Article

Anomaly Detection in Mineral Micro-X-Ray Fluorescence Spectroscopy Based on a Multi-Scale Feature Aggregation Network

1
Frontiers Science Center for Deep-Time Digital Earth, State Key Lab of Geological Processes and Mineral Resources, China University of Geosciences, Beijing 100083, China
2
School of Artificial Intelligence, China University of Geosciences, Beijing 100083, China
3
School of Earth Sciences and Resources, China University of Geosciences, Beijing 100083, China
4
Institute of Earth Sciences, China University of Geosciences, Beijing 100083, China
*
Author to whom correspondence should be addressed.
These authors contributed equally to this work and should be considered as co-first authors.
Minerals 2025, 15(9), 970; https://doi.org/10.3390/min15090970
Submission received: 11 August 2025 / Revised: 8 September 2025 / Accepted: 10 September 2025 / Published: 13 September 2025
(This article belongs to the Special Issue Gold–Polymetallic Deposits in Convergent Margins)

Abstract

Micro-X-ray fluorescence spectroscopy (micro-XRF) integrates spatial and spectral information and is widely employed for multi-elemental analyses of rock-forming minerals. However, its inherent limitation in spatial resolution gives rise to significant pixel mixing, thereby hindering the accurate identification of fine-scale or anomalous mineral phases. Furthermore, most existing methods heavily rely on manually labeled data or predefined spectral libraries, rendering them poorly adaptable to complex and variable mineral systems. To address these challenges, this paper presents an unsupervised deep aggregation network (MSFA-Net) for micro-XRF imagery, aiming to eliminate the reliance of traditional methods on prior knowledge and enhance the recognition capability of rare mineral anomalies. Built on an autoencoder architecture, MSFA-Net incorporates a multi-scale orthogonal attention module to strengthen spectral–spatial feature fusion and employs density-based adaptive clustering to guide semantically aware reconstruction, thus achieving high-precision responses to potential anomalous regions. Experiments on real-world micro-XRF datasets demonstrate that MSFA-Net not only outperforms mainstream anomaly detection methods but also transcends the physical resolution limits of the instrument, successfully identifying subtle mineral anomalies that traditional approaches fail to detect. This method presents a novel paradigm for high-throughput and weakly supervised interpretation of complex geological images.

1. Introduction

Minerals are vital carriers that record geological evolution and preserve critical information about the Earth’s interior. Their crystal structures retain key physicochemical parameters such as temperature, pressure, chemical composition, and elemental occurrence states during mineral formation, making them essential for deciphering rock-forming processes and reconstructing geological histories [1,2,3,4,5]. In recent years, micro-X-ray fluorescence spectroscopy (micro-XRF) has gained widespread application in mineral recognition, geological exploration [6], and related fields due to its ability to perform large-scale, non-destructive analysis at a relatively low cost. This technique offers simple sample preparation and rapid scanning, with micro-XRF images combining high-dimensional spectral data with two-dimensional spatial structure, providing critical data support for interpreting rock microstructures [7].
However, the application of micro-XRF still faces several challenges. On the one hand, its limited spatial resolution often leads to the “mixed-pixel” problem, where a single pixel may contain signals from multiple mineral phases. This not only blurs mineral boundaries but also makes it difficult to detect rare or trace minerals. On the other hand, the large volume of micro-XRF images and inherent noise redundancy impose high demands on mineral recognition algorithms [8]. To address these issues, supervised learning methods have been introduced to enhance the automatic analysis of micro-XRF for image classification and segmentation tasks, including spectral angle mapper (SAM) and convolutional neural networks (CNNs) [9,10]. Nevertheless, these approaches generally rely on pre-constructed spectral libraries or manually annotated labels, limiting their ability to handle pixel-mixing errors or recognize unknown minerals, resulting in poor model generalization. While certain approaches have sought to integrate traditional SAM methods with linear programming for unsupervised estimation of mineral abundances in fine-grained mixtures [11], they remain dependent on prior spectral libraries and annotations, thus falling short of truly unsupervised analysis. With the rapid development of deep learning, a range of mineral recognition studies has emerged, demonstrating superior performance over traditional methods [12,13,14,15]. For instance, Kim et al. [16] applied ANN models to build mineral classifiers, exploring correlations between elemental abundance data from XRF and mineral recognition data from μ-XRD.
Nonetheless, these deep learning-based approaches still face two fundamental limitations: First, label-dependent models lack generalization abilities when dealing with unknown minerals or complex compositions. Second, even deep networks tend to focus on global high-level semantic features when optimized for classification tasks, making them less sensitive to pixel-level, subtle, rare anomalies and fine-grained variations.
In this study, we treat sparse, irregularly distributed, and compositionally anomalous mineral grains in micro-XRF images as “anomalous” pixels—features often overlooked by conventional methods. Anomaly detection algorithms aim to identify patterns deviating from the dominant distribution and are naturally suited for capturing low-frequency pixel-level features such as fine-grained minerals and subtle compositional shifts [17]. In studies of hyperspectral images, autoencoder-based reconstruction error frameworks are widely adopted for unsupervised detection due to their ability to learn unknown patterns without requiring labels [18]. However, mineral anomalies in micro-XRF images often exhibit both spatial sparsity and spectral perturbation. Existing methods, while capable of representing features, often ignore the joint modeling of spatial–spectral information across multiple scales. Without mechanisms for dynamic attention aggregation, they fail to enhance response signals from anomalies embedded within mixed pixels, thus limiting the model’s sensitivity to subtle mineral variations.
To address the challenges of spatial resolution and label dependency in anomaly detection for micro-XRF images, we propose an unsupervised deep learning model—multi-scale feature aggregation network (MSFA-Net)—that integrates orthogonal attention mechanisms with an anomaly detection framework.
The contributions of this work are as follows:
1
We design an unsupervised MSFA-Net based on an autoencoder architecture, enabling end-to-end anomaly detection and reconstruction while jointly modeling spatial features and reconstruction errors.
2
We introduce a multi-scale orthogonal attention (MOA) module to effectively integrate and disentangle spatial–spectral features at different scales, enhancing the model’s ability to discriminate subtle mineral anomalies within mixed pixels.
3
We incorporate a DBSCAN-based spatial clustering strategy to generate pseudo-labels, guiding the reconstruction loss to assign higher semantic weights to anomalous regions. This improves the anomaly response capability while reducing dependence on labels or spectral libraries.
This study not only improves anomaly detection performance but also shifts micro-XRF analysis from a rule-driven to a data-driven paradigm, presenting an unsupervised framework for intelligent interpretation of complex mineral imagery. It offers both theoretical and practical support for geological analysis under high-throughput, weak-label conditions.

2. Methodology

2.1. MSFA-Net Framework for Micro-XRF Anomaly Detection

Owing to its ability to capture multi-scale contextual information without a corresponding increase in parameters through grouping strategies and inexpensive features, MSFA-Net has been successfully applied in several other domain analysis tasks [19,20]. However, such approaches have not yet been extended to micro-XRF anomaly detection. Unlike label-dependent models, in micro-XRF anomaly detection, MSFA-Net does not require prior annotations or spectral libraries, thereby improving its generalization ability to unknown minerals. By employing a multi-scale orthogonal attention (MOA) module, the network dynamically aggregates features at different resolutions while disentangling spatial–spectral redundancies. This enables the model to not only preserve global semantic consistency but also highlight subtle, fine-grained anomalies embedded within mixed pixels. Moreover, the integration of multi-scale aggregation ensures that both coarse-grained contextual cues and fine-grained local variations are captured, directly addressing the difficulty of detecting sparse anomalies. In this way, MSFA-Net effectively mitigates the dual limitations of label dependency and sensitivity loss, providing a principled solution to anomaly detection in micro-XRF images.
MSFA-Net adopts an autoencoder-based architecture and integrates a multi-scale attention module to learn latent image features in an unsupervised manner [21]. The framework has three parts, namely, the encoder, MOA, and decoder. The overall architecture is illustrated in Figure 1. Prior to model input, the raw micro-XRF image data, X r e c o n R B × C i n × H × W , undergoes preprocessing. For each pixel at location ( h , w ) , its spectral profile is represented as a C i n -dimensional vector. The collection of these vectors forms the input dataset, where N = H × W denotes the total number of pixels, and C i n is the number of spectral bands in the input data.

2.1.1. Encoder

As the feature extraction pathway of MSFA-Net, the encoder is designed to progressively reduce the dimensionality of the high-dimensional spectral vector associated with each pixel while abstracting semantic features at multiple levels. This process increases the depth of feature channels while compressing the original spectral information, X h , w , into a more compact and informative latent representation. The encoder consists of three hierarchically stacked modules. Each module includes a linear layer, a normalization layer, and a ReLU activation function, which together enable nonlinear feature transformation and contribute to the stability of the training process. The encoding procedure can be formally expressed as follows:
M = E n X , O u t E n .
Here, M denotes the encoded spectral–spatial representation, E n ( ) is the encoder function, X represents the original spectral data of the micro-XRF image, and O u t E n indicates the output dimension of the encoder.
The latent features, F l a t e n t , generated by the encoder contain the image’s global high-level semantic information, serving as the input to the subsequent multi-scale attention module. In addition, the feature maps e 1 and e 2 , produced at different stages of the encoder, are transmitted to the corresponding upsampling layers in the decoder through skip connections, allowing the network to retain spatial details that may be lost during the downsampling process.

2.1.2. Multi-Scale Orthogonal Attention Module

In previous studies, the use of micro-XRF images for mineral recognition and classification has often been hindered by the fact that the average grain size of the sample is smaller than the spatial resolution of the instrument. As a result, a single pixel may contain multiple mineral components, leading to mixed pixels, blurred mineral boundaries, and reduced classification accuracy [22]. Similarly, in geological exploration, multi-scale data analysis and multi-source information fusion have been proven to improve the accuracy of mineral boundary identification and the extraction of anomalous features [23,24]. To address this issue, this study designs and incorporates the MOA module. Inspired by EMA and OrthoNets [25,26], the MOA module adopts a multi-branch structure to simultaneously capture both global and local spatial contextual information. During feature fusion, it integrates Schmidt orthogonalization to reduce spectral redundancy and enhance inter-channel independence. The overall structure is illustrated in Figure 2.
Firstly, the module divides the input feature channels into G groups for multi-branch parallel processing. Subsequently, global context features are extracted using 1D average pooling along the horizontal (X Avg Pool) and vertical (Y Avg Pool) directions, generating preliminary spatial attention maps. Based on this, the module performs Schmidt orthogonalization on the spectral dimension to ensure that learned spectral features are mutually independent, thereby suppressing redundancy.
The orthogonalized spectral features are then fused with the spatial attention maps. Furthermore, the module introduces a bidirectional attention interaction mechanism, enabling deep interaction between the fused spatial–spectral features and another branch that captures local spatial information. This design allows the network to adaptively aggregate multi-scale spatial contexts and dynamically assign attention weights to each pixel. Through this architecture, the MOA module significantly enhances feature representation, suppresses noise and redundancy, and improves the discriminability of mixed-pixel regions.
An input feature map, x i n R B × C l a t e n t × H l a t e n t × W l a t e n t , is divided along the spectral dimension into G groups, resulting in grouped sub-features, x g R B × C l a t e n t / G × H l a t e n t × W l a t e n t . The module then extracts multi-scale contextual information through two primary branches. The first branch, referred to as the global directional context branch, captures global contextual information along the horizontal and vertical axes. For a specific channel, c, and batch index, b, within each grouped sub-feature, x g , horizontal adaptive average pooling is first performed to generate the compressed feature x h ( b , c , h ) . The computation is defined as follows:
M c H h = 1 W l a t e n t i = 1 W l a t e n t x c h , i .
Here, x c ( h , i ) denotes the value of the grouped sub-feature, x g , at batch b, channel c, row h, and column i. Meanwhile, vertical adaptive average pooling is performed to obtain x w ( b , c , w ) , which is computed as follows:
M c W w = 1 H l a t e n t j = 1 H l a t e n t x c j , w .
Here, x c ( j , w ) denotes the value of the grouped sub-feature, x g , at batch b, channel c, row j, and column w. Subsequently, x h and x w are concatenated along a new dimension to form X h , w R B × C l a t e n t × G × ( H l a t e n t + W l a t e n t ) × 1 . After cross-dimensional information fusion via a 1 × 1 convolution, the features are split back into x h and x w . These features are then passed through a Sigmoid function to generate the initial spatial weights, which are multiplied by the original grouped sub-feature, x g , to enhance spatially salient regions. The weighted features are normalized and subjected to Schmidt orthogonal transformation, ultimately yielding the feature x ^ 1 R B × ( C l a t e n t / G ) × H l a t e n t × W l a t e n t . The entire process is illustrated in Formulae (4) and (5).
M c = 1 H × W j H i W x c ( i , j ) .
The second branch focuses on extracting fine-grained local spatial context. It directly applies a 3 × 3 convolution to each grouped sub-feature, x g , without undergoing Schmidt orthogonalization, resulting in the feature x 2 R B × C l a t e n t / G × H l a t e n t × W l a t e n t .
Notably, Schmidt orthogonalization is only applied in the branch that extracts global horizontal and vertical features. Specifically, the input feature, x 1 R B × C l a t e n t / G × H l a t e n t × W l a t e n t , is first reshaped along the spatial dimension into a two-dimensional matrix, after which Group Normalization is performed to normalize the feature distribution within each group. Then, Schmidt orthogonalization is applied in a group-wise manner. Formally, for each batch b and group g , the reshaped feature matrix is denoted as X 1 ( b , g ) R ( C l a t e n t / G ) × H l a t e n t × W l a t e n t . The Gram–Schmidt process sequentially orthogonalizes each channel vector, x i , against the previously obtained orthogonal basis, { x ^ 1 , . . . , x ^ i 1 } :
u i = x i j = 1 i 1 x i , x ^ j x ^ j , x ^ j x ^ j , x ^ i = u i u i 2 .
This ensures that the output channels satisfy the orthogonality condition x ^ i , x ^ j = 0 i j . By enforcing this decorrelation, channel redundancy is suppressed, and more independent spectral features are obtained.
Although orthogonalization introduces additional computation, the group-wise design significantly reduces the cost since it is only performed within smaller channel subsets and in one branch. This trade-off is computationally efficient while improving channel independence and enhancing the discriminative capacity of the fused features.
Once the outputs from the two branches are obtained, x ^ 1 and x 2 , a cross-dimensional attention interaction mechanism is introduced to adaptively aggregate multi-scale context. The complementary features, x ^ 1 and x 2 , are fused to capture interdependent spatial–spectral information.
This mechanism enhances the network’s ability to focus on informative spatial regions, effectively suppressing noise and redundant information. It is especially beneficial in handling mixed or noisy pixels, allowing the network to better capture fine-grained mineralogical variations, which improves discrimination in complex mineralogical contexts.

2.1.3. Decoder

The decoder constitutes the feature reconstruction path of MSFA-Net and is symmetrical to the encoder. Its primary function is to integrate high-level semantic features processed by the multi-scale attention module with low-level detail features introduced via skip connections, progressively performing dimensional upsampling operations and ultimately reconstructing the latent features into an output, X r e c o n R B × C i n × H × W , that matches the spatial dimensions of the original micro-XRF input image. The decoder in the proposed model also consists of three modules, each comprising a fully connected layer, a normalization layer, and a ReLU activation function. The core of the decoder lies in its skip connections, which directly transfer multi-level feature information from the encoder to the corresponding levels in the decoder and concatenate them along the channel dimension before the fully connected operation. This mechanism compensates for the spatial detail loss during encoder downsampling, ensuring that the mineral information recovered from the latent features is spatially accurate and of high fidelity. The computation is defined as follows:
M ¯ = D e O u t e m a , O u t D e ,
Here, M ¯ denotes the reconstructed feature representation obtained by the decoder, while D e ( ) represents the decoder function that performs progressive upsampling and feature fusion. O u t e m a indicates the feature maps refined by the EMA module, serving as the primary input to the decoder, and O u t D e refers to the target output dimensionality of the decoder, corresponding to the spatial dimensions of the reconstructed micro-XRF image.
Through this stacked module design and the incorporation of crucial skip connection mechanisms, the decoder can effectively upsample the learned latent representations and fuse multi-level information, ultimately producing high-quality reconstructed images that can evaluate the model’s feature-learning capabilities.

2.2. Feature Aggregation Module

In the field of micro-XRF image analysis, the accurate identification of mineral phases has long been a significant challenge. In previous studies, such identification often relied on manual assessment and refinement of spectral attributes [27]. However, this traditional approach not only incurs substantial labor and time costs but also exhibits a limited ability to detect subtle anomalies and achieve full automation in the presence of complex and heterogeneous image backgrounds [28]. In recent years, machine learning-based geological mapping methods have demonstrated the potential for automated extraction of complex geological background information, providing new ideas for improving the efficiency and accuracy of mineral recognition [29]. To address this issue, a feature aggregation module (FAM) was designed to enable automated identification of background regions and potential anomalous regions, which are typically characterized by similar features. Given that micro-XRF images are inherently constrained by spatial resolution, mineral mixtures are inevitably present—meaning that the background often contains multiple mineral components, each usually occupying a relatively large proportion of pixels. By contrast, anomalous categories generally consist of far fewer pixels. This discrepancy in pixel count can be effectively exploited to distinguish between background and anomaly classes.
Unlike most unsupervised clustering algorithms, which require manual specification of the number of categories, this work employs the Density-Based Spatial Clustering of Applications with Noise (DBSCAN) model [30]. The module first feeds the latent features obtained from the multi-scale attention mechanism into the DBSCAN model to produce an initial clustering label map. The resulting category labels are then ranked in descending order by their corresponding pixel counts, and a reasonable pixel threshold, denoted as ξ, is applied to effectively separate background classes from anomaly classes. This separation process can be mathematically expressed as
D ξ , K i = K i K n o r m a l , S a K i > ξ , K i K a n o m a l y , S a K i ξ .
In Formula (7), K i denotes the pixel set of the i-th category, and the total number of categories is n. K n o r m a l represents the background classes, with a total of m categories, while K a n o m a l y is defined as the anomaly classes, with a total of n-m categories. Here, the S a ( · ) function calculates the pixel count, and ξ is a key threshold parameter used to determine whether the current class belongs to the anomaly class or the background class.

2.3. Loss Function

To further enhance the model’s sensitivity to anomalous regions, this study incorporates SAM into the reconstruction loss function [31]. SAM measures the angle between the original and reconstructed pixels in the high-dimensional spectral space, thereby reflecting the similarity of their spectral shapes. For the i-th pixel, with original spectral vector x i and reconstructed spectral vector x ^ i , the spectral angle Θ i is calculated as follows:
θ i = a r c c o s x i x ^ i x i x ^ i .
Based on the DBSCAN clustering labels and SAM values, this study proposes a weighted reconstruction loss function to enhance the model’s differentiated attention toward various types of regions during training. Specifically, the loss function is defined as follows:
L w e i g h t e d = 1 N i = 1 N ω i x i x ^ i 2 ,
where N denotes the total number of pixels in the image; x i and x ^ i represent the original and reconstructed spectral vectors of the i-th pixel, respectively; and ω i is the weighting coefficient corresponding to that pixel. The weight, ω i , is defined as
ω i = D i + λ θ i ,
where D i { 0 , 1 } is determined by the DBSCAN clustering result: D i = 1 if the i-th pixel is clustered as background; otherwise, D i = 0 if it is classified as a potential anomaly. Θ i is the normalized spectral angle value used to quantify the spectral deviation during reconstruction, and λ is a hyperparameter that regulates the contribution of the spectral angle to the total loss.

2.4. Anomaly Detection

After the above operations, the trained multi-scale feature aggregation network is first used to test each pixel, generating the corresponding latent feature representation. The residual between the original micro-XRF image and the image reconstructed by the decoder is then calculated. Finally, the Mahalanobis distance is introduced to measure the degree of abnormality in the residual features of each pixel, which is expressed as
R ( y l ) = ( y l μ ) T Γ 1 ( y l μ ) ,
where R(⋅) denotes the Mahalanobis distance function, yl is the residual feature of the test pixel, and μ and Γ represent the mean vector and covariance matrix of the residual features for the entire micro-XRF image, respectively.

2.5. Evaluation Indices

This study evaluates the anomaly detection performance of the algorithms using quantitative metrics widely adopted in anomaly detection research, including the Receiver Operating Characteristic (ROC) curve [32], the Area Under the ROC Curve (AUC) score [33], and a background anomaly separation map [34]. The detection probability ( P d ) and false alarm rate ( P f ) are critical parameters for generating ROC curves; under the same detection probability, a lower false alarm rate indicates superior algorithm performance. Additionally, the AUC score quantitatively reflects the overall quality of the ROC curve. The background–anomaly separation boxplots provide an intuitive qualitative perspective based on data distribution characteristics.
Microscopic comparative analysis of mineral thin sections is a qualitative evaluation method. By visually comparing the anomaly score maps generated by the algorithms with expert-identified and annotated mineral thin sections under a microscope, the correspondence between detected anomalous regions and actual anomalous mineral distributions can be intuitively assessed [35].

3. Materials

3.1. Sample Description

The samples analyzed in this study were collected from the Liqingdi lead–zinc–silver deposit, located in Chayouqianqi, Inner Mongolia. The deposit lies in the eastern segment of the Inner Mongolia Terrane, along the northern margin of the North China Platform. The investigated specimens comprise thin sections of porphyritic granite and carbonate rocks. The principal ore minerals are sphalerite, galena, and pyrite. Galena occurs mainly as disseminated grains within calcite- and quartz-rich matrices, exhibiting dissolution, interpenetrative, and inclusion textures with pyrite and sphalerite. It also displays metasomatic replacement along the margins and fractures of brecciated sphalerite, forming distinctive rim structures. Post-fragmentation galena commonly appears as breccia fragments or cementing material. Sphalerite predominantly shows anhedral granular to euhedral crystal forms, with most grains displaying cataclastic features. Fractured sphalerite is frequently replaced by galena along cleavage planes and grain boundaries. Pyrite is characterized by penetrative, dissolved, and encapsulated textures within galena and is often enclosed within recrystallized quartz overgrowths [36]. The principal gangue minerals are quartz and carbonate-group minerals.

3.2. Data Preparation

The data were acquired using the M6 JETSTREAM high-resolution, large-area micro-XRF imaging spectrometer developed by Bruker, Germany. The instrument’s core component features a high-performance rhodium-target micro-focus X-ray source. The scanning parameters used for data acquisition were as follows: spot size of 50 μm, step size of 50 μm, excitation voltage of 50 kV, excitation current of 600 μA, and pixel dwell time of 15 ms.
To comprehensively evaluate the detection performance of the proposed anomaly detection algorithm and comparative methods, a dataset consisting of real mineral micro-XRF images collected from different locations was selected for experimentation. Concurrently, a corresponding anomalous mineral annotation dataset was constructed on a website. As shown in Figure 3, the experimental micro-XRF images contain 256 spectral bands.

4. Results and Discussion

4.1. Detection Performance

To comprehensively evaluate the performance advantages of the proposed MSFA-Net model for micro-XRF anomaly detection, we implemented RX [37] and AE [38] for comparison with MSFA-Net. The RX detector is a classical statistical anomaly detection algorithm that characterizes the global background distribution and measures the spectral deviation of each pixel using the Mahalanobis distance. By contrast, AE is an unsupervised deep learning approach that reconstructs the input through a low-dimensional latent representation, where anomalies are identified based on reconstruction errors reflecting spectral discrepancies. By incorporating these two widely adopted baselines, the performance gains achieved by MSFA-Net can be ascribed to its architectural innovations rather than differences in preprocessing or evaluation settings. The hyperparameters of MSFA-Net used in our experiments are detailed in Table A1 in the Appendix A.

4.1.1. Comparisons of Detection Maps

Figure 4 presents a visual comparison of the detection results obtained by the three algorithms on micro-XRF images. It can be observed that both AE and MSFA-Net demonstrate superior detection performance, accurately identifying potential anomalous regions within the images. By contrast, the traditional RX, which relies on the Gaussian distribution assumption, fails to effectively detect meaningful anomalies in the complex mineral backgrounds, resulting in poor detection outcomes. Further inspection reveals that AE is prone to false positives during anomaly detection, as exemplified by the misclassification of non-anomalous regions as anomalies in the LQD_1 and LQD_2 images. Although MSFA-Net also generates a small number of false positives, its overall detection results are more stable and exhibit greater robustness. Notably, MSFA-Net not only effectively highlights anomalous regions but also preserves the integrity of their edges and spatial structures, which is beneficial for subsequent tasks such as region segmentation and mineral recognition.

4.1.2. Comparisons of AUC and ROC

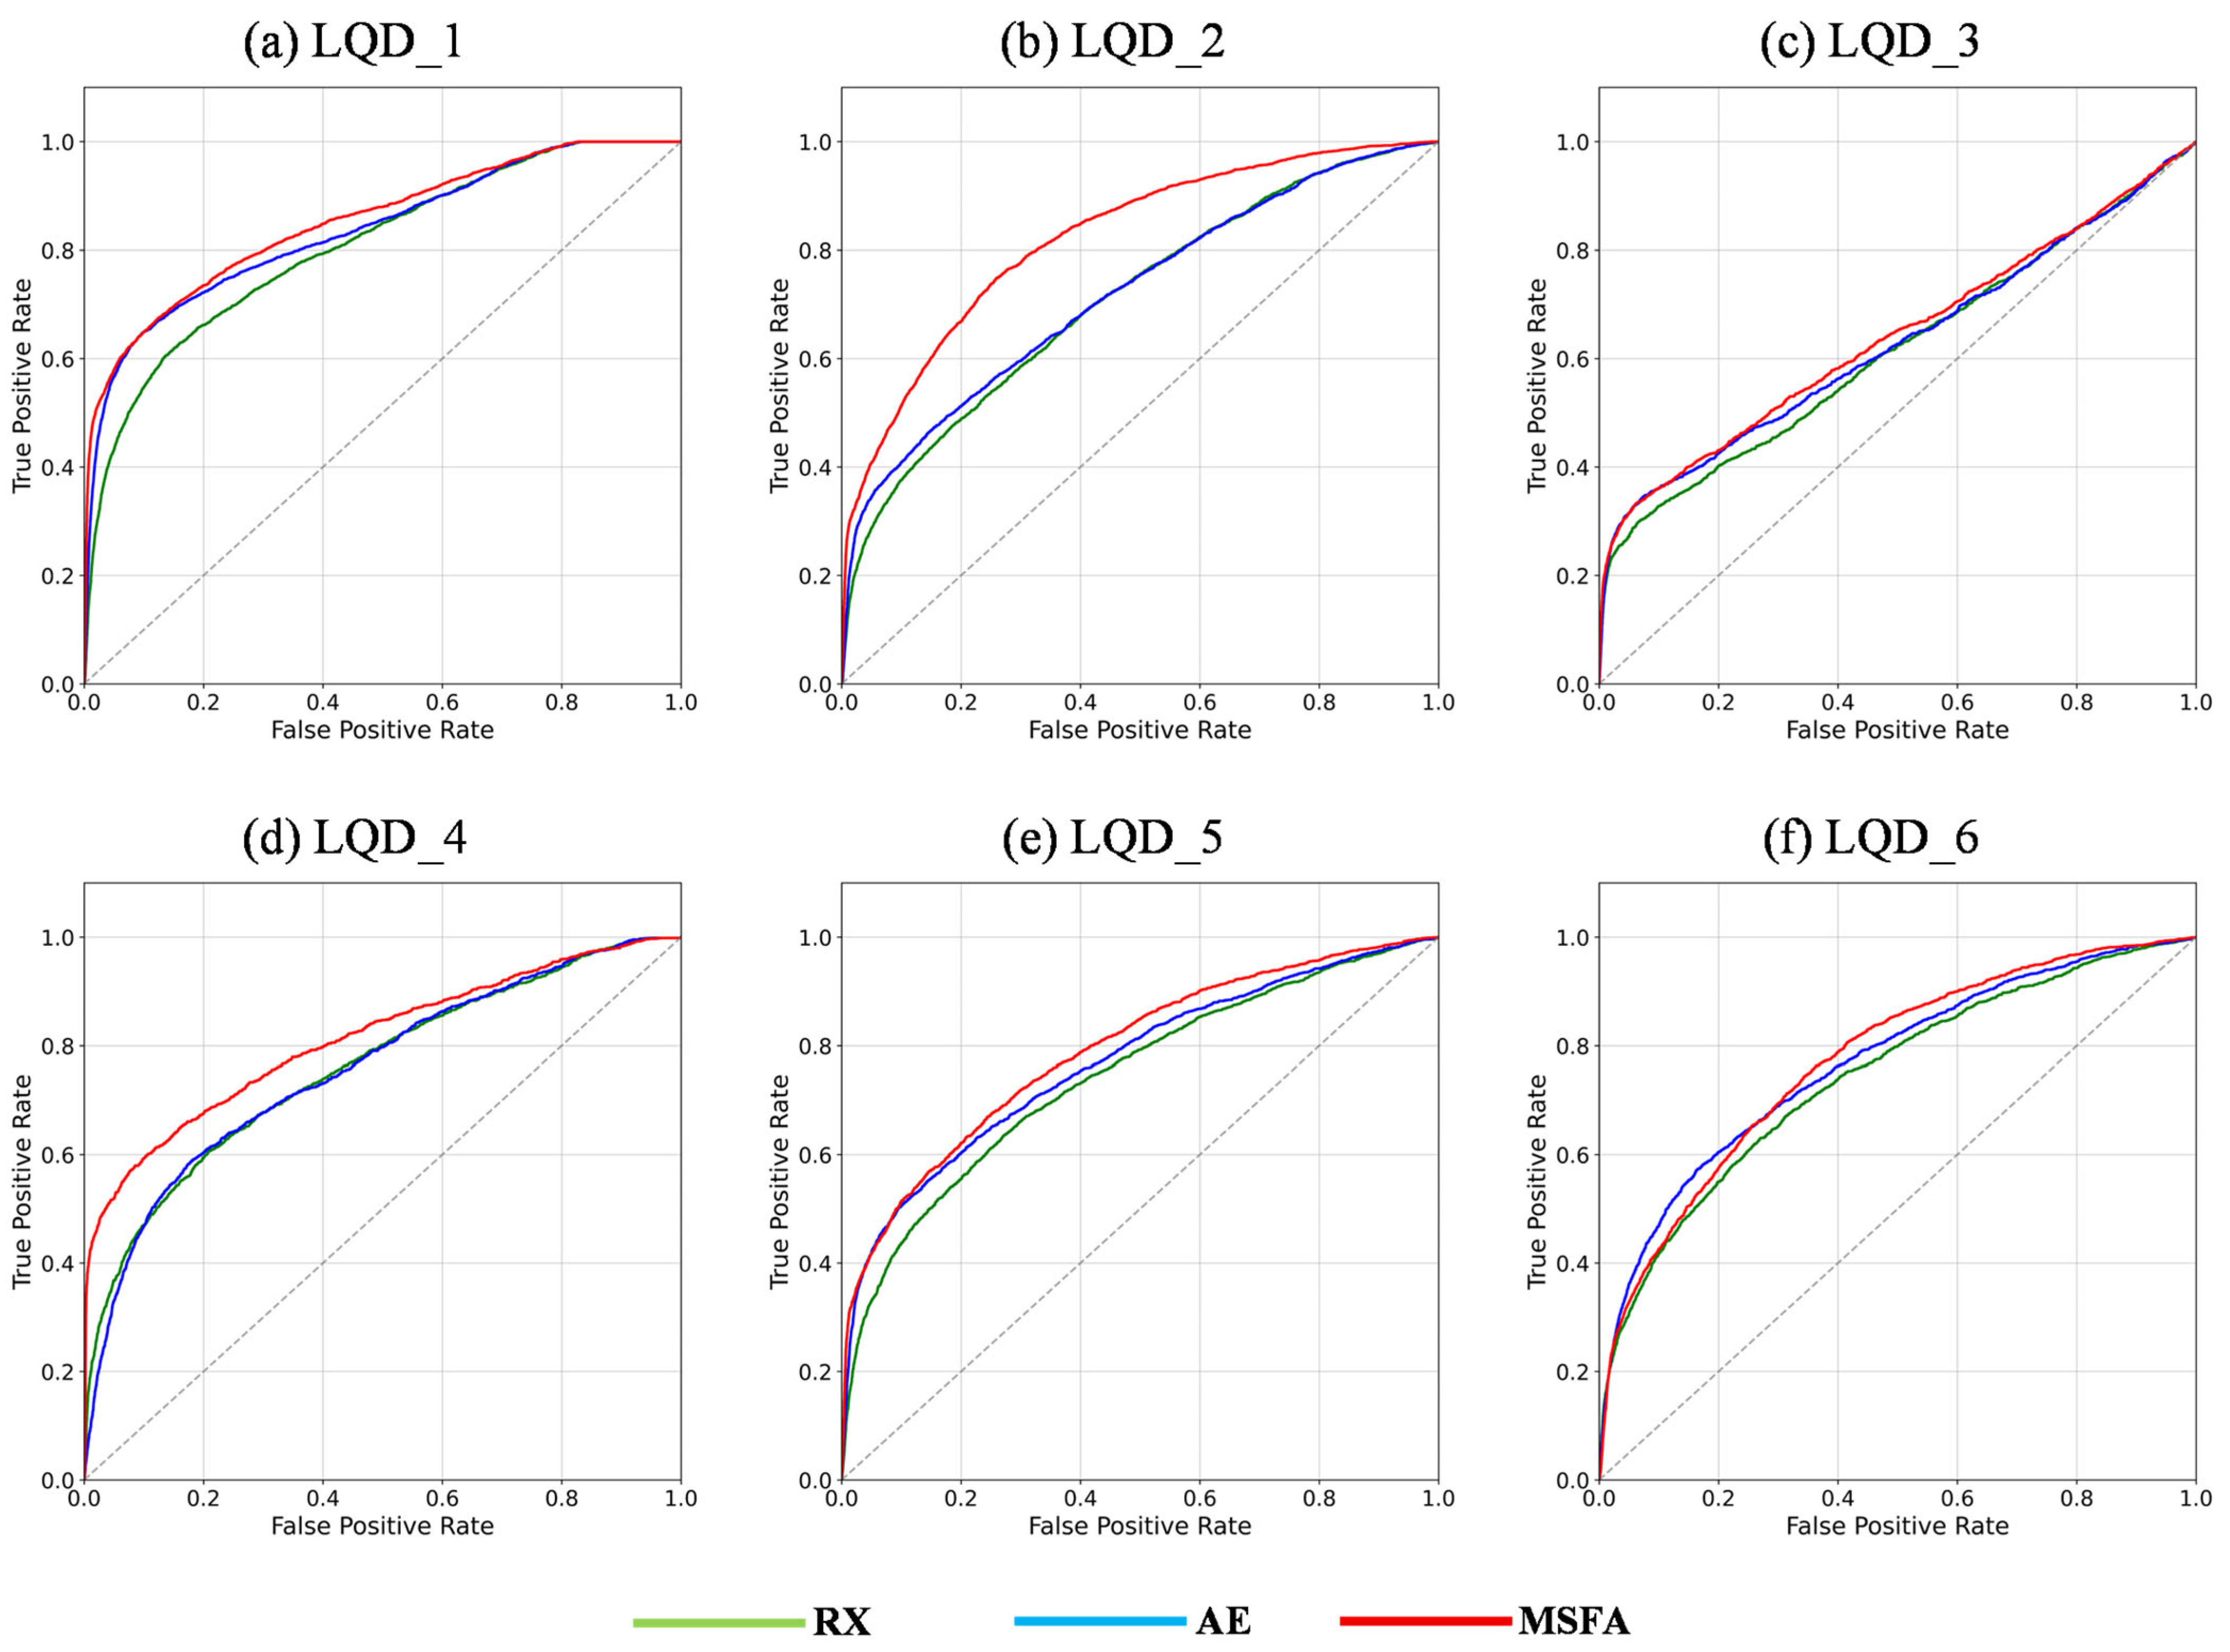
As shown in Figure 5, the experimental results demonstrate that the MSFA-Net model significantly outperforms comparative algorithms in anomaly detection on micro-XRF images. Specifically, as shown in Figure 6, the AUC values of MSFA-Net on six datasets (LQD_1 to LQD_6) are 0.852, 0.821, 0.639, 0.812, 0.790, and 0.773, respectively, all of which surpass the corresponding performance metrics of AE and RX. For instance, on the LQD_1 dataset, MSFA-Net achieves an AUC of 0.852, showing a notable improvement over AE’s 0.836 and RX’s 0.806. In the LQD_2 dataset, this advantage is further expanded, with MSFA-Net attaining an AUC of 0.821, significantly exceeding AE’s 0.720 and RX’s 0.710. Despite the increased complexity of anomalous regions in other datasets, MSFA-Net consistently maintains stable detection capability, achieving relatively optimal AUC performance across multiple sub-images.
These results strongly validate the structural advantages of MSFA-Net in anomaly detection. The model not only reconstructs normal backgrounds with higher accuracy but also generates stronger reconstruction error responses in anomalous regions, thereby markedly enhancing anomaly discriminability. By contrast, although AE possesses certain reconstruction abilities, its optimization objective focuses on minimizing errors over all pixels, making it difficult to effectively concentrate on anomalous areas, which leads to performance bottlenecks across multiple datasets (e.g., an AUC of only 0.720 on LQD_2). Meanwhile, RX, relying on linear statistical properties and covariance structures, lacks the capacity to model deep spectral features, resulting in generally mediocre AUC performance.

4.1.3. Comparisons of the Separability Map

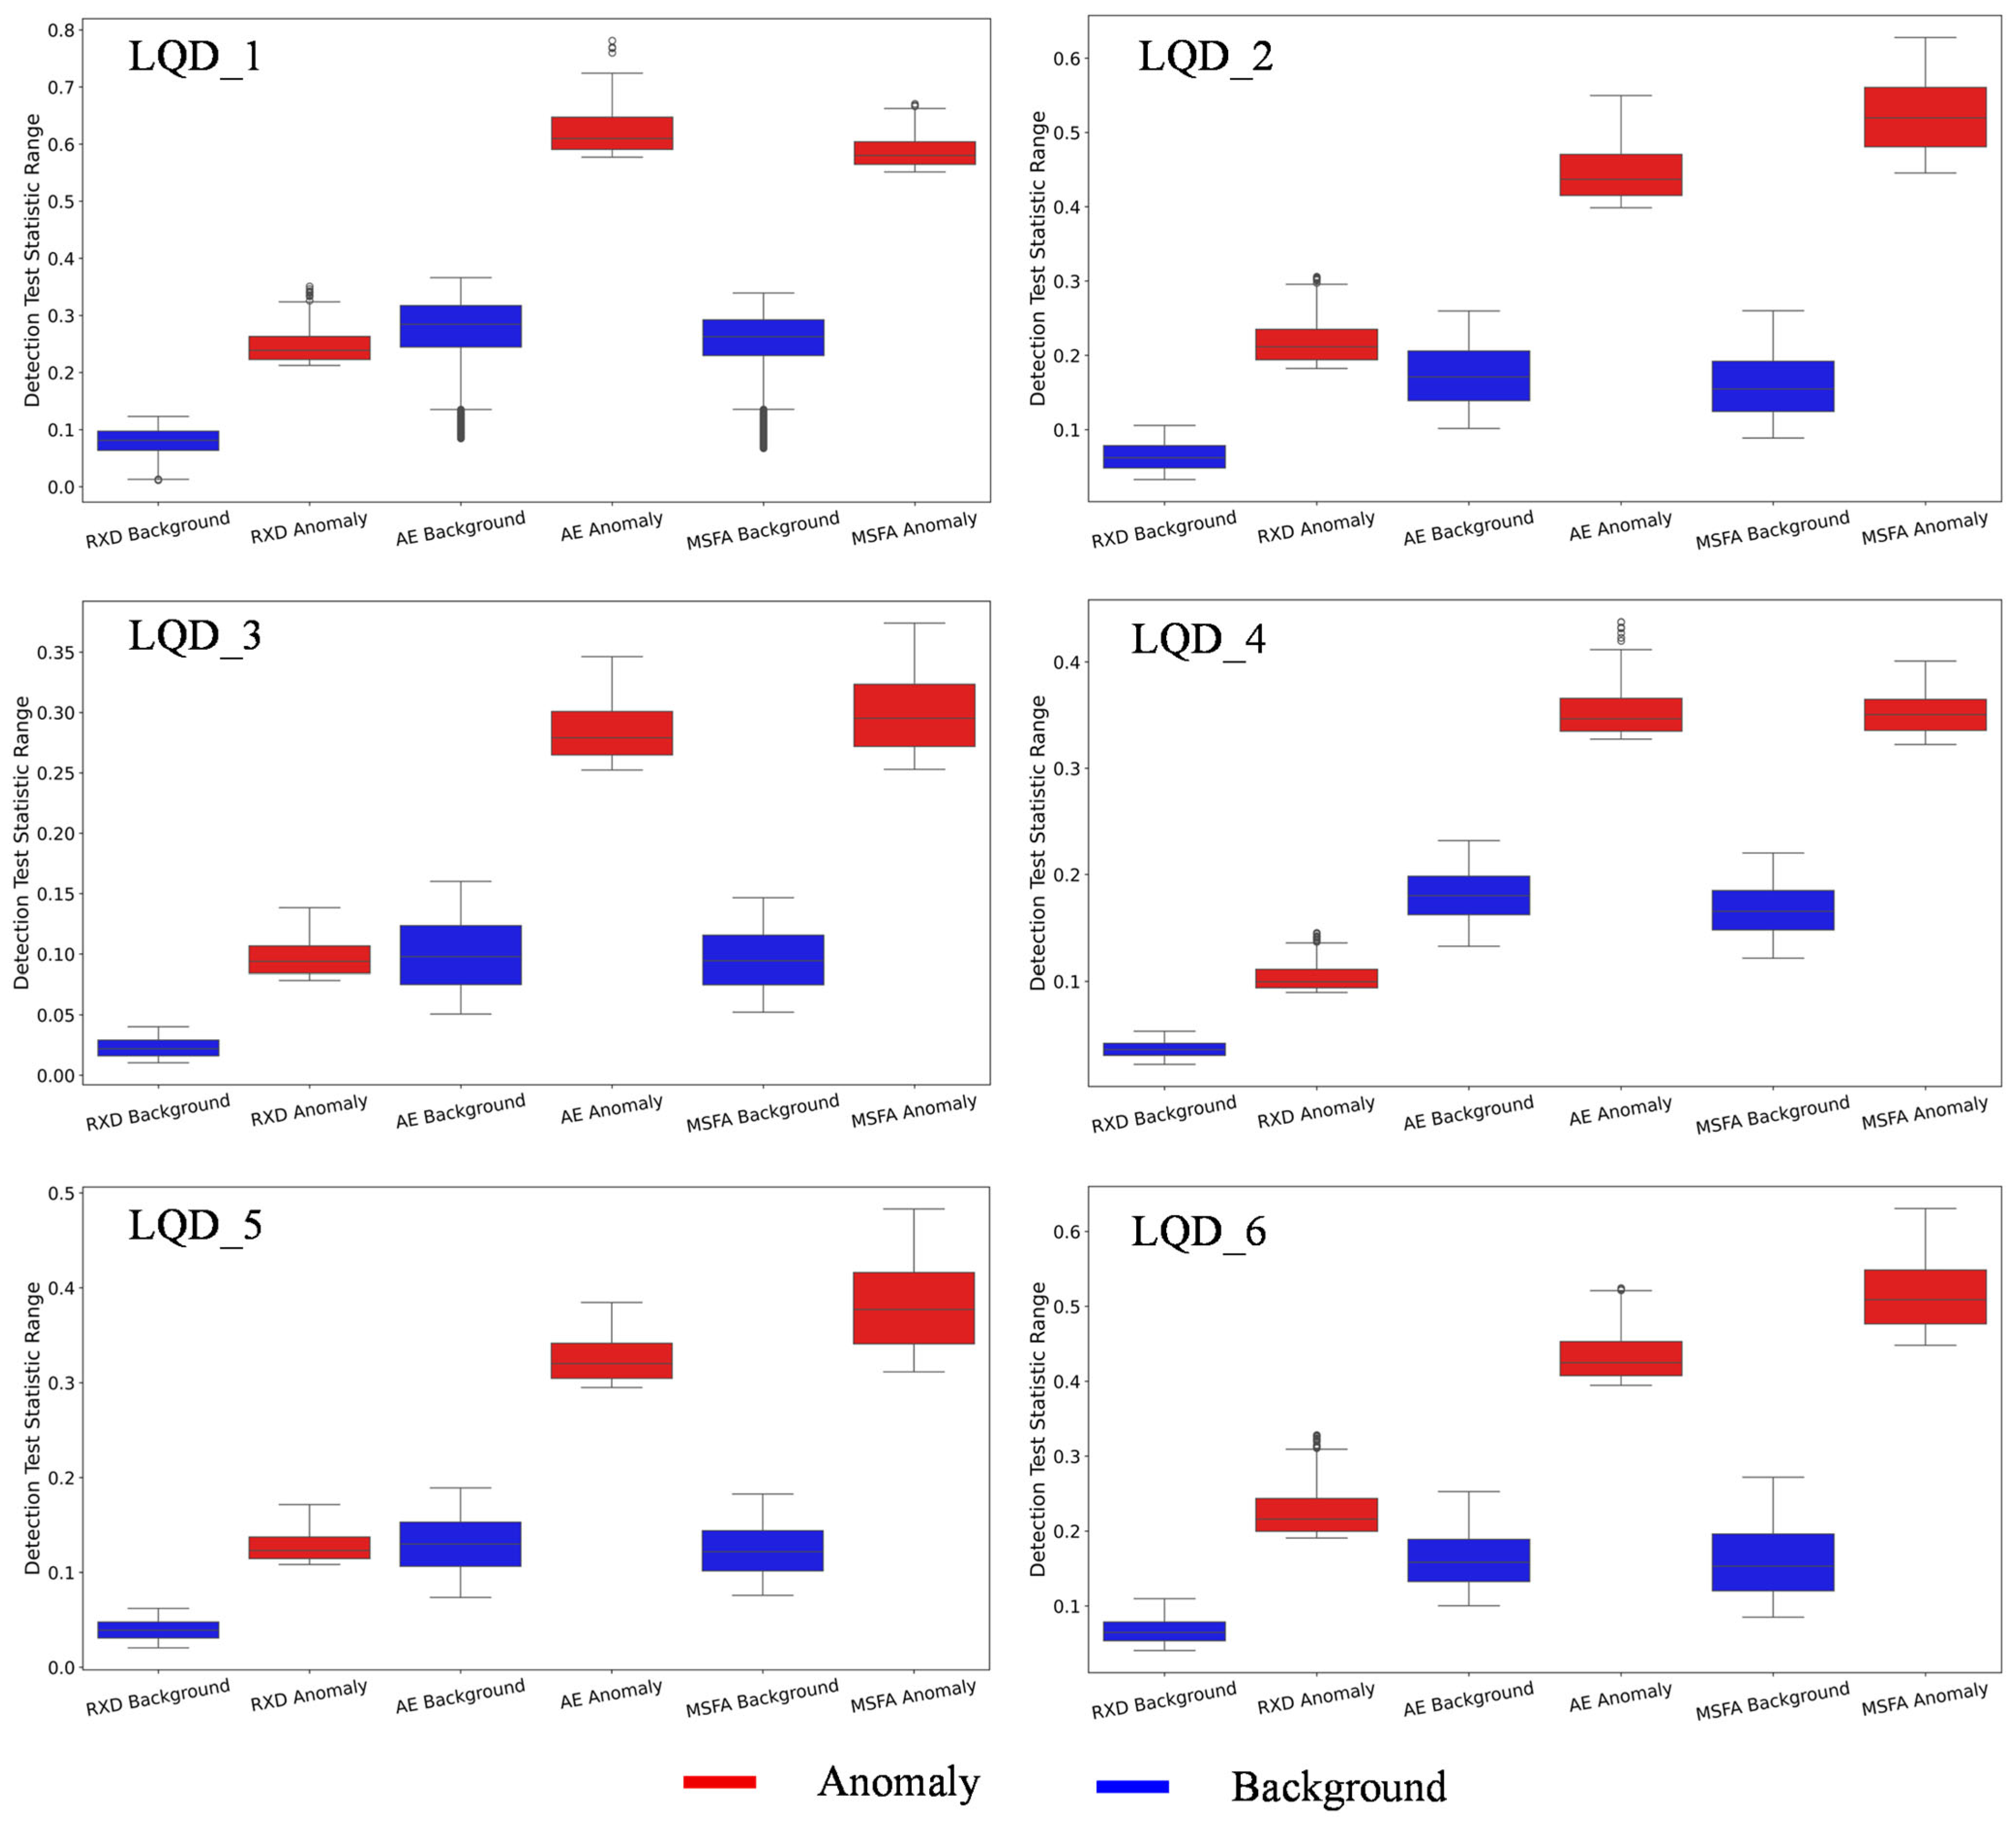
As illustrated in Figure 7, all three algorithms maintain low background pixel value distributions within the micro-XRF datasets, indicating their ability to suppress background pixels to some extent. However, notable differences exist among the methods in terms of separation between anomalies and background, as well as anomaly score distributions. Specifically, RX exhibits the most concentrated background score distribution across all datasets, demonstrating strong background suppression. Nevertheless, its anomaly scores tend to be relatively low, resulting in weaker separation between anomalies and backgrounds and limiting its ability to accurately detect subtle anomalies. AE demonstrates an enhanced response to anomalous regions in certain datasets but suffers from more dispersed background score distributions, which increases the risk of false positives. By contrast, MSFA-Net achieves low overall background pixel scores while producing higher anomaly pixel scores than the other methods, establishing a clear boundary between anomalies and background. This superior discriminative ability indicates that MSFA-Net effectively suppresses background interference and enhances anomalous pixel regions, thereby validating that the feature aggregation module improves the model’s ability to distinguish anomalies from background.

4.2. Discussion

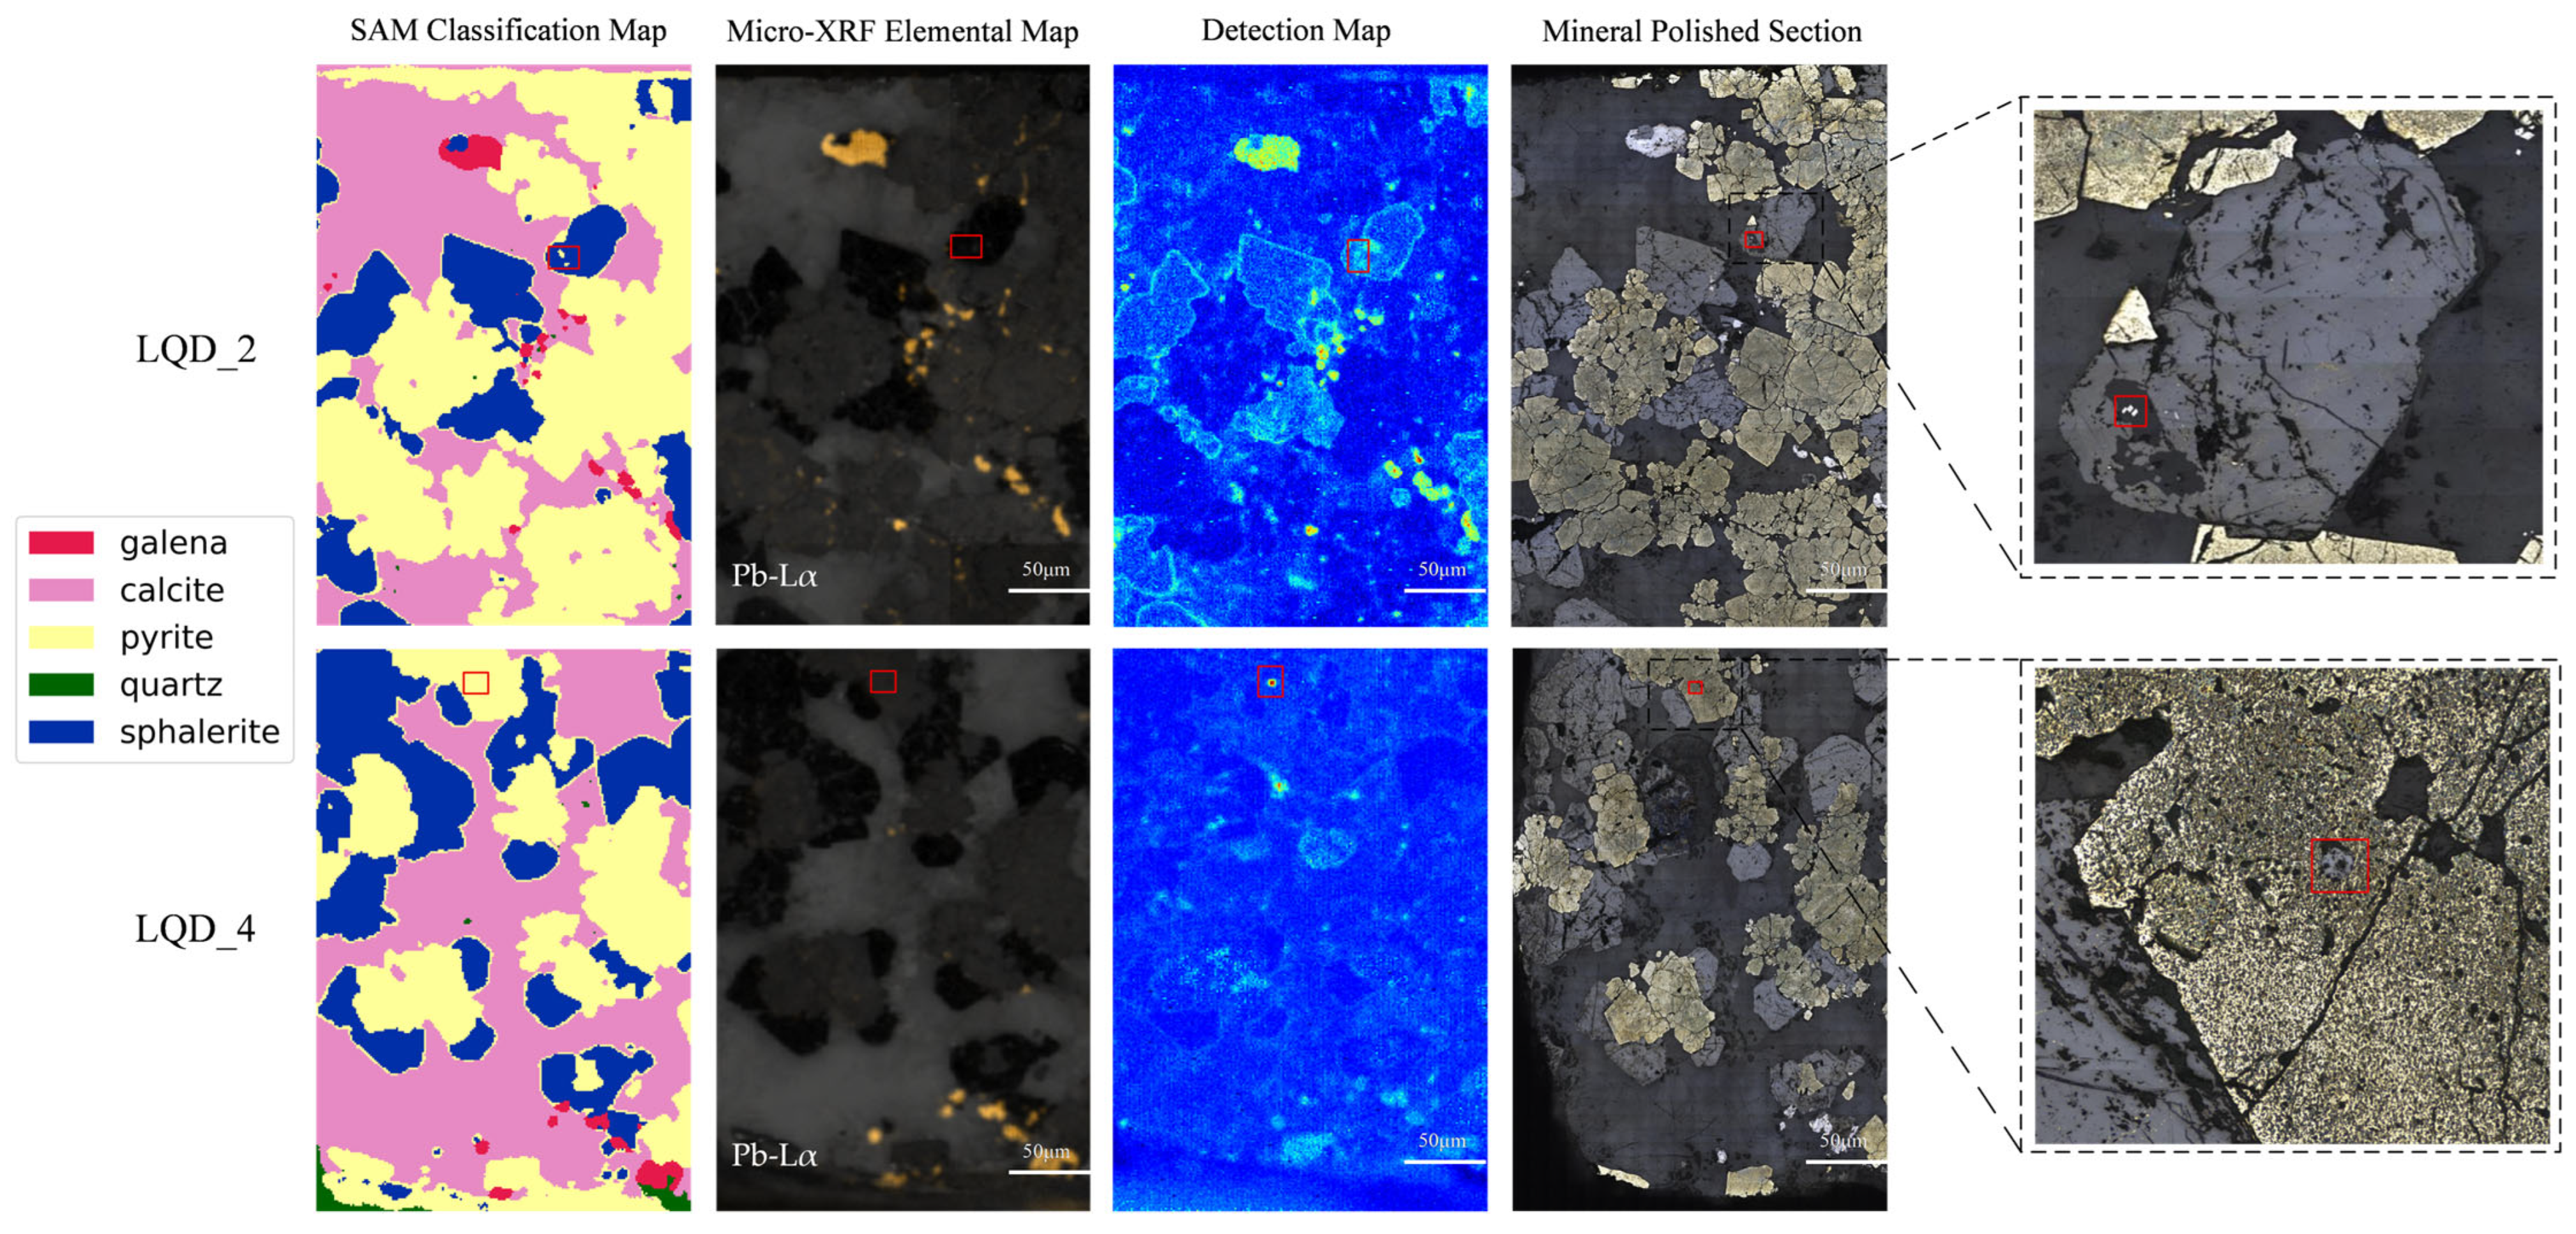
To further explore the material composition of the anomalous regions identified by the algorithm, a comparative analysis was conducted between the mineral classification maps generated by SAM, the mineral polished sections, and the detection maps produced by MSFA-Net, as shown in Figure 8. Two representative samples, LQD_2 and LQD_4, were selected for this analysis. The polished mineral sections provide real optical images of the minerals under the microscope, with red boxes indicating manually annotated anomalous regions used as a reference for evaluation.
The comparison reveals a strong spatial correlation between the high-response regions in the detection maps and most of the fine-grained galena observed in the polished mineral sections under 100× magnification. These samples contain multiple mineral species, with galena exhibiting complex intergrowth and interaction patterns with other minerals such as calcite and pyrite. We hypothesize that these intricate mineral associations induce significant local variations in elemental composition, causing the micro-XRF spectral signatures in these regions to deviate from those of the surrounding matrix or single-phase mineral areas.
Further analysis of the Pb-Lα distribution in the micro-XRF elemental maps shows that, due to the limited spatial resolution of the instrument, the Pb signal in the red-boxed regions is not clearly discernible. However, a comparison between the detection maps and the mineral polished sections reveals the presence of small galena grains within these regions. This finding is significant, indicating that MSFA-Net can, to some extent, overcome the spatial resolution limitations of micro-XRF instruments. By learning global spectral patterns, the model is capable of precisely localizing anomalous regions even when individual elemental maps lack clear signals.
Notably, the SAM classification maps further highlight the limitations of traditional supervised methods. SAM relies on a pre-constructed spectral library, and its performance is inherently constrained by the completeness and representativeness of that library. For instance, in sample LQD_2, the SAM map identifies only pyrite within the labeled region and fails to detect the fine-grained galena anomaly. In LQD_4, SAM also fails to identify the small galena grains. By contrast, the anomaly detection model requires no prior knowledge and can capture subtle, unexpected spectral variations through reconstruction error and latent spatial distributions, enabling the discovery of anomalies that conventional classification approaches often miss. In conclusion, MSFA-Net offers an effective solution for micro-XRF image analysis, enabling the proactive discovery and precise localization of small or rare mineral anomalies that are often overlooked in conventional mineral classification workflows, which may carry important geological implications.

4.3. Ablation Study

To assess the effectiveness of the proposed framework, we performed an ablation study to investigate the contribution of the MOA module and its key components. Four experimental settings were designed: No_Attention (no attention mechanism), No_Groups (group size is 1), No_Orthogonal (no orthogonal transformation), and the complete model, MSFA-Net.
As shown in Table 1, MSFA-Net consistently outperformed the other variants across all six datasets (LQD_1 to LQD_6), achieving the highest or near-highest AUC scores of 0.8517, 0.8214, 0.6389, 0.8116, 0.7905, and 0.7735, respectively. By contrast, the No_Attention model showed a notable performance drop on LQD_3 and LQD_4, with AUCs of 0.6329 and 0.7520, respectively, indicating that the MOA module is essential for capturing discriminative spectral–spatial features that distinguish anomalous mineral regions from complex background signals. Under the No_Groups setting, the AUC on LQD_3 decreased to 0.6310, suggesting that channel grouping enables more stable and expressive feature extraction by aggregating related spectral channels and reducing noise influence. The No_Orthogonal model yielded the lowest performance on LQD_3, with an AUC of only 0.6184, demonstrating the importance of orthogonal transformation in reducing spectral redundancy, enhancing channel independence, and improving feature separability for subtle anomalies.
As shown in Figure 9, the anomaly detection results for MSFA-Net exhibit a clear advantage within the highlighted red box regions. Although the No_Attention, No_Orthogonal, and No_Groups configurations can partially distinguish background and anomalous areas, they are inferior to the complete MOA module in terms of detection accuracy and comprehensive anomaly characterization. For instance, in the LQD_3 dataset, the anomalous regions detected by No_Attention and No_Orthogonal show relatively low intensity, while the No_Groups configuration produces substantial background noise. In the LQD_4 dataset, only MSFA-Net yields high-intensity and well-defined anomaly regions within the red box, demonstrating more precise and reliable detection performance. These observations indicate that the combination of multi-scale context capture, channel grouping, and orthogonal feature compression in the MOA module directly contributes to the model’s ability to effectively highlight and isolate subtle or mixed mineral anomalies.
In conclusion, the ablation study confirms the effectiveness and necessity of the MOA module and its internal mechanisms in enhancing unsupervised anomaly detection performance on micro-XRF images.

5. Conclusions

This study presents MSFA-Net, a deep learning-based multi-scale feature aggregation network designed to address key challenges in micro-XRF imaging, including limited spatial resolution, large data volumes, and high noise levels. Built upon an autoencoder framework, MSFA-Net incorporates an orthogonal spectral attention module and a density-based clustering strategy to achieve end-to-end unsupervised anomaly detection without requiring manual labels or external spectral libraries.
Extensive experiments on real micro-XRF datasets demonstrate that MSFA-Net consistently outperforms traditional methods such as RX and AE, achieving higher AUC scores and better localization of subtle anomalies. Comparative analysis with microscope-annotated mineral slices shows that MSFA-Net can effectively identify fine-grained anomalies that are indistinguishable in conventional elemental maps, partially overcoming the resolution limits of micro-XRF instruments. The main results are as follows:
1
Improved detection of subtle anomalies: The proposed multi-scale orthogonal attention module effectively captures global and local spatial–spectral contexts, significantly enhancing the network’s ability to detect weak mineral anomalies in mixed pixels.
2
Breaking through spatial resolution limitations: By deep modeling reconstruction errors, MSFA-Net can accurately localize fine-scale anomalies that are not visible in elemental distribution maps, enabling sub-resolution anomaly detection.
3
Reduced reliance on manual labels: A weighted reconstruction loss is designed based on DBSCAN clustering and spectral angle divergence, allowing the model to assign greater attention to potential anomalous regions during training, thus improving detection performance with minimal dependence on manual labeling.
In summary, MSFA-Net provides an effective and scalable solution for unsupervised mineral anomaly detection in micro-XRF images. By integrating multi-scale feature aggregation with orthogonal attention, it effectively captures both global and local spatial–spectral information, enhancing sensitivity to fine-grained anomalies. Future work will explore its application in more complex scenarios, such as hyperspectral core scanning and 3D geochemical imaging, as well as the development of adaptive clustering strategies to further improve robustness and generalization, contributing to intelligent deep resource identification and geological process modeling.

Supplementary Materials

The following supporting information can be downloaded at: https://www.mdpi.com/article/10.3390/min15090970/s1, Folder S1: Data folder containing LQD_1 to LQD_6.npy (micro-XRF image datasets). Folder S2: Ground Truth folder containing gt_1 to gt_6.npy (manually annotated ground truth maps for micro-XRF anomaly detection).

Author Contributions

Conceptualization, Y.L., W.J. and M.Z.; Methodology, Y.L., W.J. and M.Z.; Software, W.J.; Validation, Y.L. and Y.Z.; Formal analysis, Y.L.; Investigation, Y.L., W.J. and M.Z.; Resources, M.Z. and J.Y.; Data curation, J.Y.; Writing—original draft, Y.L.; Writing—review and editing, W.J., M.Z., Y.Z., J.Y., K.Q. and Q.C.; Visualization, Y.L.; Supervision, M.Z., Y.Z. and K.Q.; Project administration, M.Z. and Q.C.; Funding acquisition, M.Z., J.Y. and Q.C. All authors have read and agreed to the published version of the manuscript.

Funding

This work was supported by the Deep Earth probe and Mineral Resources Exploration–National Science and Technology Major Project (Grant No. 2024ZD1001205-06), the National Natural Science Foundation of China (Grant No. JBA013001), and the Fundamental Research Funds for the Central Universities (Grant No. 2652022061).

Data Availability Statement

The original contributions presented in this study are included in the article/Supplementary Material. Further inquiries can be directed to the corresponding author.

Conflicts of Interest

The authors declare no conflicts of interest.

Appendix A. Hyperparameter Settings of MSFA-Net

To ensure reproducibility, the detailed hyperparameter settings of the proposed MSFA-Net are summarized in Table A1. These parameters were selected based on preliminary experiments and previous works on hyperspectral and micro-XRF anomaly detection. Unless otherwise stated, all experiments in this study were trained under the same configuration.
Table A1. Hyperparameters of MSFA-Net. Notably, bandwidth, eps, and min_samples correspond to the DBSCAN clustering module.
HyperparameterValue
Epochs150
Batch size36,000
Learning rate0.0015
N_clusters4
Latent_layer_dim64
Anomal_prop0.015
Bandwidth0.3
Eps0.1
Min_samples25

References

  1. Gao, Z.; Zhu, X.; Sun, J.; Luo, Z.; Bao, C.; Tang, C.; Ma, J. Spatial Evolution of Zn-Fe-Pb Isotopes of Sphalerite within a Single Ore Body: A Case Study from the Dongshengmiao Ore Deposit, Inner Mongolia, China. Min. Depos. 2018, 53, 55–65. [Google Scholar] [CrossRef]
  2. Gregory, D.D.; Large, R.R.; Halpin, J.A.; Steadman, J.A.; Hickman, A.H.; Ireland, T.R.; Holden, P. The Chemical Conditions of the Late Archean Hamersley Basin Inferred from Whole Rock and Pyrite Geochemistry with Δ33S and δ34S Isotope Analyses. Geochim. Cosmochim. Acta 2015, 149, 223–250. [Google Scholar] [CrossRef]
  3. Hurai, V.; Huraiová, M.; Konečný, P. REE Minerals as Geochemical Proxies of Late-Tertiary Alkalic Silicate ± Carbonatite Intrusions Beneath Carpathian Back-Arc Basin. Minerals 2021, 11, 369. [Google Scholar] [CrossRef]
  4. Wang, B.; Ding, Z.; Bao, Z.; Song, M.; Zhou, J.; Lv, J.; Wang, S.; Zhang, Q.; Liu, C. Mesozoic Magmatic and Geodynamic Evolution in the Jiaodong Peninsula, China: Implications for the Gold and Polymetallic Mineralization. Minerals 2022, 12, 1073. [Google Scholar] [CrossRef]
  5. Boltshauser, B.E.; Zaffarana, C.B.; Gallastegui, G.; Orts, D.L.; Molina, J.F.; Poma, S.M.N.; González, V.R. Petrogenetic Evolution and Thermobarometry of the Late Jurassic La Hoya Pluton, Early Stages of the North Patagonian Batholith, Southwestern Argentina. Int. J. Earth Sci. 2023, 112, 1687–1716. [Google Scholar] [CrossRef]
  6. Balaram, V. Advances in Analytical Techniques and Applications in Exploration, Mining, Extraction, and Metallurgical Studies of Rare Earth Elements. Minerals 2023, 13, 1031. [Google Scholar] [CrossRef]
  7. Yang, J.; Zhang, Z.; Cheng, Q. Resolution Enhancement in Micro-XRF Using Image Restoration Techniques. J. Anal. At. Spectrom. 2022, 37, 750–758. [Google Scholar] [CrossRef]
  8. Wu, L.; Bak, S.; Shin, Y.; Chu, Y.S.; Yoo, S.; Robinson, I.K.; Huang, X. Resolution-Enhanced X-Ray Fluorescence Microscopy via Deep Residual Networks. Npj Comput. Mater. 2023, 9, 43. [Google Scholar] [CrossRef]
  9. Nikonow, W.; Rammlmair, D. Automated Mineralogy Based on Micro-Energy-Dispersive X-Ray Fluorescence Microscopy (µ-EDXRF) Applied to Plutonic Rock Thin Sections in Comparison to a Mineral Liberation Analyzer. Geosci. Instrum. Method. Data Syst. 2017, 6, 429–437. [Google Scholar] [CrossRef]
  10. Liang, J.; Sun, Y.; Lebedev, M.; Gurevich, B.; Nzikou, M.; Vialle, S.; Glubokovskikh, S. Multi-Mineral Segmentation of Micro-Tomographic Images Using a Convolutional Neural Network. Comput. Geosci. 2022, 168, 105217. [Google Scholar] [CrossRef]
  11. Barker, R.D.; Barker, S.L.L.; Wilson, S.; Stock, E.D. Quantitative Mineral Mapping of Drill Core Surfaces I: A Method for µ XRF Mineral Calculation and Mapping of Hydrothermally Altered, Fine-Grained Sedimentary Rocks from a Carlin-Type Gold Deposit. Econ. Geol. 2021, 116, 803–819. [Google Scholar] [CrossRef]
  12. Tang, J.; Wang, W.; Yuan, C. A New Anisotropic Singularity Algorithm to Characterize Geo-Chemical Anomalies in the Duolong Mineral District, Tibet, China. Minerals 2023, 13, 988. [Google Scholar] [CrossRef]
  13. Wang, W.; Yuan, C.; Tang, J.; Ren, X.; Zhao, J. Enhancing Deep Orebody Prediction and Localization through the Revelation of Geochemical Primary Halo Patterns in Drill Holes. Appl. Geochem. 2024, 171, 106100. [Google Scholar] [CrossRef]
  14. Liu, C.; Wang, W.; Tang, J.; Wang, Q.; Zheng, K.; Sun, Y.; Zhang, J.; Gan, F.; Cao, B. A Deep-Learning-Based Mineral Prospectivity Modeling Framework and Workflow in Prediction of Porphyry–Epithermal Mineralization in the Duolong Ore District, Tibet. Ore Geol. Rev. 2023, 157, 105419. [Google Scholar] [CrossRef]
  15. Lou, W.; Zhang, D.; Bayless, R.C. Review of Mineral Recognition and Its Future. Appl. Geochem. 2020, 122, 104727. [Google Scholar] [CrossRef]
  16. Kim, J.J.; Ling, F.T.; Plattenberger, D.A.; Clarens, A.F.; Lanzirotti, A.; Newville, M.; Peters, C.A. SMART Mineral Mapping: Synchrotron-Based Machine Learning Approach for 2D Characterization with Coupled Micro XRF-XRD. Comput. Geosci. 2021, 156, 104898. [Google Scholar] [CrossRef]
  17. Xu, Y.; Zhang, L.; Du, B.; Zhang, L. Hyperspectral Anomaly Detection Based on Machine Learning: An Overview. IEEE J. Sel. Top. Appl. Earth Obs. Remote Sens. 2022, 15, 3351–3364. [Google Scholar] [CrossRef]
  18. Lv, S.; Zhao, S.; Li, D.; Pang, B.; Lian, X.; Liu, Y. Spatial–Spectral Joint Hyperspectral Anomaly Detection Based on a Two-Branch 3D Convolutional Autoencoder and Spatial Filtering. Remote Sens. 2023, 15, 2542. [Google Scholar] [CrossRef]
  19. Chen, J.; Xu, F.; Zeng, T.; Li, X.; Chen, S.; Yu, J. MSFA: Multi-stage Feature Aggregation Network for Multi-label Image Recognition. IET Image Process. 2024, 18, 1862–1877. [Google Scholar] [CrossRef]
  20. Sun, T.; Wang, W.; Ma, W. MSFA-Net: A Multi-Scale Feature Aggregation Network with Mixed Attention for Industrial Defect Detection. SSRN Preprint 2025. [Google Scholar] [CrossRef]
  21. Cheng, X.; Huo, Y.; Lin, S.; Dong, Y.; Zhao, S.; Zhang, M.; Wang, H. Deep Feature Aggregation Network for Hyperspectral Anoma ly Detection. IEEE Trans. Instrum. Meas. 2024, 73, 5033016. [Google Scholar] [CrossRef]
  22. Wang, Q.; Li, F.; Jiang, X.; Wu, S.; Xu, M. On-Stream Mineral Identification of Tailing Slurries of Tungsten via NIR and XRF Data Fusion Measurement Techniques. Anal. Methods 2020, 12, 3296–3307. [Google Scholar] [CrossRef] [PubMed]
  23. Wang, W.; Liu, Z.; Tang, J.; Yuan, C. An Enhanced Strategy for Geo-Exploratory Data Analysis to Facilitate the Discovery of New Mineral Deposits. J. Geochem. Explor. 2024, 258, 107411. [Google Scholar] [CrossRef]
  24. Wang, W.; Pei, Y.; Cheng, Q.; Wang, W. Local Singularity Spectrum: An Innovative Graphical Approach for Analyzing Detrital Zircon Geochronology Data in Provenance Analysis. Fractal Fract. 2024, 8, 64. [Google Scholar] [CrossRef]
  25. Ouyang, D.; He, S.; Zhang, G.; Luo, M.; Guo, H.; Zhan, J.; Huang, Z. Efficient Multi-Scale Attention Module with Cross-Spatial Learning. In Proceedings of the ICASSP 2023—2023 IEEE International Conference on Acoustics, Speech and Signal Processing (ICASSP), Rhodes Island, Greece, 4–10 June 2023; IEEE: Rhodes Island, Greece, 2023; pp. 1–5. [Google Scholar]
  26. Salman, H.; Parks, C.; Swan, M.; Gauch, J. OrthoNets: Orthogonal Channel Attention Networks 2023; IEEE: Los Angeles, CA, USA, 2023. [Google Scholar]
  27. Wang, Q.; Zhang, X.; Tang, B.; Ma, Y.; Xing, J.; Liu, L. Lithology Identification Technology Using BP Neural Network Based on XRF. Acta Geophys. 2021, 69, 2231–2240. [Google Scholar] [CrossRef]
  28. Long, T.; Zhou, Z.; Hancke, G.; Bai, Y.; Gao, Q. A Review of Artificial Intelligence Technologies in Mineral Identification: Classification and Visualization. J. Sens. Actuator Netw. 2022, 11, 50. [Google Scholar] [CrossRef]
  29. Wang, W.; Xue, C.; Zhao, J.; Yuan, C.; Tang, J. Machine Learning-Based Field Geological Mapping: A New Exploration of Geological Survey Data Acquisition Strategy. Ore Geol. Rev. 2024, 166, 105959. [Google Scholar] [CrossRef]
  30. Duan, L.; Xu, L.; Guo, F.; Lee, J.; Yan, B. A Local-Density Based Spatial Clustering Algorithm with Noise. Inf. Syst. 2007, 32, 978–986. [Google Scholar] [CrossRef]
  31. Salles, R.D.R.; De Souza Filho, C.R.; Cudahy, T.; Vicente, L.E.; Monteiro, L.V.S. Hyperspectral Remote Sensing Applied to Uranium Exploration: A Case Study at the Mary Kathleen Metamorphic-Hydrothermal U-REE Deposit, NW, Queensland, Australia. J. Geochem. Explor. 2017, 179, 36–50. [Google Scholar] [CrossRef]
  32. Kerekes, J. Receiver Operating Characteristic Curve Confidence Intervals and Regions. IEEE Geosci. Remote Sens. Lett. 2008, 5, 251–255. [Google Scholar] [CrossRef]
  33. Tan, K.; Hou, Z.; Wu, F.; Du, Q.; Chen, Y. Anomaly Detection for Hyperspectral Imagery Based on the Regularized Subspace Method and Collaborative Representation. Remote Sens. 2019, 11, 1318. [Google Scholar] [CrossRef]
  34. Chang, C.-I.; Chiang, S.-S. Anomaly Detection and Classification for Hyperspectral Imagery. IEEE Trans. Geosci. Remote Sens. 2002, 40, 1314–1325. [Google Scholar] [CrossRef]
  35. Tusa, L.; Andreani, L.; Khodadadzadeh, M.; Contreras, C.; Ivascanu, P.; Gloaguen, R.; Gutzmer, J. Mineral Mapping and Vein Detection in Hyperspectral Drill-Core Scans: Application to Porphyry-Type Mineralization. Minerals 2019, 9, 122. [Google Scholar] [CrossRef]
  36. Li, B.; Yang, Y.; Wang, J.; Song, Z. Mesozoic Metallogenic Characteristics and Ore-Controlling Factors in the Southeastern Inner Mongolia, China. Arab. J. Geosci. 2022, 15, 1368. [Google Scholar] [CrossRef]
  37. Reed, I.S.; Yu, X. Adaptive Multiple-Band CFAR Detection of an Optical Pattern with Unknown Spectral Distribution. IEEE Trans. Acoust. Speech Signal Process. 1990, 38, 1760–1770. [Google Scholar] [CrossRef]
  38. Wang, S.; Wang, X.; Zhang, L.; Zhong, Y. Auto-AD: Autonomous Hyperspectral Anomaly Detection Network Based on Fully Convolutional Autoencoder. IEEE Trans. Geosci. Remote Sens. 2022, 60, 5503314. [Google Scholar] [CrossRef]
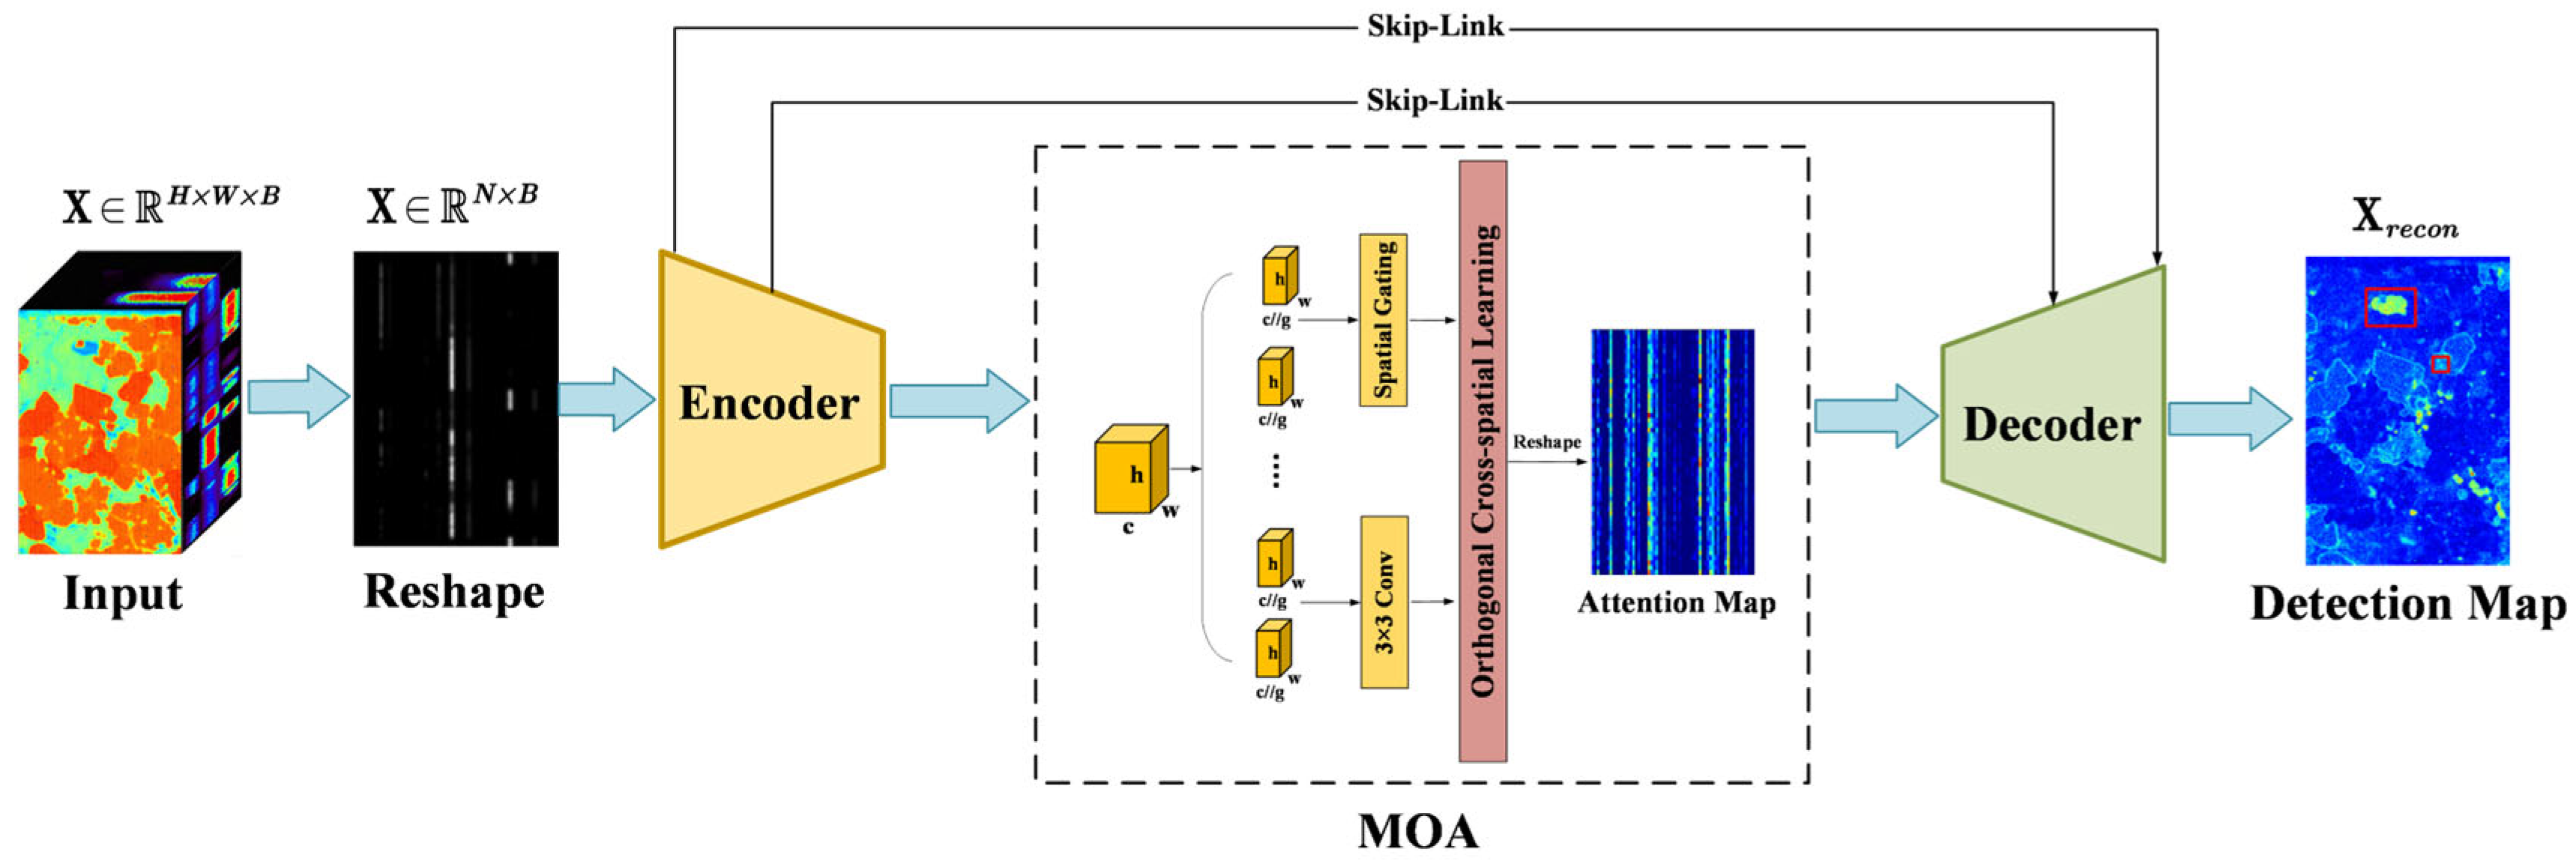
Figure 1. MSFA-Net model structure.
Minerals 15 00970 g001
Figure 2. The structures of our MOA module. G represents the divided groups. X represents features from pooling along the height (h) direction. Y represents features from pooling along the width (w) direction.
Minerals 15 00970 g002
Figure 3. Data structure of a micro-XRF image and its spectral curve.
Minerals 15 00970 g003
Figure 4. Anomaly detection results of different algorithms on the datasets. The red boxes indicate regions identified as anomalies by the models.
Minerals 15 00970 g004
Figure 5. ROC curves of RX, AE, and MSFA-Net on the datasets.
Minerals 15 00970 g005
Figure 6. AUC of the datasets.
Minerals 15 00970 g006
Figure 7. Background anomaly separation map of the datasets.
Minerals 15 00970 g007
Figure 8. Microscopic comparison and validation.
Minerals 15 00970 g008
Figure 9. Detection results for MSFA-Net under different experimental settings. The red boxes indicate regions where MSFA-Net demonstrates clear advantages in anomaly detection.
Minerals 15 00970 g009
Table 1. AUC results of the ablation study.
ModuleLQD_1LQD_2LQD_3LQD_4LQD_5LQD_6
No_Attention0.85080.78510.63290.75200.79020.7645
No_Groups0.84950.78780.63100.75160.79020.7727
No_Orthogonal0.84980.81650.61840.75260.78960.7676
MSFA-Net0.85170.82140.63890.81160.79050.7735
Disclaimer/Publisher’s Note: The statements, opinions and data contained in all publications are solely those of the individual author(s) and contributor(s) and not of MDPI and/or the editor(s). MDPI and/or the editor(s) disclaim responsibility for any injury to people or property resulting from any ideas, methods, instructions or products referred to in the content.