Article

Geochemistry and Th–U–Total Pb Chemical Ages of Late Variscan Uranium Mineralisation at Shkhara, Greater Caucasus

by
Franziska D. H. Wilke
1,*,
Avtandil Okrostsvaridze
2,
David Bluashvili
3 and
Rabi Gabrielashvili
2
1
GFZ—Helmholtz Centre for Geosciences, 14473 Potsdam, Germany
2
Institute of Earth Sciences, Ilia State University, 0177 Tbilisi, Georgia
3
Faculty of Geology and Mining, Georgian TU, 0177 Tbilisi, Georgia
*
Author to whom correspondence should be addressed.
Minerals 2025, 15(9), 960; https://doi.org/10.3390/min15090960
Submission received: 13 May 2025 / Accepted: 2 September 2025 / Published: 9 September 2025
(This article belongs to the Special Issue Advances in Uranium Metallogenic Theory, Exploration and Exploitation)

Abstract

We present the chemical composition and the U-Pb chemical age of the recently discovered uranium mineralisation occurrence in the crystalline Shkhara Massif in the Greater Caucasus. The mineralisation consists of hydrothermal uraninites from veins that intersect into the Late Variscan biotite–plagioclase-rich granite and migmatites. The chemical composition and the Th–U total Pb chemical age of the uraninites were determined. Results show thorium-rich, (∑LREE/∑HREE)N unfractionated uraninites that had been formed under higher temperatures above 450 ± 50 °C. Fifty-eight measurements on 14 grains revealed homogeneous and unaltered uraninites. Th–U–total Pb ages of the uraninite were calculated from 55 chemical analyses, among which 37 plot between 275 and 305 Ma. The weighted median age of the 55 data points corresponds to 291 ± 14 Ma: the boundary between the Carboniferous and Permian periods. These dates suggest that uraninite mineralisation is related to the late orogenic extensional process of the Great Caucasus structure. During this process, hydrothermal fluids permeated the biotite-+ and plagioclase-rich magmatic rocks of the Main Range zone and formed U- and Th-rich veins and uraninite mineralisation. This study shows that the Shkhara uranium occurrence correlates with most of the late Variscan uranium deposits in Central and Western Europe in terms of geodynamic setting, composition, age and type of mineralisation.

Graphical Abstract

1. Introduction

In Europe, uranium mineralisation and ore deposits of the vein type are associated with Upper Palaeozoic and Mesozoic granitoids [1,2]. Exceptions date from the Precambrian to the Paleozoic and mainly include intrusive and/or vein-type uranium deposits in Norway and Finland [2], and references therein. The majority of uranium occurrences in European granites are associated with the late Carboniferous peraluminous veins of the Variscan orogeny. These veins are located in brecciated zones or in fracture zones, which can occur both in the centre and at the edges of granite massifs. The uranium concentration in this type of mineralisation is typically ~200 ppm and their formation is usually associated with late orogenic magmatic activities, e.g., [3,4,5]. In Europe, such uranium deposits have been identified in the Iberian Massif, Spain [6], throughout France from the west in the Armorican to the Massif Central, on through the southeast in the Vosges, France [7,8]. The deposits continue in southwestern Germany, in the Schwarzwald Massif to Saxo-Thuringia in eastern Germany [9,10], and further appear in the Bohemian Massif, in the northeast of the Czech Republic [11].
In the Iberian Massif, in central western Spain, the leucogranite that hosts the uraninite was emplaced at 347.6 ± 1.9 Ma (U-Pb zircon) and the uraninite formed ca. 300 ± 3 Ma (U–Th–total Pb), excluding a magmatic origin of the uraninite [6]. The leucogranites of Armorica (NW France) were emplaced at 340–310 Ma (Rb-Sr whole rock; [12]), and host uranium ore depositions of 290–260 Ma were formed after brittle deformation and fluid circulation of late Hercynian activity [3,13]. In eastern Germany, the majority of late Variscan plutonic rocks were dated around 335–320 Ma (U-Pb zircon, U–Th–total Pb), with uraninites formed during the latest stage at 328 Ma (U–Th–total Pb), e.g., [14]. Granites of the Bohemian Massif were dated ca. 327–318 Ma, with uranium deposited at 310 Ma [15]. In summary, the Variscan (leuco)granite-related uranium depositions were formed in the Late Carboniferous to Early Permian period.
A uranium-bearing vein mineralisation was recently discovered in the Shkhara Massif in the upper reaches of the Enguri River. The Shkhara belongs to the Upper Palaeozoic Granitoid Massif of the Greater Caucasus. This paper reports and discusses geochemical analyses and U–Th–total Pb chemical dating of uraninites from plagiogranitic veins. Former analyses using inductively coupled plasma–mass spectrometry (ICP-MS) by the US Geological Survey (Denver Regional Center) and inductively coupled plasma–optical emission spectrometry (ICP-OES) at the Analytical Laboratories in Vancouver (MSALABS), Canada, revealed that the U concentration in the whole rock is up to 390 ppm and the Th concentration is up to 90 ppm [16]. The petrological and structural properties of the plutonic rocks of the Shkhara crystalline massif are similar to those of the Variscan granitoids throughout North Africa and Western and Central Europe, and their uranium concentrations are comparable as well, e.g., [1,7,16]. In this paper, we provide additional data for the timing of Variscan uraninite mineralisation in the Shkhara crystalline massif in Georgia and, therewith, expand knowledge about the spatial extent of the latest Variscan uranium mobilisation, which has been documented so far to occur from the central Iberian Zone to the Bohemian Massif [1,7]. The recent discoveries of uraninite in the Greater Caucasus allow us to extend the occurrence of uranium mobilisation and precipitation far to the east of Europe and to highlight spatial and temporal similarities and differences between this region and Central and Western Europe within the late to post-collisional development of the Variscan orogeny in this region.

2. Geology of the Greater Caucasus Orogenic Belt

The Caucasus region, situated between the Black and Caspian Seas, represents a critical zone of ongoing convergence between the Arabian and Eurasian plates. This dynamic region encompasses the Greater and Lesser Caucasus Mountains, as well as the intervening Kura and Rioni Basins (Figure 1). Structurally, the area is shaped by complex geological processes that reflect its role as the northernmost expression of the Arabia–Eurasia collisional system [17,18].
The Greater Caucasus extends over 1200 km from the Caspian Sea in the east to the Black Sea in the west. It is an Alpine Cenozoic collisional orogenic belt formed during the closure of a Mesozoic to Cenozoic back-arc basin [20]. This closure, marked by subduction and eventual continent–continent collision, is estimated to have begun during the Oligocene [21] and culminated in significant uplift and crustal shortening by approximately 5 Ma [22]. The range is underlain by a pre-Jurassic crystalline basement and magmatic-sedimentary formations of the Mesozoic–Cenozoic, with the basement thought to represent an active continental margin during the Palaeozoic, when the Paleo-Tethyan oceanic crust was subducted northward [23]. Post-collisional crustal relaxation of the Greater Caucasus has been proposed for the end of the Palaeozoic but can be hardly observed because of inversion due to Alpine orogeny. Recent compression within the Greater Caucasus is demonstrated by seismicity and structures along former faults (Figure 1 and Figure 2).
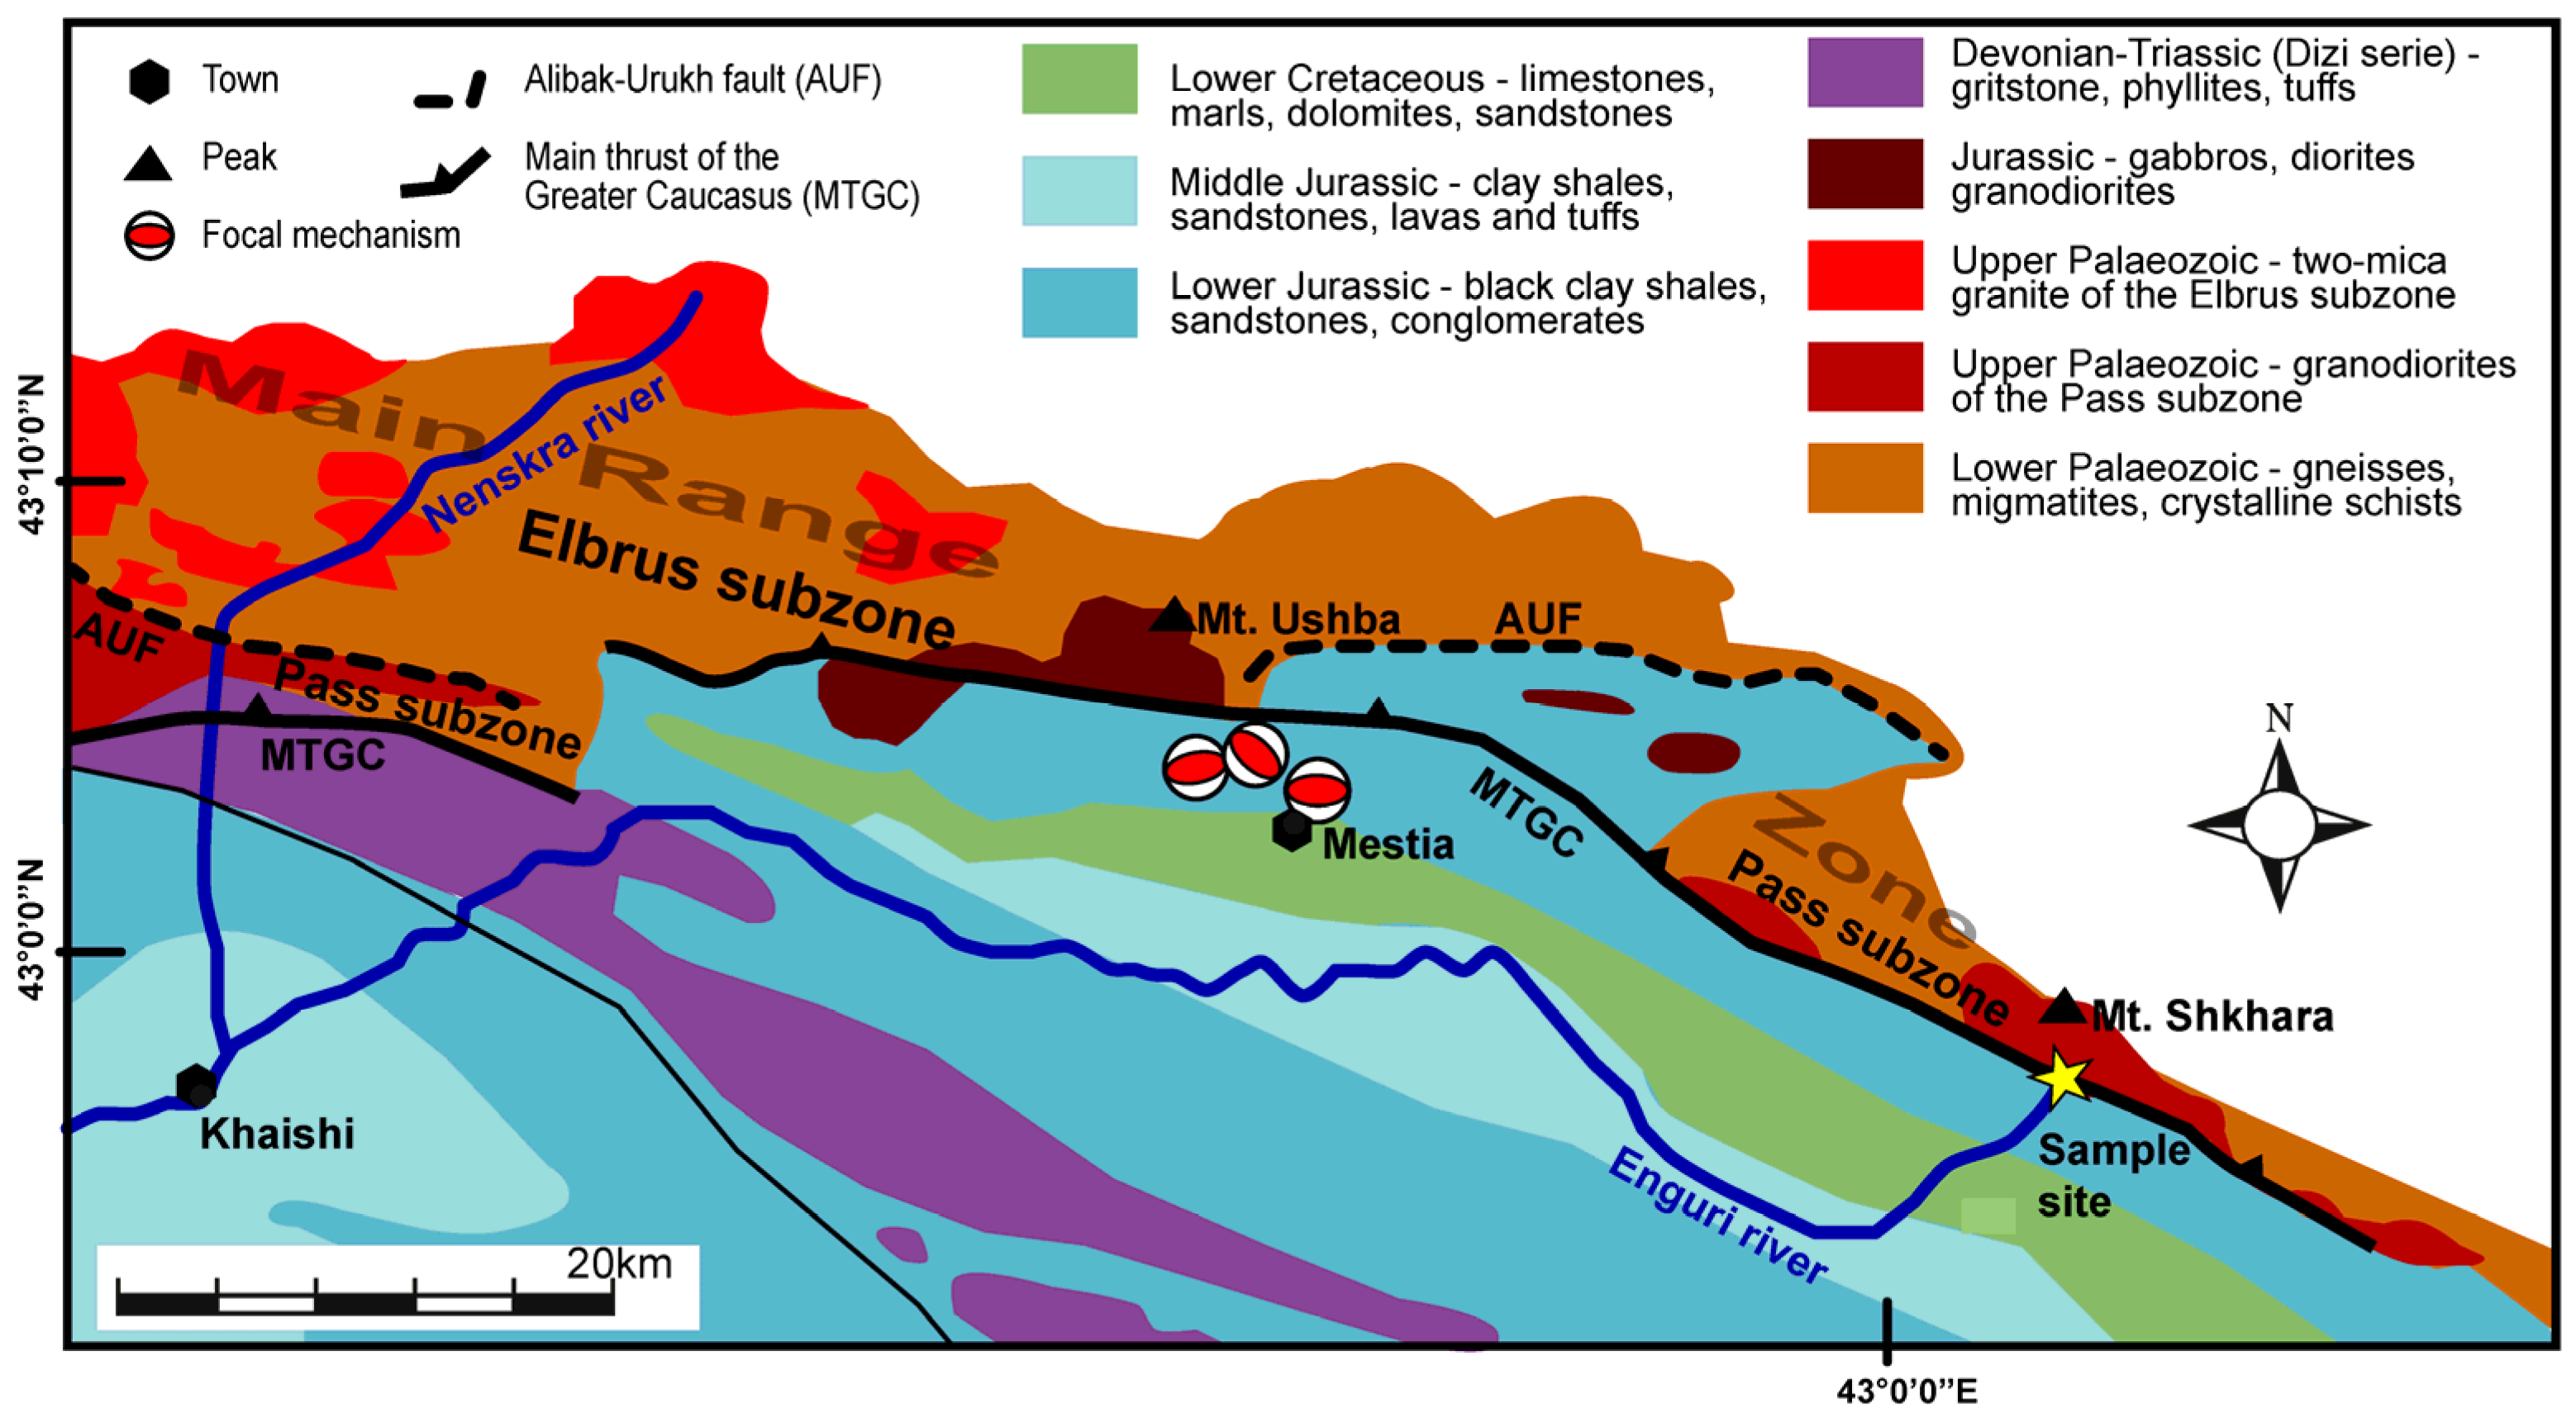
The crystalline basement of the Greater Caucasus exhibits a collage of structural tectonic zones. Among these, the Main Range Zone (Figure 2) comprises an Upper Palaeozoic crystalline basement brought to the surface by steep dipping thrusts. The Main Range Zone is divided into the Pass and Elbrus subzones, characterized by distinct magmatic and metamorphic gneiss-migmatite assemblages. The Pass Subzone is dominated by I-type quartz-diorites and granodiorites, while the Elbrus Subzone features S-type two-mica granites. Both subzones host late orogenic plagioclase-rich granite veins that intrude older gneiss-migmatite complexes [23]. The Main Thrusts of the Greater Caucasus (MTGC) and associated faults, such as the Alibak-Urukh fault (AUF), play a crucial role in the structural configuration of the range [25].
The Scythian Platform (Figure 1), located to the north of the Greater Caucasus, represents the stable cratonic segment of the Eurasian Plate [26]. Composed primarily of Precambrian basement rocks overlain by a thick sedimentary cover, it serves as a rigid backstop against which deformation within the Caucasus is localized [27]. This platform plays a crucial role in the region’s tectonics, influencing the distribution of stress and relaxation and accommodating limited shortening in response to the ongoing Arabia–Eurasia convergence [26], and references therein.
Ongoing plate convergence across the region is most evident in the Kura Fold-Thrust Belt (KFTB), which is located along the southeastern flank of the Greater Caucasus. This belt accommodates much of the shortening east of 40° E through a series of north-dipping thrusts [28]. Geodetic and seismic data indicate modern convergence rates of approximately 2 mm/yr in the west to 12 mm/yr in the east, with deformation focused along the Kura and Rioni Basins [18], which separate the Greater Caucasus in the north from the Lesser Caucasus in the south. In the eastern Greater Caucasus, convergence is partly accommodated by a north-dipping subducted slab beneath the range, extending 100–200 km [29]. Seismically, the region remains active (Figure 2), exemplified by events such as the 1991 Mw 6.9 Racha earthquake in western Georgia. In this area, the Chaladidi-Tsaishi Thrust (CTT) along the Rioni Basin’s northern edge marks the boundary of active deformation [30].

3. Uranium Mineralisation Occurrence in the Shkhara Massif

The Shkhara crystalline massif is located in the Pass subzone of the Main Range Zone (Figure 2). It forms a ~15 km long and ~5 km high ridge and is composed of Lower to Middle Palaeozoic biotite schists, gneisses and migmatites. These rocks are exposed at the headwaters of the Enguri river and along the reactivated MTGC that define a Palaeozoic suture zone. Palaeozoic rocks were thrust over the Lower-Middle Jurassic black shales (Figure 2).
The Palaeozoic rocks of the Shkhara Massif are cut by a granitoid pluton of the Variscan generation tens of kilometres in size. The pluton is predominantly composed of granodiorites, with smaller amounts of granites and quartz-diorites. The SiO2 content of the granodiorites varies between ~67 and 71%, with Al2O3 ~14%–16%, Fe2O3 ~3%–6%, MgO ~0.5%–1%, Na2O ~2.5%–3.5% and K2O ~3%–4% [16]. The pluton was probably generated in an island arc geodynamic setting [16,23]. Zircons in biotite granodiorites of the Shkhara pluton and enclosing biotite-gneisses were dated by the LA-ICP-MS method. A weighted mean 206Pb/238U age of 488.5 ± 8.5 Ma was found for zircons of the biotite-gneiss and a weighted mean 206Pb/238U age of 316.9 ± 8.8 Ma for zircons of the cutting granodiorites [16].
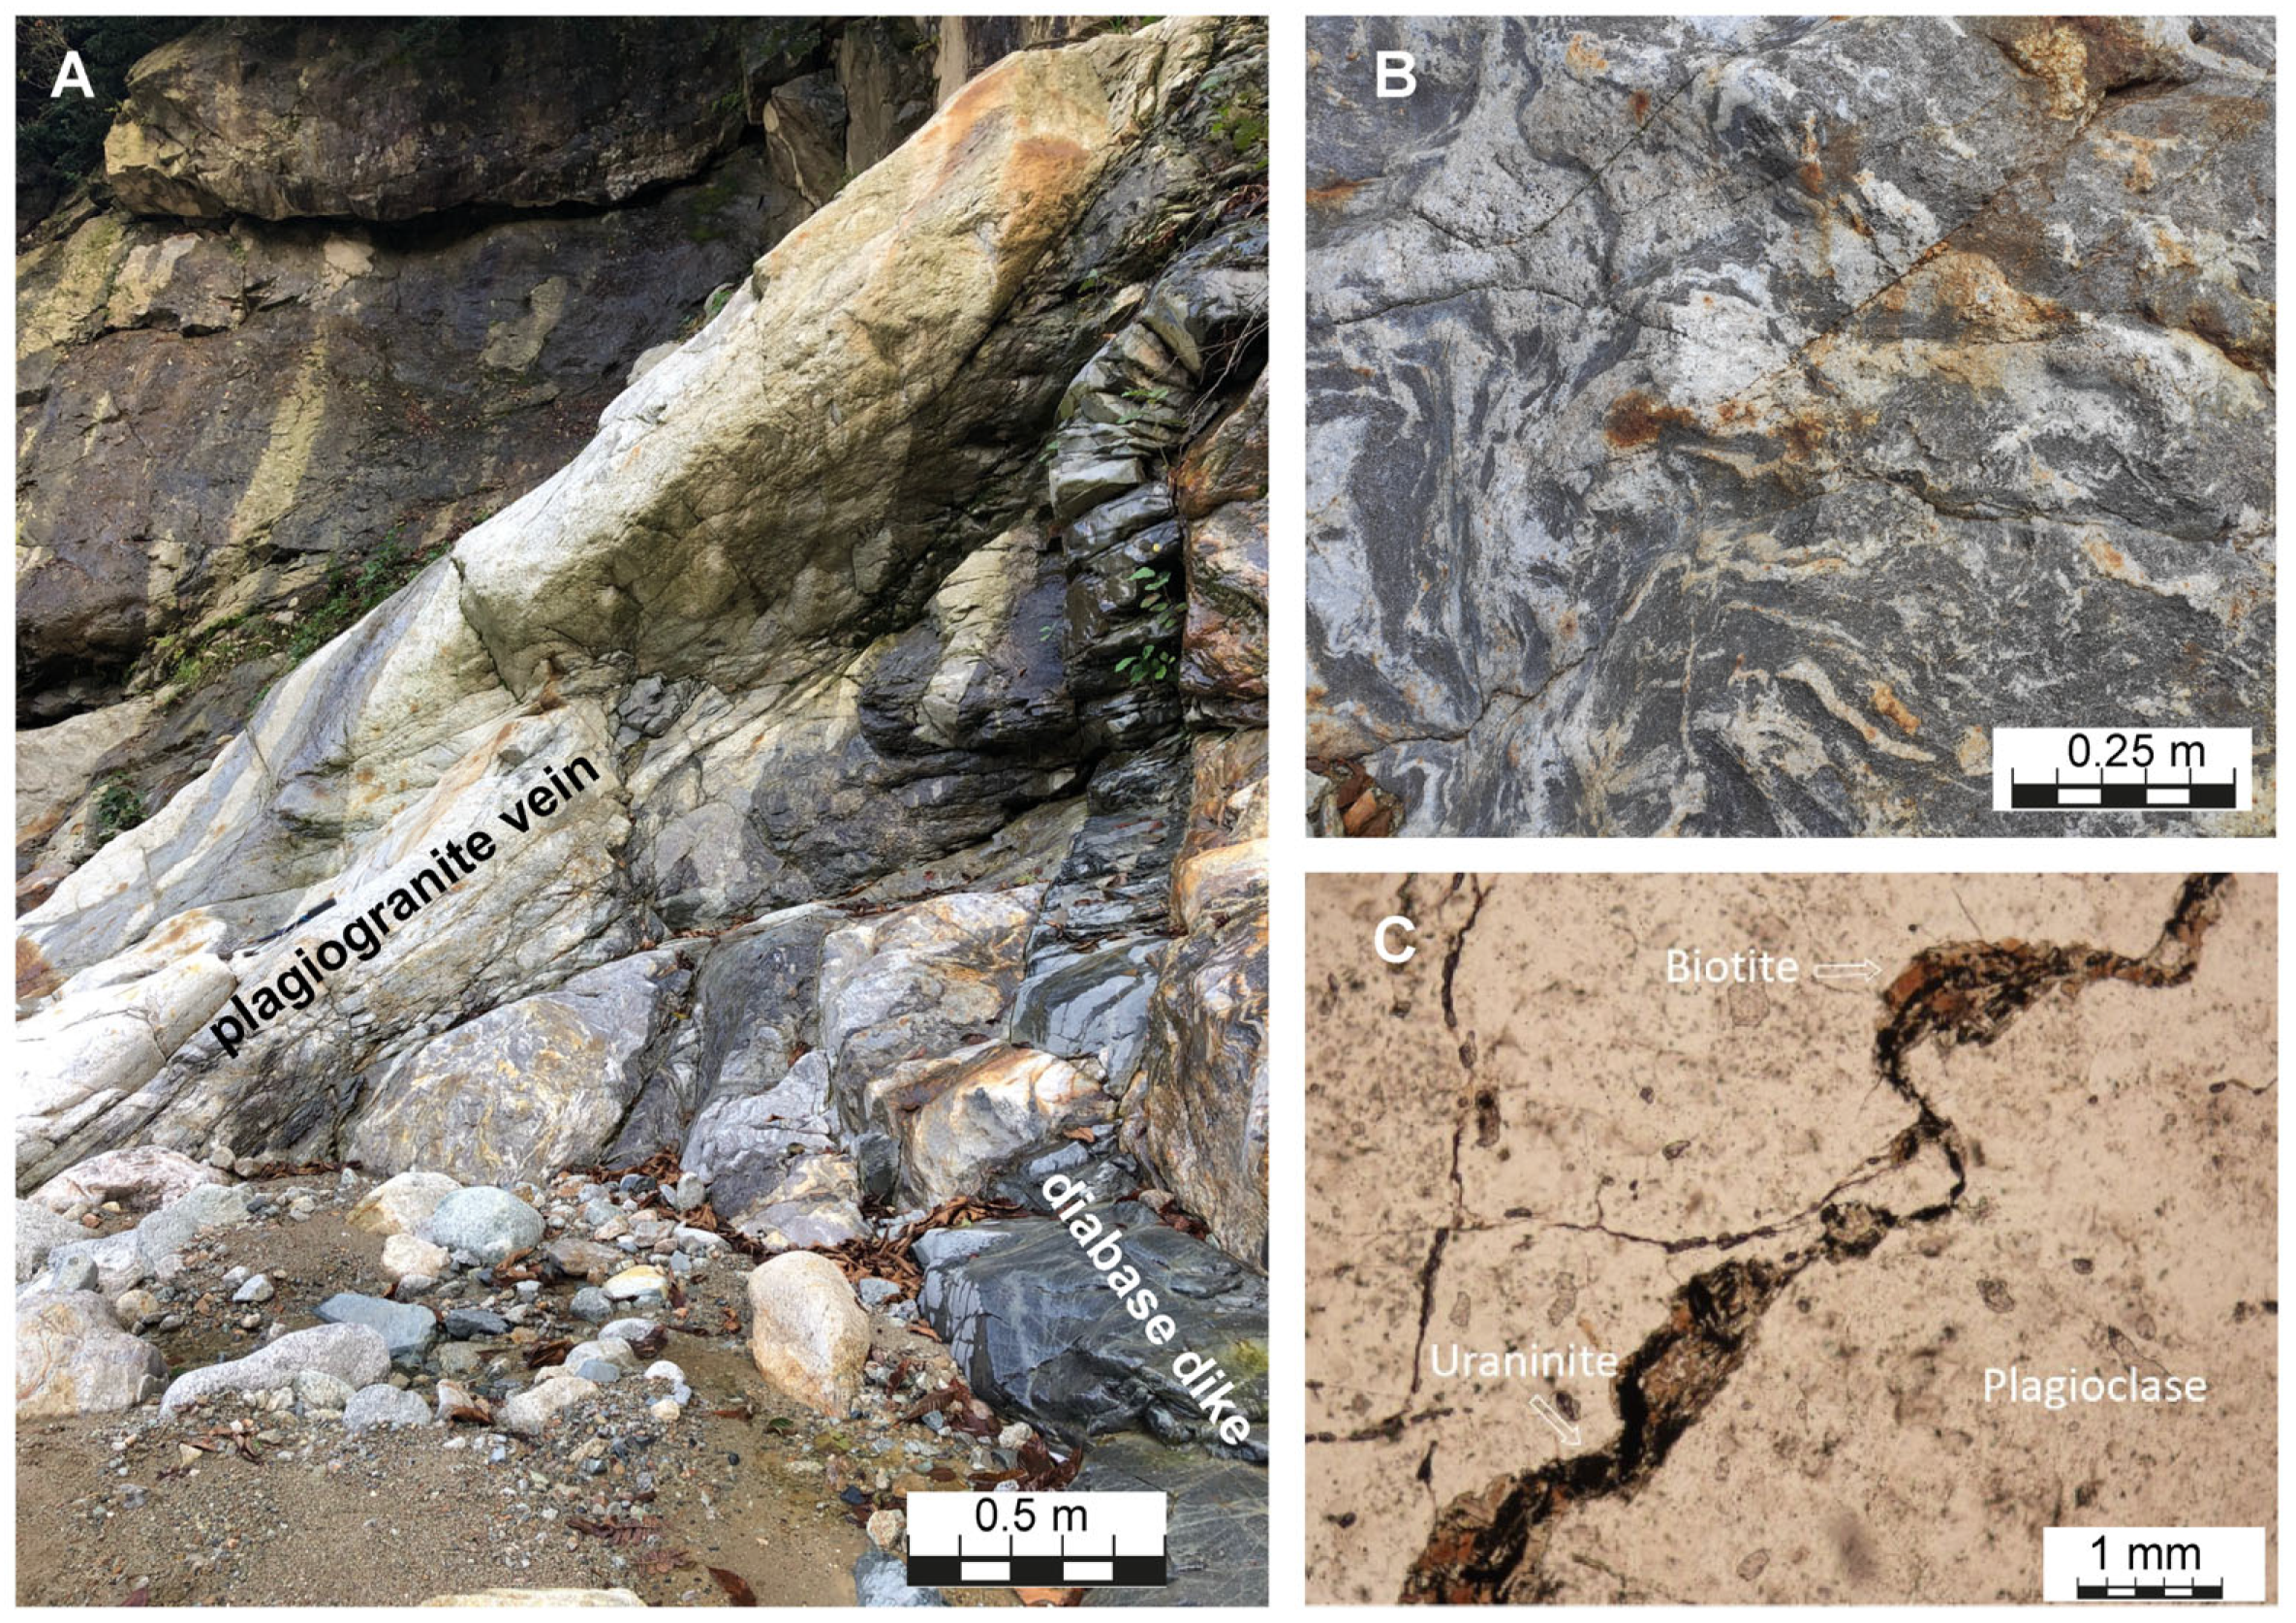
The Shkhara uranium ore occurrence at lat. 42.5845° E and long. 43.3027° N is spatially and genetically related to biotite and plagioclase-rich granite veins that occur along the MTGC. These predominantly NW-SE and N-S striking granites are localized in biotite-migmatites and gneisses which, unlike other rocks of the Shkhara Massif, have not undergone regional microclinisation. The biotite plagiogranite veins are hydrothermally altered, have a milky colour, a massive structure and a medium-to-fine-grained texture. Locally, U-mineralisation is at the contact to diabase dikes (Figure 3). The veins are slightly fractured, and the cracks are filled with quartz and albite. The plagiogranite veins are mainly composed of quartz and plagioclase, with biotite, muscovite, microcline, chlorite and epidote present in minor amounts. Accessory minerals are allanite, sphene and zircon. Zircons yield a 206Pb/238U weighted mean age of 310.2 ± 7.5 Ma [16]. Thorium-enriched uraninite occurs as small precipitates, also forming veins, in the quartz-plagioclase masses (Figure 3). The SiO2 content of the plagiogranite veins varies in the range of 75%–85%. The content of Th in this rock ranges within 25–90 ppm and that of U ranges within 55–390 ppm [16].

4. Materials and Methods

4.1. Dose Measurements of U-Bearing Biotite and Plagioclase-Rich Granites

The radiation dose on the surface of the Shkhara plagiogranite vein was measured in the field and varies from 1.5 to 2.0 μSv/h; it is is therefore almost 10–15 times higher than the reported safe dose of radiation (~0.17 µSv/h). We collected eight samples from the vein and four samples from the country rock with an elevated radiation dose of >0.3 μSv/h.

4.2. Electron Microprobe Measurements

Rocks were sampled from four ore veins (#21Ge1; #21Ge5; #21Ge7; #21Ge9) and thin sections were prepared with a final polishing of ¼ mm corundum powder. Samples were coated with ~20 nm carbon. In situ chemical analyses of Shkhara uraninite grains were carried out at the GFZ in Potsdam, Germany utilizing a JEOL JXA8500F microprobe. Fifty-eight data points were analysed on a total of 14 uraninite grains sourced from 4 ore-vein-bearing samples. An accelerating voltage of 20 kV and a current of 20 nA was used for the measurements in order to minimize damage of the uraninite grains. Probe size was 1 µm. The focus of the chemical investigation was to obtain the Th–U–total Pb chemical age of the uraninites, for which we followed the procedure widely described [6,31,32]. Th was counted for 100 s on peak and measured on the Th (Mα, PETH) line, while U was counted for 200 s and Pb for 300 s on peak. U and Pb were measured contemporaneously using their Mß-lines and PETL diffracting crystals. The detection limits (1σ) are ~350 ppm for Th and U and ~200 ppm for Pb. The counting times on peak for silicon (Si) were 10 s. Minor and trace elements like calcium (Ca), phosphorus (P), aluminium (Al), iron (Fe) REEs and Y were analysed for 30–60 s on peaks and half of that on backgrounds, respectively. Stoichiometry, composition and ages of analysed uraninite were checked throughout the analytical campaign on uraninite standard from Cannon© and, to cross-check for REE, besides U, Th and Pb, on a monazite reference material from Madagascar [33]. Up to 8 sets of measurements on one uraninite grain using the same conditions and procedures were performed. Matrix corrections were performed according to the Armstrong CITZAF method [34]. Interference corrections were performed for Er Lß and Fe Kα, which interfere with Th, for Gd Lß interfering with Ho, and Si Kα, which interferes with Nd. The obtained chemical average compositions of the uraninites are given in Table 1.
Single uraninite dates and weighted average dates were calculated utilizing the procedures applied and described in [31] and applied in, e.g., [6,14,35]. Basically, the single-point ages were obtained by iteratively solving the equation for radioactive decay of Th and U, assuming that all Pb is radiogenic. The assumption that common Pb is incompatible with uraninite stems from their contrasting ionic characteristics, such as the different charge of Pb2+ and U4+ (in uraninite) and that Pb2+ has an ionic radius of ca. 1.37 Å, compared to 1.05 Å for U4+ [36]. The equation and all constants can be found in [31,37] and the references therein.

4.3. Chemical vs. Isotopic Dating: A Brief Summary

In contrast to U–Pb isotopic ages, which are calculated from the isotopic U/Pb ratios determined by mass spectrometry, Th–U–total Pb ages can be calculated from electron microprobe analyses. Both methods can be performed in situ from the thin or thick section. The advantage of using the microprobe is the simplicity in determining mineral ages in relation to specific minerals and mineral textures, avoiding mixed mineral ages. Even in the light of recent achievements in laser-ablation ICP-MS, the electron microprobe provides an advantage due to the very small probe size, the excitation volume and the high-resolution imaging [31,35]. Several mineral generations and zonation in minerals can be detected and distinguished. However, it has to be noted that the chemical age determination is less accurate than measurements using a mass spectrometer due to the limited measurement precision of the microprobe. The precision of the ages is largely dependent on the precision of the Pb analysis and is typically ~5% [37]. This is reflected in the average error of each analysis, derived from repeated measurements of the same spot and counting statistics [14,31]. Of course, LA-ICP-MS ages are more robust as they can provide reliable ages in cases of significant Pb loss.
For chemical dating of uraninite, the initial concentration of Pb (even if it was at a level of tens or a few hundreds of ppm) is subordinate in comparison with the in situ Pb ingrowth [6,37]. Of course, this method of mineral dating is only applicable to high-U minerals such as uraninite, monazite and xenotime, which incorporate barely detectable amounts of common Pb. Pb concentrations in the samples were obtained using large PET (PETL) diffracting crystals in the microprobe, which are suitable for detecting low and trace concentrations of Pb, or other elements, with a maximum peak/background ratio and a slim peak. The raw data underwent careful data reduction and statistical analysis.
The chemical dating of uraninite using the electron microprobe has provided precise age estimates in former studies, e.g., [6,14,38]. Under the reasonable assumption that no Pb was incorporated during crystal growth and that we can demonstrate in this study that no or only minor Pb loss occurred, the chemical age determination of uraninite using microprobe analysis provides a robust and efficient tool for chronologically classifying one very specific Variscan-related event in structurally and texturally complex samples [37].

5. Results

The uraninite dating campaign includes single-point analyses from 14 grains sourced from four ore-vein-bearing samples (#21Ge1; #21Ge5; #21Ge7; #21Ge9). Each of the single-point analyses was repeated for up to eight times in the immediate vicinity of the previous measurements. However, #21Ge7 had only one small uraninite grain upon which only three spots could be located. They gave a spread of ages within the Permian, which was discarded. The minima, averages, and maxima of all quantitative results from the three ore veins are reported in Table 1. The full dataset is provided in Supplementary Table S1.

5.1. Uraninite Chemistry

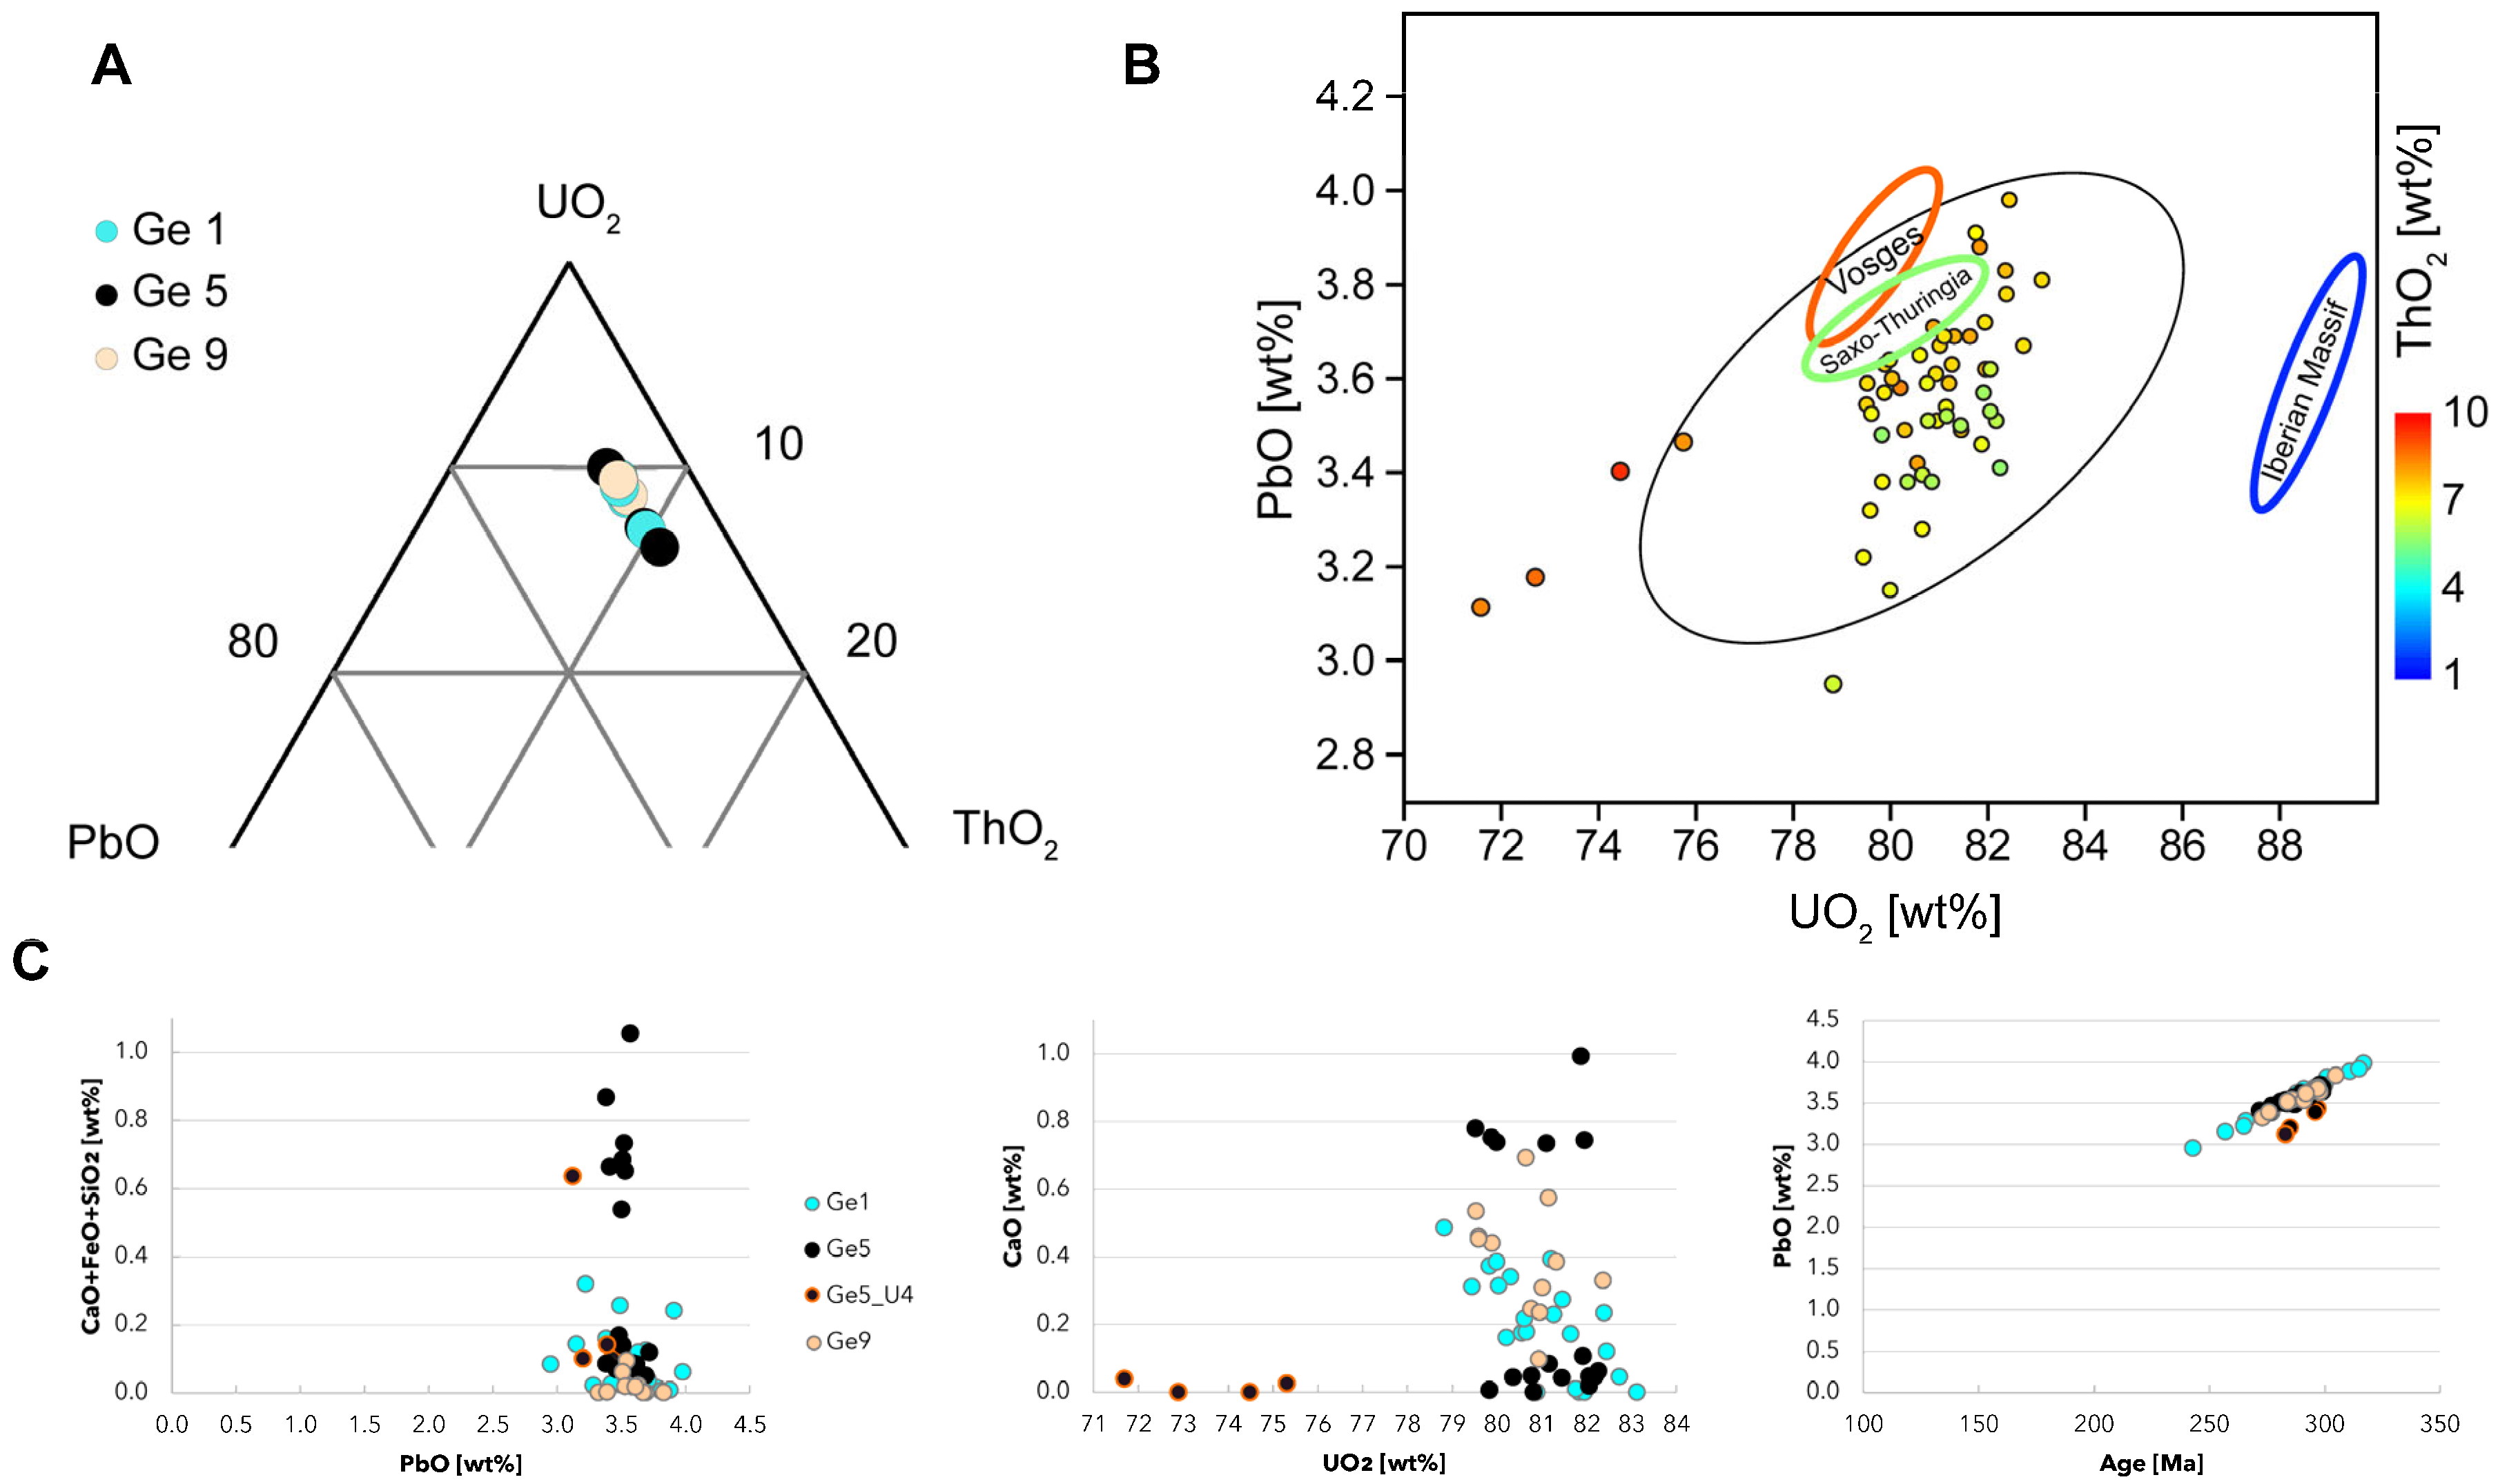
The geochemical characterization for U, Th and Pb is shown in Figure 4A,B, revealing a very homogeneous composition. Figure 4C shows the most common elements to substitute for either Pb or U due to fluid circulation and alteration, as well as the correlation of Pb content and the chemical age. The concentrations of non-stoichiometric elements used for alteration fingerprinting, such as Fe, Si and Ca, are low or even below their respective detection limits (Supplementary Table S1). Based on the investigations of [36,39] on the cation exchange reactions of Ca, Fe and Si for Pb and of Ca for U, which can occur due to fluid circulation, we can conclude that no such (or very limited) negative correlations occur in our uraninites (Figure 4C). This is also true for grain Ge5_U4, from which the four analysed spots show lower UO2 and higher ThO2 concentrations in comparison to the other uraninite grains (Figure 4B, red circles close to or outside the 95% confidence ellipse, Figure 4C). CaO, FeO and SiO2 contents are low (∑ < 0.7 wt%) and similar to the other grains.
Figure 4. Geochemical characterization of the uraninites. (A) Ternary plot showing major uraninite component variation in wt%, demonstrating the Th substitution of U. (B) Scatter plot with UO2 and PbO in wt% and a colour bar for the ThO2 [wt%] shows the very homogeneous composition of the uraninites. The 4 spots from sample Ge5_U4 (grain U4) have lower UO2 but higher ThO2 (reddish filling) and are close to or outside the 95% confidence ellipse. This Th–U substitution did not affect the respective ages (see Figure 5E). For comparison, we added the geochemical range of uraninite from episyenite and their host rocks from Spain [6], France [8] and Germany [14] to that diagram. The colour coding of these ellipses represents their ThO2 concentration as given in the colour bar for ThO2. (C) CaO+FeO+SiO2 vs. Pb and CaO vs. UO2 diagrams showing that no (or very minor) negative correlations occur in the Shkhara uraninites, pointing to no or minor elemental substitution due to fluid circulation and alteration [36,39]. The PbO vs. age diagram shows the linear correlation between radiogenic Pb2+ and age, which again points to minor, or a very homogeneous and consistent, Pb loss across all dated veins. The Ge5_U4 sample is presented separately to refute the assumption of the conversion of uraninite to coffinite and to emphasize that the substitution of UO2 by ThO2 has no, or only a minor, influence on the age.
Minerals 15 00960 g004
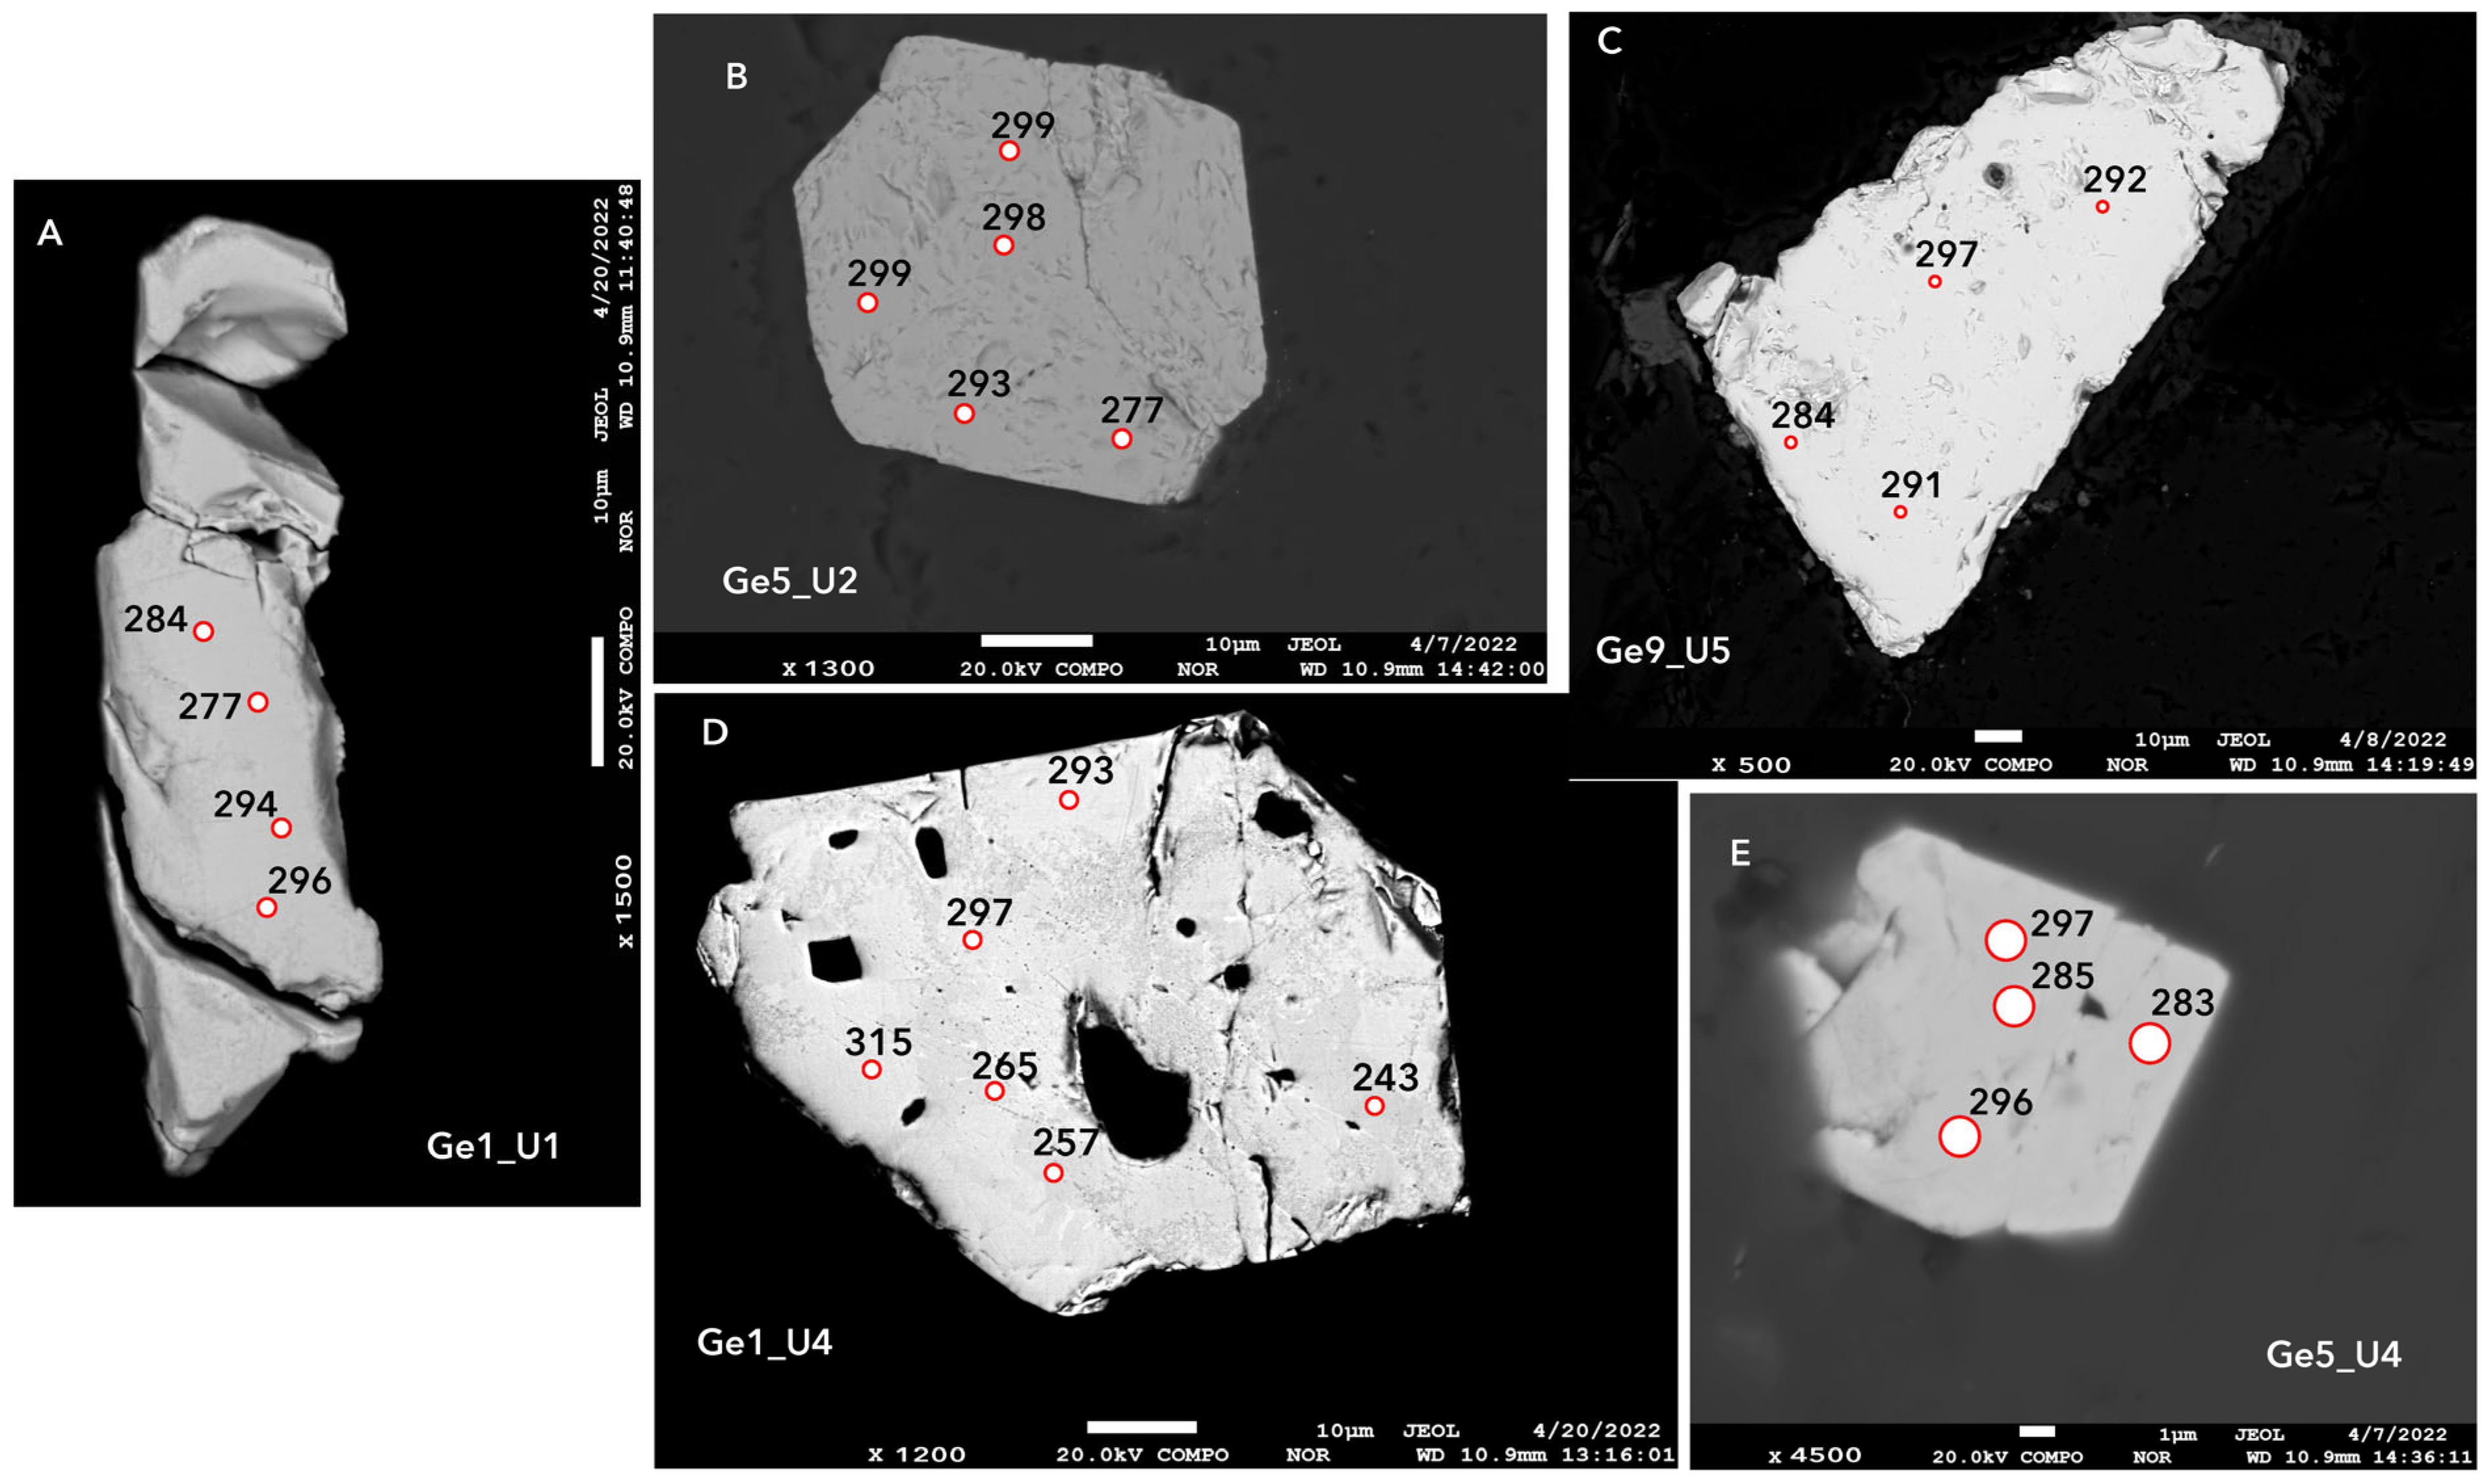
Figure 5. Backscatter electron images (COMPO/BSE) of uraninite grains from the three veins dated. (AC) No zonation is visible. Spots are ca. 1 µm, as during EPMA measurements, indicating the location of measurement. Numbers show spot ages in Ma, with uncertainties of ±15 Ma for Ge1 and ±7 Ma for Ge5 and Ge9. (D) Ge1-U4 showing inhomogeneous patterns within a grain. Darker areas have higher porosity and, when looking at the chemical composition, show increased incorporation of Er, Dy and Y at the expense of U and Th. Points placed on darker areas yielded younger ages of 243–265 Ma, while lighter areas show ages of 293–315 Ma. (E) The Ge5_U4 grain exhibits a homogeneous age and chemical distribution, while the chemical composition of this single grain differs from the other uraninites examined here in that it has higher ThO2 and lower UO2 concentrations.
Minerals 15 00960 g005
An alteration of the uraninites under oxidizing conditions can be considered relatively limited, as the total analytical values are still relatively high, ranging between 93 and 98 wt% [39]. Low total values may indicate either hexavalent U due to self-oxidation during the radioactive decay of U, structurally bound volatile substances such as CO2 or H2O, which could also be present in micro-inclusions, or uneven polishing of the samples [36,40]. The latter could have played a role in uraninites from the Ge 5 vein (Figure 5B). Additional elements not measured in this study but present in substantial concentrations can be ruled out as the reason for lower total values, as EDX analyses were carried out in advance. An alteration of the uraninite under reducing conditions, which would result in the formation of coffinite, for example, was not detected [36].

5.2. Uraninite Chemical Age Determination

The chemistry within individual grains is homogeneous, too, as visible from backscatter electron imaging (BSE/Compo), which is suitable for the visualization of compositional changes (Figure 5A–C,E). In addition, uraninites show identical compositions throughout the vein, with the exception of grain Ge5_U4, which shows lower UO2 but higher ThO2 concentrations than the other investigated grains. The uraninites lack signs of alteration, with one exception, shown in Figure 5D. Here, the central part, which is the youngest part, is darker and more porous areas are visible. This can be interpreted as altered, and some Pb loss may also have occurred (Table S1). However, a redistribution of Pb and the formation of galena in uraninite or at the rims, as seen in hydrothermally altered uraninite [41], is not evident. U, Th, Pb and Y are the main elements; REE are important minor elements. The contents of the most important chemical elements vary in the following intervals: UO2: 71.7 to 82.6 wt%; ThO2: 5.7 to 9.5 wt%; PbO: 2.95 to 3.9 wt%; and Y2O3: 0.40 to 4.6 wt% (Table 1). The uraninite studied here belongs to the typical thorianite–uraninite series (ThO2–UO2), but more specifically to the Th-rich uraninites (Figure 4B) that were also found in the Vosges and the Saxo-Thuringian region [13,14,15]. Thorium readily substitutes U in minerals (Figure 4A) due to their similar radii and valences, leading to the formation of common solid solutions [42]. Four points with enhanced Th-U substitution (Figure 4B; Ge5_U4 in Figure 4C) gave ages of 283–297 Ma (Figure 5E), well within the main age range of between 275 and 305 Ma, indicating that an enhanced Th substitution in equilibration with U does not disturb the U–Th–total Pb ratio and the age.
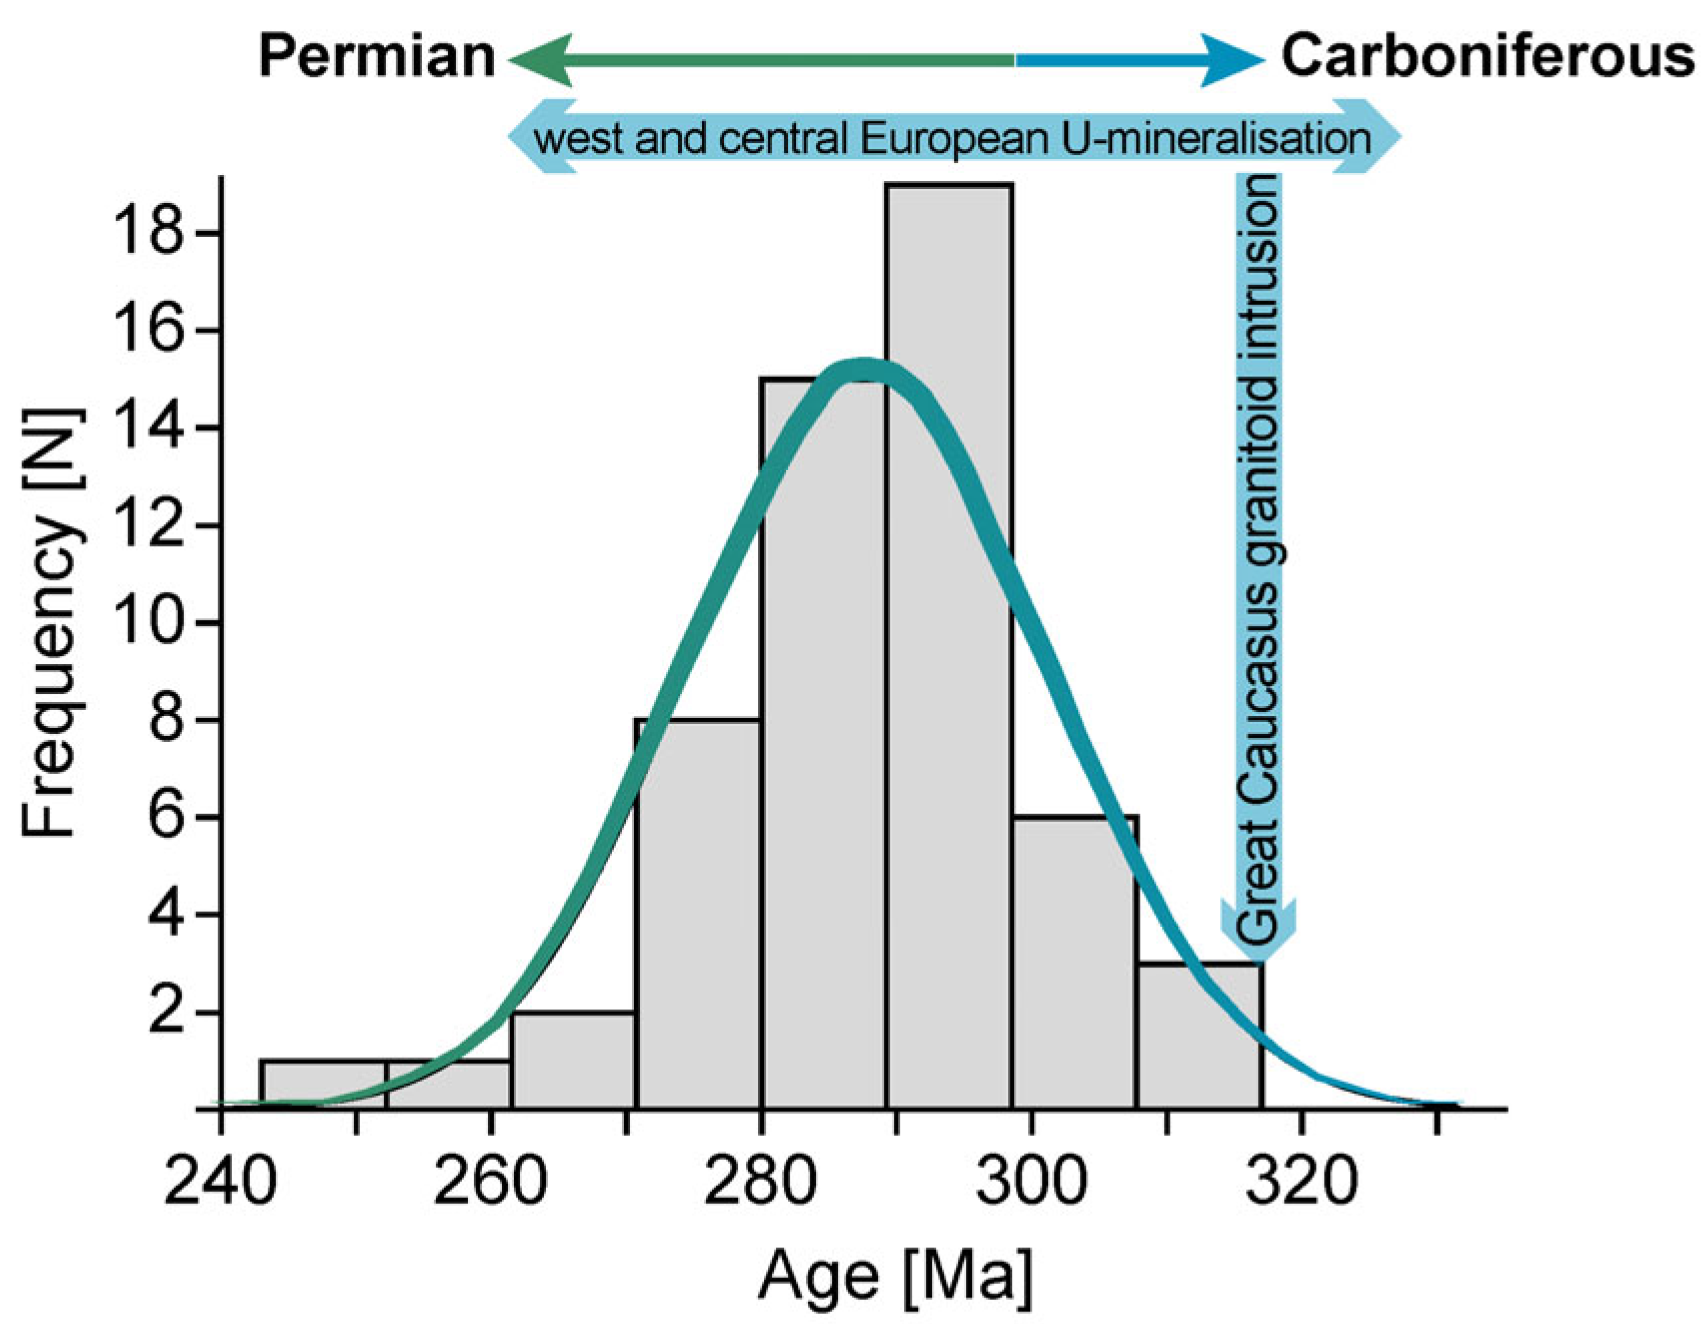
The statistical distribution of 55 measured uraninite ages (Supplementary Table S2), plotted either individually for each vein (Figure 6) or comprehensively (Figure 7; please see the discussion), shows one dominating age cluster, also represented in the normal fit distribution curve between 275 and 305 Ma, which is Late Carboniferous to Early Permian (Figure 8). The weighted median age is 291 ± 14 Ma. The average error of each analysis is ±15 Ma for Ge1 and ±7 Ma for Ge5 and Ge9, as derived from repeated measurements of the same spot and counting statistics [14,31].

5.3. REE Pattern of Uraninites

The chemical composition of uraninite generally reflects different processes, whereby (1) the decay of U to Pb during the lifetime of a crystal is an indicator of its age, (2) the incorporation of cations such as Si, Fe and Ca and the associated loss of Pb and/or U or, in the latter case, its oxidation indicates ageing processes, while (3) the initial incorporation of Th, Y and REE indicates the conditions during uraninite formation [36,39,40,43,44,45]. For Figure 7, the oxides of the rare earth elements (REE) [wt.%] were converted stoichiometrically into elements [ppm] and chondrite normalised [46]. All REE data can be found in Supplementary Table S1.
The LREE-depleted forms in Figure 7A could indicate the available source of REE during the formation of uraninite, but this only applies if no or only minor fractionation of REE is apparent. The latter is obvious, as (∑LREE/∑HREE)N is approx. 1 (Figure 7B). The abundances of ∑REE > 103 indicate that uraninites probably formed at T > 350 °C [6,43,44].

6. Discussion

Th–U–total Pb ages have been calculated from in situ electron microprobe analyses of uraninites from the Shkhara Massif in the Greater Caucasus in Georgia (Figure 6). The simplicity in determining mineral ages in relation to specific minerals, their textures and their chemistry (Figure 7), thus avoiding mixed mineral ages, due to the very small probe size, and the high resolution of the imaging are the advantages of using this method.
The statistical distribution of the 55 determined uraninite ages shows one dominating age cluster, which is also represented in the normal fit distribution curve between 275 and 305 Ma, which is Late Carboniferous to Early Permian (Figure 8). The weighted median age is 291 ± 14 Ma. The average error of each analysis is ±15 Ma for Ge1 and ±7 Ma for Ge5 and Ge9, as derived from repeated measurements of the same spot and counting statistics [14,31].
In addition to the visual evidence provided by BSE imaging, Figure 4C shows that the incorporation of trace elements such as CaO, FeO and SiO2, which replace PbO, cannot be proven, as there is no negative correlation [39]. Although sometimes variable, the levels of the above-mentioned trace elements remain below 1.2 wt%, indicating a very low loss and/or replacement of PbO in all samples [36,39,40]. No intensive hydrothermal overprinting of the uraninite is apparent, so it could be that the trace elements were incorporated during the original crystallisation. In view of the publications [36,39,40], in particular [39], we can cautiously speak of a closed system for Pb.
The chondrite-normalised REE patterns (Figure 7) show a consistent depletion of LREE compared to MREE and HREE in all samples, which is more characteristic of deposits in magmatic or even sandstone environments or of high-temperature hydrothermal uraninites [43,45]. The uraninites studied here were taken from the Main Range Zone, where the Pass Subzone is dominated by I-type quartz diorites and granodiorites, while the Elbrus Subzone contains S-type two-mica granites. Both basement zones could have supplied the REEs that now indicate the genesis of the uraninites. The source of the REEs contained in the uraninites could therefore be a mixture of both host rocks [43]. Furthermore, a review of [45] shows that the greatest variability in REE contents in uraninites is observed in vein-like deposits with a rather flat curve, whose normalised concentrations range over two orders of magnitude.
Vein-type deposits also form over a wide temperature range. With regard to the ∑REE of Shkhara uraninites, a minimum temperature of 350 °C can be assumed [6,44,45]. The REE fractionation (∑LREE/∑HREE)N is around 1, indicating no or only slight fractionation, which suggests deposits that formed at >350 °C [43]. In addition, high ThO2 contents (5.7–9.5 wt%) are found in the U-mineralisation of the Vosges, Saxo-Thuringian Mountains and the Shkhara Massif (Figure 4B), which is in contrast to the Iberian Variscan U deposits [6]. According to [32,44,45], examples of hydrothermal uraninites formed at low temperatures contain little Th (U/Th > 1000), while those formed at higher temperatures (>450 ± 50 °C) generally have a higher Th content (U/Th < 100). The uraninite mineralisation at Shkhara can be considered a high-temperature formation, as the U/Th ratio in all samples varies between 5.5 and 1.3. Therefore, the formation of this uraninite should be interpreted as a high-temperature-related, predominantly vein-like deposit. It can be assumed that a much larger area was affected by uranium mineralisation in the deeper areas of the Shkhara massif than is suggested by the small uranium-bearing veins found on the surface to date.
Among the 55 data points discussed here, 37 plot between 275 and 305 Ma (Figure 7 and Figure 8), resulting in a median weighted age of 291 ± 14 Ma, which corresponds to the Carboniferous/Permian boundary. It is noteworthy that the post-collisional relaxation or post-orogenic extension of the Greater Caucasus began in this period as a follow-up to late Carboniferous Paleo-Tethys oceanic closure and island-arc collision resulting in granitoid intrusions during the late Variscan orogeny at 318 ± 7 Ma to 312 ± 6 Ma [23]. This succession of geological events, collision–extension–intrusion–U-mineralisation, is similar to the events of the post-Variscan U-mineralisation in Central and Western Europe, which occurred mainly at around 280 Ma. The large-scale extension within the Variscan belt of Europe, following the final closure of the Rheic Ocean [1], resulted in minor intrusions and hydrothermal fluid circulation and U-mineralisation in veins and dissemination in de-quartzified granite (episyenite). However, other authors have proposed continuous subduction from the upper Palaeozoic to the Mesozoic, e.g., [47] and references therein, with a phase of intense bimodal magmatism at the end of the Variscan at around 300 Ma. They argue that the Variscan suture lies south of the Greater Caucasus, where high-pressure rocks of Carboniferous age occur [48], and thus the U-mineralisation could have been developed in a back-arc setting. This hypothesis is difficult to disprove, as there is a lack of extensional structures in the Greater Caucasus and the Shkhara Massif in particular. However, considerations of structural geology must take into account that post-collisional relaxation after the Tethyan closure and corresponding extensional structures were and are easily and completely covered by compression and crustal shortening [28], which continue to this day. Recent focal area solutions of earthquakes [29] clearly show the compression regime between the Eurasian and Afro-Arabian plates [47], with the MTGC most probably acting as a reactivated zone of weakness and accommodating extension as well as compression and overthrusting.
The analysis of Late to post-Variscan U deposits in Europe has shown that the granite-related type of U-mineralisation dominates [2,5]. The formation of U-mineralisation can be divided into two main types: First, U-mineralisation occurs at the outer margins of a contact metamorphic aureole of the host rock of the emplacing granite. These granites were often emplaced in shear zones, in older granites or in U-rich sediments like black shales. Enhanced fluid circulation caused hydrothermal alteration, with U-mobilisation and re-precipitation in the latest hydrothermal minerals, which often results in high-grade U-mineralisation. The second type is represented by intensely reworked sedimentary rocks, sometimes metamorphosed and in part recycled by crustal melting, by which the U content is transferred to U-rich granites. The U-mineralisation of the Shkhara Massif investigated and presented here is interpreted to belong mainly to the first type. It should be noted that during field work in 2022, high levels of Th and U were found in biotite gneisses and migmatites in the eastern part of the Shkhara Massif. The mineralisation is in the form of pockets and, unlike vein-type mineralisation, the whole rock has a high Th content (55–90 ppm) and a lower U concentration (25–45 ppm). Detailed mineralisation of the area has yet to be determined, although it appears that both types of mineralisation may be present in the Shkhara Massif.
The Late Variscan uraninite mineralisation of the vein type and related U deposits in Central and Western Europe and the Shkhara U-mineralisation are spatially associated with regional NW-SE to N-S fault structures [1,2]. The composition of the veins is similar to that of the host rocks (albitites, plagioclase-rich granites, biotite gneisses and migmatites). The Late Carboniferous ages observed in the host rocks and the Early Permian ore mineralisation itself frame the boundary between the Carboniferous and Permian periods. The time of formation of the host rocks and that of the ore mineralisation in fissures and veins is almost identical within the uncertainty. The Iberian–Meseta, the central Armorican, the Vosges and the Saxo-Thuringian Zone (Erzgebirge) contain U-metallogenic belts that were all formed between 340 and 275 Ma, the majority at around 280 Ma [1,2,7] during the post-orogenic transitional or extensional phase after the Variscan orogeny [2], and references therein.

7. Conclusions

Chemical spot measurements on 55 points of 14 uraninite grains from the Shkhara Massif in the Greater Caucasus were conducted by electron microprobe. The chemistry shows that no intensive hydrothermal overprinting of the uraninite is apparent and that we can cautiously speak of unaltered uraninites. Th–U–total Pb chemical age determinations and their distribution from the Shkhara U-mineralisation peak at ca. 291 Ma, i.e., the boundary between the Carboniferous and Permian periods. Due to the LREE-depleted chondrite-normalised REE pattern, the absent LREE/HREE fractionation and the high Th concentration, the uraninites from the Shkhara massif should be interpreted as a high-temperature-related, predominantly vein-like deposit. The age of the uraninites from the Greater Caucasus, which were dated in this study to the Late Carboniferous to Early Permian, indicates the rise of hot melts and fluids along reactivated faults caused by relaxation and expansion after the Variscan orogeny and after the final closure of the Paleo-Tethys. This finding indicates an eastward continuation of the Late Variscan U metallogenic belt from the Iberian Massif in the west, via central Armorica and the Massif Central, the Erzgebirge and the Bohemian Massif in Central Europe, to the Greater Caucasus at the easternmost border of Europe.

Supplementary Materials

The following supporting information can be downloaded at: https://www.mdpi.com/article/10.3390/min15090960/s1, Table S1: Electron microprobe results of all 55 dated spot analyses. Table S2: U, Pb and Th concentrations and single spot ages of uraninites from Shkhara Massif.

Author Contributions

Conceptualization, A.O., R.G. and D.B.; methodology, A.O. and F.D.H.W.; formal analysis, A.O. and F.D.H.W.; investigation, A.O., R.G., D.B. and F.D.H.W.; data curation, F.D.H.W.; writing—original draft preparation, A.O.; writing—review and editing, F.D.H.W.; visualization, F.D.H.W.; supervision, A.O.; project administration, A.O. funding acquisition, A.O. and R.G. All authors have read and agreed to the published version of the manuscript.

Funding

This research was funded by the Shota Rustaveli National Sciences foundation of Georgia, Grant No. FR-21-10905.

Data Availability Statement

Data given in this publication are available and re-usable. We are working on a data publication that will be published via the GFZ–Data Services, following the FAIR agreement.

Acknowledgments

The authors would like to thank Vakhtang Kilasonia, who made high-quality thin-sections of uraninite veins. A special thanks goes to Samuel Niedermann for his detailed comments on the content as well as the orthography and grammar of this manuscript. This work has benefited greatly from the constructive comments of three anonymous reviewers.

Conflicts of Interest

The authors declare no conflicts of interest. The funder had no role in the design of the study; in the collection, analyses, or interpretation of data; in the writing of the manuscript; or in the decision to publish the results.

Abbreviations

The following abbreviations are used in this manuscript:
Mamillion years
EPMAelectron probe micro analyses
MTGCmain thrust of the Greater Caucasus
LA-ICP-MSlaser ablation-inductively coupled plasma-mass spectrometry
Figfigure
BSE/COMPObackscatter image/composition image
Wt%
ppm
weight percent
parts per million, here in “weight-ppm”, 100 ppm = 0.01 wt%
PET/PETL(large) poly ethylene terephthalate (diffracting crystal)
nAnano Ampere
kVkilo voltage

References

  1. Romer, R.L.; Cuney, M. Phanerozoic uranium mineralization in Variscan Europe—More than 400 Ma of tectonic, supergene, and climate-controlled uranium redistribution. Ore Geol. Rev. 2018, 102, 474–504. [Google Scholar] [CrossRef]
  2. Wang, Z.; Song, H.; Chen, Y.; Song, J.; Hou, M.; Li, Q.; Du, Q.; Yu, H. Uranium resource of Europe: Development status, metallogenic provinces and geodynamic setting. Energy Strategy Rev. 2024, 54, 101467. [Google Scholar] [CrossRef]
  3. Ballouard, C.; Poujol, M.; Boulvais, P.; Mercadier, J.; Tartèse, R.; Venneman, T.; Deloule, E.; Jolivet, M.; Kéré, I.; Cathelineau, M.; et al. Magmatic and hydrothermal behavior of uranium in syntectonic leucogranites: The uranium mineralization associated with the Hercynian Guerande granite (Armorican Massif, France). Ore Geol. Rev. 2017, 80, 309–331. [Google Scholar] [CrossRef]
  4. Bonnetti, C.; Liu, X.; Mercadier, J.; Cuney, M.; Deloule, E.; Villeneuve, J.; Liu, W. The genesis of granite-related hydrothermal uranium deposits in the Xiazhuang and Zhuguang ore fields, North Guangdong Province, SE China: Insights from mineralogical, trace elements and U-Pb isotopes signatures of the U mineralization. Ore Geol. Rev. 2018, 92, 588–612. [Google Scholar] [CrossRef]
  5. René, M. Uranium hydrothermal deposits. In Uranium: Characteristics, Occurrence and Human Exposure; Vasiliev, A.Y., Sidorov, M., Eds.; Nova Science Publishers Incorporated: Hauppauge, NY, USA, 2012; pp. 211–244. [Google Scholar]
  6. López-Moro, F.J.; Romer, L.R.; Rhede, D.; Fernandez, A.; Timón-Sánchez, S.M.; Moro, M.C. Early uranium mobilization in late Variscan strke-slip shear zones affecting leucogranites of central western Spain. J. Iber. Geol. 2019, 5, 247–257. [Google Scholar] [CrossRef]
  7. Cuney, M. Felsic magmatism and uranium deposits. Bull. Soc. Geol. Fra. 2014, 185, 75–92. [Google Scholar] [CrossRef]
  8. Pagel, M.; Ruhlmann, F. Mineralogie et inclusions fluides dans les formations filoniennes mineralisees (Cu, Mo, Ag, U) du secteur de Chateau-Lambert (Vosges Meridionales). Bull. Minéral. 1979, 102, 654–664. [Google Scholar] [CrossRef]
  9. Hofmann, B.; Eikenberg, J. The Krunkelbach uranium deposit, Schwartzwald, Germany; correlation of radiometric ages (U-Pb, U-Xe-Kr, K-Ar, 230 Th- 234 U). Econ. Geol. 1991, 86, 1031–1049. [Google Scholar] [CrossRef]
  10. Pfaff, K.; Romer, R.L.; Markl, G. U-Pb ages of ferberite, chalcedony, agate, ‘U-mica’ and pitchblende: Constraints on the mineralization history of the Schwarzwald ore district. Eur. J. Miner. 2009, 21, 817–836. [Google Scholar] [CrossRef]
  11. Dolníček, Z.; René, M.; Hermannová, S.; Prochaska, W. Origin of the Okrouhlá Radouň episyenite—Hosted uranium deposit, Bohemian Massif, Czech Republic: Fluid inclusion and stable isotope constraints. Miner. Depos. 2013, 49, 409–425. [Google Scholar] [CrossRef]
  12. Bernard-Griffiths, J.; Peucat, J.J.; Sheppard, S.; Vidal, P. Petrogenesis of Hercynian leucogranites from the southern Armorican Massif: Contribution of REE and isotopic (Sr, Nd, Pb and O) geochemical data to the study of source rock characteristics and ages. Earth Planet. Sci. Lett. 1985, 74, 235–250. [Google Scholar] [CrossRef]
  13. Cathelineau, M.; Boiron, M.C.; Holliger, P.; Poty, B. Metallogenesis of the French part of the Variscan orogen. Part II: Time-space relationships between U, Au and Sn–W ore deposition and geodynamic events—Mineralogical and U–Pb data. Tectonophysics 1990, 177, 59–79. [Google Scholar] [CrossRef]
  14. Förster, H.-J.; Rhede, D.; Stein, H.J.; Romer, R.L.; Tischendorf, G. Paired uraninite and molybdenite dating of the Königshain granite: Implications for the onset of late-Variscan magmatism in the Lausitz Block. Int. J. Earth Sci. 2012, 101, 57–67. [Google Scholar] [CrossRef]
  15. Kroner, U.; Romer, R.L. The Saxo-Thuringian Zone–tip of the Armorican spur and part of the Gondwana plate. In Pre-Mesozoic Geology of Saxo-Thuringia–from the Cadomian Active Margin to the Variscan Orogen; Linnemann, U., Romer, R.L., Eds.; Schweizerbart Stuttgart: Johannesstr, Germany, 2010; pp. 371–394. [Google Scholar]
  16. Okrostsvaridze, A.; Bluashvili, D.; Gogoladze, S.; Gabrielashvili, R. The discovery of U mineralization in the late Variscan plagiogranite vein of the Shkhara Crystalline Massif (Greater Caucasus, Georgia). Geol. Balc. 2022, 51, 3–14. [Google Scholar] [CrossRef]
  17. Cowgill, E.; Forte, A.M.; Niemi, N.; Avdeev, B.; Tye, A.; Trexler, C.; Zurab, J.; Mikheil, E.; Godoladze, T. Relict basin closure and crustal shortening budgets during continental collision: An example from Caucasus sediment provenance. Tectonics 2016, 35, 2918–2947. [Google Scholar] [CrossRef]
  18. Reilinger, R.; McClusky, S.; Vernant, P.; Lawrence, S.; Ergintav, S.; Cakmak, R.; Karam, G. GPS constraints on continental deformation in the Africa-Arabia-Eurasia continental collision zone and implications for the dynamics of plate interactions. J. Geophys. Res. Solid Earth 2006, 111, B05411. [Google Scholar] [CrossRef]
  19. Adamia, S.; Zakariadze, G.; Chkhotua, T.; Sadradze, N.; Tsereteli, N.; Chabukiani, A.; Gventsadze, A. Geology of the Caucasus: A review. Turk. J. Earth Sci. 2011, 20, 489–544. [Google Scholar] [CrossRef]
  20. Zonenshain, L.P.; Pichon, X. Deep basins of the Black Sea and Caspian Sea as remnants of Mesozoic back-arc basins. Tectonophysics 1986, 123, 181–211. [Google Scholar] [CrossRef]
  21. Vincent, S.J.; Morton, A.C.; Carter, A.; Gibbs, S.; Barabadze, T.G. Oligocene uplift of the Western Greater Caucasus: An effect of initial Arabia–Eurasia collision. Terra Nova 2007, 19, 160–166. [Google Scholar] [CrossRef]
  22. Avdeev, B.; Niemi, N.A. Rapid Pliocene exhumation of the central Greater Caucasus constrained by low-temperature thermochronometr. Tectonics 2011, 30, TC2009. [Google Scholar] [CrossRef]
  23. Okrostsvaridze, A.; Lee, Y.-H.; Tormey, D.; Skhirtladze, I. U-Pb zircon chronological constraints for three stages of syn-orogenic plutonic magmatism of the Greater Caucasus Svaneti segment, Georgia. Episodes 2023, 46, 195–209. [Google Scholar] [CrossRef]
  24. Forte, A.M.; Cowgill, E.; Whipple, K.X. Transition from a singly vergent to doubly vergent wedge in a young orogen: The Greater Caucasus. Tectonics 2014, 33, 2077–2101. [Google Scholar] [CrossRef]
  25. Forte, A.M.; Cowgill, E.; Bernardin, T.; Kreylos, O.; Hamann, B. Late Cenozoic deformation of the Kura fold-thrust belt, southern Greater Caucasus. Geol. Soc. Am. Bull. 2010, 122, 465–486. [Google Scholar] [CrossRef]
  26. Natal’in, B.A.; Şengör, A.M. Late Palaeozoic to Triassic evolution of the Turan and Scythian platforms: The pre-history of the Paleo-Tethyan closure. Tectonophysics 2005, 404, 175–202. [Google Scholar] [CrossRef]
  27. Saintot, A.; Stephenson, R.A.; Stovba, S.; Brunet, M.F.; Yegorova, T.; Starostenko, V. The Evolution of the Southern Margin of Eastern Europe (Eastern European and Scythian Platforms) from the Latest Precambrian-Early Palaeozoic to the Early Cretaceous; Geological Society, Memoirs 32: London, UK, 2006; pp. 481–505. [Google Scholar] [CrossRef]
  28. Forte, A.M.; Cowgill, E.; Murtuzayev, I.; Kangarli, T.; Stoica, M. Structural geometries and magnitude of shortening in the eastern Kura fold-thrust belt, Azerbaijan: Implications for the development of the Greater Caucasus Mountains. Tectonics 2013, 32, 688–717. [Google Scholar] [CrossRef]
  29. Mellors, R.J.; Jackson, J.; Myers, S.; Gok, R.; Priestley, K.; Yetirmishli, G.; Godoladze, T. Deep earthquakes beneath the Northern Caucasus: Evidence of active or recent subduction in western Asia. Bull. Seismol. Soc. Am. 2012, 102, 862–866. [Google Scholar] [CrossRef]
  30. Banks, C.J. Regional and Petroleum Geology of the Black Sea and Surrounding Region; AAPG Memoir: Tulsa, OK, USA, 1997. [Google Scholar]
  31. Rhede, D.; Wendt, I.; Förster, H.J. A three-dimensional method for calculating independent chemical U/Pb-and Th/Pb-ages of accessory minerals. Chem. Geol. 1996, 130, 247–253. [Google Scholar] [CrossRef]
  32. Förster, H.J. The chemical composition of uraninite in Variscan granites of the Erzgebirge, Germany. Mineral. Mag. 1999, 63, 239–252. [Google Scholar] [CrossRef]
  33. Montel, J.-M.; Foret, S.; Veschambre, M.; Nicollet, C.; Provost, A. Electron microprobe dating of monazite. Chem. Geol. 1996, 131, 37–53. [Google Scholar] [CrossRef]
  34. Armstrong, J.T. CITZAF: A package of correction programs for the quantitative electron microbeam X-ray-analysis of thick polished materials, thin-films, and particles. Microbeam Anal. 1995, 4, 177–200. [Google Scholar]
  35. Kempe, U. Precise electron microprobe age determination in altered uraninite: Consequences on the intrusion age and the metallogenic significance of the Kirchberg granite (Erzgebirge, Germany). Contrib. Mineral. Petr. 2003, 145, 107–118. [Google Scholar] [CrossRef]
  36. Janeczek, J.; Ewing, R.C. Structural formula of uraninite. J. Nucl. Mater. 1992, 190, 128–132. [Google Scholar] [CrossRef]
  37. Bowles, J.F. Age dating of individual grains of uraninite in rocks from electron microprobe analyses. Chem. Geol. 1990, 83, 47–53. [Google Scholar] [CrossRef]
  38. Romer, R.L.; Thomas, R.; Stein, H.J.; Rhede, D. Dating multiply overprinted Sn-mineralized granite–examples from the Erzgebirge, Germany. Miner. Depos. 2007, 42, 337–359. [Google Scholar] [CrossRef]
  39. Alexandre, P.; Kyser, T.K. Effects of cation substitutions and alteration in uraninite, and implications for the dating of uranium deposits. Can. Min. 2005, 43, 1005–1017. [Google Scholar] [CrossRef]
  40. Dahlkamp, F.J. Uranium ore Deposits; Springer: Berlin/Heidelberg, Germany, 1993. [Google Scholar]
  41. Janeczek, J. Mineralogy and geochemistry of natural fission reactors in Gabon. Rev. Min. 1999, 38, 321–392. [Google Scholar]
  42. Anthony, J.W.; Bideaux, R.A.; Bladh, K.W.; Nichols, M.C. Uraninite. In Handbook of Mineralogy; Mineralogical Society of America: Chantilly, WV, USA, 1990; pp. 67–85. [Google Scholar]
  43. Mercadier, J.; Cuney, M.; Lach, P.; Boiron, M.-C.; Bonhoure, J.; Richard, A.; Leisen, M.; Kister, P. Origin of uranium deposits revealed by their rare earth element signature. Terra Nova 2011, 23, 264–269. [Google Scholar] [CrossRef]
  44. Frimmel, H.E.; Schedel, S.; Brätz, H. Uraninite chemistry as forensic tool for provenance analysis. Appl. Geochem. 2014, 48, 104–121. [Google Scholar] [CrossRef]
  45. Alexandre, P.; Kyser, K.; Layton-Matthews, D.; Joy, B. Chemical composition of natural uraninite. Can. Min. 2015, 53, 595–622. [Google Scholar] [CrossRef]
  46. Anders, E.; Grevesse, N. Abundances of the elements: Meteoric and solar. Geochim. Cosmochim. Acta 1989, 53, 197–214. [Google Scholar] [CrossRef]
  47. Rolland, Y. Caucasus collisional history: Review of data from East Anatolia to West Iran. Gondwana. Res. 2017, 49, 130–146. [Google Scholar] [CrossRef]
  48. Perchuk, A.; Philippot, P. Rapid cooling and exhumation of eclogitic rocks from the Great Caucasus, Russia. J. Metamorp. Geol. 1997, 15, 299–310. [Google Scholar] [CrossRef]
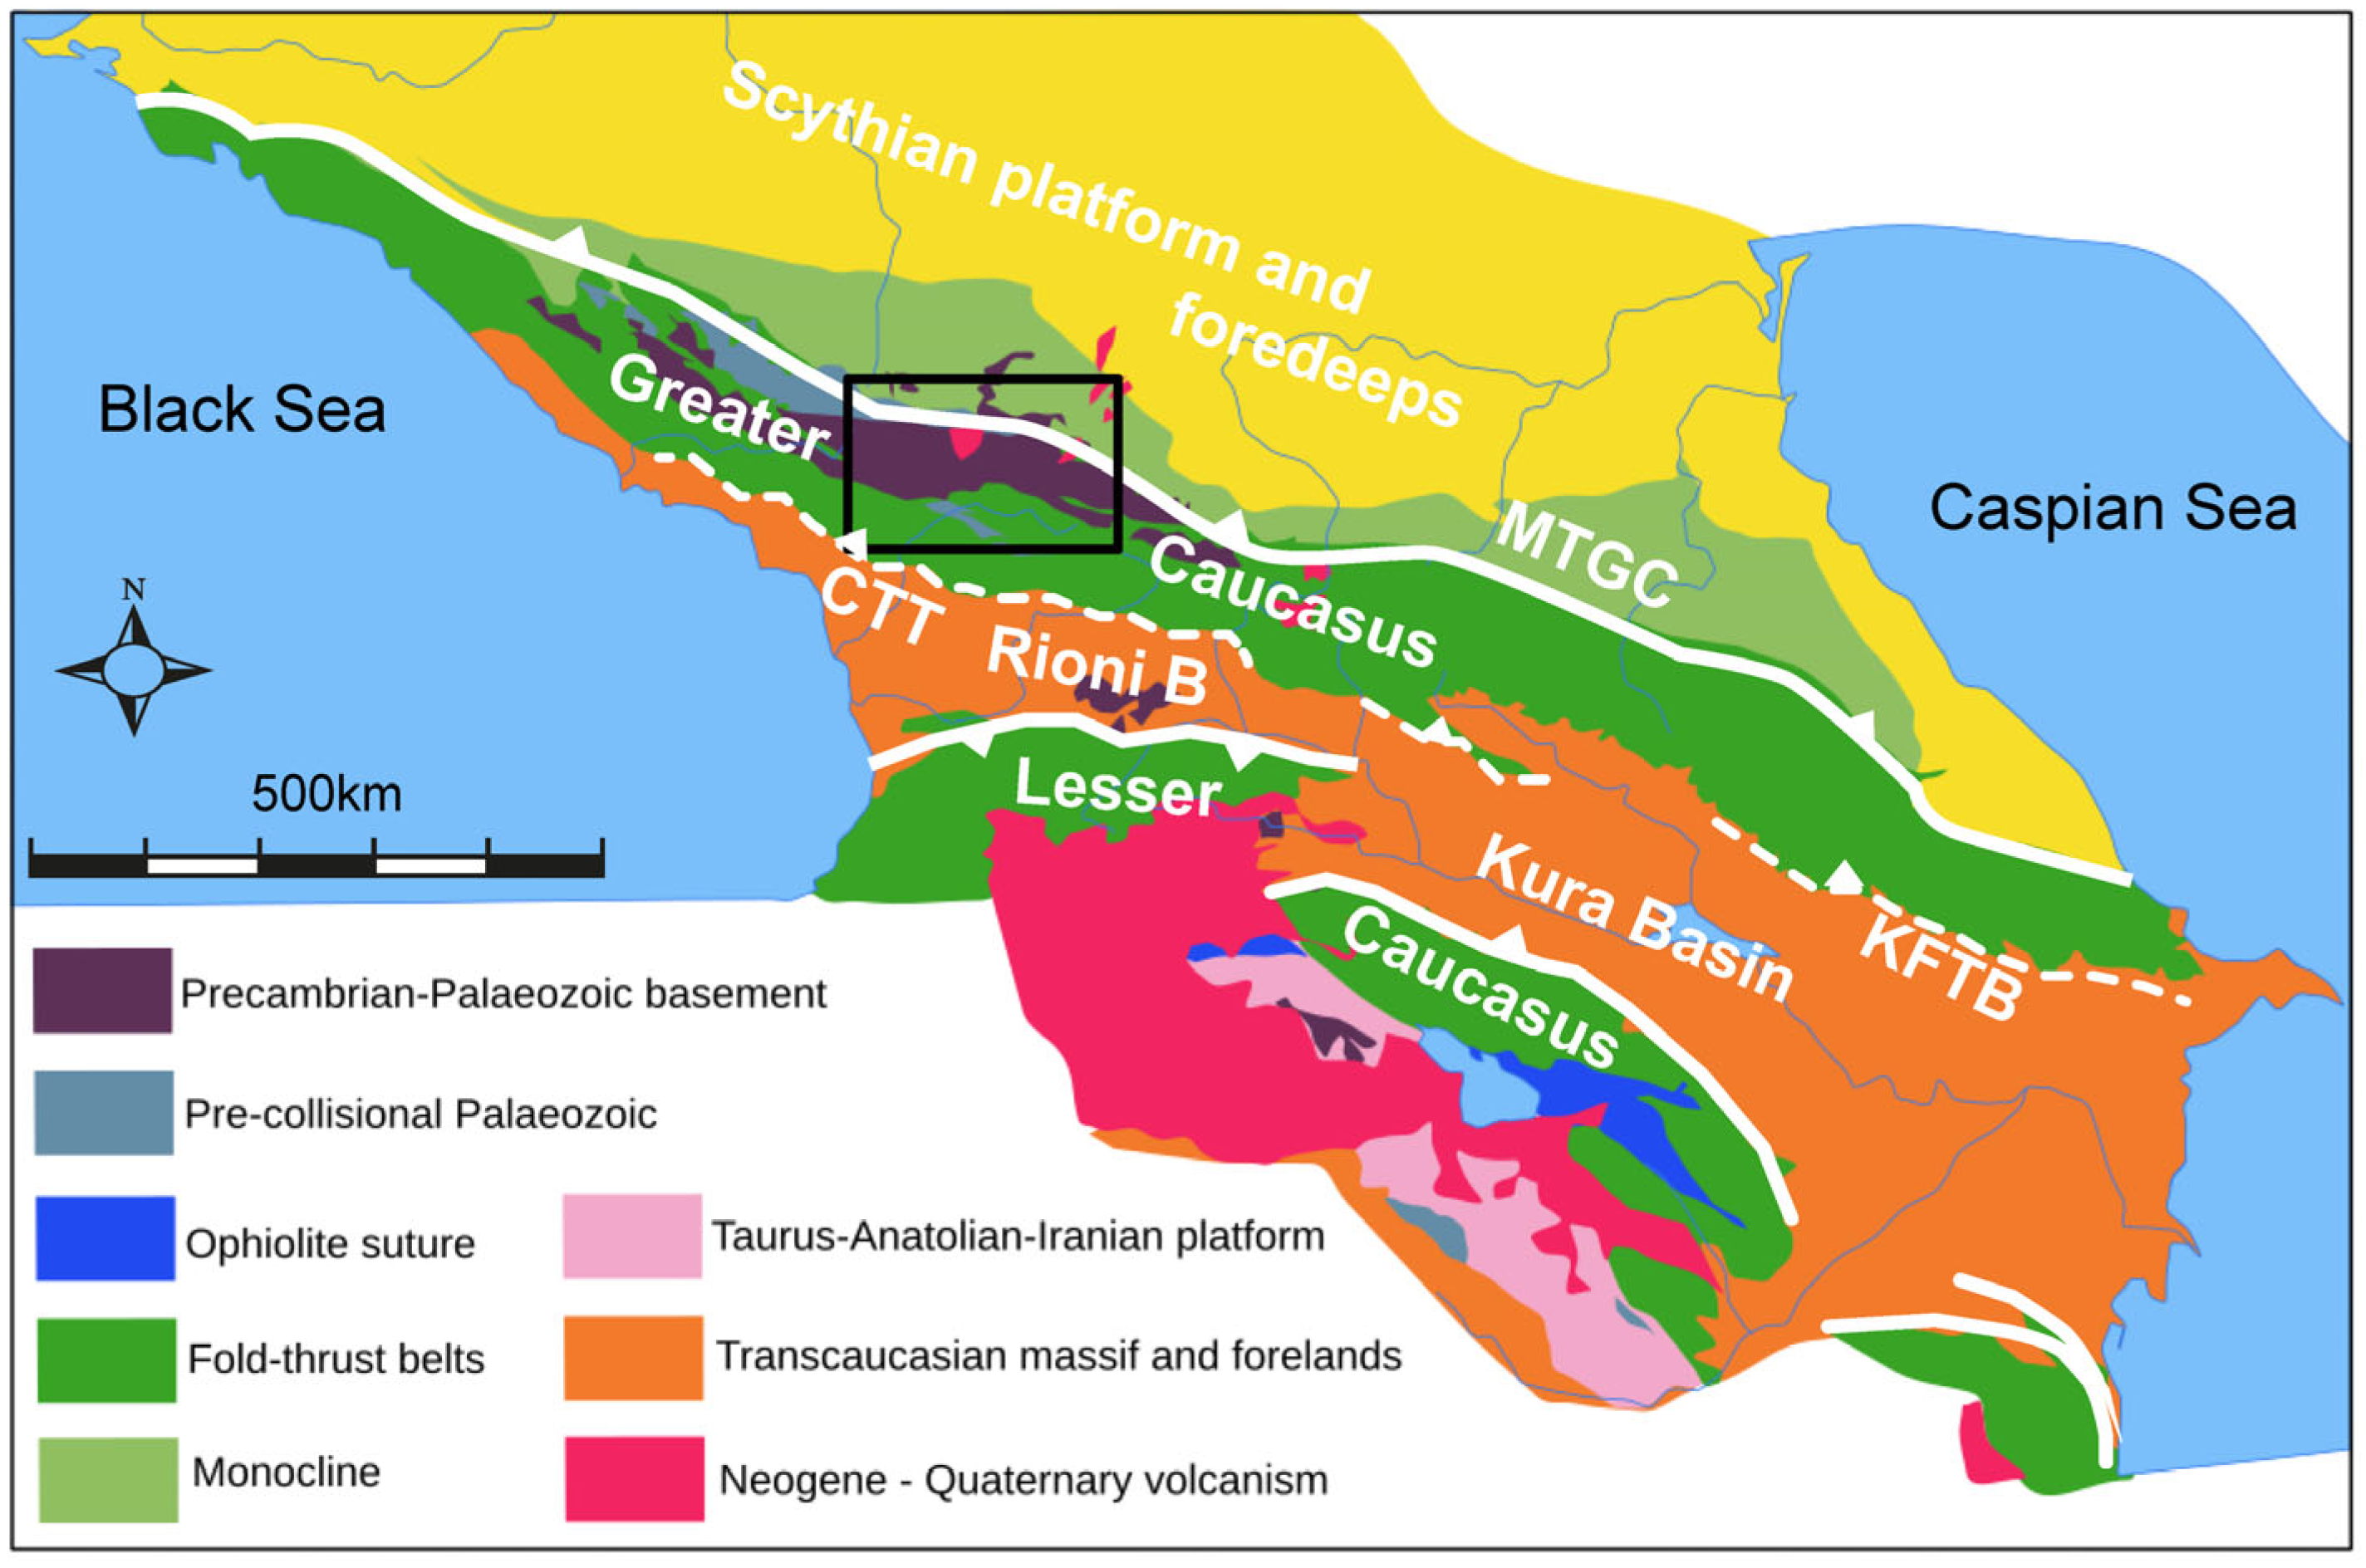
Figure 1. Regional geological map of Georgia, Russia, northern Turkey and NW Iran showing Greater and Lesser Caucasus separated by basins filled with Quaternary alluvium [19]. See chapter 2 for geological details.
Minerals 15 00960 g001
Figure 2. Geological map of the Greater Caucasus with details on the Svaneti segment modified after [16,23]. Examples of focal mechanisms from 1977 to 2012 are given [24].
Minerals 15 00960 g002
Figure 3. Images showing the outcrop situation and rock details of the Shkhara Massif. (A) One of the plagioclase-rich granite veins, crossed by a diabase dike. (B) Banded and complex folded biotite- plagiomigmatite with sparse to locally abundant leucosomes indicative for partial melting. (C) Mineralogy of one uraninite vein in plagiogranite. Plane polarized light.
Minerals 15 00960 g003
Figure 6. Individually plotted age data with normal fit distribution curve showing that uraninites from the individual veins do not have different ages. The width of columns reflects the range of ages (ca. 10 Ma) combined in a column.
Minerals 15 00960 g006
Figure 7. (A) The average chondrite-normalised rare earth element (REE) patterns for uraninites from the three different dated veins show LREE-depleted forms with MREE and HREE values in the same order of magnitude. (B) The REE abundances (∑REE) are plotted against REE fractionation (∑LREE/∑HREE)N. (∑LREE) N = La N + Ce N + Pr N + Nd N + Sm N and (∑HREE) N = Er N + Lu N. In [43], Tm was also included for ∑HREE, but Tm and Eu were not measured in this study.
Minerals 15 00960 g007
Figure 8. Histogram with 55 Th–U–total Pb chemical age determinations and their distribution from the Shkhara U-mineralisation, with the normal fit distribution curve peaking at ca. 291 Ma. The boundary between the Carboniferous and Permian periods is shown together with the post- to late- Variscan uranium mineralisation in Central and Western Europe and the intrusion age of the granitoids of the Greater Caucasus [23].
Minerals 15 00960 g008
Table 1. Microprobe results in weight percent [wt%] and calculated ages in million years [Ma]. Given are the min, max and average values of uraninites from the 3 veins dated (Ge1, Ge5, Ge9). Detection limit is given in ppm of the element. The average Cannon Uraninite standard is given that was analysed throughout the measurement campaign for data quality check. Please note that the min, average and max ages do not correspond to the given chemical analyses above.
Element Oxide.Ge1 (N = 22)DL [ppm]Ge5 (N = 21)DL [ppm]Ge9 (N = 12)DL [ppm]Cannon Std
MinAverageMaxAverageMinAverageMaxAverageMinAverageMaxAverage
SiO20.000.010.03940.000.110.61900.000.010.07910.04
FeO0.000.080.321110.000.230.871110.000.010.041110.02
Ce2O30.100.240.352380.090.230.552400.180.270.452390.00
La2O30.000.020.082660.000.020.082670.000.040.092650.04
Sm2O30.030.190.303510.010.200.433530.070.190.363520.03
Gd2O30.110.260.463570.000.320.823570.000.220.443570.06
Ho2O30.000.060.173640.000.100.213640.030.080.163620.00
Er2O30.140.270.603750.060.320.663750.080.240.413740.02
Yb2O30.110.220.482000.080.220.432000.150.230.352000.02
UO278.8281.0583.1133571.6979.6982.2533279.5380.8082.36333100.05
PbO2.953.573.981863.123.493.721843.323.573.831850.00
Pr2O30.000.060.143710.000.040.113710.010.100.173700.00
Nd2O30.200.360.543240.200.330.613220.280.420.753230.01
Tb2O30.000.050.143410.000.060.213410.000.040.113400.00
Dy2O30.170.340.573470.070.511.103460.160.320.533480.00
Lu2O30.010.040.091970.000.050.121960.010.050.081970.00
P2O50.000.000.041400.000.010.051380.000.020.051410.00
CaO0.000.200.49840.000.250.99840.100.370.69850.00
Y2O30.851.713.772060.402.034.632040.841.672.682070.00
ThO26.447.498.413505.706.899.473496.377.257.873540.01
Total94.9196.2397.19 92.9195.1197.18 94.7795.8997.88 100.30
Ages [Ma]243288317 272287299 273290305
Disclaimer/Publisher’s Note: The statements, opinions and data contained in all publications are solely those of the individual author(s) and contributor(s) and not of MDPI and/or the editor(s). MDPI and/or the editor(s) disclaim responsibility for any injury to people or property resulting from any ideas, methods, instructions or products referred to in the content.