Article

YOLO-EDH: An Enhanced Ore Detection Algorithm

1
School of Software Engineering, Jiangxi University of Science and Technology, Nanchang 330013, China
2
Yichun Lithium New Energy Industry Research Institute, Jiangxi University of Science and Technology, Yichun 336000, China
*
Author to whom correspondence should be addressed.
Minerals 2025, 15(9), 952; https://doi.org/10.3390/min15090952
Submission received: 22 July 2025 / Revised: 30 August 2025 / Accepted: 1 September 2025 / Published: 5 September 2025

Abstract

Mineral identification technology is a key technology in the construction of intelligent mines. In ore classification and detection, mining scenarios present challenges, such as diverse ore types, significant scale variations, and complex surface textures. Traditional detection models often suffer from insufficient multi-scale feature representation and weak dynamic adaptability, leading to the missed detection of small targets and misclassification of similar minerals. To address these issues, this paper proposes an efficient multi-scale ore classification and detection model, YOLO-EDH. To begin, standard convolution is replaced with deformable convolution, which efficiently captures irregular defect patterns, significantly boosting the model’s robustness and generalization ability. The C3k2 module is then combined with a modified dynamic convolution module, which avoids unnecessary computational overhead while enhancing the flexibility and feature representation. Additionally, a content-guided attention fusion (HGAF) module is introduced before the detection phase, ensuring that the model assigns the correct importance to various feature maps, thereby highlighting the most relevant object details. Experimental results indicate that YOLO-EDH surpasses YOLOv11, improving the precision, recall, and mAP50 by 0.9%, 1.7%, and 1.6%, respectively. In conclusion, YOLO-EDH offers an efficient solution for ore detection in practical applications, with considerable potential for industries like intelligent mine resource sorting and safety production monitoring, showing notable commercial value.

1. Introduction

In the fields of geology and engineering, mineral particles serve as fundamental analytical subjects. By examining their characteristics, such as the particle size, morphology, and color, quantitative information can be obtained to reveal minerals’ properties [1]. With technological advancements, image processing techniques have gradually emerged as a mainstream measurement method across multiple disciplines due to their advantages in terms of rapid image acquisition, precise color and size identification, and efficient batch analysis, demonstrating significant superiority over traditional analytical methods [2]. Furthermore, integrating machine learning and data mining technologies with image processing can substantially enhance the performance of intelligent systems [3].
In mining engineering practice, ore classification plays a crucial guiding role in equipment selection, data modeling analysis, and subsequent mining planning [4]. The data output from mineral type detection systems can assist in analyzing the local characteristics of ore deposits, providing a basis for mine design. Furthermore, identifying rock types helps to optimize process parameters for grinding, flotation, and other beneficiation processes [5]. The development of intelligent ore type detection systems can not only optimize these key processes but also reduce mineral resource waste, thereby improving the overall efficiency of mining operations [6,7].
Existing ore detection models, including traditional convolutional neural networks (CNNs) and early versions of YOLO, face several key challenges. Firstly, ore morphologies are highly irregular, with their contours, textures, and internal structures often being non-rigid. The fixed geometric structure of traditional standard convolution operations struggles to effectively capture these highly deformed features, resulting in insufficient localization accuracy for the boundaries of irregular ore blocks. Secondly, in mining environments, there are significant variations in target scales, and existing multi-scale feature fusion mechanisms still have limited adaptability to extreme scale changes, which easily leads to the missed detection of small-scale targets. Furthermore, different types of ores [8] (such as calcite and fluorite) may be very similar in color and texture, while the same type of ore may show huge differences due to factors like weathering, illumination, and attached dust. This characteristic of “large intraclass variations and small interclass differences” is highly likely to cause model misclassification. Finally, actual mining environments involve complex interferences, such as drastic changes in illumination, dust occlusion, and blurring due to equipment vibration, requiring models to possess strong anti-interference capabilities and robustness. However, many models that perform well on clear datasets suffer from significant performance degradation under such harsh conditions. Therefore, in this study, we propose an effective technique for the identification of ore types, which is based on YOLOv11 [9], seeking to recognize the numerous features on ore surfaces. Our work makes three principal contributions:
  • Our model replaces conventional convolution with advanced deformable convolution operators, enabling the superior handling of complex morphological features while significantly improving the model’s generalization capacity and robustness;
  • By integrating optimized dynamic convolution with the C3k2 module, our approach automatically adjusts the convolutional operations according to the input characteristics, thereby dramatically enhancing both the accuracy and adaptability in complex mining scenarios;
  • The proposed framework incorporates a hierarchical guided attention fusion (HGAF) module [10], which boosts the detection performance through intelligent multi-scale feature fusion and adaptive weighting mechanisms.
The structure of this paper is organized as follows. Section 2 reviews current advances in ore detection and classification techniques. Section 3 introduces the proposed ore type detection framework and elaborates on its architectural improvements. Section 4 details the experimental setup, including the data sources, parameter settings, hardware environment, and evaluation protocols. Section 5 examines and discusses the outcomes of comparative trials, along with corresponding inferences. The paper concludes with Section 6, which highlights key findings and suggests promising avenues for further research.

2. Related Works

For ore detection scenarios, deep learning has established itself as a crucial enabler for intelligent mining operations, capitalizing on its superior computer vision capabilities to efficiently and accurately identify ore types, particle sizes, and potential associated minerals. Among deep learning frameworks, the YOLO series [11] stands out as the go-to solution for real-time ore detection tasks, attributed to its streamlined architecture and robust adaptability to resource-constrained environments. Algorithms based on YOLO have exhibited broad applicability across diverse fields—including autonomous driving [12], security surveillance [13], and medical imaging [14]—thereby underscoring their versatile performance and computational efficiency.
In recent years, improved algorithms based on YOLO have continued to achieve breakthroughs in specialized industrial inspection scenarios, providing an important technical reference for ore detection. However, their adaptability to complex mining environments still requires further refinement. In the field of surface defect detection, Li et al. [15] addressed the issue of low contrast between damaged areas and normal surfaces in vehicle matte finish scenarios by proposing the YOLOv11-BSS algorithm. This approach dynamically adjusts the sampling positions through dual deformable convolutions to capture irregular defect contours, designs a spatial channel collaborative attention module to enhance the weighting of key features, and streamlines the neck network to improve the fusion efficiency. This method significantly reduces the missed detection rate, but its core optimizations target subtle defects on homogeneous material surfaces, making it difficult to adapt to the variable texture features and complex mineral morphologies of ore surfaces. In the field of concrete defect detection, Tian et al. [16] proposed the YOLOv11-EMC algorithm, which enhances the adaptability to unstructured defects (such as cracks and spalling) by improving deformable convolutions, combines the C3K2 module to achieve multi-scale feature fusion, and employs dynamic convolution to reduce redundant computations. This method improves the detection robustness for defects on rough surfaces, but the grayscale differences between defects and backgrounds in concrete scenarios are relatively stable. This fundamentally diverges from the core challenge in ore detection, where textures of the same type of ore are heterogeneous, and the features of different types of ore intersect.
In mineral mining and processing operations, real-time and precise ore characterization is essential in ensuring smooth production workflows and enhancing the resource utilization efficiency. Conventional image processing techniques such as edge detection and feature extraction [17] have been increasingly supplanted by convolutional neural networks (CNNs) when analyzing complex and variable ore imagery. CNNs facilitate automated multi-level feature extraction and classification through their end-to-end learning capabilities, substantially improving both the accuracy and efficiency of ore detection. As a representative example, Zhou et al. [18] developed an integrated approach combining CNNs with transfer learning, data augmentation, and an SNet attention mechanism for mineral classification, achieving classification accuracy exceeding 90%. Nevertheless, the model’s practical implementation may encounter challenges in terms of real-time processing and deployment efficiency owing to its considerable parameter complexity.
It is worth noting that the Stellar-YOLO algorithm proposed by Qiu et al. [19], targeting the edge computing requirements for graphite ore grade detection, adopts a lightweight backbone network to reduce resource consumption and enhances detailed feature capture through specialized modules, demonstrating advantages in balancing accuracy and efficiency. However, this method focuses solely on the grade classification of a single ore type (graphite), without addressing the detection of multiple ore types or optimization for interference factors such as dust and lighting in mining environments. This also reflects the current algorithms’ remaining room for improvement in adapting to complex mining scenarios.
In practical ore detection scenarios, the diverse morphological characteristics of minerals and their complex surrounding environments constitute critical factors affecting the detection efficiency. Future research and algorithmic improvements should prioritize in-depth exploration and optimization targeting these two key aspects.

3. Methods

3.1. The Original YOLOv11 Network

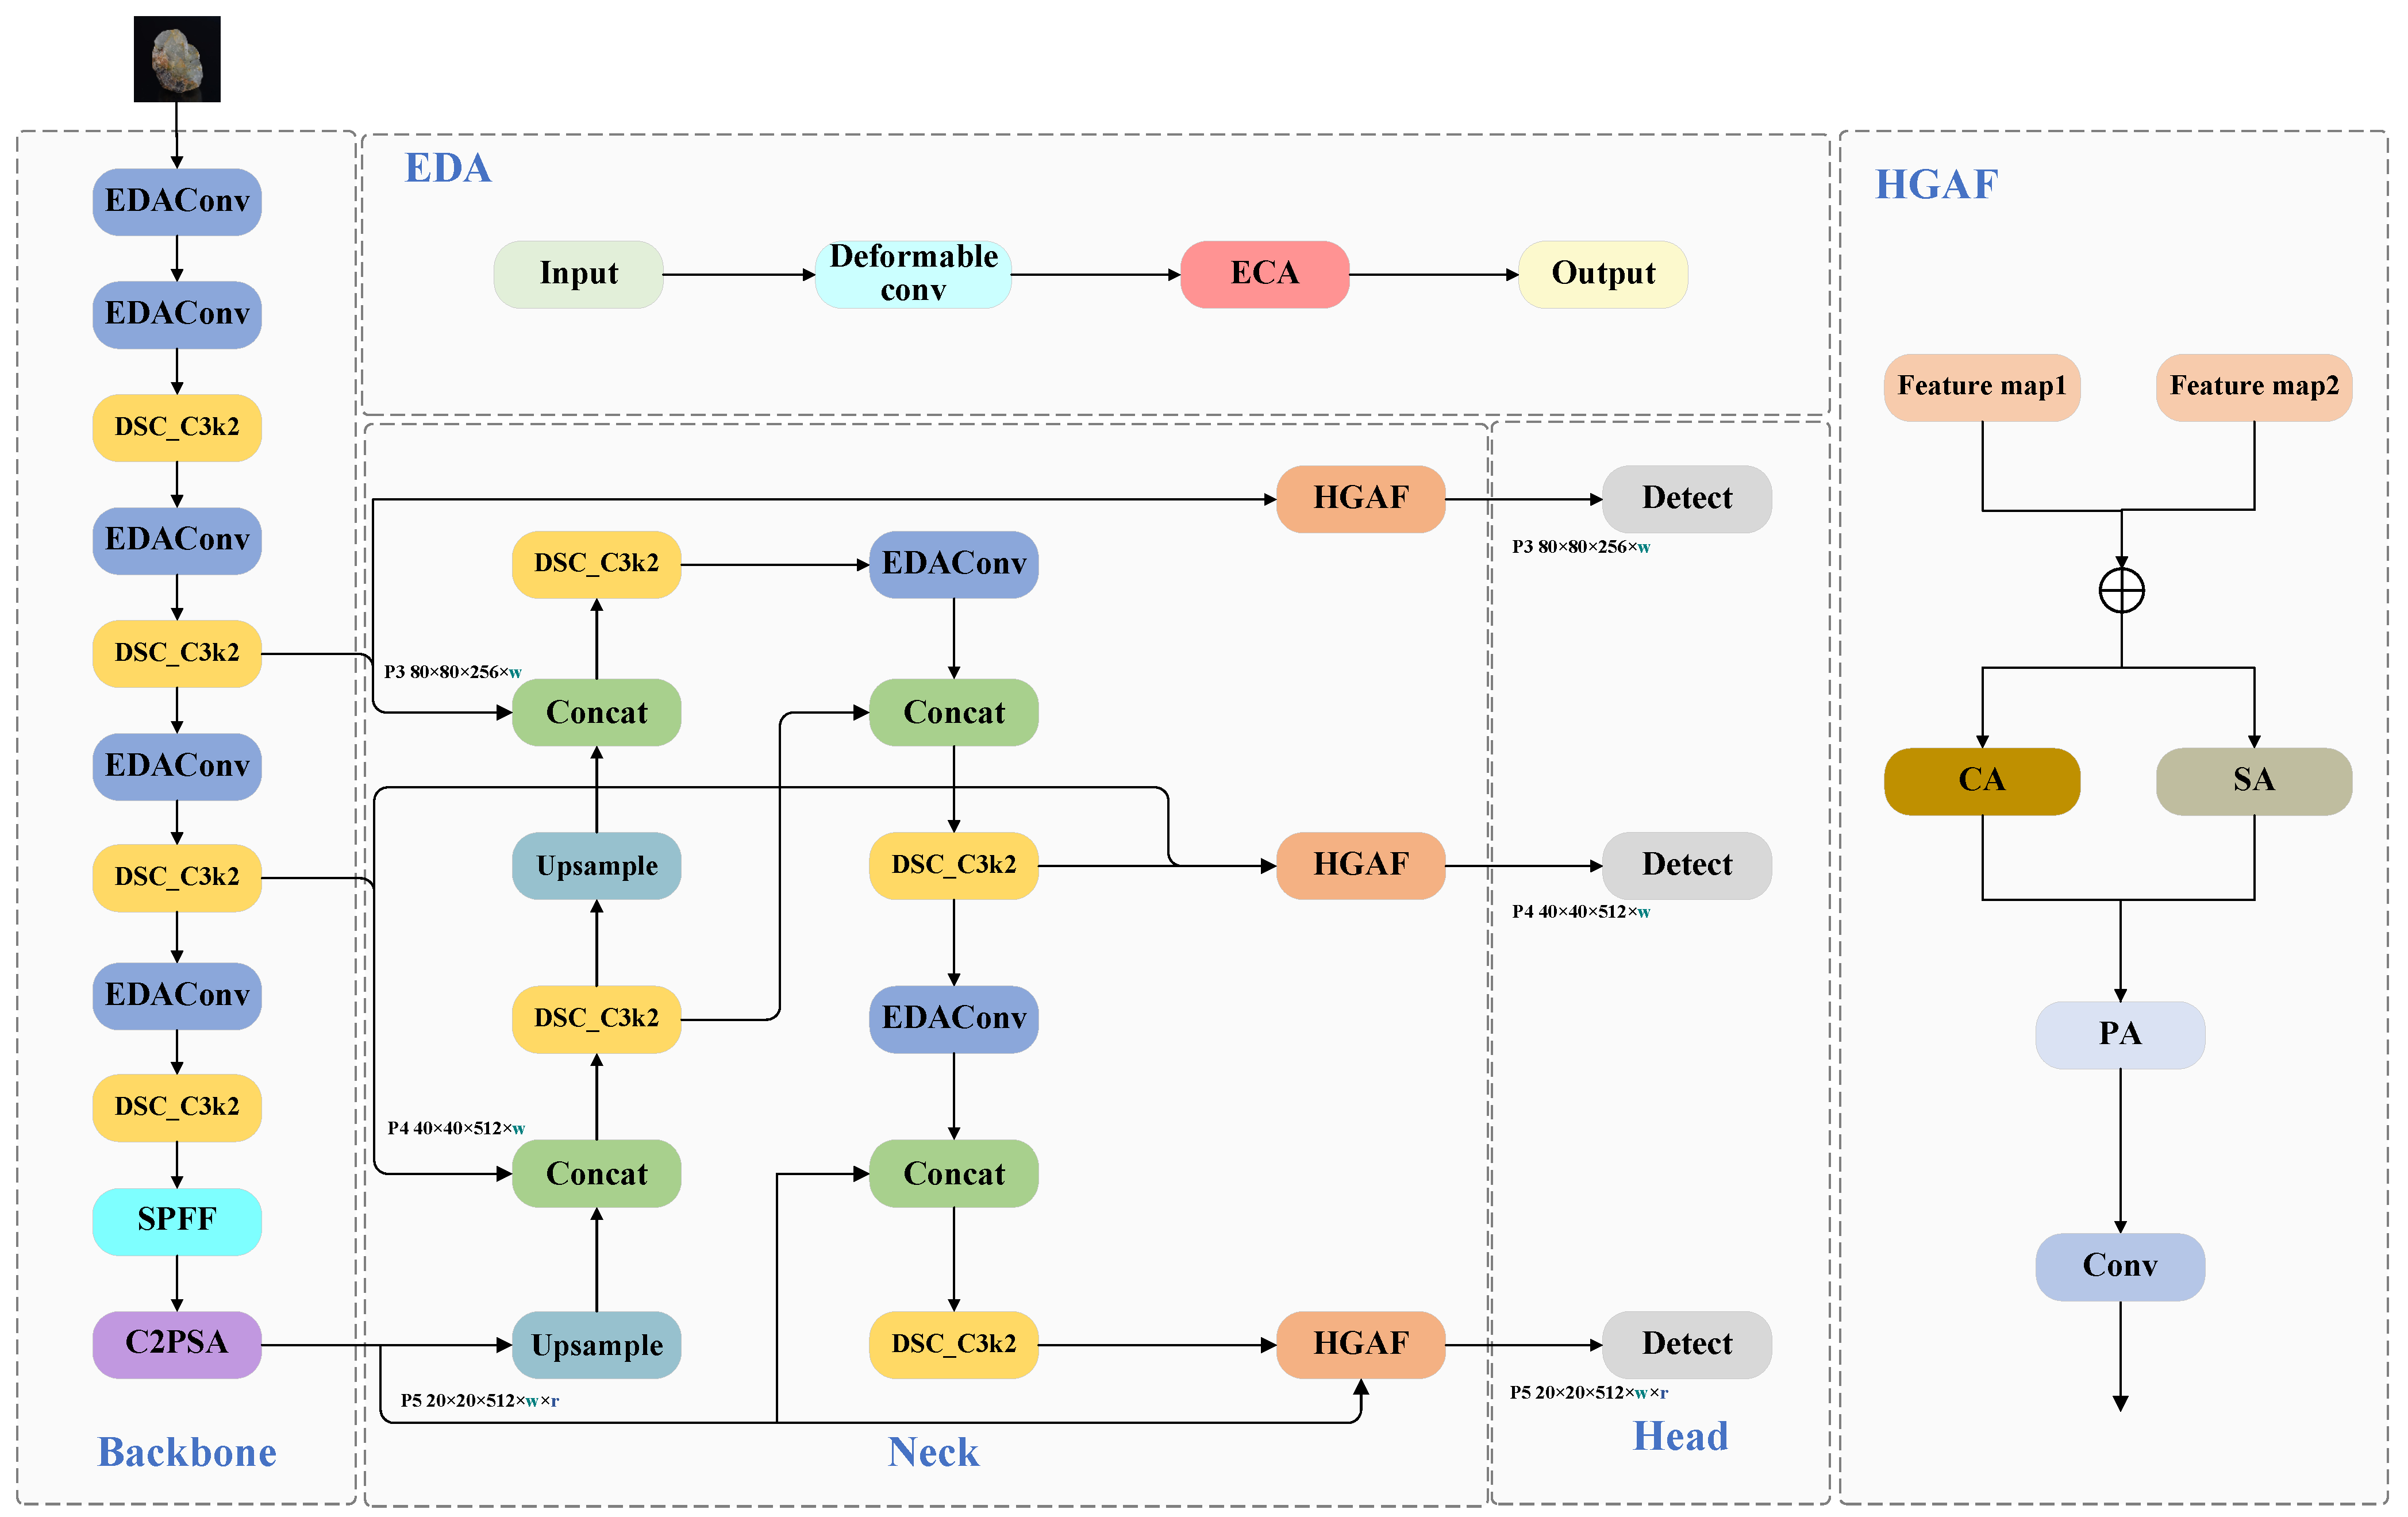
After a comprehensive evaluation from multiple perspectives, we select YOLOv11 as the foundational network for this research. The YOLO series has long been renowned for its exceptional detection speed and end-to-end training process. As the most recent iteration in the YOLO family, YOLOv11 inherits these advantages while further enhancing the detection accuracy and robustness through an optimized network architecture and training algorithms. Particularly in complex background environments, YOLOv11 demonstrates the effective handling of both object localization and classification tasks. For ore detection in challenging mining environments, YOLOv11 exhibits remarkable adaptability, successfully identifying minerals under varying illumination conditions while maintaining strong anti-interference capabilities. Compared with alternative detection models, YOLOv11 offers superior computational efficiency, enabling efficient deployment on resource-constrained devices to meet real-time detection requirements. Mineral detection tasks typically demand rapid object recognition capabilities, and YOLOv11’s operational efficiency makes it particularly suitable for such real-time scenarios. The architecture of the proposed model is illustrated in Figure 1.

3.2. The Improved YOLO-EDH Network

During the mineral collection process, the diversity and dense distribution of ores pose significant challenges for detection tasks; these include irregular morphologies, high visual similarity between different minerals, and substantial scale variations. To address these specific issues, this study improves upon the YOLOv11 model and proposes the YOLOv11-EDH model.
The model first introduces an enhanced deformable convolution with ECA attention (EDA) module. This module is specifically designed to tackle the problems of irregular ore shapes and complex textures by incorporating learnable spatial sampling offsets, enabling the convolutional kernel to adaptively align with ore contours, instead of being constrained to a rigid grid structure. The embedded ECA mechanism further enhances this process by emphasizing the most informative feature channels, which is crucial in distinguishing ores from surface impurities such as dust or oxidation layers. Subsequently, the model integrates the C3K2 module with an enhanced dynamic convolution module, specifically combining dynamic convolution with SE attention to form a novel DSC_C3K2 module. This design aims to resolve the misclassification issues among visually similar mineral types. The dynamic convolution component allows the network to adaptively aggregate multiple convolutional kernels based on the input characteristics, while the SE attention mechanism recalibrates the channel-wise feature responses, collectively improving the model’s discriminative capabilities for minerals with analogous appearances.
Furthermore, YOLOv11-EDH incorporates the HGAF module. Traditional feature fusion methods often overlook the varying importance of different feature sources, making them susceptible to noise interference and ineffective in detecting multi-scale ore targets. The HGAF module addresses this core limitation by employing a multi-attention mechanism to adaptively assign weights to channels, spatial locations, and individual pixels. This intelligent fusion strategy is particularly vital in highlighting features of small-sized ores and accurately localizing large ones within complex mining scenarios, thereby significantly reducing missed detections and improving the localization precision. The network architecture of YOLOv11-EDH is illustrated in Figure 2.

3.3. EDA Module

3.3.1. Deformable Convolution

In conventional convolution operations, the kernel extracts features from the input feature map through a rigid sampling grid. Each location of the kernel is linked to a predetermined set of sample points, whose coordinates are fixed relative to the kernel center. This uniform sampling strategy, however, is ineffective at capturing representative features of irregular or non-rigid objects. The standard convolution process at any point p 0 of the input feature map can be formulated as follows:
y p 0 = p n R w p n · x p 0 + p n
In standard convolution, p 0 refers to the current center of the convolutional kernel, while p n indicates the offset of each kernel point relative to this center. The term w ( p n ) corresponds to the weight value at the respective kernel location, and x ( p 0 + p n ) denotes the input feature at the coordinate ( p 0 + p n ) . The output feature value at position p 0 is represented as y ( p n ) .
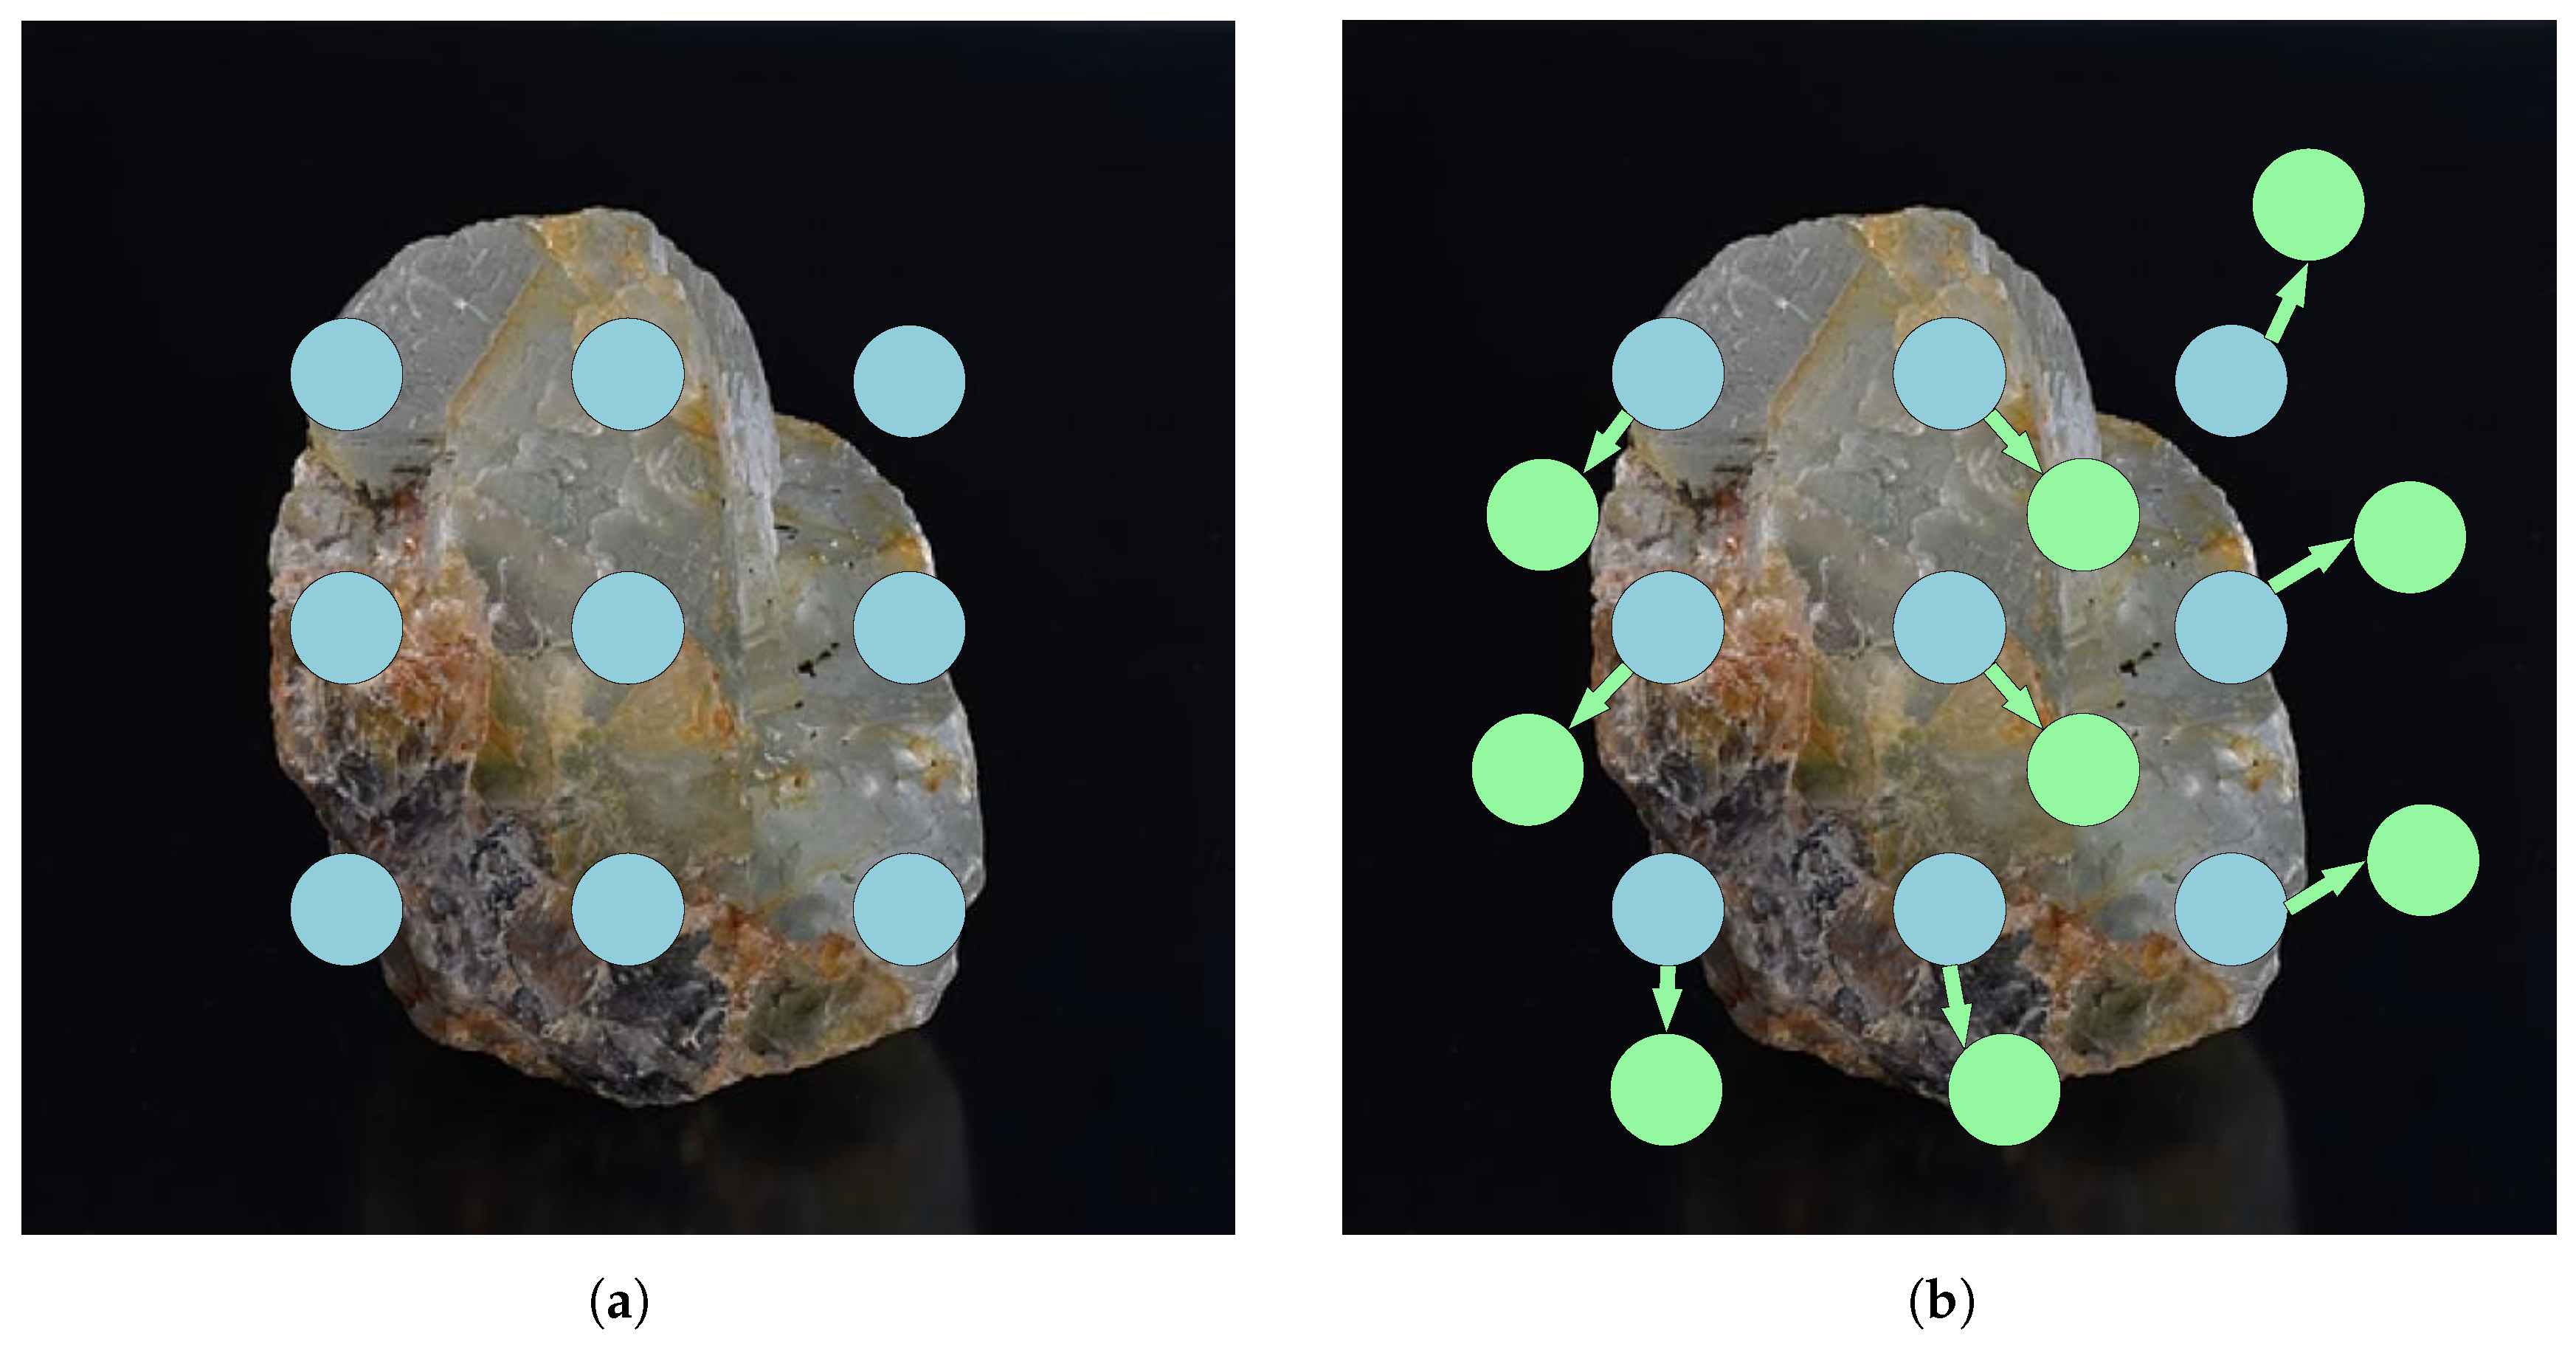
The core idea of Deformable Convolution [20] lies in assigning learnable offset parameters to each convolutional sampling point. Specifically, these offsets are learned through an auxiliary convolutional network and can be continuously optimized during model training. As a result, the sampling process of the convolution kernel breaks away from the constraints of a predefined grid and is instead adaptively adjusted based on the inferred offsets during operation. This capability grants the network greater flexibility in handling variably shaped objects and intricate morphological patterns. As visualized in Figure 3, the deformable convolution mechanism acquires sampling offsets in a self-directed manner through network learning, leading to spatial shifts of the sampling points over the input feature map. This adaptive repositioning enhances the kernel’s ability to concentrate on salient regions or areas of interest.
The deformable convolution operation can be represented by the following equation:
y p 0 = p n R w p n · x p 0 + p n + Δ p n
In deformable convolution, Δ p n denotes the offset parameter acquired through a dedicated learning module. In contrast to conventional convolutional methods, this offset-enhanced operation significantly suppresses interference from background noise and enhances the extraction of salient feature information. The detailed computational procedure is outlined below:
  • Offset generation: By applying a standard convolutional layer to the input feature map, the learnable offset Δ p is generated, determining the dynamic offset direction and magnitude of the convolution sampling points.
  • Adaptive sampling: For each convolution position, the corresponding offset Δ p is used to adjust the sampling point coordinates. Since the offset sampling positions are mostly non-integer, bilinear interpolation is applied to compute the feature values at these positions, ensuring sampling accuracy.
  • Convolution Operation: After obtaining the offset Δ p , a standard convolution operation is performed on the input feature map, integrating the dynamically sampled positions guided by the offset with conventional convolution computation. Since Δ p is typically learned as floating-point data, the value at x ( p 0 + p n + Δ p n ) needs to be determined via bilinear interpolation, as follows:
    x ( p ) = c G ( c , p ) · x ( c )
    G ( c , p ) = g ( c x , p x ) · g ( c y , p y )
where, g ( a , b ) = max ( 0 , 1 | a b | ) , G ( c , p ) is non-zero only for a small number of c values.
In the equation, c is the nearest integer pixel position in the p domain, and G represents the bilinear interpolation kernel, which consists of two one-dimensional kernels. The pixel value at the interpolated point is calculated using the weighted sum of neighboring pixels, with weights based on the distance to the interpolated point in both horizontal and vertical directions. The constraint max ( 0 , 1 ) ensures that the distance from the interpolated point to any adjacent pixel does not exceed 1.
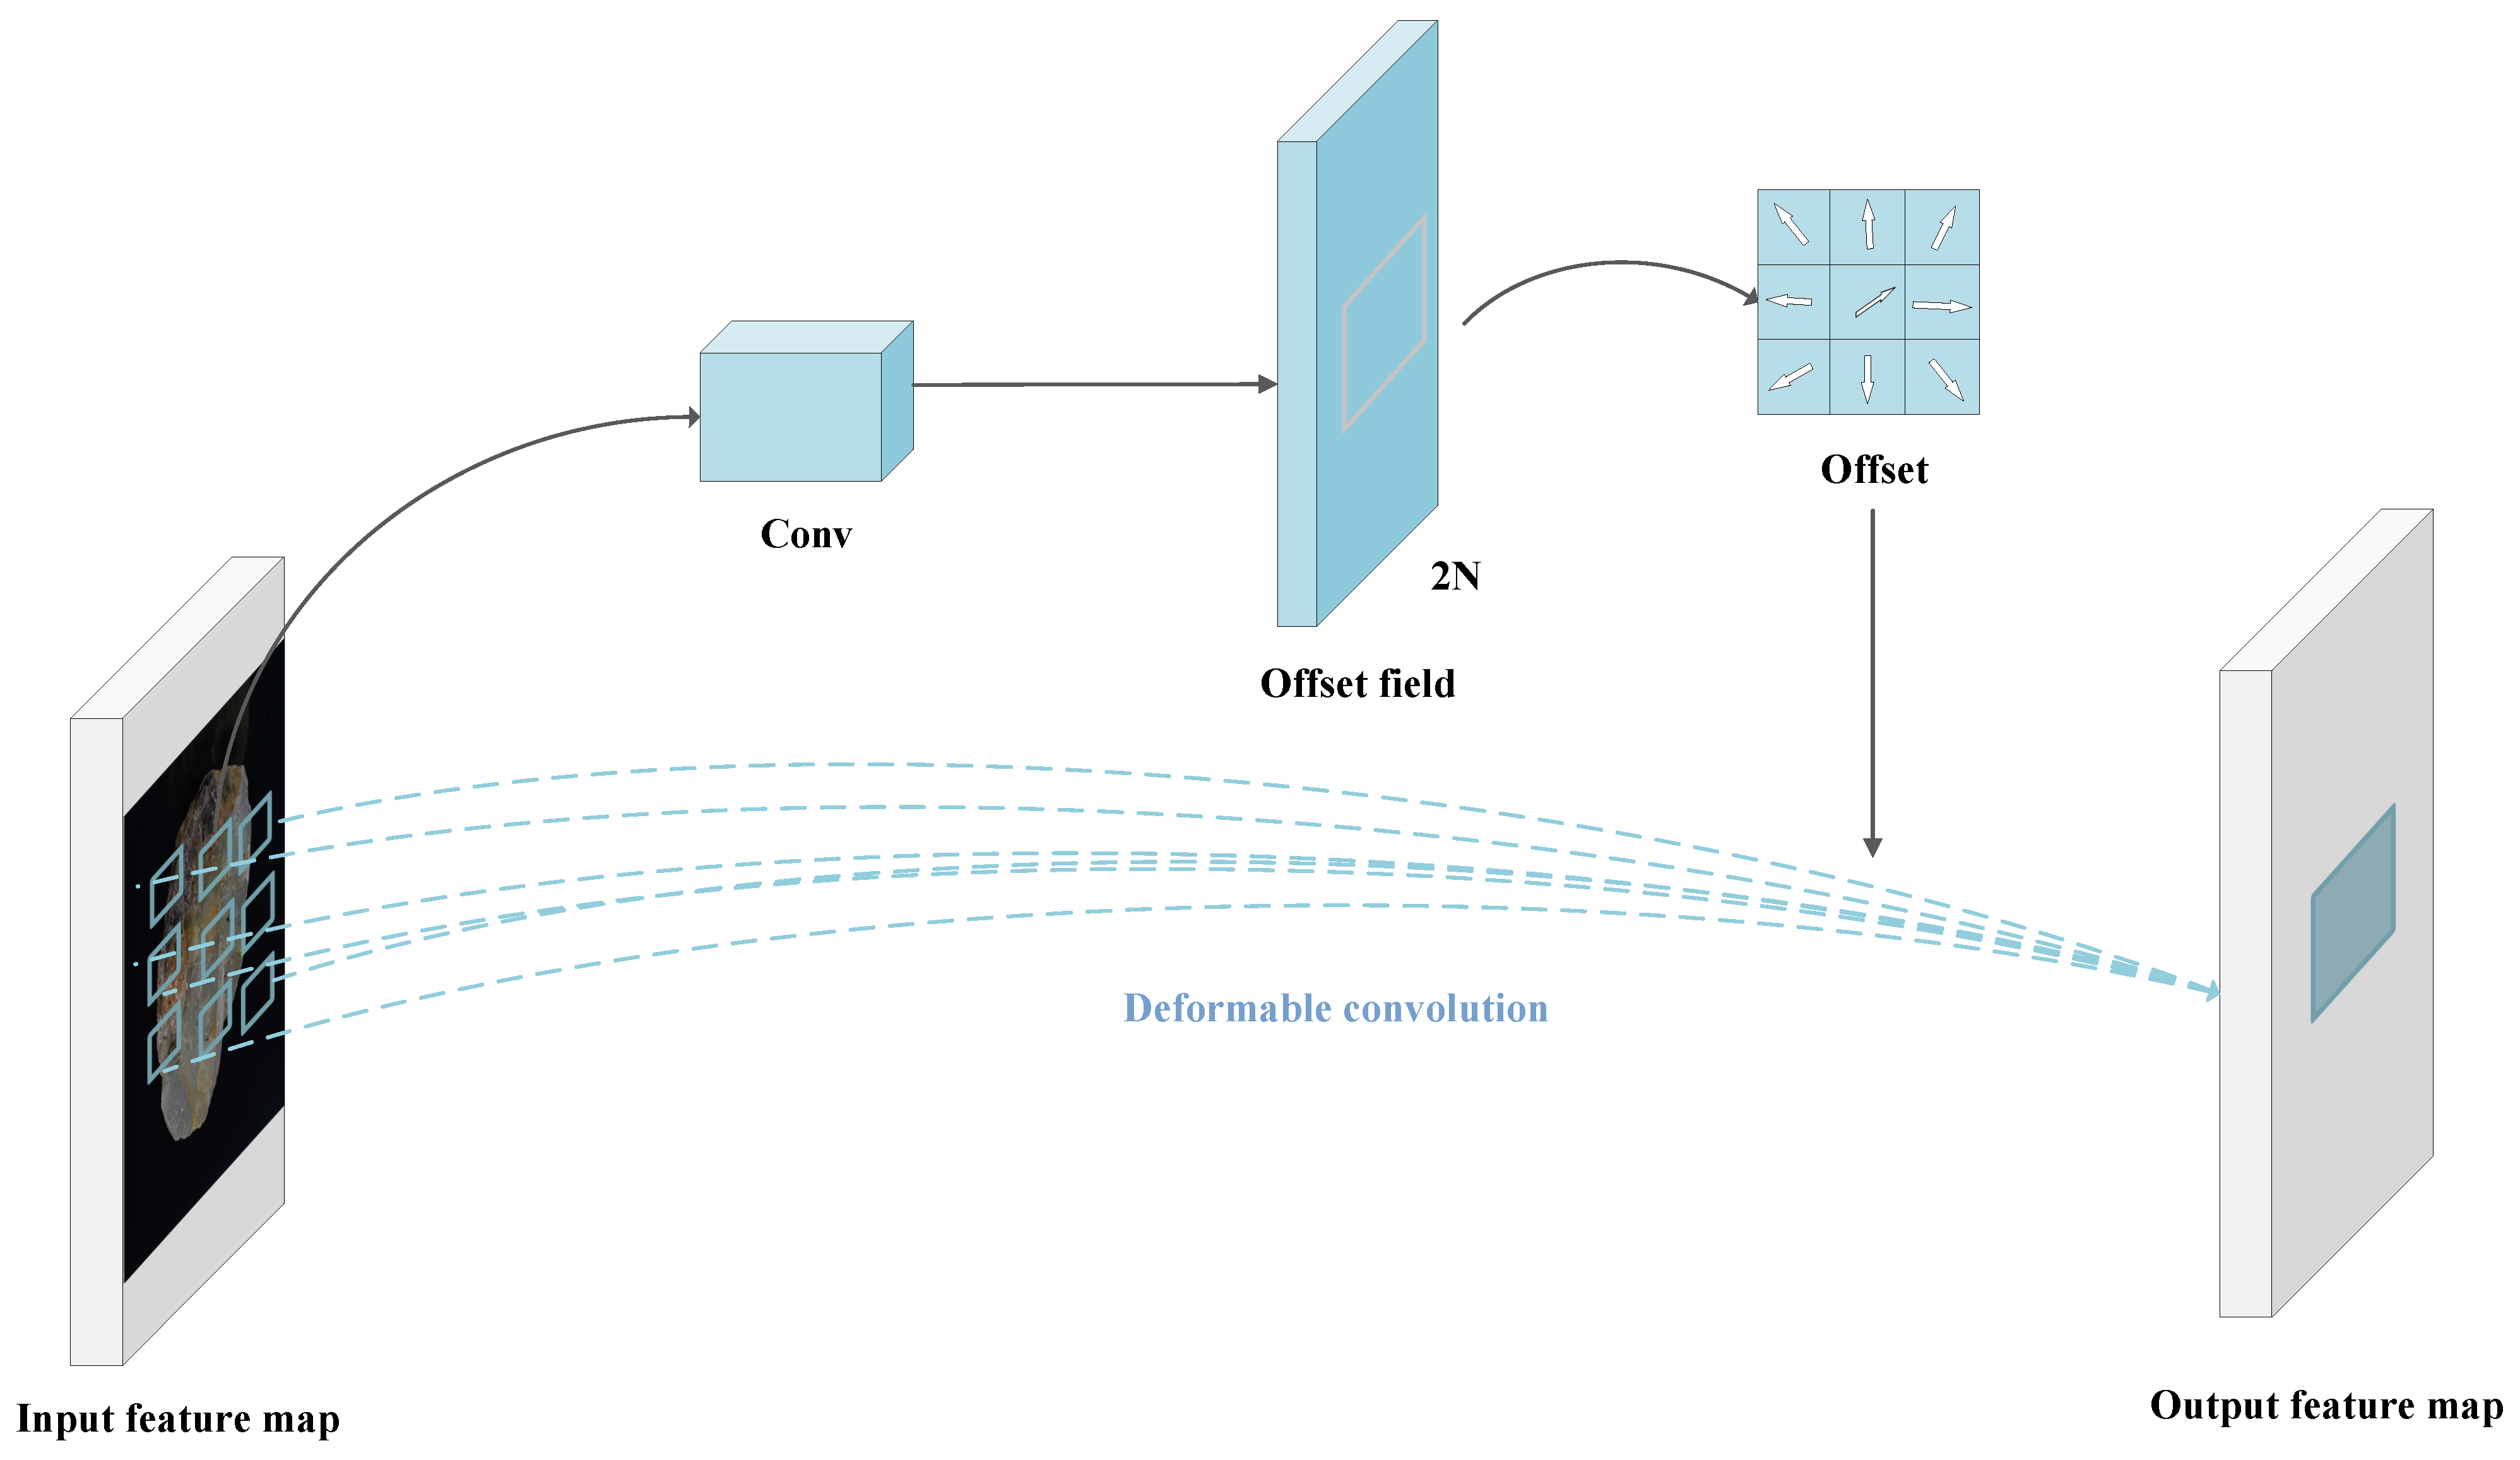
As shown in Figure 4, the offset is learned and generated through an additional convolutional network that operates independently of the final convolution operation. Taking the input feature map as an example, when the standard convolution kernel has a region size of 3 × 3 (corresponding to N = 9 sampling points), the offset learning module outputs a 2 N -dimensional offset field. This is because the convolution kernel needs to learn offsets in both the x- and y-directions separately, assigning two-dimensional offset parameters (i.e., horizontal and vertical coordinate offsets) to each sampling point.
Deformable convolution employs learnable spatial offsets, allowing the sampling points of the convolutional kernel to adaptively adjust their positions according to the complex characteristics of multi-modal ores. For instance, when identifying layered mineral structures, the sampling points can distribute linearly along the bedding direction to improve the extraction of continuous interlayer boundaries. In cases involving irregular mineral inclusions in porphyritic ores, the predicted offsets guide the convolution kernel to emphasize gradient regions exhibiting abrupt mineral phase transitions. This adaptive sampling strategy not only overcomes the constraints of conventional convolution in capturing regular geometric patterns, but also mitigates the impact of surface noise—such as oxidation layers and fractures—during mineral identification by dynamically adjusting the sampling field.

3.3.2. Augmented Deformable Convolution

To enhance the adaptability of convolutional neural networks to complex geometric deformations and focus on key features, this paper proposes an Augmented Deformable Convolution(EDA) module. The core design principle is: by extracting feature maps generated from deformable convolution, the module utilizes an Efficient Channel Attention (ECA) mechanism to adaptively generate channel-wise attention weights. This strengthens regions containing critical information in the feature maps while suppressing redundant features, thereby significantly improving the model’s feature representation capability and object detection accuracy.
The fundamental design principle of ECA (Efficient Channel Attention) lies in establishing inter-channel dependencies through convolutional operations instead of fully-connected layers [21]. This strategy significantly reduces both the model parameters and computational complexity. The mechanism enables more efficient channel-wise weight computation via 1D convolution, and its working principle is illustrated in the architecture diagram in Figure 5.
The working principle of ECA focuses on efficiently capturing the importance of the channel dimension. Its core process is as follows: first, perform global average pooling on each channel of the input feature map to compress the spatial dimension information, obtaining a vector containing only channel–dimension features, thereby acquiring the global semantic description of each channel; then, use 1D convolution instead of the traditional fully connected layer to model the dependencies between channels, where the kernel size of the 1D convolution is determined by the formula:
k = ψ ( C ) = log 2 ( C ) + γ + b
where C represents the number of channels, while γ and b denote the scaling and bias parameters, respectively. This design effectively models inter-channel dependencies while minimizing computational overhead. The output from the 1D convolution is then normalized to the range [ 0 , 1 ] using a Sigmoid activation function, producing a set of attention weights for each channel. Higher weight values indicate that the features of the corresponding channel are more salient. Finally, these weights are multiplied with the original input feature map channel-wise, enhancing the critical channel features while suppressing less significant ones. This process achieves optimized feature selection through the channel attention mechanism.
The EDA model’s operational logic involves the input feature map x, which first passes through a deformable convolution module. In this module, spatial offsets are calculated using an offset convolution layer to adjust the standard convolution’s sampling positions dynamically.
The feature map processed by deformable convolution is subsequently fed into the ECA module. Within this module, the feature map is first subjected to global average pooling, compressing it into a one-dimensional vector. This vector is then reshaped into the dimension ( b , c ) , where b indicates the batch size and c the number of channels. The resulting condensed descriptor undergoes one-dimensional convolution and is then passed through a sigmoid activation function to produce a set of channel-wise attention weights. Finally, these attention weights are reshaped and multiplied element-wise with the input feature map. This step applies the attention weighting to the output of the deformable convolution, thereby enhancing the most discriminative features. The final output from the ECA attention module serves as the result of the EDA Conv module.
The EDA model significantly enhances the accuracy of key feature extraction and overall model performance through the synergistic effect of deformable convolution and the ECA attention mechanism. The deformable convolution technique dynamically adjusts the receptive field structure of convolutional kernels, effectively handling geometric deformations and local feature variations in input images. The ECA mechanism adaptively allocates weights based on channel importance evaluation, precisely focusing on critical feature dimensions. This dual-dimensional feature optimization system not only strengthens the model’s adaptability to complex scenes but also achieves dual improvements in both detection accuracy and localization precision for engineering tasks such as object detection and semantic segmentation. Furthermore, it substantially enhances cross-dataset and cross-scenario generalization capabilities.

3.4. DSC Module

3.4.1. Dynamic Convolution

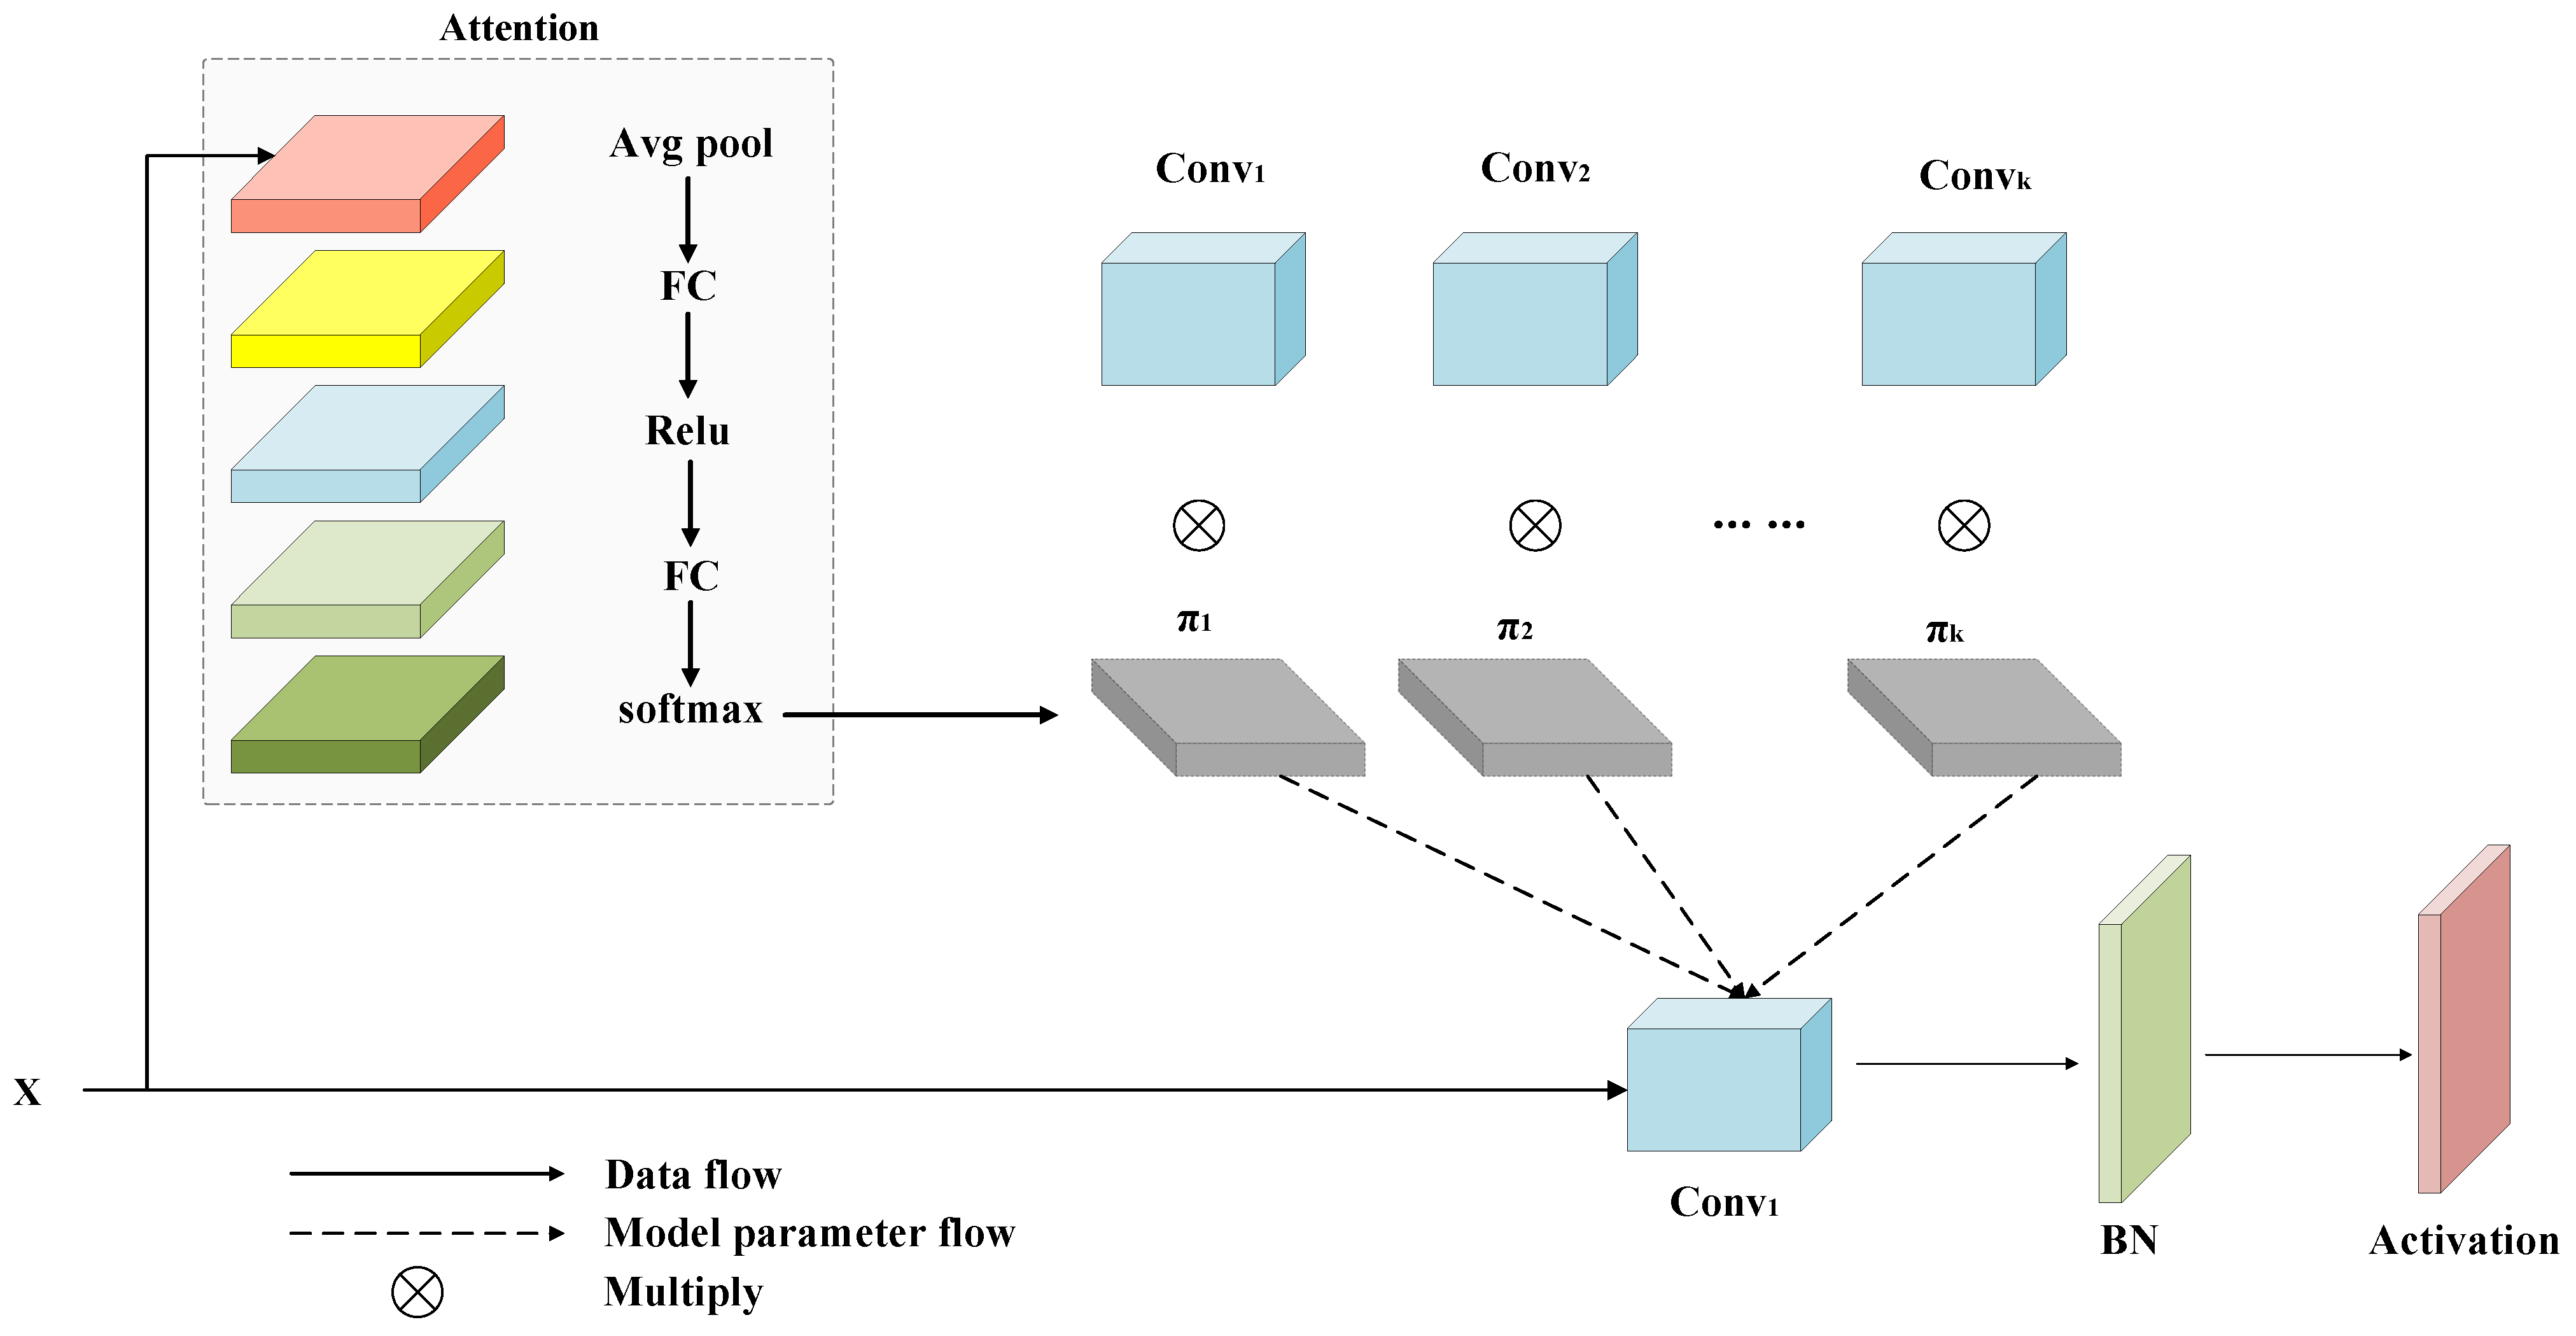
Dynamic Convolution [22] overcomes the limitation of fixed kernel parameters in traditional convolution by implementing “intelligent feature extraction through dynamic allocation of convolutional kernel combinations”. The core principle is: it customizes convolutional kernel weights for each input feature, enabling the network to flexibly adjust computation based on input content. The operation process is illustrated in Figure 6.
Dynamic convolution breaks the inherent pattern of fixed convolutional kernel parameters in traditional convolutional neural networks. By constructing an adaptive generation mechanism for dynamic convolutional kernel weights based on input features, it achieves the dynamic and intelligent feature extraction process. The core idea lies in dynamically generating the optimal combination of convolutional kernel weights for different input feature maps, thereby enhancing the network’s ability to represent complex features.
In the operational framework of dynamic convolution, the input feature maps are first fed into an attention module. This component employs global average pooling to condense the high-dimensional feature maps into compact feature vectors, effectively lowering the dimensionality of the data while retaining essential information. The resulting feature vectors then pass sequentially through two fully connected layers. A ReLU activation function is applied after the first fully connected layer to strengthen the network’s capacity for modeling non-linear relationships, allowing the model to capture more complex feature representations. Finally, the feature vectors undergo normalization via the softmax activation function, generating a weight coefficient vector. Each element of this vector has a value range of [ 0 , 1 ] , and the sum of all elements equals 1, thereby providing standardized weights for the subsequent weighted operation of convolutional kernels.
During the stage of dynamic convolution kernel selection, a set of parallel convolutional kernels (conv1, conv2, …, convn) constitutes a series of diversified feature extraction units. Each kernel exhibits autonomous feature learning abilities, allowing it to learn diverse feature representations. The weight coefficient vector generated by the aforementioned attention module serves as the weighting basis to perform weighted processing on the output feature maps of each convolutional kernel. Through weighted summation operations, it produces dynamically convolved output feature maps that are highly adaptive to the input features. This dynamic weighting mechanism endows the network with the ability to flexibly adjust the combination of convolutional kernels based on input content, thereby achieving adaptive extraction of complex features.
The generated dynamic convolution output feature maps are further processed through a standard convolutional layer, batch normalization layer, and activation function. Specifically, the standard convolutional layer performs additional feature extraction and abstraction. The BN layer accelerates the training process and improves training stability by normalizing the data, while the activation function enhances the network’s ability to represent nonlinear features. Ultimately, this pipeline outputs deeply refined feature maps.
In conventional convolution, the input feature map x is processed within a static receptive field R , with the kernel parameters w ( q ) remaining constant during operation:
y ( p ) = q R x ( q ) · w ( q )
where y ( p ) corresponds to the output value, x ( q ) represents input features, w ( q ) denotes the fixed convolutional kernel weights, and R indicates the predefined receptive field region. In such operations, the kernel parameters remain invariant across the entire input. The kernel is convolved across the input feature map, extracting features from consistent local regions through sliding window application.
In contrast, dynamic convolution adaptively generates the convolutional weights w ( q ) via a feature-dependent function f ( x ) . The kernel selection thus varies based on the characteristics of the input features:
y ( p ) = q R x ( q ) · w ( q , f ( x ) )
Dynamic convolution substantially improves the model’s representational capacity and flexibility across varying input conditions through its adaptive feature extraction mechanism.

3.4.2. Augmented Dynamic Convolution

To improve the compatibility of the dynamic convolution module with heterogeneous data distributions and multi-modal feature patterns, we introduce a Dynamic-SE-Convolution (DSC) module that incorporates the Squeeze-and-Excitation (SE) attention mechanism. This approach enhances salient channel features and suppresses less informative ones via adaptive weighting in the channel dimension, thereby strengthening the robustness of feature representation and the model’s ability to generalize across domains in complex environments. The core innovation lies in embedding the SE module’s channel dependency modeling capacity into the dynamic convolution workflow, forming a synergistic mechanism of ‘dynamic convolutional kernel parameter adjustment – channel attention weight optimization’.
As a widely-used channel attention mechanism, the SE (Squeeze-and-Excitation) module improves the feature discriminability of convolutional neural networks by adaptively recalibrating channel-wise feature responses. It consists of two key operations: Squeeze (for feature condensation) and Excitation (for adaptive recalibration) [20]. It operates in two consecutive steps:
Initially, spatial feature compression is achieved via global average pooling over the spatial axes of the input feature map X R C × H × W , with H and W denoting the feature map’s height and width, and C representing the channel count. This process yields a channel descriptor vector z R C × 1 × 1 , mathematically expressed as:
z c = 1 H × W i = 1 H j = 1 W x c ( i , j )
This operation aggregates global semantic information from spatial dimensions into channel dimensions, providing global context for subsequent channel-wise dependency modeling.
Second, feature excitation is performed by modeling channel-wise dependencies through a bottleneck-style fully connected network, generating attention weights for each channel:
s = σ W 2 · δ W 1 · z
where W 1 and W 2 denote the weight matrices for the fully connected layers, ReLU, and sigmoid activations, respectively.
Subsequently, the derived channel weights undergo element-wise multiplication with the input feature map along channel dimensions, enabling adaptive feature recalibration. Mathematically, this operation is formulated as:
x ˜ out = x c · s c
where s c signifies the attention weight assigned to channel c, with x c R H × W denoting the spatial feature map of channel c within the input tensor.
The DSC module operates by first receiving an input tensor X R C × H × W and initializing through the parent class C3k2_DynamicConv’s interface, which pre-configures the dynamic convolution parameter generator, sets up the Bottleneck module group, and initializes the feature channel partitioning strategy.
Next, the module employs multi-branch feature extraction and fusion. The parent module C3k2_DynamicConv adopts a feature splitting mechanism that partitions the output y along the channel dimension into two components. These components then undergo sequential processing via successive Bottleneck modules. Subsequently, all processed feature maps undergo channel-wise concatenation before being fed into a convolutional layer that generates the final output.
During forward propagation of the DSC module, the parent module first processes the input, yielding intermediate features. These features are subsequently compressed into channel descriptors through global average pooling, before being fed into a two-layer fully connected network that outputs channel attention weights. Finally, feature enhancement and suppression are achieved through channel-wise multiplication. The SE-optimized feature map is output by the DSC module and propagated to subsequent network layers.
The module achieves three fundamental advantages through deep integration of DynamicConv’s dynamic feature extraction and SE’s channel attention mechanisms: First, it establishes a dual adaptive mechanism at the feature extraction level, where DynamicConv performs spatial adaptation through input-dependent convolutional kernel generation while the SE module achieves channel-wise importance ranking through inter-channel dependency modeling, synergistically enhancing the model’s representation capacity for multi-scale and multi-modal features. Second, it creates a precision-generalization co-optimization at the performance level, where DynamicConv’s adaptability to geometric deformations combined with SE’s semantic feature enhancement significantly improves detection accuracy in complex scenarios and cross-domain generalization capability. Third, it realizes dual control of parameters and computations at the efficiency level, where DynamicConv reduces redundant calculations through on-demand kernel generation and the SE module implements lightweight channel attention modeling via efficient fully-connected layers, enabling stronger feature representation while maintaining high inference speed.

3.5. HGAF Module

To tackle the limited ability of YOLOv11 to extract features in multi-scale fusion scenarios, we introduce the Hierarchical Graph Attention Fusion (HGAF) module, designed to extract multi-scale and multi-dimensional attention weights for fusing two input feature tensors x , y R C × D × H × W effectively. The HGAF module integrates three synergistic attention mechanisms: Spatial Attention (SA), Channel Attention (CA), and Pixel Attention (PA) [10]. Input features are initially integrated via element-wise summation X = x + y , forming the foundation for subsequent attention calculations. The final output is produced via adaptive recombination of the original features using learned attention maps, with each mechanism selectively enhancing distinct facets of the input features through attention-guided transformations.SA is designed to locate spatially salient regions in the input feature map for subsequent processing. This is accomplished through spatially combining average-pooled and max-pooled feature maps, then subjecting them to a convolution to generate the spatial attention map. First, channel-wise average pooling (Equation (11)) is used to compress channel-wise information across D channels into a single-channel representation:
X a v g ( c , 1 , h , w ) = 1 D d = 1 D X ( c , d , h , w )
Subsequently, channel max pooling Equation (12) is applied to capture the maximum activation values across spatial locations and channels, yielding an extra single-channel feature map:
X max ( b , 1 , h , w ) = max d = 1 , , D X ( c , d , h , w )
The average-pooled and max-pooled feature maps then undergo channel-wise concatenation, per Equation (13).
X c o n c a t = concat X a v g , X max
Finally, a convolution operation with learnable parameters is applied to X c o n c a t along the spatial dimensions, which adaptively combines X a v g and X m a x through the learned kernel weights U s and bias c s . This yields the spatial importance-aware feature map M pos per Equation (14), encoding the significance of each spatial location.
M pos = U s X c o n c a t + c s , M pos R C × 1 × H × W
Building upon this foundation, Spatial Attention (SA) and Channel Attention (CA) collaboratively enhance feature representation through differential focusing mechanisms. SA operates along the spatial dimension by integrating both global contextual intensity and local regional saliency at each pixel position, generating location-sensitive attention weights that adaptively highlight object contours and detailed features. In contrast, CA optimizes features by explicitly modeling inter-channel dependencies based on semantic distinctions among channel features. Specifically, as defined in Equation (15), CA computes the spatial average of input feature map X to produce X s :
X s ( c , d , 1 , 1 ) = 1 H × U h = 1 H u = 1 U X ( c , d , h , w ) , X s R C × D × 1 × 1
The channel processing employs sequential 1 × 1 convolutions, beginning with a dimensionality-reducing layer ( U D 1 R D / r × D × 1 × 1 , c d 1 R D / r ) that compresses the channel depth by reduction ratio r (Equation (16)), generating intermediate features W R C × D / r × 1 × 1 to balance representational capacity against computational overhead through controlled channel compression.
W = U d 1 × X s + c d 1 , W R C × D r × 1 × 1
As illustrated in the HGAF workflow diagram, the ReLU activation function is incorporated to enhance the model’s nonlinear fitting capability.
W = ReLU ( W )
Ultimately, the second convolutional layer Equation (18) restores the original channel dimension D, yielding channel attention weights D ch for the input feature map. This process is parameterized by weight matrix U D 2 R D × D / r × 1 × 1 and bias vector c d 2 R D , associated with the second 1 × 1 convolution.
D ch = U d 2 × W + c d 2 , D ch R C × D × 1 × 1
The combination of Channel Attention and Spatial Attention generates the initial pixel attention map P 1 , which simultaneously incorporates both channel-wise and spatial-wise information as defined in Equation (19):
P 1 = S PoS + D ch
Subsequently, X and P 1 undergo channel-wise concatenation. Aggregating dual-channel vectors over samples c, channels d, and spatial locations ( h , w ) yields Z R C × 2 D × H × W . A learnable linear transformation is then applied to Z In our implementation, this transformation is realized using a convolutional layer with a 7 × 7 kernel. For the c-th output channel, the convolution uses weight matrix W c R 2 × 7 × 7 and bias term b c . Let the convolutional kernel be centered at position ( h , w ) ; the output is then computed as specified in Equation (20):
L d ( c , h , w ) = i = 1 2 u = 3 3 v = 3 3 W c ( i , u , v ) · Z ( c , 2 d + i , h + u , w + v ) + c d
The ( u , v ) range spans [ 3 , 3 ] , corresponding to a 7 × 7 neighborhood anchored at ( h , w ) . Z aggregates channels from X and P 1 , with each channel undergoing independent mapping. Ultimately, the sigmoid function σ Equation (21) maps the linear response L d ( c , h , w ) to attention weights.
P 2 ( c , d , h , w ) = σ L d ( c , h , w ) = 1 1 + e L d ( c , h , w )
For input feature maps x , y R C × D × H × W , uniform feature merging is performed through element-wise summation ( x + y ) . The merged result is then further integrated with P 2 according to Equation (22):
P 3 = X + P 2 x + 1 P 2 y
A 1 × 1 convolutional operation is subsequently applied to P 3 to perform linear transformation.

4. Data and Experimental Preparation

4.1. Experimental Data

A model’s capacity for deep feature learning is inherently tied to its internal architecture and the training data utilized. A training dataset with greater diversity—covering more comprehensive scenarios—facilitates more thorough feature extraction. This not only bolsters the model’s generalization and extrapolation abilities but also equips it to tackle more complex classification tasks. Such diversified features are pivotal for model training, validation, and performance assessment, especially in scientific research and field deployments. Our dataset, notable for its substantial sample diversity, is sourced from two main origins: one public repository (the Mineral Identification Dataset [23]) and one proprietary collection of field-acquired fluorite ore images. Comprising 8000 images across four mineral categories, it is split into training, validation, and test sets in an 8:1:1 ratio. Representative samples from these four mineral classes are illustrated in Figure 7.

4.2. Experimental Setup

The experiments were performed using a 64-bit Windows 11 system, powered by an Intel i5-13600KF CPU and an NVIDIA Tesla 4070 GPU (12GB VRAM). Python 3.8, CUDA v11.8, and the PyTorch 2.2.4 framework were utilized for the implementation.
A consistent training setup was followed across all experiments: 300 epochs with a batch size of 32. The model training was optimized using Stochastic Gradient Descent (SGD) with a momentum of 0.937, an initial learning rate of 0.01, and a weight decay of 0.0005. Loss weights were set as follows: bounding box loss = 7.5, classification loss = 0.5, and Distributed Focal Loss (dfl) = 1.5. An early stopping mechanism was applied, with performance on the validation set triggering the stop after 100 epochs without improvement. The Mosaic data augmentation was disabled in the final 10 epochs to stabilize convergence. This strategy, along with early stopping, was consistently applied across all experiments to ensure fairness and reproducibility. Full training parameters can be found in Table 1.

4.3. Evaluation Metrics

Guided by practical application requirements, this study leverages five core metrics to systematically assess the model’s accuracy and lightweight properties. Model accuracy is gauged via three metrics—Precision (P), Recall (R), and mean Average Precision (mAP)—which jointly reflect the detection task’s localization precision and classification credibility. Lightweight characteristics are holistically evaluated across two dimensions (Floating Point Operations (FLOPs) and network parameter count) to quantify the model’s computational efficiency and deployment viability. Real-time performance is a critical metric for the deployment of object detection in industrial applications, while FLOPs and Params are two key indicators that directly determine whether a model can meet such real-time requirements on edge computing devices with limited computational resources.
Precision quantifies the model’s confidence in positive-class predictions, representing the proportion of true positives among all predicted positives:
P = T P T P + F P
where T P signifies the count of correctly predicted positive samples, F P denotes misclassified positive predictions, and F N indicates undetected actual positives.
Recall assesses the model’s capacity to detect true positives, capturing the ratio of correctly identified actual positive samples. Its mathematical formulation is:
R = T P T P + F N
The mean Average Precision (mAP) is a standard performance measure in multi-class object detection systems. This metric is calculated as the mean of the Average Precision ( A P ) scores for all individual classes, with each class’s AP being computed from the area under its Precision-Recall (P-R) curve. The corresponding mathematical representation is given by:
mAP = 1 N i = 1 N 0 1 P i r i dr i × 100 %
where P i ( r i ) indicates the interpolated precision at a recall level r i for class i, and N refers to the total quantity of classes. In this work, N = 4 representing the four distinct mineral types under investigation.
FLOPs (Floating Point Operations) and Params (Parameter Count) are essential for model optimization. FLOPs indicate the computational load of a single inference, reflecting the processing power required for real-time operation on edge devices. Params impact memory usage and generalization—the fewer the parameters, the lower the hardware demands. By optimizing both, mineral detection models can be efficiently deployed in resource-limited environments, balancing real-time analysis, detection accuracy, and device availability for industrial inspection.

5. Experiments

5.1. Model Training

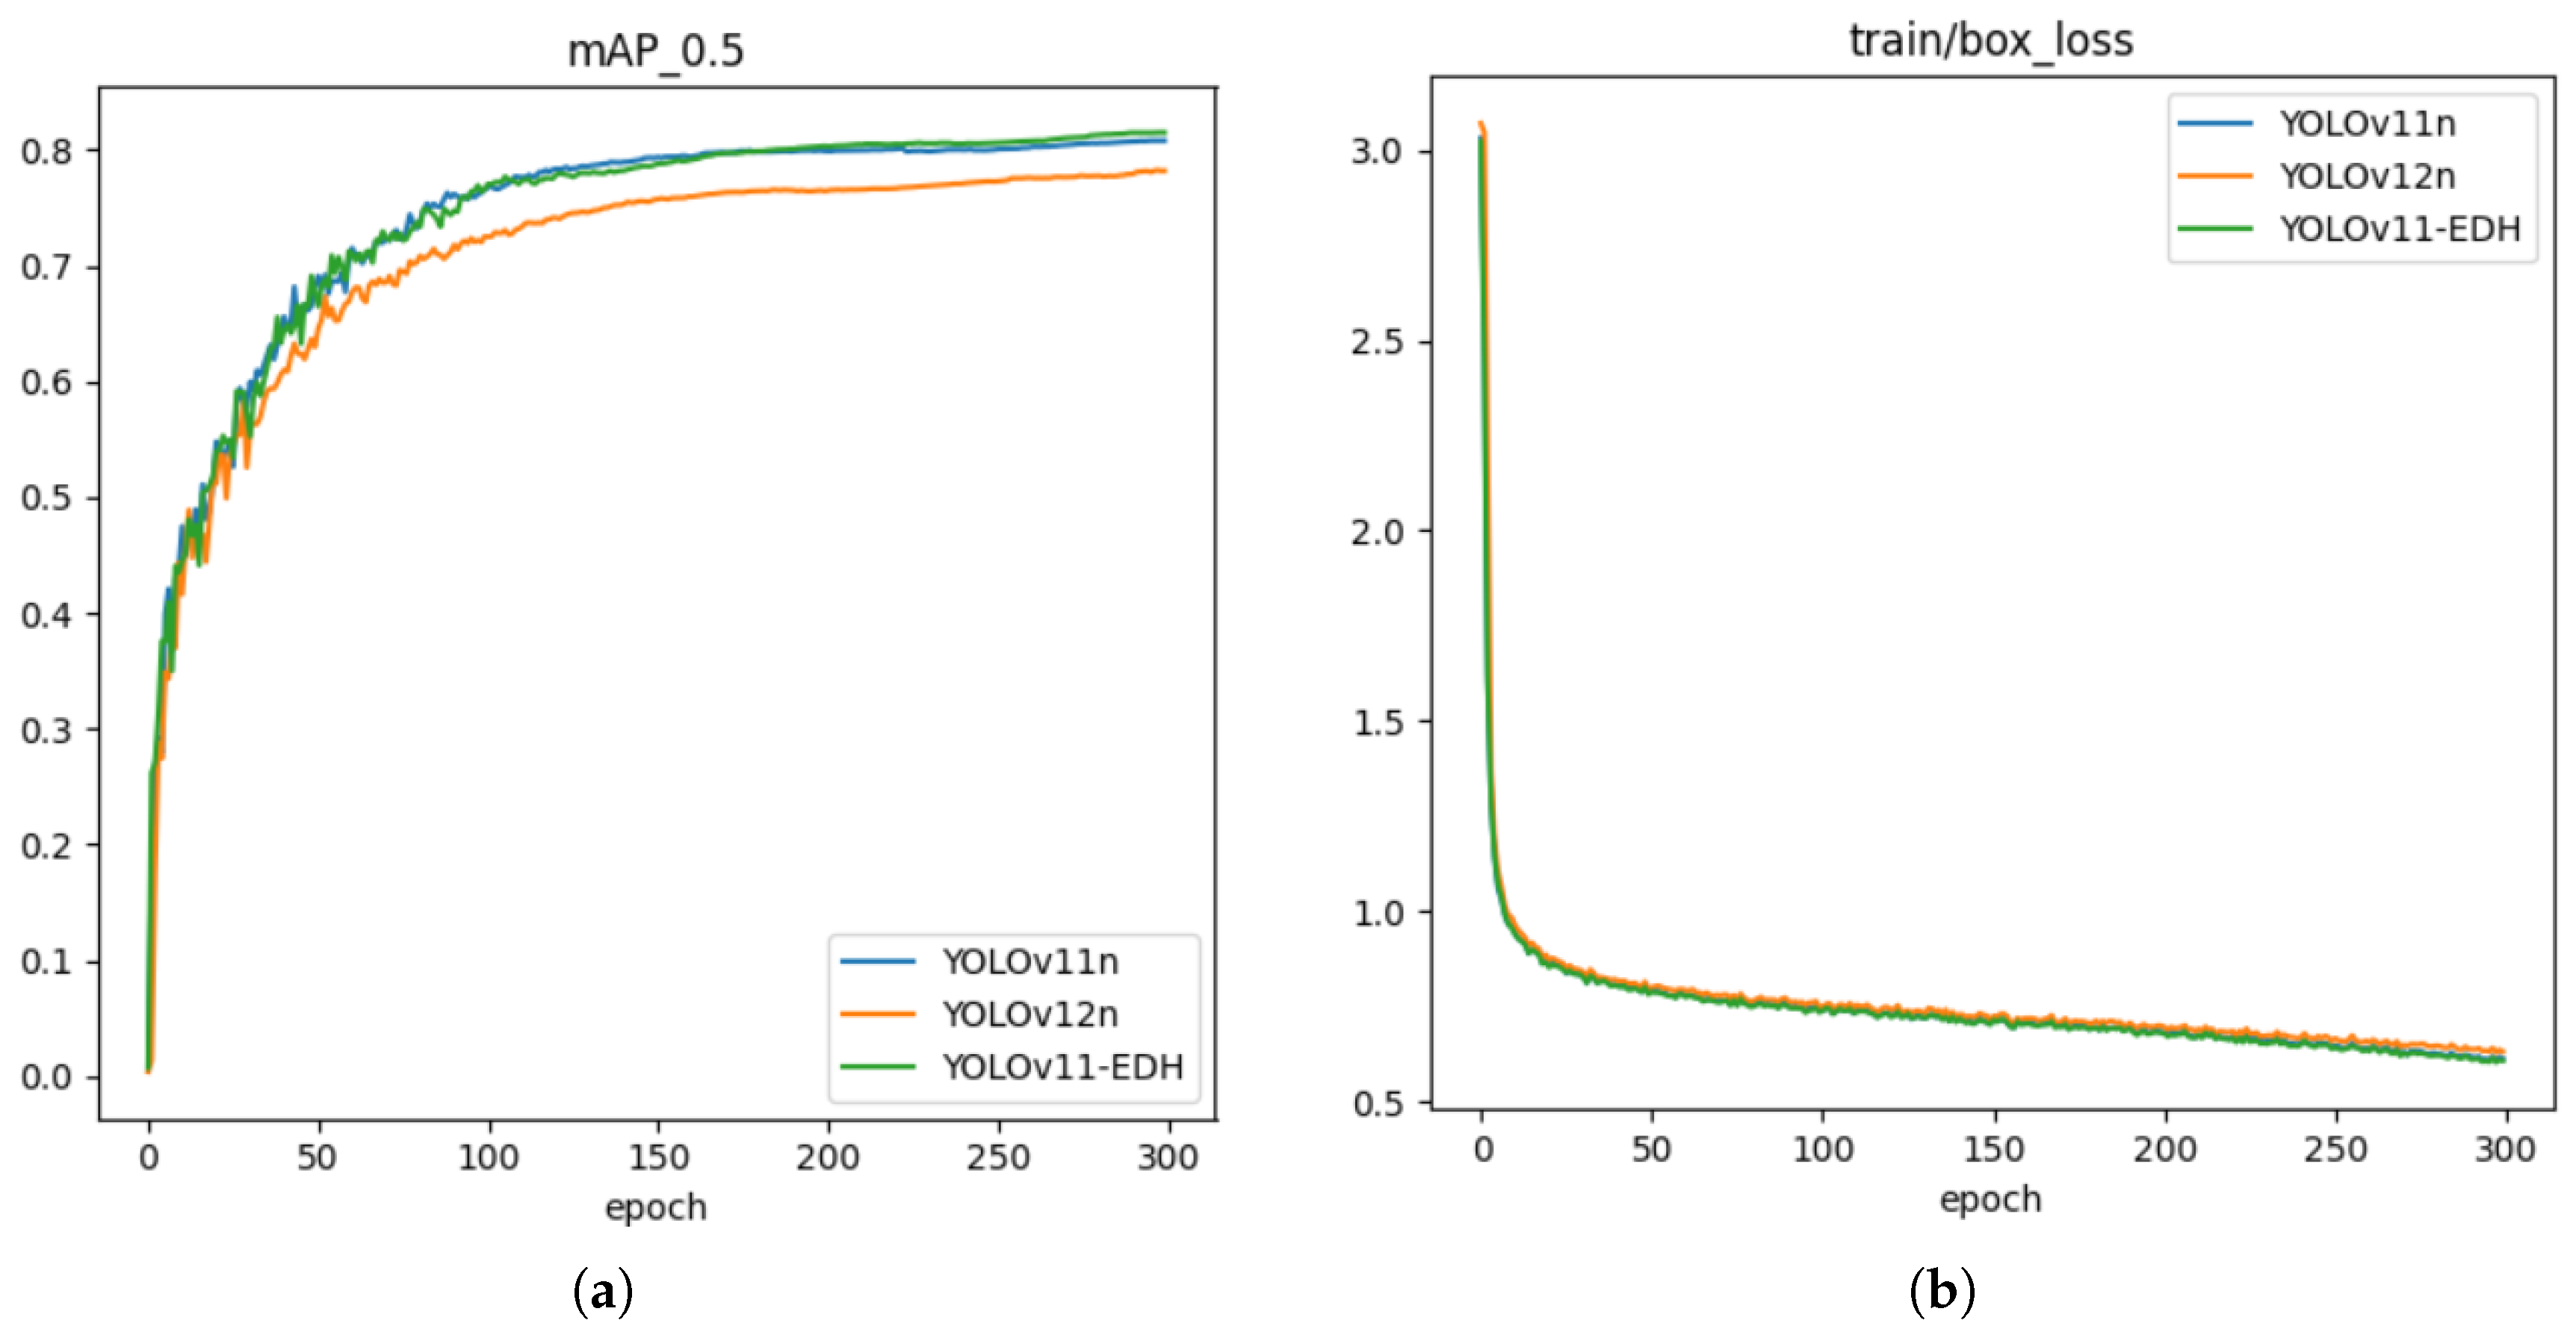
YOLO-EDH was trained using a self-built ore dataset with pre-set parameter settings, and the baseline models YOLOv11n and YOLOv12n were used for comparison. The training procedure is shown in Figure 8. In the initial phase, all three models rapidly acclimated to the dataset, with their loss values dropping quickly. When it came to mAP, YOLO-EDH held a small edge over the baseline model YOLOv11n. In the middle part of training, all three models improved steadily with little fluctuation, and their loss curves gradually converged—YOLO-EDH maintained this lead. In the final stage, compared with YOLOv11n, the improved model showed slightly higher mAP and lower loss, which indicates stronger capabilities in feature extraction and data adaptation. Additionally, the loss trend in the training set revealed that YOLO-EDH’s validation loss kept decreasing and stabilized throughout the training process. This suggests that under the current training setup, the model effectively curbed overfitting to some extent and approached its optimal performance for the task at hand.

5.2. Ablation Study

To validate the effectiveness of each improved module in the proposed algorithm, we conducted an ablation study using the original YOLOv11 as the baseline model. The evaluation metrics included precision, recall, mAP@0.5, model size, and F1-score. Different combinations of the improved modules were tested, and the results are shown in Table 2.
From the experimental results of Groups 6, 7, and 8 in Table 2, we can conclude that these three improvement methods do not mutually inhibit each other but rather complement one another, collectively enhancing the model’s detection performance. Furthermore, as shown for Group 6 in Table 2, when all three improvement methods are combined (our proposed YOLO-EDH model), it achieves the highest mAP@0.5 of 82.4%.

5.3. Visualization Experiments

To thoroughly confirm the advantages of YOLO-EDH, an all-round comparative study was carried out against other YOLO models, focusing on metrics related to accuracy and lightweight performance. To ensure impartiality, all models were assessed without using pretrained weights, adopting their own default hyperparameter configurations, and with no extra optimizations or adjustments applied. The specifics of the comparison outcomes are shown in Table 3.
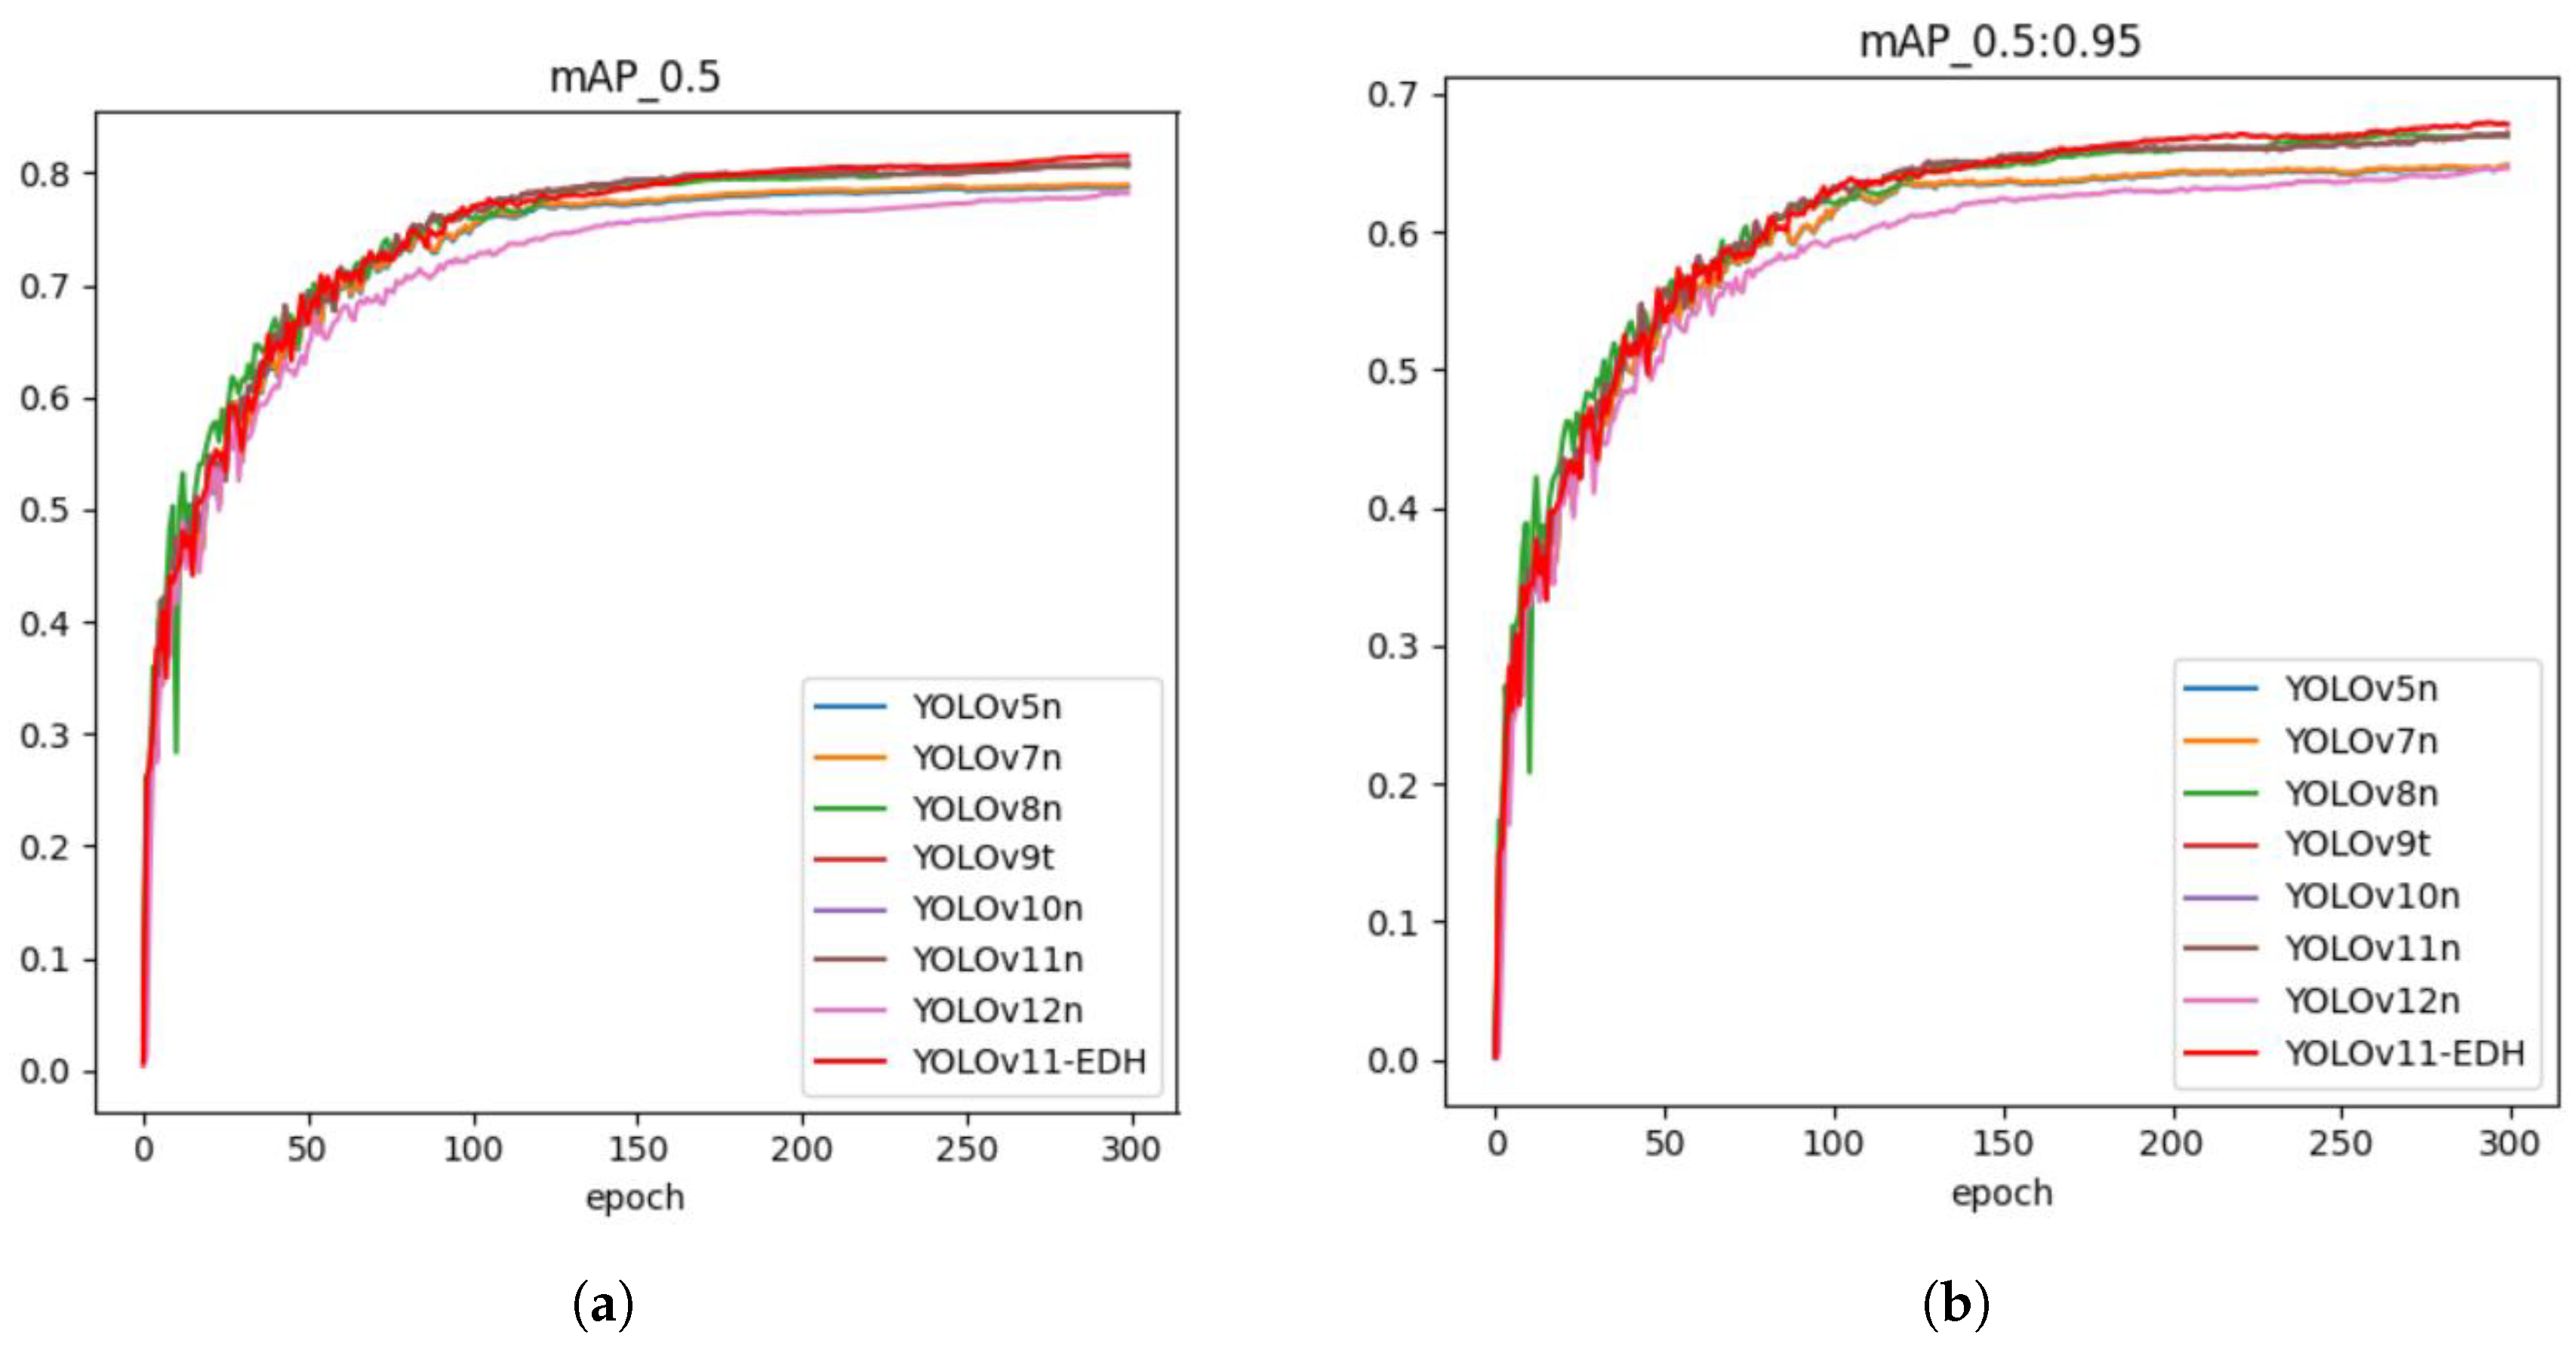
As shown in Table 3, within the margin of error, YOLOv11-EDH outperforms other YOLO models in accuracy-related metrics. Compared with previous-generation models such as YOLOv5n, YOLOv7n, YOLOv8n, YOLOv9t, and YOLOv10n, YOLOv11-EDH achieves an approximate improvement of 1%–4% in the mAP50 (mean average precision at 50% intersection over union, IoU) and 1%–5% in the F1-score—these two metrics comprehensively reflect the model’s average precision, precision, and recall. Notably, however, the scenario differs when the comparison is focused on baseline models of the same series: while the mAP50 improvement of YOLOv11-EDH compared to the baseline YOLO models (e.g., YOLOv11n) is only 1.6%, this minor improvement can minimize actual losses to the greatest extent in industrial scenarios. Furthermore, YOLOv11-EDH maintains relatively low computational consumption. Although it contains more parameters than the same-series models, it shows identical GFLOPs to YOLOv11n, achieving an optimal balance between accuracy and efficiency that would enable real-time detection in practical engineering applications. To ensure comparability, only same-series YOLO models are compared with YOLOv11-EDH, as illustrated in Figure 9.
Figure 9 shows the results in terms of the mAP and mAP50-95 for YOLO-EDH and other YOLO models, including the baseline model YOLOv11n and the improved model YOLOv11-EDH. All models exhibit similar characteristics regarding the change in the mAP: the mAP increases rapidly in the early stage of training, but the initial value of YOLOv11-EDH is slightly lower than that of YOLOv8n. This is due to the deep expansion of the network architecture, the increased width, and the introduction of a new feature fusion mechanism, which leads to increased difficulty in model convergence and necessitates more time to learn optimal weights. During approximately 50 epochs, the mAP values of all models fluctuate continuously; by 80 epochs, YOLOv11-EDH achieves a key breakthrough, and, by 100 epochs, its mAP surpasses that of YOLOv8n and it maintains steady growth. After 300 epochs of sufficient training, the mAP values of all models tend to converge. However, holistically, the YOLO-EDH model sustains a persistent increase and high performance in the late training phase, demonstrating robust discrimination between positive and negative samples. Implicitly, this underscores the model’s capacity to provide theoretical and empirical foundations for subsequent research and practical implementations, while exhibiting notable potential and adaptability in domain-specific ore detection scenarios.
To further expand the comparative scope, YOLO-EDH was benchmarked against several mainstream object detection architectures. Notably, RT-DETR-L employs ConvNeXt-Large as its backbone, whereas other models utilize the widely adopted ResNet-50 [30]. All models leverage the FPN architecture for the neck module. During training, they retained their inherent input resolutions and default pretrained setups, adhering to their respective architectural designs. Table 4 delineates the detailed comparison outcomes.
In terms of accuracy, TOOD achieved the highest mAP50 at 82.8%, with YOLO-EDH and RT-DETR-L showing strong performance too. RetinaNet and YOLOv11n were slightly less accurate, while Faster R-CNN had the poorest performance. While TOOD excels in precision, it comes with high computational costs, requiring 173.5 GFLOPs and 32.5 million parameters, which are much higher than those of YOLO-EDH. These resource demands limit TOOD’s suitability in environments with restricted computational power. On the other hand, YOLO-EDH strikes a balance, offering competitive accuracy while being more efficient, thanks to its optimized backbone and attention mechanisms.

5.4. Visualization of Classification Validation

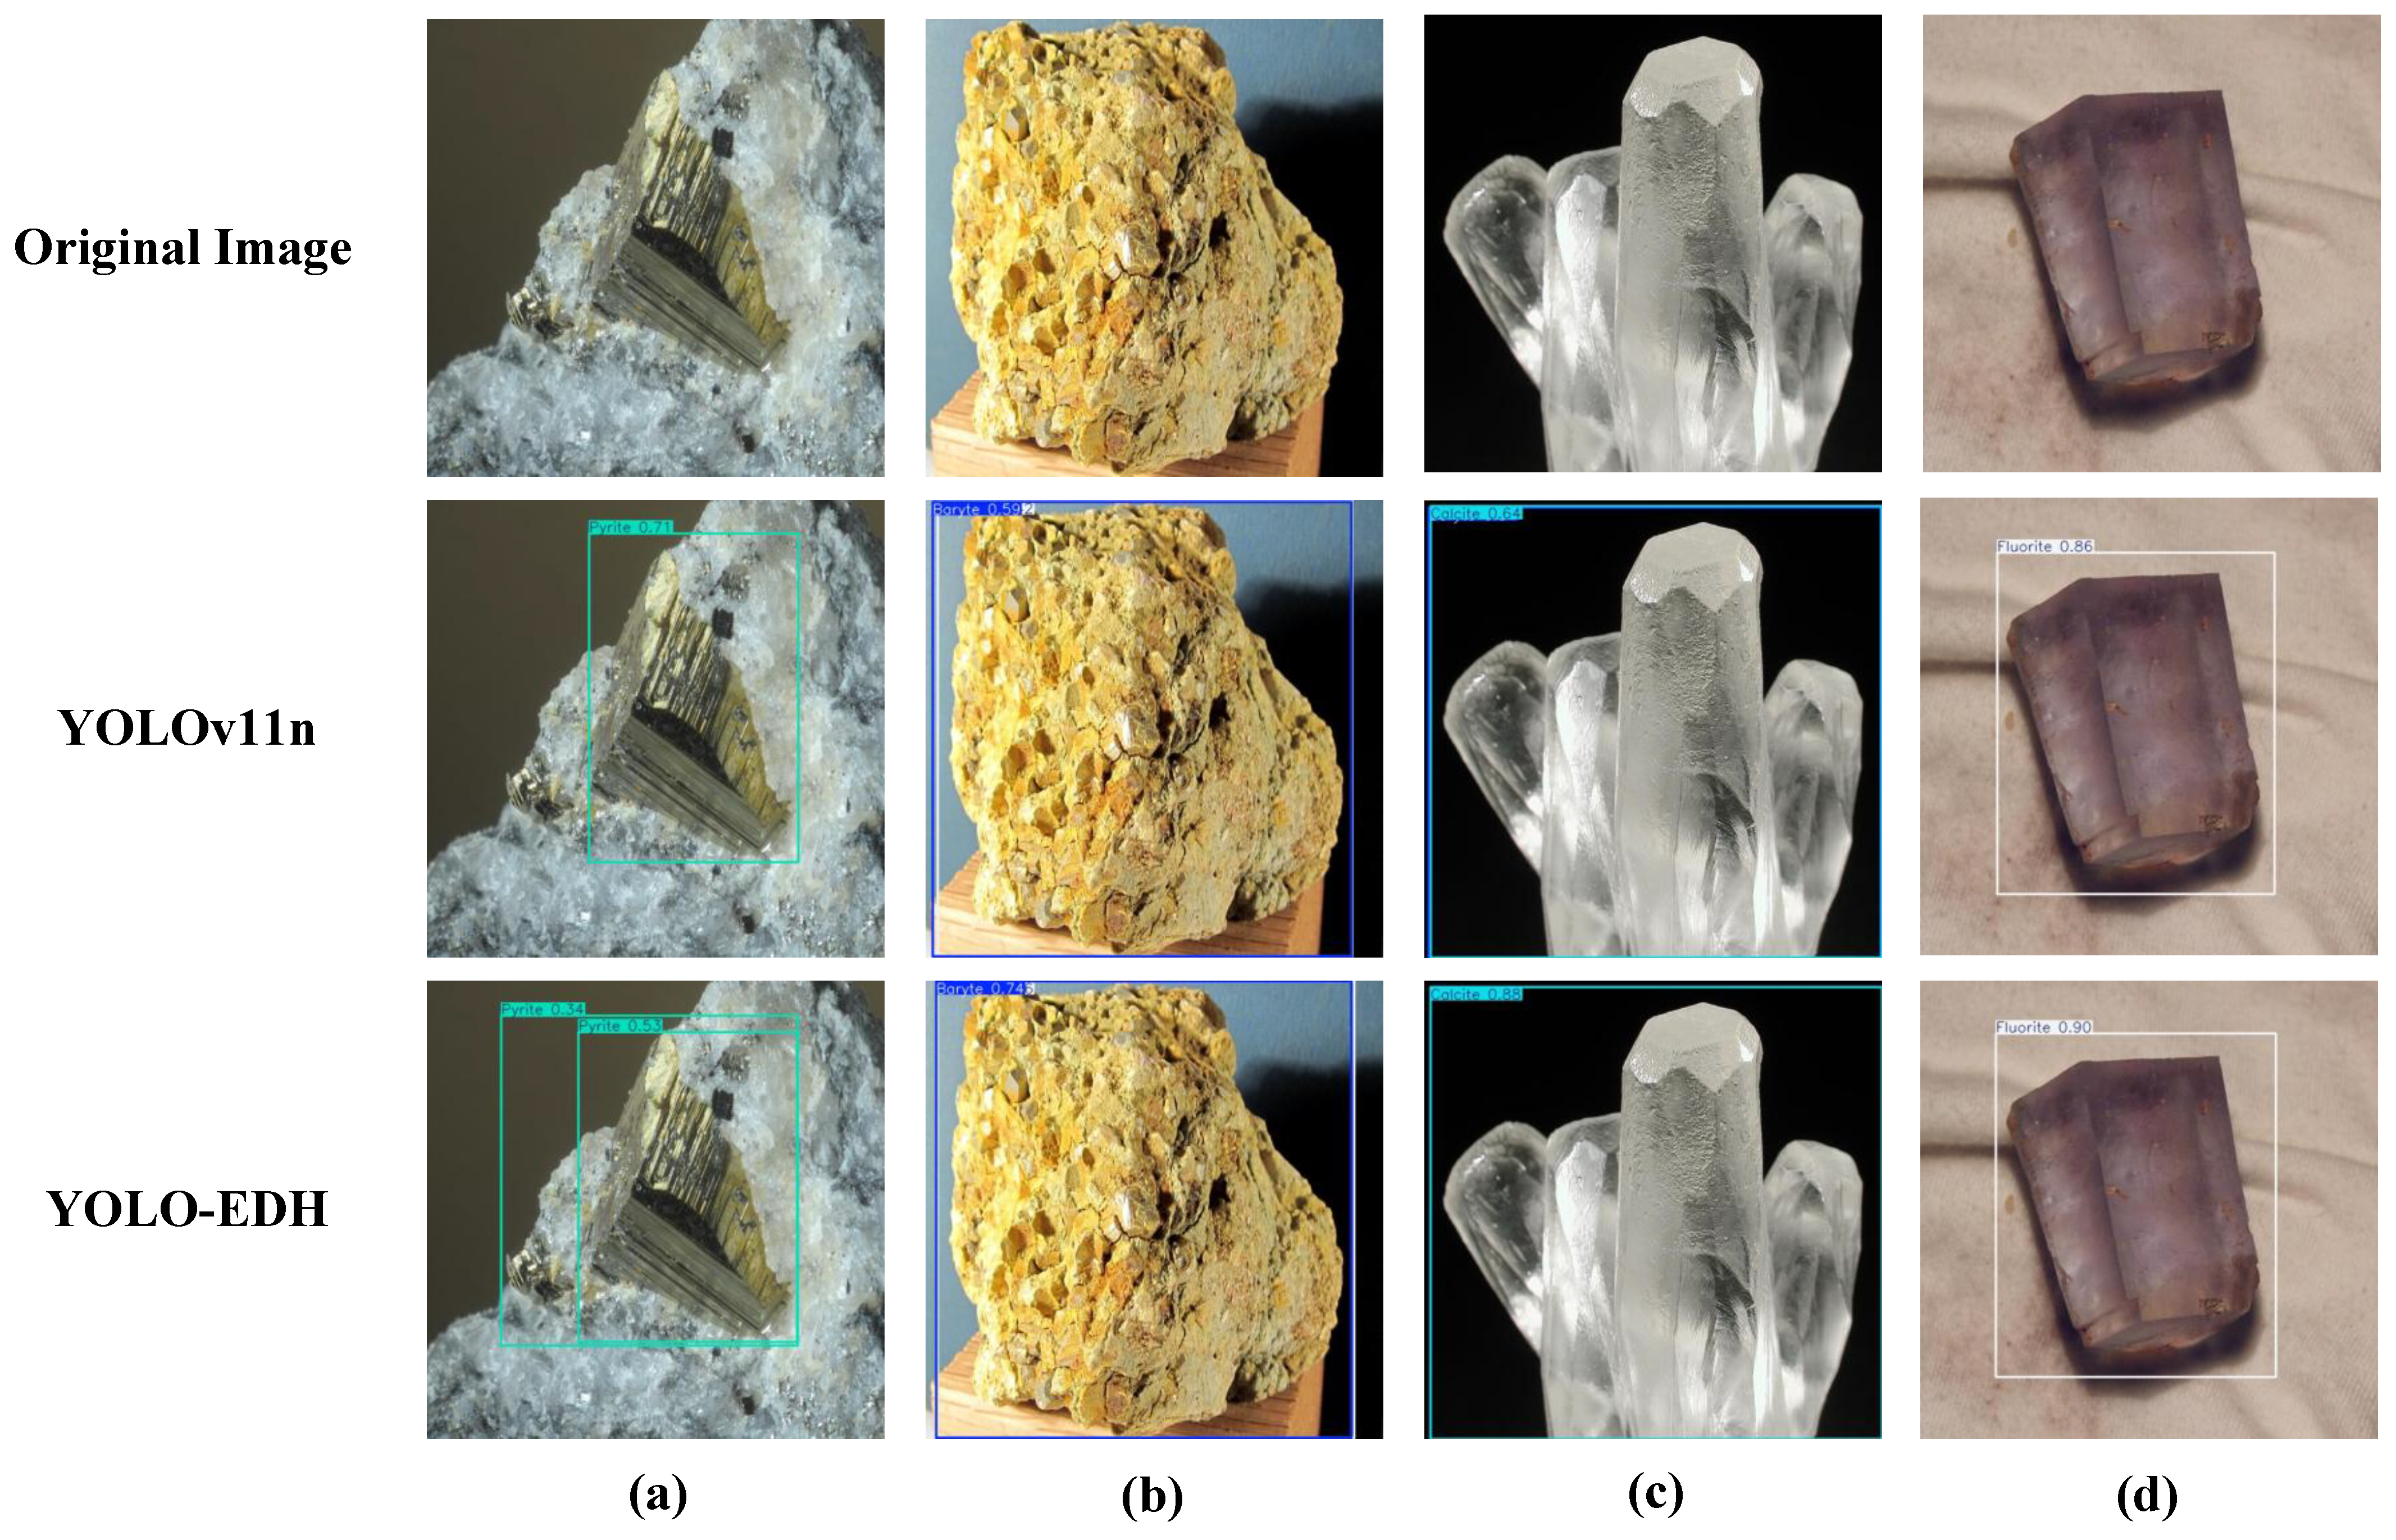
To elucidate the performance enhancements of the improved model, Figure 10 visually contrasts the detection results of YOLO-EDH against those of other models. The comparison samples, randomly selected from the test set, encompassed multiple ore mineral types. For interpretability, the detection results are color-coded by ore type: cyan for pyrite, blue for barite, green for calcite, and white for fluorite. The confidence scores (ranging from 0 to 1) in the outputs quantify the detection reliability, reflecting the model’s estimated probability of accurately identifying specific ores within target regions.
According to the comparison of the experimental results, YOLO-EDH outperforms the baseline YOLOv11n model in all categories. The pyrite ore features in Figure 10a are small, irregular, overlapping, and similar to the background, which makes feature extraction challenging and leads to severe missed detections in YOLOv11n. In contrast, YOLO-EDH can detect more ore targets, especially in the case of multiple ores, where it can detect most small ore targets with non-low confidence scores. As shown in Figure 10b–d, even when YOLOv11n processes a single ore, YOLO-EDH can still accurately detect targets of different sizes and morphologies, with higher recognition accuracy and more precise bounding box localization. Overall, the YOLO-EDH model performs well in ore detection tasks.
To further evaluate the model’s robustness under challenging conditions, a series of tests focusing on anti-interference capabilities were conducted to simulate the performance in real mining scenarios. The experiment incorporated three types of disturbances: motion blur (columns a and b), dust interference (columns c and d), and low-light conditions (columns e and f). For each category, two representative ore samples covering various mineral types and grades were randomly selected, and the detection outcomes were visually compared with those of the baseline model. The comprehensive results are illustrated in Figure 11.
For motion blur and low-light conditions (columns a, b, e, and f), compared with YOLO11n, YOLO-EDH shows significantly increased confidence, indicating that YOLO-EDH benefits from the attention mechanisms in the EDA module and DSC module. It is capable of effectively addressing mineral classification tasks in blurred and low-light situations, and it retains robust feature extraction abilities even when faced with shaking and dimly lit environments. For dust noise interference (columns c and d), when recognizing ores, YOLOv11n misclassifies dust interference as new ores, while YOLO-EDH accurately identifies the ores with higher confidence than the baseline model. This indicates that YOLO-EDH benefits from the deformable convolutions and dynamic convolutions in the EDA module and DSC module, which can effectively avoid recognition interference caused by dust on the ore surface.
On the whole, when compared with YOLO11n, the enhanced YOLO-EDH boasts better anti-interference performance. It can more efficiently tackle issues like blurriness from vibrations, lens blockages due to dust, and inadequate lighting in real mining settings, thus being better suited for practical use.

5.5. Generalization Experiments

To further demonstrate the cross-domain generalization capabilities of the proposed model, YOLO-EDH was assessed using a public rock imagery dataset [35]. The dataset comprised 1180 images representing common rock types, such as limestone, sandstone, and mudstone. As summarized in Table 5, YOLO-EDH exhibits a 1.2% increase in the mAP50 compared to the baseline YOLOv11n and outperforms the deeper YOLOv11s by 0.9%, while also achieving substantially lower model complexity. Although YOLO-EDH incorporates slightly more parameters than YOLOv11n, it attains improved accuracy with competitive computational efficiency—matching YOLOv11n’s 6.3 FLOPs. This reflects an effective trade-off between detection performance and operational efficiency. Owing to its compact architecture, YOLO-EDH delivers strong results across the evaluation metrics, indicating considerable promise for deployment on resource-limited edge devices.

6. Conclusions

To address issues in current ore detection, such as the missed detection of multi-scale targets, easy misjudgment of similar minerals, and poor adaptability of models to interference from light and dust under complex mining environments, this work constructed a multi-scenario ore dataset in complex environments. It included four types of minerals, namely barite, calcite, fluorite, and pyrite, covering different particle sizes, lighting conditions, and dust interference situations.
Based on the YOLOv11n model, this paper proposes an adaptive ore detection model YOLO-EDH for complex mining environments. Three main improvements are made to the YOLOv11n model. Firstly, an enhanced deformable convolution module is introduced, which combines the ECA attention mechanism to dynamically adjust sampling points and channel weights, optimizing the extraction of irregular ore features and enhancing the focus on key features such as mineral crystal structures and surface textures. Secondly, the DSC module is integrated with the SE attention mechanism into the feature fusion network, strengthening the ability to distinguish similar minerals in terms of spectral and visual features and improving the model’s robustness in heterogeneous environments. In addition, to effectively address the detection challenges of densely stacked ores and small-particle-size mineral veins, the HGAF bidirectional feature fusion module is adopted to replace the traditional feature pyramid structure. This is combined with the WIoU loss function, which improves the detection accuracy for multi-scale targets. Finally, the network structure is optimized through the DSC_C3k2 module, which increases the model’s inference speed while adding a small number of parameters. The experimental results show that, compared with the YOLOv11n model, YOLO-EDH improves the mAP by 1.6 percentage points, reaching 82.4%, and the mAP50-95 by 0.8 percentage points, reaching 67.9%. Meanwhile, the model maintains GFLOPs (6.7) comparable to those of lightweight models, achieving a balance between accuracy and efficiency. Compared with mainstream target detection models, YOLO-EDH has certain advantages in ore detection tasks in complex mining environments, and its modular design also lays a foundation for expansion to multi-modal scenarios. As validated by Ghasrodashti et al. [36] in their research on the fusion of hyperspectral (HSI) and LiDAR data regarding the value of multi-modal classification, the EDA module of YOLO-EDH can enhance the extraction of irregular spatial features, the DSC module improves the adaptability to heterogeneous sensor data, and the HGAF module effectively integrates multi-dimensional features such as spectral and spatial features—all of which are highly consistent with the core requirements of multi-modal fusion. Meanwhile, the principles of dynamic feature adaptation and cross-modal complementarity, emphasized by Du et al. [37] in multi-modal medical image fusion, also provide theoretical support for the modular design of this framework.
This research is expected to provide technical support for intelligent mine construction, improve the ore-sorting efficiency and resource utilization, and reduce manual detection costs. It is worth noting that the YOLO-EDH framework shows strong application potential in multi-modal image classification tasks. In future work, in addition to applying the model to online detection equipment for ore conveyor belts for large-scale onsite verification to determine its stability and reliability in continuous production environments and optimize the dataset and modules according to the actual conditions, we will explore its expansion in multi-modal data fusion scenarios to further exploit its value in cross-modal feature processing.

Author Contributions

Conceptualization, L.W., Z.Q. and X.H.; methodology, X.H. and L.W.; software, L.W. and Z.Q.; validation, L.W. and Z.Q.; resources, Z.Q.; data curation, L.W. and Z.Q.; writing—original draft preparation, L.W.; writing—review and editing, L.W.; visualization, L.W.; supervision, X.H. and Z.Q.; project administration, X.H. and Z.Q.; funding acquisition, X.H. All authors have read and agreed to the published version of the manuscript.

Funding

This research was funded by the National Key Research and Development Program of China (Grant 2020YFB1713700).

Institutional Review Board Statement

Not applicable.

Informed Consent Statement

Not applicable.

Data Availability Statement

The original ore dataset and the YOLO-EDH source code used in this study are publicly available at https://aistudio.baidu.com/dataset/detail/353906/intro (accessed on 26 August 2025) and https://github.com/leilei-beep/YOLO-EDH (accessed on 26 August 2025).

Acknowledgments

The authors acknowledge the Yichun Lithium Battery Research Institute for its support in providing instrumentation and research infrastructure. We are also grateful to the reviewers for their insightful comments, which significantly enhanced the clarity and quality of this article. Furthermore, we extend our sincere thanks to Joseph Redmon and his colleagues for their seminal work on the YOLO architecture, which provided essential foundations for our study. The successful completion of this research would not have been possible without the generous support of several individuals and organizations. The authors would like to express their most sincere gratitude. We extend our special thanks to Qiu Zhenzhong from Jiangxi Yongcheng Lithium Technology Co., Ltd. and Mei Xiaofang from Yifeng Yongzhou Lithium Industry Technology Co., Ltd. for their invaluable data resources and strong support during the dataset collection phase. Their assistance laid a solid foundation for the empirical work of this study. Furthermore, we are grateful to the Yichun Lithium Battery New Energy Industry Research Institute for its professional technical guidance and collaboration throughout this research. Their profound industry insights provided significant inspiration for the project. Lastly, we would like to express our heartfelt appreciation to all the institutions and individuals who have supported this work.

Conflicts of Interest

The authors declare no conflicts of interest.

Abbreviations

The following abbreviations are used in this manuscript:
C3k2Cross-Stage Partial Bottleneck with Convolution 3 and Kernel Size 2
SPPFSpatial Pyramid Pooling Fast
C2PSAConvolutional Block with Parallel Spatial Attention
C2fCSPDarknet53 with 2 Fusion Layers

References

  1. Al-Batah, M.S.; Isa, N.A.M.; Zamli, K.Z.; Sani, Z.M.; Azizli, K.A. A novel aggregate classification technique using moment invariants and cascaded multilayered perceptron network. Int. J. Miner. Process. 2009, 92, 92–102. [Google Scholar] [CrossRef]
  2. Murtagh, F.; Starck, J.L. Wavelet and curvelet moments for image classification: Application to aggregate mixture grading. Pattern Recognit. Lett. 2008, 29, 1557–1564. [Google Scholar] [CrossRef]
  3. Tessier, J.; Duchesne, C.; Bartolacci, G. A machine vision approach to on-line estimation of run-of-mine ore composition on conveyor belts. Miner. Eng. 2007, 20, 1129–1144. [Google Scholar] [CrossRef]
  4. Donskoi, E.; Suthers, S.; Campbell, J.; Raynlyn, T. Modelling and optimization of hydrocyclone for iron ore fines beneficiation—Using optical image analysis and iron ore texture classification. Int. J. Miner. Process. 2008, 87, 106–119. [Google Scholar] [CrossRef]
  5. Oestreich, J.; Tolley, W.; Rice, D. The development of a color sensor system to measure mineral compositions. Miner. Eng. 1995, 8, 31–39. [Google Scholar] [CrossRef]
  6. McCoy, J.T.; Auret, L. Machine learning applications in minerals processing: A review. Miner. Eng. 2019, 132, 95–109. [Google Scholar] [CrossRef]
  7. Jooshaki, M.; Nad, A.; Michaux, S. A systematic review on the application of machine learning in exploiting mineralogical data in mining and mineral industry. Minerals 2021, 11, 816. [Google Scholar] [CrossRef]
  8. Yang, X.; Li, Y.; Chen, J.; Chen, P.; Xie, S.; Song, S. Surface iso-transformation and floatability of calcite and fluorite. Miner. Eng. 2024, 216, 108855. [Google Scholar] [CrossRef]
  9. Khanam, R.; Hussain, M. Yolov11: An overview of the key architectural enhancements. arXiv 2024, arXiv:2410.17725. [Google Scholar] [CrossRef]
  10. Chen, Z.; He, Z.; Lu, Z.M. DEA-Net: Single image dehazing based on detail-enhanced convolution and content-guided attention. IEEE Trans. Image Process. 2024, 33, 1002–1015. [Google Scholar] [CrossRef] [PubMed]
  11. Redmon, J.; Divvala, S.; Girshick, R.; Farhadi, A. You only look once: Unified, real-time object detection. In Proceedings of the IEEE Conference on Computer Vision and Pattern Recognition, Las Vegas, NV, USA, 27–30 June 2016; pp. 779–788. [Google Scholar]
  12. Yurtsever, E.; Lambert, J.; Carballo, A.; Takeda, K. A survey of autonomous driving: Common practices and emerging technologies. IEEE Access 2020, 8, 58443–58469. [Google Scholar] [CrossRef]
  13. Abba, S.; Bizi, A.M.; Lee, J.A.; Bakouri, S.; Crespo, M.L. Real-time object detection, tracking, and monitoring framework for security surveillance systems. Heliyon 2024, 10, e34922. [Google Scholar] [CrossRef]
  14. Yang, R.; Yu, Y. Artificial convolutional neural network in object detection and semantic segmentation for medical imaging analysis. Front. Oncol. 2021, 11, 638182. [Google Scholar] [CrossRef]
  15. Li, Y.; Zhou, Z.; Pan, Y. YOLOv11-BSS: Damaged Region Recognition Based on Spatial and Channel Synergistic Attention and Bi-Deformable Convolution in Sanding Scenarios. Electronics 2025, 14, 1469. [Google Scholar] [CrossRef]
  16. Tian, Z.; Yang, F.; Yang, L.; Wu, Y.; Chen, J.; Qian, P. An Optimized YOLOv11 Framework for the Efficient Multi-Category Defect Detection of Concrete Surface. Sensors 2025, 25, 1291. [Google Scholar] [CrossRef]
  17. Maity, M.; Banerjee, S.; Chaudhuri, S.S. Faster r-cnn and yolo based vehicle detection: A survey. In Proceedings of the 2021 5th International Conference on Computing Methodologies and Communication (ICCMC); IEEE: Piscataway, NJ, USA, 2021; pp. 1442–1447. [Google Scholar]
  18. Torre, V.; Poggio, T.A. On edge detection. IEEE Trans. Pattern Anal. Mach. Intell. 1986, 8, 147–163. [Google Scholar] [CrossRef]
  19. Qiu, Z.; Huang, X.; Li, S.; Wang, J. Stellar-YOLO: A Graphite Ore Grade Detection Method Based on Improved YOLO11. Symmetry 2025, 17, 966. [Google Scholar] [CrossRef]
  20. Dai, J.; Qi, H.; Xiong, Y.; Li, Y.; Zhang, G.; Hu, H.; Wei, Y. Deformable convolutional networks. In Proceedings of the IEEE International Conference on Computer Vision, Venice, Italy, 22–29 October 2017; pp. 764–773. [Google Scholar]
  21. Wang, Q.; Wu, B.; Zhu, P.; Li, P.; Zuo, W.; Hu, Q. ECA-Net: Efficient channel attention for deep convolutional neural networks. In Proceedings of the IEEE/CVF Conference on Computer Vision and Pattern Recognition, Seattle, WA, USA, 13–19 June 2020; pp. 11534–11542. [Google Scholar]
  22. Chen, Y.; Dai, X.; Liu, M.; Chen, D.; Yuan, L.; Liu, Z. Dynamic convolution: Attention over convolution kernels. In Proceedings of the IEEE/CVF Conference on Computer Vision and Pattern Recognition, Seattle, WA, USA, 13–19 June 2020; pp. 11030–11039. [Google Scholar]
  23. Attallah, Y. Minerals Identification & Classification. 2023. Available online: https://www.kaggle.com/datasets/youcefattallah97/minerals-identification-classification (accessed on 8 March 2022).
  24. Jiang, T.; Zhong, Y. ODverse33: Is the New YOLO Version Always Better? A Multi Domain benchmark from YOLO v5 to v11. arXiv 2025, arXiv:2502.14314. [Google Scholar]
  25. Yang, D.; Miao, C.; Liu, Y.; Wang, Y.; Zheng, Y. Improved foreign object tracking algorithm in coal for belt conveyor gangue selection robot with YOLOv7 and DeepSORT. Measurement 2024, 228, 114180. [Google Scholar] [CrossRef]
  26. Wang, W.; Zhao, Y.; Xue, Z. YOLOv8-Coal: A coal-rock image recognition method based on improved YOLOv8. PeerJ Comput. Sci. 2024, 10, e2313. [Google Scholar] [CrossRef]
  27. Wang, C.Y.; Yeh, I.H.; Mark Liao, H.Y. Yolov9: Learning what you want to learn using programmable gradient information. In Proceedings of the European Conference on Computer Vision, Milan, Italy, 29 September–4 October 2024; Springer: Cham, Switzerland, 2024; pp. 1–21. [Google Scholar]
  28. Wang, A.; Chen, H.; Liu, L.; Chen, K.; Lin, Z.; Han, J. Yolov10: Real-time end-to-end object detection. Adv. Neural Inf. Process. Syst. 2024, 37, 107984–108011. [Google Scholar]
  29. Tian, Y.; Ye, Q.; Doermann, D. Yolov12: Attention-centric real-time object detectors. arXiv 2025, arXiv:2502.12524. [Google Scholar]
  30. He, K.; Zhang, X.; Ren, S.; Sun, J. Deep residual learning for image recognition. In Proceedings of the IEEE Conference on Computer Vision and Pattern Recognition, Las Vegas, NV, USA, 27–30 June 2016; pp. 770–778. [Google Scholar]
  31. Meivel, S.; Devi, K.I.; Subramanian, A.S.; Kalaiarasi, G. Remote sensing analysis of the lidar drone mapping system for detecting damages to buildings, roads, and bridges using the faster cnn method. J. Indian Soc. Remote Sens. 2025, 53, 327–343. [Google Scholar] [CrossRef]
  32. Peng, H.; Li, Z.; Zhou, Z.; Shao, Y. Weed detection in paddy field using an improved RetinaNet network. Comput. Electron. Agric. 2022, 199, 107179. [Google Scholar] [CrossRef]
  33. Feng, C.; Zhong, Y.; Gao, Y.; Scott, M.R.; Huang, W. Tood: Task-aligned one-stage object detection. In Proceedings of the 2021 IEEE/CVF International Conference on Computer Vision (ICCV), IEEE Computer Society, Montreal, QC, Canada, 10–17 October 2021; pp. 3490–3499. [Google Scholar]
  34. Zhao, Y.; Lv, W.; Xu, S.; Wei, J.; Wang, G.; Dang, Q.; Liu, Y.; Chen, J. Detrs beat yolos on real-time object detection. In Proceedings of the IEEE/CVF Conference on Computer Vision and Pattern Recognition, Seattle, WA, USA, 16–22 June 2024; pp. 16965–16974. [Google Scholar]
  35. Open Source Toolkit. Rock Classification Dataset. 2023. Available online: https://gitcode_com.jxust.opac.vip/open-source-toolkit/7d489 (accessed on 12 May 2025).
  36. Ghasrodashti, E.K.; Adibi, P.; Karshenas, H.; Kashani, H.B.; Chanussot, J. Multimodal Image Classification Based on Convolutional Network and Attention-Based Hidden Markov Random Field. IEEE Trans. Geosci. Remote Sens. 2025, 63, 1–14. [Google Scholar] [CrossRef]
  37. Du, J.; Li, W.; Lu, K.; Xiao, B. An overview of multi-modal medical image fusion. Neurocomputing 2016, 215, 3–20. [Google Scholar] [CrossRef]
Figure 1. Architectural overview of YOLOv11 model, where the symbols w and r denote the width factor and the ratio, respectively.
Minerals 15 00952 g001
Figure 2. A schematic diagram of the YOLO-EDH network architecture.
Minerals 15 00952 g002
Figure 3. Compares the structural differences between a standard convolution kernel and a deformable variant. (a) displays the fixed, uniform sampling grid of a conventional kernel, while (b) illustrates the adaptive sampling mechanism of deformable convolution. Blue circles mark the predefined positions in regular convolution, and green circles indicate the dynamically shifted sampling points resulting from predicted offsets. Accompanying arrows visualize the direction and magnitude of these adaptive adjustments.
Minerals 15 00952 g003
Figure 4. A schematic diagram of the 3 × 3 deformable convolution module.
Minerals 15 00952 g004
Figure 5. Schematic diagram of the ECA structure.
Minerals 15 00952 g005
Figure 6. Schematic diagram of dynamic convolution structure.
Minerals 15 00952 g006
Figure 7. Sample Data of Mineral Specimens.
Minerals 15 00952 g007
Figure 8. The training curves of YOLOv11n, YOLOv12n, and YOLO-EDH (a) mAP-epochs curve (b) loss-epochs curve.
Minerals 15 00952 g008
Figure 9. Results of comparison with other mainstream models and other YOLO models. (a) mAP–epochs curve; (b) mAP50-95–epochs curve.
Minerals 15 00952 g009
Figure 10. Performance comparison: before vs. after enhancement. (a) Pyrite, (b) barite, (c) calcite, (d) fluorite. Compared with the base model YOLOv11n, YOLO-EDH can identify all pyrite ores in the image with no loss in confidence. For barite ores, the confidence is increased by 0.25; for calcite ores, it is increased by 0.24; and, for fluorite ores, it is increased by 0.04.
Minerals 15 00952 g010
Figure 11. Visual comparison of anti-interference results, where columns (a,b) denote motion blur, (c,d) denote dust noise, and (e,f) denote low brightness.
Minerals 15 00952 g011
Table 1. Training parameter configuration.
Parameter NameParameter Value
Training Epochs300
Learning Rate0.01
Batch Size32
OptimizerSGD
Optimizer Momentum0.937
Optimizer Weight Decay0.0005
Input Size 640 × 640
Table 2. Ablation Study Results Comparison.
EDADSCHGAFP (%)R (%)mAP50 (%)mAP50-95 (%)F1 Score (%)Params (/106)Inference (ms)
×××78.270.780.867.174.272.64.7
××78.671.381.567.674.772.75.1
××78.871.581.767.874.972.84.6
××78.471.081.267.474.522.64.9
79.172.382.467.975.553.25.2
Table 3. Comparison results with other mainstream models and other YOLO models.
AlgorithmPrecision (P)Recall (R)mAP (%)mAP50-95 (%)F1-ScoreParams (/106)Inference (ms)FLOPSLayers
YOLOv5n [24]78.769.378.764.773.712.503.17.2262
YOLOv7n [25]77.970.179.865.873.813.123.26.9250
YOLOv8n [26]75.771.980.567.073.763.013.16.8245
YOLOv9t [27]78.571.281.067.474.702.6511.810.81212
YOLOv10n [28]78.170.580.266.574.132.704.38.2368
YOLOv11n78.270.780.867.174.272.584.76.7319
YOLOv12n [29]68.177.978.264.672.712.858.17.0497
YOLO-EDH79.172.382.467.975.553.205.26.7386
Table 4. Results of comparison with other popular detection models.
AlgorithmInput SizePrecision (P)Recall (R)mAP (%)F1-ScoreParams (M)FLOPS (G)
Faster R-CNN [31]600 × 60072.368.575.270.3642.6370.2
RetinaNet [32]600 × 60075.072.581.173.719.7134.1
TOOD [33]1024 × 102480.573.682.876.831.4172.1
RT-DETR-L [34]1024 × 102479.872.882.376.133.8103.4
YOLOv11n640 × 64078.270.780.874.272.586.7
YOLO-EDH640 × 64079.172.382.475.553.206.7
Table 5. Results of comparisons grounded on other datasets.
AlgorithmPrecision (P)Recall (R)mAP (%)F1-ScoreParams (/106)FLOPS
YOLOv11n65.856.565.360.82.66.3
YOLOv11s69.260.865.664.79.421.3
YOLOv12n67.855.765.461.22.56.2
YOLO-EDH68.856.066.561.73.16.3
Disclaimer/Publisher’s Note: The statements, opinions and data contained in all publications are solely those of the individual author(s) and contributor(s) and not of MDPI and/or the editor(s). MDPI and/or the editor(s) disclaim responsibility for any injury to people or property resulting from any ideas, methods, instructions or products referred to in the content.