Article

Enrichment and Fractionation of Rare Earth Elements in High-Altitude Thick Weathered Crust Elution-Deposited Rare Earth Ore

1
Xingfa School of Mining Engineering, Wuhan Institute of Technology, Wuhan 430073, China
2
Key Laboratory for Green Chemical Process of Ministry of Education, Wuhan Institute of Technology, Wuhan 430073, China
3
State Key Laboratory of Green and Efficient Development of Phosphorus Resources, Wuhan 430073, China
4
Hubei Three Gorges Laboratory, Yichang 443007, China
*
Author to whom correspondence should be addressed.
Minerals 2025, 15(9), 932; https://doi.org/10.3390/min15090932 (registering DOI)
Submission received: 6 July 2025 / Revised: 4 August 2025 / Accepted: 28 August 2025 / Published: 1 September 2025
(This article belongs to the Section Mineral Processing and Extractive Metallurgy)

Abstract

Weathered crust elution-deposited rare earth ores (WCE-REOs) are the primary global source of medium and heavy rare earth elements (M/HREEs). The recent discovery of high-altitude (1500–2500 m) WCE-REOs in southern Yunnan Province, China, presents new opportunities for the development of M/HREE resources. This study investigates the enrichment and fractionation mechanisms of rare earth elements (REEs) in these deposits through a systematic analysis of three representative weathering profiles associated with the Lincang granite batholith. The analytical results indicate that the profiles consist mainly of clay minerals (kaolinite, halloysite, illite, minor montmorillonite) and iron oxides, with high SiO2 (64.10–74.40 wt.%) and Al2O3 (15.50–20.20 wt.%) and low CaO/MgO—typical of weathered REE deposits. The total REE contents (238.12–1545.53 ppm) show distinct fractionation: LREE-enriched upper layers and HREE-enriched deeper zones. Sequential extraction revealed that the REEs in the Lincang granite weathering profiles predominantly occur in ion-exchangeable, residual, and iron-manganese oxide-bound states (>95% total REEs). Ion-exchangeable REEs showed depth-dependent enrichment (peaking at 819.96 ppm), while iron-manganese oxides exhibited a strong REE affinity (up to 47% total REEs), with amorphous phases that were preferentially enriched in Ce (partitioning >80%). Fissure systems exerted critical control over the redistribution of elements, particularly REEs.

1. Introduction

In recent years, the rapid advancement of renewable energy, electronics, and defense technologies has significantly increased the global demand for rare earth elements (REEs), particularly medium and heavy rare earth elements (M/HREEs) [1,2]. M/HREEs possess exceptional economic value due to their indispensable roles in high-tech industries, including their use in permanent magnets, laser crystals, and nuclear energy applications [3,4]. Weathered crust elution-deposited rare earth ores (WCE-REOs) constitute the predominant global source of M/HREEs. The formation of WCE-REOs is contingent upon three fundamental conditions: (1) the presence of REEs in parent rocks, which is their primary source; (2) the occurrence of REEs within weatherable minerals in the parent rocks, a prerequisite for deposit formation; and (3) exposure to warm, humid climates that promote biological, physical, and chemical weathering and thus provide the necessary environmental context [5,6]. The prevailing conditions tend to concentrate substantial WCE-REO deposits within tropical to subtropical zones between 28° N and 28° S. However, the recent discovery of super-large, thick WCE-REOs at high elevations (1500–2500 m) in southern Yunnan Province confirms this conventional geographic limitation. Although these deposits predominantly display light REE-enriched patterns, they contain significantly elevated concentrations of critical M/HREEs (e.g., Gd, Tb, Dy) compared to conventional deposits and thereby present novel prospects for M/HREE resource acquisition.
Concurrently, low-altitude WCE-REOs are experiencing resource depletion due to prolonged exploitation. In contrast, the recently identified super-large WCE-REOs in southern Yunnan are distinguished by high elevations (1500–2500 m) and unusually thick weathering crusts [7,8]. As depicted in Figure 1a–c, the Lincang granite batholith—Southwest China’s largest composite intrusion, covering approximately 7400 km2—exhibits an inverse-S shape that is aligned with the Lancang River fault zone. This batholith is primarily composed of Indosinian biotite monzogranite and granodiorite, being dated to approximately 215–238 Ma, and can be subdivided into northern, central, and southern segments [9,10]. The porphyritic, medium- to coarse-grained biotite monzogranite found in the central and southern segments serves as the principal ore-forming parent rock [11,12].
REE enrichment in the weathering crust shows strong topographic control, with significant accumulation occurring from mid-slope to summit positions in gentle terrains and low hills and forming economically viable WCE-REO deposits [14]. The batholith’s complex magmatic evolution, coupled with favorable geomorphological conditions, provides both the material source and the preservation environment necessary for REE mineralization [15,16].
Although numerous studies have explored these deposits, critical gaps remain in understanding the occurrence states and migration-enrichment behaviors of REEs in this region [4]. The current understanding suggests that REE fractionation in weathering crusts primarily involves the following: dissolution of REE-bearing minerals, formation of secondary REE minerals, complexation with organic and inorganic ligands, adsorption by minerals, surface precipitation, and redox reactions. While previous studies have established the general processes of REE fractionation in weathering crusts (e.g., dissolution, adsorption, redox reactions), the mechanisms that control vertical fractionation patterns in high-altitude, thick weathering crusts remain poorly understood [17,18,19,20,21]. Prior work has rarely addressed the role of fissure systems in REE redistribution or quantified the partitioning of REEs among different phases (e.g., amorphous vs. crystalline iron-manganese oxides) in such settings.
The effective exploitation of high-altitude WCE-REOs necessitates a comprehensive understanding of the speciation and fractionation dynamics of REEs for extraction strategies to be developed. This study focuses on three representative deposits in the Lincang region, analyzing the physicochemical properties of their weathering profiles—including their clay mineral composition—and investigating REE distribution patterns, occurrence states, and fractionation behaviors. The research aims to enhance understanding of REE migration and fractionation mechanisms, thereby contributing to improved resource potential assessments and guiding future exploration efforts.

2. Sampling and Analytical Methods

2.1. Sample Characteristics

2.1.1. Mineral Composition Analysis

Samples were collected from the humic, completely weathered, and partly weathered layers of various weathering profiles located at high altitudes. A comprehensive overview of the sampling conditions for each site is provided in Table 1.

2.1.2. Parent Rock Characterization

The main rock body in the central segment of the Lincang granite in the Lincang-Menghai area consists of Late Triassic biotite monzogranite, including medium- to fine-grained biotite monzogranite, medium- to coarse-grained biotite monzogranite, and porphyritic biotite monzogranite, which serve as the natural parent rocks for WCE-REO deposits [22].
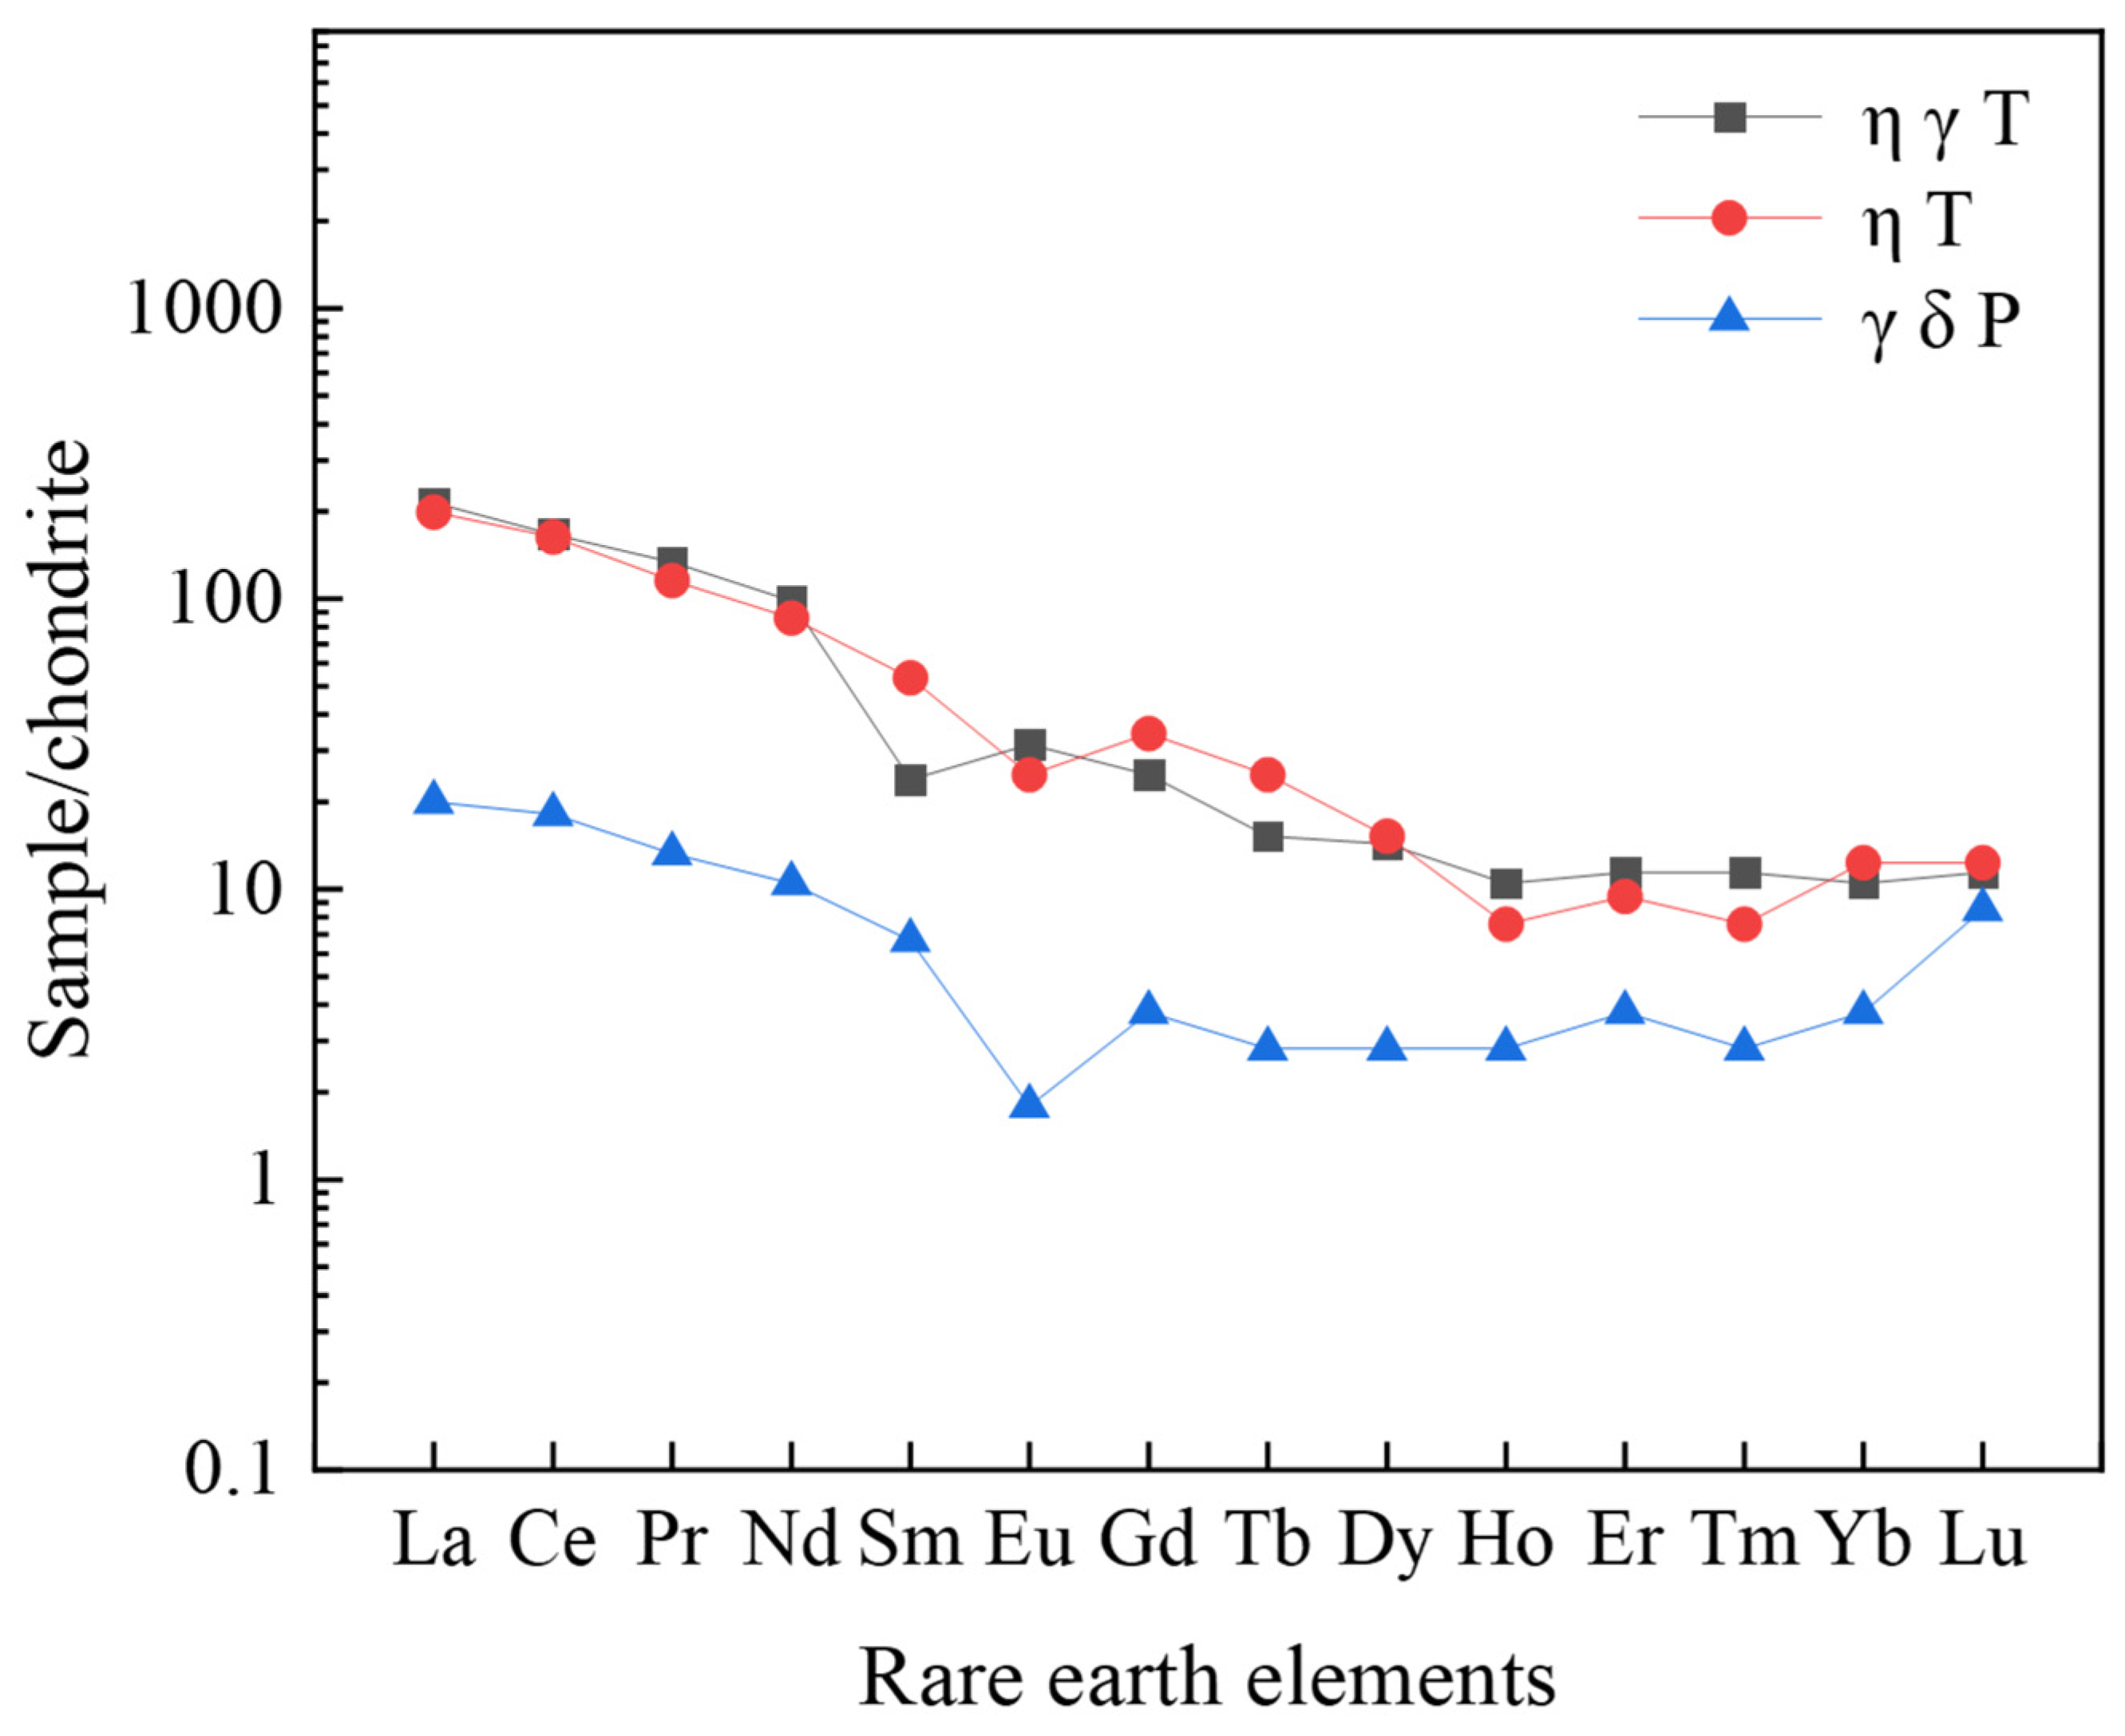
The parent rocks are enriched in REE-bearing minerals such as sphene, allanite, apatite, monazite, xenotime, and zircon, exhibiting high silicon, high potassium, and low iron and magnesium, with ΣREE > 150 ppm and a relative enrichment of light rare earth elements (LREEs: La, Ce, Pr, Nd, Sm, Eu) [23,24]. As shown in Table 2, the Lincang bedrock displays a high total REE content and significant LREE/HREE fractionation, so it is classified as LREE-enriched. The REE distribution pattern exhibits a right-leaning curve with slight to moderate depletion and is characterized by an LREE-enriched right-inclined distribution profile, where the LREE segment shows a steep slope, while the HREE (HREEs: Gd, Tb, Dy, Ho, Er, Tm, Yb, Lu, Y) segment appears nearly flat and gently inclined (Figure 2) [8].

2.2. Analysis Method

2.2.1. Mineral Composition

Clay minerals were extracted from the ore samples using a natural sedimentation method based on Stokes’ law. The mineral composition and content were analyzed using X-ray diffraction (XRD). Qualitative and semi-quantitative analyses of the clay minerals were conducted in accordance with the standard “X-ray Diffraction Analysis Methods for Clay Minerals and Common Non-Clay Minerals in Sedimentary Rocks” (SY/T 5163–2010) [25]. The clay minerals, including kaolinite, halloysite, illite, and montmorillonite (with kaolinite and halloysite belonging to the kaolinite group), are abbreviated as Kao, Hal, It, and S, respectively.
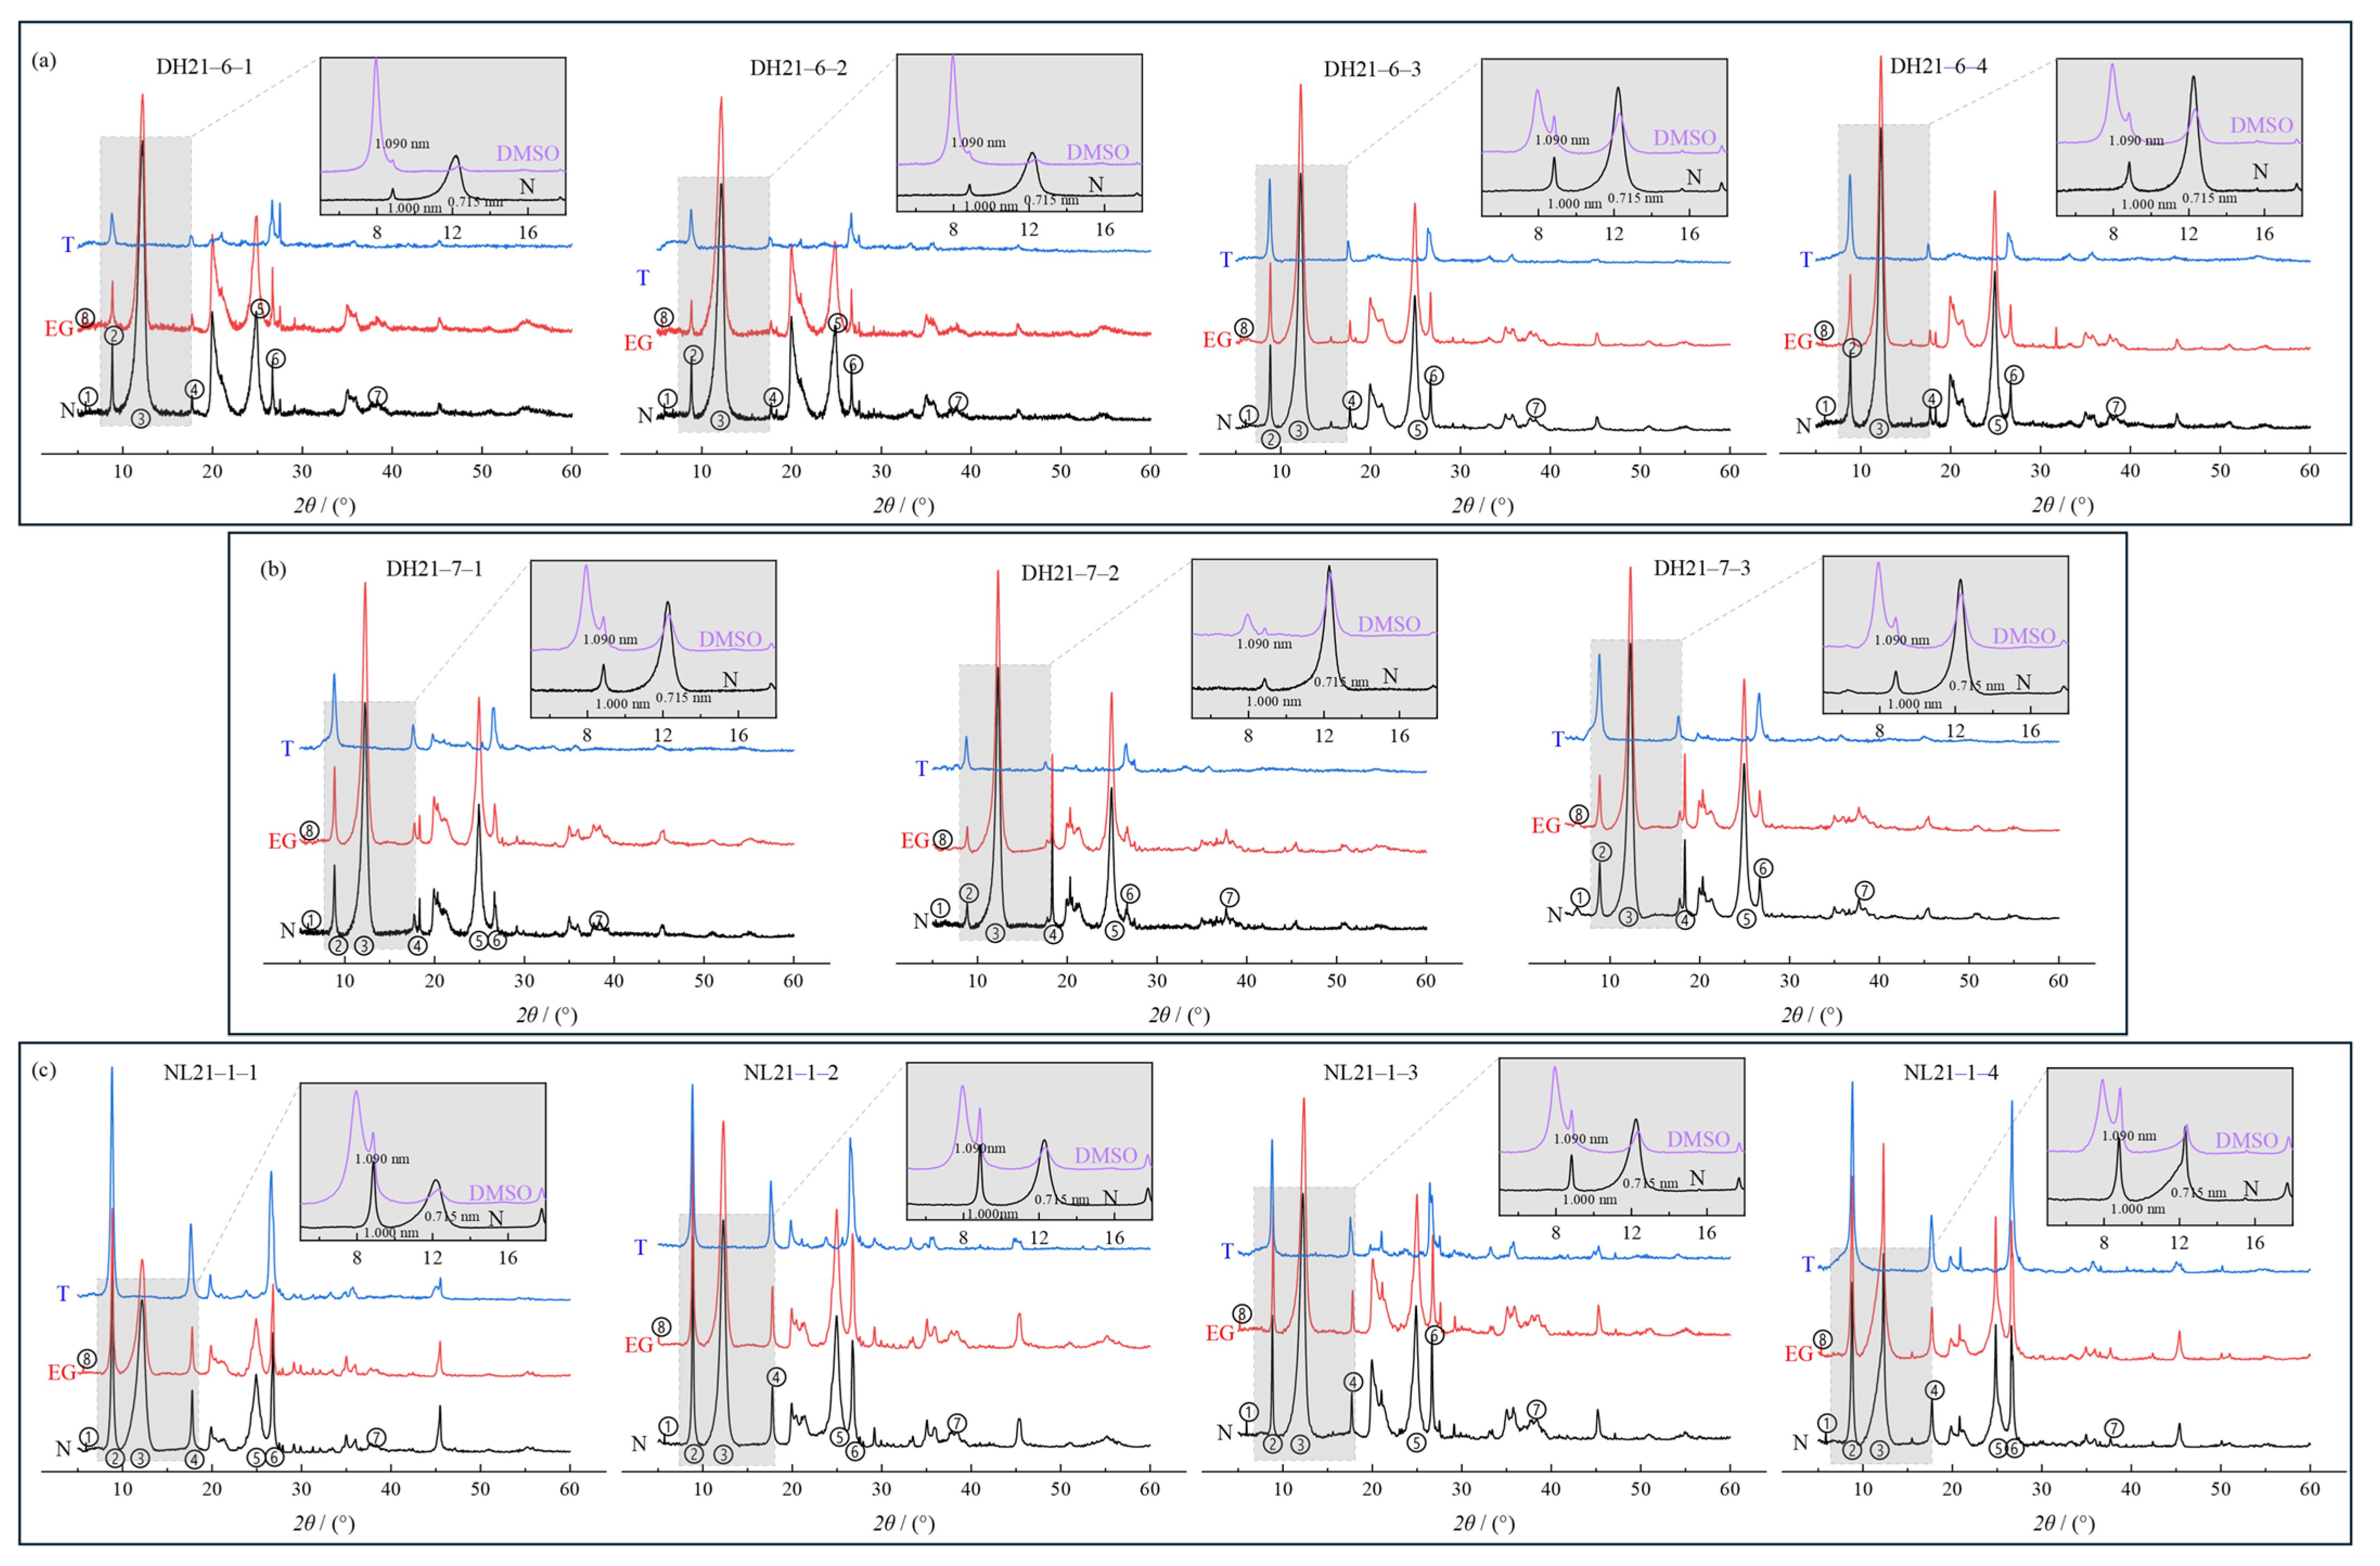
The X-ray diffraction (XRD) analysis results for clay minerals from the weathering profiles are shown in Figure 3a–c. The characteristic diffraction peaks for air-dried, oriented kaolinite group minerals (denoted as N flakes) occur at d001 = 0.715 nm, d002 = 0.357 nm, and d003 = 0.234 nm, corresponding to peaks 3, 5, and 7. Notably, these peaks disappear after heating at 550 °C for 2 h, which indicates thermal alteration of the kaolinite. Illite (It) minerals exhibit characteristic peaks at d001 = 1.000 nm, d002 = 0.500 nm, and d003 = 0.333 nm, with the d002 peak intensity being approximately one-third of that of d001, corresponding to peaks 2, 4, and 6. Montmorillonite (S) is identified by a variable d001 peak near 1.500 nm, appearing as the weak peak 1.
After ethylene glycol vapor treatment, a leftward shift of the d001 peak (peak 8 in Figure 3a–c) was observed, which indicated an increase in interlayer spacing due to the intercalation of ethylene glycol molecules. The intensities and heights of the diffraction peaks were quantified by subtracting background noise, which enabled the use of the K-value method for semi-quantitative mineral assessment. Dimethyl sulfoxide (DMSO) can penetrate the 0.7 nm interlayers of illite, forming intercalated complexes that expand the (001) layer spacing, which it cannot do to the unaltered structure of kaolinite [26]. This property allows for effective differentiation and semi-quantitative analysis of kaolinite and illite using DMSO-saturation treatment, as illustrated in Figure 4a–c.

2.2.2. Major and Trace Element Analysis

(1)
Dried samples were crushed, ground, and passed through a 200-mesh standard sieve. The major chemical components were analyzed using X-ray fluorescence spectrometry (XRF).
(2)
Finely ground samples (<200 mesh) were precisely weighed and subjected to acid digestion and dilution. REEs and other trace elements were then quantified using inductively coupled plasma mass spectrometry (ICP-MS).
The Ce and Eu anomalies (δCe and δEu) were calculated using chondrite-normalized values to quantify their geochemical fractionation. The δCe is defined as δ Ce = Ce Ce * = Ce N La N · Pr N , where Ce* represents the expected Ce concentration in the absence of anomalies and CeN, LaN, and PrN are chondrite-normalized values of their respective elements. Similarly, δEu is calculated as δ Eu = Eu Eu * = Eu N Sm N · Gd N , where Eu* is the expected Eu concentration and EuN, SmN, and GdN are the chondrite-normalized values of their respective elements. Following conventional interpretation, values of δCe or δEu < 0.95 indicate negative anomalies, while values > 1.05 indicate positive anomalies.

2.2.3. Analysis of REE Occurrence States

A seven-step sequential extraction method was employed to quantify REE occurrence states: (1) water-soluble and ion-exchangeable (1 mol/L MgCl2, pH 7, 25 °C), (2) carbonate-bound (1 mol/L CH3COONa, pH 5), (3) humic acid-bound (0.1 mol/L Na4P2O7, pH 10), (4) amorphous iron-manganese oxide-bound (0.25 mol/L NH2OH·HCl in 0.25 mol/L HCl, 60 °C), (5) crystalline iron-manganese oxide-bound (1 mol/L NH2OH·HCl in 25% CH3COOH, 90 °C), (6) strongly organic-bound (HNO3-H2O2, 85 °C), and (7) residual (HF-HClO4 digestion). To ensure fraction specificity, each step included rigorous rinsing with deionized water (3×) after filtration to remove residual reagents. Filter membranes (0.45 μm) and labware were acid-washed between steps. Procedural blanks and certified reference materials (GBW07441–GBW07445) were analyzed to validate minimal cross-contamination (<3% REE carryover between fractions) [27].

2.2.4. Analysis of Abrasion pH in Weathering Crust

Approximately 10 g of randomly selected ore samples was passed through a 20-mesh sieve and placed in a beaker. Then, 25 mL of secondary ultrapure water was added and stirred to achieve homogeneous solid–liquid mixing. The mixture was continuously agitated using a constant-speed mechanical stirrer for 2 min, which was followed by 30 min of standing. Finally, the pH of the turbid liquid was measured with a pH meter (METTLER TOLEDO, Columbus, USA, three consecutive measurements were taken and averaged) to determine the abrasion pH value.

2.2.5. Mineral Morphology Characterization

The microscopic morphological characteristics of secondary minerals (e.g., clay minerals and iron oxides) in fine-grained fractions were characterized using field emission scanning electron microscopy with energy-dispersive X-ray spectroscopy (FESEM-EDS). These secondary minerals play a crucial role in rare earth element (REE) adsorption and fractionation within weathering profiles. The analyses were conducted on gold-coated samples using a JEOL JSM-5510LV scanning electron microscope (JEOL Ltd., Tokyo, Japan), which allowed us to acquire high-resolution secondary electron images coupled with EDS elemental mapping and point analysis.

3. Results and Discussion

3.1. Mineralogical Analysis of Weathering Profiles

3.1.1. Patterns of Mineral Composition and Content Changes in Weathering Profiles

As illustrated in Figure 4a–c and Table 3, the clay mineral compositions across various weathering profiles are consistent, being primarily composed of kaolinite, illite, and halloysite with trace montmorillonite, although their relative abundances vary with the depth. With increasing depth, the proportion of 1:1 kaolinite group minerals tends to decrease slightly, while the proportion of 2:1 minerals such as montmorillonite and illite increases. For example, in profiles DH21–6 and DH21–7, the kaolinite content shows a trend of increasing and then decreasing (from 5.86% to 42.44% to 34.33% and from 33.15% to 75.72% to 43.03%, respectively), while illite exhibits the opposite trend. In profile NL21–1, the kaolinite content continuously increases (from 13.38% to 32.01%) as the halloysite content decreases (from 81.66% to 66.21%).
Kaolinite and illite are more abundant in the upper sections of the weathering profiles, while illite predominantly occurs in the lower parts of the completely weathered layer. Variations in clay mineral content are primarily influenced by the composition of the parent rock and the dynamics of the water medium [28]. As the depth increases, the degree of weathering and the leaching intensity decline and the bedrock disintegration diminishes. This reduction in water movement and leaching capacity hinders the removal of alkali elements such as K, Na, and Ca, thereby promoting the formation of illite and montmorillonite in deeper layers [29].
As the weathering intensifies from the lower partly weathered layers toward the upper completely weathered layers, enhanced water mobility facilitates alkali leaching, which favors the formation of 1:1 kaolinite group minerals. Consequently, 2:1 minerals like illite and montmorillonite in the lower layers gradually transform into kaolinite and illite. This transition, coupled with oxidative leaching, leads to desilicification and alumina enrichment in kaolinite and illite, resulting in the formation of small quantities of layered trioctahedral alumina trihydrate at the topsoil layer, as well as limited hematite through the crystallization of iron oxides [30].

3.1.2. Weathering Degree of the Weathering Profile and Distribution Patterns of Major Elements

The chemical composition of the ore samples was determined using X-ray fluorescence (XRF) spectroscopy, as summarized in Table 4 and illustrated in Figure 5 and Figure 6.
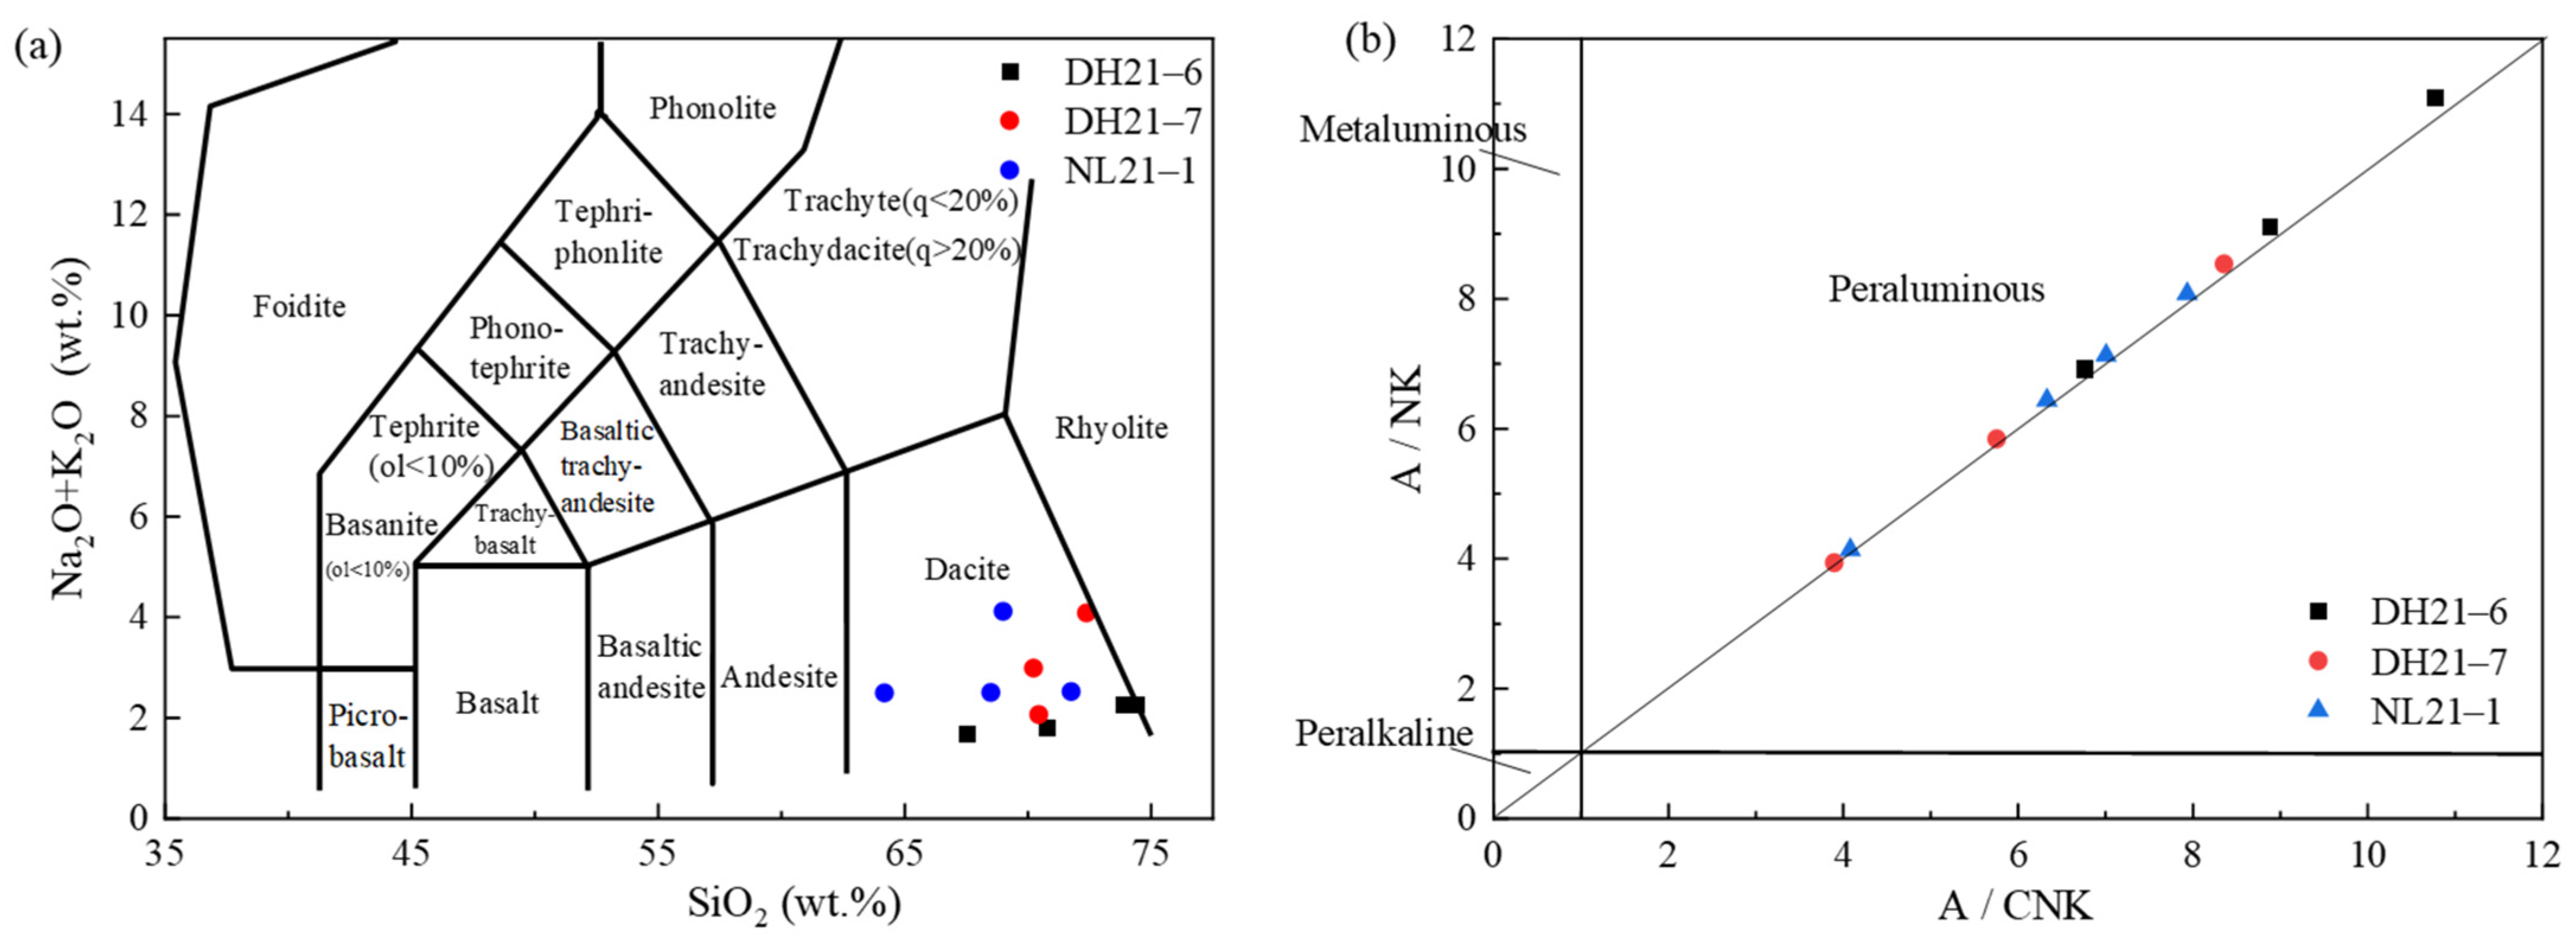
Table 4 presents the major element compositions of the weathering profiles DH21–6, DH21–7, and NL21–1. The original ores in these profiles contain 64.17–74.39 wt.% SiO2, 15.57–20.20 wt.% Al2O3, and 1.60–3.97 wt.% K2O. The concentrations of Na2O and CaO are relatively low, ranging from 0.03 to 0.16 wt.% and from 0.04 to 0.06 wt.%, respectively. The MgO content ranges from 0.45 to 0.90 wt.% and the total iron (TFe2O3) ranges from 2.05 to 4.11 wt.%, with a loss on ignition (LOI) between 4.32 and 6.77 wt.%. The total alkali content ( ALK   =   Na 2 O   +   K 2 O ) falls between 1.68 and 2.27 wt.%, and the Na2O/K2O ratios are consistently below 1, ranging from 0.018 to 0.045. The SiO2–K2O relationship suggests that the rocks belong to the high-potassium calc-alkaline and calc-alkaline series.
The TAS (total alkali-silica) diagram classifies igneous rocks based on their Na2O + K2O versus their SiO2 content, while the A/NK (Al2O3/(Na2O + K2O)) versus A/CNK (Al2O3/(CaO + Na2O + K2O)) diagram is used to evaluate the peraluminosity and alteration degree of weathered materials. These abbreviations are standard in geochemical classification: A = Al2O3, N = Na2O, K = K2O, C = CaO. The diagrams help characterize the protolith composition and weathering intensity of the REE-bearing profiles. Although the TAS diagram position (Figure 5a) reflects the composition of the granite source rock, the significant loss of alkaline elements during weathering must be taken into account. In contrast, the consistently high A/NK (3.90–11.10) and A/CNK (3.80–10.80) ratios (Figure 5b) indicate the enrichment of aluminum relative to the mobile cations (Na, K, Ca), which is consistent with late-stage weathering characteristics under tropical conditions. Furthermore, Figure 5b shows that the aluminum saturation index values (A/NK) exceed 3.5, ranging from 3.90 to 11.10, while the A/CNK values range from 3.80 to 10.80, confirming the presence of peraluminous granitic rocks [31].
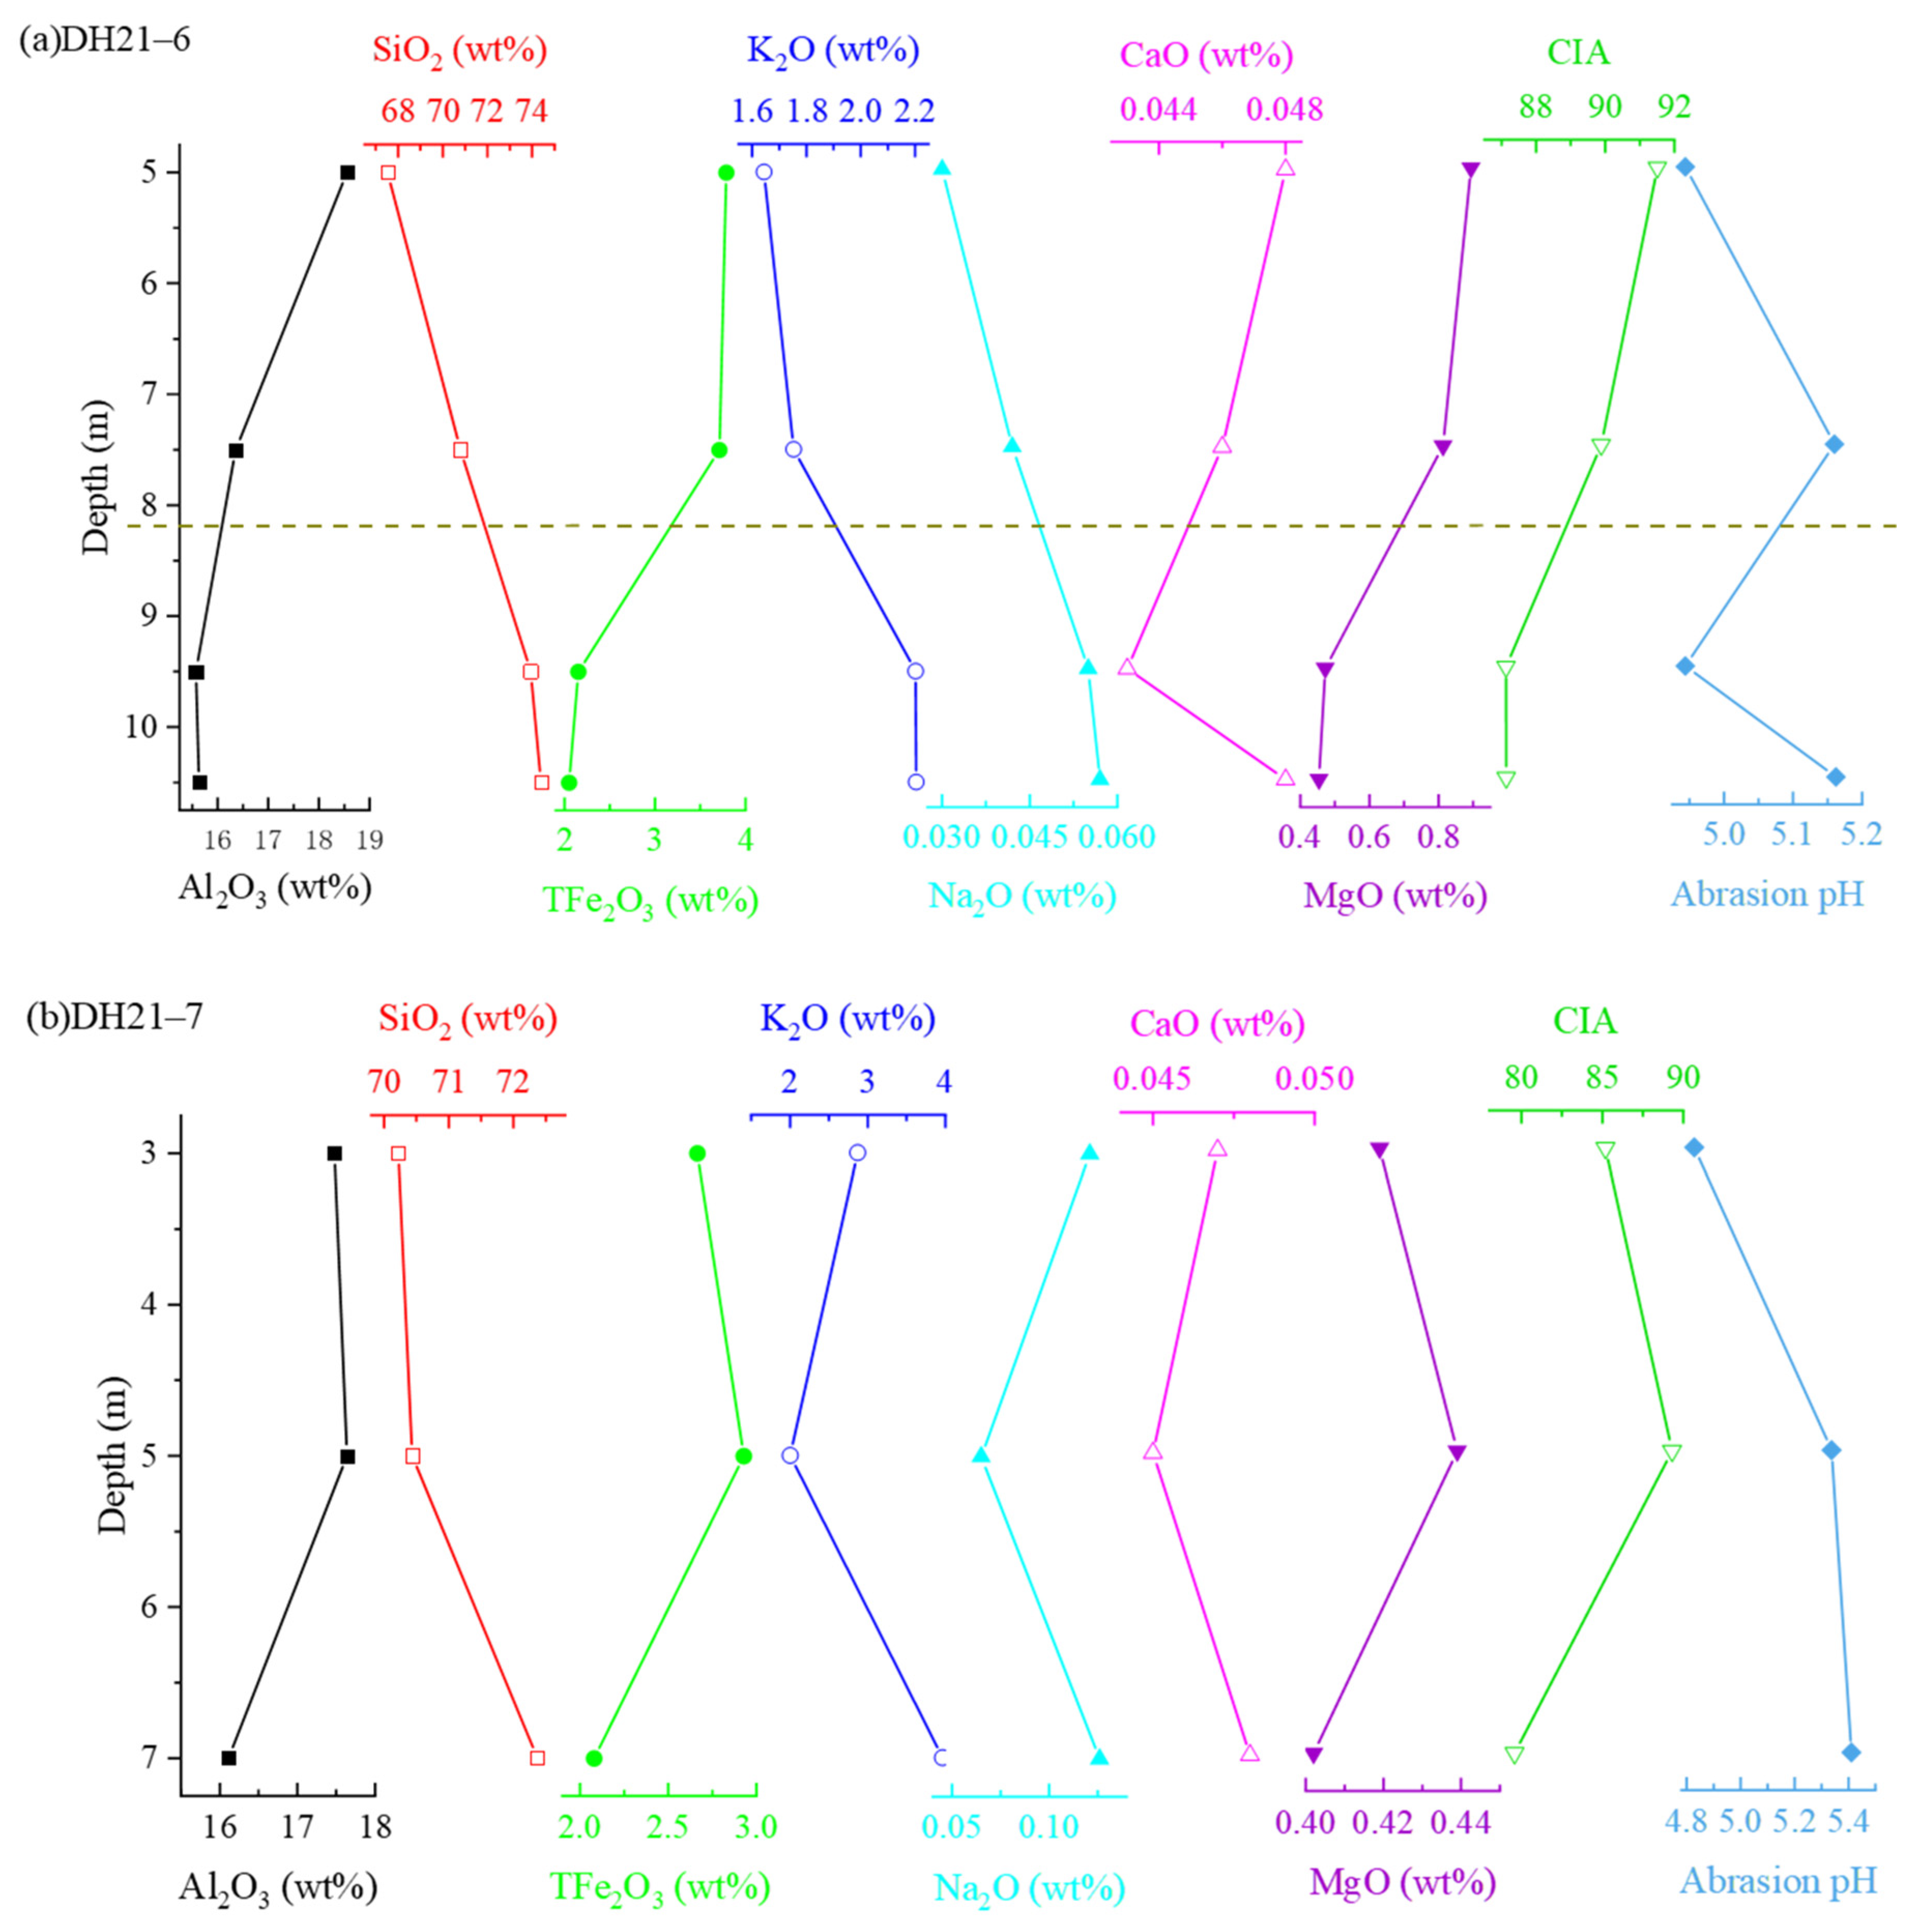
The Chemical Index of Alteration (CIA = [Al2O3/(Al2O3 + CaO + Na2O + K2O)] × 100) effectively reflects the ratio of secondary clay minerals to primary minerals in weathered rare earth ore samples. This index quantitatively evaluates the degree of feldspar chemical weathering and provides an accurate measure of the sample’s overall chemical weathering intensity [32]. As depicted in Figure 6, the Chemical Index of Alteration (CIA) decreases with the depth across all weathering profiles. In DH21–6, the CIA ranges from 91.51 to 81.73; in DH21–7, it ranges from 89.31 to 79.57; and in NL21–1, it ranges from 88.81 to 80.31. This trend reflects a reduction in weathering intensity with depth, suggesting that the upper layers have experienced more pronounced leaching of silicate minerals, including K, Na, Mg, and Ca. As the weathering progresses, primary minerals such as feldspar undergo a gradual transformation into clay minerals. CIA values between 75 and 90 are indicative of completely weathered layers, while values above 90 are typical of topsoil. Thus, the uppermost layer of DH21–6 is classified as topsoil, while the remaining sites fall within the upper completely weathered layer. The abrasion pH, a key geochemical indicator, reflects the weathering intensity and influences mineral stability and element mobility. Figure 6 shows acidic values across all depths, decreasing upward due to enhanced weathering and organic acids (e.g., humic acids) in the topsoil. The downward pH increase aligns with H+ consumption during water–rock reactions [6,33,34].
The SiO2 content increases with the depth, reflecting a declining weathering intensity. Early-stage SiO2 release occurs during silicate dissolution (e.g., feldspars) and is leached under weak acidity, while later-stage quartz accumulation elevates residual concentrations [35]. This contrasts with lateritization-driven SiO2 loss but aligns with granitic weathering regimes. Conversely, Al2O3, TiO2, and Fe2O3 exhibit minor depth-related decreases due to their stability.
In profile NL21–1, the migration and enrichment of elements are strongly affected by the presence of fissures, which leads to significant variations in the distribution of major elements above and below these structural features. Within these fissured zones, the SiO2 and other mobile elements (K2O, Na2O, and CaO) show marked depletion, while the Al2O3 and Fe2O3 concentrations peak. This suggests that fissures act as key conduits for elemental migration and accumulation. The strong leaching and weathering in these zones result in desilication and aluminum enrichment, which is accompanied by relatively high iron concentrations. This indicates a close link between iron mobility and mineral transformation under intense leaching conditions. Iron and manganese oxides commonly accumulate in fractures or pore spaces within bedrock minerals. The presence of iron-bearing minerals, including hematite and goethite, as well as silicate minerals such as biotite, has been identified as the primary factor contributing to variations in the Fe2O3 content across the profiles. The atypical CaO–CIA correlation in DH21–6 and DH21–7 likely arises from secondary clay formation, whereas fissure-driven leaching dominates in NL21–1 (Figure 6). These trends underscore the influence of the local mineralogy and structure on element mobility, even in low-Ca systems.

3.1.3. Microscopic Morphological Characteristics of the Fine Particle Fraction in Weathering Profiles

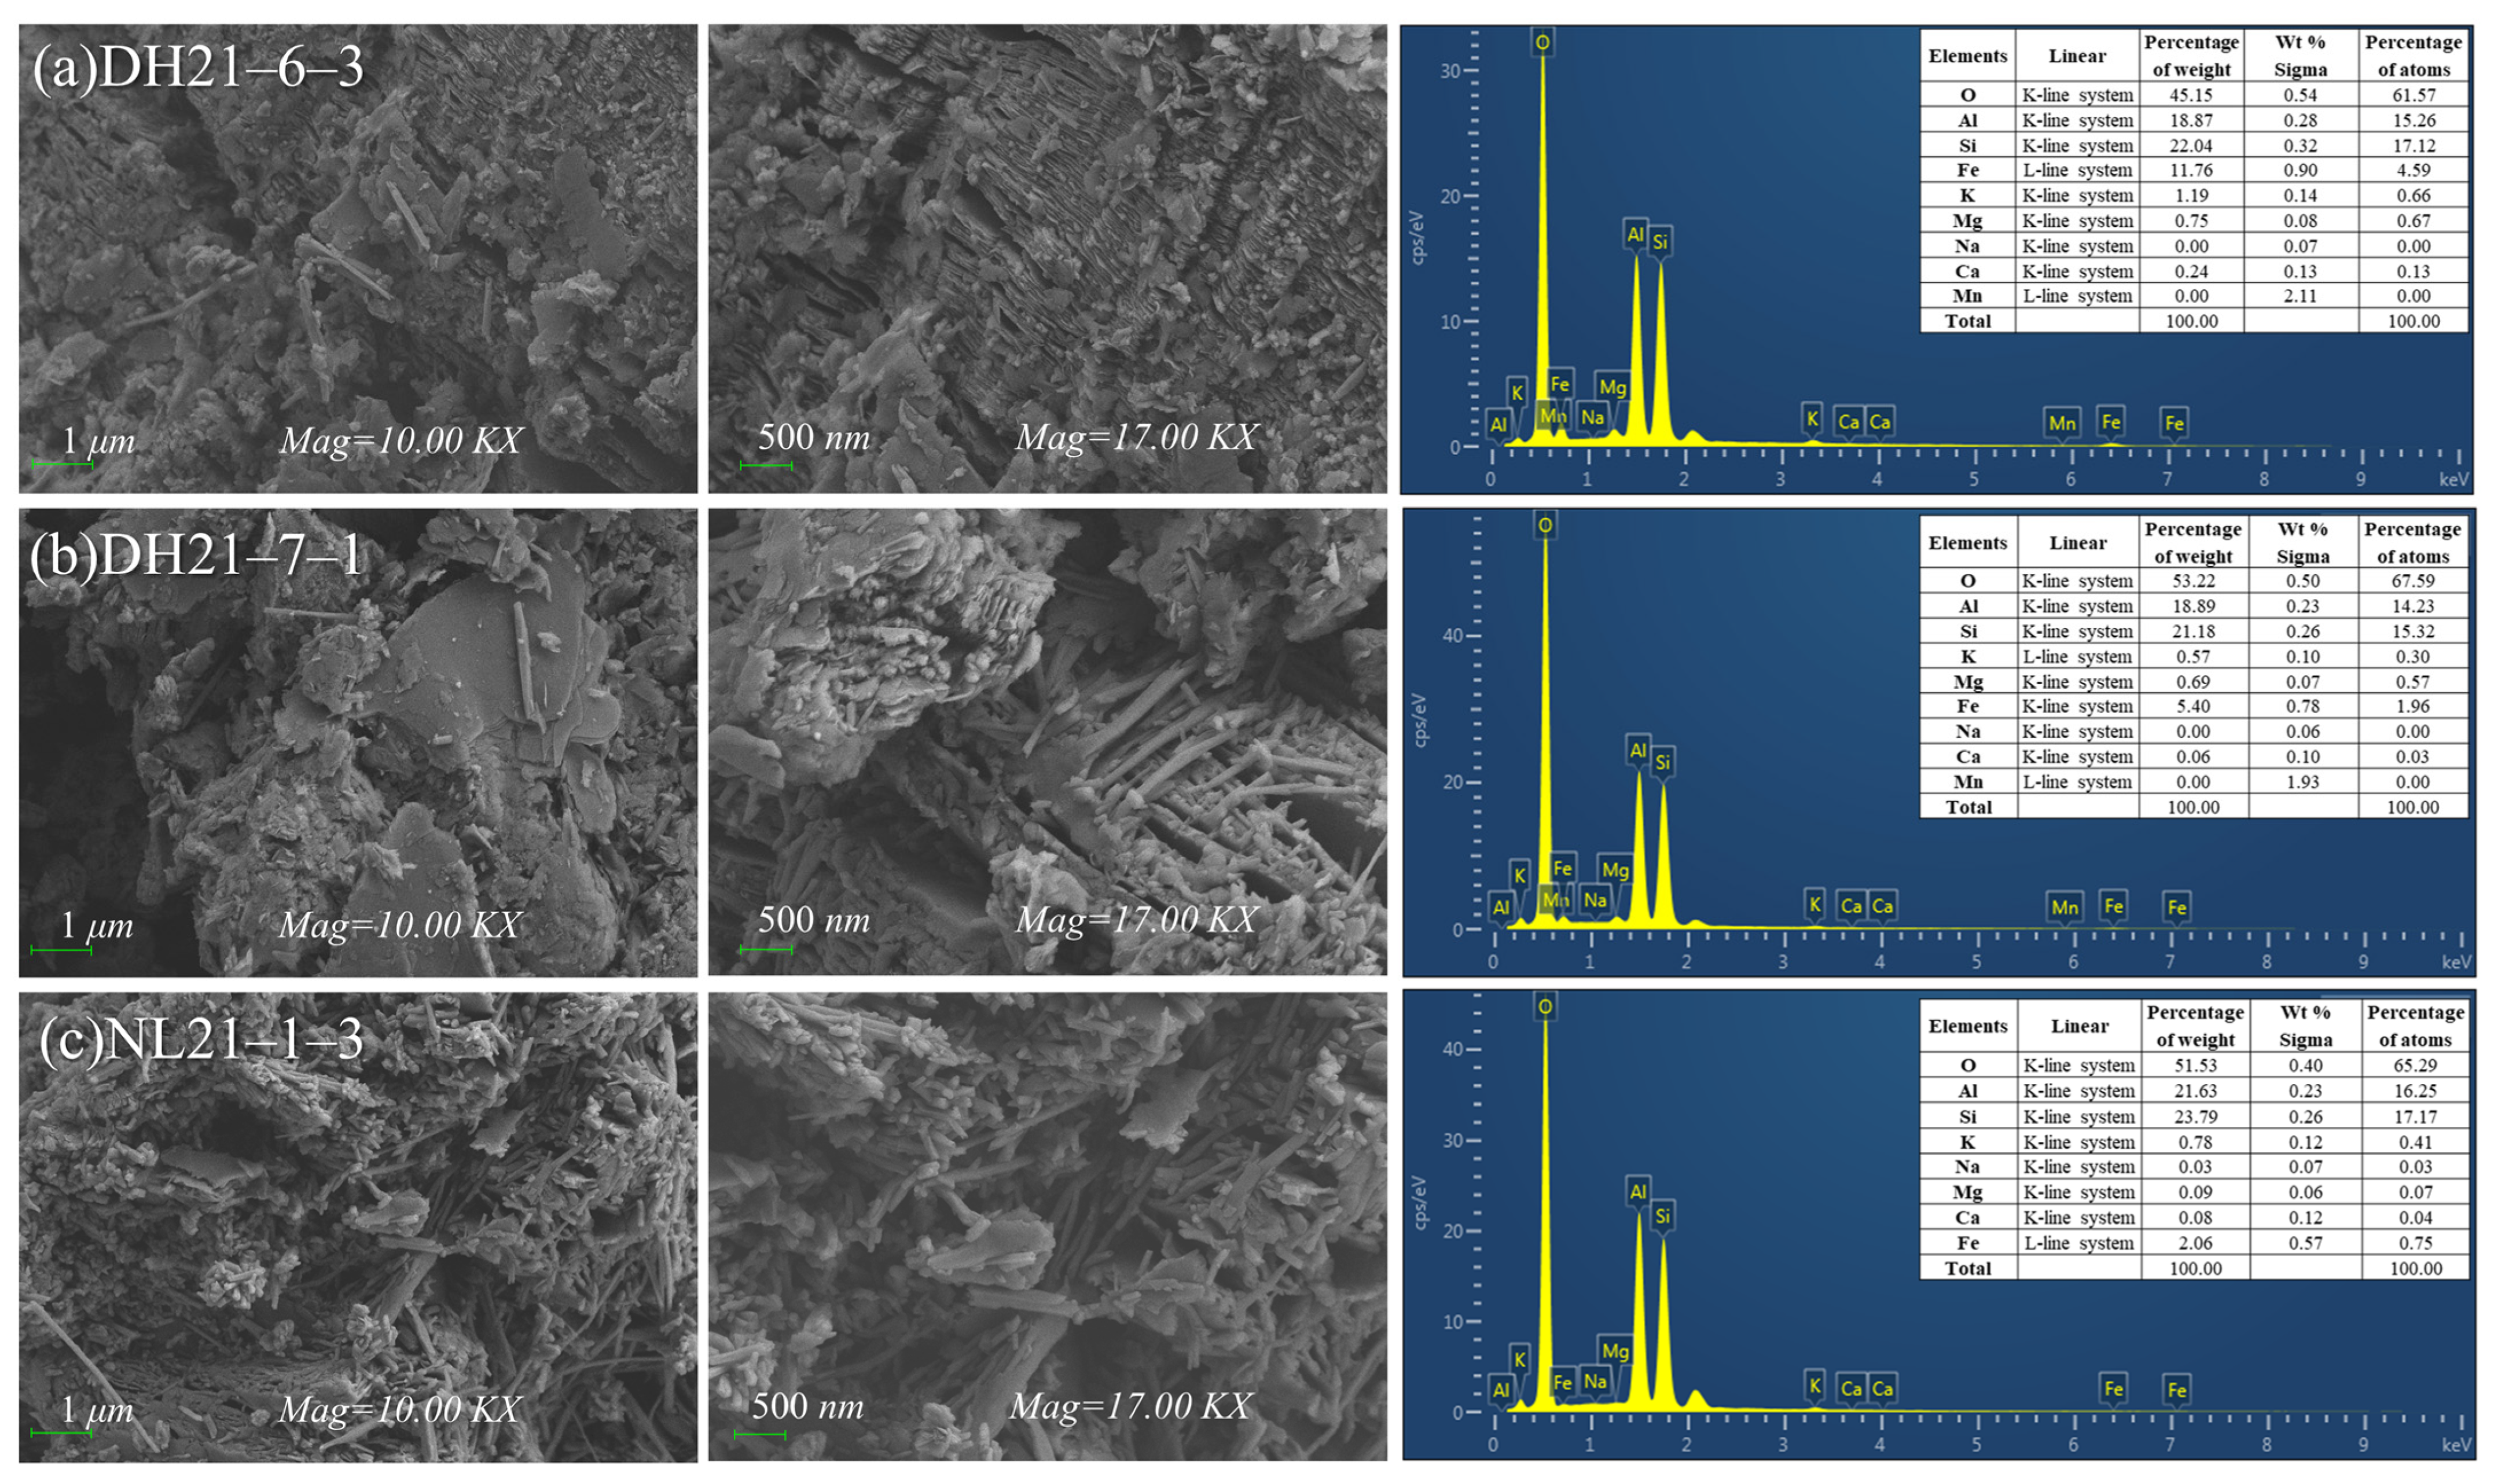
Field emission scanning electron microscopy coupled with energy dispersive spectroscopy (FESEM-EDS) was used to examine the microscopic morphological characteristics of the iron oxide–clay mineral complexes in the fine-grained fractions of the original ore. Surface FESEM images and EDS spectra of ore samples from each weathering profile are presented in Figure 7.
As demonstrated in Figure 7, kaolinite, hematite, and needle-like iron ore constitute the primary iron oxide–clay mineral within the weathering profiles. The needle-like iron ore predominantly appears as elongated strips, whereas hematite typically forms spherical particles. In Figure 7b,c, a substantial amount of needle-like iron ore—characterized by bar-shaped structures measuring approximately 0.5 to 5.0 μm in length—can be observed forming long or rectangular clusters attached to the basal surfaces of laminated kaolinite. In contrast, Figure 7a shows that hematite particles tend to form individual clusters that are arranged in microcrystalline stacks within lamellar zones of the profile. These particles are randomly distributed and tightly adhere to the surfaces of lamellar kaolinite.
In contrast to hematite, which typically forms smaller spherical granules, the needle-like iron ore forms elongated, strip-like clusters with kaolinite. These larger particles are primarily situated within interlamellar microenvironments and along the edges of clay minerals, enabling a broader spatial distribution.
The Chemical Index of Alteration (CIA), as illustrated in Figure 6, provides insight into the degree of weathering across the three sampling sites. The results indicate an increasing trend in weathering intensity, with DH21–7–1 < NL21–1–3 < DH21–6–3. When integrated with the microscopic morphological analysis of iron oxides and clay minerals, these results suggest that, with an increasing weathering intensity, the particle size of the needle-like iron ore–clay mineral complex decreases progressively. This is accompanied by dissolution and recrystallization processes, and these are especially pronounced at the edges of needle-like iron ore under intense weathering conditions. Such transformations reflect the transition of iron oxides from a poorly crystalline state (in needle-like iron ore) to a more crystalline form (as hematite) within the complex.

3.2. Distribution Characteristics of REEs in Weathering Profiles

3.2.1. REEs Content Distribution in Weathering Profiles

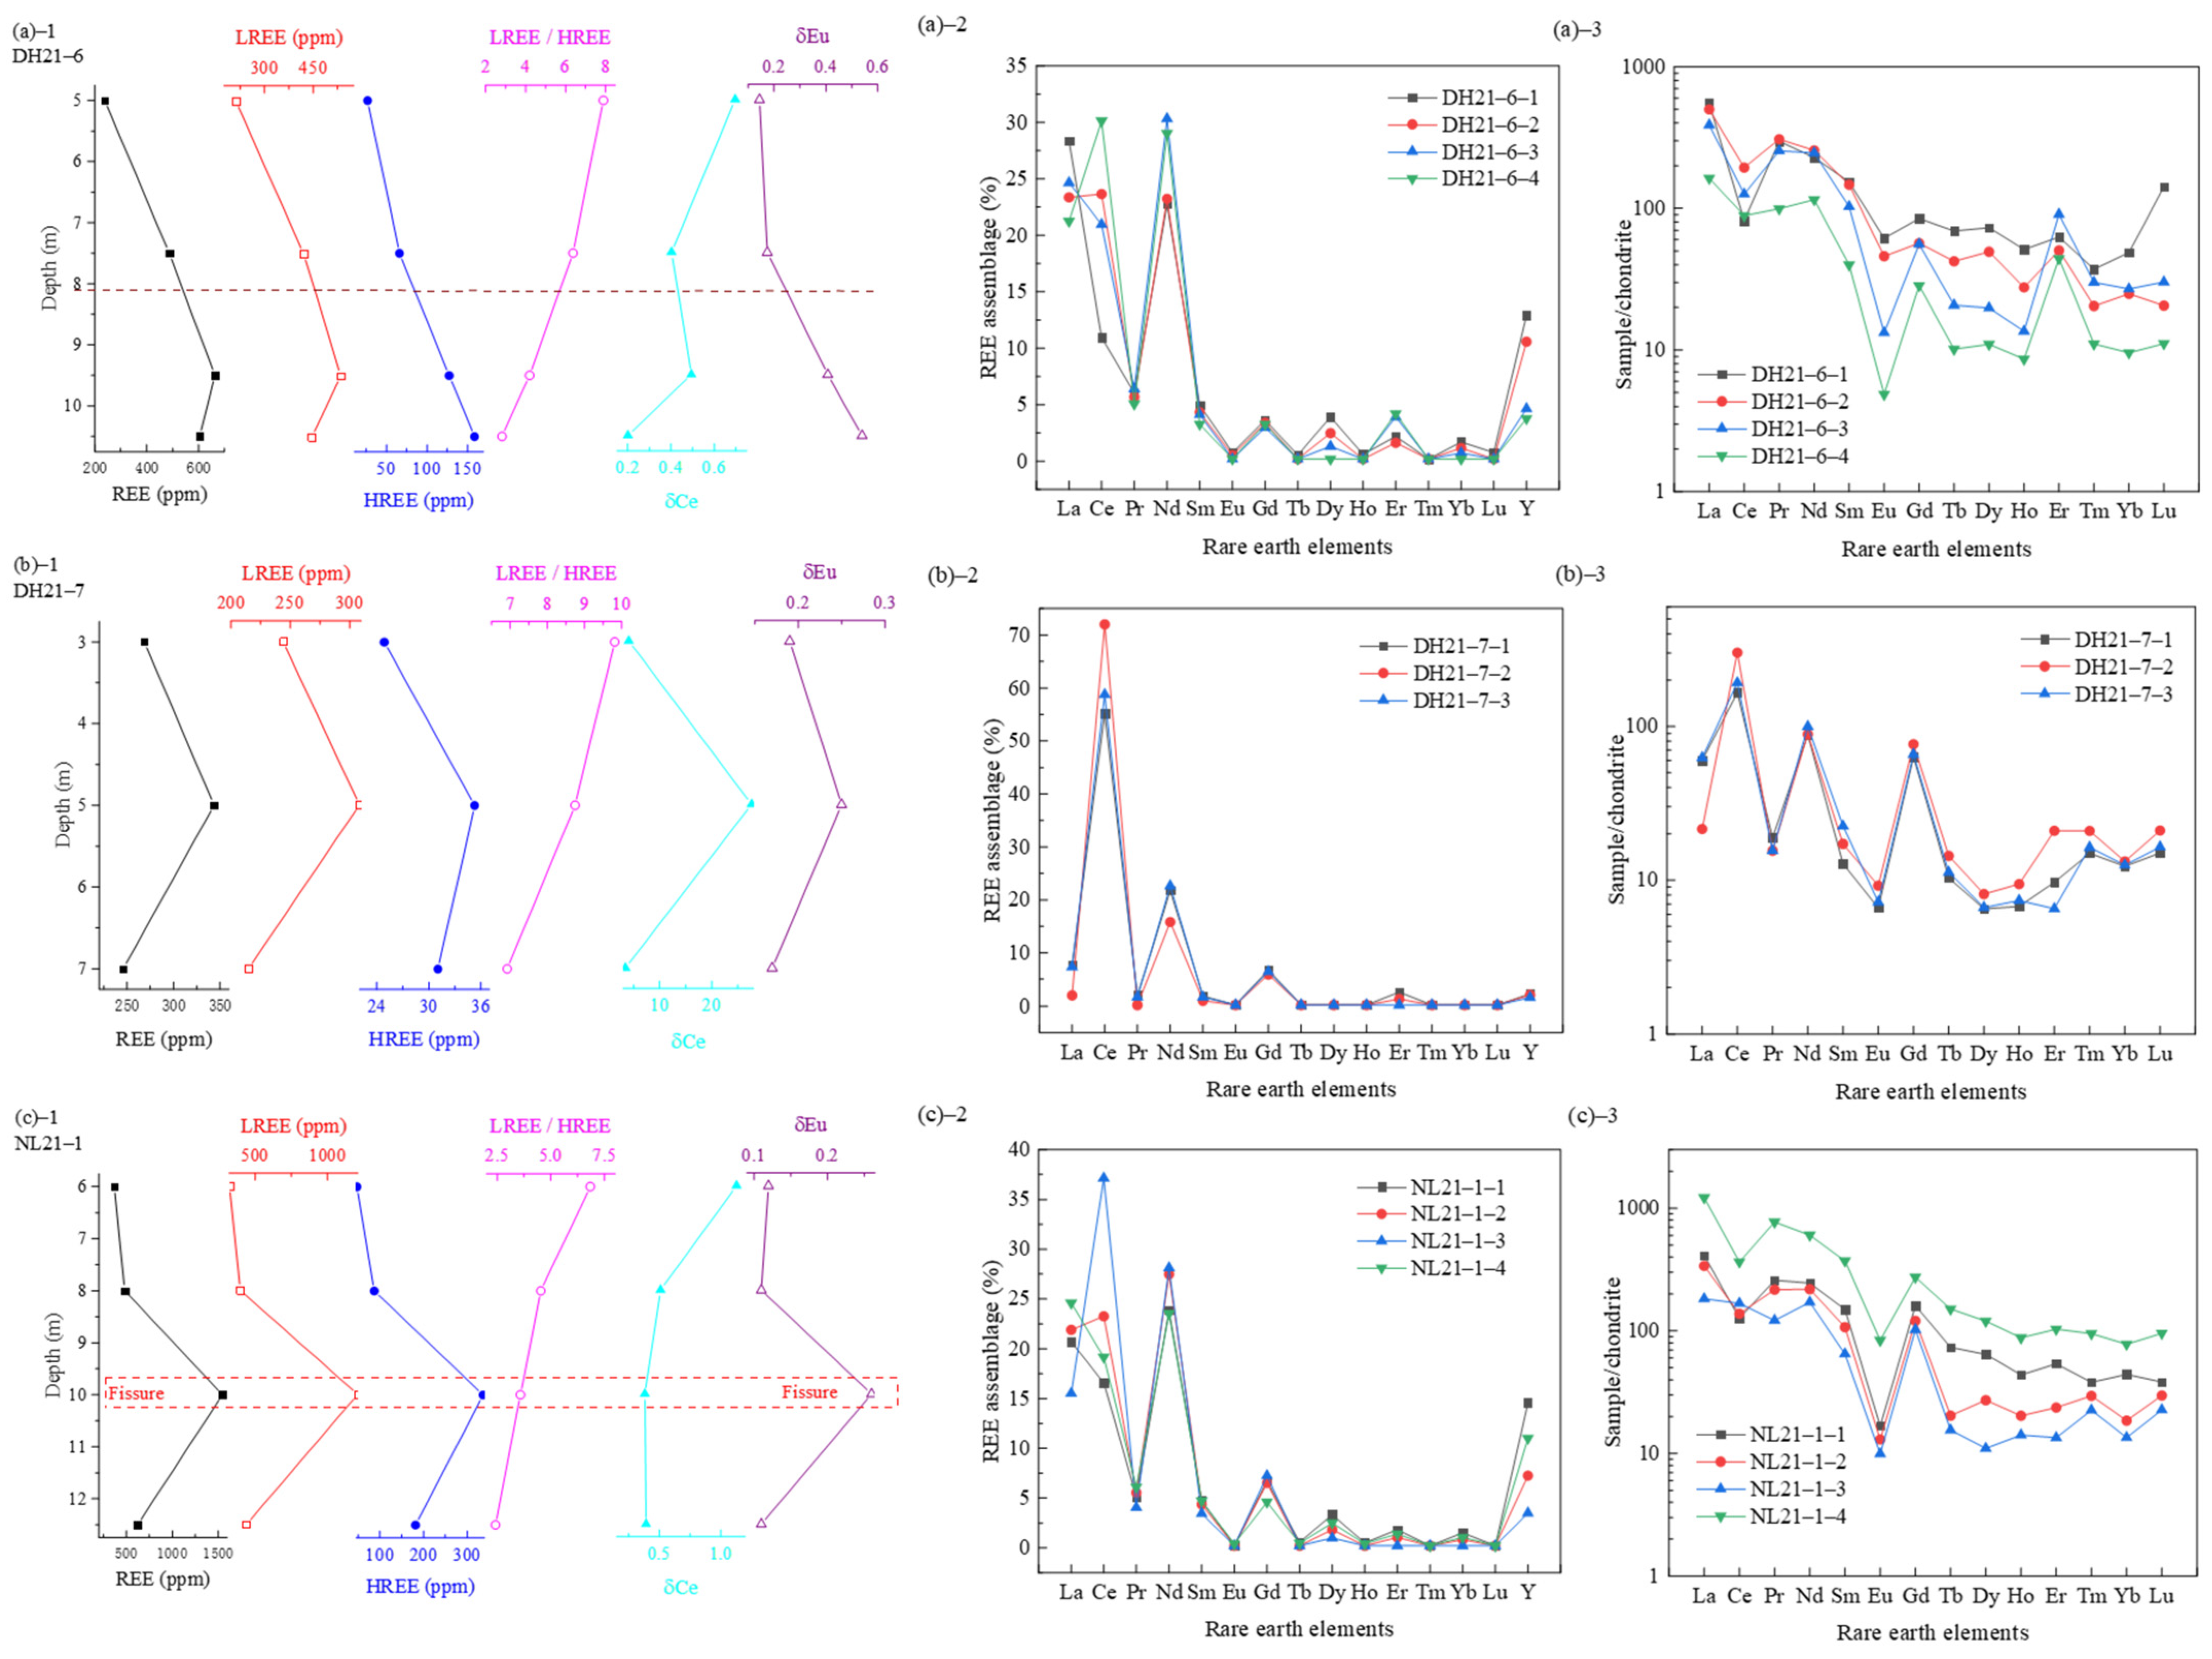
The REE contents of ore samples were analyzed at various depths across the weathering profiles. The results are presented in Table 4 and illustrated in Figure 8((a)–1,(b)–1,(c)–1).
As shown in Table 4 and Figure 8, the trends of the total REEs (ΣREEs) and light REEs (ΣLREEs) in each weathering profile generally increase from the top of the weathering crust to a maximum at mid-depth, which is followed by a slight decrease. A narrowing range of variation accompanies this change. In contrast, heavy REEs (ΣHREEs) show a consistent increase with increasing depth, while the ΣLREEs/ΣHREEs ratio decreases. This pattern indicates a pronounced differentiation between LREEs and HREEs during weathering.
In weathering profile DH21–6, the ΣREEs range from 238.15 to 662.5 ppm, with the ΣLREEs ranging from 211.36 to 535.10 ppm and the ΣHREEs ranging from 26.79 to 158.48 ppm. In profile DH21–7, the ΣREEs range from 245.87 to 343.57 ppm, with the ΣLREEs ranging between 214.83 and 308.30 ppm and the ΣHREEs ranging from 24.85 to 35.27 ppm. In profile NL21–1, the ΣREEs range from 370.18 to 1545.43 ppm, with the ΣLREEs ranging between 322.99 and 1208.72 ppm and the ΣHREEs ranging from 47.19 to 336.82 ppm.
As shown in Figure 8((c)–1), the presence of a fissure exerts a substantial influence on the distribution, migration, and enrichment of major elements and REEs in weathering profile NL21–1. The REE content is markedly higher within the fissure compared to the surrounding layers, which indicates localized enrichment. This occurs because fluids dissolve REE-rich phases in the weathering crust and subsequently transport REEs along fractures [36,37]. These elements are often found in irregular concentrations along mineral interfaces, fractures, and pore-filling zones. Consequently, variations in both the REE content and its distribution among minerals are evident [13].
This enrichment pattern confirms that REEs accumulate within the weathering crust, with the LREEs being primarily concentrated in the upper and middle sections of the completely weathered layer, while the HREE content increases with the depth. Thus, the REE distribution in the profiles is characterized by enrichment in the middle, with lower concentrations at both the top and bottom. LREEs are enriched in the upper part, and HREEs are enriched in the lower part of the completely weathered layer.
As illustrated in Figure 8, the presence of Ce and Eu anomalies has been observed across various profiles. In profile DH21–6, both the Ce and Eu show negative anomalies. In DH21–7, the Ce displays a notable positive anomaly. In profile NL21–1, the Ce exhibits a positive anomaly in the upper part and a negative anomaly in the lower part, while the Eu consistently shows negative anomalies. The spatial variation in Ce anomalies can be attributed to oxidation state controls, where Ce3+→Ce4+ oxidation in oxic upper layers leads to Ce enrichment through insoluble CeO2 formation, while reducing conditions in deeper zones promote Ce3+ mobility. Furthermore, fractures in NL21-1 enhance oxygen penetration, which creates localized Ce4+ enrichment zones adjacent to the fractures. The consistent negative Eu anomalies, on the other hand, reflect the dominant role of plagioclase weathering, where preferential leaching of Eu2+ from Ca-rich plagioclase occurs, coupled with the lack of Eu2+→Eu3+ oxidation that maintains the Eu mobility throughout the profiles.
Figure 8((a)–2,(a)–3,(b)–2,(b)–3,(c)–2,(c)–3) presents the REE partitioning of whole-rock samples in each weathering profile, normalized to chondritic meteorite standards [38]. In profile DH21–6, the REE distribution shows relative enrichment in LREEs such as La, Ce, and Nd, as well as in Y, which is a HREE. The La/Yb ratio ranges from 16.70 to 53.20 and decreases significantly with decreases in the depth. A similar pattern is observed in profile DH21–7, where the LREEs La, Ce, and Nd are enriched, with La/Yb ratios ranging from 9.85 to 38.35. In profile NL21–1, enrichment in the La, Ce, and Nd is also noted, with La/Yb values similar to those in DH21–6. The downward trend in the La/Yb ratio with the depth in all profiles further supports the conclusion that LREEs are more concentrated in the upper parts of the completely weathered layer, while HREEs are increasingly enriched in the deeper sections.

3.2.2. Occurrence States and Fractionation Characteristics of REEs in Weathering Profiles

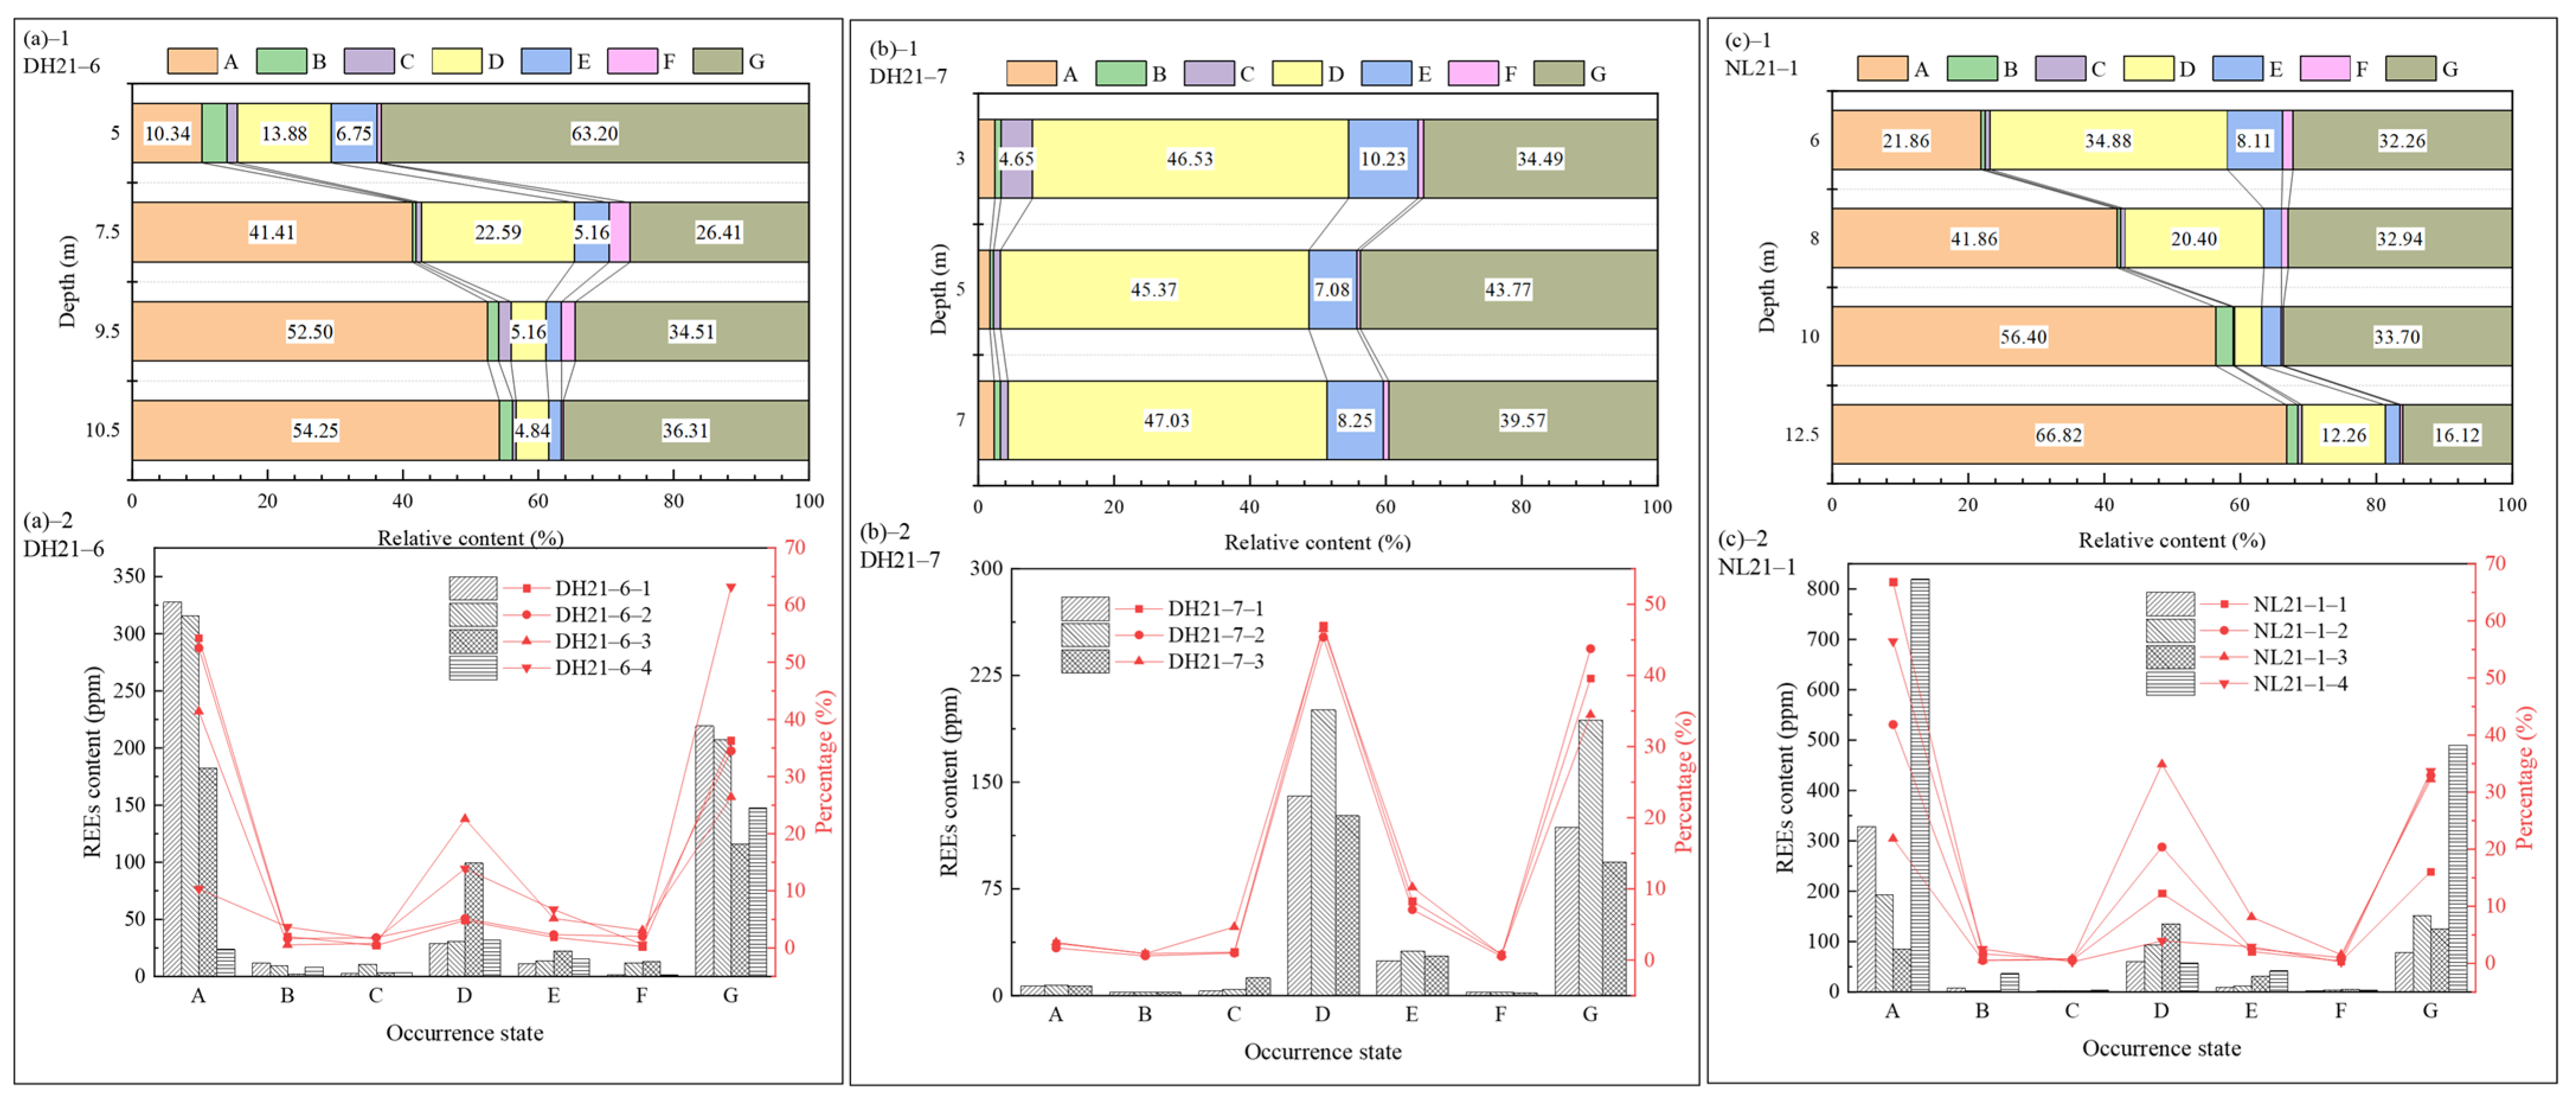
The occurrence states of REEs in WCE-REOs from the Lincang granite were investigated using continuous graded extraction. A systematic analysis of three weathering profiles (DH21–6, DH21–7, and NL21–1) was conducted to characterize the distribution patterns of REEs across different speciation states. The results are illustrated in Figure 9.
As illustrated in Figure 9((a)–1,(a)–2,(c)–1,(c)–2), profiles DH21–6 and NL21–1 exhibited similar REE partitioning patterns, with the ion-exchangeable, residual, and iron-manganese oxide-bound states collectively accounting for over 95% of the total REE content. Ion-exchangeable REEs showed pronounced depth-dependent enrichment, with peak concentrations reaching 327.73 ppm (54.25% of total REEs) and 819.96 ppm (56.40%) in the middle to lower sections of the profiles. Carbonate-bound REEs constituted a negligible percentage (0.53%–3.70%), with localized enrichment observed at a depth of 10.5 m in DH21–6 (12.13 ppm) and within fissure zones in NL21–1 (36.83 ppm). REEs bound to humic acid and organic matter each accounted for less than 2% of the total REE content.
In contrast, as illustrated in Figure 9((b)–1,(b)–2), profile DH21–7 exhibited a distinct REE partitioning pattern that was dominated by the residual and iron-manganese oxide-bound states, which together constituted 85%–92% of the total REEs. Notably, the amorphous iron-manganese oxides were highly enriched in HREEs, contributing 45.37%–47.03% of the total REE content, with a maximum concentration of 200.85 ppm at a depth of 5.0 m.
Iron-manganese oxide-bound REEs exhibited clear vertical fractionation. Amorphous phases accounted for 4.84%–22.58% of the total REEs in DH21–6 (peaking at 99.42 ppm at 7.5 m depth) and 3.95%–34.88% in NL21–1 (135.81 ppm at 6.0 m), whereas crystalline phases maintained lower proportions (2.08%–8.11%). The residual REE fraction demonstrated relative stability in the upper sections of NL21–1 (~32%), yet it exhibited greater variability in DH21–6 (26.41%–63.2%), where it reached 219.37 ppm at a depth of 10.5 m.
Fissure systems have been demonstrated to exert a substantial influence on the distribution of REEs, particularly by enhancing concentrations of amorphous iron-manganese oxide-bound REEs in overlying strata. This structural control highlights the importance of fluid pathways in the mobilization and redistribution of REEs within weathering profiles [39].

3.3. Distribution of REEs in Major Occurrence States and Partitioning Characteristics

3.3.1. REEs in the Ion-Exchange State

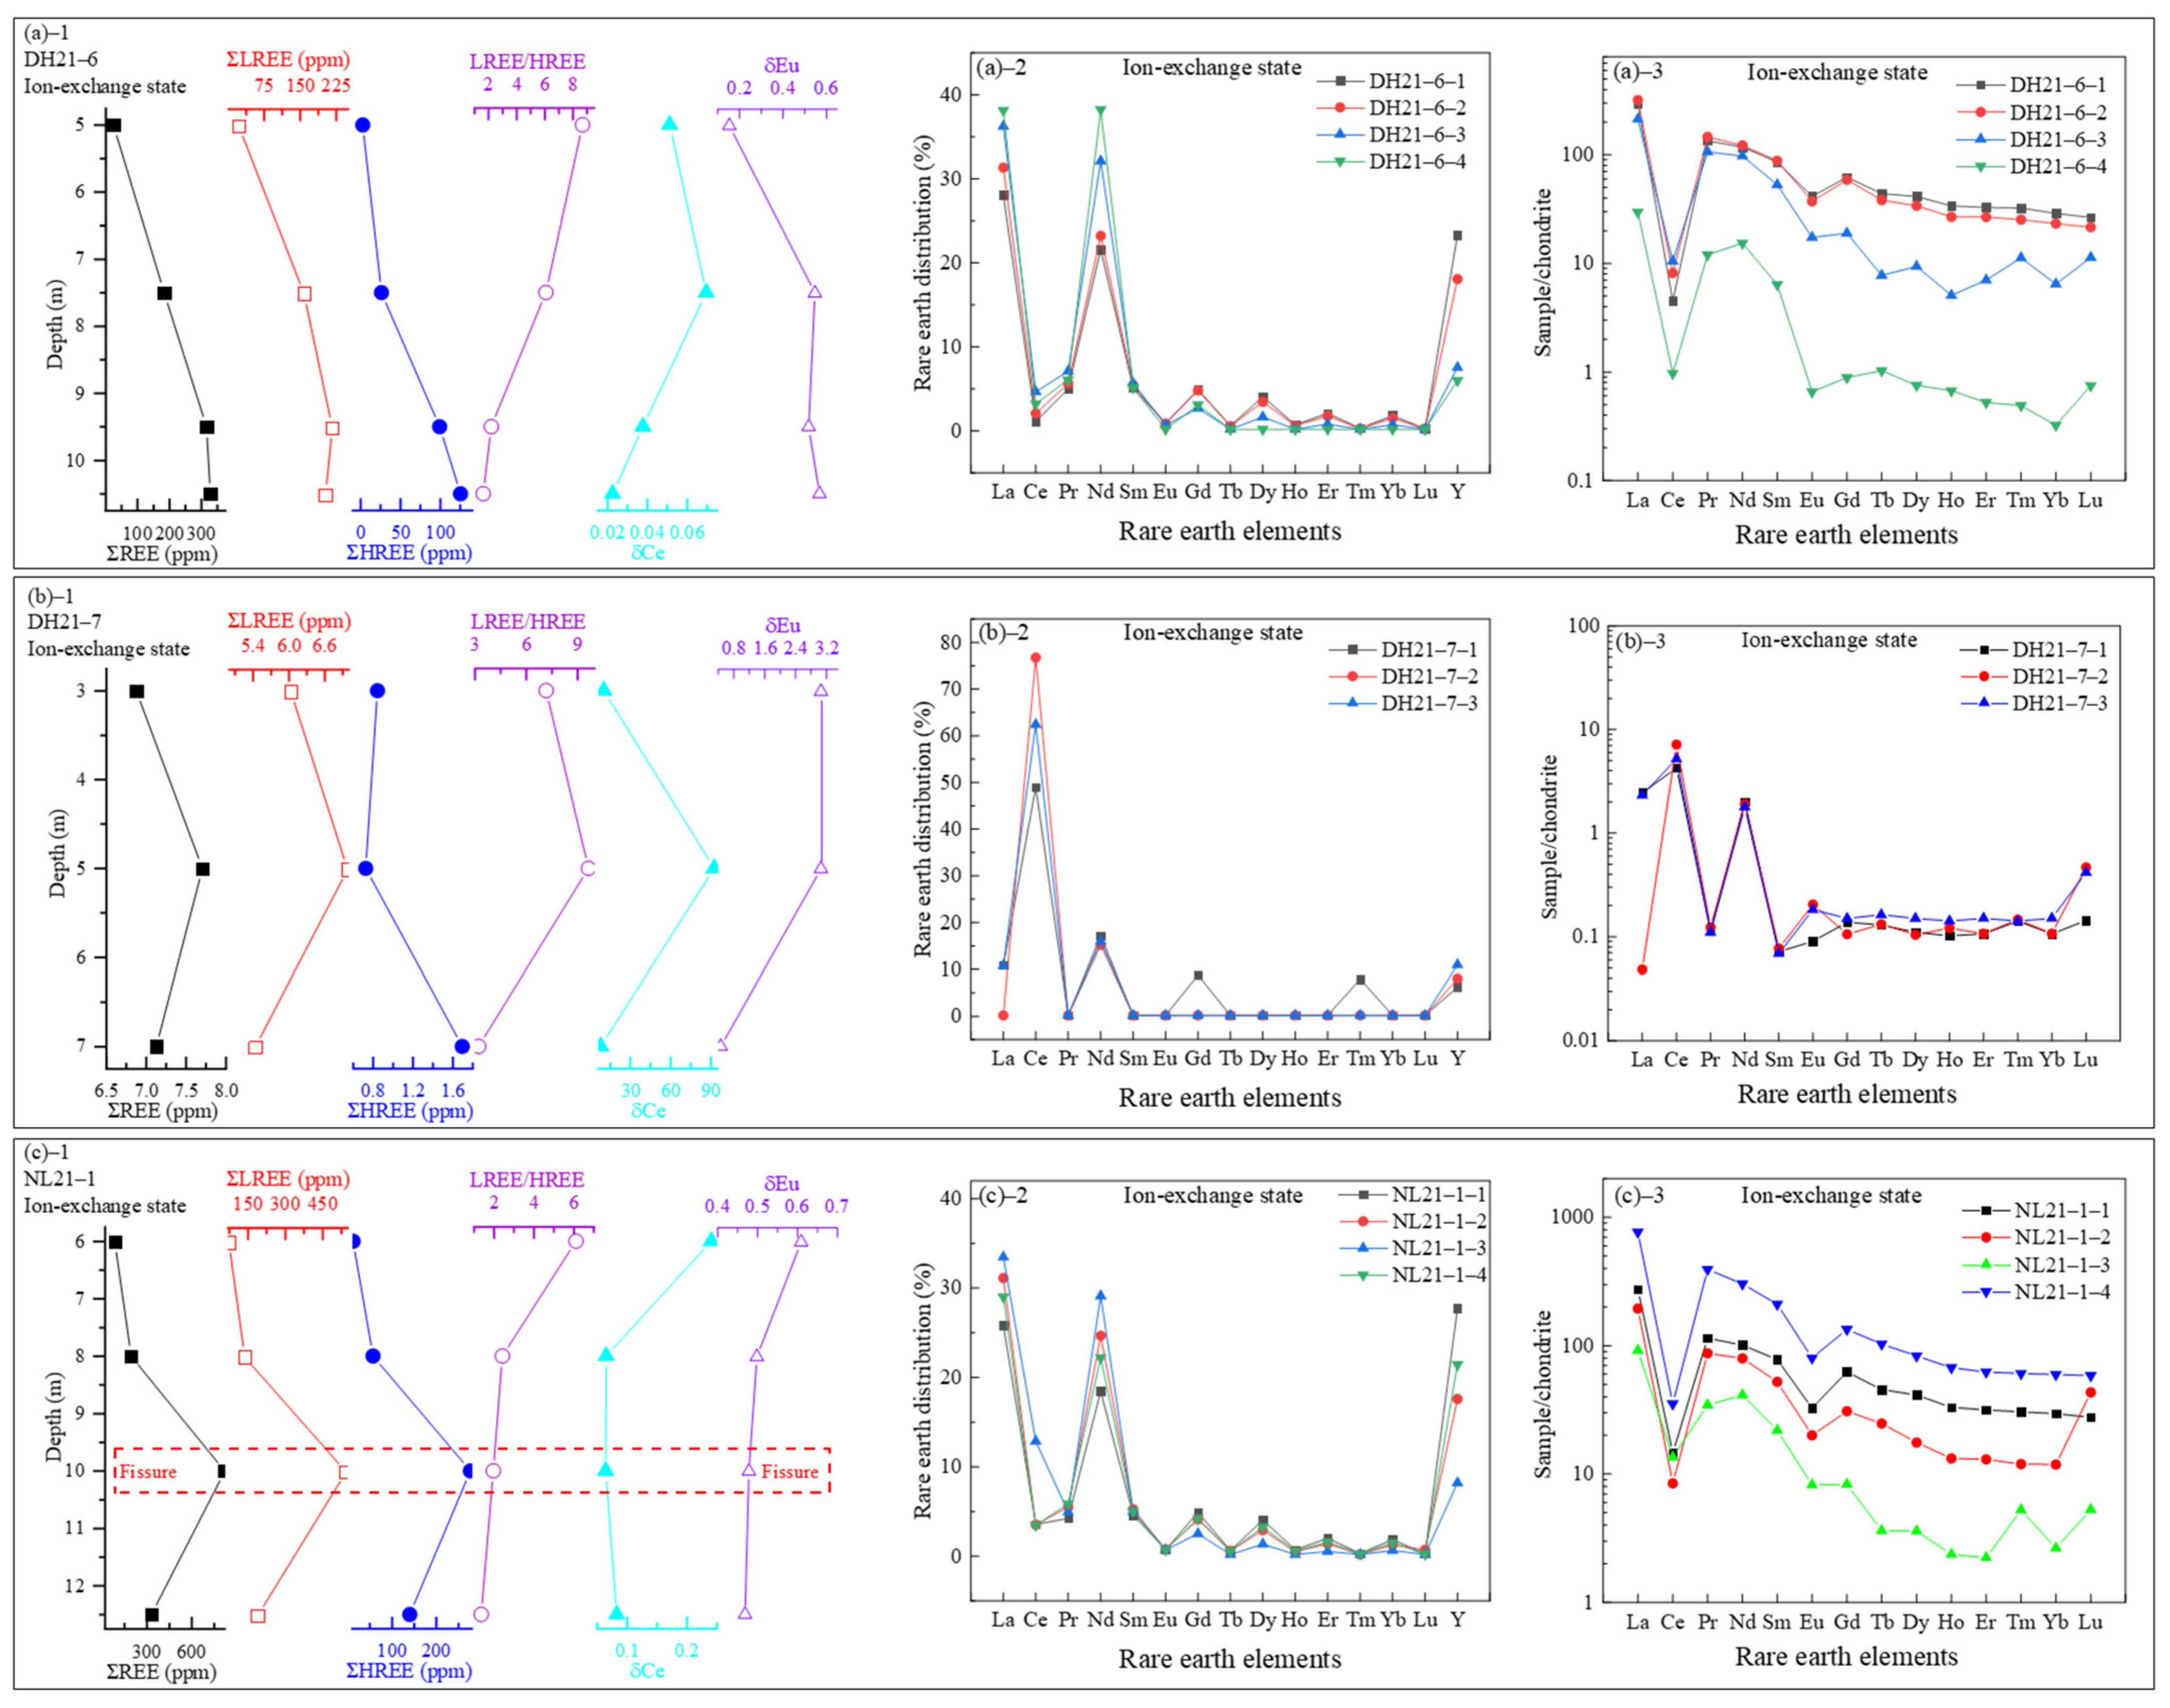
The content and partitioning characteristics of REEs in the ion-exchange state were analyzed at varying depths within the weathered crust profiles DH21–6, DH21–7, and NL21–1. The results of this analysis are presented in Figure 10.
As shown in Figure 10((a)–1–(a)–3), in profile DH21–6, the REE content in the ion-exchange state shows a clear increasing trend with the depth. In the humic layer, the REE content is as low as 24.52 ppm, but it becomes significantly enriched in the upper part of the weathered layer, with the total REE content (ΣREEs) reaching up to 327.76 ppm or higher. As the depth increases, both the ion-exchangeable ΣREEs and HREEs continue to increase, while the LREEs first increase and then slightly decrease. The enrichment depths differ for the LREEs and HREEs: the LREEs peak at 9.5 m with a content of 216.67 ppm, whereas the HREEs are most enriched at deeper layers, reaching approximately 125.16 ppm.
The LREE/HREE ratio decreases with the depth from 8.68 to 1.62, indicating a shift in REE composition in the ion-exchange state from LREE-enriched to HREE-enriched. The REE partitioning pattern and chondrite-normalized distribution reveal that the ion-exchange state is relatively enriched in the LREEs, particularly La and Nd (each with partitioning values above 20.00%). Among the HREEs, Y is dominant, with partitioning values up to 25%. Negative anomalies are observed for Ce and Eu, which aligns with the pattern seen in the total-phase REEs, except for Ce.
As illustrated in Figure 10((b)–1–(b)–3), in profile DH21–7, the REE content in the ion-exchange state is extremely low, which indicates that the REE enrichment and mineralization in this profile are not primarily controlled by ion adsorption. The contents of ΣREEs and LREEs increase with the depth initially and then decrease, while the HREE content increases steadily with the depth. This suggests that HREE enrichment occurs at deeper levels compared to that of LREEs. The decline in the LREE/HREE ratio with the depth substantiates a transition from a composition dominated by LREEs to one that is predominantly HREE-dominated. In the ion-exchange state, the LREEs are mainly enriched in Ce and Nd, each of which has partitioning values above 15.00%. Y emerges as the dominant HREE, with partitioning values that surpass 5%. Additionally, Ce and Eu show significant positive anomalies in this profile.
In Figure 10((c)–1–(c)–3), for profile NL21–1, the contents of ΣREEs, LREEs, and HREEs in the ion-exchange state first increase and then decrease with the depth. The maximum ΣREEs content reaches 819.96 ppm in the fissure zone. The LREE/HREE ratio decreases from 6.11 to 1.35 with the depth, which further suggests a transition from LREE-rich to HREE-rich ion-exchange REEs. The LREEs, particularly La and Nd, are enriched in the upper layers, with partitioning values exceeding 15.00%. Among the HREEs, Y dominates with a partitioning value above 8%. Ce and Eu exhibit negative anomalies in the ion-exchange state, which gradually weaken with increasing depth.

3.3.2. REEs in the Residual State

An analysis was conducted to examine the contents and partitioning characteristics of REEs in the residual state. This analysis was performed at varying depths within the weathered crust profiles DH21–6, DH21–7, and NL21–1. The results of this analysis are presented in Figure 11.
As demonstrated in Figure 11((a)–1–(a)–3), in the upper portion of the thoroughly weathered layer of profile DH21–6, the intensity of weathering gradually diminishes with the depth, concurrently increasing the content of REEs in the residual state. This trend signifies an augmentation in the abundance of rare-earth-bearing independent minerals at greater depths. Under the weakly acidic conditions typical of weathering crusts, weathering-prone minerals—particularly those enriched in LREEs—are subject to dissolution and leaching. Consequently, LREEs are released and migrate downward, which leads to an increasing LREE/HREE ratio with increases in the depth. Apart from a few strongly weathering-resistant monazite [(LREE)PO4] samples, which maintain their enrichment, the majority of rare-earth-bearing minerals tend to release LREEs more readily. This results in higher LREE/HREE ratios in the residual state than in the whole rock and a general decrease in this ratio as weathering progresses. The REE partitioning pattern and chondrite-normalized distribution show that the residual state is mainly enriched in LREEs, with the Ce partitioning values exceeding 30.00%. Ce consistently shows positive anomalies, while Eu exhibits negative anomalies. As the depth increases, the Ce partitioning in the residual state rises significantly, exceeding 60.00%, which indicates the presence of independent REE minerals containing Ce and Nd.
As demonstrated in Figure 11((b)–1–(b)–3), the residual state is indicative of one of the predominant occurrence modes of REEs in profile DH21–7. The contents of ΣREEs and LREEs show a trend of initially increasing and then decreasing with increases the depth, although the distinction between LREE- and HREE-enriched layers is not pronounced. The LREE/HREE ratio decreases with increasing depth, which indicates a transition from a LREE-enriched to a HREE-enriched REE composition in the residual state. The residual REEs are mainly composed of La, Ce, and Nd, each of which has partitioning values exceeding 10%. At greater depths, HREEs such as Gd, Dy, and Er are also present in the residual state, with partitioning values above 5%. The Gd–Nd anomalies (Figure 11) likely reflect (1) ligand-specific complexation in organic-rich layers; (2) secondary phosphate mineralization; and (3) weathering of Nd-bearing primary minerals (fergusonite (YNdO4), monazite ((Ce, La, Nd, Th) PO4)). These processes synergize with the protolith’s inherent LREE enrichment (Section 2.1.2) to explain the anomalous enrichment [40,41].
With regard to anomalies, Ce initially displays a positive anomaly, subsequently displays a negative anomaly in the middle portion of the profile, and ultimately reverts to a positive anomaly. This variation is attributed to REE enrichment primarily occurring in the middle of the profile, where the Ce partitioning reaches around 45%.
As shown in Figure 11((c)–1–(c)–3), in profile NL21–1, the contents of ΣREEs, LREEs, and HREEs in the residual state exhibit a tendency to increase and subsequently decrease with increasing depth. The maximum REE content observed in the residual state was 494.90 ppm, and this was recorded in the fissure zone. The LREE/HREE ratio shows a consistent decline with increasing depth, indicating progressive enrichment in HREEs. Nevertheless, the residual REEs remain dominated by LREEs, particularly La, Ce, and Nd, all of which exhibit partitioning values that exceed 10.00%.

3.3.3. REEs in Amorphous Iron-Manganese Oxide State

The contents and partitioning characteristics of REEs in the amorphous iron-manganese oxide state were analyzed at different depths in the weathered crust profiles DH21–6, DH21–7, and NL21–1. The results are shown in Figure 12.
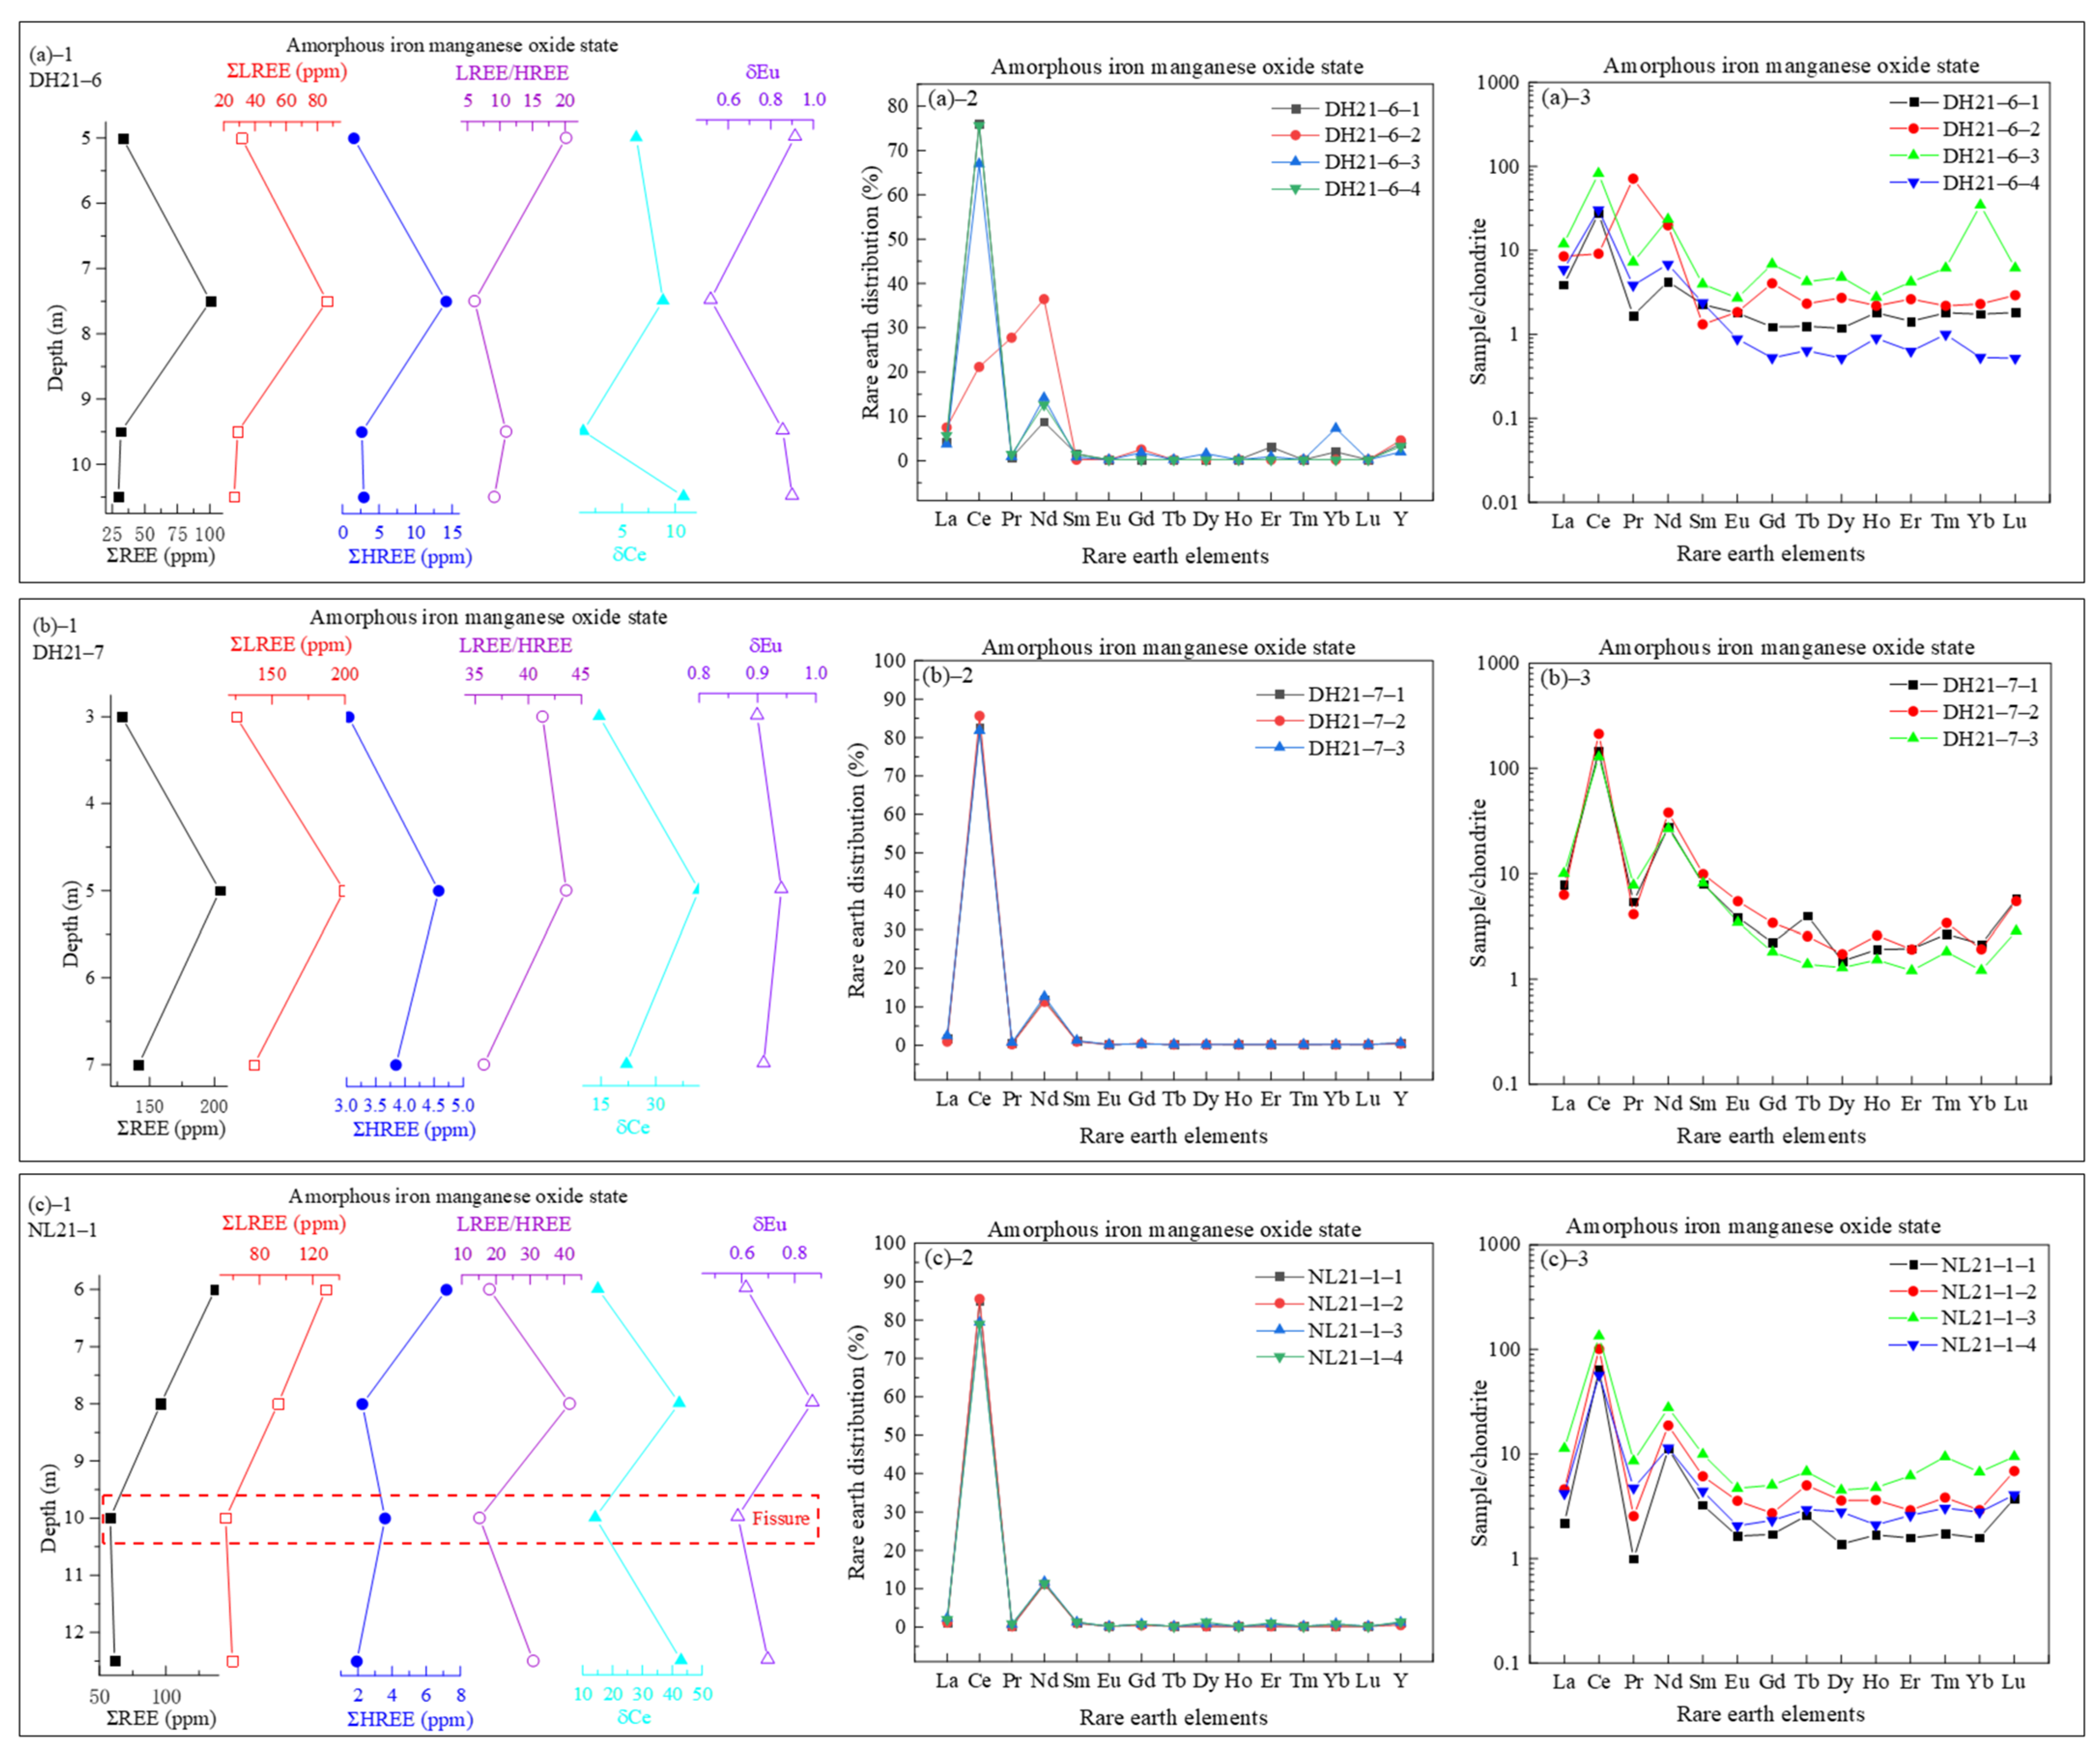
As shown in Figure 12((a)–1–(a)–3), in profile DH21–6, the contents of ΣREEs, LREEs, and HREEs in the amorphous iron-manganese oxide state exhibit an increasing-then-decreasing trend with increasing depth, with the highest ΣREEs content reaching 100.40 ppm at a depth of 7.5 m. With increasing depth, the LREE/HREE ratio decreases from 20.16 to 9.11, which indicates significant fractionation between light and heavy REEs. Ce shows a pronounced positive anomaly in this state, while Eu exhibits a negative anomaly. The Ce partitioning can reach up to 75.00%, which suggests that amorphous iron-manganese oxides are highly enriched in Ce. Additionally, La, Pr, Nd, and Y all have partitioning values above 5.00%, which indicates that this state is primarily enriched in LREEs.
As shown in Figure 12((b)–1–(b)–3), in profile DH21–7, the ΣREEs, LREEs, and HREEs in the amorphous iron-manganese oxide state also follow an increasing-then-decreasing pattern with increasing depth, with the highest ΣREEs value reaching 204.10 ppm. The LREE/HREE ratios range from 35.80 to 43.57, showing a slight increase followed by a gradual decrease with increasing depth. Ce again exhibits a strong positive anomaly, while Eu exhibits a persistent negative anomaly. In this state, the Nd partitioning exceeds 10.00% and the Ce partitioning surpasses 80.00%, which further confirms the high enrichment capacity of amorphous iron-manganese oxides for Ce.
As illustrated in Figure 12((c)–1–(c)–3), in profile NL21–1, the contents of ΣREEs, LREEs, and HREEs in the amorphous iron-manganese oxide state exhibit a decreasing-then-slightly-increasing trend with increasing depth. The maximum ΣREEs content reaches 137.18 ppm. The LREE/HREE ratios range from 15.16 to 41.59, with significant fluctuations observed above and below the fissure zone. At the fissure, the LREE/HREE ratio, Ce anomalies, and Eu anomalies reach their minimum values. This pattern suggests that exogenous phases such as amorphous iron oxides become concentrated in the fissure zone, influencing REE fractionation and redistributing light and heavy REEs within the profile. Ce displays significant positive anomalies, while Eu continues to exhibit negative anomalies. In this state, the Nd partitioning remains above 10.00% and the Ce partitioning consistently exceeds 80.00%.

3.3.4. REEs in Crystalline Iron-Manganese Oxide State

The contents and partitioning characteristics of REEs in the crystalline iron-manganese oxide state at different depths of the weathering crust profiles DH21–6, DH21–7, and NL21–1 were analyzed. The results are presented in Figure 13.
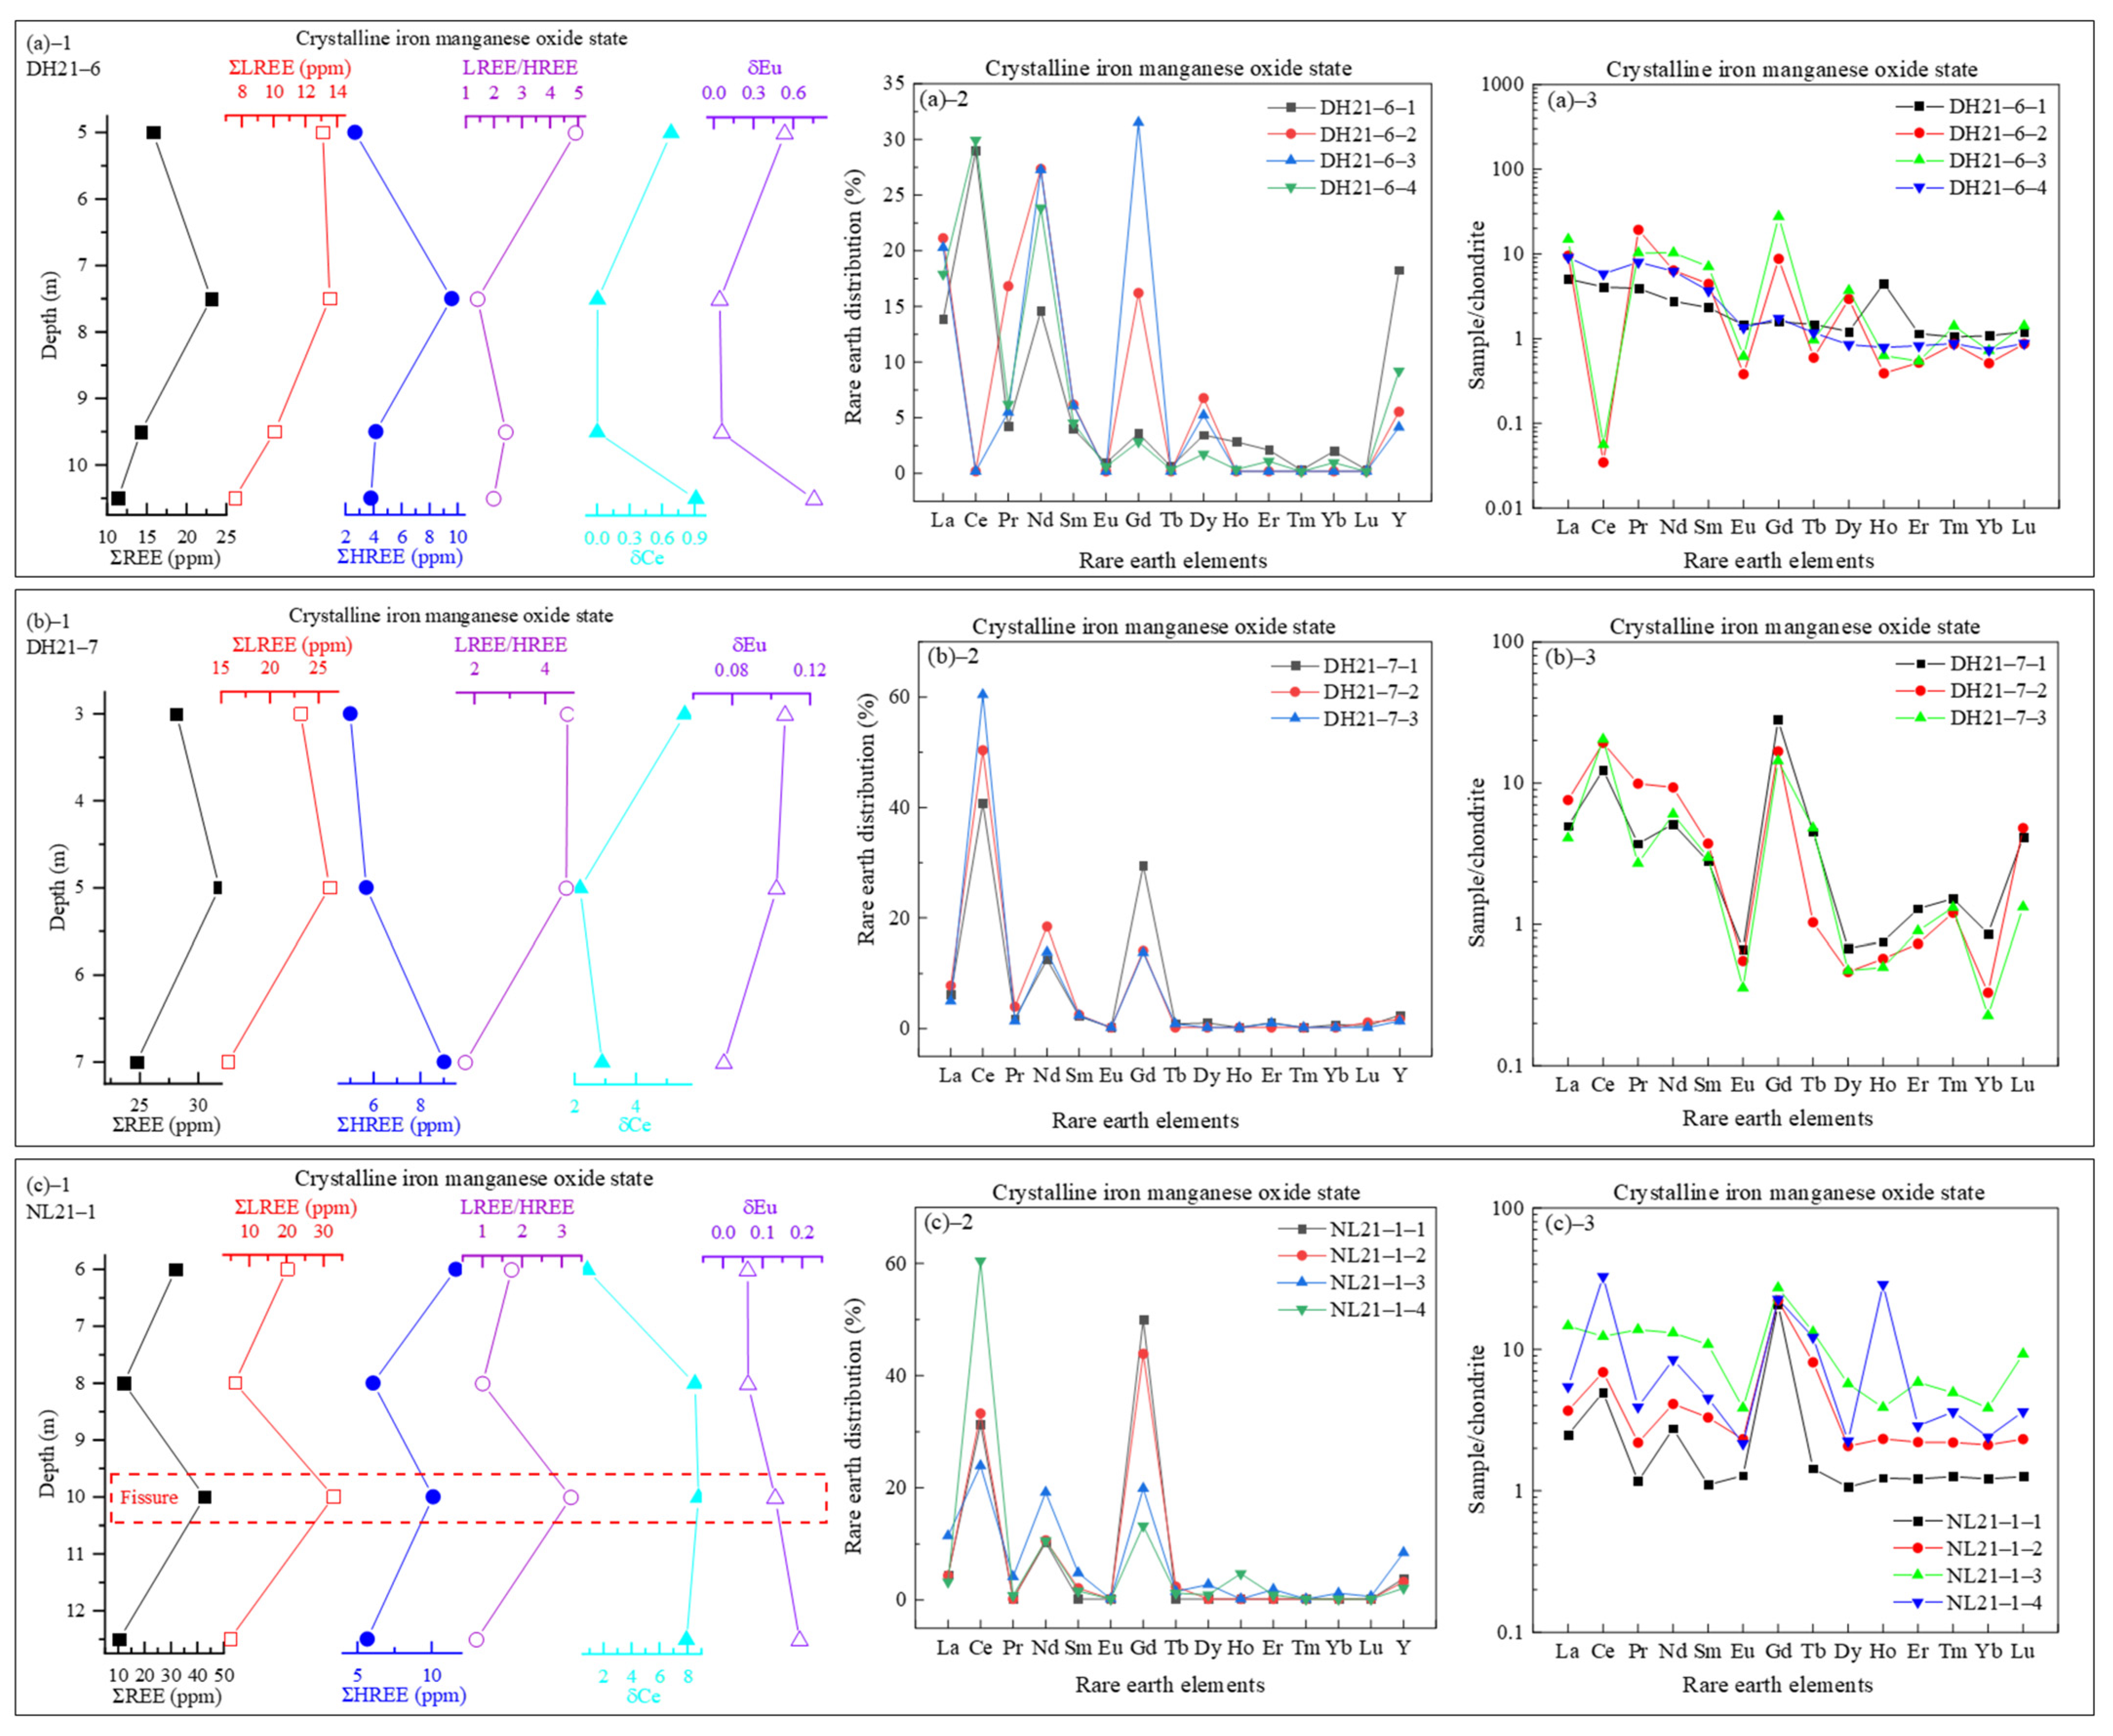
As shown in Figure 13((a)–1–(a)–3), in profile DH21–6, the contents of ΣREEs, LREEs, and HREEs in the crystalline iron-manganese oxide state exhibit an overall increasing-then-decreasing trend with increasing depth, peaking at 23.10 ppm at 7.5 m. The LREE/HREE ratio decreases from 4.9 to 1.4 with increasing depth, which indicates pronounced fractionation between light and heavy REEs. A close examination of the data reveals that both Ce and Eu exhibit substantial negative anomalies. The Ce partitioning is lower in the middle portion of the profile but reaches approximately 30% in both the upper and lower sections, which suggests that crystalline iron-manganese oxides are only weakly enriched in Ce compared to their amorphous counterparts. The partitioning of HREEs such as Gd, Dy, Ho, and Y exceeds 2.5%, which indicates a relative enrichment of HREEs in the crystalline phase compared to amorphous iron-manganese oxides.
As demonstrated in Figure 13((b)–1–(b)–3), in profile DH21–7, the contents of ΣREEs and LREEs in the crystalline iron-manganese oxide state also show an increase followed by a decrease with increasing depth, with the ΣREEs peaking at 31.79 ppm at 5.0 m. The content of HREEs increases steadily with the depth. The LREE/HREE ratio exhibits a decline from 4.62 to 1.74, again indicating differentiated enrichment between light and heavy REEs at various depths. A significant positive Ce anomaly is apparent, while Eu persists in exhibiting a negative anomaly. The Ce partitioning exceeds 40.00% and the Gd partitioning exceeds 15.00%, which is followed by substantial Y partitioning. This finding lends further credence to the hypothesis that the crystalline iron-manganese oxide state is more enriched in HREEs than the amorphous state.
As illustrated in Figure 13((c)–1–(c)–3), in profile NL21–1, the contents of ΣREEs, LREEs, and HREEs in the crystalline iron-manganese oxide state show a slight decreasing trend with increasing depth, with the exception of a fissure zone where the REE content reaches a maximum of 42.73 ppm. The LREE/HREE ratio ranges from 3.23 to 0.85, slightly declining with increasing depth. It is noteworthy that the LREE/HREE ratios exhibit significant fluctuations above and below the fissure, reaching a peak at the fissure itself. This observation suggests the presence of substantial REE enrichment, particularly of LREEs, within this specific zone. Furthermore, the Ce exhibits a marked positive anomaly, increasing with the depth, while the Eu maintains a negative anomaly. In the middle section of the profile, the Ce and Gd partitioning both exceed 20.00%, which is followed by the Nd and Y at around 10.00%.

3.4. REEs Migration and Fractionation Patterns

3.4.1. Mineral Weathering Processes and REEs Release Mechanisms

Under favorable conditions (e.g., well-developed fissures, humid climates, and gentle slopes), the parent rocks in the study area—medium- to coarse-grained (porphyritic) biotite monzogranite—are more susceptible to weathering and leaching [6,42]. Minerals such as K-feldspar and biotite undergo secondary alteration, forming clay minerals like kaolinite. In the lower part of the completely weathered layer, 2:1-type clay minerals (illite and montmorillonite) gradually transform into 1:1-type minerals (kaolinite and halloysite). Ultimately, under oxidative leaching, kaolinite and halloysite undergo desilication and Al enrichment. Primary iron minerals (e.g., hematite) are first converted into ferrihydrite (Fe5+10O14(OH)2), then into goethite (α-FeOOH), and finally into amorphous hematite (α-Fe2O3). This transformation is accompanied by reduced crystallinity and an increased specific surface area, leading to a weakened adsorption capacity for HREEs and relative LREE enrichment in shallow layers.
Geochemical data reveal that the ore samples are characterized by high SiO2, K2O, and Al2O3 contents but low CaO, MgO, and TiO2, with elevated REE background values. This suggests that mineral weathering initiates at surfaces, edges, or cleavage planes, forming dissolution pits and weathering fissures. During this process, soluble cations (e.g., K+, Na+, Mg2+) are leached, while less mobile ions (e.g., Si4+, Al3+) remain in situ. Due to the similar ionic radii of Na+ (1.02 Å), Ca2+ (1.00 Å), and REE3+ (0.85–1.03 Å), the leaching of these cations creates favorable conditions for REE3+ migration and retention.
Weathering of REE-bearing independent minerals releases REE3+, which enters solutions under specific pH conditions and migrates with the surface/groundwater, ultimately being enriched in the middle-upper completely weathered layer. LREEs dominate the upper sections, while HREEs accumulate in deeper zones. The Chemical Index of Alteration (CIA) ranges from 79.57 to 93.5, which indicates intense chemical weathering that enhances REE release and redistribution.

3.4.2. Fractionation Characteristics of REE Occurrence States

This systematic analysis of three representative profiles reveals that REEs primarily occur in ion-exchangeable, residual, and iron-manganese oxide-bound states, collectively accounting for >95% of the total REEs. Distinct fractionation patterns are observed: in profiles DH21-6 and NL21-1, the ion-exchangeable REEs increase significantly with the depth, while the LREE/HREE ratio declines, which suggests preferential downward migration of HREEs with leaching fluids. Residual REEs are hosted in unweathered or resistant minerals. In NL21-1, residual REEs remain stable (~32% of total REEs). With an increasing depth, the Ce partitioning in this state rises markedly, exceeding 60%, which indicates the presence of Ce-rich independent minerals (e.g., monazite).
Iron-manganese oxide-bound REEs exhibit selective adsorption: amorphous iron-manganese oxides show strong affinity for Ce, with partitioning values >80%, which results in pronounced positive Ce anomalies (δCe = 2–45). Crystalline iron-manganese oxides preferentially adsorb HREEs, with Gd partitioning up to 15%. In DH21-7, iron-manganese oxide-bound REEs constitute 45.37%–47.03% of the total REEs, peaking at 200.85 ppm.
These adsorption differences are key drivers of vertical REE fractionation. Iron-manganese oxides typically occur as aggregates filling bedrock fissures/pores or coexist with cerianite in weathering profiles. Redox-sensitive REEs (e.g., Ce) are directly influenced by the redox conditions: Ce3+ oxidizes readily to Ce4+, which has lower solubility and forms stable cerianite (CeO2). Consequently, Ce accumulates in topsoil, creating significant positive anomalies [43,44].
In the lower weathering crust, goethite dominates, while hematite prevails in upper layers. Mn often coexists with Fe oxides. REEs are adsorbed via inner-sphere complexation, and selectivity differences may arise from microscopic adsorption configurations and coordination changes [45]. Crystalline iron-manganese oxides preferentially fix HREEs through inner-sphere complexation, driving LREE adsorption by clay minerals and forming ion-exchangeable states with notable fractionation effects in WCE-REOs.

4. Conclusions

This study systematically analyzes three representative weathering profiles of high-altitude thick WCE-REOs in the Lincang granite, elucidating the enrichment and fractionation mechanisms of REEs. The key findings include the following:
(1)
Mineralogical characteristics: The weathering profiles are predominantly composed of clay minerals (kaolinite, halloysite, illite, and minor montmorillonite) and iron oxides, exhibiting typical geochemical signatures of weathered REE deposits—high SiO2 (64.10–74.40 wt.%) and Al2O3 (15.50–20.20 wt.%) and low CaO/MgO. With increasing depth, 2:1-type clay minerals transform into 1:1 types, while iron oxides show increasing crystallinity, transitioning from poorly structured forms in surface layers to well-crystallized hematite at depth;
(2)
REE occurrence and fractionation: The total REE contents (ΣREEs: 238.12–1545.53 ppm) display distinct vertical fractionation, with LREEs being enriched in upper layers and HREEs increasing downward. Sequential extraction reveals that REEs primarily occur in ion-exchangeable (peaking at 819.96 ppm), residual, and iron-manganese oxide-bound states (>95% of total). Amorphous iron-manganese oxides show strong Ce affinity (partitioning >80%), while crystalline phases preferentially adsorb HREEs (e.g., Gd partitioning up to 15%);
(3)
Structural controls: Fissure systems critically govern REE redistribution, inducing localized enrichment (e.g., ΣREEs reaching 1545.53 ppm in fissure zones). Fluids migrating along fractures concentrate amorphous iron-manganese oxides in overlying strata, facilitating multistage mineralization;
(4)
Mineralization mechanisms: Under weakly acidic conditions, weathering-prone minerals release REEs, with LREEs migrating downward and HREEs accumulating in deeper secondary minerals. Residual REEs exhibit increasing Ce partitioning (to 60%) with increasing depth, which indicates the presence of independent REE minerals (e.g., monazite).
These findings provide a theoretical foundation for exploring high-altitude thick WCE-REOs, clarifying REE migration-enrichment in weathering crusts, and offering guidance for resource assessment and sustainable extraction.

Author Contributions

Conceptualization, R.C. and Z.Z.; Data curation, D.L.; Formal analysis, Z.C.; Funding acquisition, R.C.; Methodology, F.L. and D.L.; Project administration, R.C. and Z.Z.; Supervision, R.C. and Z.Z.; Validation, F.L.; Visualization, Z.C.; Writing—original draft, D.L.; Writing—review and editing, F.L. and Z.Z. All authors have read and agreed to the published version of the manuscript.

Funding

This research was funded by the National Natural Science Foundation of China (52222405, 92475206, 92462303) and the Natural Science Foundation Innovation Group Project of Hubei Province (2023AFA044).

Data Availability Statement

The original contributions presented in this study are included in the article. Further inquiries can be directed to the corresponding author.

Acknowledgments

Thanks for the great effort by the editors and reviewers.

Conflicts of Interest

The authors declare no conflicts of interest.

References

  1. Borst, A.M.; Smith, M.P.; Finch, A.A.; Estrade, G.; Villanova-De-Benavent, C.; Nason, P.; Marquis, E.; Horsburgh, N.J.; Goodenough, K.M.; Cheng, X. Adsorption of rare earth elements in regolith-hosted clay deposits. Nat. Commun. 2020, 11, 4386. [Google Scholar] [CrossRef]
  2. Kynicky, J.; Smith, M.P.; Xu, C. Diversity of rare earth deposits: The key example of China. Elements 2012, 8, 361–367. [Google Scholar] [CrossRef]
  3. García, M.V.R.; Krzemień, A.; Del Campo, M.Á.M.; Álvarez, M.M.; Gent, M.R. Rare earth elements mining investment: It is not all about China. Resour. Policy 2017, 53, 66–76. [Google Scholar] [CrossRef]
  4. Li, M.Y.H.; Zhou, M.F. The role of clay minerals in formation of the regolith-hosted heavy rare earth element deposits. Am. Miner. 2020, 105, 92–108. [Google Scholar] [CrossRef]
  5. Yan, C.H.; Huang, X.W. Review on research of rare earths field in China in 2023. J. Chin. Soc. Rare Earths 2024, 42, 381–418. [Google Scholar]
  6. Zhang, L.; Wu, K.X.; Chen, L.K.; Zhu, P.; Ouyang, H. Overview of metallogenic features of ion-adsorption type REE deposits in Southern Jiangxi Province. J. Chin. Soc. Rare Earths 2015, 33, 10–17. [Google Scholar]
  7. Cheng, J.C. Tectonic surroundings forming west Yunnan granitoids and their rock characters. Yunnan Geol. 1989, 8, 205–212. [Google Scholar]
  8. Li, X.L. Basic characteristics and formation structural environment of Lincang composite granite batholith. Yunnan Geol. 1996, 15, 1–18. [Google Scholar]
  9. Dong, G.C.; Mo, X.X.; Zhao, Z.D.; Zhu, D.C.; Goodman, R.C.; Kong, H.L.; Wang, S. Zircon U–Pb dating and the petrological and geochemical constraints on Lincang granite in Western Yunnan, China: Implications for the closure of the Paleo-Tethys Ocean. J. Asian Earth Sci. 2013, 62, 282–294. [Google Scholar] [CrossRef]
  10. Ming, T.X.; Tang, Z.; Bao, C.F.; Li, R.; Zhan, D.Q.; Yang, Q.B.; Hao, X.F.; Yu, H.J. Prospect, research progress and distribution characteristics of rare earth minerals in Yunnan Province. J. Chin. Soc. Rare Earths 2022, 40, 577–590. [Google Scholar]
  11. Fan, W.M.; Pang, T.P.; Wang, Y.J. Triassic magmatism in the southern Lancangjiang zone, southwestern China and its constraints on the tectonic evolution of Paleo-Tethys. Earth Sci. Front. 2009, 16, 291–302. [Google Scholar]
  12. Jian, P.; Liu, D.Y.; Zhang, Q.; Zhang, F.Q.; Shi, Y.R.; Shi, G.H.; Zhang, C.Q.; Tao, H. Shrimp dating of ophiolite and leucocratic rocks within ophiolite. Earth Sci. Front. 2003, 10, 439–456. [Google Scholar]
  13. Lu, L.; Wang, D.H.; Wang, C.H.; Zhao, Z.; Feng, W.J.; Xu, X.C.; Chen, C.; Zhong, H.R. The metallogenic regularity of ion-adsorption type REE deposit in Yunnan Province. Acta Geol. Sin. 2020, 94, 179–191. [Google Scholar]
  14. Lin, L. Rock Geochemical Characteristics of Lincang Granodiorite and Its Genesis in Yunnan. Master’s Thesis, Chengdu University of Technology, Chengdu, China, 2017. [Google Scholar]
  15. Li, J.F.; Ma, K.M.; Lu, Y.Y.; Fu, J.M.; Cheng, S.B.; Li, Y.; Li, C.B. Timing and tectonic setting of the Gaoaobei Tungsten-Molybdenum deposit in Nanling Range, south China. J. Earth Sci. 2024, 35, 890. [Google Scholar] [CrossRef]
  16. Xu, Q.H.; Yang, L.F.; Wang, D.S.; Hou, X.; Sun, Y.Y.; Zhou, X.Z.; Zhou, X.M.; Li, Y.X. Evaluating the fractionation of ion-adsorption rare earths for in-situ leaching and metallogenic mechanism. J. Rare Earths 2018, 36, 1333–1341. [Google Scholar] [CrossRef]
  17. Bao, Z.W.; Zhao, Z.H. Geochemistry of mineralization with exchangeable REY in the weathering crusts of granitic rocks in south China. Ore Geol. Rev. 2008, 33, 519–535. [Google Scholar] [CrossRef]
  18. Liu, W.; Tian, G.; Guo, Y.C.; Gu, Z.L.; Yang, Z.F. Study on extraction method of ionic phase rare earth from ionic rare earth ore. J. Chin. Soc. Rare Earths 2023, 43, 173–182. [Google Scholar]
  19. Luo, F.; Yan, J.Y.; Liang, J.; Zhang, S.; Wu, D.H.; Rao, G.W.; Hu, W.Q.; Fu, G.M. Application status and prospect of geophysical technology in rare-earth resources field. J. Chin. Soc. Rare Earths 2024, 42, 1088–1101. [Google Scholar]
  20. Zhang, Z.Y.; Jiang, L.; Guo, W.D.; Yang, J.; Liu, D.F. Flotation behavior and adsorption mechanism of 2-hydroxy-3-naphthyl hydroxamic acid on bastnaesite surface. J. Rare Earths 2024, 43, 1084–1090. [Google Scholar] [CrossRef]
  21. Zhang, Z.Y.; Sun, N.J.; He, Z.Y.; Chi, R.A. Local concentration of middle and meavy rare earth elements in the col on the weathered crust elution-deposited rare earth ores. J. Rare Earths 2018, 36, 552–558. [Google Scholar] [CrossRef]
  22. Bai, Y.; Deng, Z.X.; Bi, X.L.; Chuan, W.T.; Yin, W.; Xia, J.F. New discovery of rare-earth mineralization of the weathering crust type and ore-search prospect in the Lancang area, Yunnan province. Geol. Explor. 2021, 57, 762–783. [Google Scholar]
  23. Lu, L.; Wang, D.H.; Wang, C.H.; Zhao, Z.; Feng, W.J.; Xu, X.H.; Yu, S. Mineralization regularity of ion-adsorption type REE deposits on Lincang granite in Yunnan Province. Acta Geol. Sin. 2019, 93, 1466–1478. [Google Scholar]
  24. Zhang, M.; Li, Y.; He, X.C.; Feng, J.L.; Zheng, Y.; Wang, H.; Du, J.G.; Wang, S.S. Mineralization of the ion adsorption-type REE deposits in the central part of the Lincang granites in western Yunnan. Sediment. Geol. Tethyan Geol. 2018, 38, 37–47. [Google Scholar]
  25. Ali, A.; Chiang, Y.W.; Santos, R.M. X-Ray Diffraction techniques for mineral characterization: A review for engineers of the fundamentals, applications, and research directions. Minerals 2022, 12, 205. [Google Scholar] [CrossRef]
  26. Lin, Z.X. Distinguishing Halloysite from Kaolinite by the use of Dimethyl Sulfoxide treatment. Rock Miner. Anal. 1988, 1, 58–61. [Google Scholar]
  27. GB/T 25282-2010; Sequential Extraction Program for 13 Trace Element Forms in Soil and Sediment: General Administration of Quality Supervision. Standardization Administration of the People’s Republic of China: Beijing, China, 2010; p. 12.
  28. Xu, Y.J.; Zuo, W.Z. The preliminary research on the cause of the clay minerals. J. North China Univ. Sci. Technol. (Nat. Sci. Ed.) 2013, 35, 68–72. [Google Scholar]
  29. Chen, T.; Wang, H.J.; Zhang, Z.Q.; Wang, H. An approach to paleoclimate- reconstruction by clay minerals. Acta Sci. Nat. Univ. Pekin. 2005, 2, 309–316. [Google Scholar]
  30. Huang, J. REE Enrichment and Fractionation Mechanism of the Renju Ion Adsorption Type REE Deposit in Guangdong Province. Ph.D. Thesis, University of Chinese Academy of Sciences (Guangzhou Institute of Geochemistry, Chinese Academy of Sciences), Beijing, China, 2021. [Google Scholar]
  31. Rickwood, P.C. Boundary lines within petrologic diagrams which use oxides of major and minor elements. Lithos 1989, 22, 247–263. [Google Scholar] [CrossRef]
  32. Nesbitt, H.; Young, G. Early Proterozoic climates and plate motions inferred from major element chemistry of lutites. Nature 1982, 299, 715–717. [Google Scholar] [CrossRef]
  33. Li, Y.; Zhao, W.W.; Zhou, M.F. Nature of parent rocks, mineralization styles and ore genesis of regolith-hosted REE deposits in South China: An integrated genetic model. J. Asian Earth Sci. 2017, 148, 65–95. [Google Scholar] [CrossRef]
  34. Deng, Y.F. An attempt to locate hidden leaching adsorption-type rare earth deposits in granite weathering crusts using soil pH values. Earth Environ. 1985, 2, 74–78. [Google Scholar]
  35. Bern, C.R.; Yesavage, T.; Foley, N.K. Ion-adsorption REEs in regolith of the Liberty Hill pluton, South Carolina, USA: An effect of hydrothermal alteration. J. Geochem. Explor. 2017, 172, 29–40. [Google Scholar] [CrossRef]
  36. Li, G.L.; Long, W.K.; Luo, W.P.; Yang, Y.L.; Liu, X.D.; Wu, B.; Wei, X.L.; Li, C.X. A detailed research on allanite in weathered sphere from the Xiajialing REE deposit in Xiangshan, Jiangxi, and its metallogenic significance. Acta Petrol. Sin. 2022, 38, 2067–2079. [Google Scholar]
  37. Peng, L.L.; Chen, B.F.; Zou, X.Y.; Zou, Z.Q.; Xiao, W.G.; Que, X.H. Rare earth partitioning characteristics and new scheme for classification of ion-adsorption type rare earth ore. J. Chin. Soc. Rare Earths 2021, 39, 624–632. [Google Scholar]
  38. Boynton, W.V. Cosmochemistry of the rare earth elements: Meteorite studies. In Developments in Geochemistry; Elsevier: Amsterdam, The Netherlands, 1984. [Google Scholar]
  39. Pan, J.X.; Zhao, L.S.; Li, Z.; Huang, X.W.; Feng, Z.Y.; Chen, J. Occurrence and vertical distribution of aluminum and rare earths in weathered crust elution-deposited rare earth ore: Effect of soil solution pH and clay minerals. J. Rare Earths 2024, 42, 1394–1402. [Google Scholar] [CrossRef]
  40. Jian, D.; Xing, D. Complexation of REE in hydrothermal fluids and its significance on REE mineralization. Minerals 2024, 14, 531. [Google Scholar] [CrossRef]
  41. Pan, Z.W.; Lu, Y.X.; Luo, J.H.; Tang, Z.; Yu, H.J.; Su, X.Y.; Yang, Q.B.; Fu, H. REE distribution characteristics of the Yingpanshan ion adsorption type rare-earth deposit in the Longchuan area of western Yunnan. Geol. Explor. 2021, 57, 784–795. [Google Scholar]
  42. He, Y.; Cheng, L.; Li, Y.; Ran, D.J.; Wei, Q.S. The mineralization mechanism of the ion adsorption type rare earths ore and prospecting marks. Chin. Rare Earths 2015, 36, 98–103. [Google Scholar]
  43. Ichimura, K.; Sanematsu, K.; Kon, Y.; Takagi, T.; Murakami, T. REE redistributions during granite weathering: Implications for Ce anomaly as a proxy for paleoredox states. Am. Mineral. 2020, 105, 848–859. [Google Scholar] [CrossRef]
  44. Janots, E.; Bernier, F.; Brunet, F.; Muñoz, M.; Trcera, N.; Berger, A.; Lanson, M. Ce(III) and Ce(IV) (re)distribution and fractionation in a laterite profile from Madagascar: Insights from in situ XANES spectroscopy at the Ce LIII-edge. Geochim. Cosmochim. Acta 2015, 153, 134–148. [Google Scholar] [CrossRef]
  45. Ohta, A.; Kagi, H.; Nomura, M.; Tsuno, H.; Kawabe, I. Coordination study of rare earth elements on Fe oxyhydroxide and Mn dioxides: Part I. Influence of a multi-electron excitation on EXAFS analyses of La, Pr, Nd, and Sm. Am. Mineral. 2009, 94, 467–475. [Google Scholar] [CrossRef]
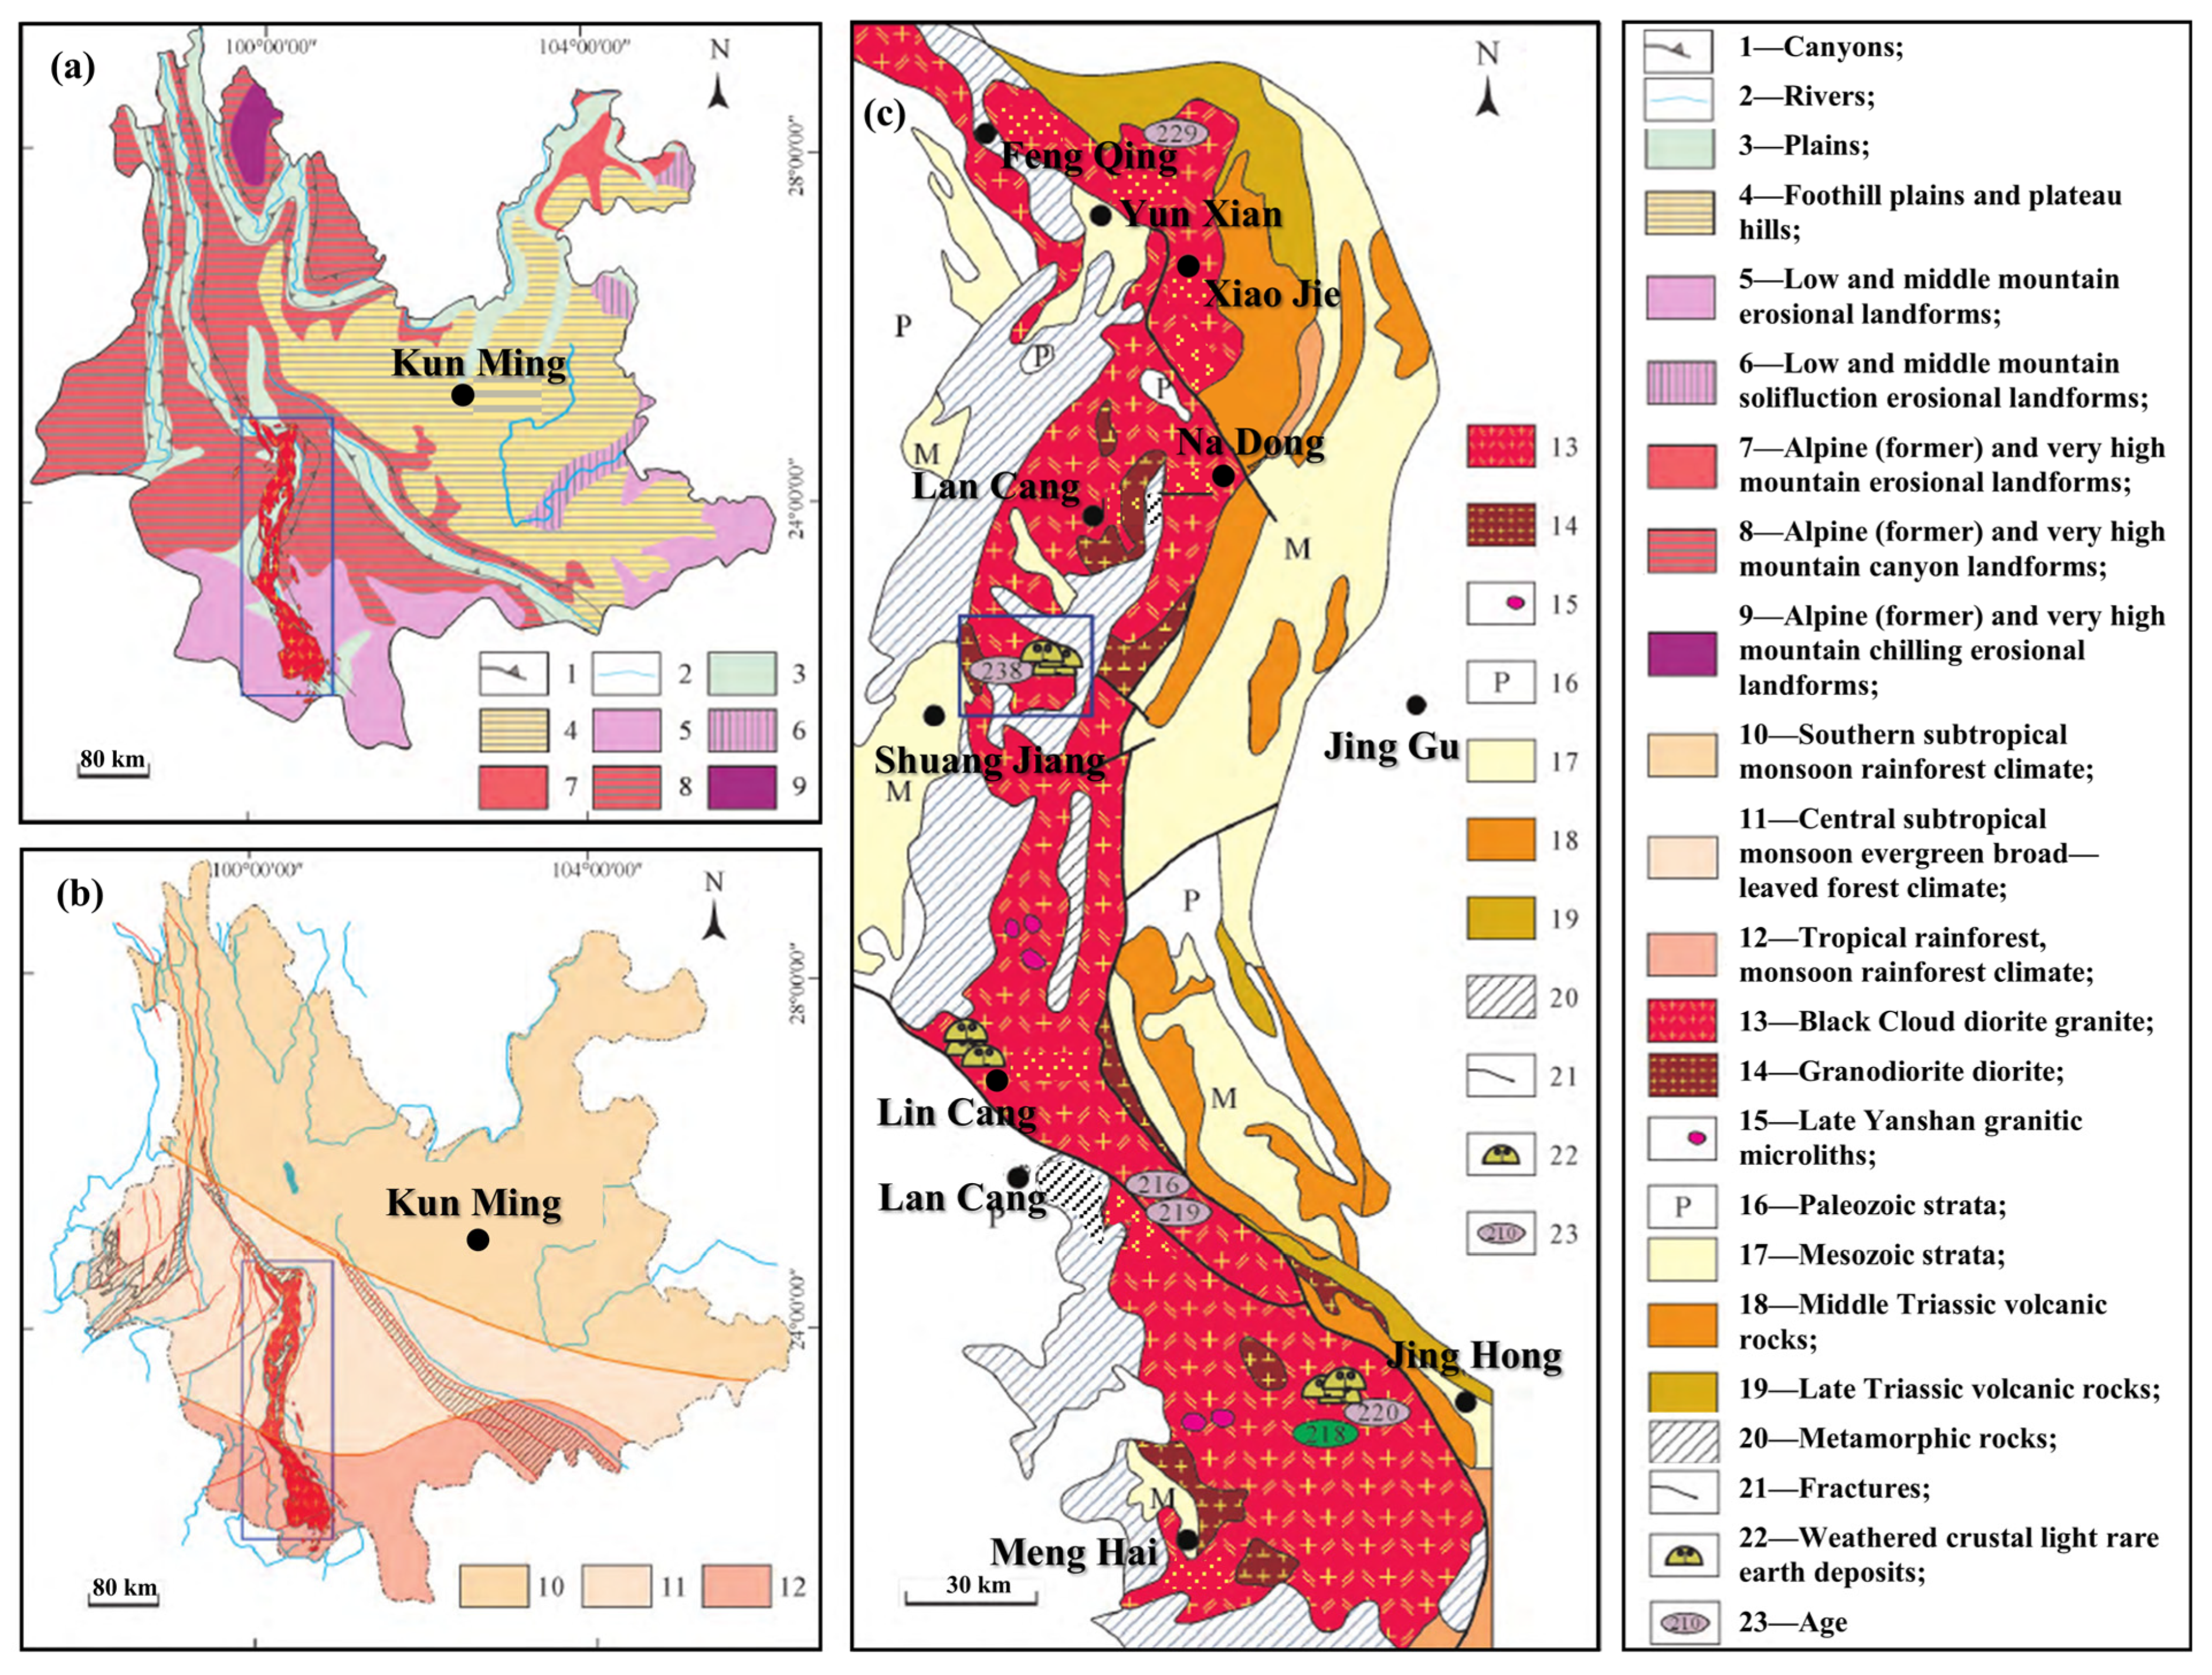
Figure 1. Regional distribution patterns of REEs: resource reserves and Yunnan Province geological setting, (a) geomorphic and climatic attributes of Yunnan Province, (b) distribution map of Yunnan Province and geological map of Lincang granite, and (c) climate and geomorphic base map (climate and topography of Yunnan Province based on Liu Mingguang, 2009; distribution map of intrusive rocks adapted from Yunnan Provincial Bureau of Geology and Mineral Resources, 1990) [13].
Minerals 15 00932 g001
Figure 2. Distribution of rare earth elements in major monzonite rock mass.
Minerals 15 00932 g002
Figure 3. XRD patterns of clay mineral: (a) profiles DH21–6, (b) profiles DH21–7, and (c) profiles NL21–1.
Minerals 15 00932 g003
Figure 4. Mineral composition and content changes in weathering profiles: (a) profiles DH21–6, (b) profiles DH21–7, and (c) profiles NL21–1.
Minerals 15 00932 g004
Figure 5. (a) TAS diagram and (b) A/NK–A/CNK diagram of REE ore profiles in the Lincang weathering crust.
Minerals 15 00932 g005
Figure 6. Main elements and chemical alteration index (CIA) with depth in weathering profiles: (a) DH21–6, (b) DH21–7, and (c) NL21–1 (The dashed box indicates the sampling point at the fissure).
Minerals 15 00932 g006aMinerals 15 00932 g006b
Figure 7. FESEM images and EDS spectra of whole-rock samples from each weathering profile: (a) DH21–6, (b) DH21–7, and (c) NL21–1.
Minerals 15 00932 g007
Figure 8. Changes in ΣREEs, LREEs, HREEs, LREEs/HREEs, δCe, and δEu with depth in each weathering profile: ((a)–1) DH21–6, ((b)–1) DH21–7, and ((c)–1) NL21–1. REE partitioning and chondrite-normalized REE patterns of whole-rock samples from each weathering profile: ((a)–2,(a)–3) DH21–6, ((b)–2,(b)–3) DH21–7, and ((c)–2,(c)–3) NL21–1.
Minerals 15 00932 g008
Figure 9. Content and proportion of REEs in each occurrence state across weathering profile samples: ((a)–1,(a)–2) DH21–6, ((b)–1,(b)–2) DH21–7, and ((c)–1,(c)–2) NL21–1 (A: ion-exchangeable state, B: carbonate-bound state, C: humic acid-bound state, D: amorphous iron-manganese oxide-bound state, E: crystalline iron-manganese oxide-bound state, F: organic matter-bound state, and G: residual state).
Minerals 15 00932 g009
Figure 10. Characteristics of REEs content and partitioning in the ion-exchange state within weathered crust profiles: ((a)–1(a)–3) DH21–6, ((b)–1(b)–3) DH21–7, and ((c)–1(c)–3) NL21–1.
Minerals 15 00932 g010
Figure 11. Characteristics of REEs content and partitioning in the residual state of weathered crust profiles: ((a)–1(a)–3) DH21–6, ((b)–1(b)–3) DH21–7, and ((c)–1(c)–3) NL21–1.
Minerals 15 00932 g011
Figure 12. Characteristics of REE content and partitioning in the amorphous iron-manganese oxide state across weathered crust profiles: ((a)–1(a)–3) DH21–6, ((b)–1(b)–3) DH21–7, and ((c)–1(c)–3) NL21–1.
Minerals 15 00932 g012
Figure 13. REE content and partitioning characteristics in the crystalline iron-manganese oxide state across weathered crust profiles: ((c)–1(a)–3) DH21–6, ((b)–1(b)–3) DH21–7, and ((c)–1(c)–3) NL21–1.
Minerals 15 00932 g013
Table 1. Statistical table of sampling condition.
Profile NumberAltitude (m)Sampling NumberDepth (m)
DH21–6
Donghe Township
2070DH21–6–110.5
DH21–6–29.5
DH21–6–37.5
DH21–6–45
DH21–7
Donghe Township
2120DH21–7–17
DH21–7–25
DH21–7–33
NL21–1
Nanling Township
1880NL21–1–112.5
NL21–1–210
NL21–1–38
NL21–1–4Fissure
Table 2. REE contents and ratios in bedrock of Lincang batholith.
Rock MassSyntexis-Type Intermediate-Acid Hypabyssal Rocks and PorphyryLincang and Fengqing Western Rock BodiesAnatectic GraniteREE Characteristics of Different Lithologies in
Lincang Batholith
12Dongqing Biotite MonzograniteBiotite MonzograniteMedium-Grained Biotite Granite
ΣREE (ppm)148164213226212.19221.1215.81
ΣCe/ΣY4.486.303.912.335.163.872.86
δEu0.941.030.520.320.590.530.14
La/Sm7.968.16.96.056.735.985.11
La/Yb19.6730.718.09.689.9312.697.25
(Ce/Yb)n7.0611.46.13.325.897.544.31
Table 3. Relative contents of It, S, Kao, and Hal.
Sampling NumberIt (%)S (%)Hal/KaoKao (%)Hal (%)
DH21–6–16.221.9013.816.2085.68
DH21–6–24.751.4215.015.8687.97
DH21–6–32.111.141.2842.4454.31
DH21–6–42.760.141.8334.3362.77
DH21–7–13.900.011.9033.1562.93
DH21–7–21.470.600.2975.7222.20
DH21–7–31.090.561.2943.0355.32
NL21–1–14.040.926.1013.3881.66
NL21–1–22.780.143.0623.8973.19
NL21–1–32.470.063.2123.1574.32
NL21–1–41.530.252.0732.0166.21
Table 4. Analytical results for the major elements and REEs in whole-rock samples from each weathering profile.
SampleDH21–6DH21–7NL21–1
Number12341231234
Major Elements (wt.%)
SiO274.39473.92970.79467.52172.36770.43370.21968.99071.75068.49064.175
TiO20.2350.2520.5560.5680.2650.2980.3480.4470.4580.5020.462
Al2O315.63515.57116.35418.55516.11217.63817.48017.04816.27117.89520.168
TFe2O32.0492.1533.7103.7882.0802.9282.6653.4363.2273.5184.114
FeO0.4000.4000.1400.2000.2000.2400.4000.2400.1200.2400.680
MnO0.0550.0360.0510.0280.0460.0420.0260.0220.0340.0880.053
MgO0.4540.4720.8130.8940.4020.4390.4190.6250.4150.6930.816
CaO0.0480.0430.0460.0480.0480.0450.0470.0590.0450.0440.045
Na2O0.0570.0550.0420.0300.1260.0650.1210.1540.0790.1090.053
K2O2.2042.2021.7531.6443.9622.0012.8703.9662.4472.4012.444
P2O50.0280.0310.0420.0400.0260.0270.0320.0490.0470.0470.063
ZrO20.0180.0220.0330.0380.0210.0260.0270.0280.029
REO0.0600.0660.0490.0240.0250.0340.0260.0620.0480.0370.155
LOI4.3634.7685.6176.6224.3205.7845.3204.8745.0305.9366.772
REE (ppm)
REEs603.750662.500486.880238.120245.870343.570268.610620.510482.950370.1801545.530
LREEs445.330535.100420.810211.360214.830308.300243.750438.910395.650322.9901208.720
HREEs158.480127.40066.07026.79031.04035.27024.850181.61087.31047.190336.820
LREEs/HREEs2.8104.2006.3707.8906.9208.7409.8102.4204.5306.8403.590
δCe0.2000.4900.4000.7003.43027.6204.0800.3900.5101.1300.380
δEu0.5400.4100.1800.1400.1700.2500.1900.1100.1100.1200.260
La/Yb16.78021.24033.77053.15038.3509.85036.60013.79027.04077.60023.200
Disclaimer/Publisher’s Note: The statements, opinions and data contained in all publications are solely those of the individual author(s) and contributor(s) and not of MDPI and/or the editor(s). MDPI and/or the editor(s) disclaim responsibility for any injury to people or property resulting from any ideas, methods, instructions or products referred to in the content.