Abstract
To unravel the link between agate geochemistry, host volcanic rocks, and ore-forming processes, this study integrated elemental correlation analysis, interaction interpretation, and interpretable machine learning (LightGBM-SHAP framework with SMOTE and 5-fold cross-validation) using 203 in-situ element datasets from 16 global deposits. The framework achieved 99.01% test accuracy and 97.4% independent prediction accuracy in discriminating host volcanic rock types. Key findings reveal divergence between statistical elemental correlations and geological interactions. Synergies reflect co-migration/co-precipitation, while antagonisms stem from source competition or precipitation inhibition, unraveling processes like stepwise crystallization. Rhyolite-hosted agates form via a “crust-derived magmatic hydrothermal fluid—medium-low salinity complexation—multi-stage precipitation” model, driven by high-silica fluids enriching Sb/Zn. Andesite-hosted agates follow a “contaminated fluid—hydrothermal alteration—precipitation window differentiation” model, controlled by crustal contamination. Basalt-hosted agates form through a “low-temperature hydrothermal fluid—basic alteration—progressive mineral decomposition” model, with meteoric water regulating Na-Zn relationships. Zn acts as a cross-lithology indicator, tracing crust-derived fluid processes in rhyolites, feldspar alteration intensity in andesites, and alteration timing in basalts. This work advances volcanic-agate genetic studies via “correlation—interaction—mineralization model” coupling, with future directions focusing on large-scale micro-area elemental analysis.
1. Introduction
Since systematic studies on agate’s chemical and mineralogical properties began in the 19th century, current research confirms that its diversity is determined by the sources and formation mechanisms of ore-forming fluids [1,2,3,4,5,6,7,8,9,10,11,12,13,14,15,16,17]. Although the majority of global agate deposits are associated with volcanic rocks such as basalt, andesite, and rhyolite, agates also occur in a wider variety of host rocks, including metamorphic [8], sedimentary [18], and even granitic rocks [19]. This diversity of host environments provides valuable insights into the formation settings and geochemical evolution of agates. Their genesis involves the siliceous enrichment during the cooling of post-magmatic hydrothermal fluids, while some deposits formed as alluvial placer deposits through weathering and transportation processes [4,10,20,21]. However, consensus remains elusive regarding the classification criteria for the volcanic rock types hosting agate, as well as their formation processes and mechanisms [3,4,5,7,15,16,19,22,23,24,25,26,27,28,29,30,31,32]. Element data from agates of different origins reveal comparable concentration levels for most chemical elements, suggesting similar formation conditions [1]. Deciphering the geochemical heterogeneities of agate hosted in distinct volcanic rocks illuminates the formation mechanisms of volcanic rock—agate systems.
Recent advances in micro-area in-situ techniques have yielded large major and trace element datasets for single-crystal minerals, fueling machine learning applications in mineralization type discrimination [33,34,35,36,37,38,39,40,41,42,43,44,45,46,47,48,49]. Machine learning demonstrates remarkable capability in processing complex geochemical signatures, as evidenced by its successful applications in analyzing element contents of minerals like apatite, zircon, and sphalerite to distinguish deposit types, identify mineralized zones, and predict mineralization potential [34,38,40,44,48]. However, a critical limitation is that these studies often overlook inter-elemental interactions, which hampers geological interpretation.
Conventional statistical methods (e.g., correlation analysis, PCA) and classical machine learning tools are primary for deciphering patterns in geochemical, mineralogical, and petrological data. Though effective in identifying macroscopic trends (e.g., elemental enrichment/depletion associations) and boosting predictive accuracy, they rarely reveal the mechanisms by which specific features drive geological processes. Traditional ML feature importance metrics can flag “significant” elements for ore deposit classification or mineralization discrimination but cannot quantify context-dependent contributions such as how major and trace elements influences shift with concentration gradients to exert subtle yet critical regulatory effects on mineralization. In contrast, SHAP (SHapley Additive exPlanations) analysis [50,51] addresses these limitations by quantifying individual features’ directional and magnitude contributions to predictions, enabling refined interpretation of complex model outputs [52]. In geology, SHAP is predominantly applied to remote sensing data for dynamic prediction of geological hazards and analyzing the evolution of their driving factors [53,54,55,56]. Notably, this interpretive power—largely untapped in mineralogy—can explicitly identify elemental synergies or antagonisms, thereby elucidating dynamic geochemical patterns during mineralization.
For agates, scarce high-precision data and class imbalances challenge small-sample classification [15]. Here, we focus on major and trace elements of agates hosted in diverse volcanic rocks, comparing 11 common ML models to identify Light Gradient Boosting Machine (LightGBM) as the optimal geochemical-based classifier, with eXtreme Gradient Boosting (XGBoost) validating robustness. Critically, we pioneer the use of SHAP (an interpretable ML method) to reveal complex relationships between elemental geochemistry and agate classification, exploring inter-elemental synergies and individual element contributions to single-sample predictions.
Compared with our prior two-stage random forest-based classification [15], which effectively classified agates (accuracy = 0.9524) but lacked mechanistic explanations for why elements like U, Sb, or Sr drive outcomes, this study represents a breakthrough. SHAP analysis not only validates classification reliability but also uncovers key elemental interaction networks and their geochemical implications, establishing a “data-driven-geochemical validation” paradigm. This shift from mere classification to mechanistic interpretation overcomes the core limitation of “black-box” models, offering novel insights into agate-formation processes across volcanic environments.
2. Data Preparation and Interpretable Machine Learning Methods
2.1. Data Collection and Preparation
To ensure the reliability and validity of the dataset, agate sample data were carefully classified following published literature, with all element data derived from micro-area in-situ analyses. A total of 203 independent major and trace element datasets from 16 deposits (Figure 1 and Figure 2a; Supplementary Table S1) were compiled. The robustness of the model was tested using 77 test datasets derived from the research team’s previous studies (‘Test’ in Figure 2a,b; Supplementary Table S2). These out-of-sample data were specifically used for model testing and strictly excluded from both the training and testing sets of model development to ensure the robustness of the model analysis.
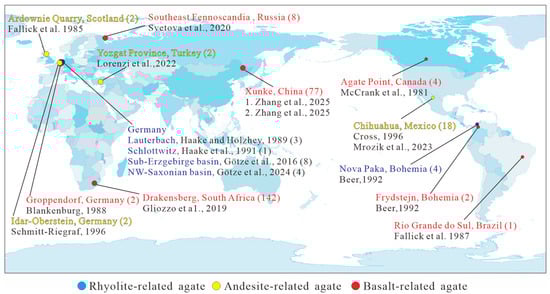
Figure 1.
Agate deposits collected for the study [1,3,4,12,15,24,32,57,58,59,60,61,62,63,64]. (Numbers in parentheses denote the sample sizes provided in the literature. Modified after [15]).
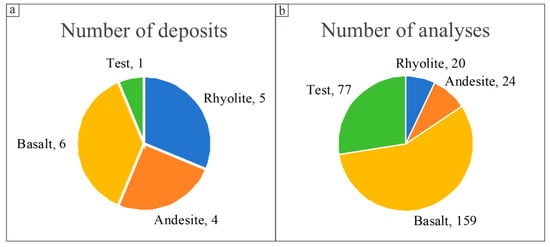
Figure 2.
(a) Number of deposits utilized for machine learning and model testing. (b) Number of analyses employed for machine learning and model testing.
This dataset includes comprehensive element analyses of agates, incorporating 18 most frequently measured major and trace elements categorized into large ion lithophile elements (LILE) and high field strength elements (HFSE), including K, Sr, Cs, Ba, Ti, U (Figure 3a); other lithophile elements, including Na, Mg, Al, Ca, Sc (Figure 3b) and siderophile and chalcophile elements, including Cr, Mn, Fe, Co, Cu, Zn, Sb (Figure 3c). Such classification offers a unified and optimized dataset for subsequent analyses.
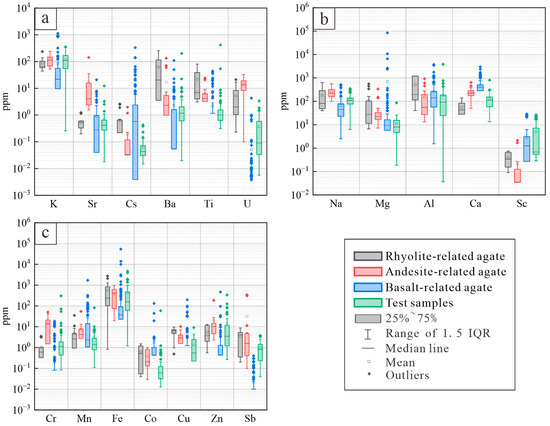
Figure 3.
Box-and-whisker plots of readily measurable major and trace element concentrations in agates associated with three volcanic rock types. (a) Large ion lithophile elements (LILE) and high field strength elements (HFSE); (b) Other lithophile elements; (c) Siderophile and chalcophile elements.
To guarantee the reliability of data, values beneath the detection limit (BDL) were given extremely low values, and missing data were filled in using median values. Raw dataset transformation is essential to mitigate misinterpretation and overfitting risks. To avoid compromising the interpretability of feature relationships, maintain consistency in the cross-model comparative framework, preserve inherent magnitude relationships among the elements, and facilitate direct cross-model comparisons of feature importance, Z-score normalization was ultimately selected. Z-Score standardization normalized data to a mean of 0 and standard deviation of 1, preserving inter-feature relationships, minimizing outlier impacts, and maintaining original distributions. Data preprocessing also included Synthetic Minority Over-sampling Technique (SMOTE) to address class imbalance. SMOTE enhances minority samples by alleviating data overlap, minimizing noise, and avoiding overgeneralization and high variance issues common in existing methods [65].
2.2. Machine Learning Methods
2.2.1. Liner Models
Logistic regression (LR) is a linear classification algorithm that uses a sigmoid function to constrain outputs between 0 and 1. Employing maximum likelihood estimation, it is suitable for multi-class classification tasks [66].
Linear Discriminant Analysis (LDA) is a supervised method for low-dimensional classification, reducing complexity in high-feature datasets using class mean differences. It assumes Gaussian-distributed data and accurate covariance estimation, with performance degraded by outliers or high dimensionality.
2.2.2. Tree-Based Models
The Decision Tree, a fundamental “weak classifier”, serves as the building block for ensemble algorithms such as LightGBM, XGBoost, and random forest. It builds a tree structure to output conditional outcomes and their probabilities, selecting optimal features as root nodes and recursively repeating this to form a complete decision tree [67].
Random Forest is an ensemble classifier with multiple decision trees [67], where each tree is trained on bootstrapped data and uses random feature subsets for optimal splitting, with final predictions via majority voting.
XGBoost, an advanced gradient boosting algorithm with native missing value handling, enhances traditional boosting via Newton-based loss optimization, L1/L2 regularization, and tree complexity penalties to avoid overfitting [68]. It utilizes second-order gradients, parallel processing, and adaptive regularization, iteratively optimizing a regularized objective function to aggregate tree outputs for high-accuracy predictions [69], suiting large-scale classification with balanced accuracy and efficiency.
AdaBoost (Adaptive Boosting), an ensemble algorithm integrating weak learners to build high-precision models [70,71], iteratively adjusts training sample weights. It initializes equal sample weights, increases weights for misclassified samples to focus subsequent models on error correction, and repeats until predefined learners or accuracy is reached, with final predictions via weighted aggregation [72]. It reduces bias through iterative training and variance via ensembling [73], requiring fewer hyperparameters and lower computation than XGBoost but being more sensitive to noise [74].
LightGBM is an efficient gradient boosting framework for large-scale high-dimensional datasets. It uses EFB to combine non-co-occurring features for dimensionality reduction and optimized feature selection, and Gradient-based One-Side Sampling (GOSS) to prioritize large-gradient samples (fixed top proportion) for enhanced efficiency and accuracy [55]. Compared to other ensemble tree models, it retains original features of large datasets with robust performance.
2.2.3. Other Models
Support Vector Machine (SVM), a key supervised method for regression/classification [75], performs well in high-dimensional spaces, using support vectors to construct hyperplanes for reliable predictions even with limited data [76].
Multi-Layer Perceptron (MLP) comprises input, output, and hidden layers with interconnected neurons, using weights/biases and activation functions for non-linear mapping [41]. Optimized via backpropagation, it excels in complex tasks with sufficient data but requires architecture tuning.
Naïve Bayes, a simple method based on Bayes’ theorem assuming attribute conditional independence given class labels, often achieves satisfactory classification accuracy despite its simplicity relative to complex classifiers [44].
K-Nearest Neighbors (KNN), a supervised method determining optimal K via nearest neighbor averaging [77], efficiently performs classification/regression by computing target averages from training neighbors using feature similarity, with K optimized via cross-validation [78]; inference assigns classes by similarity for dual prediction capabilities.
2.2.4. SHAP
SHAP (Shapley Additive Explanations) assigns importance scores by evaluating each feature’s contribution to model outputs, enabling global and local explanations of black-box models [56]. It uses additive feature attribution, with model output as a linear sum of input variable contributions [79], where SHAP values quantify individual feature impacts on sample predictions. Herein, SHAP ranks key elements influencing agate type prediction, providing comprehensive global and local interpretations.
2.3. Machine Learning Model Construction
Using 18 common element concentrations in agates, a machine learning workflow (Figure 4) was implemented with model construction in three sequential stages, utilizing Python v3.8.5 libraries for both models and the SMOTE algorithm.
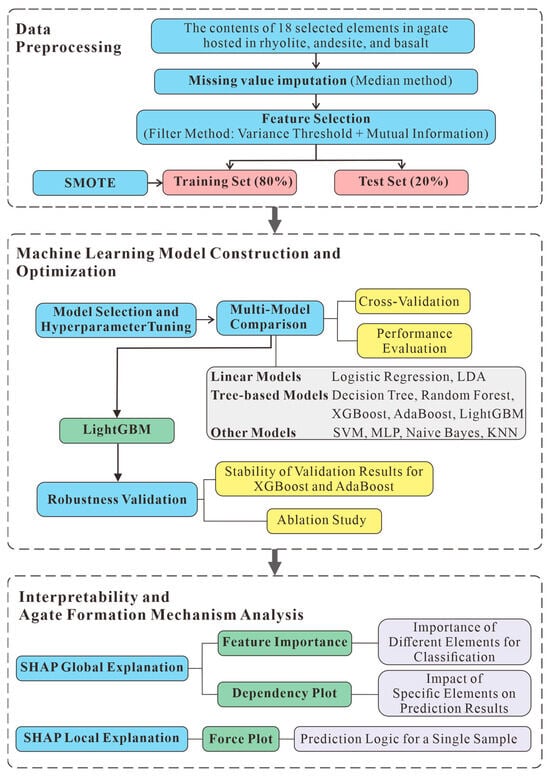
Figure 4.
Framework of the interpretable machine learning used to clarify the geochemical characteristics of agate in different volcanic host rocks.
- Stage 1: Data Preprocessing
Concentration data for 18 elements in rhyolite-, andesite-, and basalt-hosted agates were collected. Missing values were imputed with medians. Values below/above the detection limit are replaced with extremely low/high values. Feature selection used a hybrid filter method combining variance thresholding and mutual information analysis. After SMOTE augmentation, the dataset was split into training and testing sets at an 8:2 ratio.
- Stage 2: Machine Learning Model Construction and Optimization
This stage involved initial model selection with hyperparameter tuning via grid search, followed by cross-validation and performance evaluation through comparative analysis of linear, tree-based, and other architectures. To mitigate instrument measurement biases, multi-source literature datasets under varying conditions were integrated, with alignment preprocessing for missing data from diverse statistical standards and exclusion of unmatched samples to ensure dataset consistency. A stable model was selected, prioritizing lightweight, parsimonious methods with low computational cost (entire process < 1 min) and high interpretability, suitable for the dataset scale and facilitating replication. Ablation studies on main/auxiliary models and out-of-sample prediction verified robustness and reliability.
- Stage 3: Interpretability and Agate-Formation Mechanism Analysis
SHAP supported both global and local interpretations. Globally, it assessed element importance, the impacts of element combinations (via dependence plots), and inter-element interactions across agate types. Locally, force plots visualized how individual elements influenced sample predictions, aiding exploration of agate-formation mechanisms.
3. Results
3.1. Filter-Based Feature Selection
Filter-based feature selection used feature variance and mutual information (Figure 5). Treating elements as features, Figure 5a shows feature variance (horizontal axis) reflecting concentration dispersion: Na, Mn, K, Ca, Al, Fe, and Mghave high variances (significant inter-sample differences), while Sc, U, Cr, and Co have low variances (stable distributions). Figure 5b (horizontal axis) presents mutual information with agate classification—higher values indicate greater predictive importance: Sb, Sr, and U have high mutual information, whereas Al and Mn have lower values.
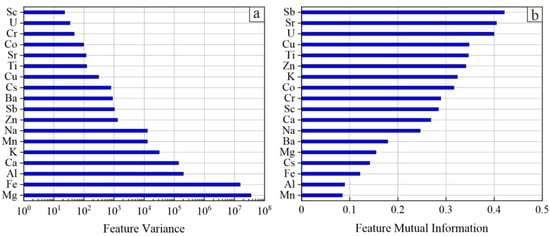
Figure 5.
Histograms of variance (a) and mutual information (b) for 18 common elements in volcanic rock-hosted agates.
Feature selection integrated data dispersion, predictive importance, and geochemical significance to retain elements explaining agate classification and formation-related behaviors while removing redundancy. Mg, Ba, and Cs were retained despite low mutual information (Figure 5b) due to high variance (Figure 5a) and significant content differentiation among the agate (Figure 3a,b). Fe, with “high variance–low mutual information” but clear content differentiation (Figure 3c) and its role as a common coloring element, was retained. In contrast, Al and Mn (also “high variance–low mutual information”) were excluded for low inter-type differentiation (Figure 3b,c), numerous outliers, and redundant/noisy information interfering with learning. After screening, 16 elements were selected for subsequent model construction and interpretable analyses.
3.2. Classifier Comparison
In the agate classification study utilizing elemental features, 11 rigorously optimized classifiers were compared for performance (Table 1). These models employed 16 elements—selected via variance and mutual information screening—from agates hosted in three major volcanic rock types.

Table 1.
Summary of average performance scores of models based on 16 selected elements.
Model performance was evaluated using 11 metrics. These included Accuracy (correct prediction ratio); for multiclass tasks, weighted precision/recall (class-wise averages weighted by sample proportion), weighted F1 (harmonic mean of these), and Macro F1 (average of per-class F1); Macro AUC (average of one-vs-all ROC AUC for class fairness), Micro AUC (global performance via binary flattened predictions), Kappa (agreement beyond chance), AUPR (true positive discrimination via precision-recall curves), and G-Mean (cube root of the geometric mean of class recall scores). All metrics were computed using sklearn.metrics (https://scikit-learn.org/stable/modules/classes.html#module-sklearn.metrics) to ensure methodological rigor, accessed on 28 June 2025.
The G-Mean, a geometric mean of class recall scores, is calculated as their cube root.
The Mean Absolute Error (MAE) maps agate types (rhyolite-hosted, andesite-hosted, basalt-hosted) to labels (0–2) and averages absolute differences between predicted and true values to gauge balanced accuracy.
where denotes the predicted class value and represents the true class value.
Logistic regression achieved a mean accuracy of 0.9460 with high weighted precision (0.9637), whereas LDA showed lower overall performance (mean accuracy = 0.9068) and greater result variability (accuracy SD = 0.0432).
Among tree-based and ensemble models, random forest excelled with the highest mean accuracy (0.9950), stable performance (accuracy SD = 0.0112), and perfect Macro AUC (1.0000) and AUPR (1.0000), indicating robust classification. Decision Tree achieved 0.9752 mean accuracy, with the lowest MAE (0.0165) among single tree models but a relatively low Macro F1 (0.9562) versus ensembles. AdaBoost showed moderate performance (mean accuracy = 0.9802) but significantly higher MAE (0.4077) than other tree-based models, suggesting data distribution sensitivity.
XGBoost and LightGBM both reached 0.9901 mean accuracy with strong consistency (SD = 0.0135). LightGBM had minimal MAE (0.0068) and perfect Macro AUC/AUPR (1.0000), reflecting exceptional generalization. XGBoost, matching in accuracy, had slightly higher MAE (0.0167) but maintained perfect Macro AUC/AUPR, highlighting stability.
SVM and MLP showed moderate performance, with mean accuracies of 0.9756 and 0.9560 respectively. SVM had higher weighted precision (0.9798) but lower Macro F1 (0.9461), while MLP exhibited greater performance variability (accuracy SD = 0.0361). K-Nearest Neighbors (KNN) outperformed Naive Bayes, with higher mean accuracy (0.9755 vs. 0.9459) and low MAE (0.0147), though its Macro F1 (0.9349) was constrained by class imbalance sensitivity.
Overall, rigorously parameter-optimized ensemble models (random forest, XGBoost, LightGBM) outperformed single models, with smaller SDs indicating stronger anti-overfitting ability. LightGBM was optimal, combining the highest error control precision (MAE = 0.0068), perfect discriminative metrics (AUC, AUPR), and stable performance, well-suited to capture complex patterns in agate elemental features. XGBoost and LightGBM’s consistent accuracy, overlapping perfect AUC/AUPR, and comparable stability (similar SDs) confirmed LightGBM’s performance reliability, ensuring robust research conclusions.
3.3. Ablation Experiments and Robustness of LightGBM Model
In three-class classification with imbalanced distributions, tuned LightGBM, XGBoost, and AdaBoost were compared using F1 scores. LightGBM achieved the highest F1 (0.9974) with optimal parameters (learning_rate = 0.2, max_depth = −1, n_estimators = 50). XGBoost’s best F1 was 0.9947 (learning_rate = 0.1, max_depth = 3, n_estimators = 100), while AdaBoost reached 0.9787 (learning_rate = 1.0, n_estimators = 200). LightGBM and XGBoost outperformed AdaBoost, confirming their stronger noise resistance.
To systematically evaluate model performance across feature sets, ablation experiments were conducted using two sets—18 common element features and 16 filter-selected features—with LightGBM/XGBoost, both with and without SMOTE augmentation. Results (Figure 6; Supplementary Table S3) showed SMOTE significantly improved performance. For the 18-element set, LightGBM accuracy remained 0.9901, while XGBoost accuracy increased from 0.9801 to 0.9852; both models’ Macro AUC rose to 1.0000 (from 0.9948 and 0.9998). MAE improved, with LightGBM decreasing from 0.0089 to 0.0063 and XGBoost from 0.0244 to 0.0170. For the 16-element set, SMOTE led to perfect Macro AUC (1.0000) for both models, with MAE decreasing significantly (LightGBM: 0.0097→0.0068; XGBoost: 0.0234→0.0167), indicating excellent generalization. Overall, SMOTE combined with LightGBM/XGBoost achieved optimal performance using the 16-element feature set, providing a robust foundation for subsequent interpretability analyses.
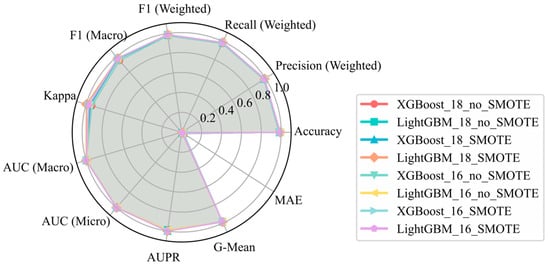
Figure 6.
Performance comparison of LightGBM and XGBoost classifiers under different feature dimensions and SMOTE processing.
Robustness analysis of the primary model was performed via comparison with an alternative model. In both LightGBM (Figure 7a) and XGBoost (Figure 7b), Na, Ca, Sr, U, Sb, Ba, and Sc showed consistent importance trends, with minor ranking variations. LightGBM better identified less prominent features. Na and Ca ranked eighth and fourth in XGBoost but first and second in LightGBM, indicating higher sensitivity to feature utilization.
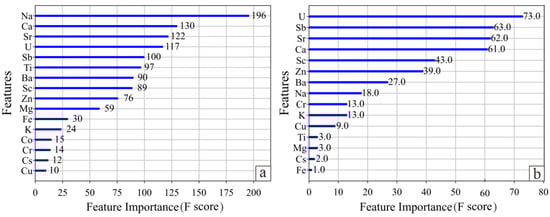
Figure 7.
Feature importance of elements in volcanic rock-hosted agates. (a) LightGBM model; (b) XGBoost model.
To verify model prediction reliability, the trained LightGBM was tested on an untrained ‘Test’ dataset (Supplementary Table S2). Among 77 basalt-hosted agate samples, 75 were correctly predicted (97.4% accuracy; Supplementary Table S4), outperforming our previous two-stage random forest approach which achieved 0.813 accuracy on the same out-of-sample data [15], further validating LightGBM’s robustness.
3.4. SHAP-Derived Interpretations
3.4.1. SHAP Global Explanation
The global feature importance bar plot based on SHAP values (Figure 8) shows that among 16 common elements in agates from different volcanic rocks, Sr, U, and Zn are the most critical for classification, followed by Sc, Sb, and Ca. The remaining 10 elements play secondary roles overall but may act as key predictors for specific types. Ba and Cu strongly influence rhyolite-hosted agate classification but minimally affect andesite-hosted ones; Na and Cr significantly impact andesite-hosted agate predictions, while Cs and Fe notably affect basalt-hosted agate classifications.
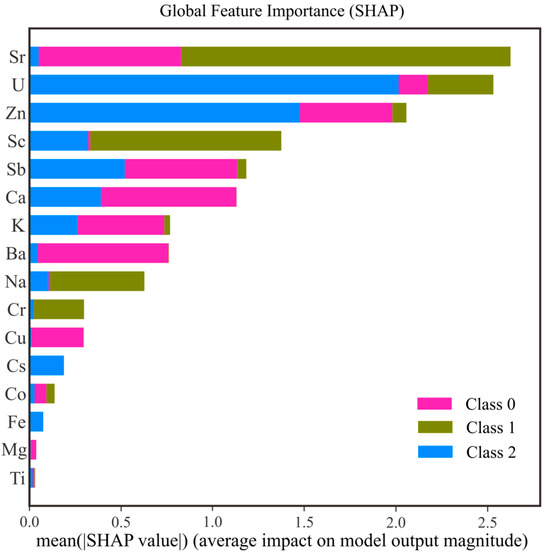
Figure 8.
SHAP-based global feature importance of 16 elements in agates hosted in different volcanic rocks. (Class 0: rhyolite-hosted agates; Class 1: andesite-hosted agates; Class 2: basalt-hosted agates).
3.4.2. Interaction Effect Analysis of Elements
Element interactions were visualized via dependence plots (Figure 9, Figure 10 and Figure 11). Due to small sample size potentially blurring trends, we precomputed SHAP interaction strengths (Supplementary Table S5) and Pearson correlations of SHAP values (Supplementary Table S6). For each class, samples with high absolute interaction strengths and high SHAP value correlations were prioritized for analysis.
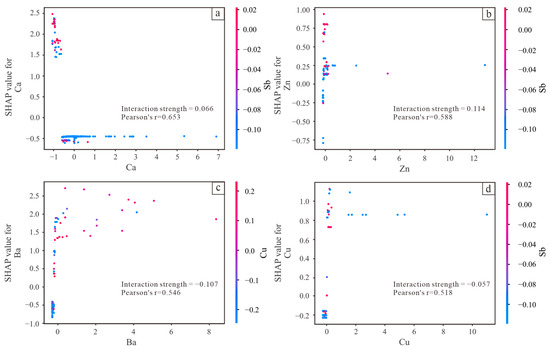
Figure 9.
SHAP-based dependence plots of element interaction effects in rhyolite-hosted agates. (a) SHAP values for Ca (y-axis) vs. Ca content (x-axis), points colored by Sb content; (b) SHAP values for Zn (y-axis) vs. Zn content (x-axis), points colored by Sb content; (c) SHAP values for Ba (y-axis) vs. Ba content (x-axis), points colored by Cu content; (d) SHAP values for Cu (y-axis) vs. Cu content (x-axis), points colored by Sb content.
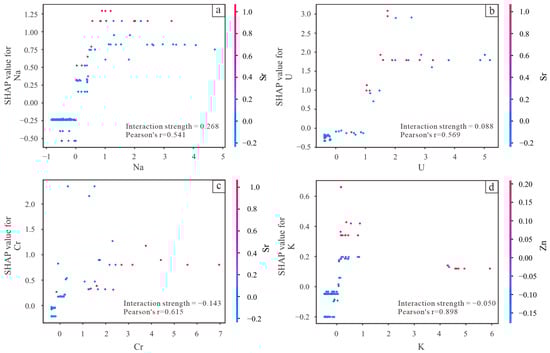
Figure 10.
SHAP-based dependence plots of element interaction effects in andesite-hosted agates. (a) SHAP values for Na (y-axis) vs. Na content (x-axis), points colored by Sr content; (b) SHAP values for U (y-axis) vs. U content (x-axis), points colored by Sr content; (c) SHAP values for Cr (y-axis) vs. Cr content (x-axis), points colored by Sr content; (d) SHAP values for K (y-axis) vs. K content (x-axis), points colored by Zn content.
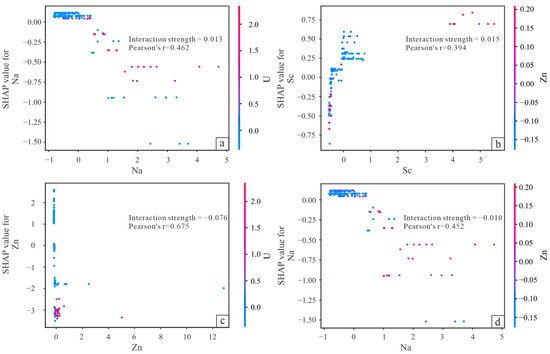
Figure 11.
SHAP-based dependence plots of element interaction effects in basalt-hosted agates. (a) SHAP values for Na (y-axis) vs. Na content (x-axis), points colored by U content; (b) SHAP values for Sc (y-axis) vs. Sc content (x-axis), points colored by Zn content; (c) SHAP values for Zn (y-axis) vs. Zn content (x-axis), points colored by U content; (d) SHAP values for Na (y-axis) vs. Na content (x-axis), points colored by Zn content.
In rhyolite-hosted agates, Ca-Sb (Figure 9a) and Zn-Sb (Figure 9b) showed pronounced synergies (concurrent increases amplified their positive classification impacts via SHAP values), while Ba-Cu (Figure 9c) and Cu-Sb (Figure 9d) exhibited antagonism (co-increases diminished such amplification).
3.4.3. SHAP Local Explanation
The SHAP Force Plot, a widely used SHAP-based visualization tool for interpreting predictions from complex models (e.g., tree-based algorithms), vividly illustrates feature influences on predictions and clarifies the feature-driven classification decision process.
Force Plot analysis of Class 0 (rhyolite-hosted agate) showed predictions (f(x)) significantly above base value (≈−7), dominated by positive contributions (Figure 12). High-impact elements (U, Ba, K) elevated predictions; Sb (contributions: 0.0088–0.0393) acted as a Class 0 diagnostic with consistent positive effects. Despite minor negative pulls from Ca, Sr, Zn, overall predictions remained in the red region, reflecting these elements’ specific sample contributions. Positive synergies in Ca-Sb and Zn-Sb were observed in Figure 12a,b, respectively, while antagonistic interactions in Cu-Sb and Ba-Cu were revealed in Figure 12b,c and Figure 12d,e, respectively. High-contribution elements (e.g., U, Ba) dictated trends, with dynamic element balances (e.g., Ca-Sb synergy, Cu-Ba antagonism) fine-tuning outcomes, highlighting model sensitivity to multi-feature interactions.
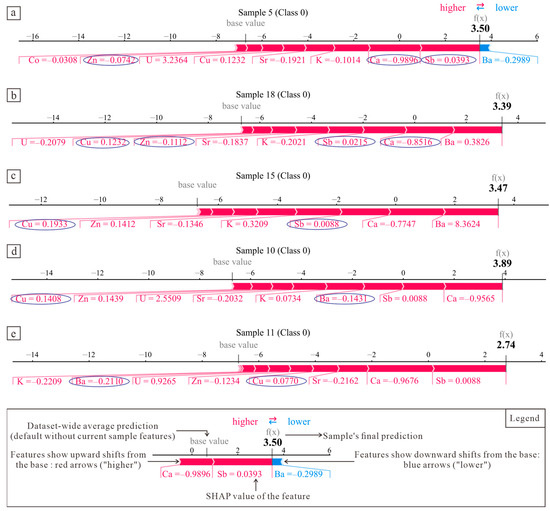
Figure 12.
SHAP Force Plots of rhyolite-hosted agate samples (Class 0). Arrow length reflects impact magnitude (longer = stronger influence). (a) Sample 5 with U (3.2364) and Ca (−0.9896) contributions; (b) Sample 18 illustrating the positive synergy of Ca -Sb (0.0393→0.0215 compared to Sample 5) and Zn (−0.0742→−0.1112 compared to Sample 5)-Sb; (c) Sample 15 showing antagonism of Cu (0.1933→0.1232 compared to Sample 15)-Sb (0.0088→0.0215 compared to Sample 15). (d) Sample 10 with Ba (−0.1431) and Cu (0.1408) contributions; (e) Samples 11 displaying Ba-Cu antagonism compared to Sample 10.
For Class 1 (andesite-hosted agates), Sc was identified as a positive contributor despite its negative SHAP value (e.g., Sample 28: Sc = −0.4743; Figure 13a), consistent with earlier observations that feature influence direction is independent of numerical sign. Class 1 classification decisions resulted from combined multi-feature effects, with red features (positive contributions) exerting differential impacts. For instance, in Sample 42 (Figure 13b), Na, U, and Sr showed stronger positive effects than in Sample 28 (Figure 13a), weakening Cr’s relative influence—aligning with positive Na-Sr and U-Sr interactions and Cr-Sr antagonism noted in elemental synergy analysis. Notably, Cr’s contribution magnitude significantly affected the model’s prediction value (f(x)).
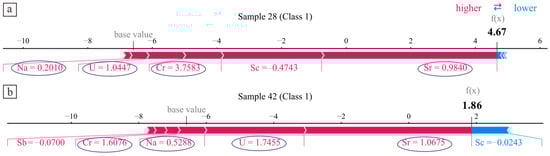
Figure 13.
SHAP Force Plots of andesite-hosted agate samples (Class 1). Arrow length reflects impact magnitude (longer = stronger influence). (a) Sample 28, showing base value about−7; Na, U, and Cr contributing to increased prediction; Sc with negative SHAP value (−0.4743); Sr driving a strong positive push; final prediction (f(x)) = 4.76. (b) Sb, Cr, Na, U, and Sr progressively enhancing prediction; Sc exerting a negative pull.
SHAP analysis of Class 2 (basalt-hosted agates) showed all sample predictions (f(x) = 4.23–5.84) exceeded the base value (3; Figure 14). Positive synergies were identified between Na-U (U’s positive effect amplified with Na = −0.7655 in Sample 62 vs. 68; Figure 14a,b) and Zn-Sc (Sc’s positive effect diminished as Zn turned positive in Sample 159 vs. 62; Figure 14a,c). In contrast, antagonistic interactions emerged between Zn-U and Na-Zn, evidenced by U’s amplified effect with negative Zn (Sample 159 vs. 68; Figure 14b,c) and Na’s positive value corresponding to less negative Zn (Sample 163 vs. 159; Figure 14c,d).
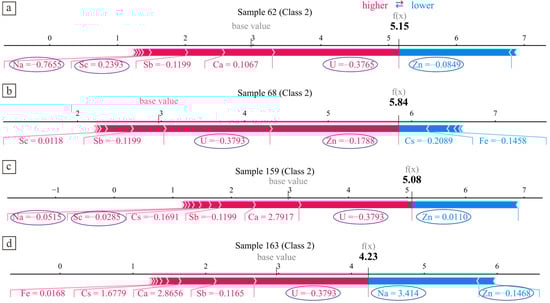
Figure 14.
SHAP Force Plots of basalt-hosted agate samples (Class 2), showing all predictions (f(x)) above the base value (≈3). Arrow length reflects impact magnitude (longer = stronger influence). (a) Sample 62 with U (−0.3765), Sc (0.2393), Na (−0.7655) and Zn (−0.0849) contributions; (b) Sample 68 illustrating the positive synergy of Na (−0.0849→−0.1788 compared to Sample 62)-U (−0.3765→−0.3793 compared to Sample 62); (c) Sample 159 showing positive synergy of Zn (−0.0849→0.0110 compared to Sample 62)-Sc (0.2393→−0.0285 compared to Sample 62) and antagonism of Zn (−0.1788→0.0110 compared to Sample 68)-U (U’s positive SHAP effect was significantly amplified); (d) Sample 163 displaying Na (−0.0515→3.414)-Zn (0.0110→−0.1468) antagonism compared to Sample 159.
4. Discussion
The agates studied, hosted in rhyolites, andesites, and basalts, all occur in effusive facies volcanic rocks [1,3,4,9,12,24,57,58,59,60,61,62,63,64]. Rhyolite-hosted agates mainly formed during hydrothermal alteration post-Carboniferous-Permian volcanic activities [1,4,59,80]; andesite-hosted ones formed in the late Eocene (post-Lutetian) [9,60]; basalt-hosted agates have a broader age range (Paleoproterozoic to Cretaceous) [12,24,63]. Chemical compositions show no significant differences among different localities of agates hosted in the same type of rock.
Wall-rock alteration of rhyolite-hosted agates mainly forms clay minerals (kaolinite, montmorillonite), zeolites (clinoptilolite), iron oxides (hematite), and silica minerals (chalcedony, quartz) [1,4]; basalt alteration is dominated by chlorite, epidote, calcite, and zeolites [12,24,63]. Element release specificity during alteration is key to agate-formation mechanisms. In geological evolution, unstable volcanic glass, pyroxene, and feldspar in host rocks alter, releasing SiO2 and alkali metals to form the basis of agate chemical composition [81,82,83,84,85]. However, variations in wall-rock composition and chemical environment induce high diversity in agate elemental composition.
4.1. Geochemical Characteristics of Agate Based on Correlation and Interaction
Traditional statistical methods often use “content correlation” to discuss elemental characteristics, calculating correlation coefficients between associated elements to reflect distribution synchrony (Figure 15). Here, “interaction” refers to elemental synergistic (co-migration, co-precipitation) or antagonistic (source competition, precipitation inhibition) effects in geological processes driven by physicochemical conditions. Correlation represents the statistical expression of elemental content, while interaction embodies its geological essence.
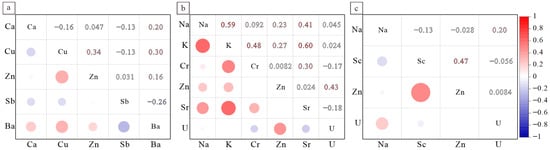
Figure 15.
Correlation analysis of contents (ppm) of important characteristic elements in different types of agates. (a) Rhyolite-related agate. (b) Andesite-related agate. (c) Basalt-related agate.
4.1.1. Co-Migration and Co-Precipitation Driven by Synergistic Effects
In rhyolite-hosted agates, Zn and Sb display positive correlation (0.031; Figure 15a) and interaction (Figure 9b). Their fluid inclusions have medium-low salinity (4.96–9.21 eq% NaCl [1] and 0.65–2.4 wt% (KCl) [4]), with Zn and Sb migrating as Zn-Cl− and Sb-Cl− complexes [86] and co-precipitating upon cooling. Fluid inclusion homogenization temperatures (80–375 °C [1,4,59,86]) reflect these complexes’ high-temperature stability and low-temperature co-precipitation tendency. Ca and Sb show negative correlation (Figure 15a) but positive synergy (Figure 9a). Ca derives from wall-rock alteration, Sb from crustal input [87]; both are transported by ore-forming fluids, inducing synergism. In relatively closed hydrothermal systems, Ca is fixed by early incorporation into calcite lattices, causing a sharp drop in Ca2+ activity in residual fluids [5]. Subsequently, when temperatures decrease to 150–250 °C with concurrent oxidation and pH elevation, Sb precipitates rapidly as Sb2S3, Sb2O3, or sulfosalts in agate-quartz bands [9]. Due to system closure, the two-stage precipitation shares a limited total metal pool; the preferential early crystallization of Ca directly deprives potential carrier sites for later Sb, resulting in a spatial negative correlation between Ca and Sb contents.(correlation coefficient −0.13; Figure 15a).
In andesite-hosted agates, plagioclase alteration releases Na+ and Sr2+, which co-migrate as NaCl and SrCl2 and co-precipitate, showing positive correlation (Figure 15b) and interaction (Figure 10a). U, stable as UO2(CO3)34− [88,89], co-migrates with Sr2+ (positive interaction) but enriches later than Sr2+ and CO32− precipitation in oxidizing alkaline environments [90]; precipitation window dislocation induces their negative content correlation.
In basalt-hosted agates, Sc and Zn exhibit positive correlation (Figure 15c) and synergism (Figure 11a), as Sc3+ and Zn2+ released by basaltic rock chloritization and albitization co-migrate and precipitate in low-salinity fluids via hydroxyl-silicate-hydrated mixed complexes [91,92]. Na, released during basaltic mineral alteration [93], co-enriches and precipitates with U in hydrothermal fluids, showing positive content correlation and synergism.
4.1.2. Source Competition and Precipitation Inhibition Driven by Antagonistic Effects
In rhyolite-hosted agates, crust-derived Sb [94] and mantle-derived Cu [95] exhibit negative correlation (r = −0.13; Figure 15a) and antagonism (Figure 9d) due to source competition. Both Ba (from crust-derived material or meteoric water [96]) and Cu migrate/precipitate with Cl− during mineralization; despite statistical positive correlation (Figure 15a), they show geological antagonism (Figure 9c) from source competition.
In andesite-hosted agates, Cr and Sr show positive correlation (Figure 15b) due to synchronous magmatic differentiation during wall-rock chloritization and albitization. Sr (incompatible) remains in fluids, while compatible Cr3+ forms hydroxyl complexes (e.g., Cr(OH)2+, Cr(OH)3) that migrate/precipitate preferentially, causing antagonism with Sr (Figure 10c). K-feldspar alteration releases abundant K+, which coexists with magmatic hydrothermal Zn in agate-forming systems [9], inducing positive content correlation (Figure 15b). However, high K+ reduces Zn-Cl complex stability and Zn2+ activity [97], leading to their antagonism (Figure 10d).
In basalt-hosted agates, Zn from wall-rock alteration precipitates preferentially during magma cooling, while U from late basaltic hydrothermal fluids adsorbs on silica gel as UO2(SiO3)2·nH2O [88,89]. Synchronous hydrothermal-alteration changes induce their positive correlation (Figure 15c), but precipitation mechanism differences cause antagonism (Figure 11c). Early albitization releases abundant Na+ with limited ferromagnesian mineral decomposition, forming high-Na, low-Zn fluids [98]; late chloritization drives ferromagnesian breakdown, releasing large Zn2+, while weakened plagioclase alteration reduces Na+ input sharply, yielding high-Zn, low-Na fluids [98]. This induces Na-Zn negative correlation (Figure 15c) and antagonism (Figure 11d).
4.2. Metallogenic Model of Agates in Volcanic Rocks
In the late hydrothermal stage of acidic magma, high-silica, volatile-rich environments [1,4,59] enrich residual fluids in incompatible elements (Sb, Zn). Both the positive correlation/interaction of Zn-Sb and the negative correlation/positive synergism of Ca-Sb are governed by magmatic hydrothermal evolution. Rhyolite-hosted agates follow the “crust-derived magmatic hydrothermal fluid—medium-low salinity complexation—multi-stage precipitation” model, featuring three key characteristics: (1) medium-low salinity complexation, reflected by Zn-Sb positive correlation/interaction; (2) stepwise crystallization, indicated by Ca-Sb negative correlation/positive synergism; and (3) crust-mantle source competition, revealed by Cu-Sb negative correlation/antagonism. This mechanism is further supported by relatively high crust-derived oxygen isotope signals (δ18O ≈ +18.7‰~+33.3‰) [4,5,21,99,100].
In the late hydrothermal stage of intermediate magma, oceanic crust-continental crust contamination enriches Sr and Na. The positive correlation/synergism of Na-Sr and positive correlation/antagonism of K-Zn reflect combined hydrothermal and wall-rock alteration effects in andesite-hosted agate formation. Andesite-hosted agates follow the “contaminated fluid—hydrothermal alteration—precipitation window differentiation” model, featuring four key aspects: (1) positive correlation/synergism of Na-Sr (released by feldspar alteration) as the core; (2) negative correlation/positive interaction of U-Sr (precipitation timing differences); (3) positive correlation/antagonism of Cr-Sr (preferential mineral crystallization); and (4) positive correlation/antagonism of K-Zn (complex stability competition). Oxygen isotopes δ18O (δ18O ≈ +17.5‰~+33.4‰) with mixed oceanic crust-continental crust signals [5] confirm fluid-plagioclase material exchange, supporting the genetic basis of their positive correlation and synergism.
During the long-term cooling in the late hydrothermal stage of basic magma, Sc-Zn positive correlation/synergism reflects element release from basic alteration, while Zn-U positive correlation/antagonism relates to late basic magma hydrothermal differentiation. Na-Zn negative content correlation and mutual antagonism associate with earlier feldspar decomposition versus later ferromagnesian mineral breakdown during wall-rock alteration. Basalt-hosted agates follow the “low-temperature hydrothermal fluid—basic alteration—progressive mineral decomposition” model, featuring four key characteristics: (1) Sc-Zn positive correlation/synergism (co-migration during alteration); (2) Zn-U positive correlation/antagonism (precipitation mechanism differences); (3) Na-U positive correlation/interaction (co-enrichment in hydrothermal fluids); and (4) Na-Zn negative correlation/antagonism (mineral decomposition timing). Meteoric water signals in oxygen isotopes (δ18O ≈ +10.4‰~+25.8‰) [3,5,20,101] support wall-rock progressive decomposition by hydrothermal fluids and compositional differences from temperature-dependent gradual crystallization in basalt-hosted agate formation.
It identifies Zn as a cross-lithology tracer for fluid evolution and alteration processes via its interactions with other elements. In rhyolite-hosted agates, Zn-Sb positive correlation/interaction reflects synergistic enrichment migration in crust-derived magmatic hydrothermal environments; in andesite-hosted agates, Zn-Na interaction sensitively indicates feldspar alteration intensity; in basalt-hosted agates, Zn-Sc positive correlation/synergism and Zn-Na negative correlation/antagonism reflect Sc3+-Zn2+ co-release during basic rock alteration and timing differences in progressive decomposition of feldspars and ferromagnesian minerals, thus forming a cross-lithology “indicator” for alteration intensity.
5. Conclusions
Integrating elemental correlation, interaction analysis, and interpretable machine learning, this study explores geochemical behaviors of characteristic elements in volcanic-hosted agates and their coupling with formation mechanisms.
Elemental statistical correlations and geological interactions diverge: synergies reflect co-migration/precipitation, antagonisms derive from source competition or precipitation inhibition, revealing processes like stepwise crystallization.
Rhyolite-hosted agates form via the “crust-derived magmatic hydrothermal fluid—medium-low salinity complexation—multi-stage precipitation” model, driven by high-silica, volatile-rich fluids enriching Sb/Zn, regulated by fluid-meteoric water mixing. Andesite-hosted agates follow the “contaminated fluid—hydrothermal alteration—precipitation window differentiation” model, controlled by crustal contamination and fluid-alteration coupling. Basalt-hosted agates form via the “low-temperature hydrothermal fluid—basic alteration—progressive mineral decomposition” model, with meteoric water-dominated environments restricting complexation and governing Na-Zn relationships.
Zn acts as a cross-lithology indicator: in rhyolites, Zn-Sb interaction indicates crust-derived fluid processes; in andesites, Zn-Na interaction reflects feldspar alteration intensity; in basalt, Zn-Sc synergism and Zn-Na antagonism indicate basic alteration and mineral decomposition timing.
This work, via “correlation—interaction—mineralization model” coupling, advances volcanic-agate genetic studies and mineral geochemical decipherment. Future research should prioritize large-scale micro-area elemental analysis to capture richer mineralization information.
Supplementary Materials
The following supporting information can be downloaded at: https://www.mdpi.com/article/10.3390/min15090923/s1, Table S1. Element contents of volcanic-rock-hosted agate from the literature. Table S2. The test data of element content in basalt-related agate from Xunke area. Table S3. Performance comparison of LightGBM and XGBoost classifiers under different feature dimensions and SMOTE processing. Table S4. Prediction results of LightGBM for elemental contents in basalt-related agates from the Xunke Area. Table S5. SHAP interaction strength values for elemental features in agate datasets. Table S6. Pearson correlation coefficients of SHAP values for elemental features in agate datasets.
Author Contributions
Conceptualization, P.Z. and X.X.; methodology, X.X.; software, P.Z. and X.X.; validation, X.X., P.Z. and B.-C.W.; formal analysis, X.X.; investigation, P.Z.; resources, P.Z.; data curation, X.X. and P.Z.; writing—original draft preparation, P.Z.; writing—review and editing, P.Z.; visualization, X.X.; supervision, P.Z.; project administration, P.Z.; funding acquisition, B.-C.W. All authors have read and agreed to the published version of the manuscript.
Funding
This study received funding from the Geological Survey Project of China Geological Survey (Grant No. DD20230477).
Data Availability Statement
The original contributions presented in this study are included in the article/Supplementary Materials. Further inquiries can be directed to the corresponding author.
Acknowledgments
The authors are deeply grateful to the anonymous reviewers for their insightful comments, which significantly enhanced the quality of our manuscript.
Conflicts of Interest
The authors declare no conflicts of interest.
References
- Götze, J.; Möckel, R.; Pan, Y.; Müller, A. Geochemistry and formation of agate-bearing lithophysae in Lower Permian volcanics of the NW-Saxonian Basin (Germany). Mineral. Petrol. 2024, 118, 23–40. [Google Scholar] [CrossRef]
- Moxon, T.; Palyanova, G. Agate genesis: A continuing enigma. Minerals 2020, 10, 953. [Google Scholar] [CrossRef]
- Fallick, A.; Jocelyn, J.; Donnelly, T.; Guy, M.; Behan, C. Origin of agates in volcanic rocks from Scotland. Nature 1985, 313, 672–674. [Google Scholar] [CrossRef]
- Götze, J.; Möckel, R.; Vennemann, T.; Müller, A. Origin and geochemistry of agates in Permian volcanic rocks of the Sub-Erzgebirge basin, Saxony (Germany). Chem. Geol. 2016, 428, 77–91. [Google Scholar] [CrossRef]
- Götze, J.; Tichomirowa, M.; Fuchs, H.; Pilot, J.; Sharp, Z. Geochemistry of agates: A trace element and stable isotope study. Chem. Geol. 2001, 175, 523–541. [Google Scholar] [CrossRef]
- Lee, D.R. Characterisation of silica minerals in a banded agate: Implications for agate genesis and growth mechanisms. Masters Res. 2007, 1–18. [Google Scholar]
- Merino, E.; Wang, Y.; Deloule, E. Genesis of agates in flood basalts; twisting of chalcedony fibers and trace-element geochemistry. Am. J. Sci. 1995, 295, 1156–1176. [Google Scholar] [CrossRef]
- Moxon, T.; Reed, S.; Zhang, M. Metamorphic effects on agate found near the Shap granite, Cumbria, England: As demonstrated by petrography, X-ray diffraction and spectroscopic methods. Mineral. Mag. 2007, 71, 461–476. [Google Scholar] [CrossRef]
- Mrozik, M.; Götze, J.; Pan, Y.; Möckel, R. Mineralogy, Geochemistry, and Genesis of Agates from Chihuahua, Northern Mexico. Minerals 2023, 13, 687. [Google Scholar] [CrossRef]
- Pabian, R.K.; Zarins, A. Banded Agates, Origins and Inclusions; Conservation and Survey Division: Lincoln, NE, USA, 1994. [Google Scholar]
- Powolny, T.; Dumańska-Słowik, M.; Sikorska-Jaworowska, M.; Wójcik-Bania, M. Agate mineralization in spilitized Permian volcanics from “Borówno” quarry (Lower Silesia, Poland)–microtextural, mineralogical, and geochemical constraints. Ore Geol. Rev. 2019, 114, 103130. [Google Scholar] [CrossRef]
- Svetova, E.N.; Svetov, S.A. Mineralogy and geochemistry of agates from Paleoproterozoic volcanic rocks of the Karelian Craton, Southeast Fennoscandia (Russia). Minerals 2020, 10, 1106. [Google Scholar] [CrossRef]
- Svetova, E.N.; Svetov, S.A. Agates from Mesoproterozoic Volcanics (Pasha–Ladoga Basin, NW Russia): Characteristics and Proposed Origin. Minerals 2022, 13, 62. [Google Scholar] [CrossRef]
- Wang, Y.; Merino, E. Origin of fibrosity and banding in agates from flood basalts. Am. J. Sci. 1995, 295, 49–77. [Google Scholar] [CrossRef]
- Zhang, P.; Wang, B.-C.; Huang, X.-W.; Xi, X. Geochemical Discrimination of Agate in Diverse Volcanic Host Rocks Through Machine Learning Methods. Minerals 2025, 15, 32. [Google Scholar] [CrossRef]
- Zhang, X.; Ji, L.; He, X. Gemological characteristics and origin of the Zhanguohong agate from Beipiao, Liaoning province, China: A combined microscopic, X-ray diffraction, and Raman spectroscopic study. Minerals 2020, 10, 401. [Google Scholar] [CrossRef]
- Götze, J.; Möckel, R.; Pan, Y. Mineralogy, geochemistry and genesis of agate—A review. Minerals 2020, 10, 1037. [Google Scholar] [CrossRef]
- Götze, J.; Möckel, R.; Kempe, U.; Kapitonov, I.; Vennemann, T. Characteristics and origin of agates in sedimentary rocks from the Dryhead area, Montana, USA. Mineral. Mag. 2009, 73, 673–690. [Google Scholar]
- Moxon, T.; Nelson, D.; Zhang, M. Agate recrystallisation: Evidence from samples found in Archaean and Proterozoic host rocks, Western Australia. Aust. J. Earth Sci. 2006, 53, 235–248. [Google Scholar] [CrossRef]
- Gliozzo, E. Variations on the Silica Theme: Classification and Provenance from Pliny to Current Supplies. In The Contribution of Mineralogy to Cultural Heritage; European Mineralogical Union: Paris, France, 2019. [Google Scholar]
- Holzhey, G. Contribution to petrochemical-mineralogical characterization of alteration processes within the marginal facies of rhyolitic volcanics of lower Permian Age, Thuringian Forest, Germany. Chem. Der Erde 2001, 61, 149–186. [Google Scholar]
- Dumańska-Słowik, M.; Natkaniec-Nowak, L.; Wesełucha-Birczyńska, A.; Gaweł, A.; Lankosz, M.; Wróbel, P. Agates from Sidi Rahal, in the atlas Mountains of Morocco: Gemological characteristics and proposed origin. Gems Gemol. 2013, 49, 148–159. [Google Scholar] [CrossRef]
- Flörke, O.; Köhler-Herbertz, B.; Langer, K.; Tönges, I. Water in microcrystalline quartz of volcanic origin: Agates. Contrib. Mineral. Petrol. 1982, 80, 324–333. [Google Scholar] [CrossRef]
- Gliozzo, E.; Cairncross, B.; Vennemann, T. A geochemical and micro-textural comparison of basalt-hosted chalcedony from the Jurassic Drakensberg and Neoarchean Ventersdorp Supergroup (Vaal River alluvial gravels), South Africa. Int. J. Earth Sci. 2019, 108, 1857–1877. [Google Scholar] [CrossRef]
- Götze, J.; Nasdala, L.; Kempe, U.; Libowitzky, E.; Rericha, A.; Vennemann, T. The origin of black colouration in onyx agate from Mali. Mineral. Mag. 2012, 76, 115–127. [Google Scholar] [CrossRef]
- Götze, J.; Nasdala, L.; Kleeberg, R.; Wenzel, M. Occurrence and distribution of “moganite” in agate/chalcedony: A combined micro-Raman, Rietveld, and cathodoluminescence study. Contrib. Mineral. Petrol. 1998, 133, 96–105. [Google Scholar] [CrossRef]
- Götze, J.; Plötze, M.; Habermann, D. Origin, spectral characteristics and practical applications of the cathodoluminescence (CL) of quartz—A review. Mineral. Petrol. 2001, 71, 225–250. [Google Scholar] [CrossRef]
- Heaney, P.J. A proposed mechanism for the growth of chalcedony. Contrib. Mineral. Petrol. 1993, 115, 66–74. [Google Scholar] [CrossRef]
- Heaney, P.J.; Davis, A.M. Observation and origin of self-organized textures in agates. Science 1995, 269, 1562–1565. [Google Scholar] [CrossRef]
- Moxon, T. A re-examination of water in agate and its bearing on the agate genesis enigma. Mineral. Mag. 2017, 81, 1223–1244. [Google Scholar] [CrossRef]
- Moxon, T.; Petrone, C.; Reed, S. Characterization and genesis of horizontal banding in Brazilian agate: An X-ray diffraction, thermogravimetric and electron microprobe study. Mineral. Mag. 2013, 77, 227–248. [Google Scholar] [CrossRef]
- Zhang, P.; Wang, B.-C.; Zheng, J.-L.; Guo, X.-Y. Formation mechanism of basalt-related agate deposits: An example from the Ating River alluvial gravels in the Xunke area, Heilongjiang, NE China. Front. Earth Sci. 2025, 13, 1548167. [Google Scholar] [CrossRef]
- Abedi, M.; Norouzi, G.-H.; Bahroudi, A. Support vector machine for multi-classification of mineral prospectivity areas. Comput. Geosci. 2012, 46, 272–283. [Google Scholar] [CrossRef]
- Cao, G.; Chen, H.; Zhang, Y.; Sun, W.; Zhao, J.; Zhao, H.; Wang, H. Primary controlling factors of apatite trace element composition and implications for exploration in orogenic gold deposits. Geochem. Geophys. Geosystems 2024, 25, e2024GC011574. [Google Scholar] [CrossRef]
- Cao, G.; Zhang, Y.; Zhao, H.; Cheng, J.; Hao, J.; Lei, J.; Song, S.; Wang, X. Trace element variations of pyrite in orogenic gold deposits: Constraints from big data and machine learning. Ore Geol. Rev. 2023, 157, 105447. [Google Scholar] [CrossRef]
- Carranza, E.J.M.; Laborte, A.G. Random forest predictive modeling of mineral prospectivity with small number of prospects and data with missing values in Abra (Philippines). Comput. Geosci. 2015, 74, 60–70. [Google Scholar] [CrossRef]
- Carranza, E.J.M.; Laborte, A.G. Data-driven predictive modeling of mineral prospectivity using random forests: A case study in Catanduanes Island (Philippines). Nat. Resour. Res. 2016, 25, 35–50. [Google Scholar] [CrossRef]
- Carrasco-Godoy, C.; Campbell, I.H.; Cajal, Y. Quantifying the Criteria Used to Identify Zircons from Ore-Bearing and Barren Systems in Porphyry Copper Exploration. Econ. Geol. 2024, 119, 1035–1058. [Google Scholar] [CrossRef]
- Daviran, M.; Maghsoudi, A.; Ghezelbash, R.; Pradhan, B. A new strategy for spatial predictive mapping of mineral prospectivity: Automated hyperparameter tuning of random forest approach. Comput. Geosci. 2021, 148, 104688. [Google Scholar] [CrossRef]
- Han, F.-G.; Leng, C.-B.; Chen, J.-J.; Zhan, Y.-Y. Rock type discrimination by using trace elements of apatite based on the machine learning. Bull. Mineral. Petrol. Geochem. 2024, 43, 607–620. [Google Scholar] [CrossRef]
- Li, H.; Zhang, Z.; Zhang, R.; Xie, Q.; Zhang, L.; Santosh, M. Geochemical discrimination of pyrite in diverse ore deposit types through statistical analysis and machine learning techniques. Am. Mineral. 2024, 109, 846–857. [Google Scholar] [CrossRef]
- Li, S.; Zhao, Z.; Miao, T.; Li, X.; Yu, S.; Zhang, Y.; Wei, J.; Zou, K. Discrimination of Pb-Zn deposit types using the trace element data of galena based on deep learning. Ore Geol. Rev. 2024, 170, 106133. [Google Scholar] [CrossRef]
- Luo, L.; Chen, G.; Li, Z. Identifying tectonic settings of porphyry copper deposits using zircon trace elements–A semi-supervised machine learning method. Ore Geol. Rev. 2024, 171, 106170. [Google Scholar] [CrossRef]
- Meng, Y.-M.; Huang, X.-W.; Hu, R.; Beaudoin, G.; Zhou, M.-F.; Meng, S. Deposit type discrimination based on trace elements in sphalerite. Ore Geol. Rev. 2024, 165, 105887. [Google Scholar] [CrossRef]
- Sun, G.; Zeng, Q.; Zhou, J.-X. Machine learning coupled with mineral geochemistry reveals the origin of ore deposits. Ore Geol. Rev. 2022, 142, 104753. [Google Scholar] [CrossRef]
- Sun, G.-T.; Zhou, J.-X. Application of Machine Learning Algorithms to Classification of Pb–Zn Deposit Types Using LA–ICP–MS Data of Sphalerite. Minerals 2022, 12, 1293. [Google Scholar] [CrossRef]
- Zhang, X.; Wang, D.; Ma, H.; Dong, S.; Wang, Z.; Wang, Z. Application of Machine Learning to Research on Trace Elemental Characteristics of Metal Sulfides in Se-Te Bearing Deposits. Minerals 2024, 14, 538. [Google Scholar] [CrossRef]
- Zheng, Y.-Y.; Xu, B.; Lentz, D.R.; Yu, X.-Y.; Hou, Z.-Q.; Wang, T. Machine learning applied to apatite compositions for determining mineralization potential. Am. Mineral. 2024, 109, 1394–1405. [Google Scholar] [CrossRef]
- Zou, S.; Brzozowski, M.J.; Chen, X.; Xu, D. Machine-learning oxybarometer developed using zircon trace-element chemistry and its applications. Am. Mineral. 2024, 109, 1181–1192. [Google Scholar] [CrossRef]
- Lundberg, S.M.; Lee, S.-I. A unified approach to interpreting model predictions. Adv. Neural Inf. Process. Syst. 2017, 30, 4765–4774. [Google Scholar]
- Hart, S. Shapley value. In The New Palgrave Dictionary of Economics; Springer: Berlin/Heidelberg, Germany, 1987; pp. 1–6. [Google Scholar]
- Pradhan, B.; Dikshit, A.; Lee, S.; Kim, H. An explainable AI (XAI) model for landslide susceptibility modeling. Appl. Soft Comput. 2023, 142, 110324. [Google Scholar] [CrossRef]
- Sun, D.; Wang, J.; Wen, H.; Ding, Y.; Gu, Q.; Zhang, J.; Zhang, F. Insights into landslide susceptibility in different karst erosion landforms based on interpretable machine learning. Earth Surf. Process. Landf. 2024, 49, 1006–1027. [Google Scholar] [CrossRef]
- Wang, N.; Zhang, H.; Dahal, A.; Cheng, W.; Zhao, M.; Lombardo, L. On the use of explainable AI for susceptibility modeling: Examining the spatial pattern of SHAP values. Geosci. Front. 2024, 15, 101800. [Google Scholar] [CrossRef]
- Yang, S.; Tan, J.; Luo, D.; Wang, Y.; Guo, X.; Zhu, Q.; Ma, C.; Xiong, H. Sample size effects on landslide susceptibility models: A comparative study of heuristic, statistical, machine learning, deep learning and ensemble learning models with SHAP analysis. Comput. Geosci. 2024, 193, 105723. [Google Scholar] [CrossRef]
- Zheng, D.; Li, Y.; Yan, C.; Wu, H.; Yamashiki, Y.A.; Gao, B.; Nian, T. Landslide susceptibility assessment using AutoML-SHAP method in the southern foothills of Changbai Mountain, China. Landslides 2025, 22, 1855–1875. [Google Scholar] [CrossRef]
- Beer, M. Achate und andere Mineralien aus den nordost-böhmischen Melaphyren. Mineralien-Welt 1992, 4, 47–51. [Google Scholar]
- Blankenburg, H.-J. Achat; VEB Deutscher Verlag für Grundstoffindustrie: Leipzig, Germany, 1988. [Google Scholar]
- Haake, R.; Fischer, J.; Reissmann, R. Über das Achat-Amethyst-Vorkommen von Schlottwitz im Osterzgebirge. Mineralien-Welt 1991, 2, 20–24. [Google Scholar]
- Lorenzi, R.; Zullino, A.; Gagliardi, V.; Prosperi, L.; Paleari, A.; Adamo, I. Atomic and microstructural origin of banded colours in purple-blue variety of agate from Yozgat Province, Turkey. Phys. Chem. Miner. 2022, 49, 33. [Google Scholar] [CrossRef]
- McCrank, G.; Misiura, J.D.; Brown, P.A. Plutonic Rocks in Ontario; Geological Survey of Canada: Ottawa, ON, Canada, 1981. [Google Scholar]
- Schmitt-Riegraf, C. Magmenentwicklung und Spät-Bis Post-Magmatische Alterationsprozesse Permischer Vulkanite im Nordwesten der Nahe-Mulde; Institut für Geologie und Paläontologie: Münster, Germany, 1996. [Google Scholar]
- Fallick, A.; Jocelyn, J.; Hamilton, P.; Rodriguez-Clemente, R.; Tardy, Y. Oxygen and hydrogen stable isotope systematics in Brazilian agates. Geochem. Miner. Form. Earth Surf. 1987, 99–117. [Google Scholar]
- Cross, B.L. The Agates of Northern Mexico; Burgess International Group: Edina, MN, USA, 1996. [Google Scholar]
- Chawla, N.V.; Bowyer, K.W.; Hall, L.O.; Kegelmeyer, W.P. SMOTE: Synthetic minority over-sampling technique. J. Artif. Intell. Res. 2002, 16, 321–357. [Google Scholar] [CrossRef]
- Belyadi, H.; Haghighat, A. Machine Learning Guide for Oil and Gas Using Python: A Step-by-Step Breakdown with Data, Algorithms, Codes, and Applications; Gulf Professional Publishing: Houston, TX, USA, 2021. [Google Scholar]
- Myles, A.J.; Feudale, R.N.; Liu, Y.; Woody, N.A.; Brown, S.D. An introduction to decision tree modeling. J. Chemom. A J. Chemom. Soc. 2004, 18, 275–285. [Google Scholar] [CrossRef]
- Chen, T.; Guestrin, C. Xgboost: A scalable tree boosting system. In Proceedings of the 22nd Acm Sigkdd International Conference on Knowledge Discovery and Data Mining, San Francisco, CA, USA, 13–17 August 2016; pp. 785–794. [Google Scholar]
- Can, R.; Kocaman, S.; Gokceoglu, C. A comprehensive assessment of XGBoost algorithm for landslide susceptibility mapping in the upper basin of Ataturk dam, Turkey. Appl. Sci. 2021, 11, 4993. [Google Scholar] [CrossRef]
- Schapire, R.E. The strength of weak learnability. Mach. Learn. 1990, 5, 197–227. [Google Scholar] [CrossRef]
- Freund, Y.; Schapire, R.E. A decision-theoretic generalization of on-line learning and an application to boosting. J. Comput. Syst. Sci. 1997, 55, 119–139. [Google Scholar] [CrossRef]
- Azmi, S.S.; Baliga, S. An overview of boosting decision tree algorithms utilizing AdaBoost and XGBoost boosting strategies. Int. Res. J. Eng. Technol. 2020, 7, 6867–6870. [Google Scholar]
- Rajesh, K.N.; Dhuli, R. Classification of imbalanced ECG beats using re-sampling techniques and AdaBoost ensemble classifier. Biomed. Signal Process. Control 2018, 41, 242–254. [Google Scholar] [CrossRef]
- Rätsch, G.; Onoda, T.; Müller, K.-R. Soft margins for AdaBoost. Mach. Learn. 2001, 42, 287–320. [Google Scholar] [CrossRef]
- Otchere, D.A.; Ganat, T.O.A.; Ojero, J.O.; Tackie-Otoo, B.N.; Taki, M.Y. Application of gradient boosting regression model for the evaluation of feature selection techniques in improving reservoir characterisation predictions. J. Pet. Sci. Eng. 2022, 208, 109244. [Google Scholar] [CrossRef]
- Zhao, X.; Chen, X.; Huang, Q.; Lan, Z.; Wang, X.; Yao, G. Logging-data-driven permeability prediction in low-permeable sandstones based on machine learning with pattern visualization: A case study in Wenchang A Sag, Pearl River Mouth Basin. J. Pet. Sci. Eng. 2022, 214, 110517. [Google Scholar] [CrossRef]
- Kramer, O. Dimensionality Reduction with Unsupervised Nearest Neighbors; Springer: Berlin/Heidelberg, Germany, 2013; Volume 51. [Google Scholar]
- Bui, X.-N.; Jaroonpattanapong, P.; Nguyen, H.; Tran, Q.-H.; Long, N.Q. A novel hybrid model for predicting blast-induced ground vibration based on k-nearest neighbors and particle swarm optimization. Sci. Rep. 2019, 9, 13971. [Google Scholar] [CrossRef]
- Mangalathu, S.; Hwang, S.-H.; Jeon, J.-S. Failure mode and effects analysis of RC members based on machine-learning-based SHapley Additive exPlanations (SHAP) approach. Eng. Struct. 2020, 219, 110927. [Google Scholar] [CrossRef]
- Haake, R.; Holzhey, G. Achate in kugelförmigen Rhyolithen des Rotliegenden im sächsisch-thüringischem Raum. Chem. Der Erde 1989, 49, 173–183. [Google Scholar]
- Correns, C. The experimental chemical weathering of silicates. Clay Miner. Bull. 1961, 4, 249–265. [Google Scholar] [CrossRef]
- Götze, J.; Hofmann, B.; Machałowski, T.; Tsurkan, M.V.; Jesionowski, T.; Ehrlich, H.; Kleeberg, R.; Ottens, B. Biosignatures in subsurface filamentous fabrics (SFF) from the Deccan Volcanic Province, India. Minerals 2020, 10, 540. [Google Scholar] [CrossRef]
- Klammer, D. Mass change during extreme acid-sulphate hydrothermal alteration of a Tertiary latite, Styria, Austria. Chem. Geol. 1997, 141, 33–48. [Google Scholar] [CrossRef]
- Ottens, B.; Götze, J.; Schuster, R.; Krenn, K.; Hauzenberger, C.; Zsolt, B.; Vennemann, T. Exceptional multi stage mineralization of secondary minerals in cavities of flood basalts from the Deccan Volcanic Province, India. Minerals 2019, 9, 351. [Google Scholar] [CrossRef]
- Seyfried, W., Jr.; Bischoff, J. Low temperature basalt alteration by sea water: An experimental study at 70 °C and 150 °C. Geochim. Cosmochim. Acta 1979, 43, 1937–1947. [Google Scholar] [CrossRef]
- Tagirov, B.; Seward, T.M. Hydrosulfide/sulfide complexes of zinc to 250 °C and the thermodynamic properties of sphalerite. Chem. Geol. 2010, 269, 301–311. [Google Scholar] [CrossRef]
- Noll, P., Jr.; Newsom, H.; Leeman, W.; Ryan, J.G. The role of hydrothermal fluids in the production of subduction zone magmas: Evidence from siderophile and chalcophile trace elements and boron. Geochim. Cosmochim. Acta 1996, 60, 587–611. [Google Scholar] [CrossRef]
- Pan, Y.; Li, D.; Feng, R.; Wiens, E.; Chen, N.; Chernikov, R.; Götze, J.; Lin, J. Uranyl binding mechanism in microcrystalline silicas: A potential missing link for uranium mineralization by direct uranyl co-precipitation and environmental implications. Geochim. Cosmochim. Acta 2021, 292, 518–531. [Google Scholar] [CrossRef]
- Zielinski, R.A. Uranium mobility during interaction of rhyolitic obsidian, perlite and felsite with alkaline carbonate solution: T = 120 C, P = 210 kg/cm2. Chem. Geol. 1979, 27, 47–63. [Google Scholar] [CrossRef]
- Tan, W.; Zeng, Y.; Lin, M.; Zeng, X.; Lin, R.; Guo, H. Hydrothermal alteration and elements migration features of Mali Krivelj porphyry copper deposit in Bor metallogenic belt, Serbia. Miner. Depos. 2023, 42, 1266–1284. [Google Scholar]
- Mei, Y.; Sherman, D.M.; Liu, W.; Etschmann, B.; Testemale, D.; Brugger, J. Zinc complexation in chloride-rich hydrothermal fluids (25–600 C): A thermodynamic model derived from ab initio molecular dynamics. Geochim. Cosmochim. Acta 2015, 150, 265–284. [Google Scholar] [CrossRef]
- Wood, S.A.; Samson, I.M. The aqueous geochemistry of gallium, germanium, indium and scandium. Ore Geol. Rev. 2006, 28, 57–102. [Google Scholar] [CrossRef]
- Wu, J.; Liu, Z.; Yu, X. Plagioclase-regulated hydrothermal alteration of basaltic rocks with implications for the South China Sea rifting. Chem. Geol. 2021, 585, 120569. [Google Scholar] [CrossRef]
- Zhang, T.; Li, C.; Sun, S.; Hao, X. Geochemical characteristics of antimony and genesis of antimony deposits in South China. Acta Petrol. Sin. 2020, 36, 44–54. [Google Scholar]
- Wu, C.; Liu, Y.; Cao, M.; Hong, T.; Xu, X.; Dong, L. Characteristics and formation mechanism of reduced porphyry Cu and Mo-Cu deposits. Acta Petrol. Sin. 2015, 31, 617–638. [Google Scholar]
- Warren, J. Dolomite: Occurrence, evolution and economically important associations. Earth-Sci. Rev. 2000, 52, 1–81. [Google Scholar] [CrossRef]
- Shen, Q.-H.; Wang, H.-Y.; Zhou, J.-M.; Du, C.-W.; Chen, X.-Q. Dynamic Release of Potassium from Potassium Bearing Minerals as Affected by Ion Species in Solution. Soils 2009, 41, 862–868. [Google Scholar]
- Feng, Y.; Shao, Y.; Jiang, M.; Feng, Y.; Song, Z. Micro Area Composition Characteristics of Metal Minerals in the Laoyachao Pb-Zn Deposit in Hunan Province. Adv. Geosci. 2017, 7, 574–585. [Google Scholar] [CrossRef]
- Harris, C. Oxygen isotope Geochemistry of a Quartz-Agate Geode from northwestern Namibia. Communs Geol. Surv. SW Afr. Namib. 1988, 4, 43–44. [Google Scholar]
- Harris, C. Oxygen-isotope zonation of agates from Karoo volcanics of the Skeleton Coast, Namibia. Am. Mineral. 1989, 74, 476–481. [Google Scholar]
- Shen, M.; Lu, Z.; He, X. Mineralogical and Geochemical Characteristics of Banded Agates from Placer Deposits: Implications for Agate Genesis. ACS Omega 2022, 7, 23858–23864. [Google Scholar] [CrossRef] [PubMed]
Disclaimer/Publisher’s Note: The statements, opinions and data contained in all publications are solely those of the individual author(s) and contributor(s) and not of MDPI and/or the editor(s). MDPI and/or the editor(s) disclaim responsibility for any injury to people or property resulting from any ideas, methods, instructions or products referred to in the content. |
© 2025 by the authors. Licensee MDPI, Basel, Switzerland. This article is an open access article distributed under the terms and conditions of the Creative Commons Attribution (CC BY) license (https://creativecommons.org/licenses/by/4.0/).