Article

Effects of Fluid Inclusion Component Release on Flotation Behavior of Fluorite Minerals

1
School of Minerals Processing and Bioengineering, Central South University, Changsha 410083, China
2
Technology Research Center of Hunan Province for Comprehensive Utilization of Associated Fluorite and Fluorine Chemical Engineering, Chenzhou 423042, China
*
Author to whom correspondence should be addressed.
Minerals 2025, 15(9), 912; https://doi.org/10.3390/min15090912
Submission received: 25 July 2025 / Revised: 17 August 2025 / Accepted: 25 August 2025 / Published: 27 August 2025
(This article belongs to the Section Mineral Processing and Extractive Metallurgy)

Abstract

Fluid inclusions, ubiquitously present within fluorite during diagenesis and mineralization, are released as inevitable ionic components in the pulp during mineral crushing and grinding. This study, grounded in geochemistry, combined microstructural analysis, spectroscopy, and X-ray computed tomography (X-CT) to investigate the morphology and petrographic characteristics of fluid inclusions in fluorite minerals. Building on this foundation, inductively coupled plasma optical emission spectrometry (ICP-OES) and ion chromatography (IC) were employed to analyze the release patterns of fluid inclusion components and their impact on fluorite flotation. The results reveal that fluid inclusions within fluorite are predominantly liquid-rich, two-phase (vapor-liquid) inclusions, exhibiting a spatial distribution density as high as 14.1%. Furthermore, fluid components are released during fluorite grinding, particularly homonymous Ca2+ ions, which significantly influence fluorite flotation behavior. Low concentrations of Ca2+ can activate fluorite flotation, whereas high concentrations of Ca2+ consume the collector (sodium oleate) in solution through competitive adsorption. This competition inhibits the adsorption of sodium oleate onto the fluorite mineral surface. The findings of this research provide theoretical support for in-depth studies on fluid inclusions in minerals and their effects on mineral flotation behavior, thereby facilitating the clean and efficient recovery of strategic fluorite mineral resources.

1. Introduction

Fluorite, possessing a theoretical fluorine content of 48.67%, possesses excellent physical and chemical properties, enabling its extensive application across industrial sectors such as metallurgy, chemical engineering, and building materials. Notably, fluorite with a purity exceeding 97% plays a crucial role in strategic industries. In the optical field, it serves as a core material for manufacturing critical components including high-performance optical lenses, spectrometer prisms, and radiation-resistant windows. In the advanced materials sector, it functions as an essential raw material for synthesizing various organic fluoropolymers and fine chemicals. Within the new energy domain, high-purity fluorite acts as a key raw material for producing ultra-pure hydrofluoric acid, which is subsequently used in the fabrication of core materials like lithium-ion battery electrolytes. It stands as one of the most pivotal minerals containing fluorine in the Earth’s crust and serves as the primary source of fluorine in contemporary industry. In accordance with the “National Mineral Resources Planning (2016–2020)” sanctioned by the State Council, fluorite has been incorporated into the strategic national mineral reserves of China, thereby highlighting its indispensable role in China’s economic development [1]. Flotation remains the predominant method for fluorite enrichment in order to obtain fluorite concentrate products that meet industrial standards [2,3,4]. In addition to mineral properties and flotation reagents, the pulp solution environment, serving as the fluid medium of flotation, also plays a pivotal role in this process. The presence of unavoidable ions in the pulp, particularly metal ions, directly impacts both the overall flotation process and separation efficiency [5,6,7].
The impact of unavoidable ions in pulp on mineral flotation behavior has been partially investigated, and corresponding activation or inhibition principles have been summarized [8]. However, most studies attribute the source of unavoidable ions in pulp solution solely to the surface dissolution of minerals, surface oxidation, introduction of grinding media, and the origin of mineral processing return water while overlooking another significant and indispensable source: the release of fluid inclusion components [9,10,11,12,13,14]. Fluid inclusion refers to the portion of material enclosed within mineral defects or cavities during mineral crystallization and growth, which remains within the main minerals and exhibits distinct phase boundaries with them [15]. During mineral processing, particularly in the crushing and grinding stages, the initially sealed fluid inclusions rupture due to external forces, causing gas, liquid, and ore-forming fluid components trapped within these inclusions to overflow. Some electrolyte ion components adsorb onto the surface of these inclusions and are subsequently released into the pulp during mineral flotation. These ions become inevitable constituents of the pulp solution environment, disrupting its balance and thereby influencing mineral flotation behavior.
Currently, there is a paucity of literature regarding the impact of mineral fluid inclusion and its component release on mineral flotation. Only a limited number of studies have focused on investigating the influence of fluid inclusion component release in sulfide ore as an inevitable ion in pulp on its flotation, while research on non-sulfide ore remains scarce [16,17,18,19,20]. To elucidate the primary source of noble ions in fluorite flotation pulp and enhance the theoretical framework of fluorite flotation, this study investigates the petrographic characteristics of fluid inclusions within fluorite and examines the impact of inclusion component release on flotation behavior.

2. Materials and Methods

2.1. Materials

The fluorite mineral utilized in the experiment was sourced from a fluorite mine located in Baotou, Inner Mongolia. Following meticulous manual selection and impurity removal, the mineral underwent crushing using a corundum jaw crusher and fine grinding via a ceramic ball mill. Subsequently, the finely ground products with particle sizes ranging from 45 to 74 μm were subjected to flotation and dissolution tests. Chemical element analysis (Table 1) revealed that the fluorine content in fluorite amounted to 48.429%, while the calcium content reached 49.647%. In conjunction with the XRD results (Figure 1a), it can be inferred that the fluorite sample possessed high purity levels, meeting the requirements for pure mineral flotation purposes. For this study, chemical-grade sodium oleate (NaOL) served as the collector, analytical-grade calcium chloride (CaCl2) functioned as an adjusting agent, and deionized water with resistivity exceeding 18 MΩ·cm was employed as the test water.

2.2. Petrographic Study of Fluid Inclusions

Well-crystallized pure fluorite bulk samples were selected and cut into double-polished inclusion thermometry slices (Figure 1b). The morphological characteristics and types of fluid inclusions in fluorite were observed under a DMLP polarizing microscope (Leica Co., Ltd., Wetzlar, Germany). Measurements of the homogenization temperature (Th) and freezing point temperature (Tm) of fluid inclusions were conducted on a THMS600 heating–cooling stage (Linkam Co., Ltd., Redhill, UK). The programmed heating rate was set at 10 °C/min, and the cooling rate was 30 °C/min. Near the ice melting point and phase transition point, the temperature control rate was adjusted to 0.5–1 °C/min.

2.3. X-Ray Computed Tomography Test

The fluorite samples were subjected to three-dimensional tomographic scanning using a high-resolution micro-focus cone-beam X-ray computed tomography (X-CT) system under conditions of 150 kV tube voltage, 200 μA current, and a 1 mm aluminum filter (inspeXio SMX-6000, Shimadzu Co., Ltd., Kyoto, Japan). A complete scan was performed over a 360° rotation with an exposure time of 1 s. Based on the acquired data, an 850 × 850 × 850 μm3 region of interest was constructed using the scanning software PathologyScan V 1.0. The rock matrix and voids within the sample were distinguished via a threshold segmentation method to conduct a statistical analysis of the spatial distribution characteristics of fluid inclusions in fluorite.

2.4. Laser Raman Spectroscopy Testing

The molecular constituents of the fluid inclusions in fluorite temperature plates were analyzed using a Renishaw inVia micro-confocal laser Raman spectrometer (Renishaw Co., Ltd., Wotton-under-Edge, UK). The instrument parameters were as follows: excitation wavelength of 514.5 nm, laser power of 20 mW, minimum laser beam diameter of 1 μm; spectral range from 100 to 4500 cm−1 with continuous scanning; spectral resolution less than 2 cm−1 and spectral repeatability within ±0.2 cm−1.

2.5. Ion Component Test

The cationic components released from the bursting of fluorite fluid inclusions and surface dissolution were analyzed using a Prodigy 7 plasma optical emission spectrometer (ICP-OES, Leeman Co., Ltd., Powder Springs, GA, USA), while the anionic components were analyzed using a Dionex Aquion high-performance ion chromatograph (IC, Thermo Scientific Inc., Waltham, MA, USA). Prior to analysis, a clean fluorite sample with a particle size of 1 mm was obtained and the fluid inclusions were ruptured through grinding. The fluid constituents were then added to the solution, followed by solid–liquid separation after ultrasonication.

2.6. Flotation Test

Flotation tests were conducted using an XFG-type hanging-cell flotation machine. The rotational speed of the flotation machine was set at 1600 r/min. For each test, 10.0 g of pure mineral was mixed with 100 mL of deionized water and added to a 120 mL flotation cell, followed by conditioning for 1 min. The regulator and collector were then added successively and stirred for 2 min and 3 min, respectively. Each test was aerated for 0.5 min, and froth collection was performed by scraping for 3 min. The froth product and the cell-bottom product were separately filtered, dried, and weighed. The yield of the froth product was calculated as the mineral recovery.

3. Results and Discussion

3.1. Morphological Characteristics of Fluorite Fluid Inclusions

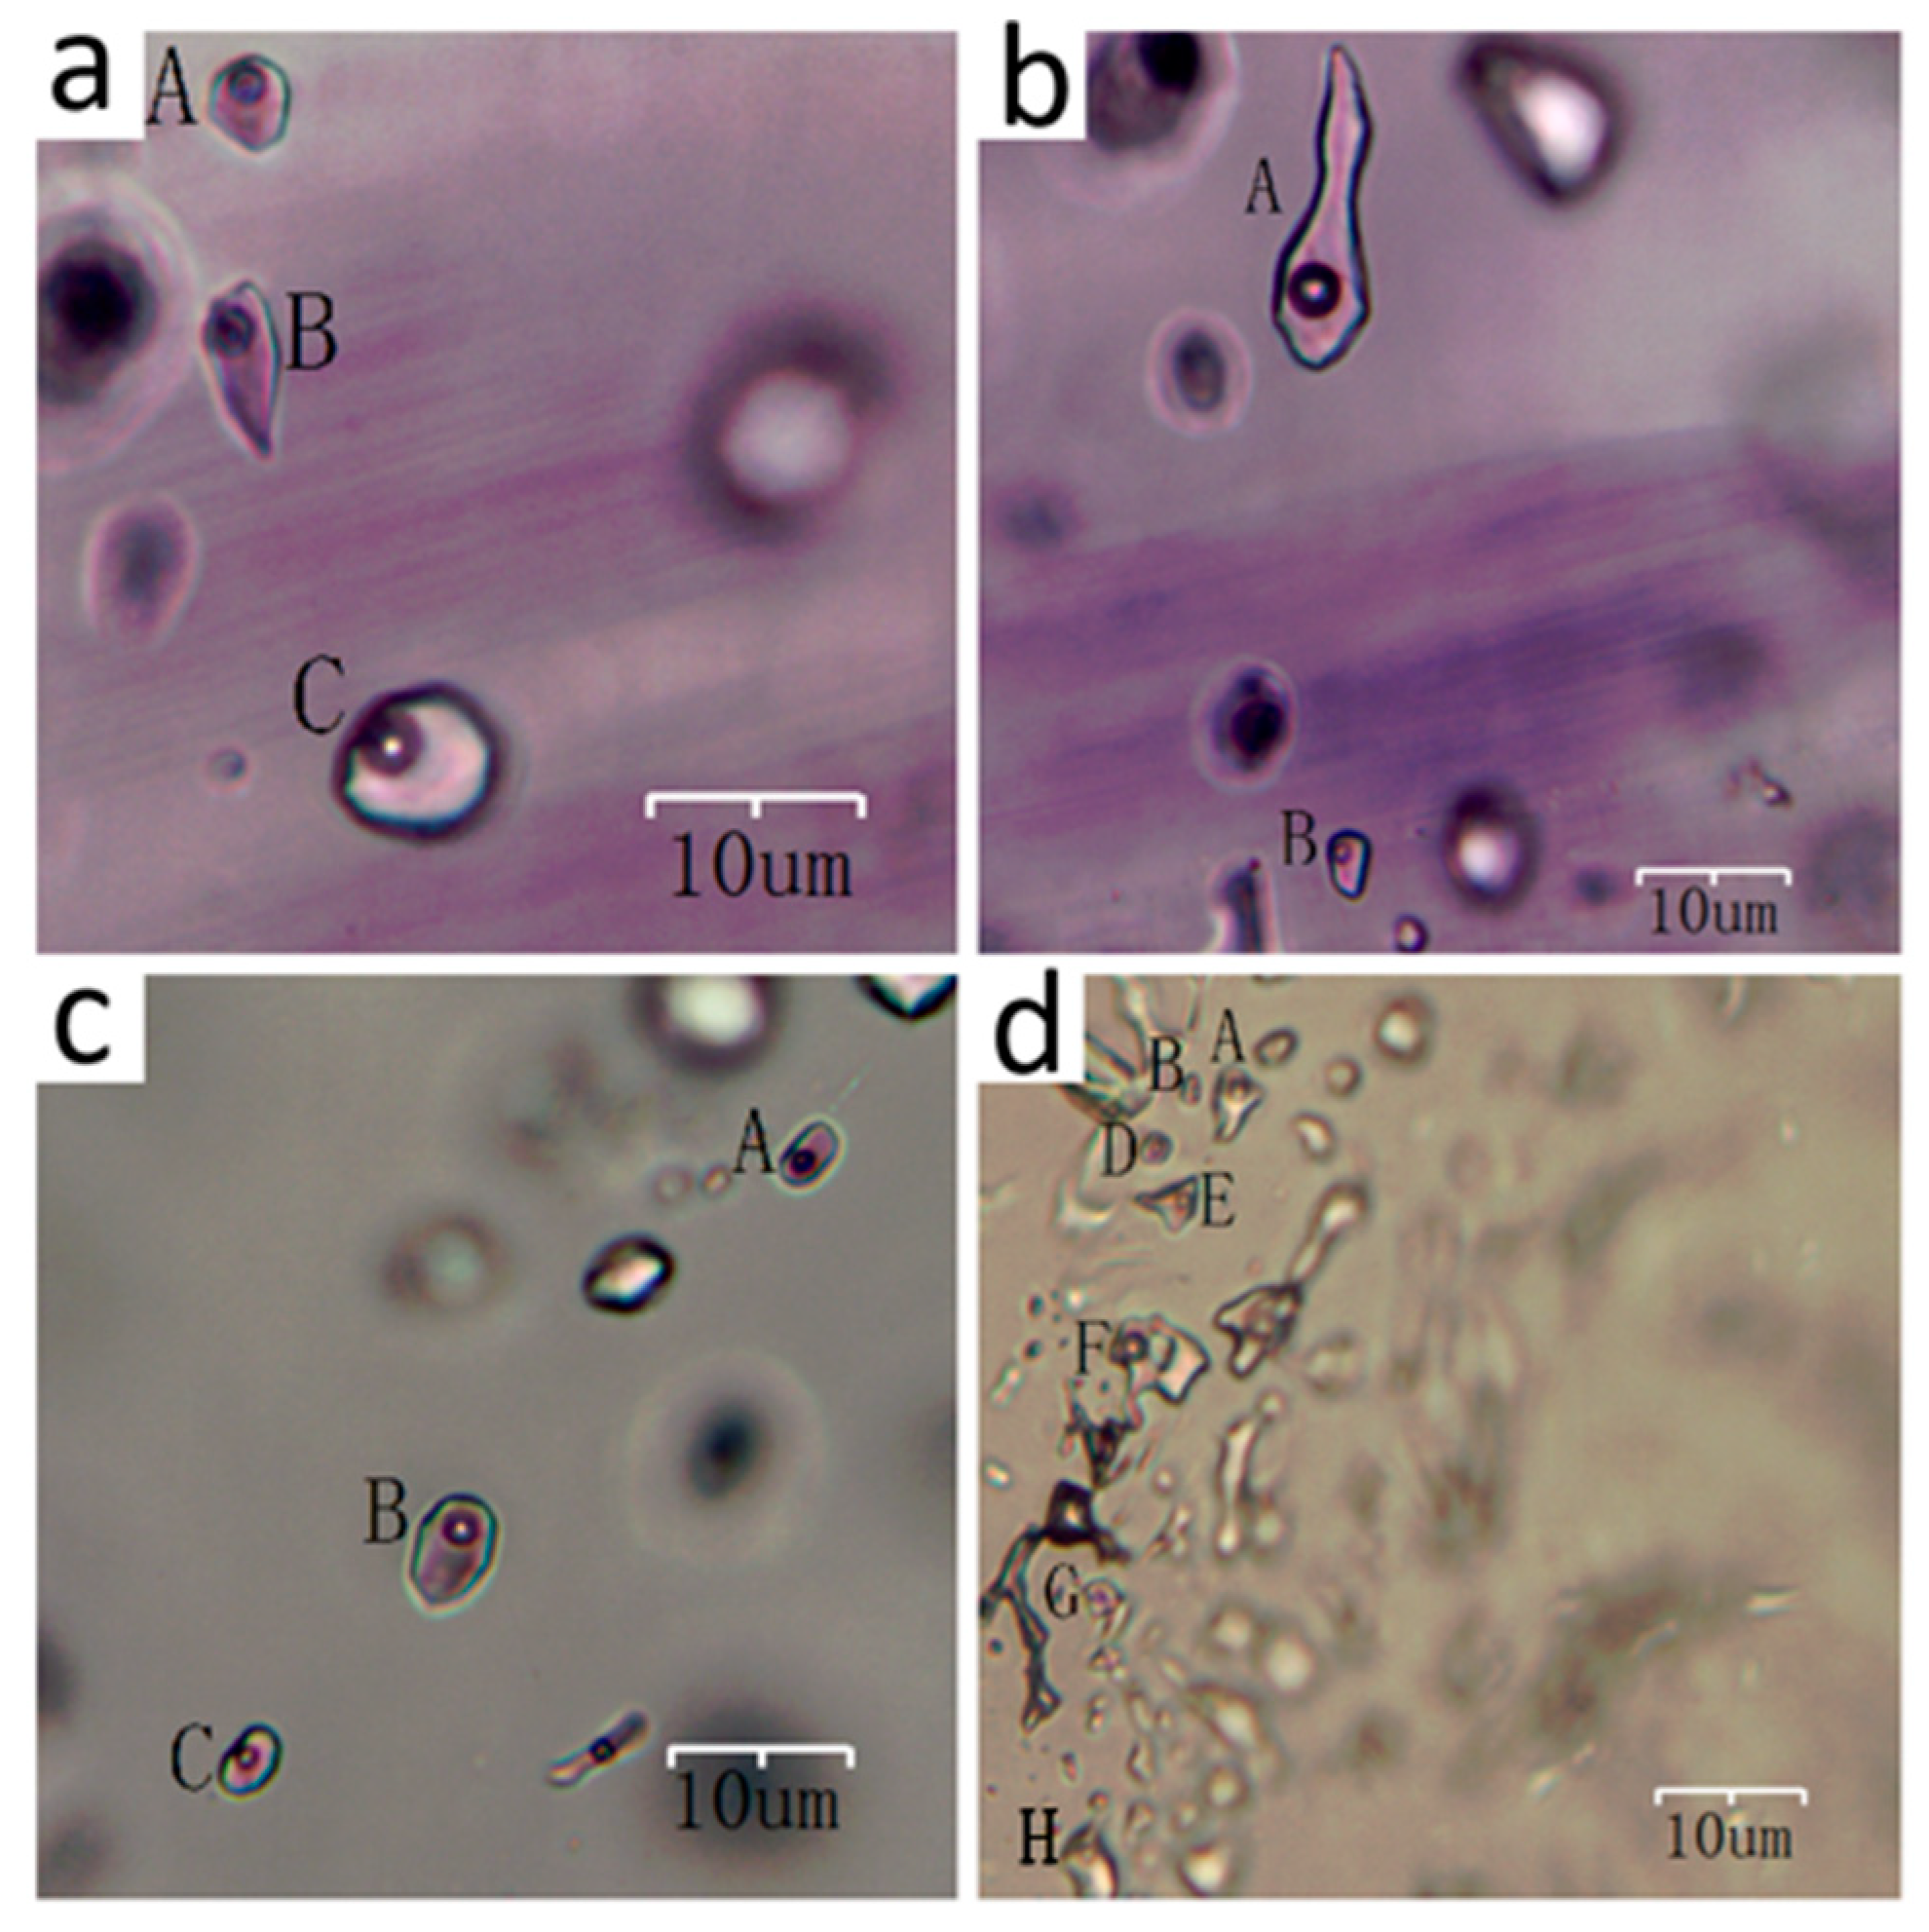
As shown in Figure 2, the larger fluid inclusions within the fluorite thermometer slices are clearly observable under microscopic examination, with distinct purple halos present in certain areas. These inclusions exhibit a banded distribution pattern and are predominantly composed of liquid-rich gas–liquid two-phase inclusions (WG type), with only a minor proportion consisting of single liquid-phase inclusions (L type). Most inclusions display elliptical morphologies and are classified as primary in origin. However, a small number of long strip-shaped (Figure 2b(A)) or irregularly shaped (Figure 2d(G)) inclusions were also observed. In terms of size, the inclusions range from 4.5 to 20.4 μm, with maximum radial lengths reaching up to 37 μm and minimum dimensions as low as 3.8 μm; elliptical inclusions generally measure between 3.6 and 10.6 μm. Additionally, rare three-phase inclusions containing daughter minerals (Figure 2d(F)) were identified, which exhibit irregular morphologies and size ranges of approximately 3.6 to 8.9 μm. The morphological characteristics suggest that these three-phase inclusions can be classified as either secondary or pseudo-secondary.

3.2. Petrographic Characteristics of Fluorite Fluid Inclusions

3.2.1. Homogenization Temperature and Freezing Point Temperature

The majority of fluid inclusions in fluorite are classified as liquid-rich gas–liquid two-phase inclusions (WL type), which homogenize to the liquid phase upon heating. As temperature increases, gas bubbles within the inclusions gradually shrink, and the liquid phase occupies an expanding proportion of the inclusion volume (Figure 3a,b). Further heating leads to complete bubble disappearance, resulting in full homogenization to the liquid phase (Figure 3c). The temperature at which bubble disappearance occurs is defined as the homogenization temperature (Th) of these inclusions. Upon reaching Th, heating is terminated, and natural cooling of the system initiates. During cooling, gas–liquid two-phase reformation occurs as bubbles reappear in previously homogenized inclusions (Figure 3d).
Using liquid nitrogen, the temperature of the glass carrier is reduced from room temperature to −110 °C, causing the entire liquid phase within the inclusions to freeze (Figure 3e,f). The freezing process is then halted, and the temperature inside the glass carrier is gradually increased. As temperature rises, the frozen fluid begins to melt at a specific temperature defined as the initial melting point (Tem) (Figure 3g). With continued heating, progressive melting occurs: the solid phase area decreases, the liquid phase expands, and gas bubbles precipitate and grow concurrently. The freezing point temperature (Tm) is recorded when the solid phase within inclusions disappears completely, restoring the original gas–liquid two-phase state (Figure 3h). This reversion is microscopically observable as a purple hue on the thermal measurement stage.
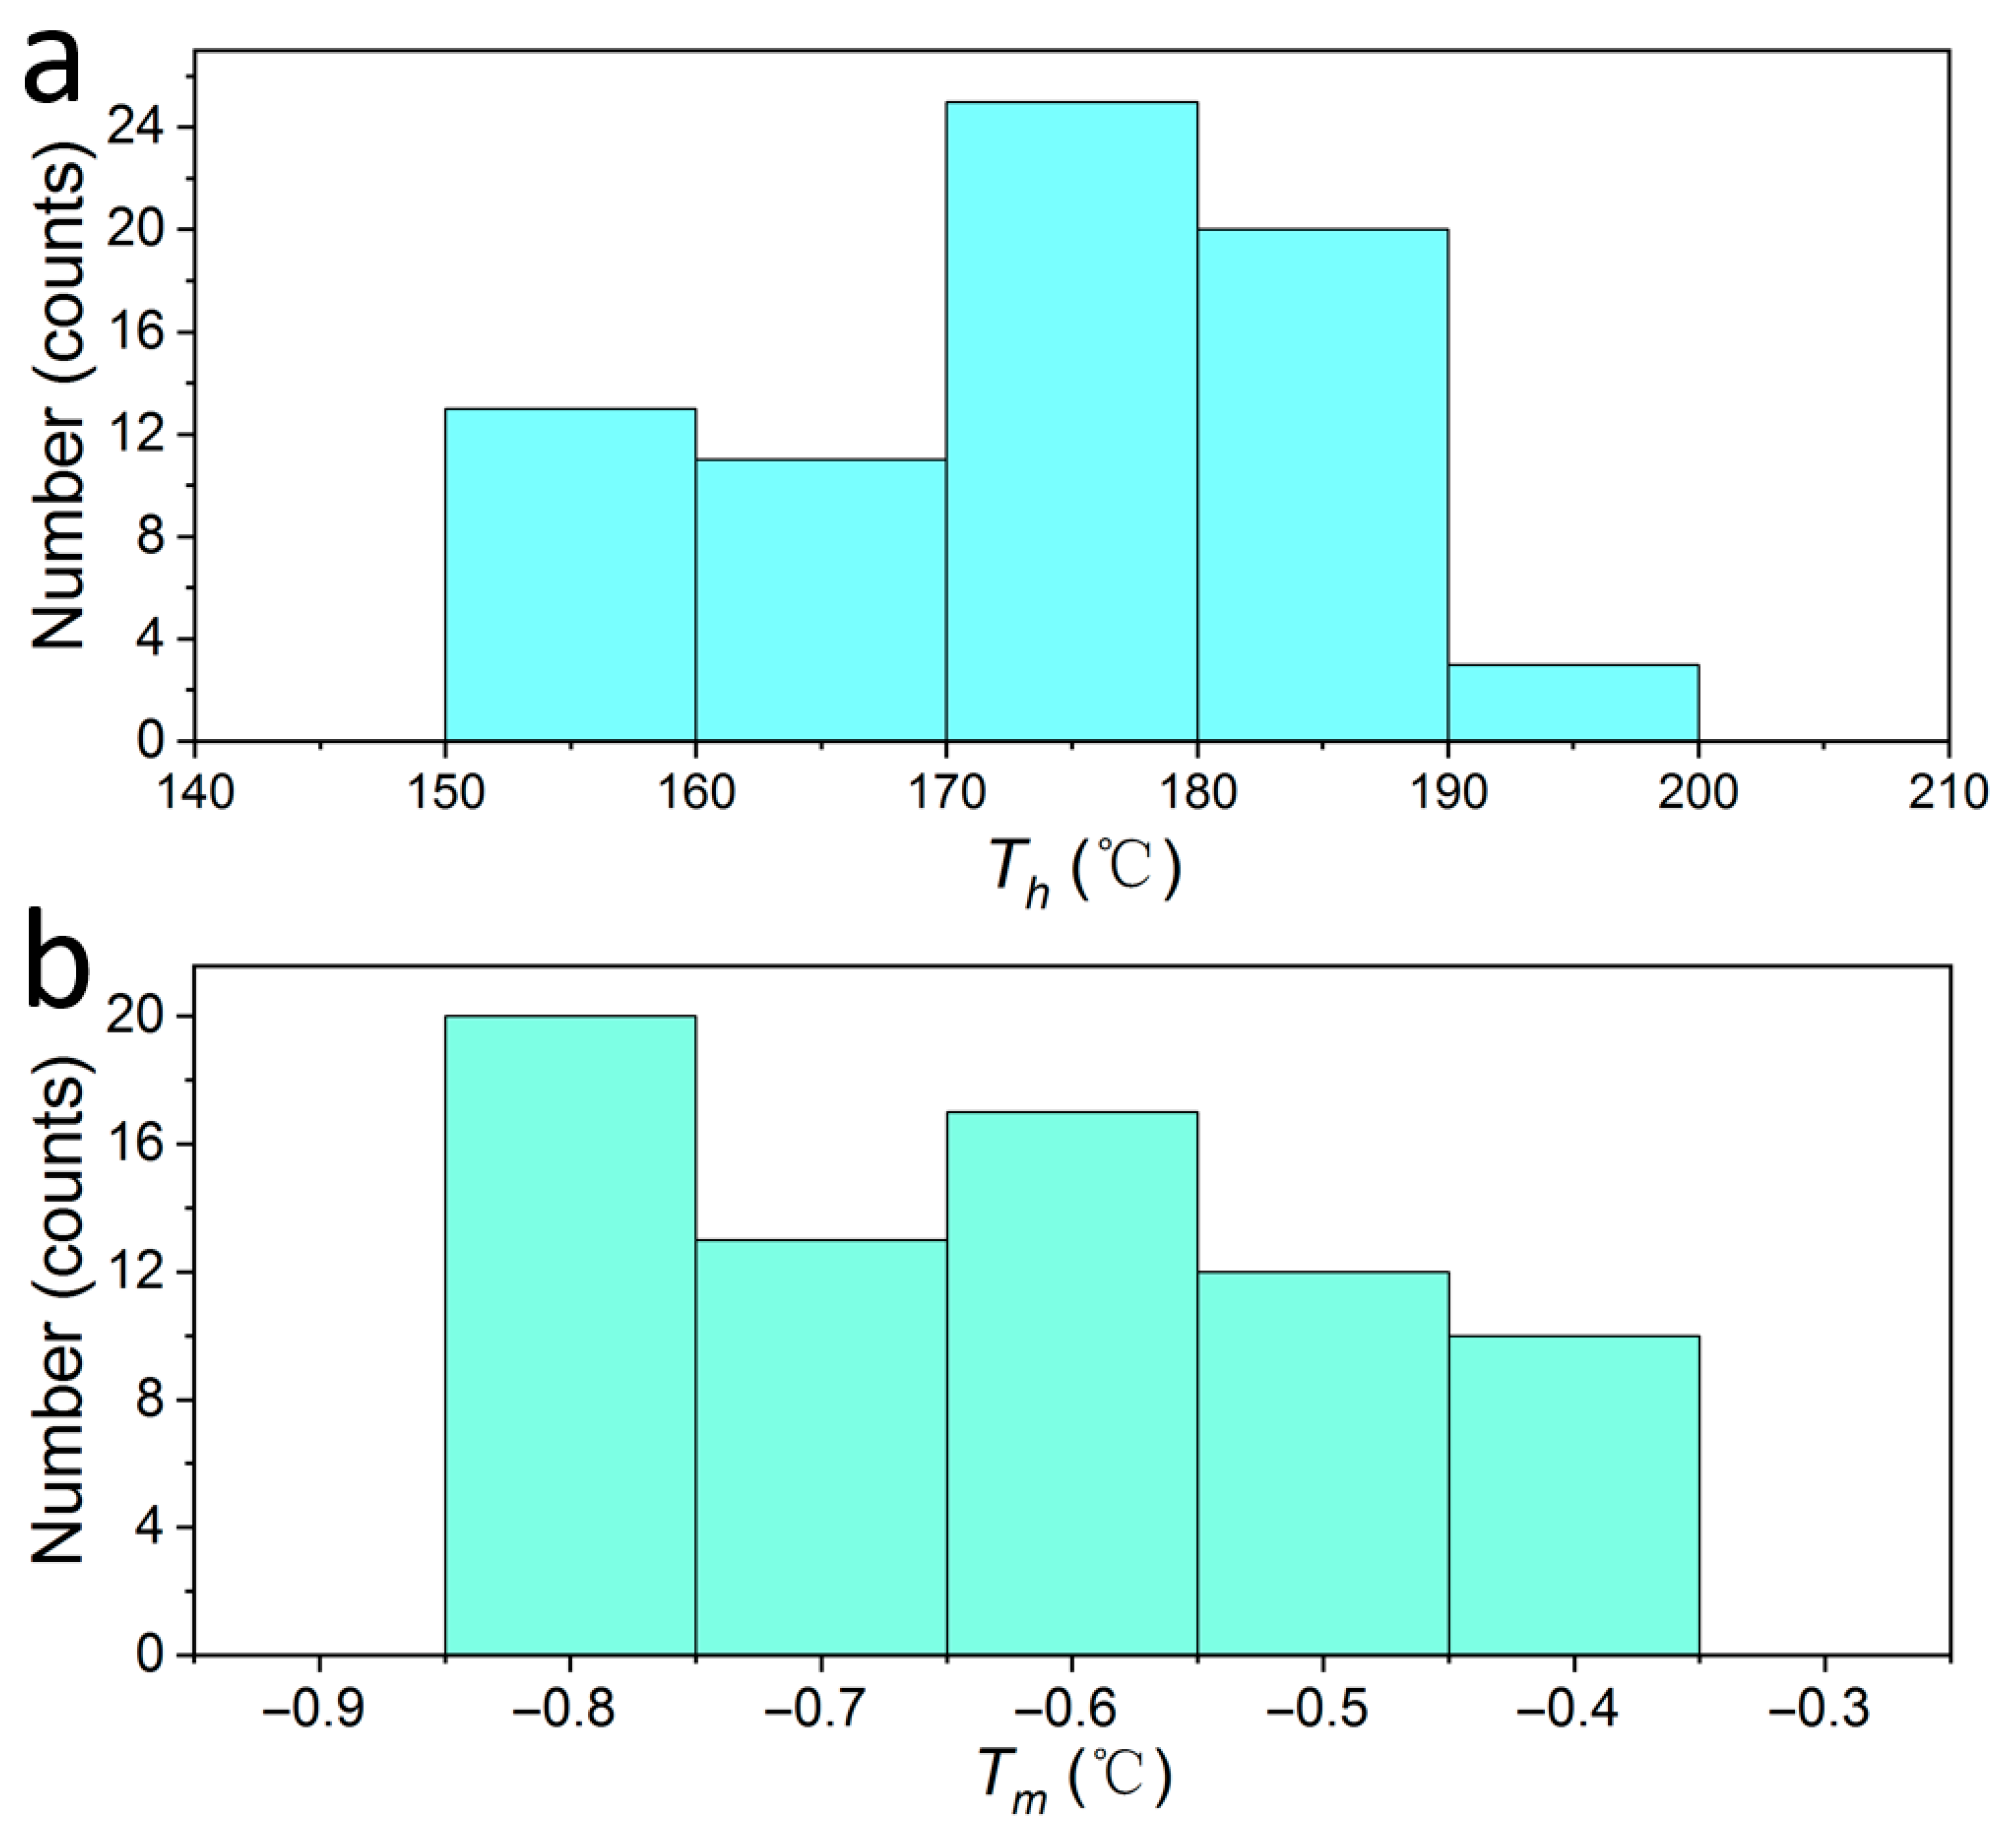
As shown in Figure 4a, statistical analysis reveals that homogenization temperatures of fluid inclusions in fluorite are primarily concentrated in the range of 155 to 185 °C, with a minor fraction distributed between 190 and 200 °C, and an average of 175 °C. This indicates that the ore-forming temperature of this fluorite type is relatively low, belonging to a medium–low-temperature ore-forming environment. In contrast, freezing point temperatures exhibit a uniform distribution ranging from −0.8 to −0.4 °C, without a distinct clustering pattern, reflecting relatively homogeneous composition and salinity within the fluorite fluid inclusions.

3.2.2. Fluid Inclusion Salinity and Density Analysis

Through microscopic observation and in conjunction with the freezing point temperature distribution characteristics of inclusions, it can be determined that the initial melting temperature (Tem) of inclusions in fluorite exceeds −20 °C, indicating that the fluid inclusions within fluorite belong to a simple NaCl-H2O system. Consequently, the salinity of inclusion fluid within fluorite can be calculated using Equation (1) based on the salinity–freezing point relationship of the NaCl-H2O system [15].
W = 1.78 T m 0.0442 T m 2 + 0.000557 T m 3
where Tm represents the freezing point temperature of the inclusion, while W denotes the salinity of the fluid in the inclusion system. Furthermore, combined with the homogenization temperature of the fluid inclusion, one can calculate its density using Barton’s formula [21,22]. As a crucial thermodynamic parameter of fluid inclusions, density provides a more comprehensive understanding of their characteristics. The results for temperature parameters such as salinity and density are presented in Table 2.
The salinity and density of fluid inclusions in fluorite exhibit variations due to differences in fluid systems, as evident from Table 2. Salinity ranges between 0.701 wt.% and 1.389 wt.% while density varies from 0.878 to 0.927 g/cm3. Generally, these fluid inclusions belong to low-temperature and low-salinity fluids, sharing similarities with the ones found in the fluorite deposit in the Xilinshuitou area of Inner Mongolia, as studied by previous researchers [23,24,25]. Consequently, it can be inferred that this type of fluorite deposit is formed through medium–low-temperature hydrothermal fissure filling processes.

3.2.3. Spatial Distribution Characteristics of Fluid Inclusions

The spatial distribution characteristics of internal fissures in tested samples can be detected using X-CT, based on the density differences between the tested samples and their X-ray absorption degree. Given that fluorite fluid inclusions primarily consist of the WG type with significantly lower densities than fluorite minerals, X-CT analysis can be employed to examine the spatial distribution characteristics of fluid inclusions within fluorite minerals.
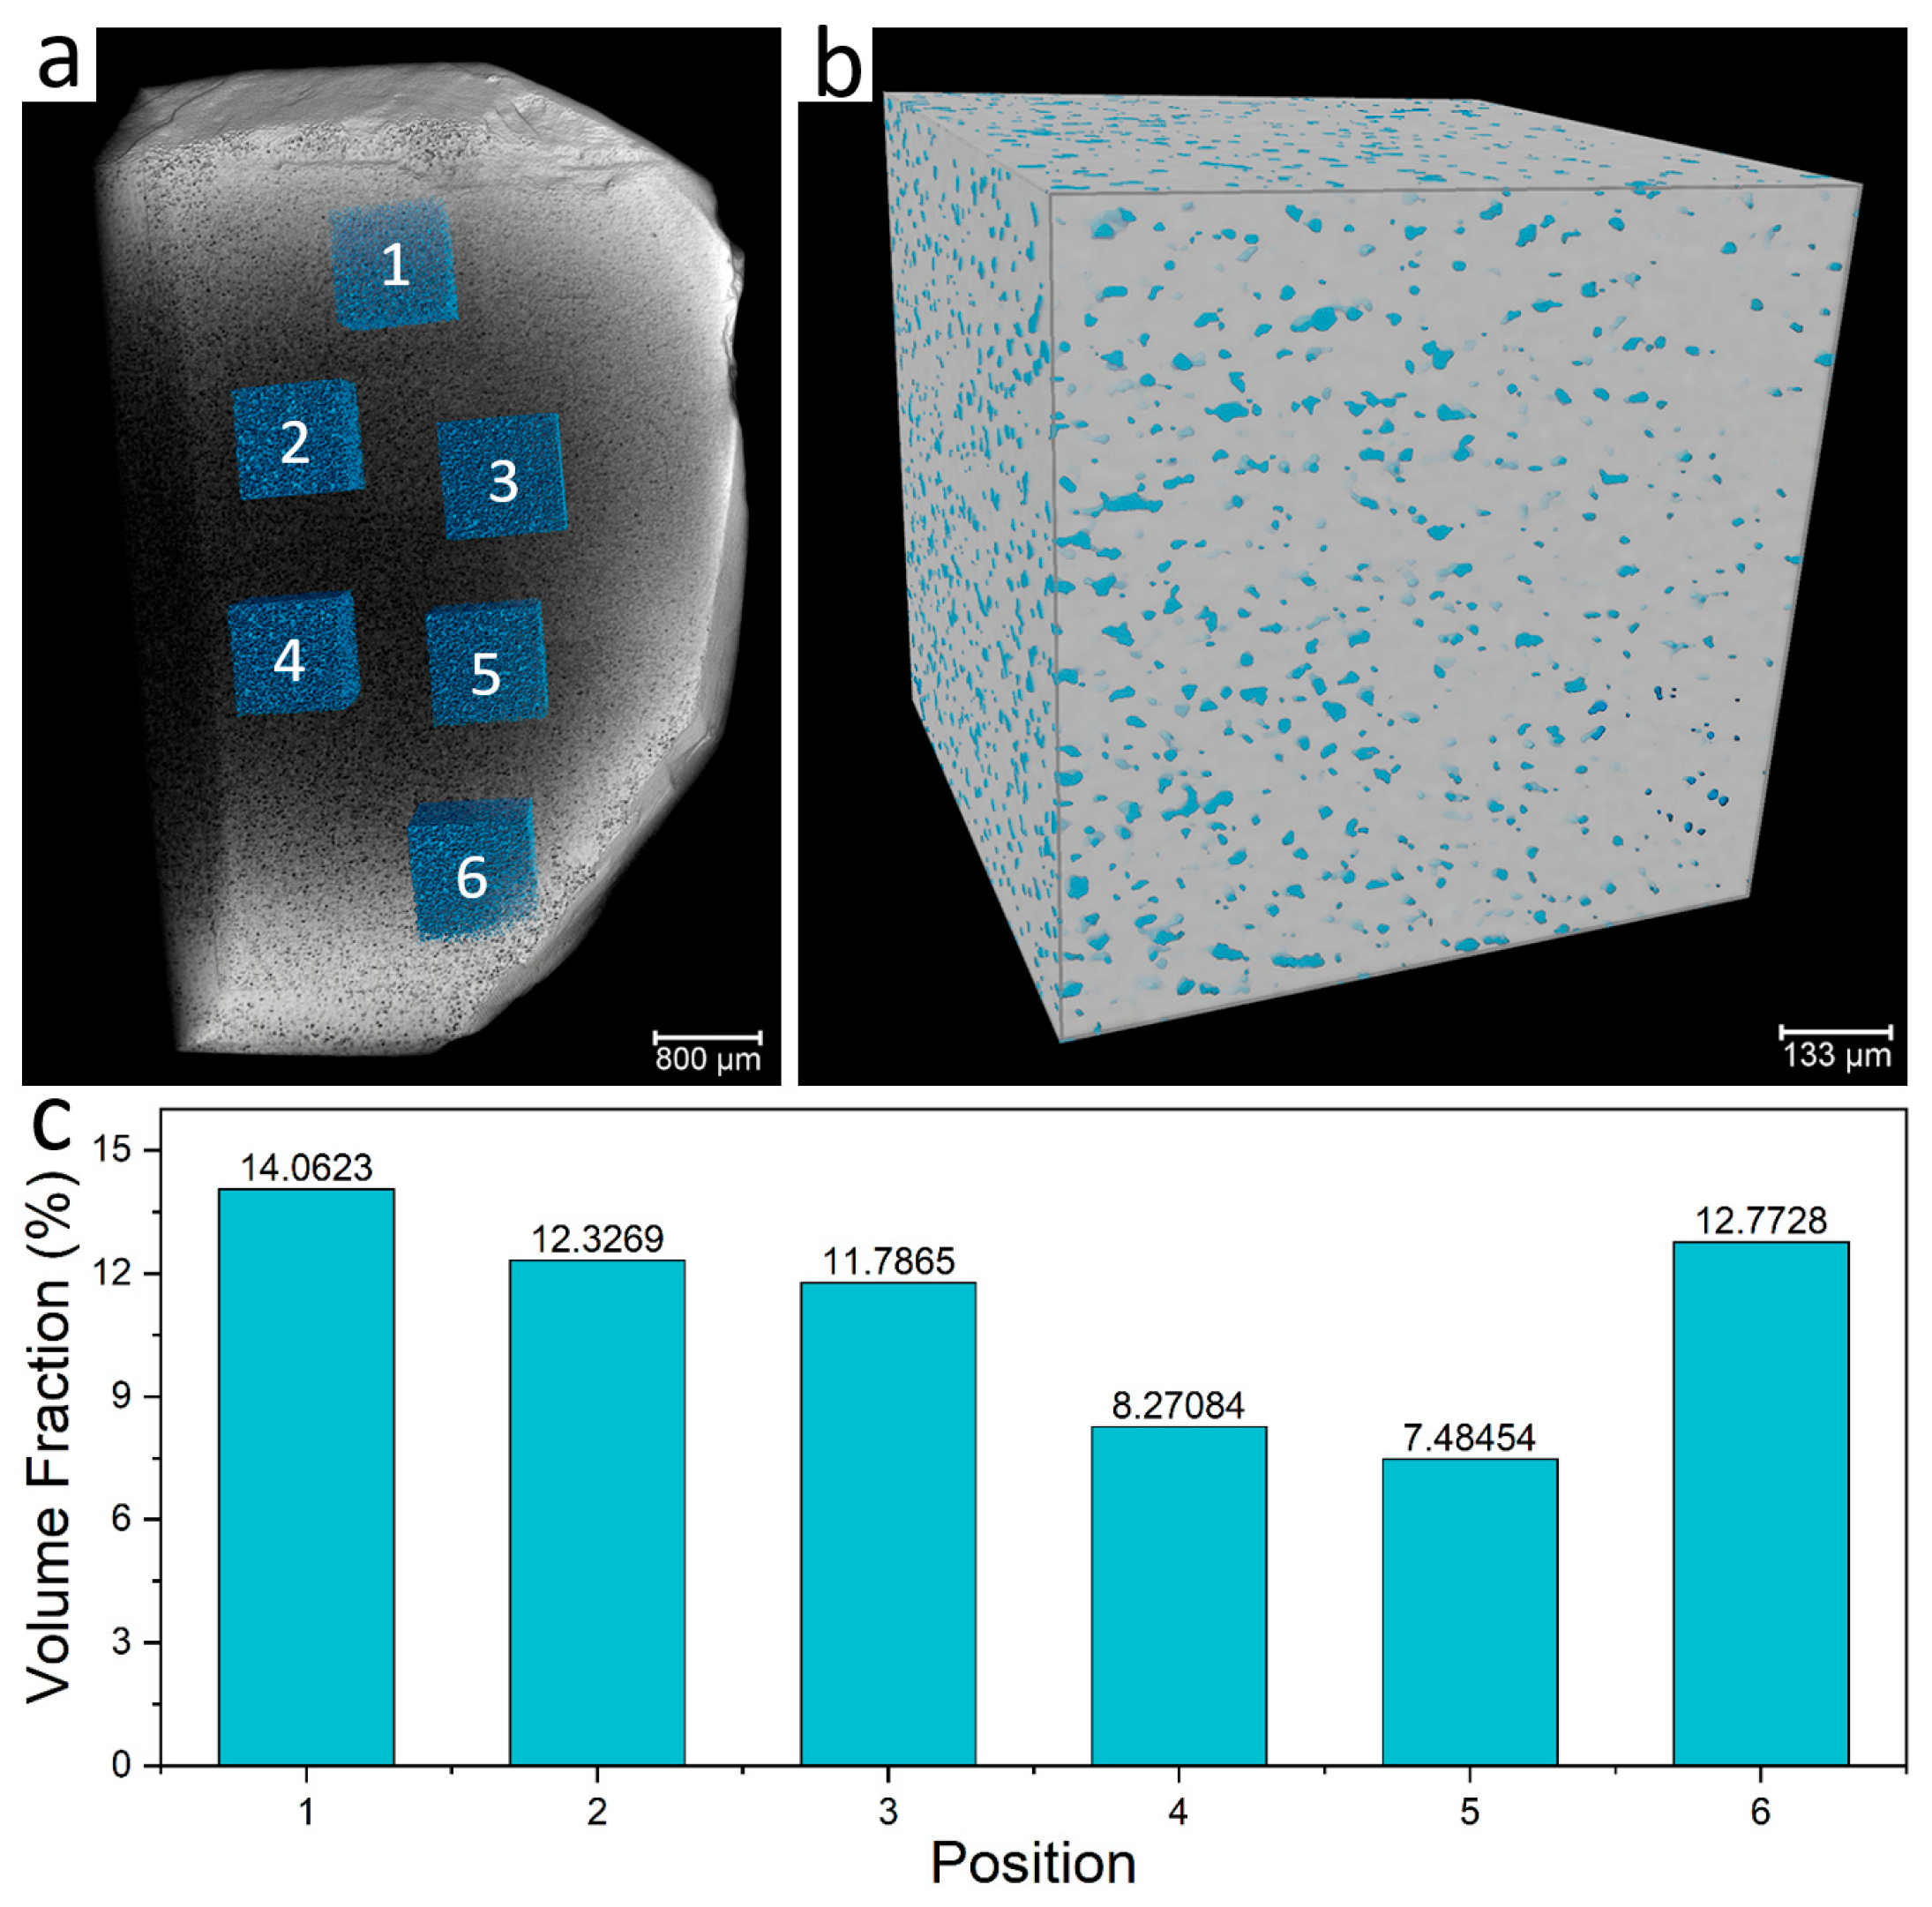
The three-dimensional (3D) tomography structure of fluorite is illustrated in Figure 5, where a reconstruction area measuring 850 × 850 × 850 μm3 was established to analyze the spatial distribution characteristics of fluid inclusions within fluorite (Figure 5b). The blue region represents the low-density area, indicating the 3D spatial distribution of fluid inclusions. Statistical analysis reveals that the spatial distribution density of fluid inclusions within fluorite reaches an impressive 14.1%, with an average occurrence rate of 11.1%, suggesting a significant abundance of fluid inclusions.

3.2.4. Chemical Composition Analysis of Fluid Inclusions

Due to the small diameter of the laser beam (at least 1 μm), laser Raman micro-area analysis has emerged as a prominent technique for fluid inclusion testing. When integrated with an optical microprobe system, it enables the independent examination of individual liquid or gas phases within fluid inclusions, facilitating the acquisition of pertinent chemical composition information.
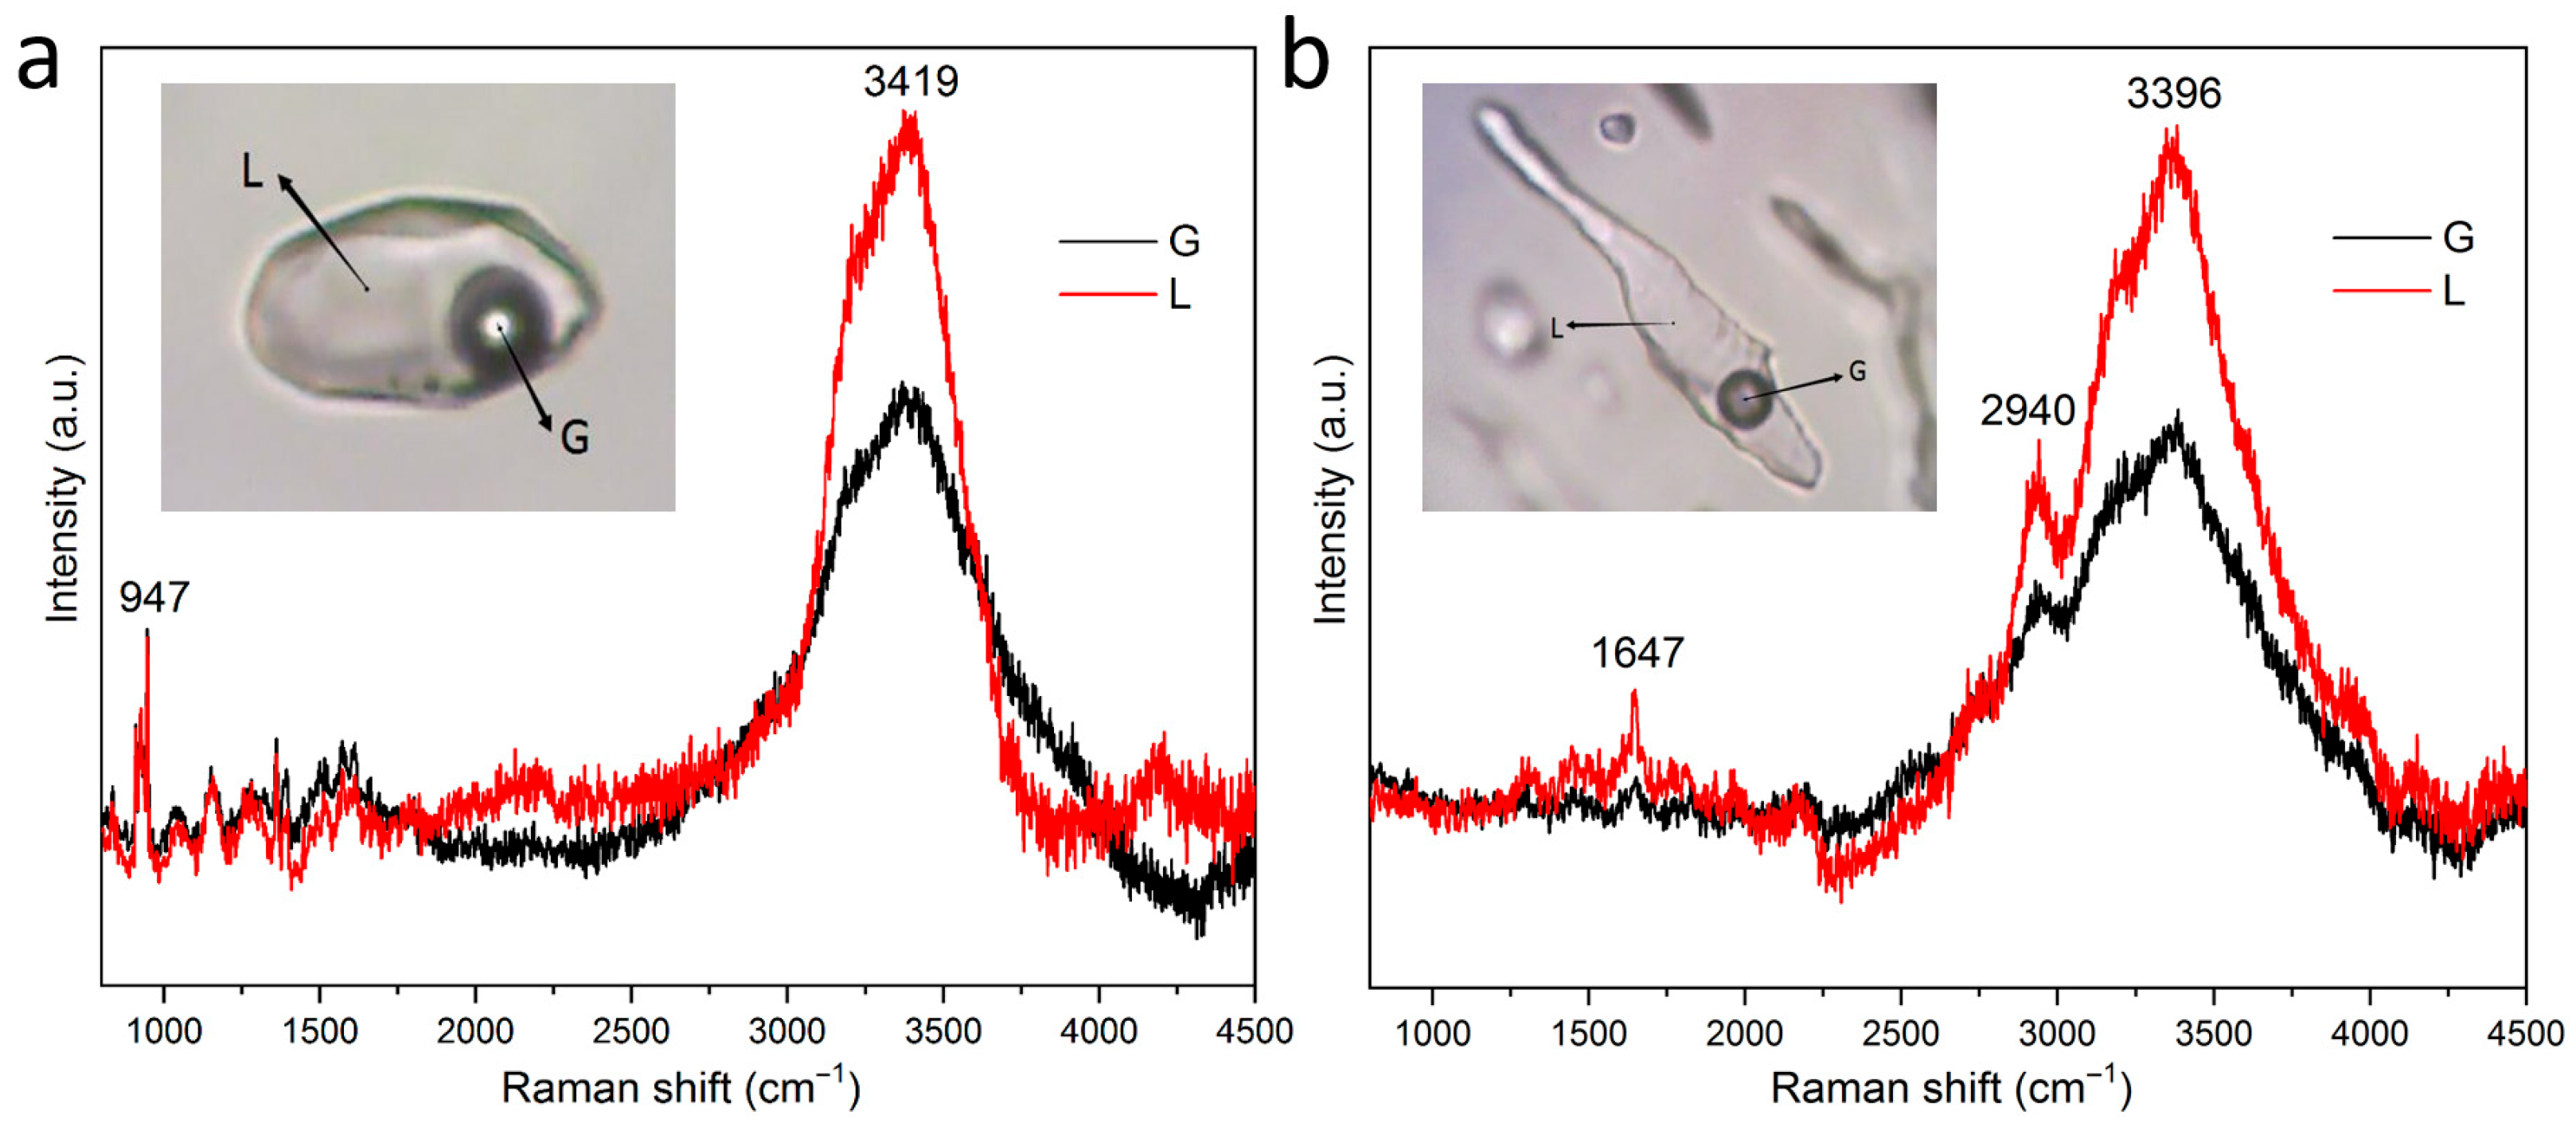
The gas and liquid components of the original fluid inclusions in fluorite are predominantly H2O, as indicated by Figure 6a, with a Raman shift at approximately 3419 cm−1. Notably, the vibration absorption peak of water in the liquid phase is significantly stronger than that in the gas phase. Laser Raman analysis did not detect any CO2 or H2 gases within the fluid, which aligns with microscopic observations showing an absence of CO2-rich inclusions. Furthermore, secondary fluid inclusions (Figure 6b) revealed the presence of alkane organic compounds such as C2H6 (2940 cm−1) and C4H6 (1647 cm−1), suggesting that during late geological events associated with splitting, organic matter was mixed into the original fluid inclusions and subsequently trapped. Laser Raman spectroscopy analysis demonstrated a relatively simple composition for the fluid within fluorite’s inclusion system without significant complexity regarding its gas composition. The primary constituents were found to be liquid-rich fluid inclusions primarily composed of H2O, indicating a simple NaCl-H2O system consistent with previously calculated salinity values.

3.3. Release Behavior of Fluid Inclusion Compositions in Fluorite

In the field of mineral processing, apart from comprehending the structure and morphology of mineral fluid inclusions, greater emphasis is placed on the rupture of fluid inclusions entrapped within minerals during their crushing or grinding processes. The subsequent release of fluid components into the pulp solution inevitably influences mineral flotation through ion interactions. Consequently, particular attention is directed towards investigating the solute composition released by fluorite fluid inclusions in solution and comparing their contribution to unavoidable ions present in the pulp with that originating from the fluorite mineral surface.
As shown in Table 3, the concentration of various ion components released into the solution by fluorite fluid inclusions increases significantly with increasing grinding time. Specifically, when the grinding time is increased from 8 min to 60 min, the concentration of Ca2+ released from fluid inclusions increases from 11.00 × 10⁻⁴ to 88.24 × 10⁻⁴ mol/L, indicating that increasing grinding intensity facilitates the full opening and release of ion components in fluid inclusions. This result indirectly suggests that the effect of releasing ion components on flotation is greater for fine minerals than for coarse ones. In addition to Ca2+ and F, Cl and SO42− concentrations also gradually increase with longer grinding times. Specifically, when grinding time is increased from 8 min to 60 min, Cl and SO42− concentrations increase from 0.20 × 10⁻⁴ and 0.11 × 10⁻⁴ mol/L to 1.10 × 10⁻⁴ and 0.81 × 10⁻⁴ mol/L, respectively. Although the ion concentrations are significantly lower compared to the concentrations of Ca2+ and F in solution, the observed increase in concentration remains substantial in terms of orders of magnitude. This suggests that the rise in Cl and SO42− levels within the solution is predominantly attributed to fluid inclusion components.
In order to further minimize the contribution of ion components from the dissolution of the fluorite mineral surface, fluorite mineral particles were subjected to repeated washing with ultrapure water for 60 min prior to conducting the dissolution test. The washed fluorite mineral was then prepared in a solution with a solid concentration of 10% in a conical flask, followed by magnetic stirring at 800 rpm for 7 h. As shown in Table 4, after a dissolution period of 7 h, the concentrations of Ca2+ and F in the solution were found to be significantly lower (3.12 × 10⁻⁴ and 1.18 × 10⁻⁴ mol/L, respectively) compared to those released by fluid inclusions, as presented in Table 3. Furthermore, there was also a notable decrease observed in Cl concentration, while SO42− could not be detected for its lower concentration. Henceforth, it can be inferred that the primary source of abundant ion components such as Ca2+, F, Cl, and SO42− within the solution is attributed not to the dissolution process of fluorite mineral but rather to the release from numerous fluid inclusion components present within fluorite.

3.4. Influence Mechanism of Fluid Inclusion Component Release on Fluorite Flotation

In addition to the surface dissolution of fluorite minerals, the primary source of ions in the pulp solution is attributed to the release of fluid inclusion components within fluorite mineral particles. Among these released ion components, Ca2+ plays a particularly significant role. Consequently, extensive investigations have been conducted on the influence of Ca2+ on fluorite flotation behavior. Building upon this research, we provide a concise analysis regarding the mechanism and significance of fluorite fluid inclusion and its component release on fluorite flotation.
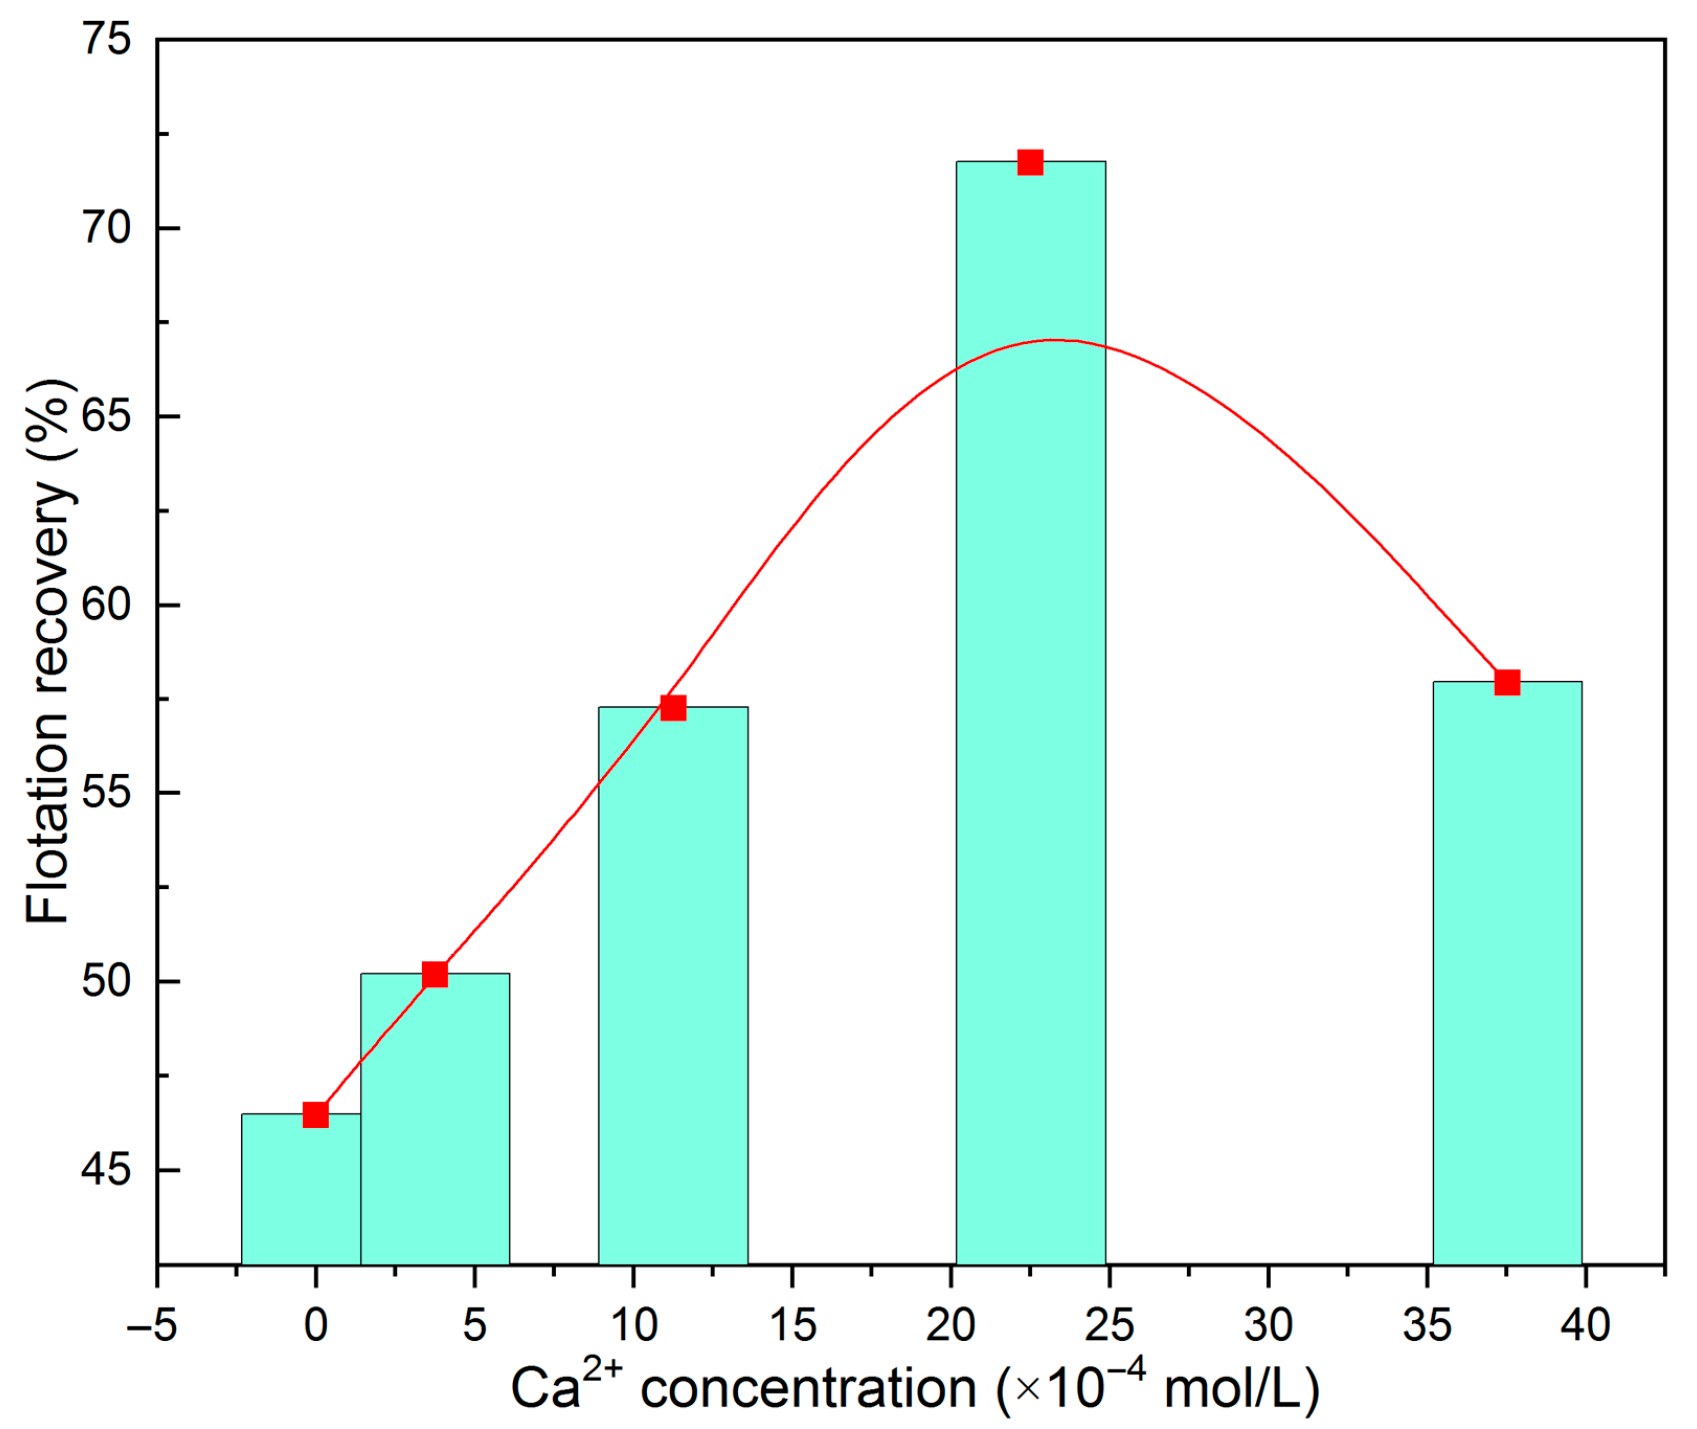
The representative sample used in this study was fluorite powder with a particle size of 45 to 74 μm, and the CaCl2 electrolyte solution served as the source of Ca2+ for the pulp. Figure 7 illustrates the effect of Ca2+ concentration on fluorite flotation behavior in a neutral pulp environment when the collector sodium oleate was present at a concentration of 6.0 × 10⁻⁵ mol/L. It can be observed that as the concentration of Ca2+ in the pulp solution increased from 0 to 37.5 × 10⁻⁴ mol/L, the flotation recovery rate of fluorite initially increased and then decreased. The highest flotation recovery rate (71.8%) was achieved when an amount of Ca2+ addition equal to 22.5 × 10⁻⁴ mol/L was used, which was approximately 25 percentage points higher than that without any Ca2+ addition. This indicates that within a certain range, adding Ca2+ has an activating effect on fluorite flotation. However, a further increase in Ca2+ concentration led to a decrease in the flotation recovery rate due to excessive reaction between Ca2+ and sodium oleate, resulting in the consumption of the collector and a reduction in its concentration within the solution, consequently inhibiting the adsorption of sodium oleate onto fluorite mineral surfaces. Additionally, based on our investigation into fluid inclusion components released by fluorite minerals, it is worth noting that even at solid concentrations as low as 10%, ion component concentrations introduced through inclusion release reached magnitudes of around 10−4 mol/L (Table 3). These released components become unavoidable ions within the pulp solution and significantly impact mineral flotation.
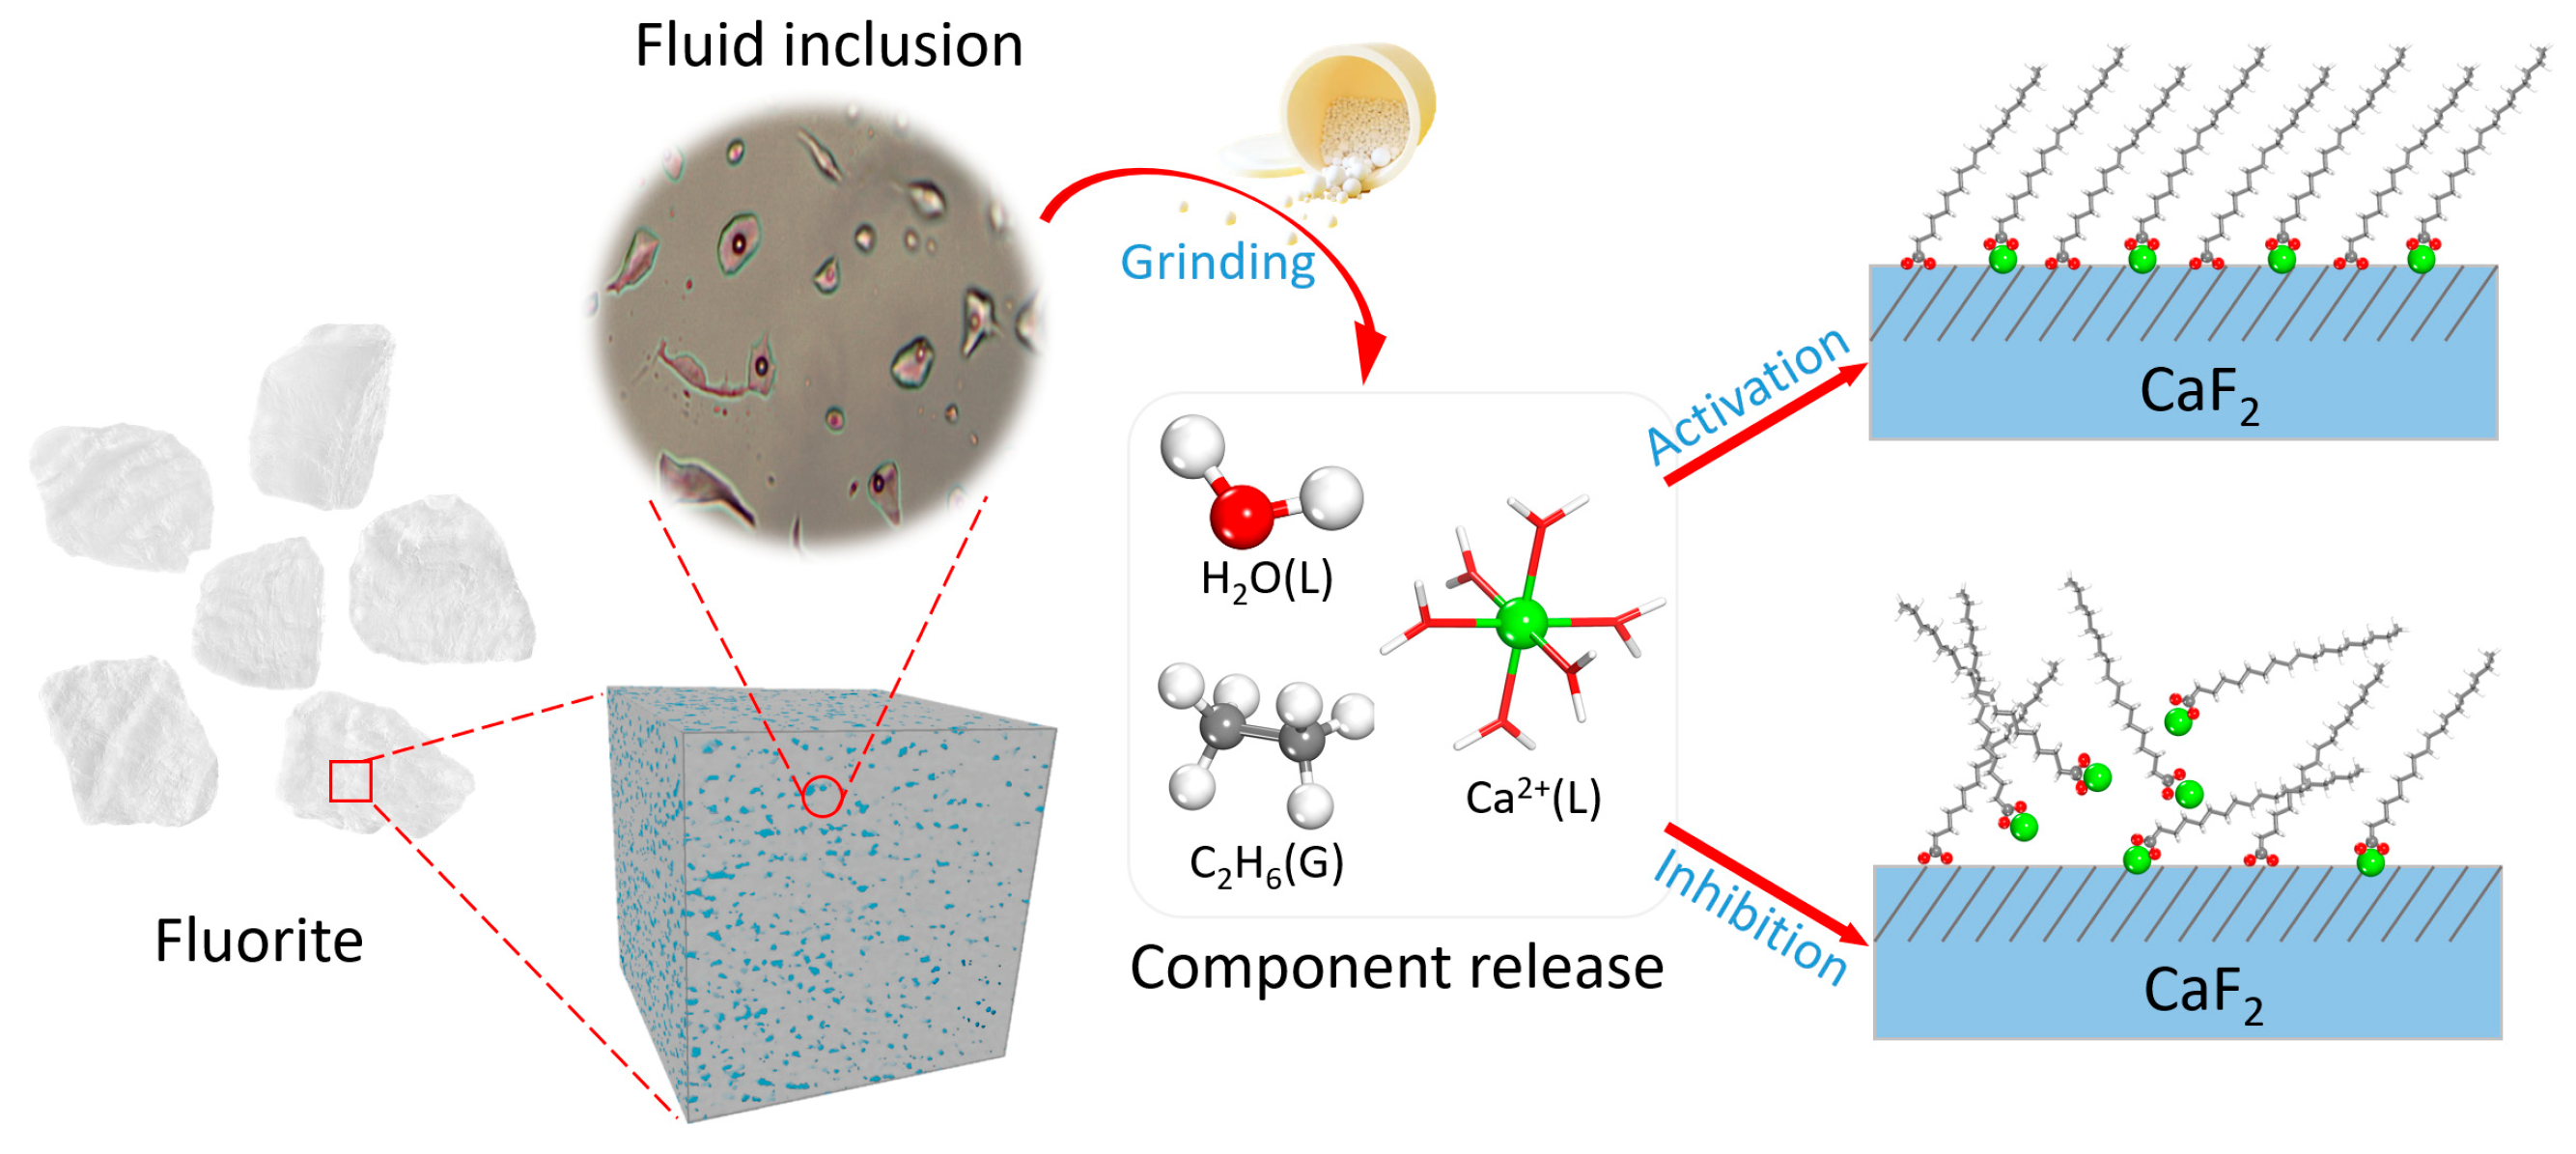
The fluid inclusions effectively preserve the ore-forming fluids that are trapped during mineralization and are commonly found in minerals, particularly fluorite minerals formed through hydrothermal mineralization. The recent discovery that the release of components from fluid inclusions serves as a source of unavoidable ions in the pulp solution used for fluorite flotation has significant implications for both theoretical research on fluorite flotation and practical production practices. As depicted in Figure 8, when fluorite minerals containing abundant fluid inclusions are crushed or ground, the thinning of mineral particles causes external forces to rupture the captured fluid inclusions within these minerals, resulting in the release of ore-forming components contained within them. These components include gases like C2H6 and liquids such as H2O, along with an electrolyte solution bearing similar composition. The liberation of these components from fluid inclusions, especially electrolyte ion constituents, subsequently leads to their presence as unavoidable ions within the pulp solution employed for fluorite flotation. The introduction of such unavoidable ions into the pulp solution significantly impacts its chemical composition and properties, thereby influencing the behavior observed during fluorite flotation processes. When released at low concentrations, Ca2+ is adsorbed onto the surface of fluorite minerals, which enhances calcium active sites on mineral surfaces, promoting oleate collector adsorption and facilitating improved performance during fluorite flotation by acting as an activator agent. However, excessive release of Ca2+ can react with oleate present within the pulp solution, forming complexes that deplete collector concentration and leading to inhibited adsorption capacity on mineral surfaces, ultimately resulting in reduced recovery rates during fluorite flotation processes.

4. Conclusions

This study characterizes the occurrence and textural features of fluid inclusions in fluorite minerals from a geochemical perspective. By defining petrographic properties including phase homogenization temperature, salinity, density, and chemical composition, the research explores the mechanism through which ionic components within fluid inclusions are released into pulp solution. The following conclusions are drawn.
  • Optical microscopy analysis identifies abundant and diverse fluid inclusions in fluorite, with gas–liquid two-phase inclusions being the dominant type, while single-liquid-phase inclusions are less common and three-phase inclusions containing daughter minerals are extremely rare. These inclusions exhibit variable morphologies and size distributions, and sizes vary from 4.5 to 20.4 μm.
  • Microthermometric measurements show that the homogenization temperature of fluorite-hosted ore-forming fluids ranges from 155 to 195 °C, with salinities between 0.701% and 1.389 wt.% NaCl equivalent. Fluid density values fall within 0.878–0.927 g/cm3, and the spatial distribution density of inclusions reaches up to 14.1%. Laser Raman spectroscopy confirms that H2O constitutes the primary component of fluorite fluid inclusions, which belong to a low-temperature, low-salinity, low-density NaCl-H2O system.
  • Fluorite fluid inclusions contain significant ionic components such as Ca2+, F, Cl, and SO42−. Upon release into pulp solution, these ions act as unavoidable species that influence fluorite flotation behavior—most notably through the introduction of Ca2+. Low concentrations of Ca2+ activate fluorite flotation, whereas excessive amounts preferentially consume flotation reagents, thereby inhibiting the flotation process. This verifies that the release of components from fluorite fluid inclusions constitutes a non-negligible source of unavoidable ions in flotation pulp systems.

Author Contributions

Conceptualization, R.Z., H.T. and Z.G.; Methodology, R.Z.; Validation, R.Z., S.H. and S.W.; Investigation, S.W.; Data curation, R.Z., S.H. and S.W.; Writing—original draft, R.Z.; Writing—review and editing, R.Z., S.H., H.T. and Z.G.; Supervision, Z.G.; Project administration, H.T. and Z.G. All authors have read and agreed to the published version of the manuscript.

Funding

This research was funded by the National Natural Science Foundation of China (52204300), the National Key R&D Program of China (2024YFC2909600), the Scientific Research Project of Hunan Provincial Department of Education (24B0024), and the Technology Research Center of Hunan Province for Comprehensive Utilization of Associated Fluorite and Fluorine Chemical Engineering (CF-SZX-2023002).

Data Availability Statement

The original contributions presented in this study are included in the article. Further inquiries can be directed to the corresponding author.

Acknowledgments

The X-CT data were collected by using equipment maintained by the National Center for Applied Mathematics Shenzhen (NCAMS), Southern University of Science and Technology.

Conflicts of Interest

The authors declare no conflict of interest.

References

  1. Ministry of Land and Resources. National Plan for Mineral Resources (2016–2020) [EB/OL]; Ministry of Natural Resources of the People’s Republic of China: Beijing, China, 2016.
  2. Akgün, A.; Teğin, İ.; Ziyadanoğulları, R. Enrichment of molybdenum and fluorite by flotation of fluorite ore containing molybdenum. J. Miner. Mater. Charact. Eng. 2006, 05, 103–107. [Google Scholar] [CrossRef]
  3. Chandra, A.P.; Gerson, A.R. A review of the fundamental studies of the copper activation mechanisms for selective flotation of the sulfide minerals, sphalerite and pyrite. Adv. Colloid Interface Sci. 2009, 145, 97–110. [Google Scholar] [CrossRef]
  4. Zheng, R.; Ren, Z.; Gao, H.; Chen, Z.; Qian, Y.; Li, Y. Effects of crystal chemistry on sodium oleate adsorption on fluorite surface investigated by molecular dynamics simulation. Miner. Eng. 2018, 124, 77–85. [Google Scholar] [CrossRef]
  5. Huang, J.; Zhang, Q.; Jiang, T.; Chen, M.; Wang, C.; Wang, S.; Li, H.; Chen, F. Enhancing the flotation separation of fluorite and calcite: Insights into the mechanism of differential surface regulation by various metallic ions. Appl. Surf. Sci. 2025, 696, 162964. [Google Scholar] [CrossRef]
  6. Zheng, Q.; Dong, L.; Shen, P.; Liu, D. A novel activation scheme for fine cassiterite flotation by using a metal ion modified collector. Colloids Surf. A Physicochem. Eng. Asp. 2025, 710, 136310. [Google Scholar] [CrossRef]
  7. Zhang, B.; Sun, N.; Sun, W.; Jiang, F.; Wang, L. Enhanced spodumene flotation through Zn(Ⅱ) ions activation using sodium oleate as collector. Miner. Eng. 2025, 230, 109414. [Google Scholar] [CrossRef]
  8. Yang, X.; Li, Y.; Chen, J.; Xie, S.; Chen, P.; Song, S. Enhanced flotation separation of fluorite and F−-activated calcite by sodium gluconate and sodium silicate. Miner. Eng. 2025, 229, 109375. [Google Scholar] [CrossRef]
  9. Rao, S.R.; Finch, J.A. A review of water re-use in flotation. Miner. Eng. 1989, 2, 65–85. [Google Scholar] [CrossRef]
  10. Muzenda, E. An investigation into the effect of water quality on flotation performance. Sci. Rep. 2010, 6, 26172. [Google Scholar]
  11. Wei, Y.; Sandenbergh, R. Effects of grinding environment on the flotation of Rosh Pinah complex Pb/Zn ore. Miner. Eng. 2007, 20, 264–272. [Google Scholar] [CrossRef]
  12. Liu, J.; Wen, S.; Xian, Y.; Deng, J.; Huang, Y. Dissolubility and surface properties of a natural sphalerite in aqueous solution. Miner. Metall. Process. 2012, 29, 113–120. [Google Scholar] [CrossRef]
  13. Stanton, M.R.; Gemery-Hill, P.A.; Shanks, W.C.; Taylor, C.D. Rates of zinc and trace metal release from dissolving sphalerite at pH 2.0–4.0. Appl. Geochem. 2008, 23, 136–147. [Google Scholar] [CrossRef]
  14. Acero, P.; Cama, J.; Ayora, C. Sphalerite dissolution kinetics in acidic environment. Appl. Geochem. 2007, 22, 1872–1883. [Google Scholar] [CrossRef]
  15. Lu, H.; Fan, H.; Ni, P.; Ou, G.X. Fluid Inclusion; Science Press: Beijing, China, 2004; pp. 1–444. [Google Scholar]
  16. Ai, G.; Cai, X.; Bi, K.; Li, J.; Tian, Y.; Zhang, R. Research progress on the effect of metal ions on mineral flotation behavior. Nonferrous Met. Sci. Eng. 2017, 8, 70–74. [Google Scholar]
  17. Deng, J.; Wen, S.; Xian, Y.; Liu, J.; Bai, S. New discovery of unavoidable ions source in chalcopyrite flotation pulp: Fluid inclusions. Miner. Eng. 2013, 42, 22–28. [Google Scholar] [CrossRef]
  18. Liu, J.; Wen, S.; Wu, D.; Bai, S.; Liu, D. Determination of the concentrations of calcium and magnesium released from fluid inclusions of sphalerite and quartz. Miner. Eng. 2013, 45, 41–43. [Google Scholar] [CrossRef]
  19. Xian, Y.; Wen, S.; Bai, S.; Chen, C. Metal ions released from fluid inclusions of quartz associated with sulfides. Miner. Eng. 2013, 50–51, 1–3. [Google Scholar] [CrossRef]
  20. Bai, S.; Wen, S.; Xian, Y.; Liu, J.; Deng, J. New source of unavoidable ions in galena flotation pulp: Components released from fluid inclusions. Miner. Eng. 2013, 45, 94–99. [Google Scholar] [CrossRef]
  21. Barton, P.B.; I-Ming, C. Calculation of the vapor-saturated liquidus for the NaCl-CO2-H2O system. Geochim. Et Cosmochim. Acta 1993, 57, 2715–2723. [Google Scholar] [CrossRef]
  22. Bodnar, R.J.; Bethke, P.M. Systematics of stretching of fluid inclusions I: Fluorite and sphalerite at 1 atmosphere confining pressure. Econ. Geol. 1984, 79, 141–161. [Google Scholar] [CrossRef]
  23. Zeng, Z.; Cao, H.; Gao, F.; Gao, Y.; Zou, H.; Li, D. Fluid inclusion study of fluorite deposits in linxi region, Inner Mongolia. Geochimica 2013, 42, 73–81. [Google Scholar]
  24. Zhang, S.; Cao, H.; Zheng, L.; Ma, Y.; Fang, J.; Ju, H. Characteristics of ore- forming fluids and mineralization processes of the Shuitou fluorite deposit in Linxi, Inner Mongolia Autonomous Region. Earth Sci. Front. 2014, 21, 31–40. [Google Scholar]
  25. Pei, Q.; Zhang, S.; Santosh, M.; Cao, H.; Zhang, W.; Hu, X.; Wang, L. Geochronology, geochemistry, fluid inclusion and C, O and Hf isotope compositions of the Shuitou fluorite deposit, Inner Mongolia, China. Ore Geol. Rev. 2017, 83, 174–190. [Google Scholar] [CrossRef]
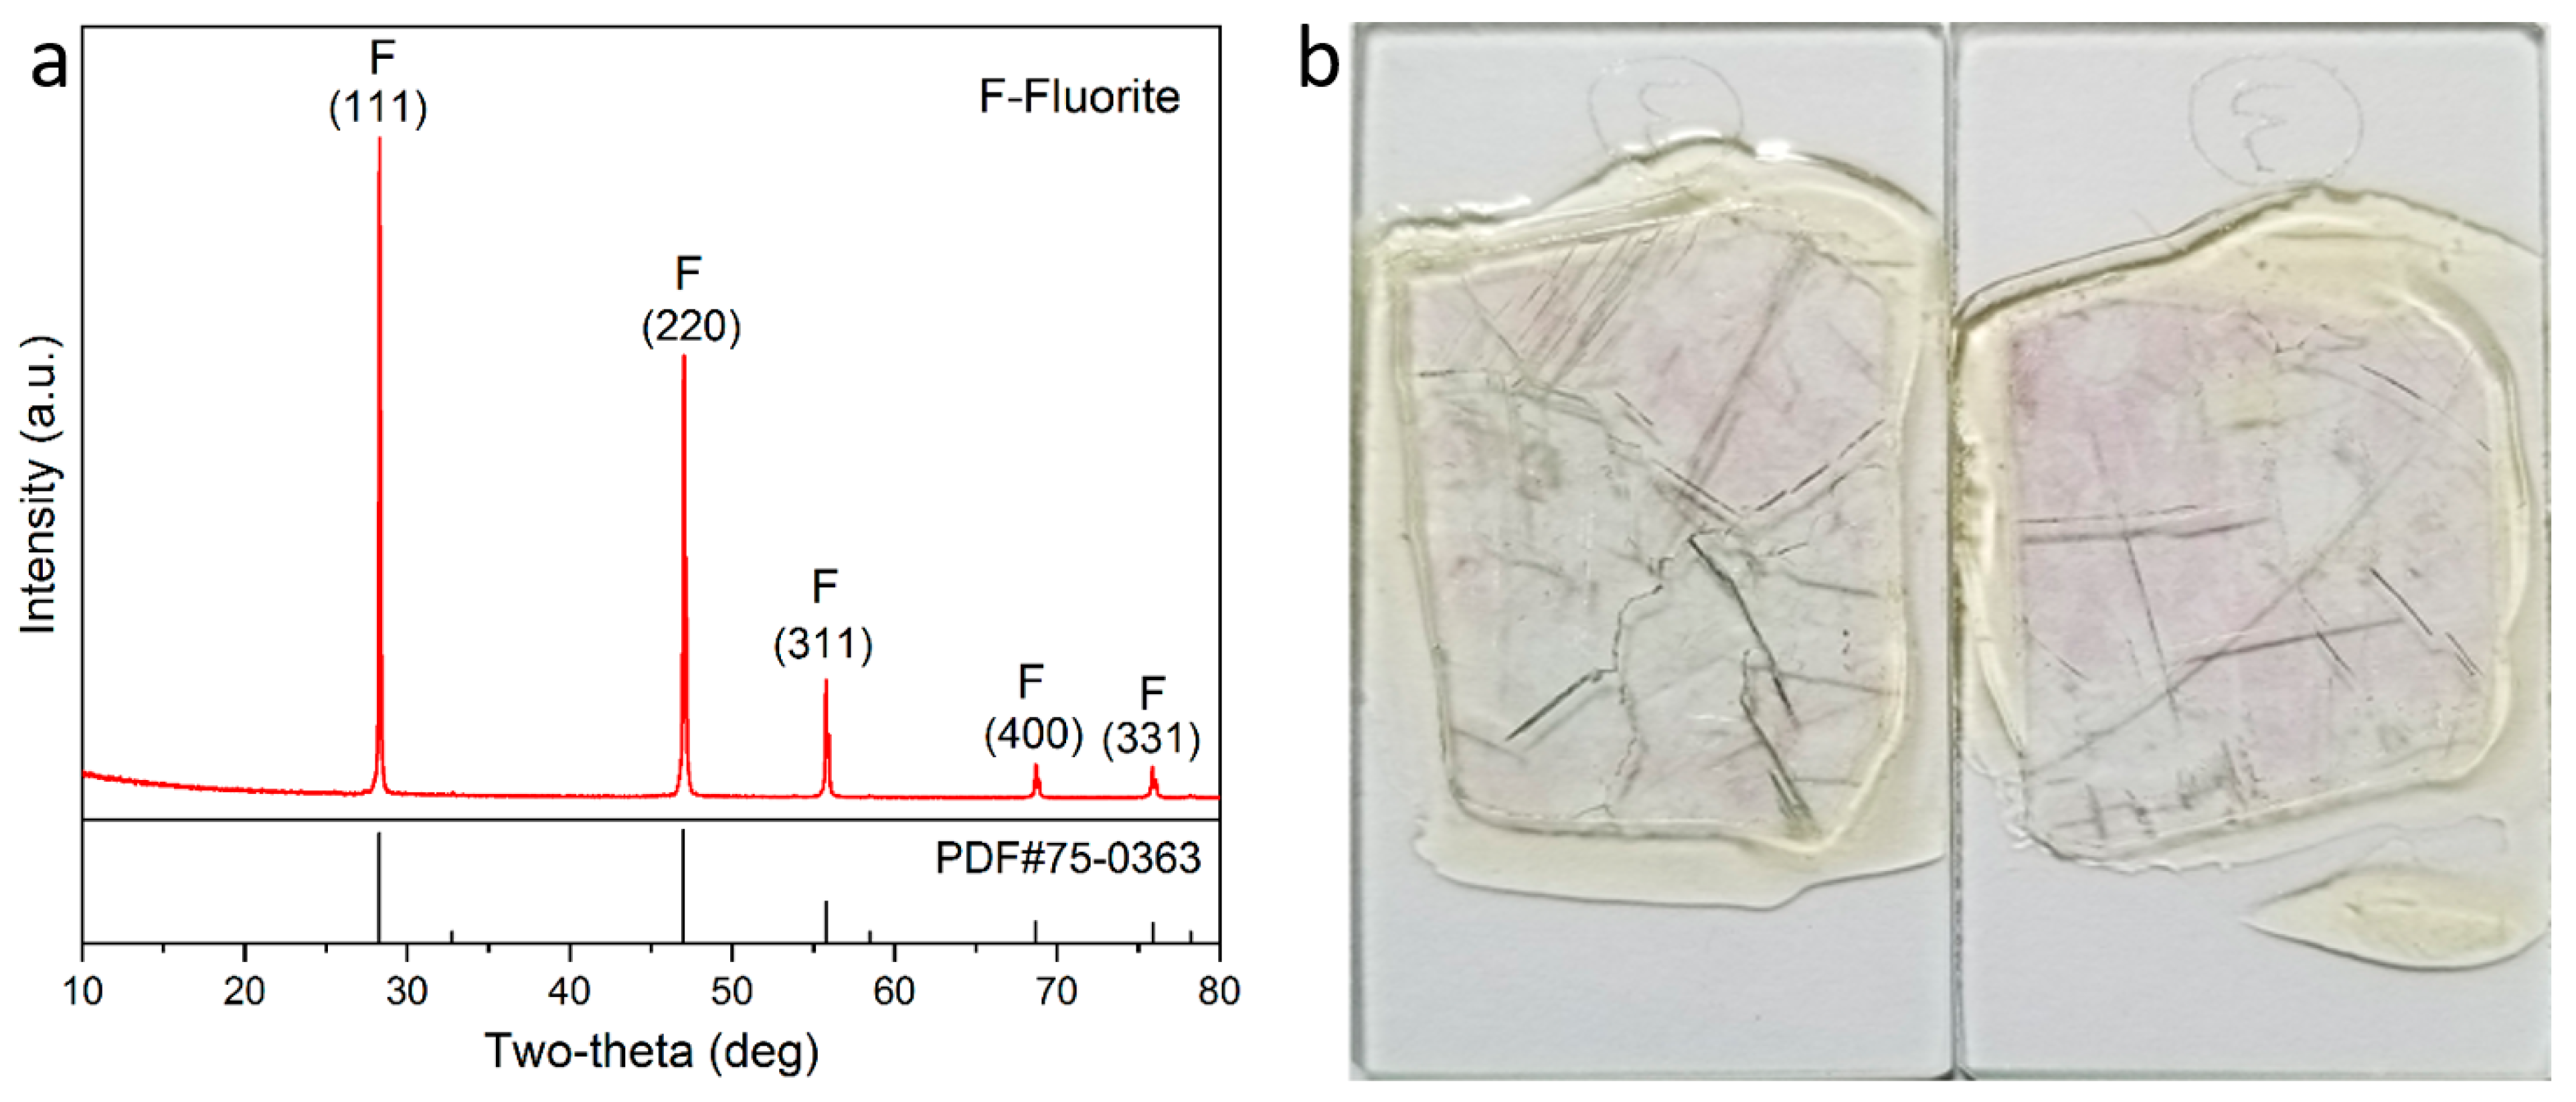
Figure 1. XRD pattern (a) and thin sections (b) of the fluorite.
Minerals 15 00912 g001
Figure 2. Microphotographs of typical fluid inclusions (A–H) in fluorite ((a) field of vision 1; (b) field of vision 2; (c) field of vision 3; (d) field of vision 4).
Minerals 15 00912 g002
Figure 3. Schematic diagram of the homogenization temperature (ad) and melting temperature (eh) measurements of fluorite fluid inclusions (The bubbles within the inclusions have been circled in white in the figure.).
Minerals 15 00912 g003
Figure 4. Histogram of homogenization temperature (a) and melting temperature (b) of fluid inclusions in fluorite.
Minerals 15 00912 g004
Figure 5. Spatial distribution characteristics of fluid inclusions in fluorite ((a) X-CT image; (b) three-dimensional reconstruction of X-CT image; (c) spatial distribution density).
Minerals 15 00912 g005
Figure 6. Laser Raman spectra of fluid inclusions in fluorite ((a) original fluid inclusions; (b) secondary fluid inclusions).
Minerals 15 00912 g006
Figure 7. Effect of Ca2+ concentration on flotation recovery of fluorite.
Minerals 15 00912 g007
Figure 8. Theoretical model for the effect of the component released from fluid inclusion on fluorite flotation.
Minerals 15 00912 g008
Table 1. Chemical multi-element analyses of the fluorite (%).
FCaAlSiPSFeSrL.O.I.
48.42949.6470.1490.9610.0020.0050.0730.0160.717
Table 2. Microthermometry parameters of fluid inclusions in the three defective fluorites.
SampleTh/°CTm/°CSalinity/wt.%Density/g/cm3
Fluorite155–195−0.8–−0.40.701–1.3890.878–0.927
Table 3. Effect of grinding on concentration of ions released from fluid inclusions in the fluorite.
Grinding Time/minIon Concentration/×10−4 mol/L
Ca2+(T)FClSO42−Ca2+(R)
814.216.420.200.1111.00
1530.1726.980.290.2116.68
2556.4142.740.600.4535.04
4097.1750.140.960.7172.10
60114.5752.661.100.8188.24
Note: Ca2+(T) represents total calcium concentration; Ca2+(R) represents dissolved calcium concentration in fluid inclusions.
Table 4. Concentration of ions released from fluorite dissolution (n.a. indicates absence of detection).
Grinding Time/minDissolution Time/hIon Concentration/×10−4 mol/L
Ca2+FClSO42−
6073.121.180.02n.a.
Disclaimer/Publisher’s Note: The statements, opinions and data contained in all publications are solely those of the individual author(s) and contributor(s) and not of MDPI and/or the editor(s). MDPI and/or the editor(s) disclaim responsibility for any injury to people or property resulting from any ideas, methods, instructions or products referred to in the content.