Article

Reservoir Properties of Lacustrine Deep-Water Gravity Flow Deposits in the Late Triassic–Early Jurassic Anyao Formation, Paleo-Ordos Basin, China

1
State Key Laboratory of Coal Resources and Safe Mining, College of Geoscience and Surveying Engineering, China University of Mining and Technology, Beijing 100083, China
2
Research Institute of Petroleum Exploration and Development, Petro China, Beijing 100083, China
3
PetroChina Coalbed Methane Company Limited, Beijing 100083, China
4
Henan International Joint Laboratory of Green Low Carbon Water Treatment Technology and Water Resources Utilization, School of Municipal and Environmental Engineering, Henan University of Urban Construction, Pingdingshan 467036, China
5
CanCambria Energy Corp, Vancouver, BC V6M 4E1, Canada
6
Department of Chemical and Petroleum Engineering, University of Calgary, Calgary, AB T2N 1N4, Canada
*
Author to whom correspondence should be addressed.
Minerals 2025, 15(9), 888; https://doi.org/10.3390/min15090888
Submission received: 23 June 2025 / Revised: 14 August 2025 / Accepted: 19 August 2025 / Published: 22 August 2025
(This article belongs to the Section Mineral Exploration Methods and Applications)

Abstract

The development of gravity flow sedimentology has improved our understanding of the physical properties of different types of gravity flow deposits, especially the advancement of various gravity flow models. Although studies of gravity flows have developed greatly, the linkage between different sub-facies and their reservoir properties is hindered by a lack of detailed sedimentary records. Here, integrated test data (including thin-section petrology, high-pressure mercury injection experiments, capillary pressure curve analysis, and scanning electron microscopy) are used to evaluate links between different types of gravity flows and their reservoir properties from the Late Triassic–Early Jurassic Anyao Formation, southeastern Paleo-Ordos Basin, China. The petrological and sedimentological data reveal two types of deep-water gravity flow deposits comprising sandy debris flow (SDF) and turbidity current (TC) deposits. Both are fine-grained lithic sandstones and form low-porosity and ultra-low permeability reservoirs. Secondary porosity, formed by the dissolution of framework grains, including feldspars and lithic fragments, dominates the pore types. This secondary porosity is widely developed in the Anyao Formation and formed by reaction with organic acids during burial (early mesodiagenesis). The associated mud rocks have reached the early mature stage of the oil window with Tmax of 442–448 °C. Compared with the turbidites, the sandy debris flows have higher framework grain content (87.9 vs. 84.8%), framework grain size (0.091 vs. 0.008 mm), porosity (6.97 vs. 3.44%), pore throat radius (0.102 vs. 0.025 μm), and permeability (0.025 vs. 0.005 mD) but are relatively poor in the sorting of framework grains and pore throat radii. The most important petrological factors affecting porosity and permeability of the SDF reservoirs are framework grain size and feldspar grain content, respectively, but those of the TC reservoirs are feldspar grain content and the maximum pore throat radius. Diagenetic dissolution of framework grains is the most important porosity-affecting factor for both SDF and TC reservoirs. Our multi-proxy study provides new insights into the links between gravity flow sub-facies and reservoir properties in the lacustrine deep-water environment.

1. Introduction

Lacustrine deep-water oil and gas reservoirs have been described from various stratigraphic intervals in China, including the Late Triassic Yanchang Formation in the Ordos Basin [1,2,3,4], the Cretaceous Nenjiang Formation in the Songliao Basin [5], and the Paleogene Shahejie Formation in the Bohai Bay Basin [6]. The study of lacustrine deep-water gravity flow deposits has largely focused on depositional modes [4,7,8], triggering mechanisms [9,10,11,12], and reservoir classification in order to delineate favorable exploration areas [13,14]. Lowe (1979) proposed a classification of gravity flows based on the original nomenclature of Middleton and Hampton (1973) [15,16]. In Lowe’s classification, gravity flows are distinguished on the basis of flow behavior (fluid or plastic) and subdivided according to the particle support mechanism. Turbidity currents represent fluid flows in which fluid turbulence supports the sediment particles, whereas in debris flows particles are supported by the matrix strength or density. Debris flows can be divided into cohesive debris flows in which a clay matrix supports the particles, or grain flows in which frictional pressure between grains maintains their dispersion against gravity. The physical properties of these flows can be expected to impact the basic reservoir properties of the resulting rock types. However, little attention has been paid to the physical properties of different types of gravity flows and the factors which impact the reservoir properties of these kinds of deposits. Such studies are the basis of the prediction and exploitation of lacustrine deep-water oil and gas fields [17,18,19,20].
With the continuous consumption of conventional petroleum resources, unconventional sources have become an important field to increase oil and gas storage and production in China, and tight gas is the most important part of it [21]. The Ordos Basin is the second largest sedimentary basin in China and is rich in unconventional oil and gas resources [22,23], especially within the Chang 7 Member of the Late Triassic Yanchang Formation [24,25], where typical deep-water gravity flow tight reservoirs are widely developed [3,26,27,28]. During the Late Triassic, the Jiyuan Basin was located in the southeast of the Ordos Basin, and they belong to a unified sedimentary basin [29,30,31]. In the Jiyuan Basin, the Late Triassic–Early Jurassic Anyao Formation comprises a sequence of deep-water gravity flow sediments [10,32]. In the Anyao Formation, turbidity current structures and Bouma-type sequences were previously documented by Wu (1985), Hu (1991), and Hu et al. (2004, 2015) [32,33,34,35]. More recently, sandy debris flow (SDF) and turbidity current deposits (TC) were identified in the Anyao Formation and were considered promising tight oil and gas reservoirs [10,31]. Further studies on the Anyao Formation have led to the development of a depositional model through delta front to deep lake facies [36], and its changes in deposition were linked to the Carnian Pluvial Episode as a likely environmental driver [37]. These previous geological investigations make the Anyao Formation an ideal subject for evaluating reservoir properties of sandy debris flows and turbidity current deposits in a deep-water lacustrine systems.
In this study, we investigate the petrology, sedimentology, and physical properties of deep-water gravity flow reservoirs from the JY-1 borehole section in the Jiyuan Basin and use the experimental results of 40 samples to explore the differences in reservoir properties between the SDF and TC deposits. This will further deepen our understanding of the conditions of the formation of lacustrine deep-water gravity flow reservoirs and the factors that influence their reservoir quality.

2. Geological Setting

During the Late Triassic–Early Jurassic, the Jiyuan Basin was located in the southeast margin of the Ordos Basin, and the latter occupied the central and southwestern parts of the North China Platform with the Yinshan Oldland to the north and the Qinling-Dabie Orogenic Belt to the south (Figure 1a,b) [30]. In the early Mesozoic, the Jiyuan Basin was connected with Ordos Basin in the west and belonged to a unified sedimentary basin [3,10,29]. However, after the Middle Jurassic, the development of the Jiyuan Basin came to an end due to the influence of Taihang uplift [37]. In the Jiyuan Basin, the lithostratigraphic successions from the Late Triassic to the Middle Jurassic include the Chunshuyao, Tanzhuang, Anyao, and Yangshuzhuang Formations in ascending order (Figure 1c) [32]. The conformable contact of the Tanzhuang and Anyao Formations is marked by a layer of white-gray tuffaceous claystone (Figure 1d) which yields a U-Pb zircon age of 233.1 ± 1.3 Ma from the Carnian Stage of the Late Triassic [10,33,37,38]. The ClassopollisCyathiditesCycadopites spore–pollen assemblage in the Anyao Formation supports a Late Triassic to Early Jurassic age for the Anyao Formation [32,39,40,41]. The Anyao Formation is mainly composed of black-gray calcareous shales interbedded with white-gray massive fine sandstone and siltstones. It accumulated in a semi-deep to deep lacustrine system and comprises numerous deep-water gravity flow deposits, including the sandy debris flows (SDF), turbidity current deposits (TC), and occasional minor slump and slide deposits [10]. Partial Bouma sequences with various scour structures, flute casts, load cast, floating mudstone gravel and debris, and deep-water trace fossils (including Neonereites biserialis and Cochlichnus anguineus) are common [10,32,33].

3. Materials and Methods

This study focuses on the deep-water gravity flow sedimentary deposits of the Anyao Formation, as exposed in the Anyao section, Sanhuang section, and JY-1 borehole core (cylinder with a diameter of 94 mm) as the research objects (Figure 1c). Through the measurement of the section and the borehole, the lithology stratification, and the description, from the characteristics of rock color, structure, and sedimentary structure, referring to Miall et al.’s lithofacies division standard [42], combined with the sandstone grain size probability curve, Walther’s facies law was applied to determine the gravity flow deposition type in the study area [43].
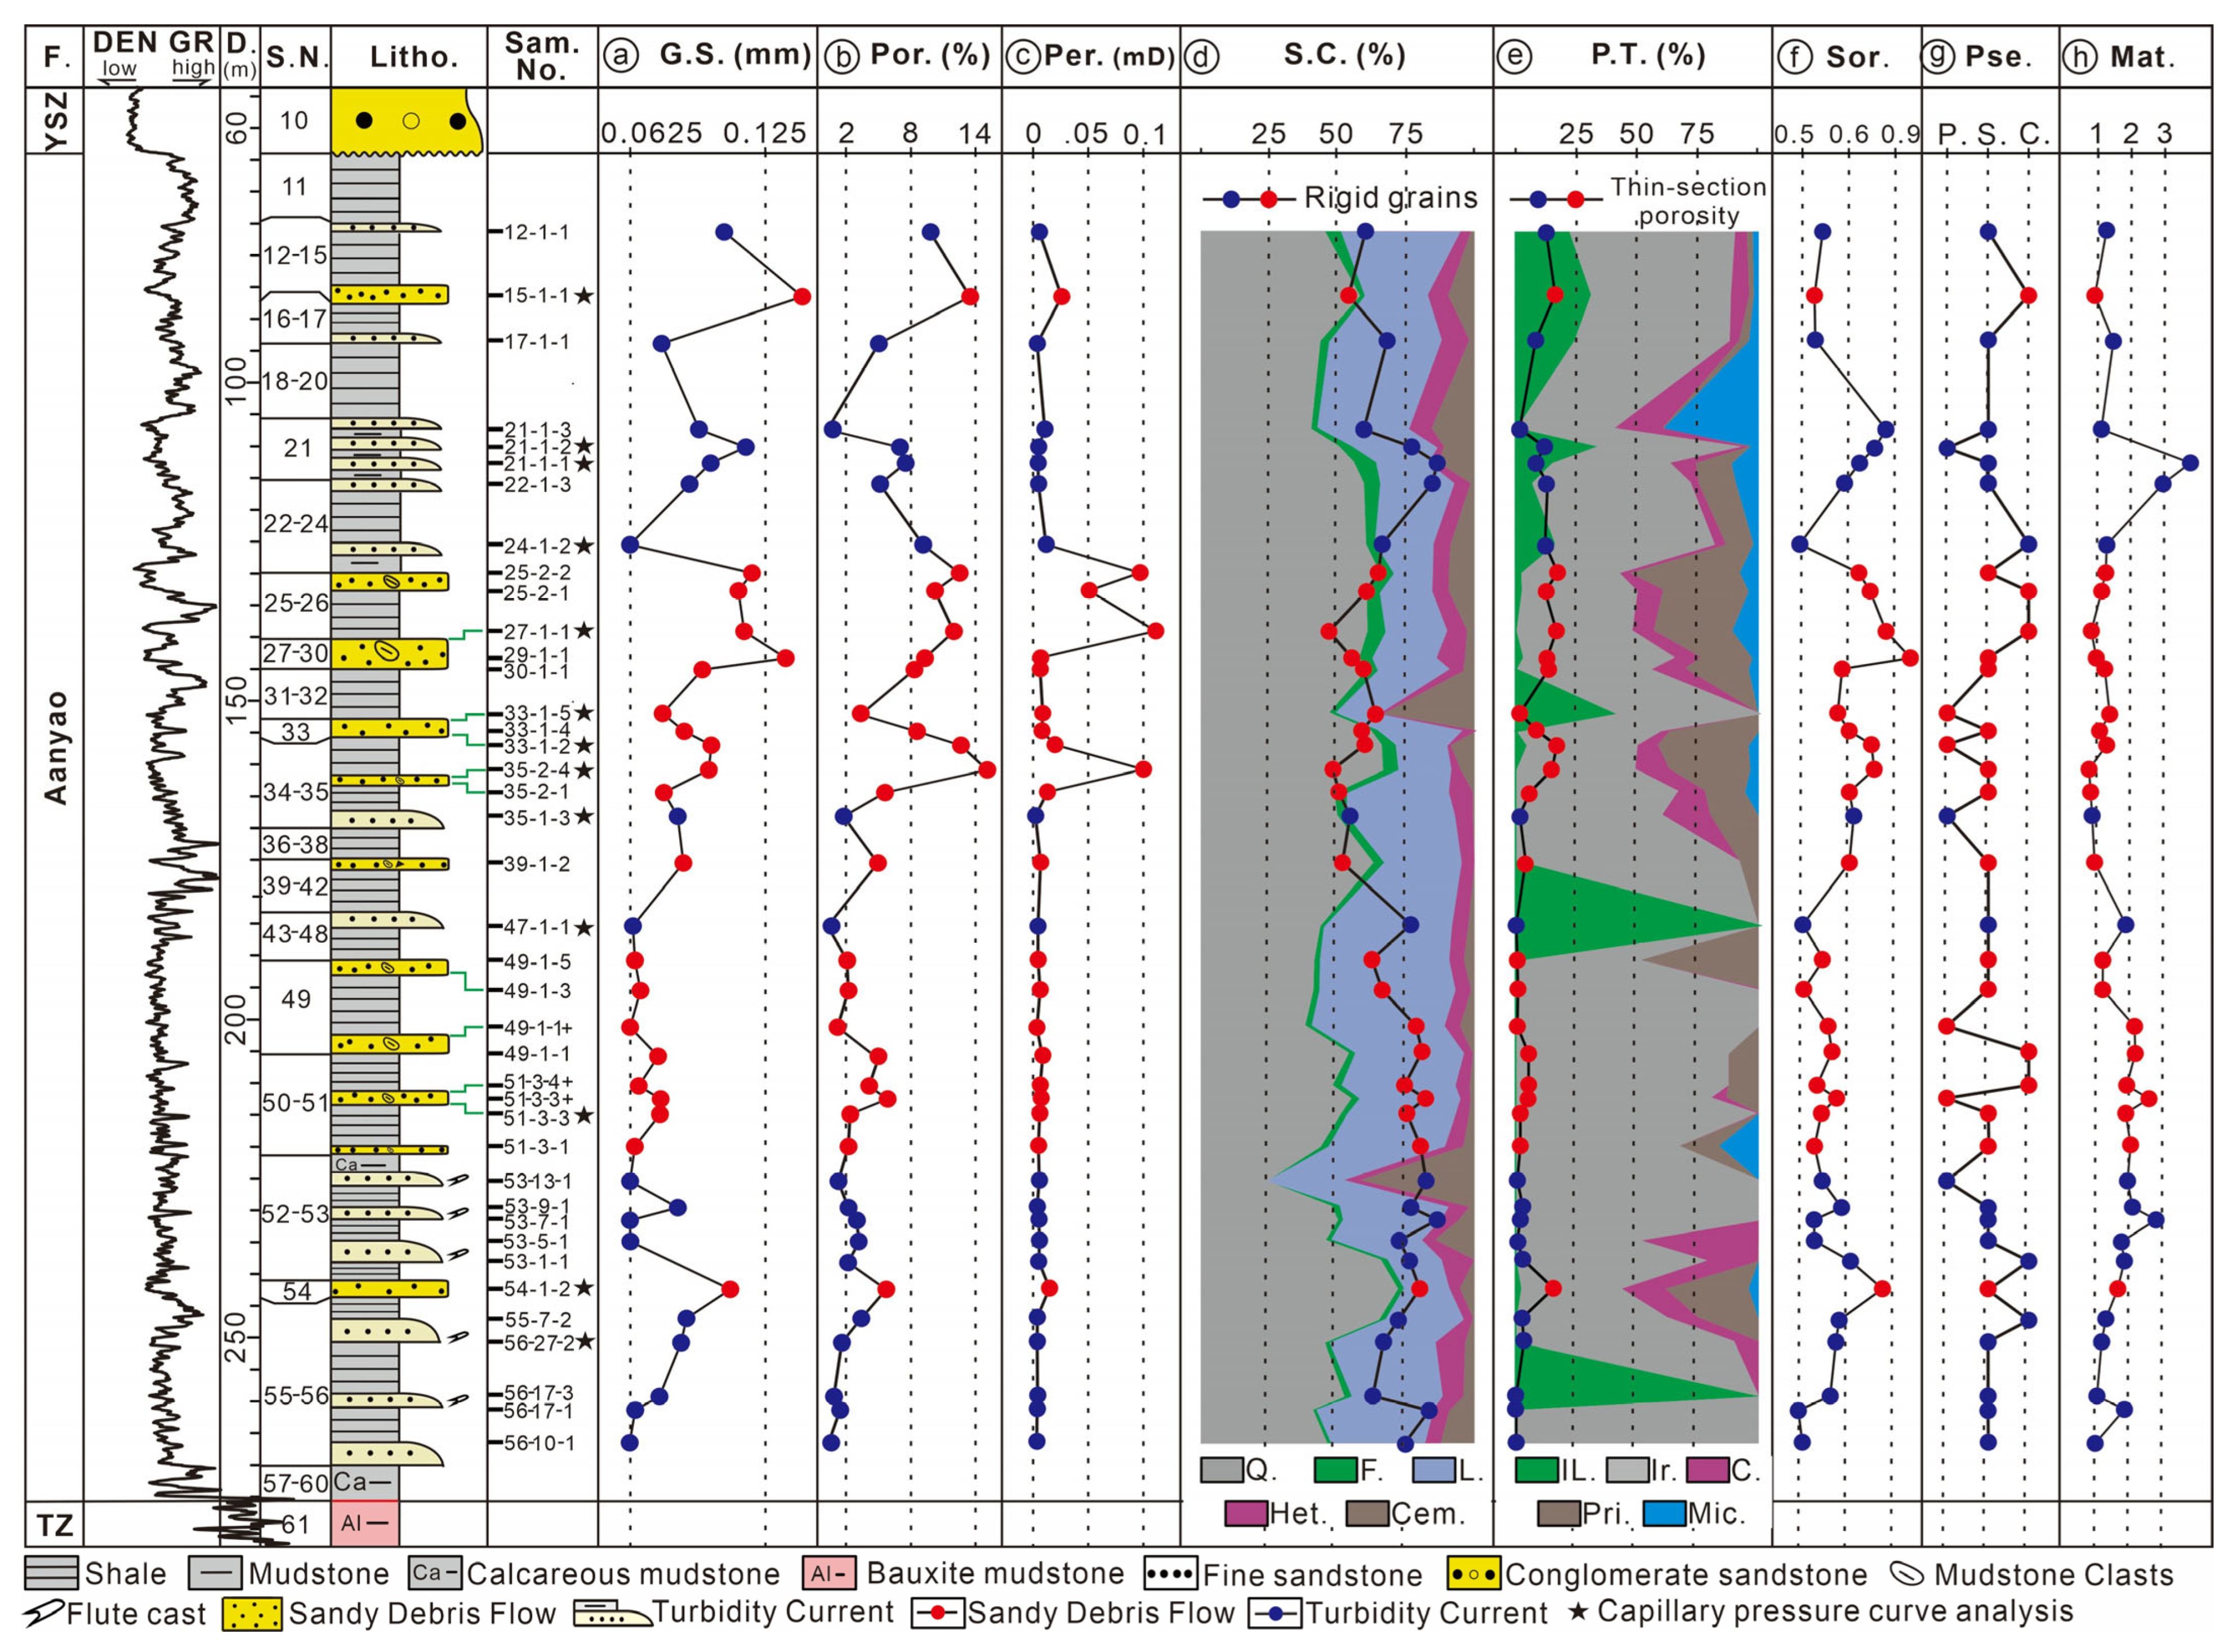
Our study is based on 40 gravity flow clastic rock samples collected from the JY-1 borehole core, and 4 gravity flow clastic rock samples collected from the Anyao section and Sanhuang section (Figure 1c). Sampling depths and location are shown in Figure 2, Figure 3, Figure 4, Figure 5, Figure 6, Figure 7, Figure 8 and Figure 9. The 40 borehole core samples were divided into two parts, with one part for producing petrographic thin sections, and the other for porosity and permeability measurements. In addition, 13 representative samples were measured for capillary pressure curves, and 6 representative samples were processed by argon ion polishing and observed under a scanning electron microscope (Helios NanoLab™600 FIB-SEM, Beijing, China, identification of authigenic clay minerals in accordance with GB/T 17361-2013 [44]). Thin sections were produced and identified in the State Key Laboratory of Coal Resources and Safety Mining (Beijing), and the other experiments were conducted in the Experimental Center of China Petroleum Exploration and Development Research Institute. And the 4 section samples were produced from petrographic thin sections.
Individual samples were impregnated under vacuum with blue epoxy resin to highlight pore structure before thin-section production, followed by staining with Alizarin Red S and potassium ferricyanide to distinguish different carbonate minerals. The composition of the thin sections was determined by point counting using a LEICA DM4500P microscope (Leica Microsystems GmbH, Wetzlar, Germany, with a minimum of 300 points per slide, including the number of minerals and pores). The scheme of Folk (1980) was used to classify the samples and depict the compositional variation [45]. Plug samples (2.5 cm diameter, 2.2–4.5 cm high) were prepared for porosity and permeability measurements and also for capillary pressure curves to be constructed. Porosity and permeability measurements were performed using a computer-controlled Corelab CMS300 tester (Core Laboratories, TX, USA, with an overburden pressure range of 0–10,000 psig, porosity measurement ranges from 0.01 to 40%, and permeability measurement from 0.00005 mD to 15 D). The capillary pressure curve analysis was undertaken using the Corelab CMS300 tester and the Autopore IV 9505 mercury porosimeter (Micromeritics, GA, USA, with a maximum simulated pressure of 200 MPa and a pore diameter testing range of 0.005–6 μm).
The standard deviation of grain size (σ) was calculated to evaluate the sorting of sandstone framework grains, and the computing formula and classification are from Nichols (2009) [46]. The textural maturity of sandstone was determined using the flow diagram suggested by Nichols (2009) [46]. The compositional maturity of sandstone was calculated using the formula S = Q/(F + C), where “S” is the compositional maturity, “Q” includes quartz and siliceous lithic fragments, “F” is feldspar content, and “C” is the other lithic fragment contents (Nichols, 2009) [46].

4. Results and Analysis

4.1. Lithofacies and Environmental Interpretation

Based on the lithology, texture, sedimentary structure, bed shape, contact relationships, and vertical grain size profiles, a total of 11 lithofacies types were recognized from the rock core and two outcrop sections (Figure 1c,d), and their characteristics are summarized in Table 1. Four depositional facies associations in the Anyao Formation are proposed based on field observation and laboratory analysis of rock thin slice, which include deep lacustrine (DL), sandy debris flows (SDFs), turbidity currents (TCs), and slump (SP) (Table 1).

4.1.1. Facies Association DL: Deep Lacustrine

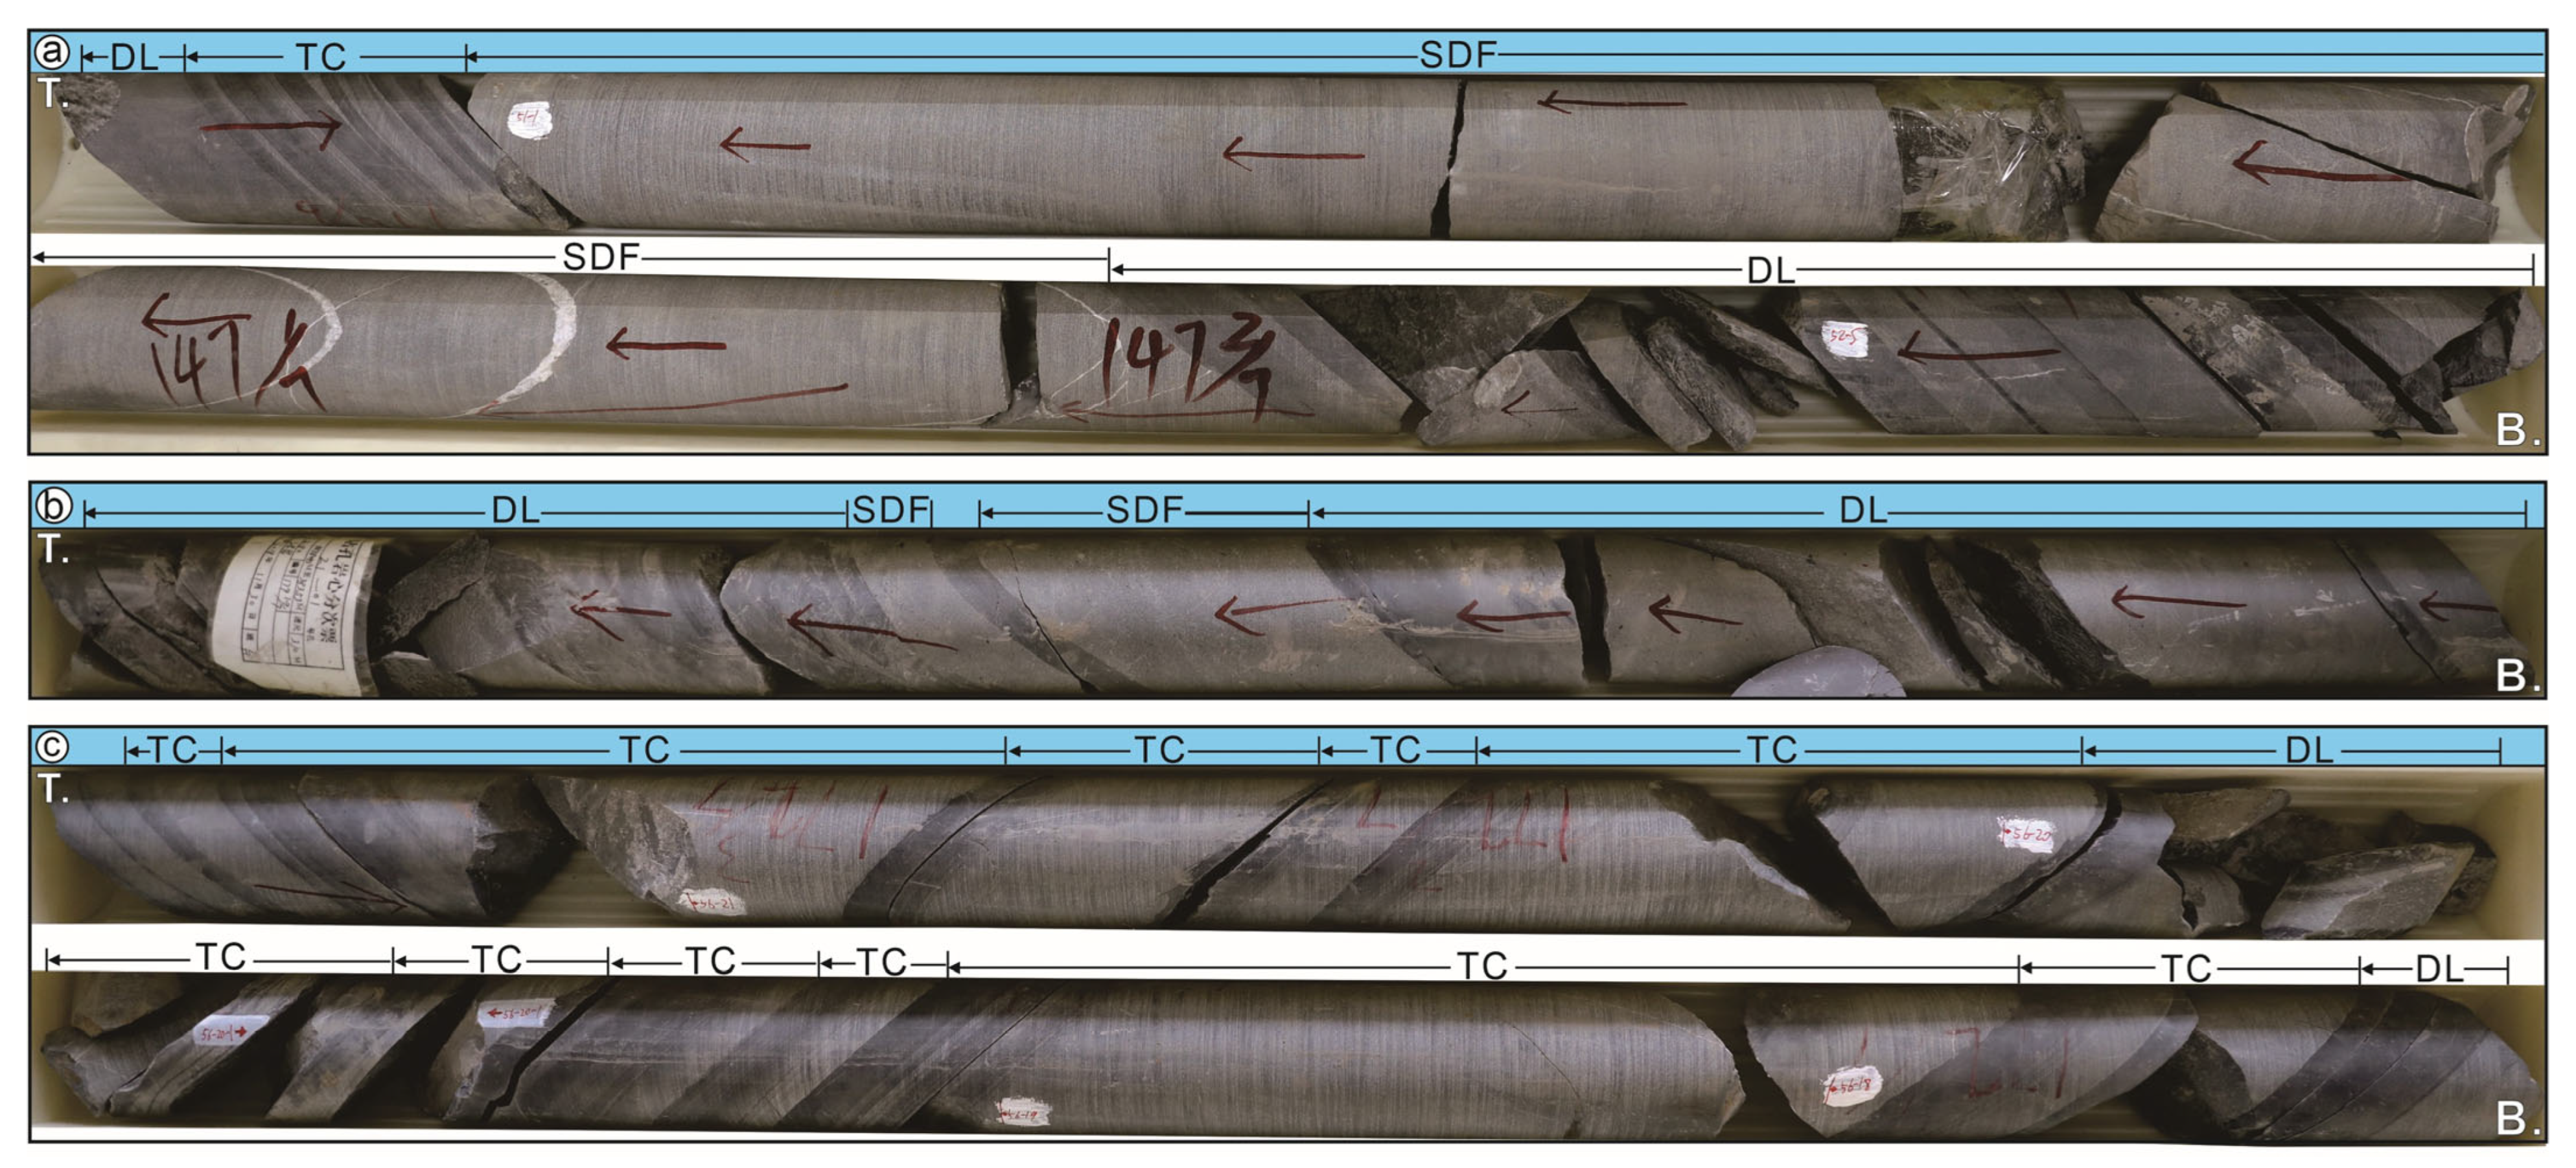
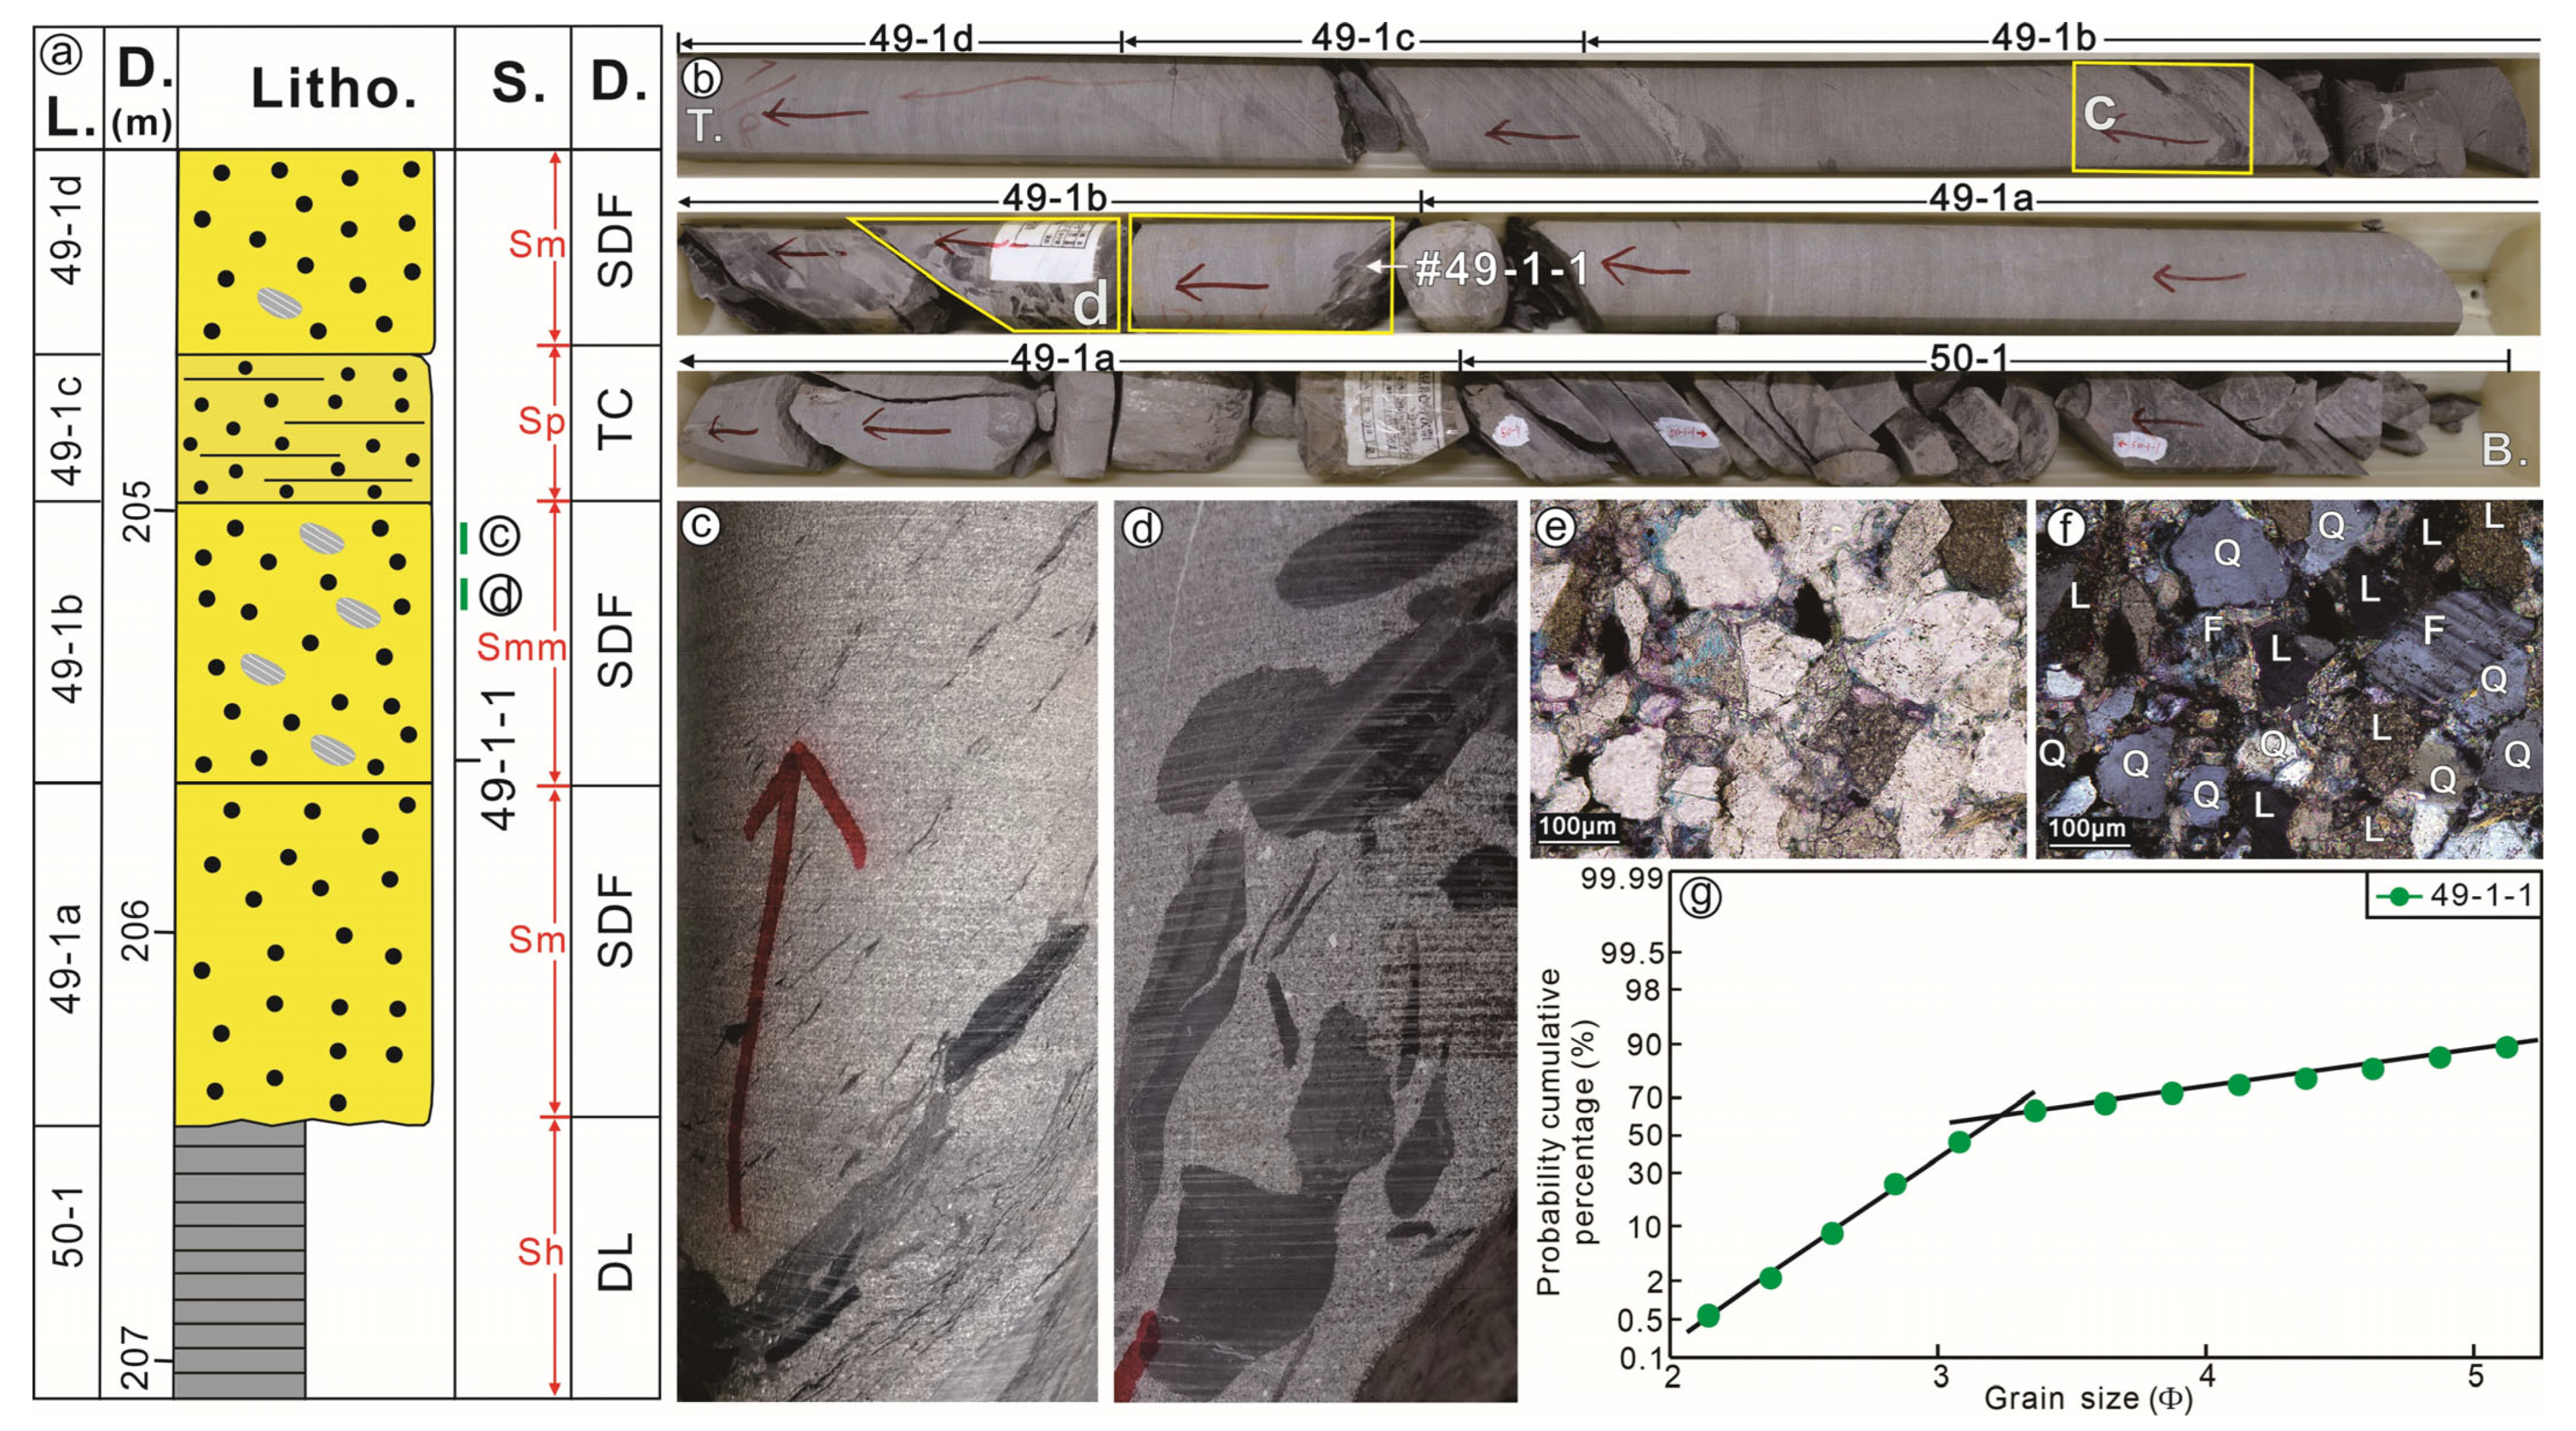
Descriptions: facies association DL mainly consists of lithofacies Sh and Mh (Table 1), which is the most widely distributed facies in the Anyao Formation (more than 50% in thickness ratio) (Figure 2). Facies association DL is composed of laminated organic-rich black shale (Figure 3, Figure 4, Figure 5, Figure 6, Figure 7, Figure 8 and Figure 9) and parallel bedding gray-black mudstone (Figure 3c and Figure 8b), and produces abundant trace fossils of deep-water environments, such as Protopaleodictyon anyaoensis, Protopaleodictyon submontaum, Paleodictyon aff. Gomeizi, Tuberculichnus henanensis, and Paracanthorphe tongwunia [32,33,47]. Facies association DL is usually interbedded with other lithofacies in each layer of the Anyao Formation (Figure 3, Figure 4, Figure 5, Figure 6, Figure 7, Figure 8 and Figure 9).
Interpretation: horizontal lamination and abundant organic matter in facies association DL indicate the vertical accretion of suspended sediment in a quiet and reductive environment, plus widely developed deep-water trace fossils; the facies DL is interpreted as in situ deep-water deposits under the lake wave base. Similar facies associations were identified in the Chang 7 Member of the Yanchang Formation in Yaoqu section, Ordos Basin, Late Triassic, and the Sha 4 Member of the Shahejie Formation in the Jiyang Depression, Bohai Bay Basin, Paleogene [48,49].

4.1.2. Facies Association SP: Slump

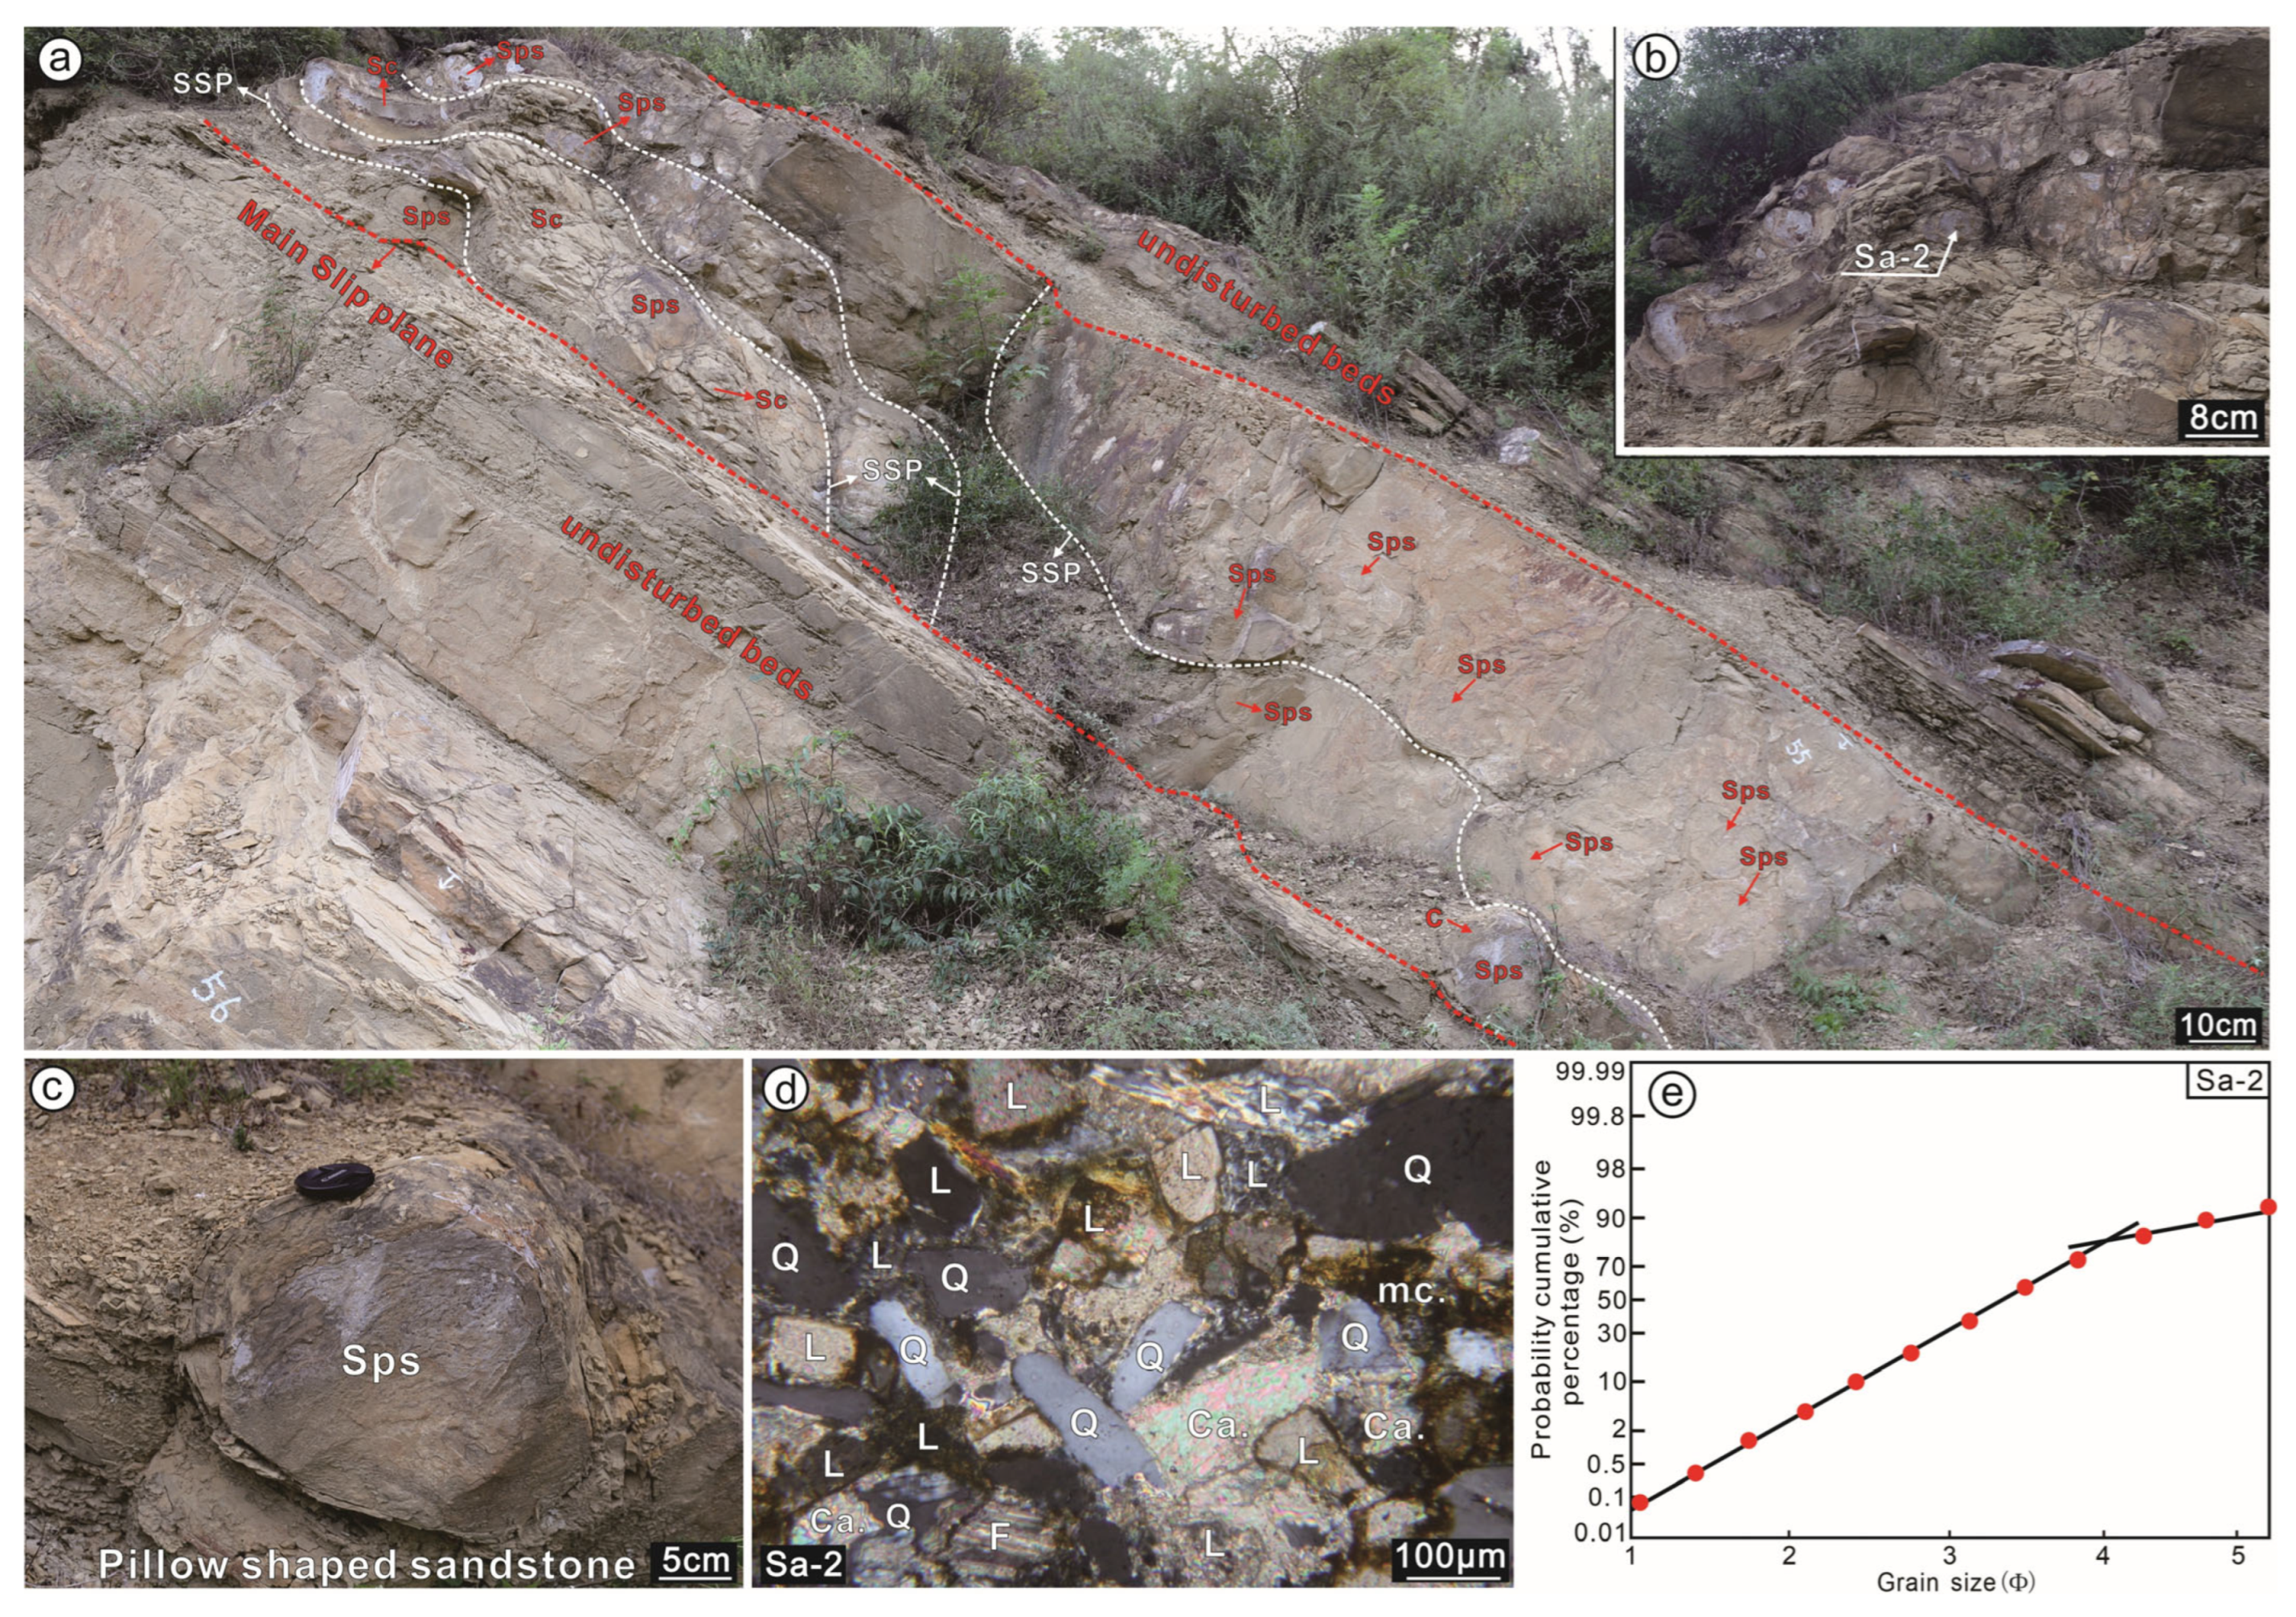
Descriptions: facies association SP consists of gray-white internal contorted fine sandstone and mudstone (lithofacies Sc) and pillow-shaped fine sandstone (lithofacies Sps) (Table 1), which is mainly developed in the bottom of the Aanyao Formation with a thickness of 0.1–0.6 m (0.34–1.97 ft) for each lithofacies (Figure 2). Facies association SP shows irregular geometry (Figure 9b) and is distinguished from surrounding undisturbed beds by the basal slip surface and top sharp contact surface (Figure 9a). Lithofacies Sc shows sharp top and bottom contacts with facies association DL and with the undulating slip plane at the bottom of sandstone (Figure 9a). Lithofacies Sps usually develops on the bottom of sandstone, shows a load structures, and is surrounded by peripheral mudstone (Figure 9c). The grain size log-probability curves of sandstones (#Sa-2) in lithofacies Sps show two populations, namely the suspension population (~70–80%, 1.1–4.0 Φ) and saltation population (~20–30%, 4.0–5.1 Φ), and they are truncated at about 4.0 Φ (Figure 9e).
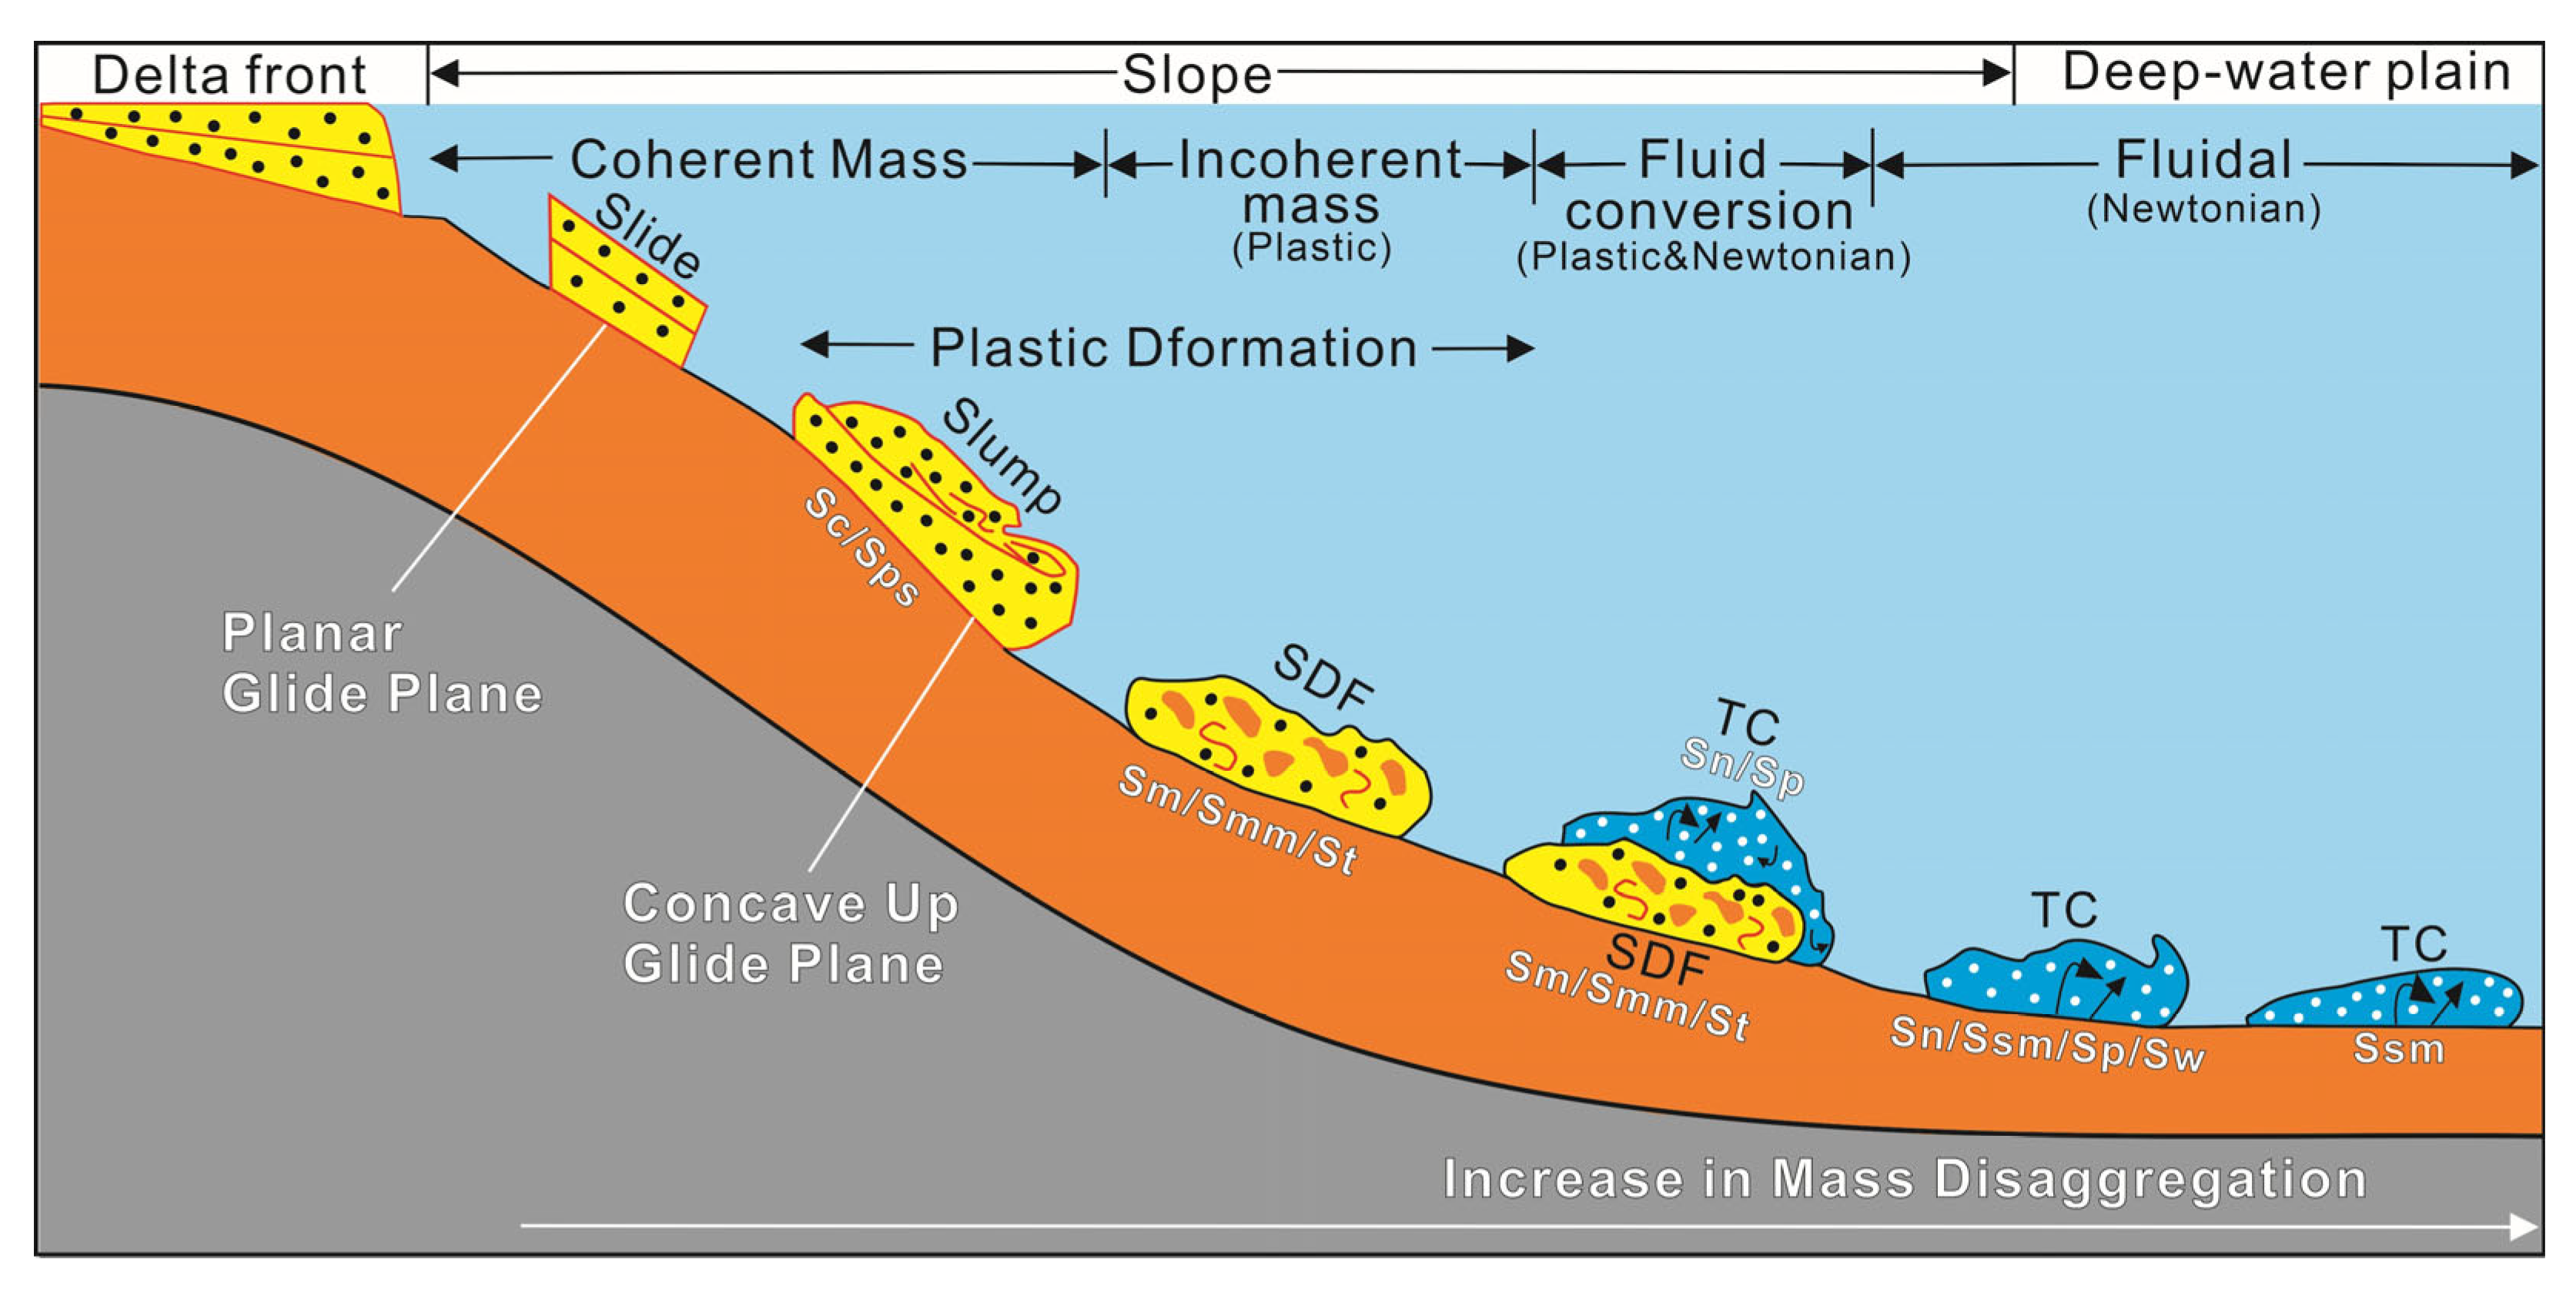
Interpretation: facies association SP is interpreted as typical of slump deposits; the reasons include the following: (1) due to the different speed in the sliding process, the slump bodies underwent extrusion pressure, resulting in internal folds [50]. (2) The load structures indicates that the slumping process was squeezed into clumps due to the weak cohesion of sandy deposits, which were pillow-shaped; furthermore they were able to roll and be transported along the secondary sliding surface, or they invaded the underlying mudstone layer under the action of gravity [51,52]. (3) The close occurrence of folded sandstone and undeformed sandstone indicates synsedimentary deformation rather than late tectonic product [23]. (4) The grain size log-probability curves show that it is basically consistent with the grain size characteristics of a delta front sand body, thus indicating that the deposits were near the delta front [53]. Facies association SP is the product of the plastic deformation of sliding sediment under the action of gravity or shear force and usually develops in the upper position of the slope (Figure 10) [54]. Similar lithofacies Sc and Sps were identified within the Longwuhe Formation of the Early Triassic Gonghe Basin and the Qingshankou Formation of the Late Cretaceous Songliao Basin, and they were also interpreted as facies association SP [52,55].

4.1.3. Facies Association SDF: Sandy Debris Flows

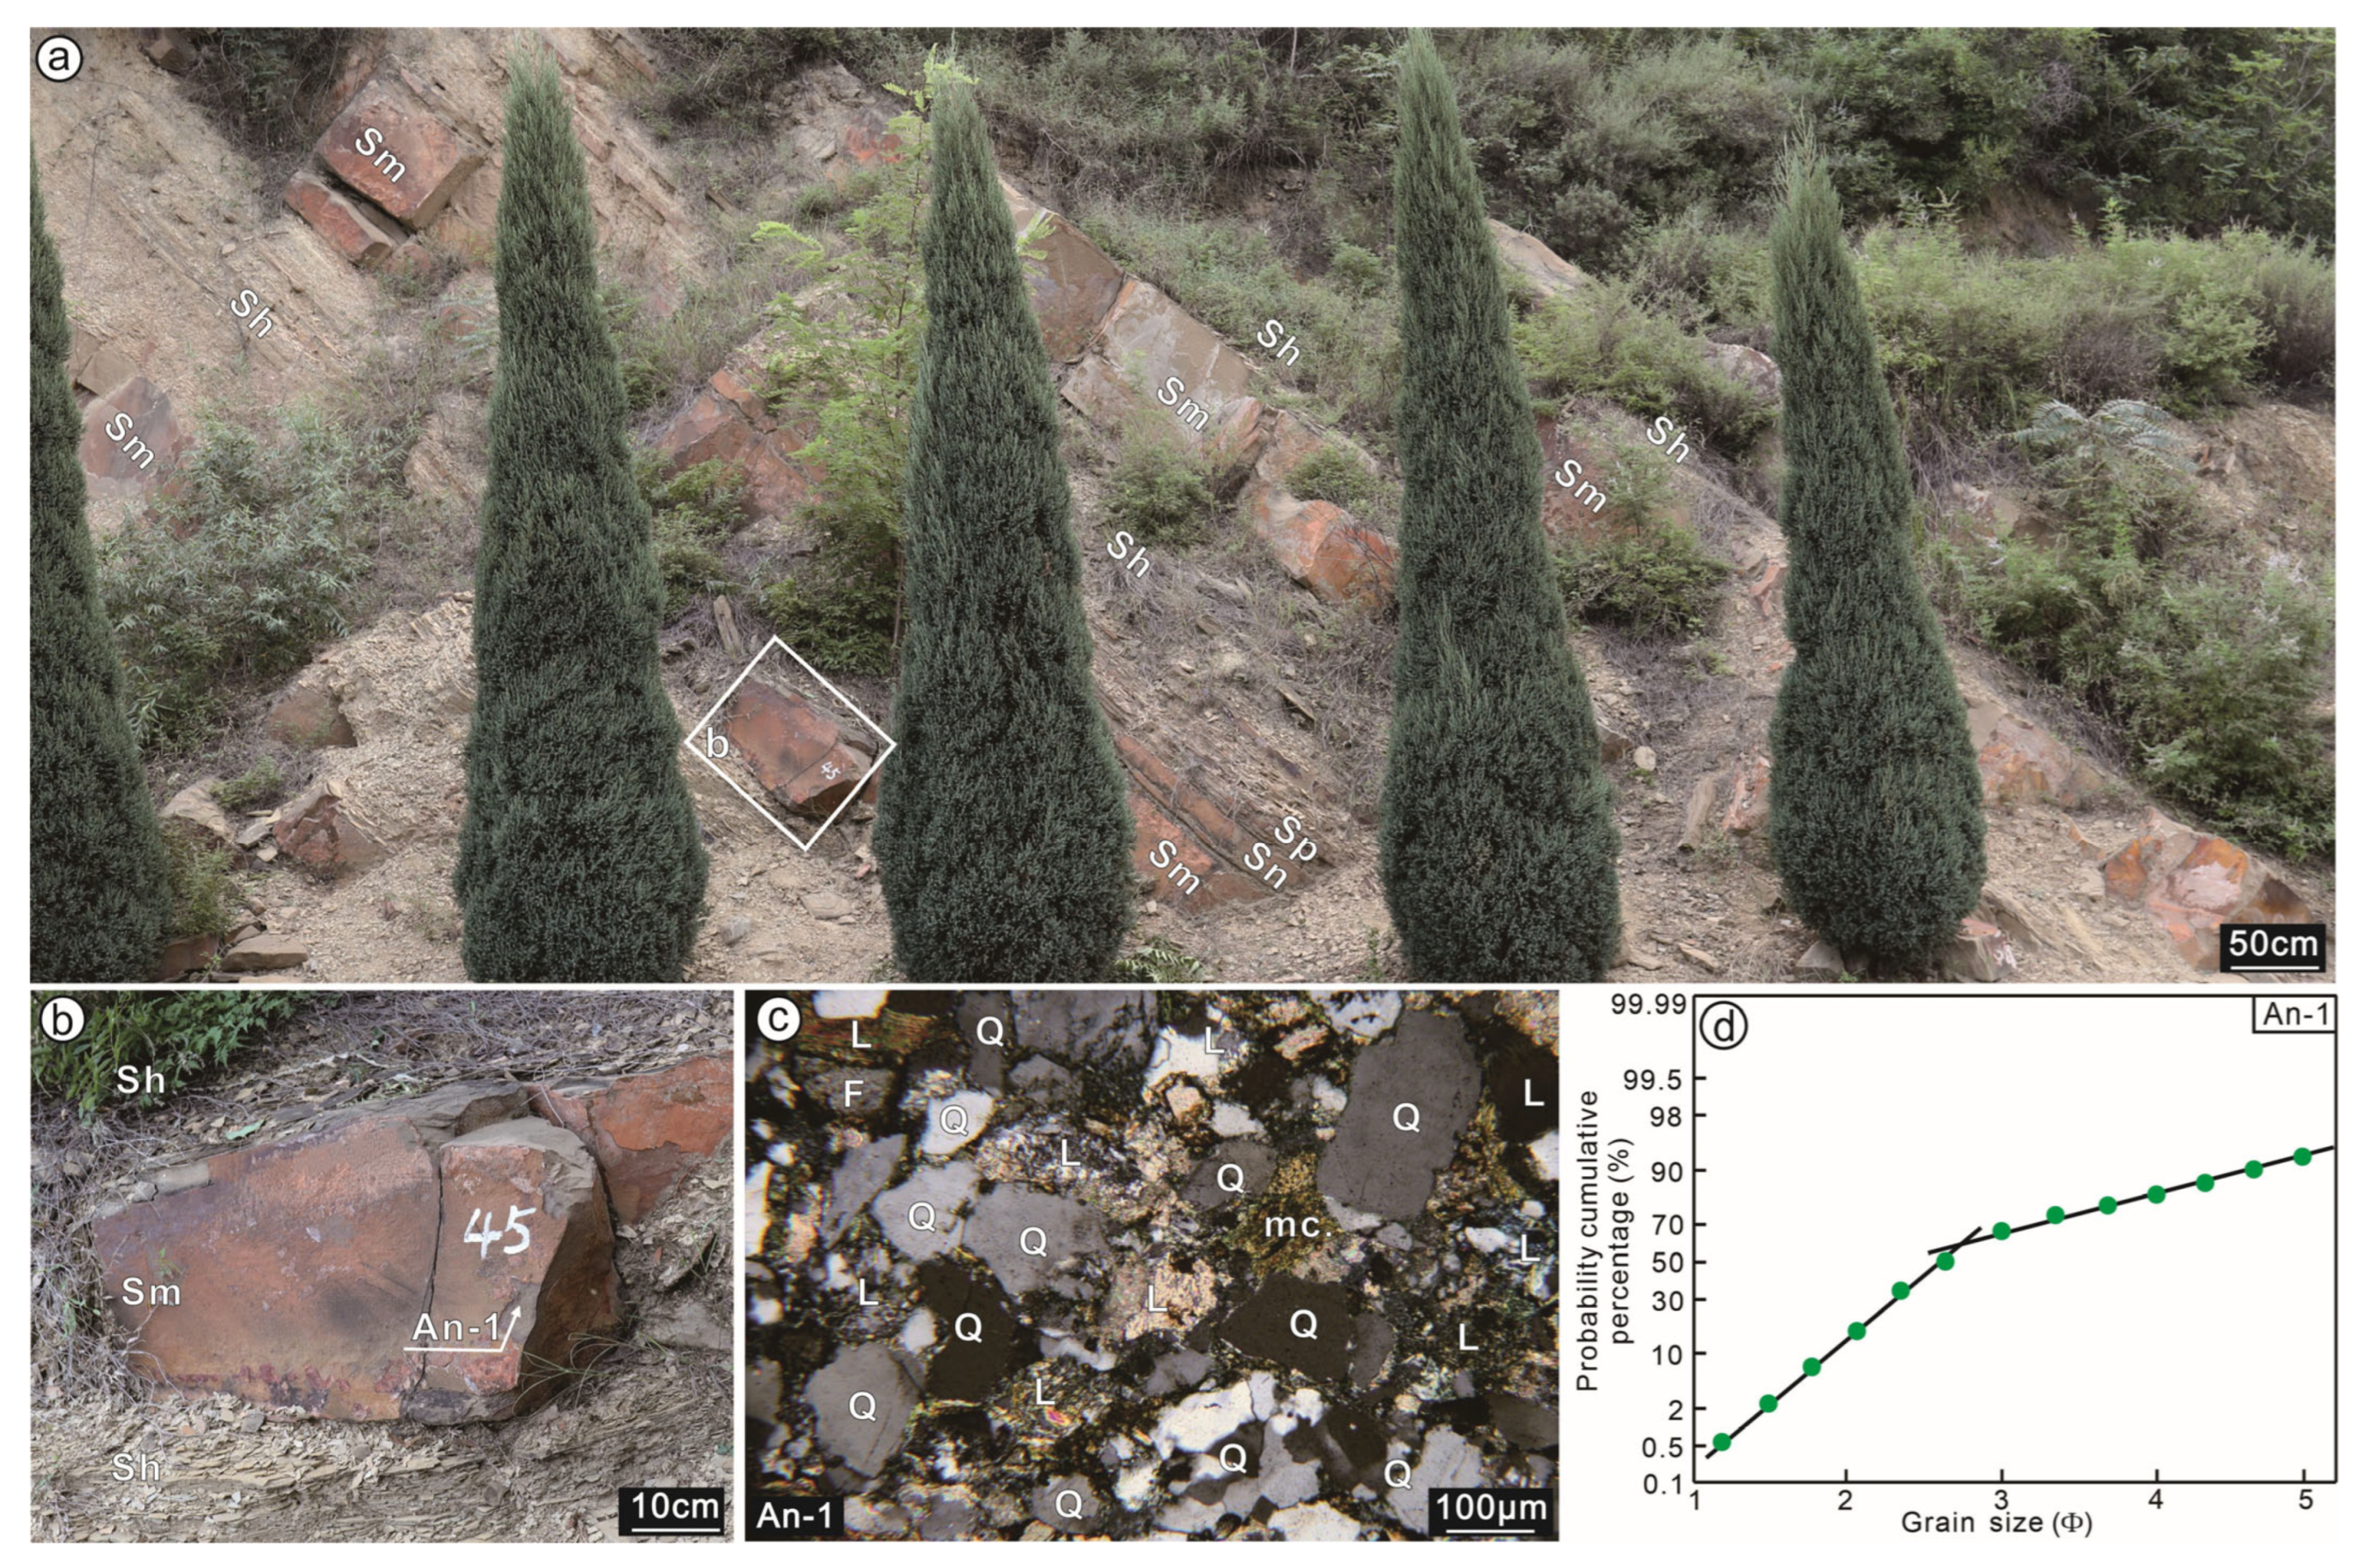
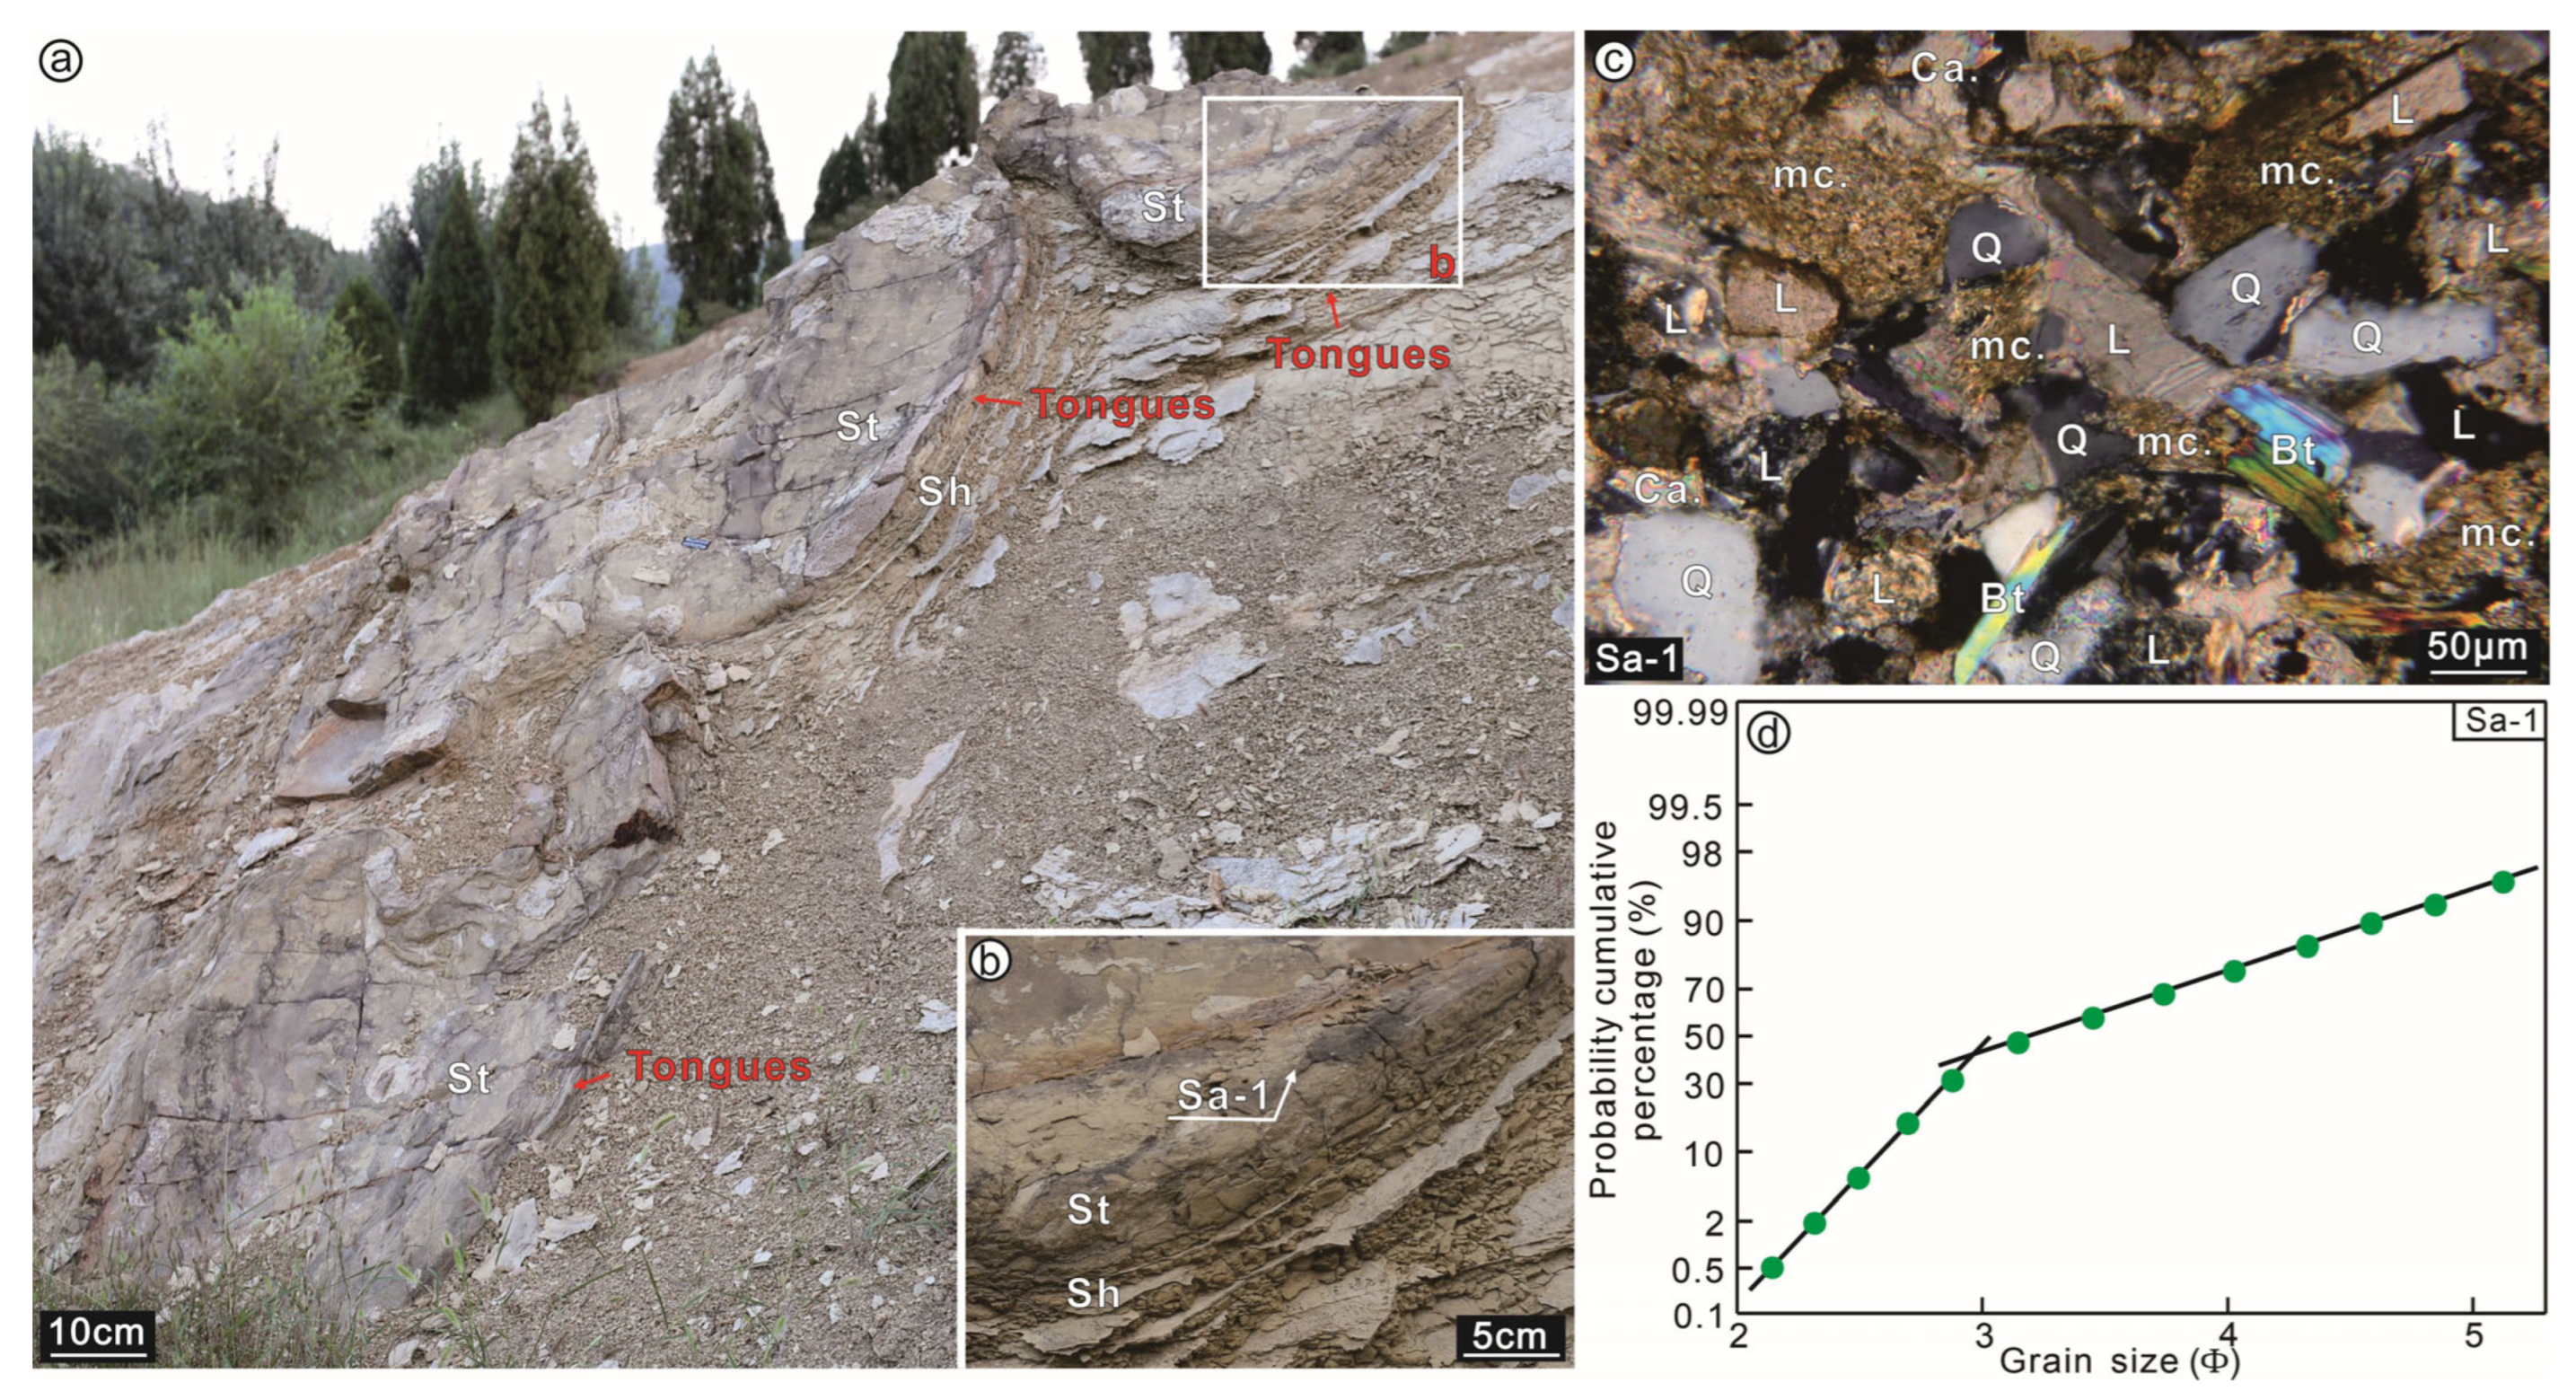
Descriptions: facies association SDF comprises lithofacies Sm, Smm, and St (Table 1), which are mainly developed in the middle of the Aanyao Formation (Figure 2). Each lithofacies of facies association SDF is 0.05–2.5 m (0.16–8.20 ft) thick and is alternated with or enclosed by facies association DL (Figure 3a,b, Figure 4a, Figure 5a and Figure 6b). This facies association mainly comprises gray-white massive fine-grained sandstone and shows parallel-sided geometry (Figure 4a). The lithofacies in facies association SDF usually has sharp top and bottom contacts with facies association DL (Figure 3a,b and Figure 4a) and sometimes has gradual top contact with parallel bedding sandstone (lithofacies Sp; Figure 4a and Figure 6b). The differences among the three lithofacies are the abundant rafted mud clasts and torn mud clasts in lithofacies Smm and the terminal tongue-like shape in lithofacies St (Figure 5a and Figure 6c,d). The grain size log-probability curves of sandstones (#An-1, #Sa-1 and #49-1-1) from lithofacies Sm show two populations (Figure 4d, Figure 5d and Figure 6g), namely suspension population (~40–55%, 2.8–5.1 Φ) and saltation population (~45–60%, 1.2–3.2 Φ) with the boundary around at 2.8–3.2 Φ.
Interpretation: facies association SDF is interpreted as typical of sandy debris flow deposits; the reasons include the following: (1) parallel-side geometry and sharp top and bottom contacts with in situ deep-water facies association DL indicates their allochthonous transportation origin [51]. (2) The massive structure, rafted mud clasts, and tongue-shaped end indicate that facies association SDF is a plastic fluid and that deposition occurs through freezing en masse [50,54,56,57]. (3) The tongue-shaped instead of lobe-shaped end of facies association SDF also indicates the origin of sandy debris flow rather than turbidity currents [57,58]. (4) The grain size log-probability curves indicate that it retains some grain size characteristics of delta front sand bodies; it also proved that the particles are transported by freezing en masse [53,59]. In general, it is reasonable for facies association SDF to be interpreted as sandy debris flow deposits. As shown in Figure 10, slump deposits continue to be transported and deposited along the slope; the transported deposits have been seriously broken and continuously mixed with the surrounding water, forming layered plastic flows, and thus transforming into sandy debris flows (Figure 10) [54]. Similar lithofacies Sm and Smm were identified in the Chang 6 Member of the Yanchang Formation in the Heshui regions of the Late Triassic Ordos Basin and the Qingshankou Formation of the Late Cretaceous Songliao Basin [23,55,60], and similar lithofacies St were found in the Sha 3 Member of the Shahejie Formation in the Dongying Depression of the Paleogene Bohai Bay Basin [61], and they were all interpreted as facies association SDF.

4.1.4. Facies Association TC: Turbidity Currents

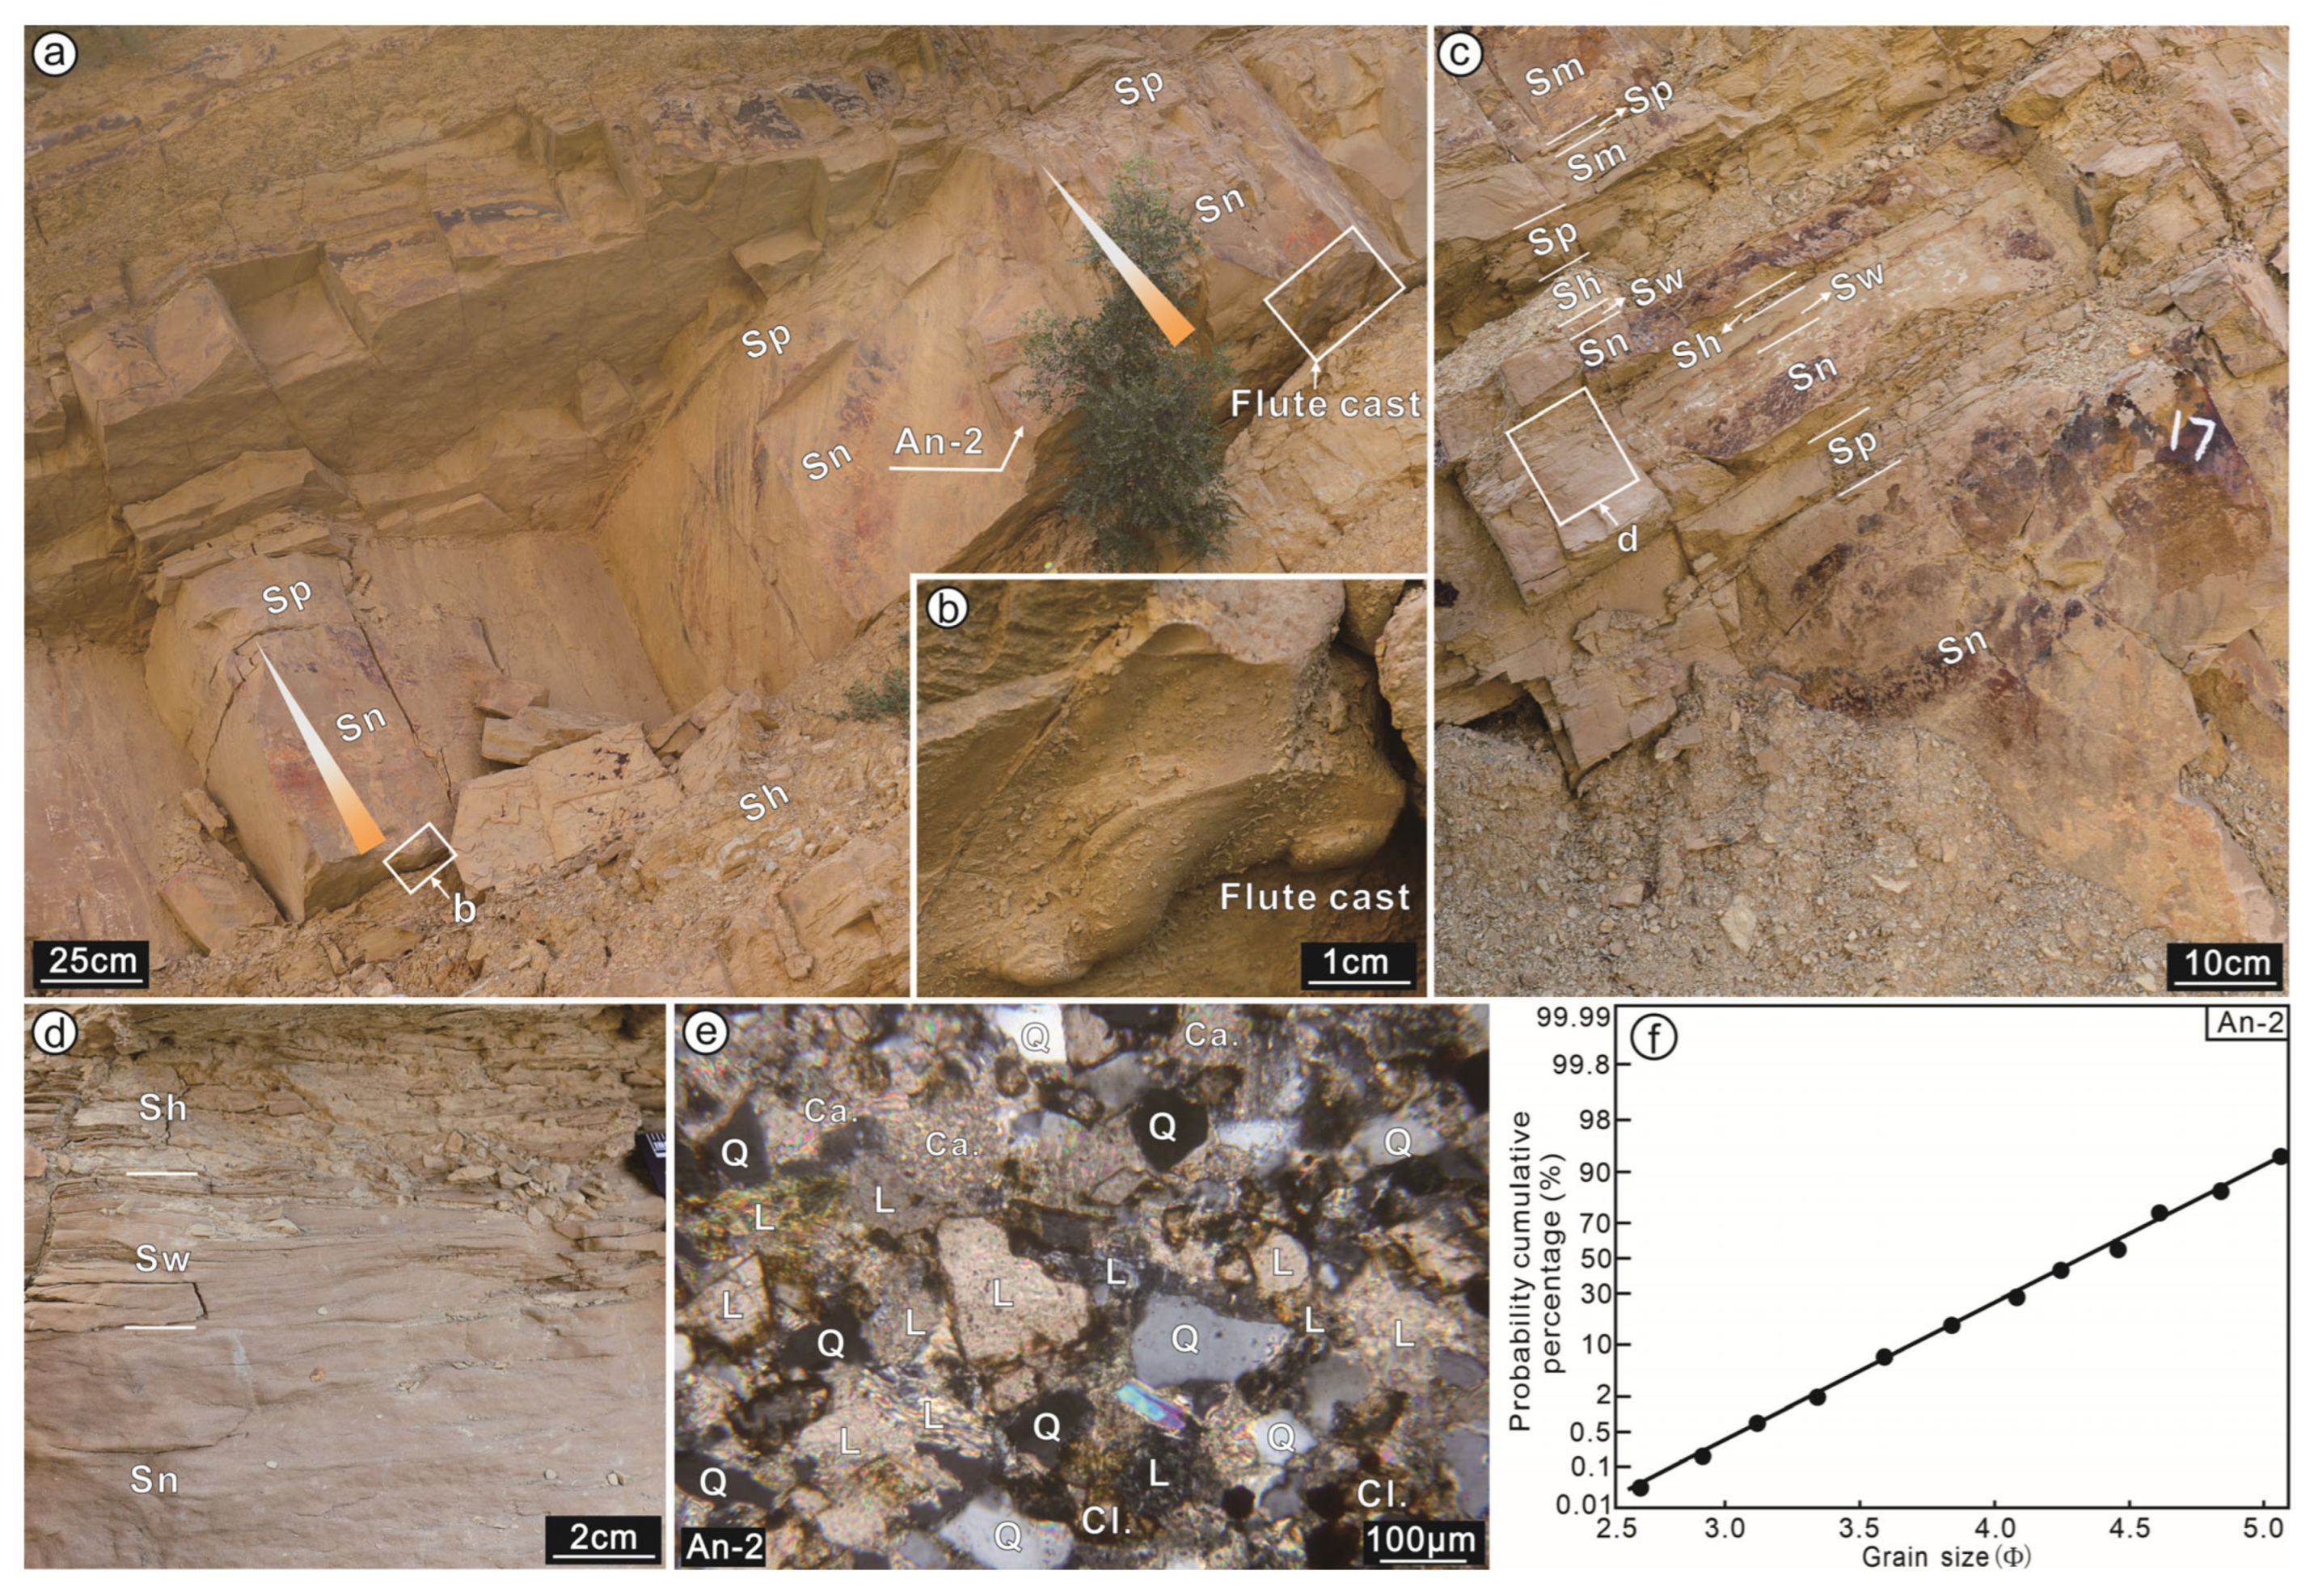
Descriptions: facies association TC is developed widely throughout the Aanyao Formation (Figure 2) and comprises mainly lithofacies Sn and Ssm, with a few lithofacies Sp and Sw (Table 1). It is mainly composed of gray-white fine sandstone, siltstone, and gray-black mudstone (Figure 3c, Figure 7a and Figure 8b), with a thickness of 0.01–0.7 m (0.03–2.30 ft) for each lithofacies. Facies association TC shows normal graded bedding (Sn and Ssm, Figure 7a and Figure 8b), wavy bedding (Sw, Figure 7c,d), or parallel bedding (Sp, Figure 6b and Figure 8b) with parallel-sided geometry (Figure 7a,c). Lithofacies Sn, usually with flute cast on the bottom surface (Figure 7b), has sharp bottom contact with facies association DL, and shows normal graded bedding and upward gradual transition to the lithofacies Sp or Mh (Figure 7a and Figure 8b). Lithofacies Ssm also shows sharp basal contact, normal graded bedding, and gradational upper from lower fine-grained sandstone to upper claystone, but with a thinner thickness (usually less than 5 cm, Figure 8d). Lithofacies Sp and Sw are usually developed through overlying of the lithofacies Sm or Sn (Figure 6b, Figure 7c,d and Figure 8b) and rarely appear alone. The grain size log-probability curves of sandstones (#An-2, #53-9-1) in lithofacies Sn usually show one suspension population (~2.1–5.1 Φ) (Figure 7e and Figure 8h).
Interpretation: lithofacies Sn and Ssm in Facies association TC are interpreted as typical turbidity current deposits. Firstly, their basal sharp or erosional contact with the in situ deep-water facies association DL indicates their allochthonous origin. Secondly, normal grading without complications (such as floating clasts) indicates a decreasing velocity with time in a waning flow [57,62]. As a result, a normal grading is formed by coarse-grained material deposited first, followed by fine-grained material. At the same time, normal grading also indicates that lithofacies Sn and Ssm are sediment flows with Newtonian rheology and a turbulent state [57,63], in which sediment is supported and transported by turbulence and deposition occurs through suspension settling [57]. Turbulent transport and suspension settling are also evidenced by the grain size log-probability curves of sandstones (#An-2, #53-9-1) of lithofacies Sn, which only develop one suspension population [53,64]. In general, lithofacies Sn and Ssm can be explained as the deposits of turbidity currents. The parallel and wavy bedding of lithofacies Sp and Sw indicates a traction flow with Newtonian rheology and a laminar flow state. Its source is controversial and is interpreted as the Tb and Tc divisions of the Bouma sequence by Bouma (1962) [65]. They are considered to represent a high flow stage in the early stages of a turbidity event. Subsequently, they are further explained as the low-density turbidity current origin by Lowe (1979) [15]. Recently, Tb and Tc divisions of the Bouma sequence were considered to be products of bottom current reworking for they do not meet the definition of turbidity current (sediments are transported via suspended load by turbulence) [56]. In this study, lithofacies Sp and Sw only account for a very small proportion, we temporarily place them within the facies association TC.
Traditionally, turbidites were interpreted as deposits formed by a turbidity current event [65], a waning flow characterized by decreasing velocity with time. In this case, turbidites are widely distributed and may cover any type of lithofacies. From the proximal to distal basin, the thickness and grain size of turbidites decrease gradually [51,58]. Accordingly, the medium to thick bedded sandstone turbidites (lithofacies Sn) and very thin to thin bedded sandstone–mudstone turbidites (lithofacies Ssm) in this study represent more proximal and distal turbidite successions, respectively (Figure 10). Recently, most turbidites have been observed as the conversion products of downward moving sandy debris flows. This conversion is caused by the continuous dilution of plastic flows of SDF by water (Figure 10) [9,66,67], and may be partial or complete. The former will lead to the deposit coexistence of SDF and TC (Figure 10), while the latter will cause the separate occurrence of turbidites (Figure 10). In our study, lithofacies Sn and Sp either coexist with SDF (Figure 4a and Figure 6b) or occur alone (Figure 7a,c and Figure 8b). This indicates the mixed origin of the turbidites in the study area.
Similar lithofacies Sn were identified in the Chang 7 Member of the Yanchang Formation in the Chengye regions of the Late Triassic Ordos Basin and the Pico Formation in California of the Pliocene Ventura Basin [14,53], and similar lithofacies Ssm and Sp were found in the Chang 6 Member of the Yanchang Formation in the Heshui regions of the Late Triassic Ordos Basin and the Qingshankou Formation of the Late Cretaceous Songliao Basin [23,55,68,69].

4.2. Clastic Rock Component and Texture

The rock and mineral identification results of the 40 samples are shown in Figure 2. The content of framework grains (>30 mm) varies from 51.0 to 96.1% ( x - = 86.4%) and includes quartz (mean ( x - ) = 49.4%), lithic fragments ( x - = 31.5%), and a small amount of feldspar ( x - = 3.2%) (Figure 2 and Figure 11). The mean framework grain size varies from 0.063 to 0.142 mm ( x - = 0.086 mm); therefore, based on Folk’s classification scheme (Figure 2 and Figure 12) [45], they are almost all fine-grained litharenite according to the area proportion of framework grain. The matrix content varies from 0.0 to 43.0% ( x - = 7.6%), which mainly comprises clay ( x - = 4.6%) and fine silt ( x - = 3.0%). The chemical cement varies from 1.0 to 12.8% ( x - = 6.0%) in content and is mainly carbonate ( x - = 4.7%), followed by siliceous ( x - = 0.6%, quartz overgrowths) and clay minerals ( x - = 0.6%) (Figure 2 and Figure 11).
The lithology of SDF is mainly fine-grained lithic sandstone (n = 21), with the average framework grain size from 0.063 to 0.142 mm ( x - = 0.091 mm). The σ values (standard deviation of framework grain size) range from 0.50 to 0.96 ( x - = 0.68), indicating that they are moderately well sorted. The content of framework grains varies from 64.4 to 96.1% ( x - = 87.9%) and mainly comprises monocrystalline quartz ( x - = 51.9%) and lithic fragments ( x - = 30.46%), followed by a small number of feldspar grains ( x - = 3.5%). The S values of SDF vary from 0.73 to 3.76 with a mean value of 1.70, indicating a level of compositional maturity. The SDF framework grains are mostly clast-supported and porous and sub-angular to sub-rounded. The matrix content of the SDF deposits varies from 0.3 to 34.8% ( x - = 6.5%, moderate textural maturity overall) and mainly comprises clay ( x - = 4.85%) and very fine silt ( x - = 4.32%). The chemical cement content varies from 1.0 to 12.8% ( x - = 5.6%) and mainly comprises carbonates (calcite and dolomite, ( x - = 4.01%), followed by quartz overgrowths, x - = 0.96%) and clay minerals ( x - = 0.66%) (Table S1; Figure 2 and Figure 11). All these indicate that the textural maturity of SDF is sub-mature according to the flow diagram of Nichols (2009) [46].
The 19 TC samples are also fine-grained lithic sandstones and have framework grain contents that range from 51.0 to 95.9% ( x - = 84.8%) and from 0.063 to 0.116 mm ( x - = 0.08 mm) in average framework grain size. The framework grains are sub-angular, moderately well sorted (average σ values 0.46–0.85, x - = 0.62), and particle-supported. They mainly comprise quartz ( x - = 46.7%) and lithic fragments ( x - = 32.6%), followed by a small amount of feldspar ( x - = 2.9%). The S values of the TC samples vary from 0.91 to 1.26 and have a mean value of 1.35 (<SDF = 1.70), indicating that their maturity was lower than SDF. The cement component of the TC samples (about 6.4%) is mainly carbonate ( x - = 5.6%), followed by siliceous ( x - = 0.3%) and clay minerals ( x - = 0.6%) (Table S1; Figure 2 and Figure 11). All these indicate that the textural maturity of TC is also sub-mature.
Overall, the SDF and TC samples in this study are all fine-grained lithic sandstones and are similar in the types and percentages of framework grains (mainly quartz and lithic fragments with fewer feldspar grains) and the composition and the content of matrix and chemical cement (mainly carbonates followed by quartz and clay minerals). However, there are differences in the average content, grain size, and sorting of framework grains and compositional maturity. The SDF is higher in average framework grain content (87.9% for SDF vs. 84.8% for TC) and compositional maturity (average S value 1.70 for SDF vs. 1.35 for TC). Also, the average grain size is slightly greater in the sandy debris flows (0.091 mm for SDF vs. 0.080 mm for TC), but is relatively poor in sorting (average σ value 0.68 for SDF vs. 0.62 for TC).

4.3. Pore System

4.3.1. Thin-Section Porosity and Pore Types

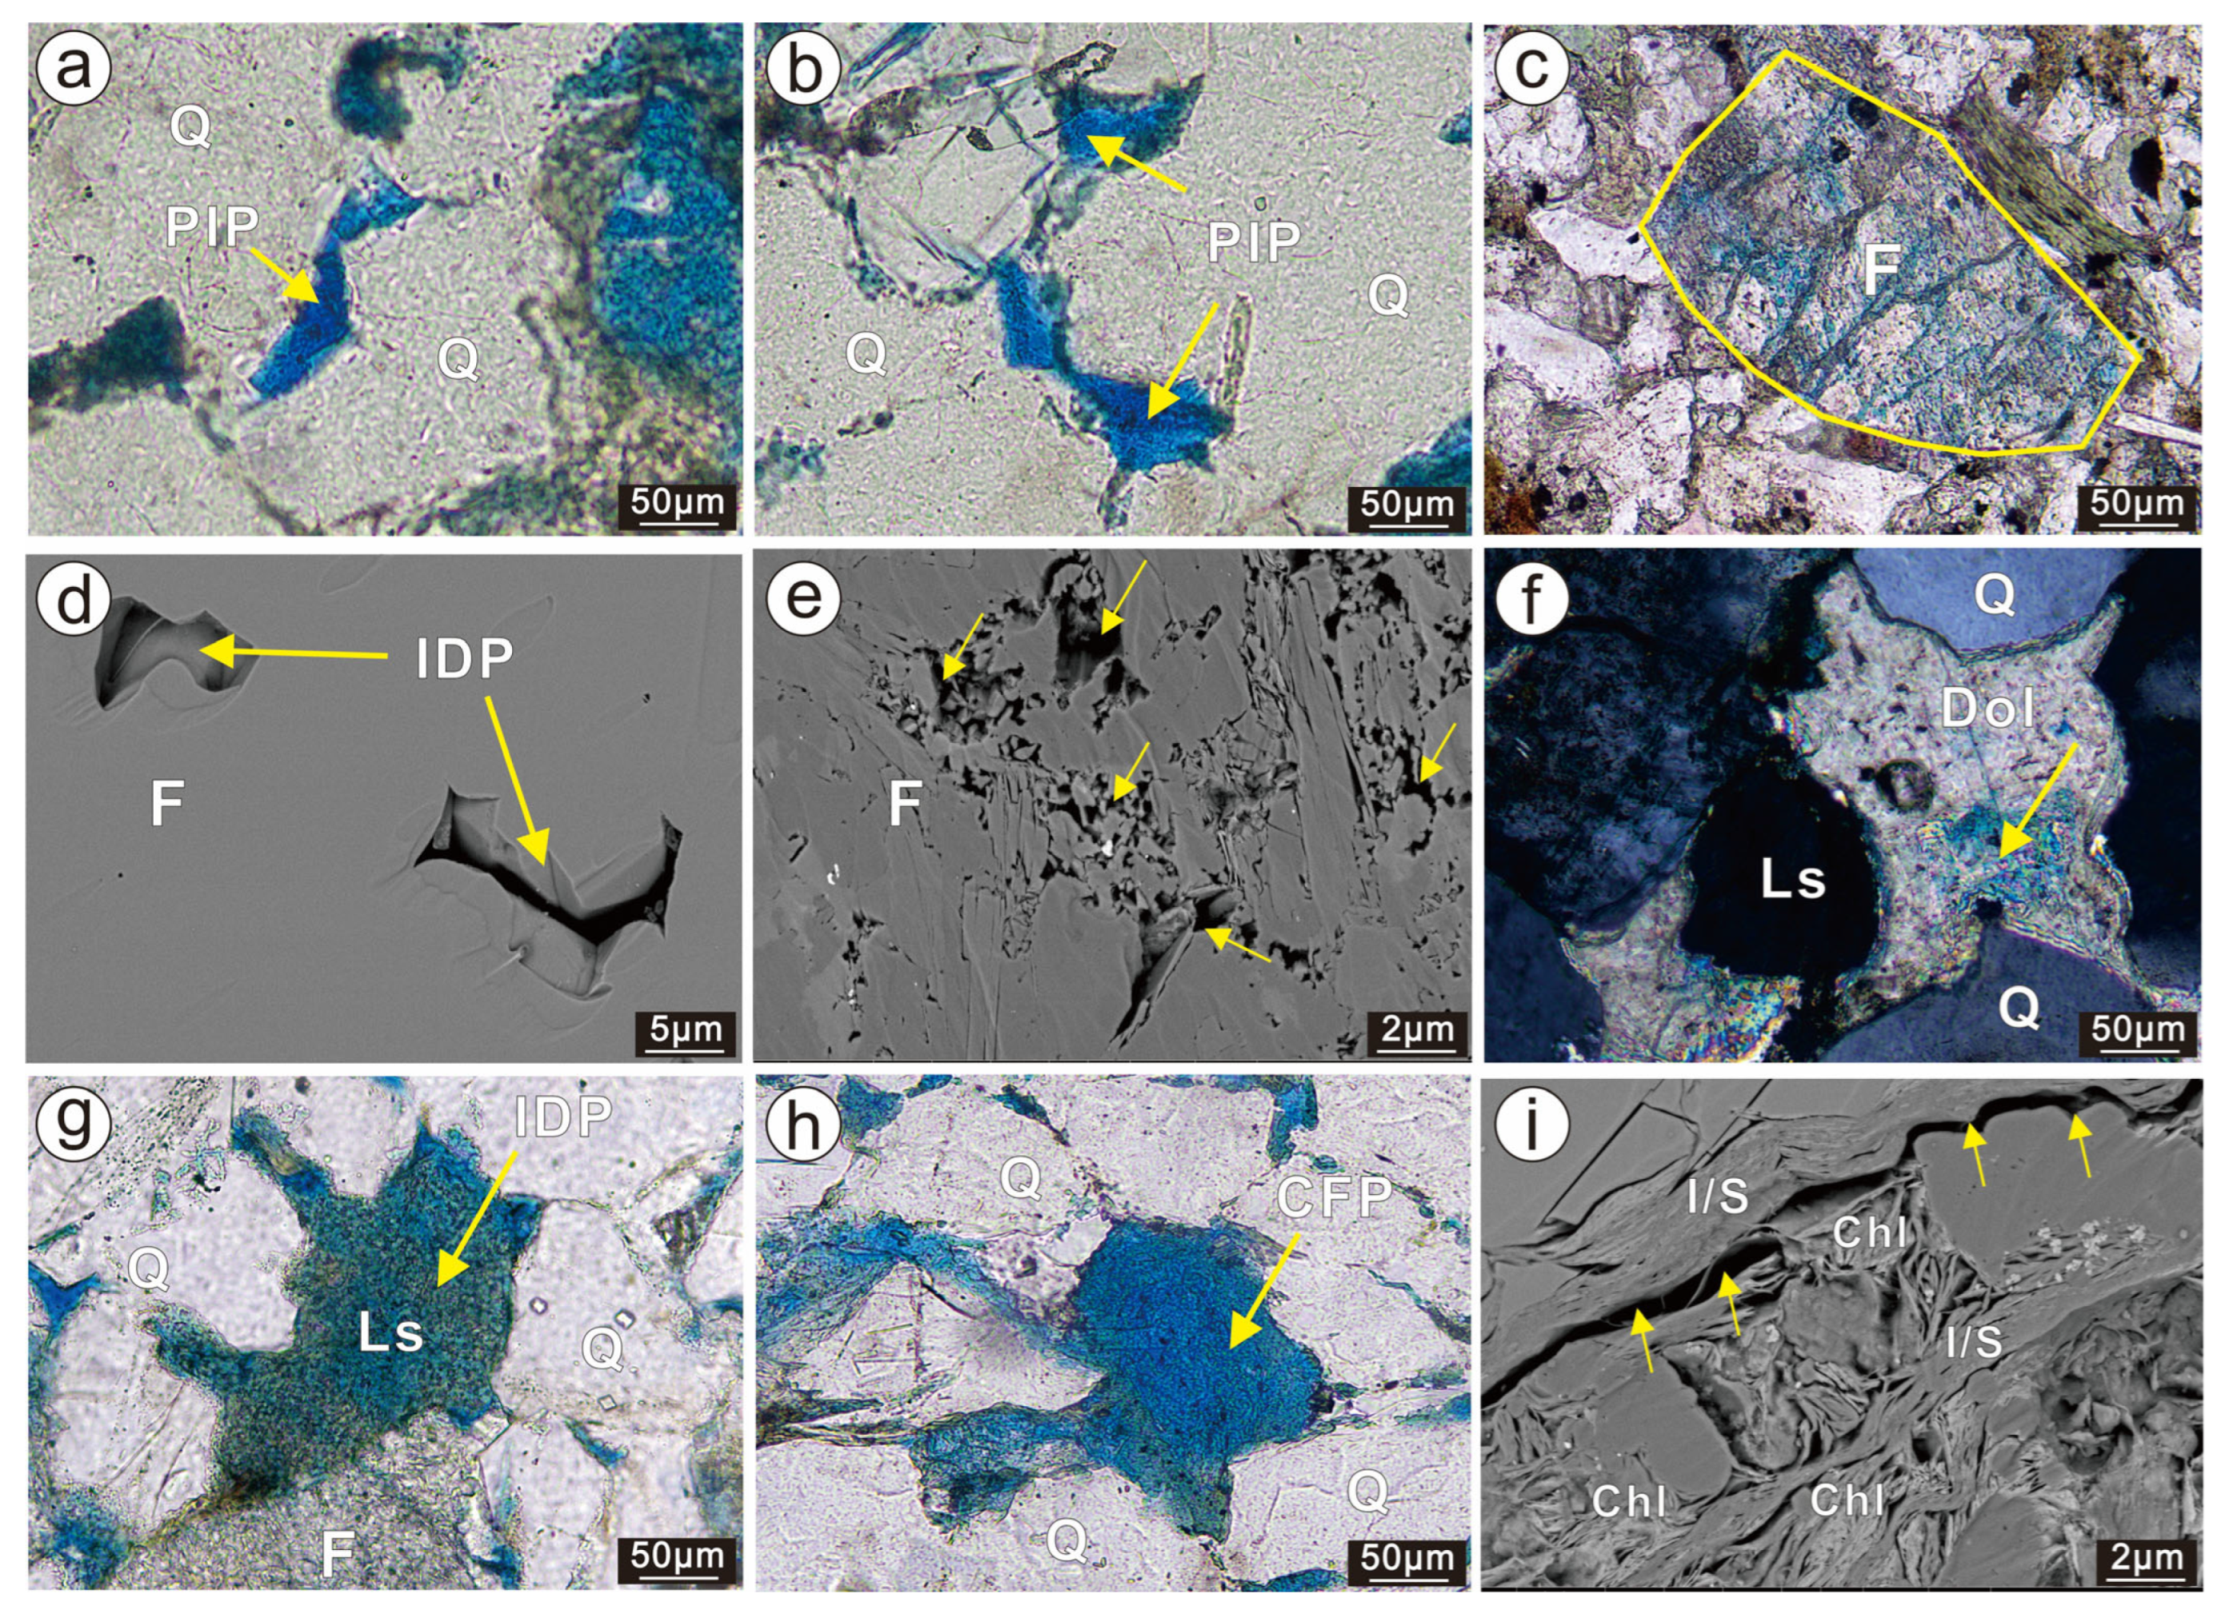
The thin-section porosity of samples varies from 0.0 to 12.1% ( x - = 4.9%). Pore types are dominated by secondary pores ( x - = 85.1% of total pores), followed by primary pores ( x - = 14.9%) (Figure 2). The former includes intragranular dissolution pores (0.0–6.7%, x - = 3.1%) originating from the dissolution of framework grains (mainly feldspar and some lithic fragments), inter-grain dissolution pores (mainly the dissolution of calcareous cement, 0.0–2.0%, x - = 0.4%), cast film pores (0.0–1.0%, x - = 0.3%), and microcracks (0.0–1.0%, x - = 0.2%) (Figure 13c–i). The latter are mainly primary intergranular pores between quartz grains (0.0–4.7%, x - = 1.0%; Table S1; Figure 7a,b). The main pore types in the Anyao Formation are similar to those in the Chang 7 and Chang 8 Members of the Ordos Basin [17,70,71], but the thin-section porosity is slightly higher ( x - = 2.6% in the Chang 7 and Chang 8 Members) [17,70]. The secondary pore content in the Anyao Formation ( x - = 4.0%) is significantly higher than that in Chang 7 and Chang 8 Members ( x   - = 1.7% and x - = 0.9%, respectively). The primary pore content in the Anyao Formation reservoirs ( x - = 1.0%) is close to that in the Chang 7 Member ( x - = 0.8%), but less than that in the Chang 8 Member ( x - = 1.8%).
Comparative analysis of the SDF porosity with TC indicates that the thin-section porosity of SDF ( x - = 6.3%) is higher than that of TC ( x - = 3.4%), although their pore types are all dominated by intragranular dissolution pores ( x - = 3.4% and 2.4%, respectively) and primary intergranular pores ( x - = 1.5% and 0.3%, respectively).

4.3.2. Pore Throat Characteristics

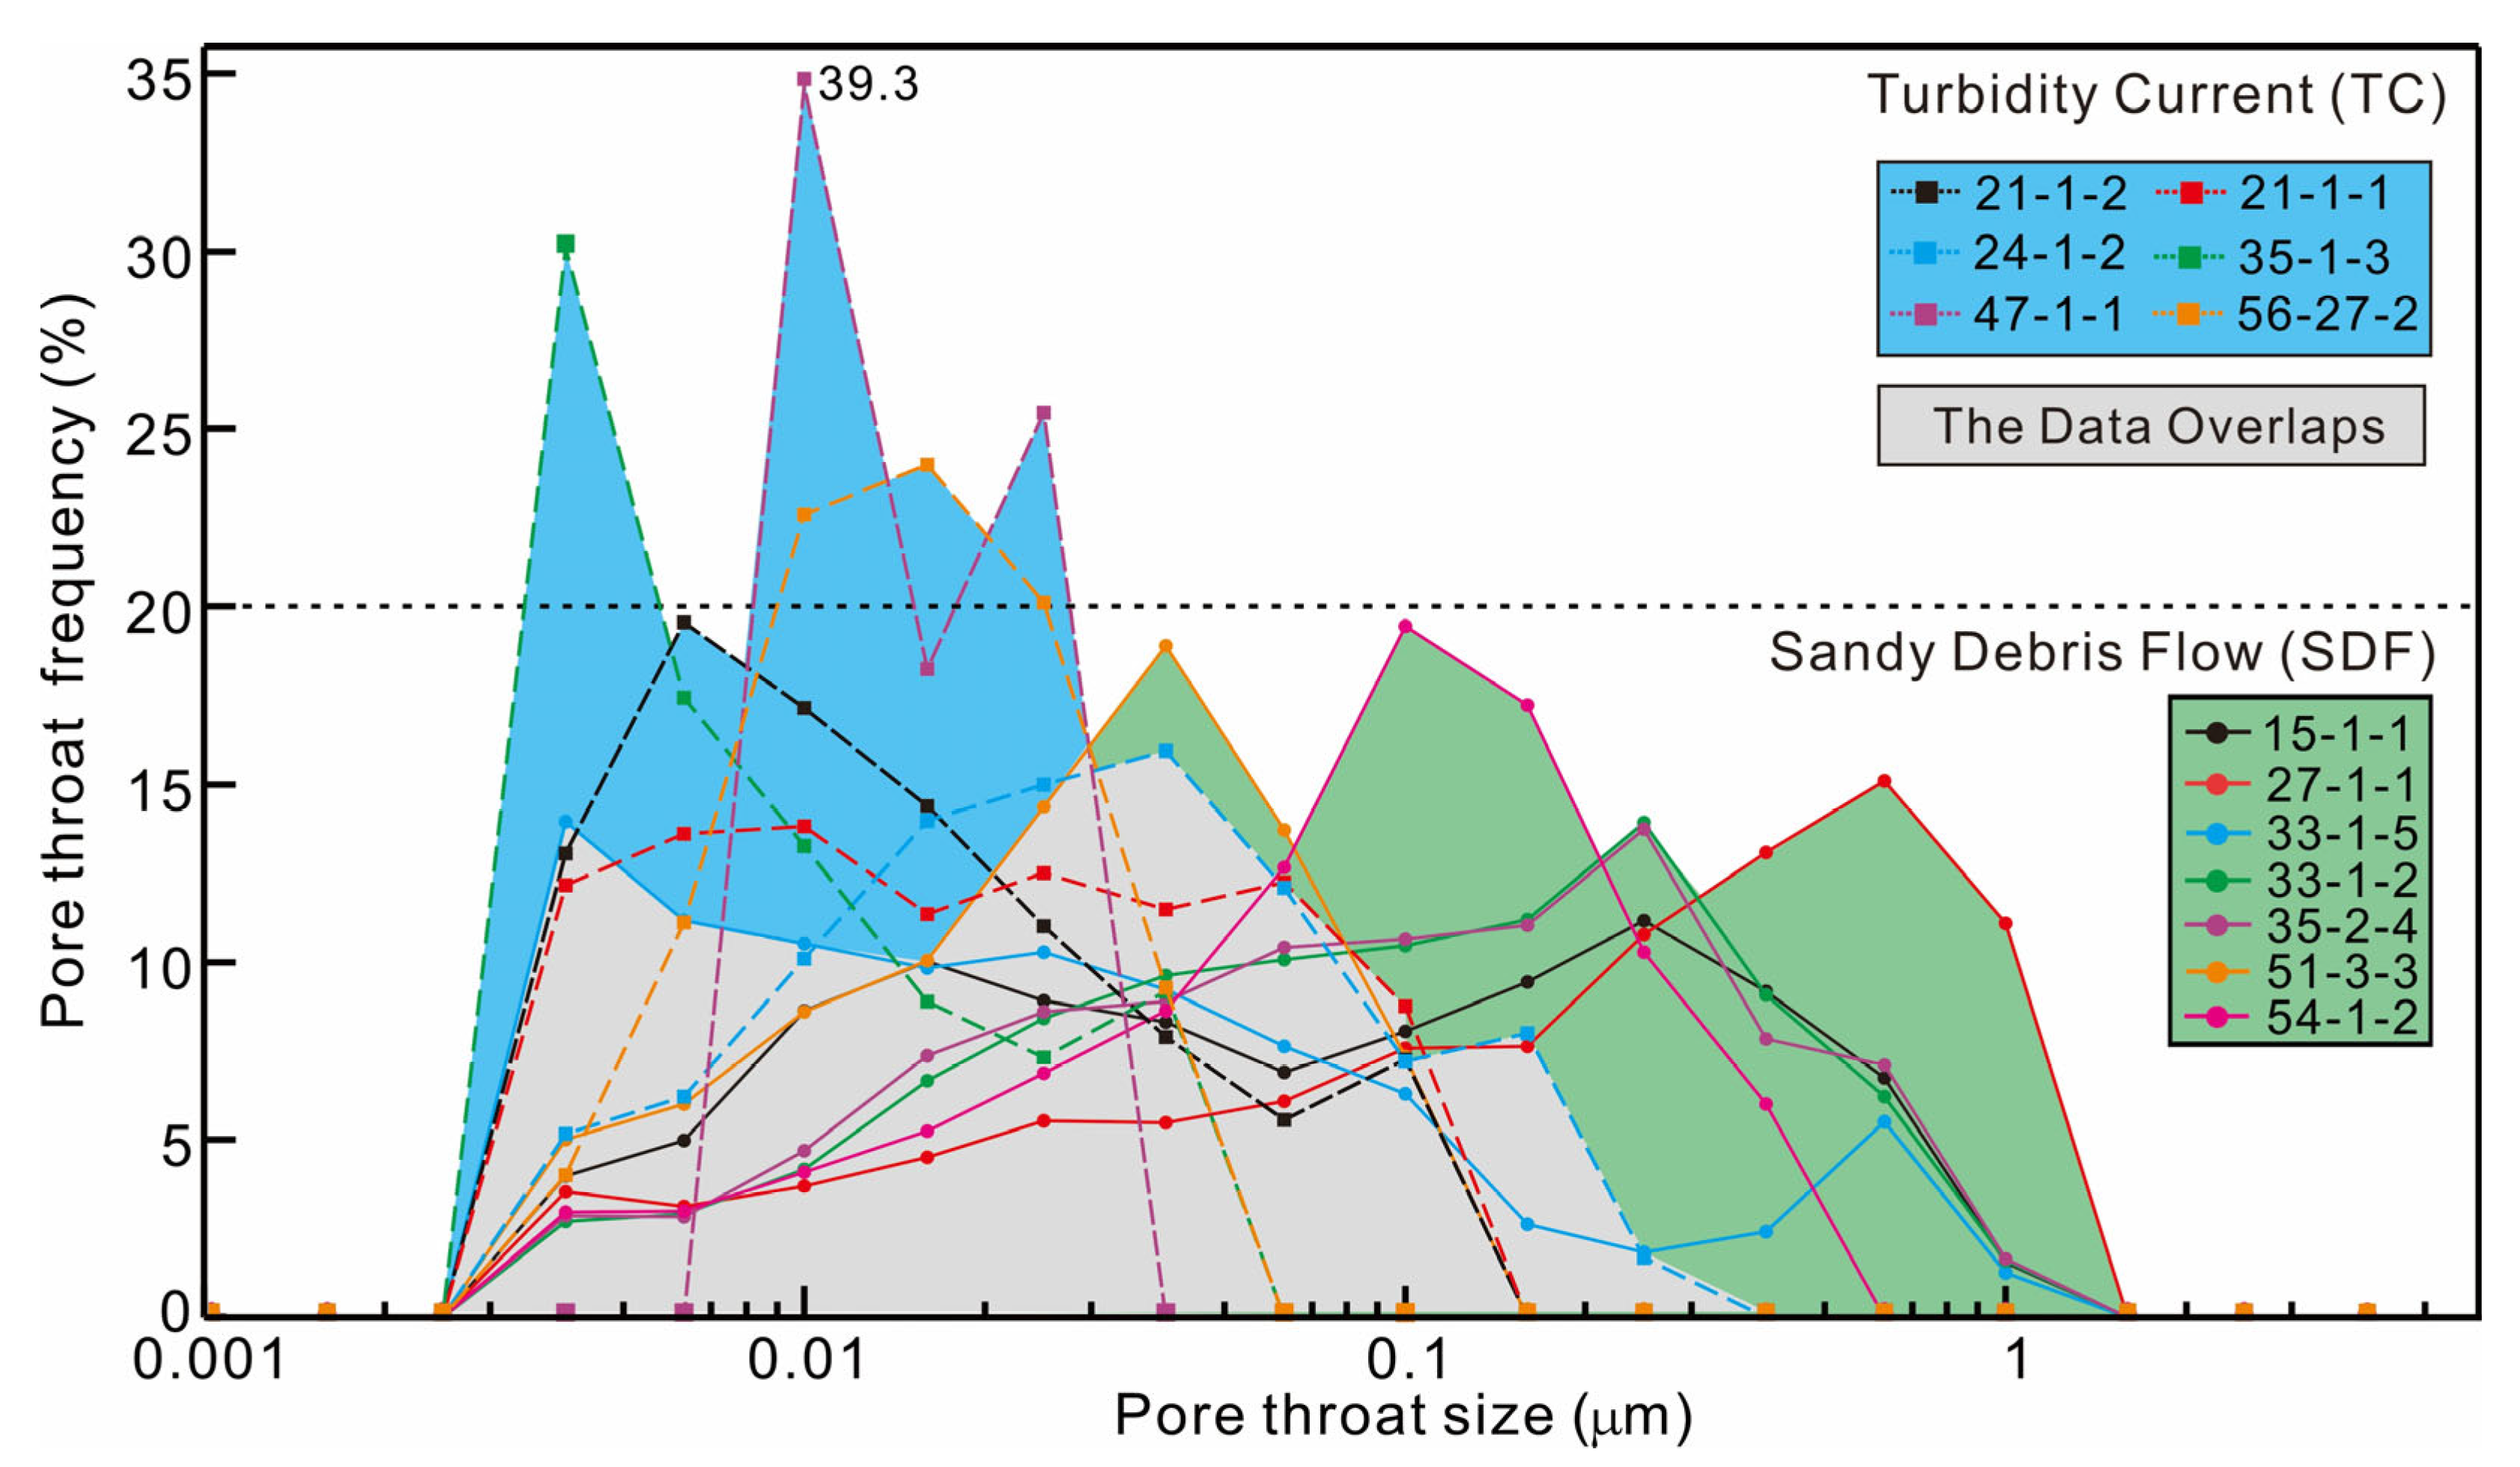
The results of capillary curves for 13 representative samples (7 SDF and 6 TC samples) are shown in Figure 14. The maximum mercury saturation values range from 82.98 to 97.84% ( x - = 93.07%) and are close to 100%, indicating that almost all pore throat systems are in contact with mercury. The sample displacement pressure (the pressure value at which mercury begins to enter the sample throat) changes greatly, and ranges from 0.47 to 48.24 MPa ( x   - = 7.66 MPa) (Table S1; Figure 14). The samples change greatly in pore throat radius values with the maximum radii (rm) from 0.015 to 1.58 μm ( x - = 0.558 μm), the median radii (r50) from 0.006 to 0.251 μm ( x - = 0.063μm), and the average radii (ra) from 0.006 to 0.358 μm ( x - = 0.105 μm) (Figure 15). The sorting coefficient of the pore throat radius (SCPo) represents the dispersion degree of these radius values; the closer its value is to 1, the more concentrated the pore throat radius values. In this study, the SCPo values for the 13 samples vary from 0.672 to 2.537 with a mean value of 1.771.
Compared with the TC samples, the SDF samples are much lower in average displacement pressure ( x - = 1.43 MPa and 14.93 MPa, respectively) (Figure 14) and are higher in average SCPo value ( x - = 2.16 and 1.30, respectively). Similarly, the maximum, median, and average pore throat radii of SDF ( x - = 2.16, 0.102, and 0.174 μm, respectively) are significantly higher than those of the TC samples ( x - = 0.109, 0.025, and 0.017 μm, respectively).
Figure 15 shows the pore throat radius distribution of the 13 samples, and most of them are less than 1 μm in pore throat radius but with a wide distribution range. The pore throat radius of the SDF samples varies from 0.001 to 1.580 μm, showing a unimodal distribution mode with the main peak radius from 0.1 to 1.0 μm. For the TC samples, the pore throat radii change from 0.001 to 0.268 μm, and most of them show a bimodal distribution with main peaks at radii of 0.006–0.010 μm and 0.030–0.100 μm, respectively. The left peak may represent disconnected pores, and the right peak is associated with the larger residual inter-connected pores [18]. In general, the pore throat radii of the SDF and TC samples in the study area are significantly different, with the average value of the former being more than 0.1 μm, indicating that the former pores are mainly connected by pore throats with a radius greater than 0.1 μm, and the peak value of the high permeability pore throats is close to 1.0 μm (Figure 15). However, most of the TC pore throat radius values are less than 0.1 μm, indicating that TC pores are mainly connected by a pore throat with a radius less than 0.1 μm, or are even not connected.

4.3.3. Porosity and Permeability

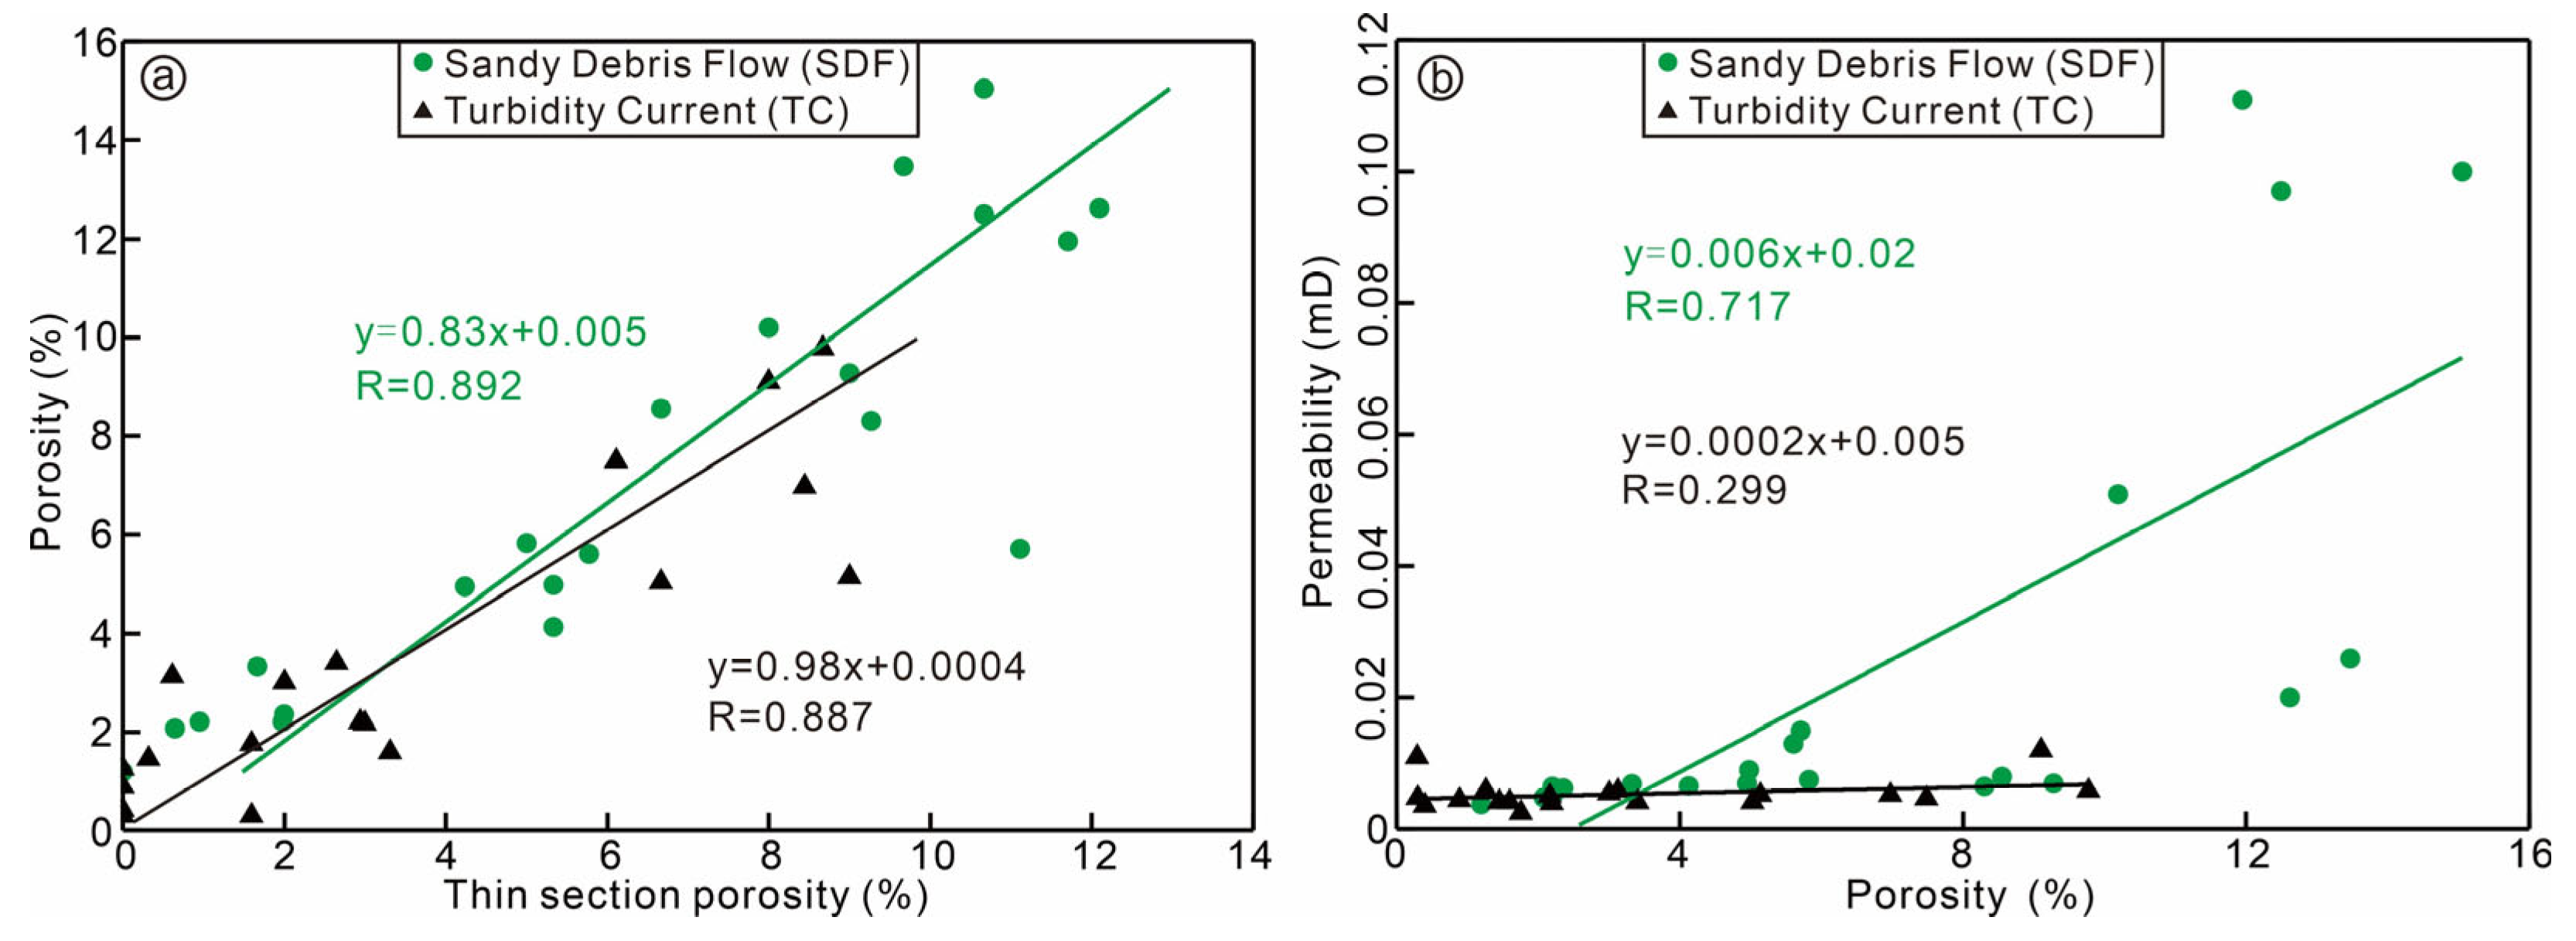
The porosity and permeability test results for the 40 samples are shown in Figure 2. The porosity values vary from 0.30% to 15.05% ( x - = 5.30%) and show a good correlation with the thin-section porosity (RSDF = 0.892 and RTC = 0.887, critical correlation coefficients 0.433 and 0.456 for 21 and 19 samples, respectively, under 95% confidence level; Figure 16a). The permeability values change from 0.002 to 0.111 mD ( x - = 0.015 mD), indicating that the gravity flow reservoirs of the Anyao Formation are of low porosity and ultra-low permeability (Figure 2). Compared with the TC samples, the SDF porosity and permeability are significantly better (Figure 2) with porosity values varying from 1.19 to 15.05% ( x - = 6.97%), and permeability from 0.004 to 0.111 mD ( x - = 0.025 mD). The TC porosity values vary from 0.30 to 9.78% ( x - = 3.44%), and its permeability values range from 0.002 to 0.012 mD ( x - = 0.005 mD).
Compared with the porosity and permeability of the gravity flow reservoirs in the Ordos Basin, the SDF porosity of the Anyao Formation ( x - = 6.97%) is slightly lower than that of the Chang 7 Member reservoirs ( x - = 7.48%), but significantly higher than that of the Chang 8 Member reservoirs ( x - = 3.44%). The SDF permeability ( x - = 0.025 mD) is much lower than that of the Chang 7 and Chang 8 reservoirs (average 0.14 mD and 0.51 mD, respectively) [17,70]. For the TC samples of the Anyao Formation, both the porosity ( x - = 3.44%) and permeability ( x - = 0.005 mD) are lower than those in the Chang 7 reservoirs (average 7.48% and 0.14 mD, respectively) and the Chang 8 reservoirs (average 3.44% and 0.51 mD, respectively) [17,70].
Correlation analysis of porosity with permeability in the study area shows that the correlation coefficient for the SDF samples (R = 0.717) is greater than the critical correlation coefficient value 0.433 (under 95% confidence level and 21 samples) (Figure 16b), indicating a significant positive correlation between permeability and porosity, and the porosity is the important controlling factor of SDF reservoir permeability. However, for the TC samples, the porosity–permeability correlation coefficient (R = 0.299) is less than the critical correlation coefficient value 0.456 (under 95% confidence level and 19 samples), indicating no correlation between the permeability and the porosity (Figure 16b), and the porosity is not the main controlling factor of the TC reservoir’s permeability. In addition, some samples are characterized by high porosity and low permeability (e.g., #29-1-1), or low porosity and high permeability (e.g., #21-1-3); similar conditions also occurred in the Yanchang Formation in the Ordos Basin and the Xujiahe Formation in the Sichuan Basin [17,18]. The high-porosity and low-permeability reservoirs mainly reflect the small pore throat radius with poor pore connectivity, which does not allow fluid to pass through effectively [72]. Conversely, the low-porosity and high-permeability reservoirs mainly indicate better pore connectivity and larger pore throat radius [72].

4.4. Diagenesis Processes

Petrographic examination of thin sections under optical and electron microscope shows that the main diagenetic features of the Anyao Formation include compaction, dissolution, cementation, and metasomatism. Compaction is the most common diagenetic feature in the study area and is indicated by the brittle fracture of quartz grains (Figure 11a) and the bending of mica flakes (Figure 12 and Figure 17b). This mainly occurs in eodiagenesis (Figure 12) in what Ma et al. (2021) and Lu et al. (2021) termed early diagenesis stages A and B [19,37]. The cementation mainly occurred through later eodiagenesis (early diagenesis B) and into mesodiagenesis (medium diagenesis A) (Ma et al., 2021) [19]. The cement composition is mainly dominated by carbonates (Figure 17c,i,j,l), followed by a small amount of authigenic quartz and clay minerals (Figure 11 and Figure 17c–h). Calcite and dolomite are the main carbonate cements and are mainly distributed in the intergranular pore space (Figure 17c,i,j,l). Authigenic quartz cements are mainly in the form of overgrowths and show a clear boundary with the original quartz grains (Figure 17d). Authigenic clay minerals include book-like kaolinite, a curved flake mixed layer of illite–montmorillonite, leaf-like chlorite, and flaky illite (Figure 17e–h).
Dissolution mainly occurred in mesodiagenesis (middle diagenesis stage A) (Figure 18), at the peak of organic acid production, because the organic matter during this period is in the low-mature to mature stage [19]. In the study area, the SDF and TC sediments are usually surrounded by black shale rich in organic matter; this favors the infiltration of organic acid into sandstone reservoirs and results in extensive dissolution of framework grains and carbonate cements (Figure 18). As a result, a large amount of intragranular dissolution pores, a few intergranular dissolution pores, and moldic pores are produced, and reservoir physical properties are improved to some extent (Figure 13c–h and Figure 17i,j). Although the dissolution of framework grains increased the reservoir porosity, the residues of the dissolution reaction (such as clay minerals) may have blocked the throat between pores, and this becomes one of the reasons for the occurrence of high-porosity and low-permeability reservoirs (e.g., samples #12-1-1, #24-1-2, #29-1-1, #30-1-1 and #33-1-4). Metasomatism is mainly represented by the replacement of calcite by quartz. These reactions mostly occur along cleavage cracks and the edge fractures of quartz (Figure 17k). The metasomatism has less effect on the reservoir physical properties because it only causes the transformation between mineral composition and does not cause any change in pore volume [19].
The widespread presence of authigenic clay minerals, authigenic carbonate minerals, the quartz overgrowth (siliceous cements), and the abundant secondary pores from the dissolution of framework grains and carbonate cements indicate that the sediments of the Anyao Formation are in mesodiagenesis (middle diagenesis stage A of Ma et al., 2021) [19]. This is consistent with the result from the rock pyrolysis analysis (Tmax varies from 442 to 448 °C), and the organic matter is in the early mature stage of the oil window [37].

5. Discussion

5.1. Controls on the Porosity of Two Gravity Flow Reservoirs

5.1.1. Rock Texture

The correlation analysis of porosity with the petrological indices, namely framework grain size, framework grain sorting, rigid grain content (quartz + feldspar + chert + siliceous lithic fragment), feldspar grain content, matrix content, and cement content, is shown in Figure 19.
For the SDF samples, the correlation coefficient values (R) of porosity with the framework grain size, rigid grain content, feldspar grain content, and framework grain sorting are 0.812, 0.763, 0.605, and 0.594, respectively (Figure 19a–d). They are all greater than the critical correlation coefficient 0.433 (under 95% confidence level and 21 samples), indicating significant positive correlation between them, and they are the main porosity-affecting factors in descending order for SDF samples. However, the R values of porosity with the matrix and cement content (0.217 and 0.067, respectively) are all less than 0.433 (Figure 19e,f), indicating that there is no correlation between them.
For the TC samples, the porosity shows positive correlation with the feldspar grain content, rigid grain content, and framework grain size (0.723, 0.574, and 0.463, respectively, with a critical correlation coefficient of 0.456 under a 95% confidence level and 19 samples), but no correlation with the framework grain sorting, matrix content, and cement content (0.035, −0.093, and −0.149, respectively) (Figure 19a–d). This shows that the feldspar grain content, rigid grain content, and framework grain size are the main porosity-affecting factors in descending order for TC samples.
In the study area, the porosity of SDF samples shows positive correlation with the framework grain size and framework grain sorting. However, the TC samples show a relatively weak positive correlation with the framework particle size (R = 0.463) and no correlation with the framework size (R = 0.035). Previous studies generally suggest that the framework grain size and sorting play an important role in the retention of primary pores [17,73], and the reservoirs with larger grain size and better sorting have higher porosity. However, in this study, the grain size of SDF samples is widely distributed and poorly sorted compared with the TC samples, namely the larger the grain size is, the worse the sorting is, but the greater the porosity. The possible reason is the existence of larger clastic grains in samples with poorer sorting, which play a better supporting role and provide more pore volume. In addition, the TC samples are finer grained and better sorted compared with the SDF samples; so the porosity of the TC samples is not sensitive to the changes in grain size and sorting. At the same time, the secondary pores of the gravity flow samples accounted for 85.06% of the total porosity; so the petrological indices affecting the primary pores (e.g., matrix content and cement content) were not the main porosity-affecting factors.
The porosities of the SDF and TC samples are all closely related to the rigid grain and feldspar grain content (Figure 19c,d), and this is due to their strong resistance to compaction. The increase in their content can effectively reduce the primary porosity loss caused by compaction [74,75,76,77]. Moreover, the feldspar and rigid grains are more conducive to the infiltration of organic acids or other acidic fluids, which will further promote the generation of a large number of secondary pores through the dissolution of framework grains. In this process, the feldspar grains can not only resist compaction but are easily dissolved and produce plenty of secondary dissolution pores, and thus increase the reservoir porosity [78].

5.1.2. Diagenesis

As outlined above, the pore types in the study area are mainly secondary dissolution pores ( x - = 85.1%), followed by primary intergranular pores ( x - = 14.9). The observation result of cast thin sections in the study area shows that the compaction and cementation are the key diagenesis in reducing primary pores, and they are also considered the most important factors in decreasing initial porosity to current values in conventional reservoirs [79,80]. The relationship plots (Figure 20) between intergranular volume (primary intergranular pore content + cement content) and cement content (assuming that the sandstones had an initial porosity of 40%) have shown that, whether for SDF or TC samples, the porosity loss rate due to compaction is greater than that of cementation [81,82,83]. Compared with the SDF samples, the TC samples, with lower rigid grain content and better sorting, are more significantly compacted (Figure 20), as indicated by the lower amount of primary intergranular pore content ( x - = 0.3% for TC and 1.5% for SDF). As to another important diagenesis, the cementation is relatively weak in decreasing the porosity for their lower cement content ( x - = 4.92%) and calcareous chemical composition. These calcareous cements even increased reservoir porosity when they underwent wide dissolution in the subsequent diagenetic process. As a result, cementation is a secondary factor in decreasing the porosity in the study area (Figure 19f).
In the study area, the higher content of dissolution pores ( x - = 3.7%) indicate that the dissolution is the main porosity-affecting factor in stage A of middle diagenesis. In general, lithic fragments (excluding siliceous lithic fragments such as chert) and feldspar in detrital rocks are chemically unstable [18,84], and they are easily dissolved under the influence of acidic fluids, which is mainly related to the organic acids from the metamorphism of organic matter in surrounding rocks. In the study area, the SDF and TC deposits are alternated or interbedded within the deep-water in situ organic-rich shale [37], coupled with the mass production of humic acid in stage A of middle diagenesis. It is easy for the unstable framework grains in the SDF and TC sediments to react with these acid fluids and produce abundant dissolution pores. In the study area, the dissolution pore content of the SDF samples ( x - = 4.47%) is higher than that in TC samples ( x - = 2.9%). This may be attributed to the higher primary porosity of the SDF sample relative to the that of the TC sample, because higher primary porosity favors the infiltration of humic acid into the reservoir and the dissolution of unstable framework grains.
Previous studies have shown that the current reservoir property is mainly a cumulative manifestation of sedimentary properties and subsequent diagenetic changes [85,86], such as the framework grain size and sorting, content, and type of cement [87]. However, in the study area, the porosity-affecting factors for the SDF and TC deposits are significantly different. The former is mainly controlled by the framework grain size, followed by the content of rigid grains and feldspar grains. But the latter is mainly controlled by the feldspar content of framework grains, followed by rigid grain content and framework grain size. Dissolution of unstable framework grains is the main diagenetic progress affecting the porosity in the study area, followed by compaction and cementation.

5.2. Controls on Permeability of Two Gravity Flow Reservoirs

5.2.1. Rock Texture

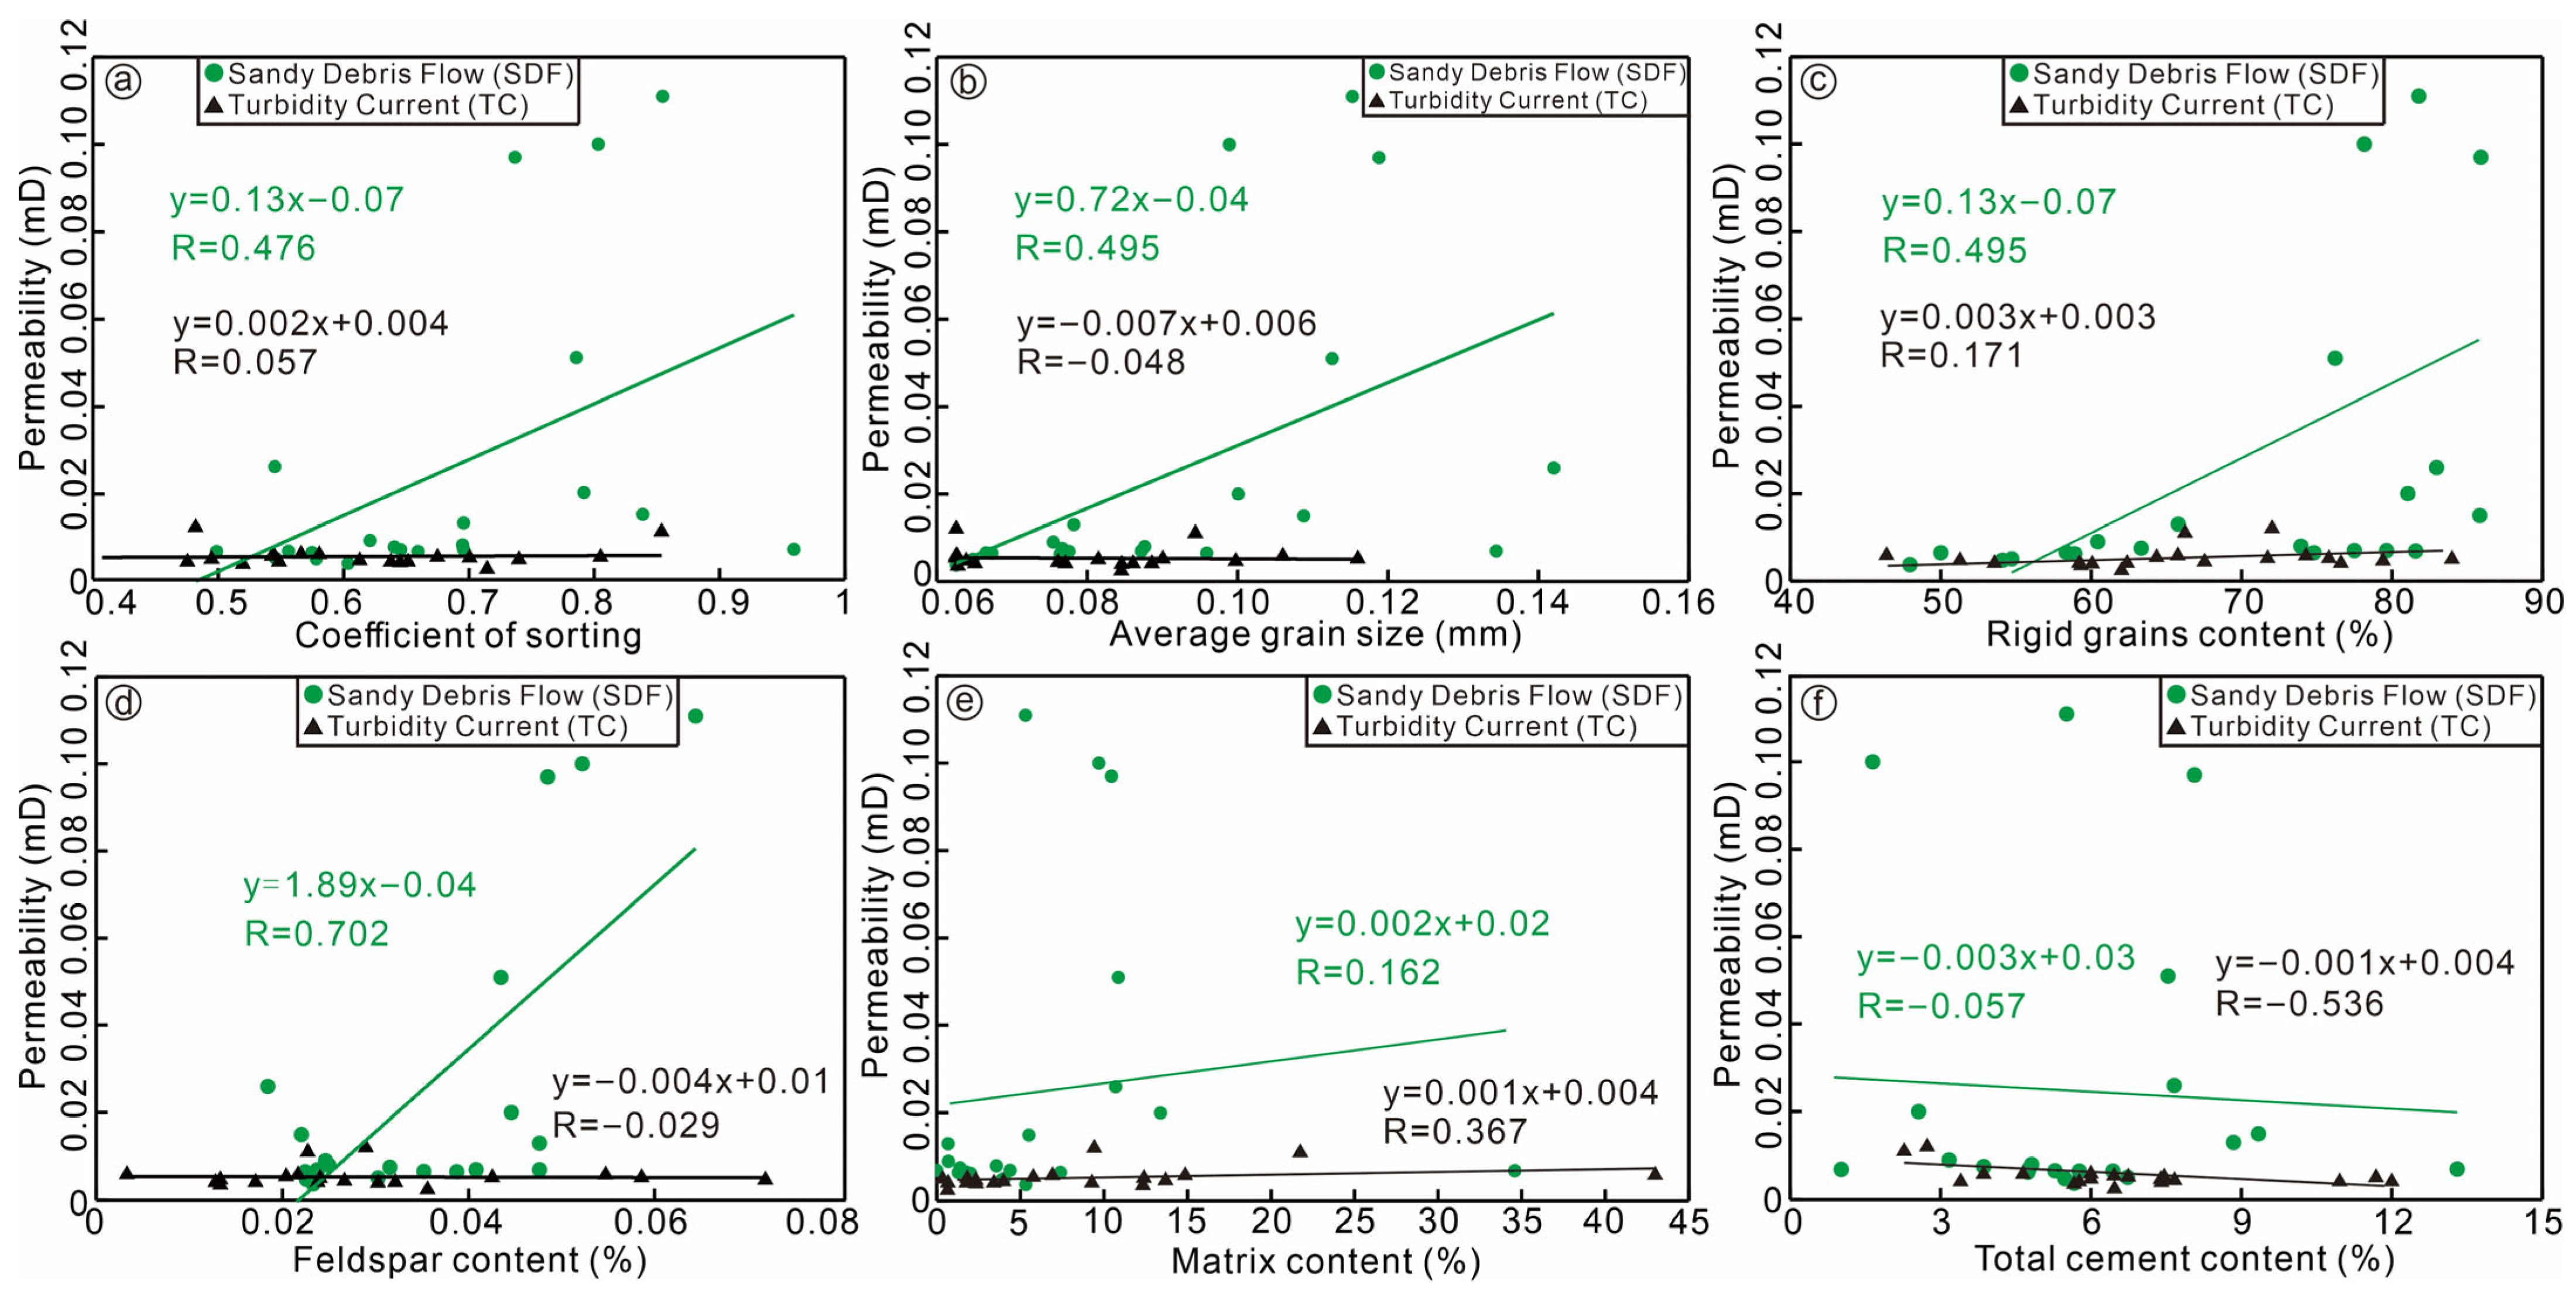
The correlation analysis of permeability with petrological indexes is shown in Figure 21. For the SDF samples, except for matrix content and cement content, the correlation coefficient values of permeability with feldspar grain content, framework grain size, rigid grain content, and framework grain sorting are 0.702, 0.495, 0.495, and 0.476, respectively (Figure 21a–d). Each of these values is higher than the critical correlation coefficient 0.433 (under 95% confidence level and 21 samples), indicating that they are the favorable factors in improving SDF reservoir permeability. As described in Section 4.3.1, the pore types of the SDF in the study area are mainly from the dissolution pores of feldspar, and the positive correlation of feldspar content with the porosity and permeability shows that the dissolution increased both the reservoir porosity and the pore throat size (namely the connectivity of the pore). At the same time, their contributions to the permeability are also reflected in the retention of primary pores, because these primary pores provide infiltration passages and dissolution reaction spaces for the subsequent acid fluid; they improve the reservoir porosity and connectivity and thus increase the reservoir’s permeability. As for the matrixes and cements of the SDF samples, clay minerals and fine silt grains, as the main components of matrixes, are insensitive to dissolution reaction. Meanwhile, although the calcareous cements are also partly dissolved, their contribution to porosity is small (7.1% of thin-section porosity). Therefore, there is no significant correlation between the permeability and the content of matrixes and cements.
For the TC samples, the permeability shows negative correlation with the cement content (R = −0.536, critical R value 0.456 under 95% confidence level, and 19 samples) (Figure 21f), but no correlation with framework grain sorting, framework grain size, rigid grain content, feldspar grain content, and matrix content (R = 0.057, −0.048, 0.171, −0.029, and 0.367, respectively) (Figure 21a–e), indicating that the rock texture has less effect on the TC reservoir’s permeability in the study area. The negative correlation of the cement content with the permeability indicates that cementation has a strong plugging effect on the pore throat system [17], which reduces the pore space, pore connectivity, and reservoir permeability.

5.2.2. Pore Throat Radius

The correlation analysis of permeability with the square of the median, maximum, and average pore throat radius (r250, r2max, and r2a, respectively) is shown in Figure 22a–c. For the SDF samples, the correlation coefficient values (R) of permeability with r250 and r2a are 0.762 and 0.787, respectively (Figure 22a,c), all higher than the critical correlation coefficient 0.755 (under 95% confidence level and seven samples). This indicates the positive correlation between them and the r50 and ra as the main affecting factors of SDF permeability. For the TC samples, the R values of permeability with the r250, r2max, and r2a are 0.94, 0.96, and 0.92, respectively (Figure 22a–c); they all exceed the critical correlation coefficient 0.811 (under 95% confidence level and six samples), indicating positive correlations between them, and the pore throat size, especially the r2max, is the main affecting factor in increasing TC permeability.
Compared with the rock texture indexes, the reservoir permeability in the study area (both SDF and TC) is more controlled by pore throat size, and similar phenomena were also observed in the Late Triassic Chang 7 and Xujiahe Members in the Ordos and Sichuan basins, respectively [88,89]. The pore throats, especially the larger ones, are considered the main controlling factor of reservoir permeability although their content accounts for a small part [90,91,92]. In addition, as shown in Figure 22a,c, the permeability of the SDF sample is more sensitive to the change in the r250 and r2a, indicating that the pore throat radius of each size range has a certain contribution to its permeability [91]. For the TC samples, the r2m is the more sensitive factor to permeability, indicating that the largest pore throat contributes more to the permeability [88,89,93], while the other pore throat contributes less to the permeability [74,88,94,95].

5.2.3. Sorting of Pore Throat Radius

The sorting coefficient of pore throat radius (SCPo) represents the dispersion degree of the pore throat radius values; the closer its value is to 1, the more concentrated the pore radius. In the study area, the SCPo values vary from 0.672 to 2.537 ( x - = 1.771). Because the SCPo results include values that are greater and less than 1, we use the corrected sorting coefficient (SCPc) to express the dispersion degree of the pore throat radius. SCPc is defined by |SCPo − 1|, and the ranges of corrected SCPc values are from 0.099 to 1.537 ( x - = 0.822) for all samples, 0.791 to 1.537 ( x - = 1.173) for the SDF samples, and 0.099 to 0.717 ( x - = 0.413) for the TC samples.
Correlation analysis of permeability with SCPc is shown in Figure 22d. The R value of permeability with SCPc from all samples is 0.627, which is greater than the critical correlation coefficient 0.553 (under 95% confidence level and 13 samples), indicating the positive correlation between them. For the SDF and TC samples, although their R values are all less than the critical correlation coefficients 0.755 and 0.811 (under 95% confidence level, seven and six samples, respectively), the sample permeability values all show a rising trend with the increasing SCPc values. These indicate that the increasing SCPc values (poor pore throat radius sorting) will improve the reservoir permeability. A similar phenomenon was also found in the Late Triassic Chang 8 Member in the Jiyuan area of the western Ordos Basin [95]. In the tight sandstone, poor sorting of pore throat radius indicates the presence of relatively large pore throats because the relatively small pore throats are ubiquitous. At the same time, the relatively large pore throats contribute more to permeability [88,89,93]. As a result, the permeability shows a rising trend with the increasing SCPc in the study area.

6. Conclusions

(1)
Petrological and sedimentological data reveal two deep-water gravity flow deposits comprising sandy detrital flow (SDF) and turbidity current (TC) deposits. Both are fine-grained lithic sandstone reservoirs, with low porosity (secondary dissolution pore as dominant pore type) and ultra-low permeability. Four diagenetic types are identified (compaction, cementation, metasomatism, and dissolution), and the widespread presence of dissolution indicates that the Anyao Formation is in stage A of middle diagenesis.
(2)
Compared with the TC samples, the average values of SDF are higher in the content (87.9% vs. 84.8%) and particle size (0.091 mm vs. 0.008 mm) of framework grains, porosity (6.97% vs. 3.44%), pore throat radius (0.102 μm vs.0.025 μm), and permeability (0.025 vs. 0.005 mD), but are relatively poor in the sorting of framework grain size (σ values 0.68 vs. 0.62) and pore throat radius (SCPo, 2.16 vs. 1.30).
(3)
The porosity-affecting factors in petrology for SDF reservoirs include framework grain size, rigid grain content, feldspar grain content, and framework grain sorting in descending order. However, for TC reservoirs they are feldspar grain content, rigid grain content, and framework grain size. The dissolution of framework grains is the most important porosity-affecting factor in diagenesis for both SDF and TC reservoirs. The permeability-affecting factors for SDF reservoirs are feldspar grain content, rigid grain content, framework grain size, framework grain sorting, and the median and average pore throat radius in descending order. In contrast, for TC reservoirs only the pore throat radius is a permeability-affecting factor, and the maximum pore throat radius has the greatest influence.
(4)
The difference in the gravity flow subphases in deep water directly affects the physical properties of reservoirs. Strengthening the study of gravity flow sub-facies is an important direction of future gravity flow reservoir research, so as to accurately explore and develop high-quality deep-water gravity flow reservoirs. It also provides a new idea for the accurate exploration and development of high-quality deep-water gravity flow reservoirs around the world.

Supplementary Materials

The following supporting information can be downloaded at: https://www.mdpi.com/article/10.3390/min15090888/s1, Table S1: Identification results of rock and ore deposits in Anyao Formation.

Author Contributions

J.L., Z.H., M.Y., and L.S. designed the research. J.L., Z.H., L.W., L.Y., K.Z., and P.Z. worked on the core description. Z.H. worked on the thin sections, capillary pressure measurements, and the FIB-SEM. J.L., Z.H., and M.Y. analyzed the data. J.L., Z.H., M.Y., L.S., P.T., and Z.C. wrote the manuscript. All authors have read and agreed to the published version of the manuscript.

Funding

This research was funded by the Science Fund for Creative Research Groups of the National Natural Science Foundation of China grant number 42321002, the National Natural Science Foundation of China grant numbers 42472227, 42172196, 41772161, and 41472131, and the Open Fund of National Energy Shale Gas Research and Development Centre grant number 2022-KFKT-14. And the APC was funded by 2022-KFKT-14.

Data Availability Statement

The original contributions presented in this study are included in the article. Further inquiries can be directed to the corresponding author.

Acknowledgments

We are grateful to Suping Peng and Shifeng Dai (China University of Mining and Technology Beijing) for their comments on earlier versions of the manuscript, and to Jason Hilton (University of Birmingham) for editing the manuscript. We also thank Xiao Bian, Lusheng Yin, Xue Peng, and others for their contributions to sample collection and data processing in this study (China University of Mining and Technology Beijing).

Conflicts of Interest

Minfang Yang and Lei Wang were employed by Petro China. Peter Turner was employed by the CanCambria Energy Corp. All authors declare that the research was conducted in the absence of any commercial or financial relationships that could be construed as potential conflicts of interest.

References

  1. Wang, F.; Chen, R.; Yu, W.; Tian, J.; Liang, X.; Tan, X.; Gong, L. Characteristics of lacustrine deepwater fine-grained lithofacies and source-reservoir combination of tight oil in the triassic chang 7 member in Ordos Basin, China. J. Pet. Sci. Eng. 2021, 202, 108429. [Google Scholar] [CrossRef]
  2. Xian, B.; Wang, J.; Gong, C.; Yin, Y.; Chao, C.; Liu, J.; Zhang, G.; Yan, Q. Classification and sedimentary characteristics of lacustrine hyperpycnal channels: Triassic outcrops in the south Ordos Basin, central China. Sediment. Geol. 2018, 368, 68–82. [Google Scholar] [CrossRef]
  3. Niu, X.; Yang, T.; Cao, Y.; Li, S.; Zhou, X.; Xi, K.; Thomas, J. Characteristics and formation mechanisms of gravity-flow deposits in a lacustrine depression basin: Examples from the Late Triassic Chang 7 oil member of the Yanchang Formation, Ordos Basin, Central China. Mar. Pet. Geol. 2023, 148, 106048. [Google Scholar] [CrossRef]
  4. Yang, T.; Cao, Y.; Wang, Y.; Zhang, S. Types, sedimentary characteristics and genetic mechanisms of deep-water gravity flows: A case study of the middle submember in Member 3 of Shahejie Formation in Jiyang depression. Acta Pet. Sin. 2015, 36, 1048–1059. [Google Scholar]
  5. Pan, S.; Liu, H.; Zavala, C.; Liu, C.; Liang, S.; Zhang, Q.; Bai, Z. Sublacustrine hyperpycnal channel-fan system in a large depression basin: A case study of Nen 1 Member, Cretaceous Nenjiang Formation in the Songliao Basin, NE China. Pet. Explor. Dev. 2017, 44, 860–870. [Google Scholar] [CrossRef]
  6. Cao, Y.; Wang, Y.; Gluyas, J.G.; Liu, H.; Liu, H.; Song, M. Depositional model for lacustrine nearshore subaqueous fans in a rift basin: The Eocene Shahejie Formation, Dongying Sag, Bohai Bay Basin, China. Sedimentology 2018, 65, 2117–2148. [Google Scholar] [CrossRef]
  7. Shanmugam, G. New perspectives on deep-water sandstones: Implications. Pet. Explor. Dev. 2013, 40, 316–324. [Google Scholar] [CrossRef]
  8. Peng, J.; Hu, Z.; Feng, D.; Wang, Q. Sedimentology and sequence stratigraphy of lacustrine deep-water fine-grained sedimentary rocks: The Lower Jurassic Dongyuemiao Formation in the Sichuan Basin, Western China. Mar. Pet. Geol. 2022, 146, 105933. [Google Scholar] [CrossRef]
  9. Talling, P.J.; Wynn, R.B.; Masson, D.G.; Frenz, M.; Cronin, B.T.; Schiebel, R.; Akhmetzhanov, A.M.; Dallmeier-Tiessen, S.; Benetti, S.; Weaver, P.P.E.; et al. Onset of submarine debris flow deposition far from original giant landslide. Nature 2007, 450, 541–544. [Google Scholar] [CrossRef]
  10. Yang, W.; Wu, M.; Yang, H.; Shi, F.; Liang, T. Sedimentary characteristics and tectonic significance of gravity flow deposits of the Lower Jurassic Anyao Formation in Jiyuan Basin Henan Province. J. Palaeogeo. 2017, 19, 433–444. [Google Scholar]
  11. Yang, T.; Cao, Y.; Tian, J. Discussion on research of deep-water gravity flow deposition in lacustrine basin. Acta Sedimentol. Sin. 2021, 39, 88–111. [Google Scholar]
  12. Yang, T.; Cao, Y.; Tian, J.; Niu, X.; Li, S.; Zhou, X.; Jin, J.; Zhang, Y. Deposition of deep-water gravity-flow hybrid event beds in lacustrine basins and their sedimentological significance. Acta Geolo. Sin. 2021, 95, 3842–3857. [Google Scholar]
  13. Li, J.; Liu, Z.; Xie, X.; Fang, Y. New understanding of deep-water gravity flow deposition mechanism and its application in the discovery of G oilfield in North sea. J. Palaeogeo. 2021, 33, 23–31. [Google Scholar]
  14. Zhang, J.; Li, S.; Li, H.; Zhou, X.; Liu, J.; Guo, R.; Chen, J.; Li, S. Gravity flow deposits in the distal lacustrine basin of the 7th reservoir group of Yanchang Formation and deepwater oil and gas exploration in Ordos Basin: A case study of Chang 73 sublayer of Chengye horizontal well region. Acta Pet. Sin. 2021, 42, 570–587. [Google Scholar]
  15. Lowe, D.R. Sediment gravity flows: Their classification and some problems of application to natural flows and deposits. In Geology of Continental Slopes; SEPM Special Publication: Tulsa, OK, USA, 1979; Volume 27, pp. 75–82. [Google Scholar]
  16. Middleton, G.V.; Hampton, M.A. Sediment gravity flows: Mechanics of flow and deposition. In Turbidity and Deep Water Sedimentation; Short Course Lecture Notes; Middleton, G.V., Bouma, A.H., Eds.; SEPM, Pacific Section: Fullerton, CA, USA, 1973; pp. 1–38. [Google Scholar]
  17. Lai, J.; Wang, G.; Ran, Y.; Zhou, Z.; Cui, Y. Impact of diagenesis on the reservoir quality of tight oil sandstones: The case of Upper Triassic Yanchang Formation Chang 7 oil layers in Ordos Basin, China. J. Pet. Sci. Eng. 2016, 145, 54–65. [Google Scholar] [CrossRef]
  18. Lai, J.; Wang, G.; Wang, Z.; Chen, J.; Pang, X.; Wang, S.; Zhou, Z.; He, Z.; Qin, Z.; Fan, X. A review on pore structure characterization in tight sandstones. Earth-Sci. Rev. 2018, 177, 436–457. [Google Scholar] [CrossRef]
  19. Ma, B.; Chen, S.; Yan, W.; Lin, C.; Zhang, H.; Sun, Z.; Zheng, J.; Wang, Y.; Wu, S.; Wang, J. Pore structure evaluation of low permeability clastic reservoirs based on sedimentation diagenesis: A case study of the Chang 8 reservoirs in the Zhenbei region, Ordos Basin. J. Pet. Sci. Eng. 2021, 196, 107841. [Google Scholar] [CrossRef]
  20. Cao, J.; Wang, Q.; Fan, L.; Yuan, X.; Wei, F. Deep water tight sandstone reservoir characteristics and diagenetic facies analysis: A case study of Chang 7 oil-bearing formation in Xifeng area, Ordos Basin, NW China. J. Northwest Univ. (Nat. Sci. Ed.) 2021, 51, 80–94. [Google Scholar]
  21. Zou, C.; Yang, Z.; Dong, D.; Zhao Qun Chen, Z.; Feng, Y.; Li, J.; Wang, X. Formation, distribution and prospect of unconventional hydrocarbons in source rock strata in China. Earth Sci. 2022, 47, 1517–1533. [Google Scholar]
  22. Jia, C.; Zheng, M.; Zhang, Y. Unconventional hydrocarbon resources in China and the prospect of exploration and development. Pet. Explor. Dev. 2012, 39, 129–136. [Google Scholar] [CrossRef]
  23. Zou, C.; Wang, L.; Li, Y.; Tao, S.; Hou, L. Deep-lacustrine transformation of sandy debrites into turbidites, Upper Triassic, Central China. Sediment. Geol. 2012, 265–266, 143–155. [Google Scholar] [CrossRef]
  24. He, Z. Evolution and Oil and Gas in the Ordos Basin; Petroleum Industry Press: Beijing, China, 2003. [Google Scholar]
  25. Gu, J. Development Review and Current Application of Petroleum Sedimentology. Acta Sedimentol. Sin. 2003, 21, 137–141. [Google Scholar]
  26. Li, X.; Chen, Q.; Liu, H.; Wan, Y.; Mu, J.; Liao, J.; Wei, L. Three types of sediment gravity flows and their petroliferous features of Yanchang Formation in Ordos Basin. Lithol. Reserv. 2010, 22, 16–21. [Google Scholar]
  27. Liao, J.; Zhu, X.; Deng, X.; Sun, B.; Hui, X. Sedimentary characteristics and model of gravity flow in Triassic Yanchang Formation of Longdong area in Ordos Basin. Earth Sci. Front. 2013, 20, 29–39. [Google Scholar]
  28. Liu, F.; Zhu, X.; Li, Y.; Xu, L.; Niu, X.; Zhu, S.; Liang, X.; Xue, M.; He, J. Sedimentary characteristics and facies model of gravity flow deposits of Late Triassic Yanchang Formation in southwestern Ordos Basin, NW China. Pet. Explor. Dev. 2015, 42, 577–588. [Google Scholar] [CrossRef]
  29. Zhao, J.; Liu, C.; Liang, J.; Wang, X.; Yu, L.; Huang, L.; Liu, Y. Restoration of the original sedimentary boundary of the Middle Jurassic Zhiluo Formation -Anding Formation in the Ordos Basin. Acta Geol. Sin. 2010, 84, 553–569. [Google Scholar]
  30. Liu, S.; Su, S.; Zhang, G. Early Mesozoic basin development in North China: Indications of cratonic deformation. J. Asian Earth Sci. 2013, 62, 221–236. [Google Scholar] [CrossRef]
  31. Yang, W.; Wang, M.; Du, Y. The depositional characteristics from Mesozoic Jiyuan Basin with its response to the uplift of Qinling Orogen and Taihang Mountains. Geol. Rev. 2014, 60, 260–274. [Google Scholar]
  32. Hu, B. The Late Triassic and Middle Jurassic continental strata of Jiyuan Basin in Henan Province. J. Stratigr. 1991, 15, 48–52. [Google Scholar]
  33. Wu, X. Trace fossils and their environmental significance in non-marine turbidite deposits from Jiyuan-Yima Basin, western Henan. Acta Sediment. Sin. 1985, 3, 23–31. [Google Scholar]
  34. Hu, B.; Zhang, L.; Qi, Y.; Guo, W. Sedimentary structures and environments of Lower Jurassic Anyao Formation, Jiyuan, Central China. J. Jiaozuo Inst. Tec. 2004, 23, 18–22. [Google Scholar]
  35. Hu, B.; Lu, X.; Song, H. Lower Triassic ichnofossils and sedimentary environments in the Dengfeng Area, Western Henan Province. J. Stratigr. 2015, 39, 454–465. [Google Scholar]
  36. Zhang, S. Deep-water sedimentary model and environmental evolution of the Anyao Formation in the Jiyuan Basin. Ph.D. Thesis, China University of Mining Technology, Beijing, China, 2020. [Google Scholar]
  37. Lu, J.; Zhang, P.; Dal Corso, J.; Yang, M.; Wignall, P.B.; Greene, S.E.; Shao, L.; Lyu, D.; Hilton, J. Volcanically driven lacustrine ecosystem changes during the Carnian Pluvial Episode (Late Triassic). Proc. Natl. Acad. Sci. USA 2021, 118, e2109895118. [Google Scholar] [CrossRef]
  38. Yang, W.; Yang, J.; Wang, X.; Du, Y. Geochronology from middle Triassic to middle Jurassic Detrital Zircons in Jiyuan Basin and its implications for the Qinling Orogen. Earth. Sci. 2012, 37, 489–500. [Google Scholar]
  39. Zhang, P.; Lu, J.; Yang, M.; Bond, D.P.G.; Greene, S.E.; Liu, L.; Zhang, Y.; Wang, Y.; Wang, Z.; Li, S.; et al. Volcanically-induced environmental and floral changes across the Triassic-Jurassic (T-J) transition. Front. Ecol. Evol. 2022, 10, 853404. [Google Scholar] [CrossRef]
  40. Chen, A.; Chen, H.; Hou, M. The Middle-Late Triassic event sediments in Ordos Basin: Indicators for episode I of the Indosinian Movement. Acta Geolo. Sin. 2011, 85, 1681–1690. [Google Scholar]
  41. Sun, Y.D.; Richoz, S.; Krystyn, L.; Zhang, Z.; Joachimski, M.M. Perturbations in the carbon cycle during the Carnian Humid Episode: Carbonate carbon isotope records from southwestern China and northern Oman. J. Geol. Soc. 2019, 176, 167–177. [Google Scholar] [CrossRef]
  42. Miall, A.D. Lithophacies types and vertical profile models in braided rivers: A summary. Fluv. Sedimentol. 1977, 5, 597–604. [Google Scholar]
  43. Walther, J. Einleitung in die Geologie als historische Wissen schaft. In Lithogenesis der Gegenwart; Fischer, G., Ed.; Forgotten Books: Jena, Germany, 1894; pp. 535–1055. [Google Scholar]
  44. GB/T 17361-2013; Microbeam Analysis—Identification of Authigenic Clay Mineral in Sedimentary Rock Menthod by Scanning Electron Microscope and Energy Dispersive Spectrometer. Standardization Administration of the People’s Republic of China: Beijing, China, 2013.
  45. Folk, R.L. Petrology of Sedimentary Rocks; Hemphill Publishing Company: Austin, TX, USA, 1980. [Google Scholar]
  46. Nichols, G. Sedimentology and Stratigraphy, 2nd ed.; Wiley-Blackwell: Chichester, UK, 2009; pp. 1–419. [Google Scholar]
  47. Buatois, L.A.; Mangano, M.G.; Wu, X.T.; Zhang, G.C. Trace fossils from Jurassic lacustrine turbidites of the Anyao Formation (central China) and their environmental and evolutionary significanc. Ichnos 1996, 5, 287–301. [Google Scholar] [CrossRef]
  48. Hu, B.; Jiang, Z.; Qi, Y.; Zhang, G. Trace fossils of deeper lacustrine deposits in the Paleogene Shahejie Formation of Jiyang depression, Shandong province, Eastern, China. Acta Palaeontol. Sin. 2006, 45, 83–94. [Google Scholar]
  49. Lv, Q.; Luo, S.; Fu, J.H.; Xiang, J.; Niu, X.; Gong, C.; Xu, L.M.; Feng, S.B.; Li, S.X. Outcrop-Based Analysis of a Deep-Water Gravity Flow Sediments in Lake:A Case Study from the Chang 7 of Yaoqu Section, Ordos Basin. Acta Geol. Sin. 2017, 91, 617–628. [Google Scholar]
  50. Shanmugam, G. 50 years of the turbidite paradigm (1950s–1990s): Deep-water processes and facies models—A critical perspective. Mar. Pet. Geol. 2000, 17, 285–342. [Google Scholar] [CrossRef]
  51. Stow, D.A.V. Sedimentary Rocks in the Field: A Colour Guide; Manson Publishing Ltd.: London, UK, 2005; p. 320. [Google Scholar]
  52. Liu, B.; Shao, L.Y.; Wang, W.; Huang, X.; Liu, W.; Zhang, S.; Zhang, H.; Lu, J. Sedimentary characteristics and deposition model of deep-water deposits dominated by gravity flow: A case study from the Lower Triassic in the Gonghe Basin. Acta Geol. Sin. 2020, 94, 1106–1127. [Google Scholar]
  53. Visher, G.S. Grain size distributions and depositional processes. J. Sediment. Res. 1969, 39, 1074–1106. [Google Scholar] [CrossRef]
  54. Shanmugam, G.; Lehtonen, L.R.; Straume, T.; Syvertsen, S.E.; Hodgkinson, R.J.; Skibeli, M. Slump and Debris-Flow Dominated Upper Slope Facies in the Cretaceous of the Norwegian and Northern North Seas (61-67øN): Implications for Sand Distribution. AAPG Bull. 1994, 78, 910–937. [Google Scholar]
  55. Fu, Y.; Li, Z.; Wan, P.; Que, Y.; Wang, Z.; Ji, Y.; Huang, L.; Luo, J.; Bao, Z. Sedimentary characteristics and controlling factors of slump gravity flow indelta front: A case study of Qing 1 member in Da’an area, Songliao Basin. Lithol. Reserv. 2021, 33, 198–208. [Google Scholar]
  56. Shanmugam, G. The Bouma Sequence and the turbidite mind set. Earth-Sci. Rev. 1997, 42, 201–229. [Google Scholar] [CrossRef]
  57. Shanmugam, G. Deep-Water Processes and Facies Models: Implications for Sandstone Petroleum Reservoirs: Handbook of Petroleum Exploration and Production 5; Elsevier: Amsterdam, The Netherlands, 2006; p. 476. [Google Scholar]
  58. Allen, J.R.L. Principles of Physical Sedimentology; George Allen & Unwin: London, UK, 1985; p. 272. [Google Scholar]
  59. Xia, J.; Liu, X.; Wang, Z.; Wen, W.; Tang, X. Sedimentary characteristics of sandy debris flow in the 3rd Member of Dongying Formation and the 1st Member of Shahejie Formation of the western Nanpu sag, Bohai Bay Basin and its significance in hydrocarbon exploration. Acta Pet. Sin. 2017, 38, 399–413. [Google Scholar]
  60. Li, Z.; Xu, Y.; Deng, J.; Li, Z.; Zhang, J.; Li, Y. Microscale sedimentary characteristics and distinguishing methods for deep-water sandy debris flow and turbidity flow in continental lakes: A case study of seventh member of Yanchang Formation, Ordos Basin. Pet. Geol. Exp. 2021, 43, 415–423. [Google Scholar]
  61. Cao, Y.; Jin, J.; Liu, H.; Yang, T.; Liu, K.; Wang, Y.; Wang, J.; Liang, C. Deep-water gravity flow deposits in a lacustrine rift basin and their oil and gas geological significance in eastern China. Pet. Explor. Dev. 2021, 48, 247–257. [Google Scholar] [CrossRef]
  62. Hiscott, R.N.; Middleton, G.V. Depositional Mechanics of Thick-Bedded Sandstones at the Base of a Submarine Slope, Tourelle Formation (Lower Ordovician), Quebec, Canada. Geol. Cont. Slopes 1979, 27, 307–326. [Google Scholar]
  63. Dott, R.H. Dynamics of Subaqueous Gravity Depositional Processes. AAPG Bull. 1963, 47, 104–128. [Google Scholar] [CrossRef]
  64. Crowell, J.C.; Hope, A.R.; Kahele, J.; Ovenshine, A.; Sams, R. Deep-Water Sedimentary Structures, Pliocene Pico Formation, Santa Paula Creek, Ventura Basin, California. AAPG Bull. 1964, 48, 522–523. [Google Scholar]
  65. Bouma, A.H. Sedimentology of Some Flysch Deposits: A Graphic Approach to Facies Interpretation; Elsevier: Amsterdam, The Netherlands, 1962; p. 168. [Google Scholar]
  66. Shanmugam, G. Ten turbidite myths. Earth-Sci. Rev. 2002, 58, 311–341. [Google Scholar] [CrossRef]
  67. Shanmugam, G. Deep-marine tidal bottom currents and their reworked sands in modern and ancient submarine canyons. Mar. Pet. Geol. 2003, 20, 471–491. [Google Scholar] [CrossRef]
  68. Li, X.; Liu, H.; Wan, Y.; Wei, L.; Liao, J.; Ma, Y. First discovery of the sandy debris flow from the Triassic Yanchang Formation, Ordos Basin. Lithol. Reserv. 2009, 21, 19–21. [Google Scholar]
  69. Yang, R.; Fan, A.; Han, Z.; van Loon, A.J.T. Lithofacies and origin of the Late Triassic muddy gravity-flow deposits in the Ordos Basin, central China. Mar. Pet. Geol. 2017, 85, 194–219. [Google Scholar] [CrossRef]
  70. Wang, Q.; Cao, J. Analysis and Evaluation of Main Controlling Factors of Chang8. Sino-Glob. Energy 2019, 24, 24–31. [Google Scholar]
  71. Lai, J.; Wang, G.; Chen, J.; Wang, S.; Zhou, Z.; Fan, X. Origin and distribution of carbonate cement in tight dandstones: The Upper Triassic Yanchang Formation Chang 8 Oil Layer in West Ordos Basin, China. Geofluids 2017, 2017, 8681753. [Google Scholar] [CrossRef]
  72. Kassab, M.A.; Hashish, M.F.A.; Nabawy, B.S.; Elnaggar, O.M. Effect of kaolinite as a key factor controlling the petrophysical properties of the Nubia sandstone in central Eastern desert. Egypt. J. Afr. Earth Sci. 2017, 125, 103–117. [Google Scholar] [CrossRef]
  73. Bjørlykke, K. Relationships between depositional environments, burial history and rock properties. Some principal aspects of diagenetic process in sedimentary basins. Sediment. Geol. 2014, 301, 1–14. [Google Scholar] [CrossRef]
  74. Bloch Salman Lander, R.H.; Bonnell, L. Anomalously high porosity and permeability in deeply buried sandstone reservoirs: Origin and predictability. AAPG Bull. 2002, 86, 301–328. [Google Scholar] [CrossRef]
  75. Reed, J.S.; Eriksson, K.A.; Kowalewski, M. Climatic, depositional and burial controls on diagenesis of Appalachian Carboniferous sandstones: Qualitative and quantitative methods. Sediment. Geol. 2005, 176, 225–246. [Google Scholar] [CrossRef]
  76. Zhang, J.; Qin, L.I.; Zhang, Z. Depositional facies, diagenesis and their impact on the reservoir quality of Silurian sandstones from Tazhong area in central Tarim Basin, western China. J. Asian Earth Sci. 2008, 33, 42–60. [Google Scholar] [CrossRef]
  77. Lai, J.; Wang, G.; Chai, Y.; Ran, Y.; Zhang, X. Depositional and diagenetic controls on reservoir pore structure of tight gas sandstones reservoirs: Evidence from Lower Cretaceous Bashijiqike Formation in Kelasu Thrust belts, Kuqa depression in Tarim Basin of West China. Resour. Geol. 2015, 65, 55–75. [Google Scholar] [CrossRef]
  78. Kordi, M.; Turnerc, B.; Salem, A.M.K. Linking diagenesis to sequence stratigraphy in fluvial and shallow marine sandstones: Evidence from the Cambrian–Ordovician lower sandstone unit in southwestern Sinai. Egypt. Mar. Pet. Geol. 2011, 28, 1554–1571. [Google Scholar] [CrossRef]
  79. Higgs, K.E.; Zwingmann, H.; Reyes, A.G.; Funnell, R.H. Diagenesis, porosity evolution, and petroleum emplacement in tight gas reservoirs, Taranaki basin, New Zealand. J. Sediment. Res. 2007, 77, 1003–1025. [Google Scholar] [CrossRef]
  80. Taylor, T.R.; Giles, M.R.; Hathon, L.A.; Diggs, T.N.; Braunsdorf, N.R.; Birbiglia, G.V.; Kittridge, M.G.; Macaulay, C.I.; Espejo, I.S. Sandstone diagenesis and reservoir quality prediction: Models, myths, and reality. AAPG Bull. 2010, 94, 1093–1132. [Google Scholar] [CrossRef]
  81. Zheng, J.; Pang, M. Diagenesis of Clastic Reservoir Rock; China University of Geosciences Press: Wuhan, China, 1989. [Google Scholar]
  82. Mørk, M.B.E. Diagenesis and quartz cement distribution of low-permeability Upper Triassic–Middle Jurassic reservoir sandstones, Longyearbyen CO2 lab well site in Svalbard, Norway. AAPG Bull. 2012, 97, 577–596. [Google Scholar] [CrossRef]
  83. Beard, D.C.; Weyl, P.K. Influence of texture on porosity and permeability of unconsolidated sand. AAPG Bull. 1973, 57, 349–369. [Google Scholar] [CrossRef]
  84. Morad, S.; Al-Ramadan, K.; Ketzer, J.M.; DeRos, L.F. The impact of diagenesis on the heterogeneity of sandstone reservoirs: A review of the role of depositional facies and sequence stratigraphy. AAPG Bull. 2010, 94, 1267–1309. [Google Scholar] [CrossRef]
  85. Nguyen, N.T.T.; Jones, S.J.; Goulty, N.R.; Middleton, A.J.; Grant, N.; Ferguson, A.; Bowen, L. The role of fluid pressure and diagenetic cements for porosity preservation in Triassic fluvial reservoirs of the Central Graben, North Sea. AAPG Bull. 2013, 97, 1273–1302. [Google Scholar] [CrossRef]
  86. Ajdukiewicz, J.M.; Lander, R.H. Sandstone reservoir quality prediction: The state of the art. AAPG Bull. 2010, 94, 1083–1091. [Google Scholar] [CrossRef]
  87. Mckinley, J.M.; Atkinson, P.M.; Lloyd, C.D.; Ruffell, A.H.; Worden, R.H. How porosity and permeability vary spatially with grain size, sorting, cement volume, and mineral dissolution in fluvial Triassic sandstones: The value of geostatistics and local regression. J. Sediment. Res. 2011, 81, 844–858. [Google Scholar] [CrossRef]
  88. Lai, J.; Wang, G.; Fan, Z.; Chen, J.; Wang, S.; Zhou, Z.; Fan, X. Insight into the pore structure of tight sandstones using NMR and HPMI measurements. Energy Fuels 2016, 30, 10200–10214. [Google Scholar] [CrossRef]
  89. Li, P.; Zheng, M.; Bi, H.; Wu, S.; Wang, X. Pore throat structure and fractal characteristics of tight oil sandstone: A case study in the Ordos basin, China. J. Pet. Sci. Eng. 2017, 149, 665–674. [Google Scholar] [CrossRef]
  90. Rezaee, R.; Saeedi, A.; Clennell, B. Tight gas sands permeability estimation from mercury injection capillary pressure and nuclear magnetic resonance data. J. Pet. Sci. Eng. 2012, 88–89, 92–99. [Google Scholar] [CrossRef]
  91. Schmitt, M.; Fernandes, C.P.; Wolf, F.G.; Neto, J.A.B.C.; Rahner, C.P. Characterization of Brazilian tight gas sandstones relating permeability and ang-strom-to micron-scale pore structures. J. Nat. Gas Sci. Eng. 2015, 27, 785–807. [Google Scholar] [CrossRef]
  92. Tian, X.; Cheng, L.; Cao, R.; Wang, Y.; Zhao, W.; Yan, Y.; Liu, H.; Mao, W.; Zhang, M.; Guo, Q. A new approach to calculate permeability stress sensitivity in tight sandstone oil reservoirs considering micro-pore-throat structure. J. Pet. Sci. Eng. 2015, 133, 576–588. [Google Scholar] [CrossRef]
  93. Xi, K.; Cao, Y.; Haile, B.G.; Zhu, R.; Jahren, J.; Bjørlykke, K.; Zhang, X.; Hellevang, H. How does the pore-throat size control the reservoir quality and oiliness of tight sandstones? The case of the Lower Cretaceous Quantou Formation in the southern Songliao Basin, China. Mar. Pet. Geol. 2016, 76, 1–15. [Google Scholar] [CrossRef]
  94. Dutton, S.P.; Loucks, R.D. Diagenetic controls on evolution of porosity and permeability in lower Tertiary Wilcox sandstones from shallow to ultradeep (200–6700 m) burial, Gulf of Mexico Basin, U.S.A. Mar. Pet. Geol. 2010, 27, 69–81. [Google Scholar] [CrossRef]
  95. Lai, J.; Wang, G.; Chai, Y.; Wu, D.; Yao, Y.; Zhang, Y.; Zhang, X.; Wang, D.; Li, M. Mechanism analysis and quantitative assessment of pore structure for tight sandstone reservoirs: An example from Chang 8 oil layer in the Jiyuan area of Ordos Basin. Acta Geol. Sin. 2014, 88, 2119–2130. [Google Scholar]
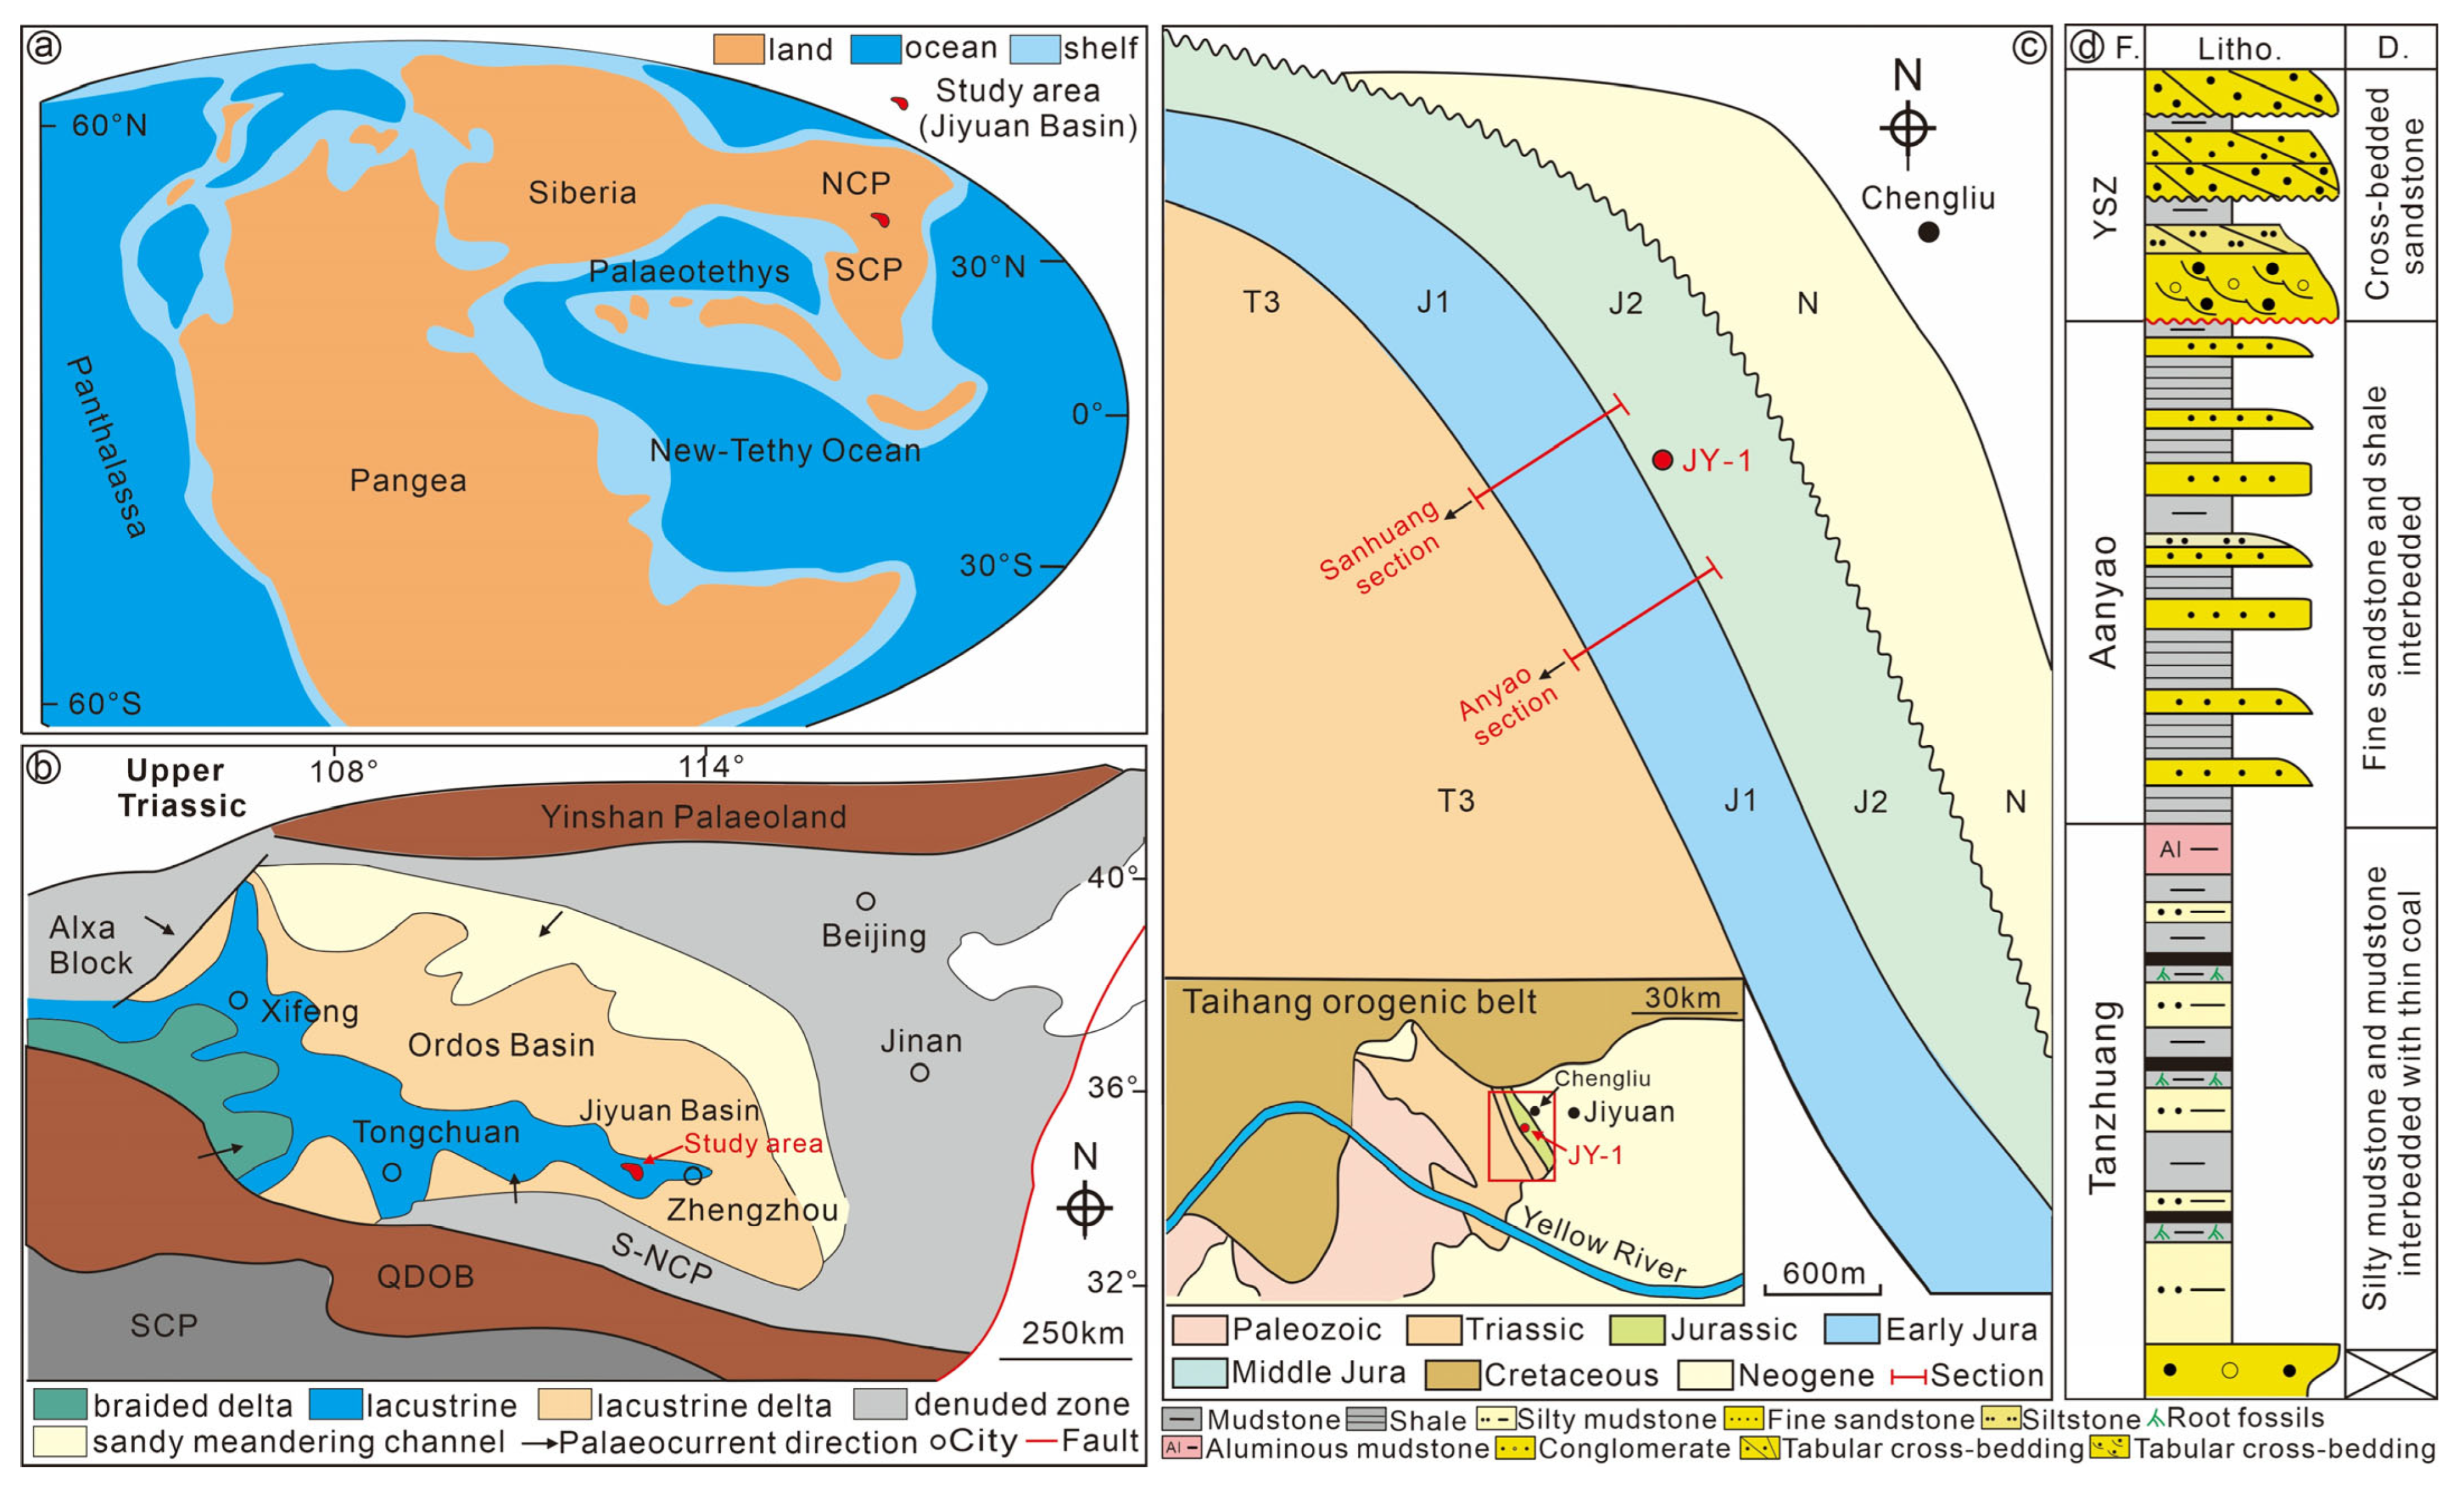
Figure 1. Location and geological context for the study area. (a) Global Late Triassic paleogeographic reconstruction, showing the location of North China Platform (NCP) (modified from Chen et al., 2011 and Sun et al., 2019) [40,41]; (b) structural paleogeographic map of NCP during the Late Triassic (revised after Liu et al., 2013) [30], showing the location of the Paleo-Ordos Basin and the Jiyuan Basin study area; (c) geological sketch map of the study area, showing the location of borehole (JY-1) and outcrop sections (Anyao village and Sanhuang sections); (d) lithology and dominant depositional environment of the Anyao Formation in Jiyuan Basin. Abbreviations: S-NCP: Southern North China Platform; SCP: South China Plate. QDOB: Qinling-Dabie Orogenic Belt.
Minerals 15 00888 g001
Figure 2. Test and analysis results of samples from the JY-1 borehole core section: (a) framework grain size; (b) porosity; (c) permeability; (d) framework grain composition and rigid grain content; (e) pore type and thin-section porosity; (f) sorting; (g) roundness; (h) compositional maturity. Abbreviations: Qt = quartz; F = feldspar; L = lithic fragment; Het = matrix; Cem. = cement; IL = intergranular dissolved pores; Ir = intragranular dissolved pores; C = cast film pores; Pri = primary intergranular pores; Mic = microcracks; P = angular; S = sub-angular; C = sub-rounded; red dots represent sandy debris flow (SDF) samples and blue dots represent turbidity current (TC) samples.
Minerals 15 00888 g002
Figure 3. Petrological and sedimentological characteristics of sandy debris flow (SDF) deposits and turbidity current (TC) deposits in in JY-1 borehole core: (a) sedimentary characteristics of thick SDF deposits, 212.2–214.3 m; (b) sedimentary characteristics of thin SDF deposits, 220.7–221.6 m; (c) sedimentary characteristics of multi-stage TC deposits, 259.4–261.5 m. Abbreviations: T.: top; B.: bottom.
Minerals 15 00888 g003
Figure 4. Sedimentary characteristics of sandy debris flow (SDF) in Aanyao section: (a) panoramic profile of interbedding between mid-thick block sandstone and deep lacustrine shale (lithofacies Sm and Sh); (b) massive sandstone shows sharp top and bottom contacts with deep lacustrine (DL) shale (lithofacies Sm and Sh); (c) mineralogical composition and textural characteristics of SDF deposit, orthogonal polarization, #An-1; (d) log-probability curves of framework grains size, #An-1. Abbreviations: Q: quartz; F: feldspar; L: lithic fragment; mc.: mud clast.
Minerals 15 00888 g004
Figure 5. Sedimentary characteristics of the tongue-like sandy debris flows (SDFs) in Sanhuang section: (a) tongue-like SDF deposition panoramic profile (lithofacies St and Sh); (b) SDF tongues, and with the sharp bottom contacts with deep lacustrine shale (lithofacies St and Sh); (c) mineralogical composition and textural characteristics of SDF deposit, orthogonal polarization, #Sa-1; (d) log-probability curves of framework grains size, #Sa-1. Abbreviations: Q: quartz; L: lithic fragment; mc.: mud clast.
Minerals 15 00888 g005
Figure 6. Petrological and sedimentological characteristics of sandy debris flow (SDF) deposits in JY-1 borehole core: (a,b) lower in situ deep lacustrine (DL) shale sudden upward change to sandstone; the sandstones can be divided into massive sandstones (49-1a and 49-1d, lithofacies Sm) and massive sandstones with mud clasts (49-1b, lithofacies Smm) of SDF, or parallel bedding sandstones of turbidity currents (TCs) (49-1c, lithofacies Sp); (c,d) SDF sandstone with floating mud clast in various shapes and mud chips in angular shapes; (e,f) mineralogical composition and textural characteristics of SDF deposit, plane, and orthogonal light, #49-1-1; (g) log-probability curves of framework grain size, #49-1-1. Abbreviations: Q: quartz; F: feldspar; L: lithic fragment; T.: top; B.: base.
Minerals 15 00888 g006
Figure 7. Sedimentary characteristics of turbidity currents (TCs) in Aanyao section: (a) the TC panoramic profile, normal graded bedding with the sharp bottom contacts with deep lacustrine shale, and with the flute casts on the bottom surface (lithofacies Sn, Sp, and Sh); (b) flute cast on the bottom bedding surface; (c) the TC panoramic profile, normal graded bedding (lithofacies Sn, Sp, Sw, Sm, and Sh); (d) normal graded bedding (lithofacies Sn, Sw, and Sh); (e) mineralogical composition and textural characteristics of TC deposit, orthogonal polarization, #An-2; (f) log-probability curves of framework grain size, #An-2. Abbreviations: Q: quartz; F: feldspar; L: lithic fragment; Ca: calcite; Cl.: clay.
Minerals 15 00888 g007
Figure 8. Petrological and sedimentological characteristics of turbidity current deposits (TCs) in JY-1 borehole core: (a,b) normal graded beds through siltstone to mudstone (53-8, lithofacies Ssm), normal graded sandstone and mudstone (53-9a, 53-9c, and 53-9d, lithofacies Sn and Mh), and parallel bedding sandstones of TC (53-9c, lithofacies Sp); (c) flute cast on the bottom bedding surface; (d) TC sandstone and deep lacustrine mudstone thin interbedded, normal grained bedding (lithofacies Ssm); (e) TC sandstone sharp bottom contact with deep lacustrine shale; (f,g) mineralogical composition and textural characteristics of turbidity flow sandstone, plane, and orthogonal light, #53-9-1; (h) log-probability curves of framework grain size, #53-9-1. Abbreviations: Q: quartz; F: feldspar; L: lithic fragment; Ca: calcite; Bt: biotite; Cl.: clay; T.: top; B.: base.
Minerals 15 00888 g008
Figure 9. Sedimentary characteristics of slump deposits (SP) in Sanhuang section: (a) SP panoramic profile, with main slip plane, secondary slip shear (SSP) plane, and undisturbed beds (lithofacies Sc and Spa); (b) internal contorted sandstone and mudstone (lithofacies Sc); (c) pillow-shaped sandstone (lithofacies Sps); (d) mineralogical composition and textural characteristics of SP deposit, orthogonal polarization, #Sa-2; (e) log-probability curves of framework grain size, #Sa-2. Abbreviations: Q: quartz; F: feldspar; L: lithic fragment; Ca: calcite; mc.: mud clast.
Minerals 15 00888 g009
Figure 10. Schematic diagram showing gravity-driven downslope processes in deepwater [54].
Minerals 15 00888 g010
Figure 11. Statistical box plot of sample petrological characteristics: (a) mean framework grain size; (b) quartz content; (c) feldspar content; (d) lithic fragment content; (e) matrix content; (f) cement content. Abbreviations: Total: samples total; SDF: sandy debris flow samples; TC: turbidity current samples.
Minerals 15 00888 g011
Figure 12. Triangular graph showing the mineralogical composition of gravity flow samples in the study area. Q: quartz; F: feldspar; R: lithic fragment.
Minerals 15 00888 g012
Figure 13. Main pore types for the gravity flow samples in the study are (a) primary intergranular pore (PIP) indicated by the yellow arrow, plane light, #25-2-2; (b) primary intergranular pore (PIP) in the quartz grain, plane polarized light, #27-1-1; (c) intragranular dissolution pores in feldspar grain, plane polarized light, #51-3-1; (d) intragranular dissolution pores (IDPs) from the dissolution of feldspar grain, SEM, #35-2-4; (e) intragranular dissolution pores (IDPs) from the dissolution of feldspar grain, SEM, #21-1 -2; (f) intergranular dissolution pores from the dissolution of carbonate cements (Dol: dolomite), orthogonal light, #29-1-1; (g) intragranular dissolution pores (IDPs) from the dissolution of lithic fragment, plane polarized light, #25-2-2; (h) cast film pores (CFPs) from the complete dissolution of framework grain, plane light, #25-2-2; (i) microcracks developed in the authigenic clay minerals (I/S: illite–montmorillonite mixed layer, Chl: chlorite), SEM, #51-3-3.
Minerals 15 00888 g013
Figure 14. Mercury injection test result for the samples in the study area: (a) sandy debris flow; (b) turbidity flow.
Minerals 15 00888 g014
Figure 15. Sample pore throat distribution interval in the study area.
Minerals 15 00888 g015
Figure 16. The relationship of porosity with thin-section porosity (a) and permeability (b) in the study area.
Minerals 15 00888 g016
Figure 17. Diagenesis types recognized under polarizing and scanning electron microscopy: (a) fractured quartz grain by compaction (Q: quartz, Ls: lithic fragment), #54-1-3, plane light; (b) deformed mica by compaction (Bit: mica), forming a pseudo-hetero group, #12-1-1, plane light; (c) carbonate cement between quartz grain (Dol: dolomite), #29-1-1, orthogonal light; (d) siliceous cement in the form of quartz overgrowth, #25-2-2, orthogonal light; (e) authigenic clay cement, #21-1-3, orthogonal light; (f) authigenic book-like kaolinite (Kao: kaolinite), #35-2-4, SEM; (g) curved sheet-like illite–montmorillonite mixed layer (I/S) and flaky illite (I), SEM, #35-2-4; (h) leafy chlorite (Chl: chlorite), SEM, #51-3-3; (i) intergranular carbonate cement, which is dissolved and forms the dissolution pore, orthogonal light; (j) dissolution pores from the dissolved intergranular carbonate cement, #29-1-1, orthogonal light; (k) quartz grain is replaced by calcite (Cal: calcite), #21-1-3, orthogonal light; (l) calcite cements between quartz grains is dyed red, #35-1-3, plane light.
Minerals 15 00888 g017
Figure 18. Main diagenetic types and diagenetic evolution of the Anyao Formation in the Jiyuan Basin [19,37].
Minerals 15 00888 g018
Figure 19. Correlation analysis of various factors on porosity: (a) the effect of sorting on porosity; (b) the effect of framework grain size on porosity; (c) the effect of rigid grain content on porosity; (d) the effect of feldspar content on porosity; (e) the effect of matrix content on porosity; (f) the effect of cement content on porosity.
Minerals 15 00888 g019
Figure 20. The relationship of intergranular volume (IGV) with cement volume. Note that destruction of porosity by mechanical compaction was more significant than by cementation [17,83].
Minerals 15 00888 g020
Figure 21. Correlation analysis of various factors of permeability: (a) effect of sorting on permeability; (b) particle size and permeability; (c) rigid particle content on permeability; (d) feldspar content on permeability; (e) matrix content on permeability; (f) cement content on permeability.
Minerals 15 00888 g021
Figure 22. Plots showing the relationship of displacement pressure with pore throat sorting coefficient. (a) Relationship between the square of the median pore throat radius and permeability; (b) relationship between the square of the maximum pore throat radius and permeability; (c) relationship between the square of the mean pore throat radius and permeability; (d) relationship between pore throat sorting coefficient and permeability.
Minerals 15 00888 g022
Table 1. Lithofacies of the Anyao Formation in the JY-1 borehole core, Anyao section and Sanhuang section.
CodeLithofaciesLithology Sedimentary FeaturesGeometryTypical PhotosFacies Association
SmMassive sandstoneFine
sandstone
Massive structure, sharp top and bottom contact with shale or gradual top contact with parallel bedding sandstoneThin–very thick (0.05–2.5 m) parallel-sided bedsFigure 3a, Figure 4a and Figure 6bSDF
SmmMassive sandstone with mud clastsFine
sandstone
Similar with lithofacies Sm except that containing floating mud clastsThin–very thick (0.05–2.5 m) parallel-sided bedsFigure 6b–dSDF
StTongue-like sandstoneFine
sandstone
Similar with lithofacies Sm except for the terminal tongue-like bodiesThin (0.05–0.1 m) parallel-sided bedsFigure 5aSDF
SnNormal graded sandstoneFine
sandstone
Normal graded bedding with erosional base and flute casts on the bottom surfaceThin–very thick (0.05–2.0 m) parallel-sided bedsFigure 3c, Figure 7a and Figure 8bTC
SsmNormal graded beds through siltstone to mudstoneSiltstone,
mudstone
Siltstone has sharp bottom contact with shale and gradual top contact with mudstoneVery thin (0.01–0.03 m) parallel-sided bedsFigure 8dTC
SpParallel bedding sandstoneFine
sandstone
Parallel bedding, gradual bottom contact with lithofacies Sm or Smm and sharp top contact with mudstoneMedium–thick (0.2–0.4 m) parallel-sided bedsFigure 4a, Figure 6b and Figure 8bTC
SwWavy bedding sandstoneFine
sandstone
Wavy bedding, gradual bottom contact with lithofacies Sn and sharp top contact with mudstoneVery thin–thin (2.0–5.0 cm) parallel-sided bedsFigure 7c,dTC
ScInternal contorted sandstone and mudstoneFine
sandstone, mudstone
Internal folding, with slip plane at the bottom of sandstoneThick (0.3–0.6 m) non-parallel bedsFigure 9bSP
SpsPillow-shaped sandstoneFine
sandstone
Load structures, developed at the bottom of sandstoneMedium (0.1–0.2 m), non-parallel bedsFigure 9cSP
ShBlack shaleShaleLaminated laminaThin–thick (0.1–1.0 cm), parallel-sided laminaFigure 3, Figure 4, Figure 5, Figure 6, Figure 7, Figure 8 and Figure 9DL
MhHorizontal bedding mudstoneMudstoneHorizontal beddingVery thin–thin (1.0–5.0 cm) parallel-sided bedsFigure 3c and Figure 8b DL
Disclaimer/Publisher’s Note: The statements, opinions and data contained in all publications are solely those of the individual author(s) and contributor(s) and not of MDPI and/or the editor(s). MDPI and/or the editor(s) disclaim responsibility for any injury to people or property resulting from any ideas, methods, instructions or products referred to in the content.