Article

Geochemical Characteristics and Hydrocarbon Generation Potential of Source Rock in the Baorao Trough, Jiergalangtu Sag, Erlian Basin

1
PetroChina Huabei Oilfield Company, Renqiu 062550, China
2
Key Laboratory of Tectonics and Petroleum Resources, Ministry of Education, China University of Geosciences, Wuhan 430074, China
3
The Research Institute, Bureau of Geophysical Prospecting Inc., China National Petroleum Corporation (CNPC), Zhuozhou 072750, China
*
Author to whom correspondence should be addressed.
Minerals 2025, 15(9), 1002; https://doi.org/10.3390/min15091002
Submission received: 16 July 2025 / Revised: 15 September 2025 / Accepted: 16 September 2025 / Published: 20 September 2025
(This article belongs to the Special Issue Organic Petrology and Geochemistry: Exploring the Organic-Rich Facies)

Abstract

The Baorao Trough of the Jiergalangtu Sag, located in the central Erlian Basin, is rich in petroleum resources. However, due to a lack of systematic geochemical characterization and comparative studies with other source rocks, the hydrocarbon generation potential of its Jurassic strata remains unclear. In this study, 125 samples from the Baorao Trough were analyzed to evaluate their hydrocarbon generation potential, identify organic matter sources and depositional environments, and characterize hydrocarbon generation and expulsion. Results show that source rocks from the first member of the Tengge’er (K1bt1) Formation and the Aershan (K1ba) Formation have high organic matter content, favorable kerogen types, and have reached low to medium maturity. In contrast, Jurassic source rocks are predominantly Type III kerogen and highly mature. K1bt1 was deposited in a weakly oxidizing to reducing, brackish environment, while K1ba formed under weakly reducing, saline conditions. Jurassic source rocks also developed in weakly reducing, brackish to saline settings. Notably, saline and reducing environments promote the development of high-quality source rocks. The lower total organic carbon (TOC) threshold for effective source rocks in the study area is 0.8%, and the hydrocarbon expulsion threshold for vitrinite reflectance ratio (Ro) is approximately 0.8%. Accordingly, K1bt1 and K1ba have undergone partial hydrocarbon expulsion but remain within the oil-generating window, indicating strong oil-generating potential. Jurassic source rocks likely experienced early thermal cracking of Type III kerogen, with generated oil migrating or escaping during early geological activity. However, some gas-generating potential remains. These findings provide significant evidence for assessing resource potential, predicting the distribution of high-quality source rocks and favorable exploration areas.

1. Introduction

Source rock is the fundamental material for hydrocarbon generation, and favorable source rock conditions are essential for the formation of medium to large oil and gas reservoirs [1,2]. The Jirgalangtu Sag in Erlian Basin is a significant petroliferous area in northern China, where heavy oil reservoirs, conventional oil reservoirs, and shallow gas reservoirs have been successively discovered [3,4]. Previous studies have identified three sets of potential source rocks within the Erlian Basin: the second member of Tengge’er (K1bt2) Formation, the first member of Tengge’er Formation (K1bt1)—Aershan (K1ba) Formation, and the Jurassic strata [5,6].
In the eastern trough of the Jirgalangtu Sag, source rocks are shallowly buried and thermally immature, making large-scale hydrocarbon generation and expulsion unlikely. As a result, early drilling efforts yielded no significant discoveries. Current exploration is focused on the central and western troughs, where surrounding oil and gas reservoirs demonstrate the controlling role of source rocks in hydrocarbon distribution [7,8]. The Jurassic strata, deeply buried in the central troughs, have not been previously penetrated by wells. Based on Jurassic source rocks encountered at high structural position on the western trough slope, earlier studies reported low organic matter abundance (TOC = 0.30~0.97%) and poor hydrocarbon generation potential [9]. Similarly, the K1bt2 Formation, due to its shallow burial and low thermal maturity, also lacks the capacity for large-scale hydrocarbon generation and expulsion. Consequently, the hydrocarbons discovered in the region are believed to have originated from the K1bt1 and K1ba Formations [6,7,10]. However, spatial variations in sedimentary facies mean that source rock properties in high slope areas may not accurately represent those in the sag center. Jurassic source rocks’ development and hydrocarbon potential in the sag center remain poorly understood, primarily due to the lack of available samples. The newly drilled L29X well in the central trough in 2024 revealed the presence of Jurassic black mudstones for the first time, challenging the prevailing view that the Cretaceous is the sole source rock.
To address the above issues, source rock samples from the Jurassic, K1ba, and K1bt1 Cretaceous Formation in well L29X were systematically collected, and a comprehensive analysis was conducted, including total organic carbon (TOC), Rock-Eval pyrolysis, organic matter extraction and separation, saturated hydrocarbon gas chromatography (GC), and gas chromatography–mass spectrometry (GC–MS). This study aims to clarify the conditions for organic matter enrichment, evaluate the hydrocarbon generation potential, and elucidate the processes of hydrocarbon generation and expulsion. The results will provide critical insights into the origin of hydrocarbons, migration pathways, resource potential, and the distribution of high-quality source rocks, thereby supporting exploration efforts in the region.

2. Geological Setting

The Erlian Basin, located in northern China (Figure 1a), is a Mesozoic–Cenozoic sedimentary basin developed upon a Paleozoic folded basement formed during the Hercynian tectonic movement. Structurally, the basin extends from the Daxing’anling Uplift in the east to the Solunshan Uplift in the west, from the Wenduermiao Uplift in the south to the Bayanbaolige Uplift in the north. It is approximately 1000 km long east–west, 20 to 220 km wide north–south, and covers an area of approximately 100,000 km2 [11,12]. It comprises a group of Mesozoic–Cenozoic rifted lake basins, including 54 small sags, each with an independent depositional system (Figure 1b) [13,14].
The Jiergalangtu Sag is located southwest of the Sunite Depression in the central Erlian Basin (Figure 1b). It extends approximately 45 km east–west and 10–15 km north–south, covering an area of about 600 km2. The maximum burial depth of the Lower Cretaceous reaches about 3500 m. Structurally, it is a half-graben depression trending NE–SW, characterized by a south-dipping boundary fault and northward onlap (Figure 1c) [6,15,16]. The sag comprises three troughs: eastern, central, and western. The central trough is the main hydrocarbon generation zone, with current exploration efforts focused on the central and western parts.
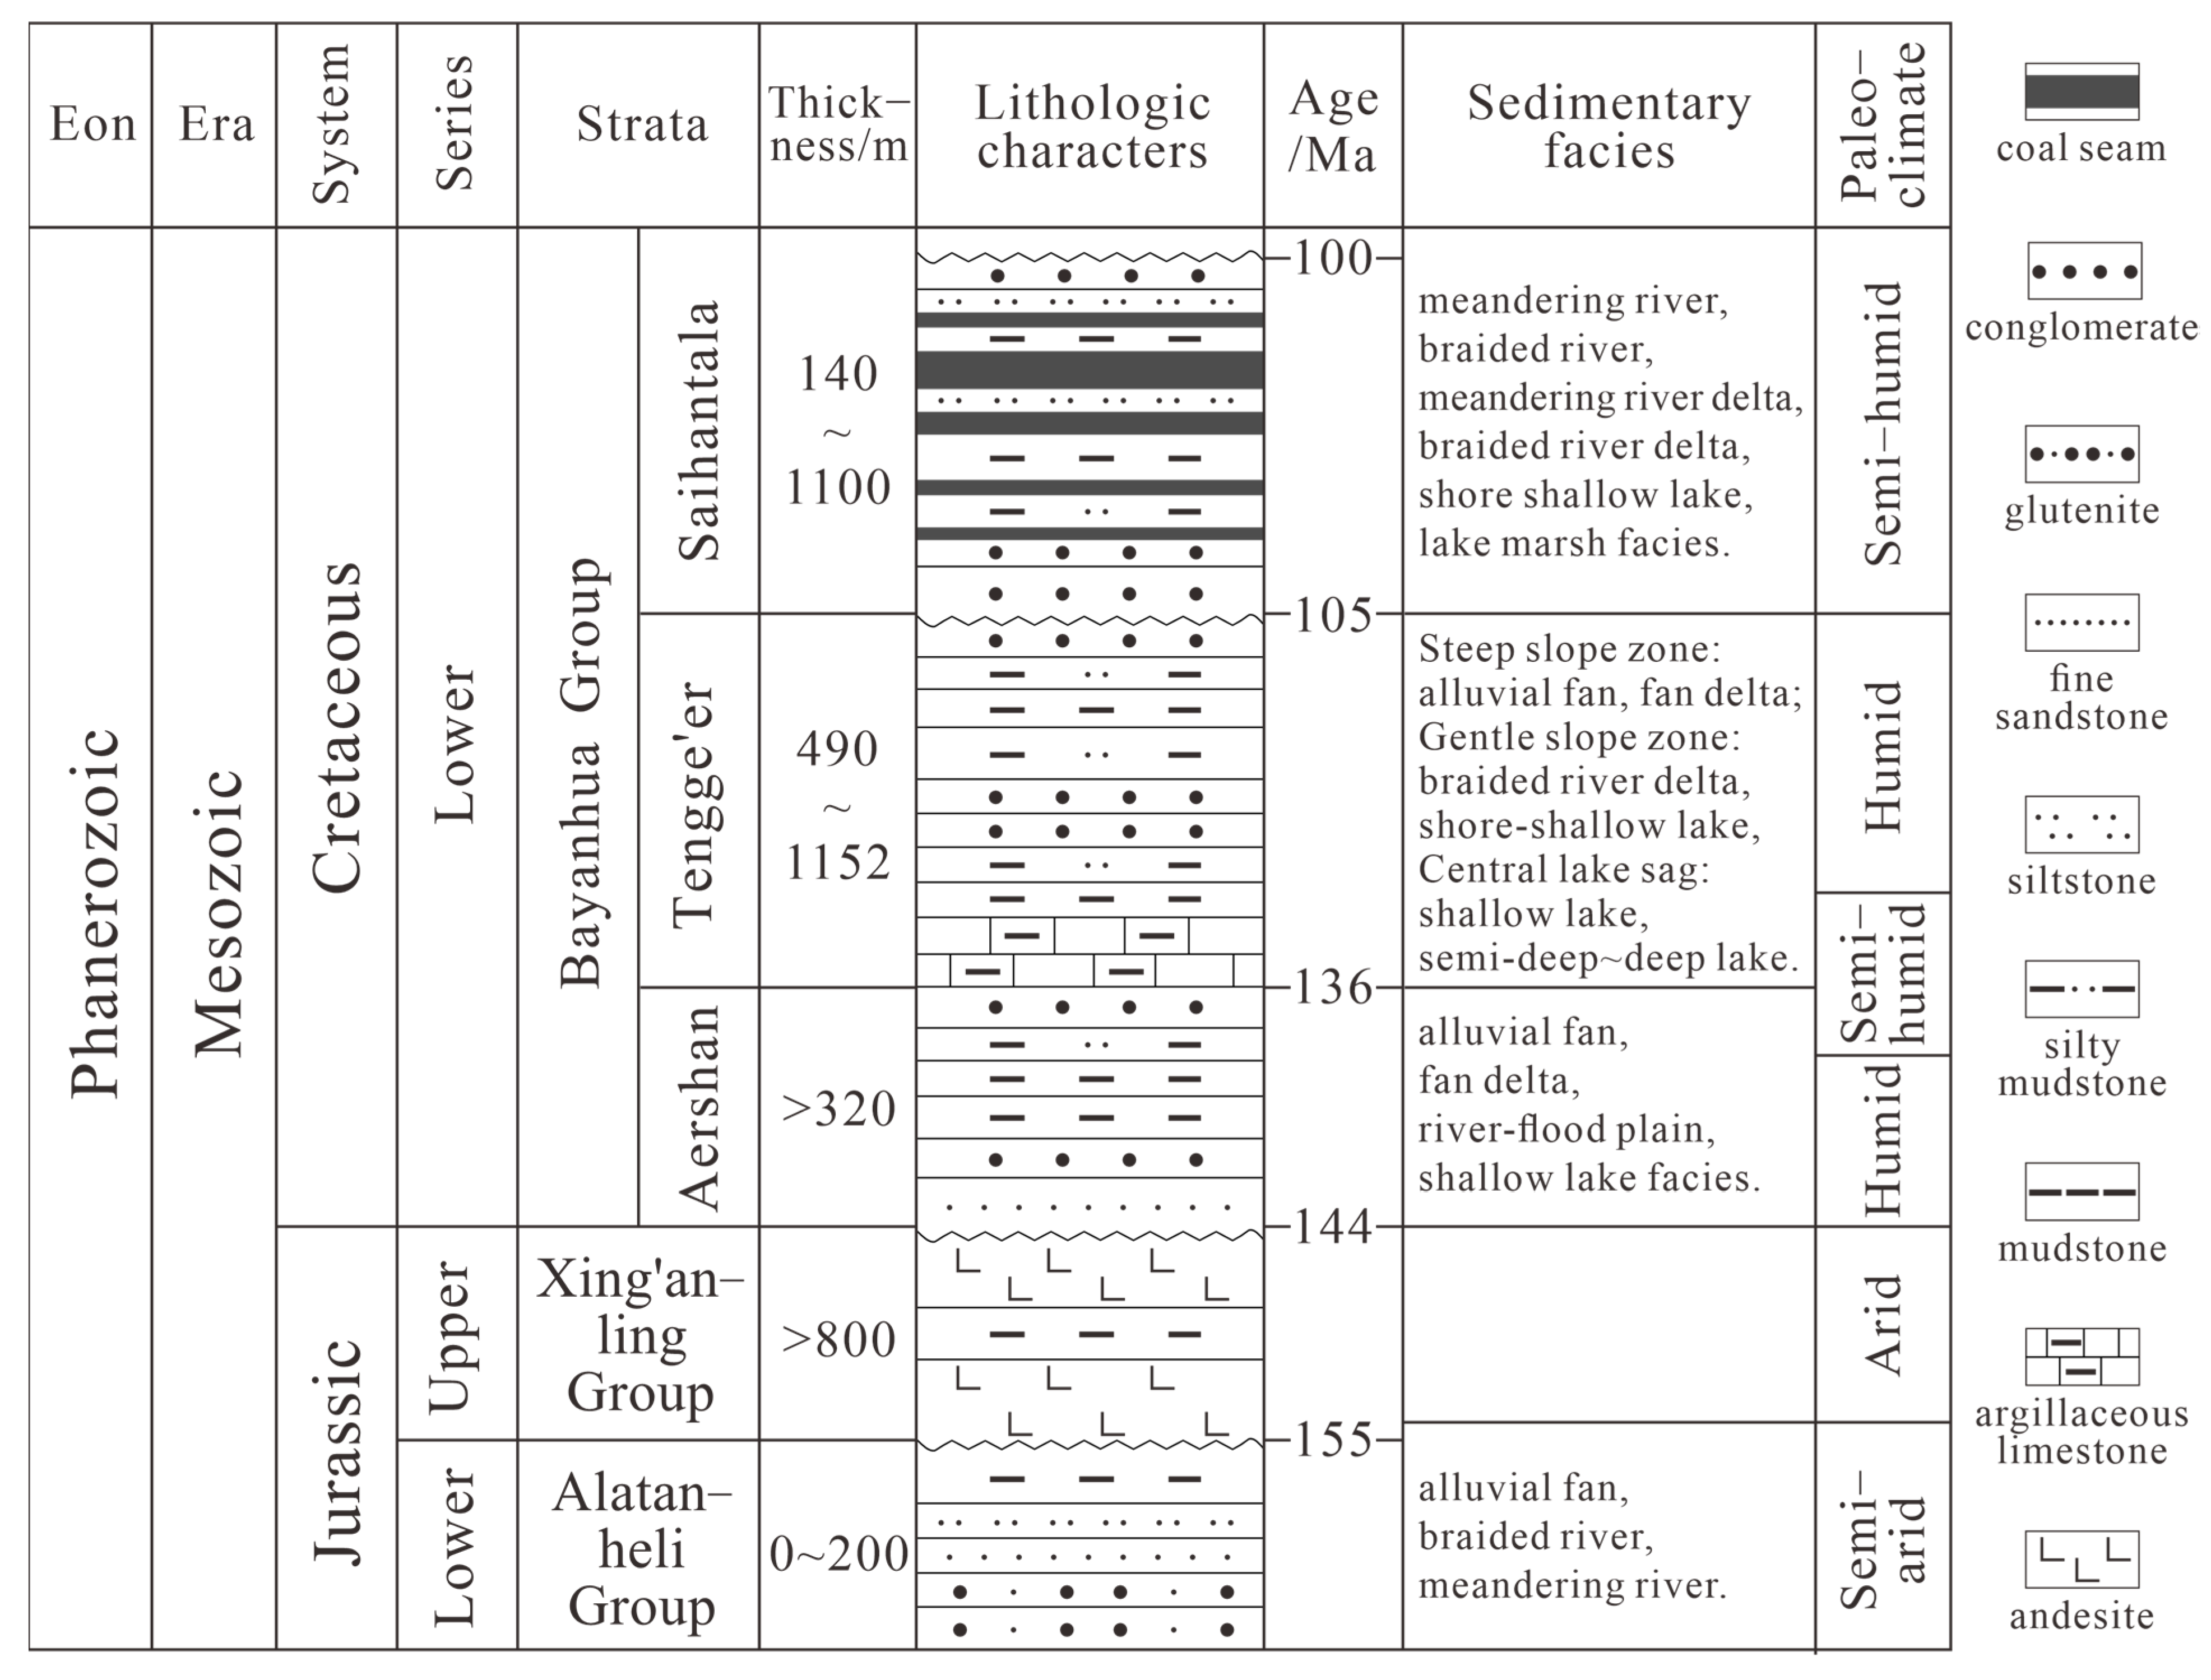
The sedimentary strata of Erlian Basin are predominantly Mesozoic, with Triassic deposits largely absent across most areas, including the Jiergalangtu Sag. The stratigraphic sequence consists of Jurassic and Cretaceous formations, with the latter subdivided into Aershan (K1ba), Tengge’er (K1bt), and Saihantala (K1bs) formations (Figure 1d and Figure 2). During the early and Middle Jurassic, the Jiergalangtu Sag developed the Alatanheli Group, composed of a set of fluvial–lacustrine sandstone, conglomerate, and relatively thinner-layered dark mudstone. These sediments were deposited in irregular, low-lying areas in a filling-type pattern. In the Late Jurassic, intense tectonic inversion along basement fault zones triggered large-scale volcanic eruptions. The remaining thickness of the Alatanheli Formation is approximately 0~200 m [17]. Subsequently, the Jiergalangtu Sag developed a thick volcanic sequence of the Xing’anling Group, mainly consisting of andesite. During volcanic hiatuses, these fluvial–lacustrine deposits formed, including gray mudstone thin layers [18]. In the Early Cretaceous (Aershan Formation), the Yanshan Movement caused lava overflow and initiated rifting, leading to the expansion of lake basins.
On the basin margins, coarse-grained, impurity-rich silty mudstone and conglomerate were deposited. However, the limited sediment supply led to only small underwater fans being formed at the basin edges. In the central depression, thick layers of dark mudstone and dolomitic mudstone rich in oil-generating material accumulated. During the middle Cretaceous stage (between the deposition of K1bt1 and K1bt2), two large-scale lake transgressions occurred. The first member of the K1bt1 Formation saw the longest and most extensive transgression, marking the main stage of lake basin development. The sedimentation was dominated by lacustrine facies, producing fine clastic rocks, such as calcareous mudstone, dolomitic mudstone, and dark gray mudstone. In the Baorao Trough, multiple deltas developed, with the sedimentary system characterized by proximity to the sediment source, narrow facies belts, and rapid lateral variations [6]. Throughout the Baorao Trough’s deposition, the initial subsidence phase was substantial. Later regional uplift caused erosion of overlying strata, with maximum denudation occurring after the Saihantala Formation deposition. Before the Late Cretaceous (prior to the middle Saihantala deposition), the Jiergalangtu Sag existed as a unified catchment lake basin. However, intense tectonic reactivation ended the Saihantala sedimentation and divided the basin into three troughs along the Baorao–Baofeng and Hani–Xilin transverse structural belts [19,20].
Figure 2. Comprehensive stratigraphic column of the Jiergalangtu Sag [21,22].
Minerals 15 01002 g002
The study area, the Baorao Trough, is located in the central Jirgalangtu Sag (Figure 1c) and covers approximately 320 km2. It consists of three structural elements: the northern steep-slope Hani Structural Belt, the southern gentle-slope Baorao Structural Belt, and the central depression zone, which forms the sag’s principal hydrocarbon-generating trough [7]. The Baorao Trough has significant oil and gas exploration potential, with an estimated resource of 35 million tons. By the end of 2024, cumulative proven reserves reached 10.25 million tons, leaving substantial resources untapped (data from Huabei Oilfield Company, Renqiu, China).

3. Samples and Methods

3.1. Samples

Samples were collected from the K1bt1, K1ba, and Jurassic formations in the Baorao Trough (Xilinhot, China), which consist mainly of gray and dark gray mudstones, deposited in shallow lacustrine settings. A total of 125 samples were taken from eight wells (J55, L7, J58, J59, L4-37X, L29X, J43, and L15) along the west–east axis of the trough (Figure 1c). Of these, 29 samples came from the Cretaceous K1bt1 formation, 70 samples from the Cretaceous K1ba formation, and 26 samples from the Jurassic strata. Notably, four wells (J58, J59, J43, and L15) are located in the trough slope zone, where drilling depths and formation depth ranges vary, reflecting the oilfield company’s selective coring strategy (non-full-well coring). Accordingly, most samples from the K1ba Formation, which developed originally below the K1bt1 Formation, are currently at shallower actual depths than the K1bt1 samples in this study. This phenomenon of stratigraphic depth inversion is noted here to prevent ambiguity in the discussions and figures below (e.g., scatter plots of depth versus geochemical parameters). All samples were immediately packed into wooden boxes for transportation after being collected. They were placed in a sample storage room with a constant setting, with a temperature of 24 °C, a humidity of 45%, and protected from light until tested within 20 days.
To assess the abundance, type, and maturity of organic matter and evaluate the hydrocarbon generation potential of source rocks, all samples were analyzed for total organic carbon (TOC) and rock pyrolysis analysis; 18 samples were analyzed for vitrinite reflectance (Ro), 16 samples were analyzed for organic elemental composition, and 10 samples were analyzed for kerogen carbon isotope. To investigate the origin of organic matter and depositional environments, 19 samples were analyzed using gas chromatography (GC) and gas chromatography–mass spectrometry (GC–MS). All analyses were performed at the Central Laboratory of Geological Sciences, Exploration and Development Research Institute, PetroChina Huabei Oilfield Company.

3.2. Methods

Rock debris samples were carefully selected to remove impurities, including drilling mud particles and barite. Core and cutting samples were cleaned with distilled water, dried in an oven at 45 °C for 12 h, and then pulverized to 100 mesh. Pretreatment was performed to remove inorganic carbon prior to TOC analysis. Finely ground samples were treated with an excess of dilute HCl (H2O: HCl = 7:1 by volume) and heated in a 60 °C water bath for over 2 h. The samples were rinsed with distilled water to neutral PH and dried at 60 °C. TOC content was measured using a LECO CS-844 carbon–sulfur analyzer, with O2 as the combustion-supporting gas, adjusted to 0.25 MPa, following the Chinese National Standard GB/T 19145-2022 [23].
The Rock-Eval pyrolysis was conducted using a Rock-Eval 6 analyzer, in accordance with the Chinese National Standard GB/T 18602-2012 [24]. Measured parameters included free and volatile hydrocarbon (S1) released at 300 °C; remaining hydrocarbon-generating potential (S2) during progressive heating from 300 °C to 650 °C; and the temperature of maximum pyrolysis yield (Tmax).
For major elements analysis, approximately 1.0 g of powdered sample was weighed into a porcelain crucible and combusted in a muffle furnace at 1000 °C for 4 h to remove organic matter and carbonate with mass loss recorded. The ashed sample was mixed with 0.3~0.4 g ammonium nitrate (NH4NO3) and 6 g Li2B4O7-LiBO2-LiF flux in a platinum crucible, then fused at 1050 °C for 10 min to produce a glass bead. Major element concentrations were determined using a Rigaku 100e X-ray fluorescence spectrometer (Rigaku, Akishima, Japan), with analytical precision better than ±5% following the Chinese National Standards GBW07107 [25]. The chemical index of alteration (CIA) was calculated as CIA   =   molar   [ Al 2 O 3 / ( Al 2 O 3   +   CaO *   +   Na 2 O   +   K 2 O ) ]   ×   100 , where CaO* represents the concentration of CaO in the silicate fraction, derived from a formula based on P2O5 content ( CaO *   =   molar   CaO - 10 / 3   ×   molar   P 2 O 5 ) [26]. If the calculated CaO* is lower than Na2O, CaO* can be directly adopted to calculate CIA, otherwise, it is replaced with Na2O [27].
Kerogen preparation followed the Chinese National Standards GB/T 19144-2010 [28] prior to vitrinite reflectance, kerogen elemental, and kerogen carbon isotope analyses. Source rock samples were treated sequentially with 15% HCl, a mixture of 15% HCl and 40% HF (1:3 by volume), and 15% HCl (heated in a water bath at 80 °C) to dissolve minerals, then repeatedly washed with ultrapure water to neutral PH and dried to obtain kerogen. The isolated kerogen powder was placed into fixed molds, impregnated with epoxy resin for cold curing, and after solidification, ground and polished using an automatic grinding polisher with alumina suspension. Polished thin section surfaces were examined under a 20× dry objective to ensure the absence of stains, scratches, and unclear boundaries. After drying, random reflectance measurements were taken using a Leica DM4500P polarizing microscope (Leica Microsystems, Wetzlar, Germany) with a 50× objective and an MPM-80 photometer (PerkinElmer, Waltham, MA, USA). Calibration was conducted using yttrium aluminum garnet (Ro = 0.90%), gadolinium gallium garnet (Ro = 1.72%), and cubic zirconia (Ro = 3.17%) in line with the actual reflectance range of the samples. To account for optical variability among vitrinite particles within the same sample, multiple measurements were taken to ensure the representativeness: at least 30 points when the mean Ro was ≥2.0% and at least 20 points when Ro was between 0.5% and 2.0%. The analysis followed the Chinese Industry Standard SY/T 5124-2012 [29], with a standard deviation below 0.2%.
The organic elemental composition (C, H, N, and O) of kerogen samples was measured using a Thermo FLASH EA1112. Helium was used as the carrier gas at a constant flow rate of 150 mL/min. For carbon, hydrogen, and nitrogen analysis, the column temperature and the left oven were set to 65 °C and 950 °C, respectively. For oxygen analysis, the carrier gas flow rate was 130 mL/min, with the column and right oven temperature set to 75 °C and 1060 °C, respectively. The analytical accuracy was better than ± 0.1% (1 sd, n = 9) using IVA33802180 (C = 0.83%, S = 0.014%, N = 0.07%), IVA33802150 (C = 7.45%, S = 0.62%, N = 0.52%), and B2162 (C = 46.47%, S = 0.78%, N = 10.75%) as reference material for calibration, following the Chinese National Standard GB/T 19143-2017 [30].
Kerogen carbon isotope (δ13C) analysis was performed using a Thermo EA IsoLink-MAT 253 Plus IRMS (Thermo Fisher Scientific, Waltham, MA, USA) with pure CO2 as the standard gas, helium as the carrier gas, and reference gas at a constant rate of 180 mL/min and 70 mL/min, respectively; oxygen was used as the combustion-supporting gas at 250 mL/min. The reaction oven and GC oven temperatures were set to 960 °C and 50 °C. Calibration and isotope calculation were performed against three international reference materials—USGS61 (δ13C = −35.05‰), USGS43 (δ13C = −21.28‰), and USGS62 (δ13C = −14.79‰)—with analytical precision better than ± 0.2‰ (1 sd, n = 9), following the Chinese Industry Standard SY/T 5238-2019 [31].
Organic matter was first extracted to analyze biomarkers. First, the samples were enclosed in filter paper cartridges after being crushed to 100 meshes, placed in the extractor chamber, and heated in a 50~60 °C water bath while being continuously extracted with chloroform to obtain chloroform bitumen “A”. Asphaltenes were removed from the extracts by precipitation with n-hexane. The resulting maltenes were separated on a silica gel/alumina column (activated at 150 °C for 12 h) using sequential elution with n-hexane, n-hexane/dichloromethane (1:1 by volume), and dichloromethane/methanol (95:5 by volume) to obtain saturated, aromatic, and resin fractions, respectively. Quantitative analysis of saturated hydrocarbon was performed using GC and GC–MS, following the Chinese National Standards GB/T 18340.5-2010 [32] and GB/T 18606-20 [33].
Gas chromatography (GC) of saturated hydrocarbons was performed on an Agilent 6890N (Agilent Technologies, Santa Clara, CA, USA) equipped with a 30 m × 0.20 mm × 0.25 μm PONA fused silica capillary column, using N2 as the carrier gas at a flow rate of 1.0 mL/min. The oven was programmed at 50 °C for 10 min, then ramped to 310 °C at 4 °C/min, and finally held at 310 °C for 40 min. The injection and detector temperatures were set to 310 °C. Gas chromatography–mass spectrometry (GC–MS) of the saturated hydrocarbon fraction was performed on a Thermo 1300-ISQ (Thermo Fisher Scientific, Waltham, MA, USA) with a 30 m × 0.20 mm × 0.25 μm HP-5MS fused silica capillary column, using helium as the carrier gas at a constant flow rate of 1.0 mL/min. The vaporizing chamber and transfer line temperatures were 310 °C and 300 °C, respectively. The oven was held at 50 °C for 1 min, then ramped to 100 °C at 20 °C/min, then to 310 °C at 3 °C/min, and held for 20 min. Analyses were run in electron impact (EI) mode at 70 eV in both full-scan and selected-ion monitoring modes, with a scan range of 50–550 amu.

4. Results

4.1. Bulk Organic Geochemical Characterization

4.1.1. Geochemical Parameters of Whole Rock

The K1bt1 source rocks show the highest TOC values, ranging from 0.39% to 4.04%, with 58.6% of samples exceeding 1.00% and a mean of 1.45%. In contrast, the K1ba source rocks have the lowest TOC, with 30% of samples below 0.6% and a mean of 1.19%. Additionally, the Jurassic source rocks exhibit intermediate TOC values, ranging from 0.71% to 1.76%, with an average of 1.37% (Figure 3).
Rock-Eval pyrolysis results show that the sum of free hydrocarbon values (S1) and remaining hydrocarbon values S2, S1 + S2 in K1bt1 and K1ba source rocks range from 0.68 mg HC/g rock to 21.83 mg HC/g rock and 0.08 mg HC/g rock to 27.9 mg HC/g rock, with mean values of 4.78 mg HC/g rock and 3.45 mg HC/g rock, respectively. In contrast, the Jurassic source rocks have significantly lower S1 + S2 values, ranging from 0.20 to 3.78 mg HC/g rock, with an average of 0.96 mg HC/g rock; 38.5% of samples fall below 0.40 mg/g HC/g rock, and 61.5% lie between 0.40 and 6.00 mg/g HC/g rock (Figure 4).
The hydrogen index (HI = S2 × 100/TOC) values of the K1bt1 and K1ba source rocks (80~479 mg/g TOC and 40~693 mg/g TOC, with average values of 227 mg HC/g TOC and 191 mg HC/g TOC) are relatively higher than those of the Jurassic source rocks (16~212 mg HC/g TOC, with an average value of 60 mg HC/g TOC) (Figure 5). In contrast, the Jurassic has higher Tmax values (the temperature of the peak rate of hydrocarbon generation) (440 °C~528 °C and a mean of 474 °C) than the K1bt1 (437~451 °C, with a mean of 446 °C) and K1ba source rocks (424~451 °C, with a mean of 442 °C).
Major element analysis was conducted on 13 mudstone samples from the L29x well focusing on CIA and Al2O3/Na2O ratios. The CIA values of the K1bt1 and K1ba source rocks are similar, ranging from 54.1 to 68.3 and 61.2 to 64.8, with averages of 62.0 and 62.8, respectively. In contrast, the Jurassic rocks have lower CIA values, ranging from 55.5 to 57.6, with a mean of 56.5. Additionally, the Al2O3/Na2O ratios for the K1bt1 and K1ba range from 3.22 to 7.37 and 4.88 to 5.82, with averages of 5.12 and 5.29, respectively. The Jurassic rocks show lower ratios, ranging from 3.51 to 4.23, with a mean of 3.87.

4.1.2. Geochemical Parameters of Kerogen

The O/C ratios from the K1bt1 and K1ba kerogen samples range from 0.06 to 0.10 and 0.06 to 0.84. Only one sample was obtained from the Jurassic source rocks, with H/C and O/C ratios of 0.54 and 0.08, both significantly lower than those of the K1bt1 and K1ba source rocks. The carbon isotopic compositions (δ13C) of K1ba kerogen range from −31.1‰ to −24.35‰. In contrast, four representative Jurassic samples exhibit higher δ13C values than K1ba source rocks, with a range of −23.06‰~−22.50‰.

4.2. Vitrinite Reflectance Characterization

The mean vitrinite reflectance ratio (Ro) of kerogen from the K1bt1 and K1ba samples range from 0.63% to 0.82% and 0.52% to 1.15%, with averages of 0.72% and 0.74%, respectively. The Jurassic source rocks have higher Ro values, ranging from 1.84% to 2.35%, with an average of 2.04%. The kerogen organic elemental composition shows H/C ratios of K1bt1 and K1ba range from 0.88 to 1.22 and 0.85 to 2.62, respectively.

4.3. Molecular Geochemical Characteristics

4.3.1. N-Alkanes and Isoprenoids

Gas chromatography (GC) analysis of mudstone samples reveals n-alkanes ranging from nC13 to nC36. The n-alkane distributions for the K1bt1, K1ba, and Jurassic source rocks are predominantly unimodal, peaking at nC15~nC18, nC15~nC23, and nC18~nC23, respectively. Odd–even predominance (OEP) values range from 0.81 to 1.23, indicating a generally weak odd-carbon preference. The pristane (Pr)-to-phytane (Ph) ratios vary among the mudstone samples (Figure 6). K1bt1 ranges from 0.98 to 1.07 (mean 1.02). K1ba ranges from 0.55 to 1.50 (mean 0.96), with most values between 0.75 and 1.10. In comparison, that of the Jurassic samples is relatively lower (0.60~0.89, average of 0.68), showing less distinct odd-carbon predominance (Table 1).

4.3.2. Terpenoids

Abundant terpenoid compounds were detected in source rocks from the Baorao Trough, including minor tricyclic terpenes, trace tetracyclic terpenes, and predominant pentacyclic triterpenoids (hopane series). Terpenes mass chromatograms (m/z 191) of all source rock extracts show high intensities of C30 hopane (C30H) as the dominant peak, with abundance decreasing from C31 hopane to C35 (Figure 7). The C35H index, expressed as the C35H/C34H ratio, is lower in K1bt1 than in K1ba and Jurassic source rocks, ranging from 0.53 to 0.65, 0.37 to 1.06, and 0.63 to 0.67, with averages of 0.58, 0.64, and 0.65, respectively. Gammacerane (Ga) abundance varies (Figure 7), with the Ga index (Ga/C30H) between 0.18 and 1.72 overall. Compared with the K1bt1 and Jurassic source rocks, the K1ba shows marginally higher Ga indexes, ranging from 0.24 to 1.72, with a mean of 0.52. In comparison, the ratios of 0.18~0.32 for K1bt1 show the lowest values, with an average of 0.26. In contrast, the ratios of the Jurassic range between the two sets of source rocks (0.21~0.40), with an average of 0.33. The C21TT, C19+20TT, and C23TT percentages for the K1bt1 source rocks range from 28.7% to 36.7%, 43.5% to 47.9%, and 15.4% to 26.5%, with means of 31.6%, 45.0%, and 23.4%, respectively. Samples from the K1ba source rocks exhibit more heterogeneous percentages and similar averages to K1bt1, ranging from 22.4% to 34.5%, 33.6% to 50.2%, and 22.2% to 37.8%, with averages of 29.1%, 41.8%, and 29.1%, respectively. In contrast, Jurassic source rocks exhibit relatively low C21TT (25.8%~28.1%) and C19+20TT (35.4%~39.8%) but higher C23TT (32.3%~38.8%), with means of 27.1%, 37.8%, and 35.1%, respectively (Table 1).

4.3.3. Steroids

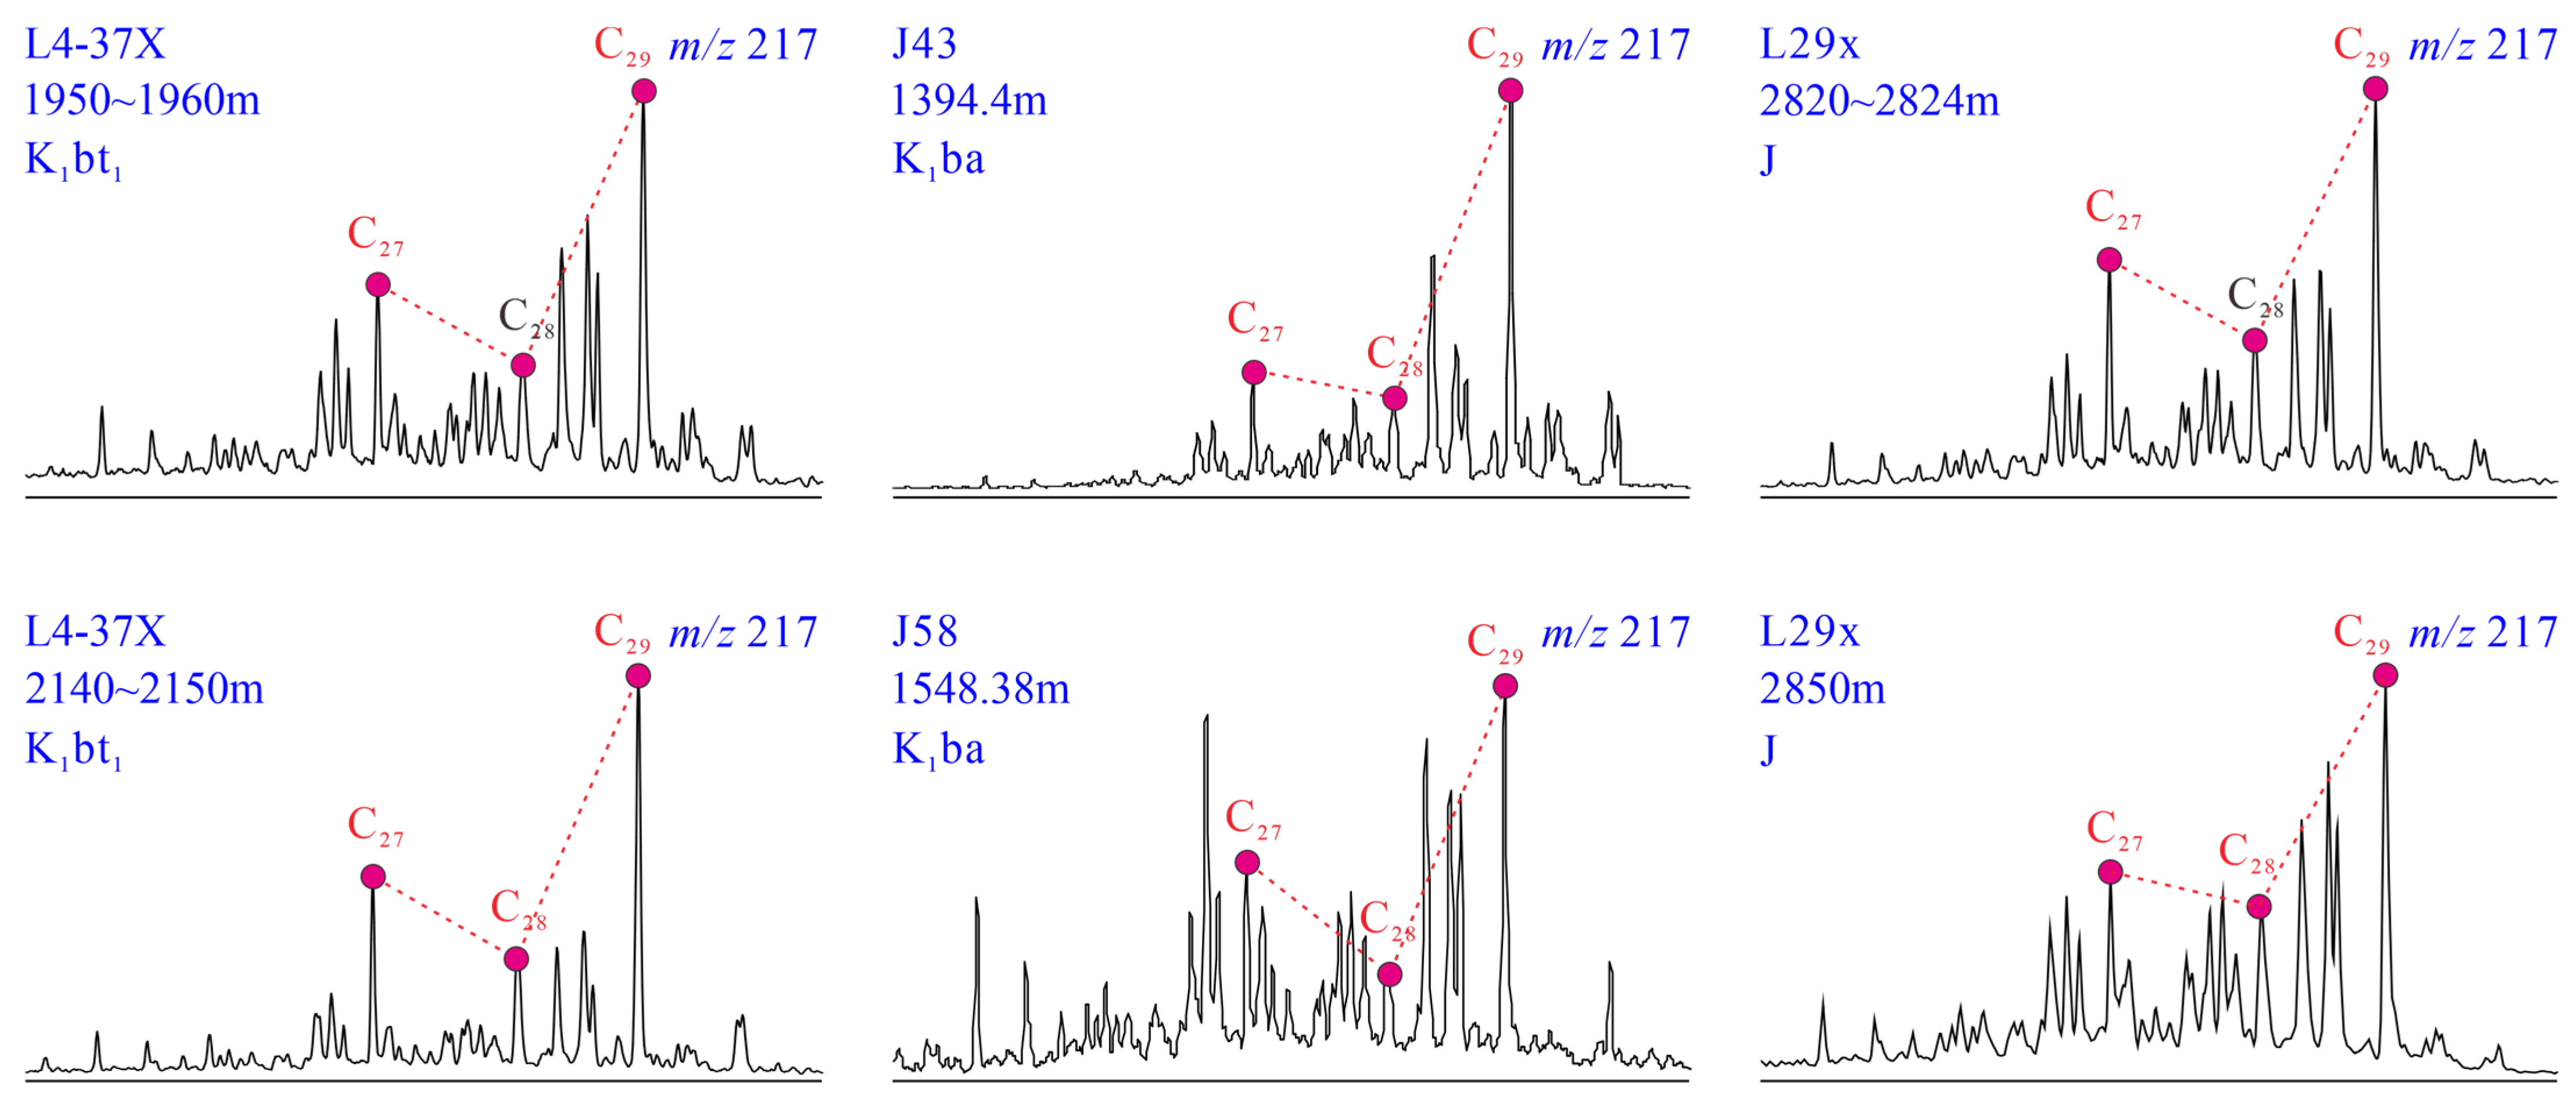
Mass chromatograms for steroids (m/z 217) exhibit a predominance of C29 steranes over C27 and C28 steranes in all three source rock groups, with slight differences in ratio distributions (Figure 8). K1bt1 source rocks display narrow ranges (13.8%~17.3% of C27 steranes, 25.7%~27.9% of C28 steranes, and 54.8%~60.5% of C29 steranes). K1ba samples are more variable, ranging from 8.5% to 17.4%, 15.3% to 30.2%, and 53.9% to 72.6% of C27, C28, and C29 steranes, respectively. Jurassic samples are relatively stable, ranging from 16.3% to 18.1%, 26.5% to 33.0%, and 48.9% to 57.2%, respectively. The steranes-to-hopanes (S/H) ratios are similar across groups, with a mean of 0.36 for Jurassic, 0.25 for K1bt1, and 0.29 for K1ba (Table 1).

5. Discussion

5.1. Hydrocarbon Generation Potential

5.1.1. Organic Matter Abundance

The abundance of organic matter reflects its relative content in source rocks and is the primary factor determining their hydrocarbon generation potential. Common indicators include total organic carbon (TOC) content, chloroform bitumen “A” content, and hydrocarbon generation potential S1 + S2 from rock pyrolysis [34,35,36].
Statistical analysis shows that source rocks in the study area have relatively high TOC contents but low S1 + S2 values and bitumen “A” contents (0.0984~0.7376% in K1bt1, 0.0051~0.2762% in K1ba, and 0.0077~0.0312% in Jurassic), particularly pronounced in the Jurassic, consistent with high maturity and significant hydrocarbon generation and expulsion. Comprehensive evaluation indicates that K1bt1 and K1ba are fair-quality source rocks. In contrast, Jurassic source rocks are relatively poor (Figure 9a). Additionally, the Jurassic samples exhibit stable TOC values, with 96.2% falling between 1% and 2%. In comparison to the Jurassic source rocks, the K1bt1 and K1ba show greater variability, ranging from 0.39% to 4.04% and 0.08% to 4.81%, respectively. Furthermore, 89.6% of K1bt1 samples have TOC values greater than 0.6%, while only 70.0% of K1ba source rock samples present TOC content above this threshold (Figure 3). The pronounced TOC heterogeneity in K1bt1 and K1ba reflects unstable depositional environments and variable organic matter sources during that time, whereas Jurassic source rocks were deposited in a more stable setting with consistent organic matter supply.

5.1.2. Organic Matter Type

The type of organic matter is another critical parameter in source rock evaluation, as it determines the products generated during the maturation [35,37]. Type I kerogen is oil-prone, whereas Type III is gas-prone [34,35]. Both the K1bt1 and K1ba source rocks are dominated by Type II1-II2 organic matter. However, the K1ba contains a higher proportion of Type I and Type III kerogen than K1bt1, indicating greater heterogeneity. This suggests that K1ba was deposited under more variable conditions, including different organic matter sources and depositional environments. They are mainly composed of types II2–III organic matter, implying limited oil-generation capacity but some potential for gas generation (Figure 9b). In addition to the hydrogen index (HI), organic element ratios and carbon isotopes are important indicators of organic matter type.
Kerogen is primarily composed of carbon (C), hydrogen (H), oxygen (O), sulfur (S), and nitrogen (N), and its elemental composition varies by origin. Aquatic-derived kerogen is hydrogen-rich, oxygen-poor, and enriched in liptinite macerals, allowing type determination through kerogen elemental analysis. Organic matter typing is conventionally performed by plotting hydrogen/carbon (H/C) and oxygen/carbon (O/C) atomic ratios on a “Van Krevelen” diagram (Figure 9c) [35,38]. Furthermore, the carbon isotopic composition (δ13C) of kerogen in sedimentary rocks is largely determined by the isotopic signature of the precursor organic matter, with a slight enrichment in δ13C (generally <2‰) observed with increasing thermal maturity [39]. Type III kerogen generally has δ13C values around −25.5‰, while Type II falls between −28‰ and −25.5‰ [40]. δ13C analysis reveals that K1ba source rocks predominantly contain Type II kerogen, whereas Jurassic source rocks show characteristics of Type III. These findings are consistent with the results of the HI and kerogen elemental analysis.

5.1.3. Thermal Maturity

Vitrinite reflectance (Ro), a measure of the optical properties of vitrinite in kerogen, is widely used to evaluate the thermal evolution of organic matter in source rocks [35,36]. In the study area, Ro ranges from 0.52% to 2.35%, placing most samples just before the peak oil-generation window. Jurassic source rock samples have higher Ro values, indicating high thermal maturity and entry into the high-temperature gas-generation stage. In contrast, the K1bt1 and K1ba source rocks have reached the oil-generation stage.
Based on the Ro-depth trend, the oil-generation threshold (Ro = 0.5%) occurs at depths of less than 1200 m (Figure 10a). Additionally, due to the limited number of measured Ro samples, restricted by kerogen preparation difficulties, these data are insufficient for a comprehensive maturity assessment. Therefore, the Tmax parameter is used as supplementary evidence. Equivalent vitrinite reflectance values calculated from Tmax (RTmax = 0.018 × Tmax − 7.16) [41] show good agreement with measured Ro values from corresponding samples (Figure 10b).

5.2. Geochemical Characteristics

5.2.1. Organic Matter Sources

Organisms exhibit distinct n-alkane patterns: phytoplankton typically dominate in low-molecular-weight n-alkanes, while terrestrial higher plants are characterized by high-molecular-weight n-alkanes [42]. Therefore, n-alkane profiles can indicate the sources of organic matter. The K1bt1 and K1ba exhibit a predominance of short-chain n-alkanes (Figure 6), suggesting a greater contribution from lower organisms such as algae. In contrast, the Jurassic source rocks peak at nC21 to nC23, indicating a higher input from terrestrial higher plants. Thermal maturity affects these patterns, as increasing maturity promotes the cracking of long-chain to short-chain n-alkanes [43]. The low maturity of K1bt1 and K1ba means their n-alkane distributions reliably reflect original organic matter input. In contrast, the Jurassic source rocks, with maturity up to 2.0% Ro, have experienced significant alteration. Therefore, it can be inferred that in their early thermal history, the Jurassic source rocks likely peaked at higher n-alkanes, reflecting a greater terrestrial plant contribution.
C27 steranes are typically derived from plankton, metazoans, and red algae; C28 steranes from chlorophyll-c-containing phytoplankton (e.g., diatoms, green and golden algae); and C29 steranes predominantly from terrestrial higher plants [44,45]. GC–MS analysis of saturated hydrocarbons shows enrichment in C29 steranes across all source rocks (Figure 11a), indicating a dominant terrestrial organic matter input [46,47]. Additionally, the sterane/hopane (S/H) ratio reflects the relative contributions of eukaryotic (mainly algae and higher plants) versus prokaryotic (bacterial) organisms [47,48], while S/H values >1 suggests algal-derived input. The study area shows values 0.14~0.49, indicating a predominance of terrestrial or microbially altered organic matter, consistent with interpretation from the sterane ternary diagram.
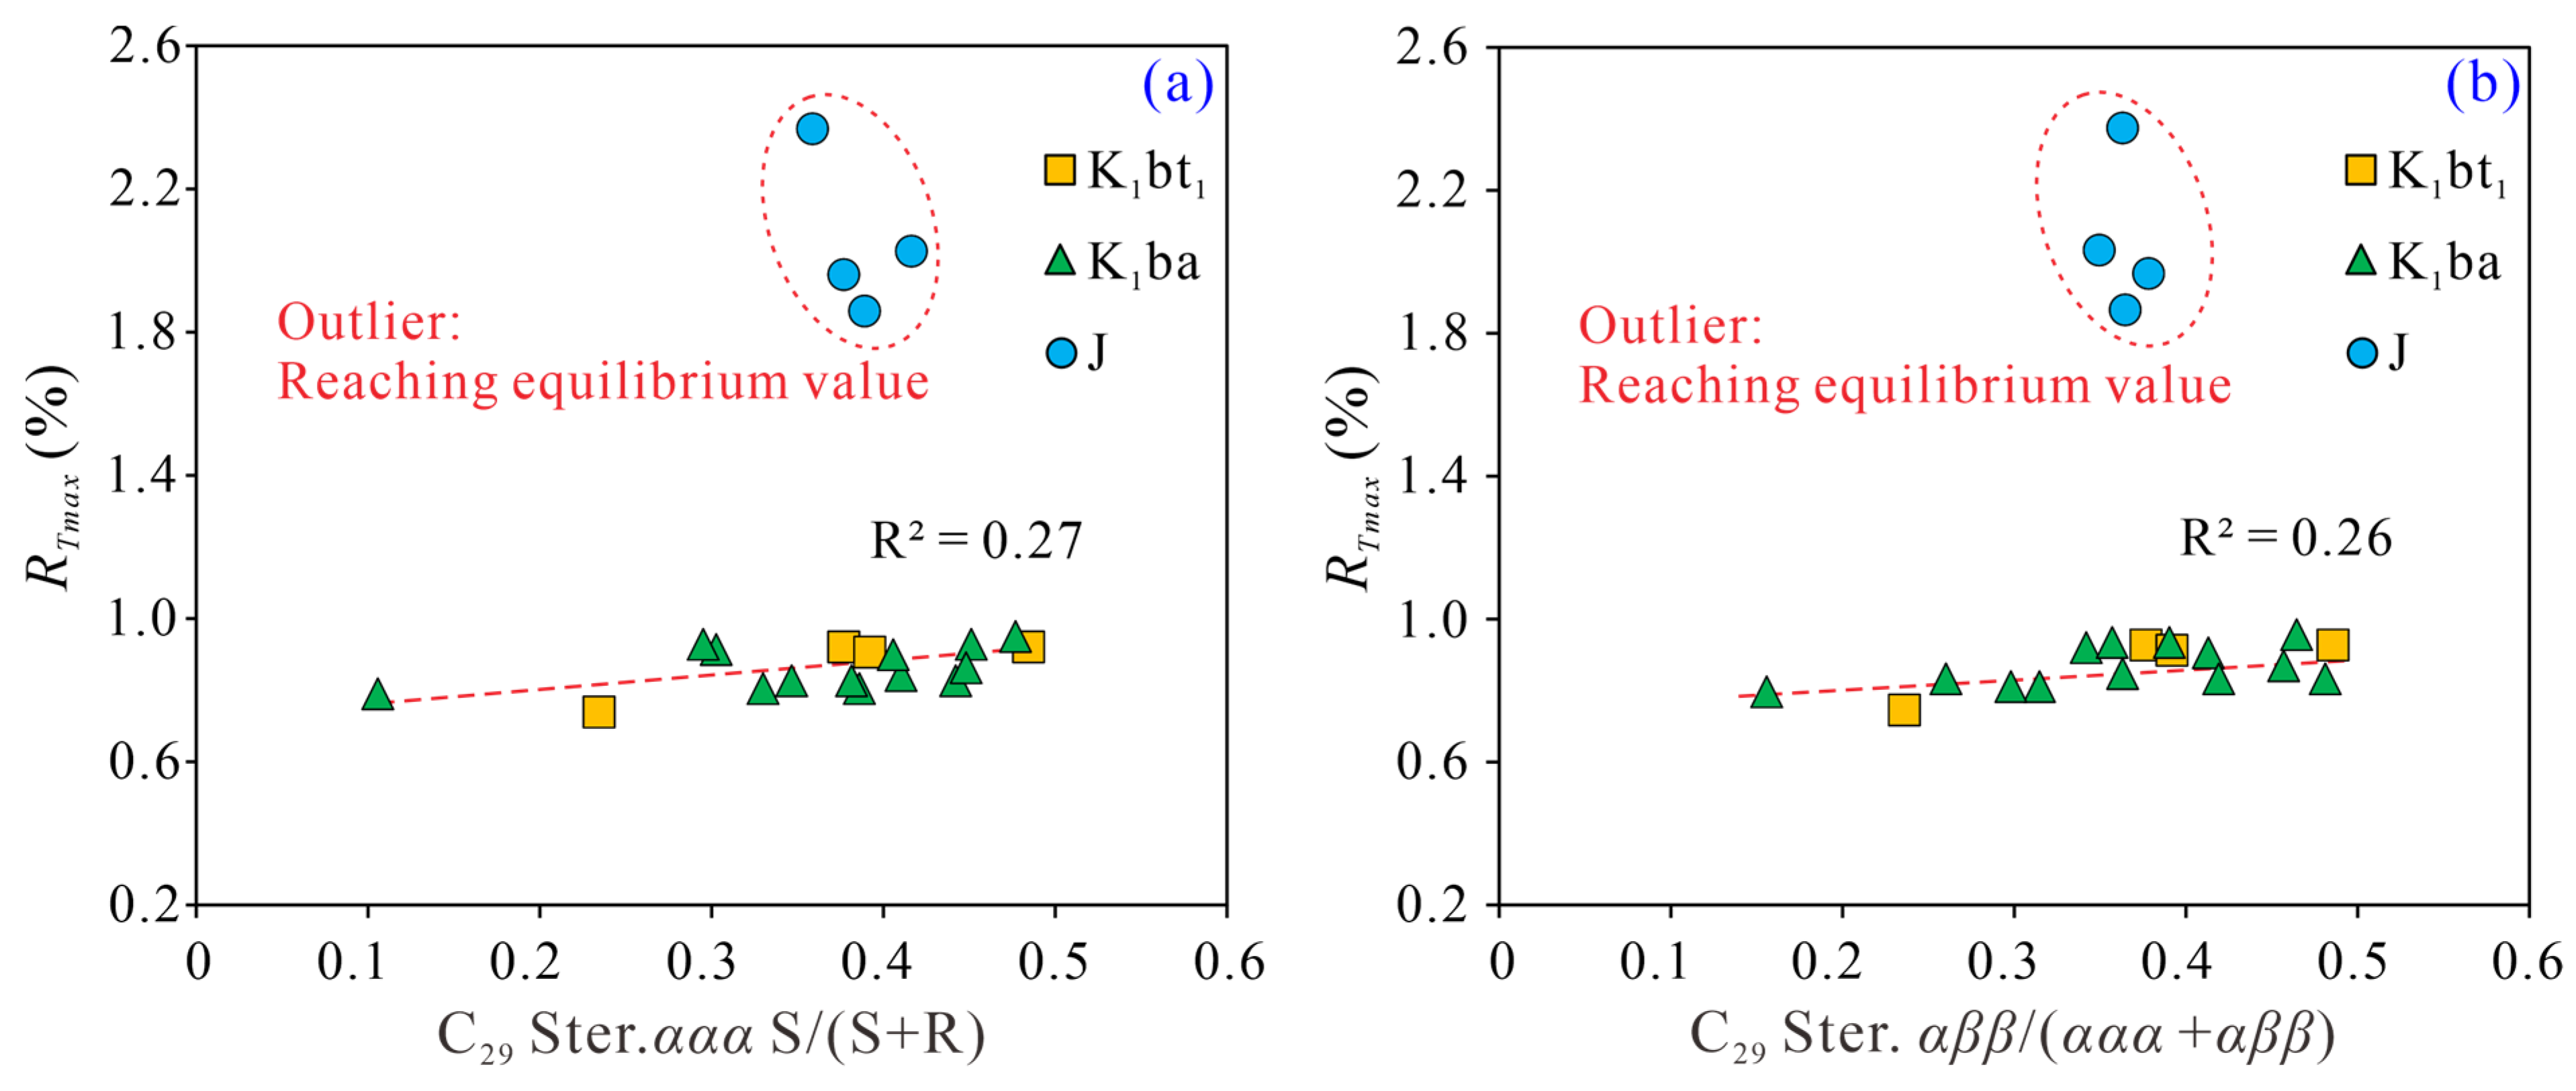
Organic-matter typing reveals a discrepancy. The K1bt1 and K1ba source rocks are dominated by Type II kerogen, whereas the Jurassic source rocks are dominated by Type III kerogen and should contain a greater contribution from terrestrial higher plants in theory. However, the Jurassic shows lower C29 regular sterane content than the other two intervals (Figure 11a). Previous studies indicate that C29 steranes can also derive from diatoms, cyanobacteria, green algae, and brown algae [47,49], reducing their reliability as indicators of terrestrial input. In addition to multiple biological sources, thermal maturation can also affect C29 sterane abundance. In crude oil maturity assessment, the C29αααS/(S + R) and C29αββ/(ααα + αββ) ratios are robust maturity indicators, but during source rock thermal evolution, relative C29 sterane abundance may shift. This study shows weak positive correlations between these ratios and thermal maturity (R2 = 0.27 and 0.24) (Figure 12). Once equilibrium values are reached, sterane degradation occurs, further reducing their reliability as biological indicators. Thermal degradation likely explains the lower C29 sterane content in the Jurassic compared with K1bt1 and K1ba.

5.2.2. Sedimentary Environment

Pristane and phytane are commonly used to assess sedimentary environments. Pr/Ph ratios of <0.5, 0.5~1.0, 1.0~2.0, and >2.0 generally indicate strongly reducing, reducing, weakly reducing to weakly oxidizing, and strongly oxidizing conditions, respectively [47,50]. Based on Pr/Ph ratios and Pr/nC17 vs. Ph/nC18 diagrams (Figure 13a,b), the K1bt1 source rocks were deposited in a weakly oxidizing to reducing environment, while the K1ba and Jurassic source rocks formed under weakly reducing conditions.
Tricyclic terpenes (TTs) are widely distributed in petroleum and sedimentary organic matter and are thought to originate from both vascular plants and lower organisms. For example, C19TT and C20TT are mainly derived from diterpenoids of vascular plants and serve as typical markers of terrestrial higher plant input. Source rocks from marine or saline lacustrine facies typically exhibit C23TT dominance, whereas freshwater lacustrine facies are generally characterized by C21TT predominance [51,52]. Therefore, the tricyclic terpenes distribution patterns are closely linked to depositional environments [53,54]. All samples in this study show relatively high C21TT and C19+20TT percentages, indicating a predominantly freshwater depositional environment for the three sets of source rocks (Figure 11b). However, subtle salinity variations can significantly affect organic matter enrichment even within freshwater systems. Therefore, additional parameters are needed to identify the salinity range among the three source rock groups more precisely.
Among pentacyclic triterpenoids, the homohopane index (C35/C31+32) measures paleosalinity, with elevated values typically reflecting marine and saline lacustrine environments [55,56]. Gammacerane abundance also reflects stratified water columns caused by vertical salinity gradients, with high values often observed in hypersaline lacustrine and marine sediments. Elevated water salinity during deposition generally increases both gammacerane indices (Ga/C30H; Ga/C31H) and homohopane indices (C35/C31+32) [57,58]. In this study, the K1bt1 source rocks developed in a brackish environment. The K1ba shows relatively higher and more variable salinity, suggesting a brackish to saltwater depositional setting. In comparison, the Jurassic source rocks exhibit intermediate salinity but also formed in brackish water (Figure 13b,c).
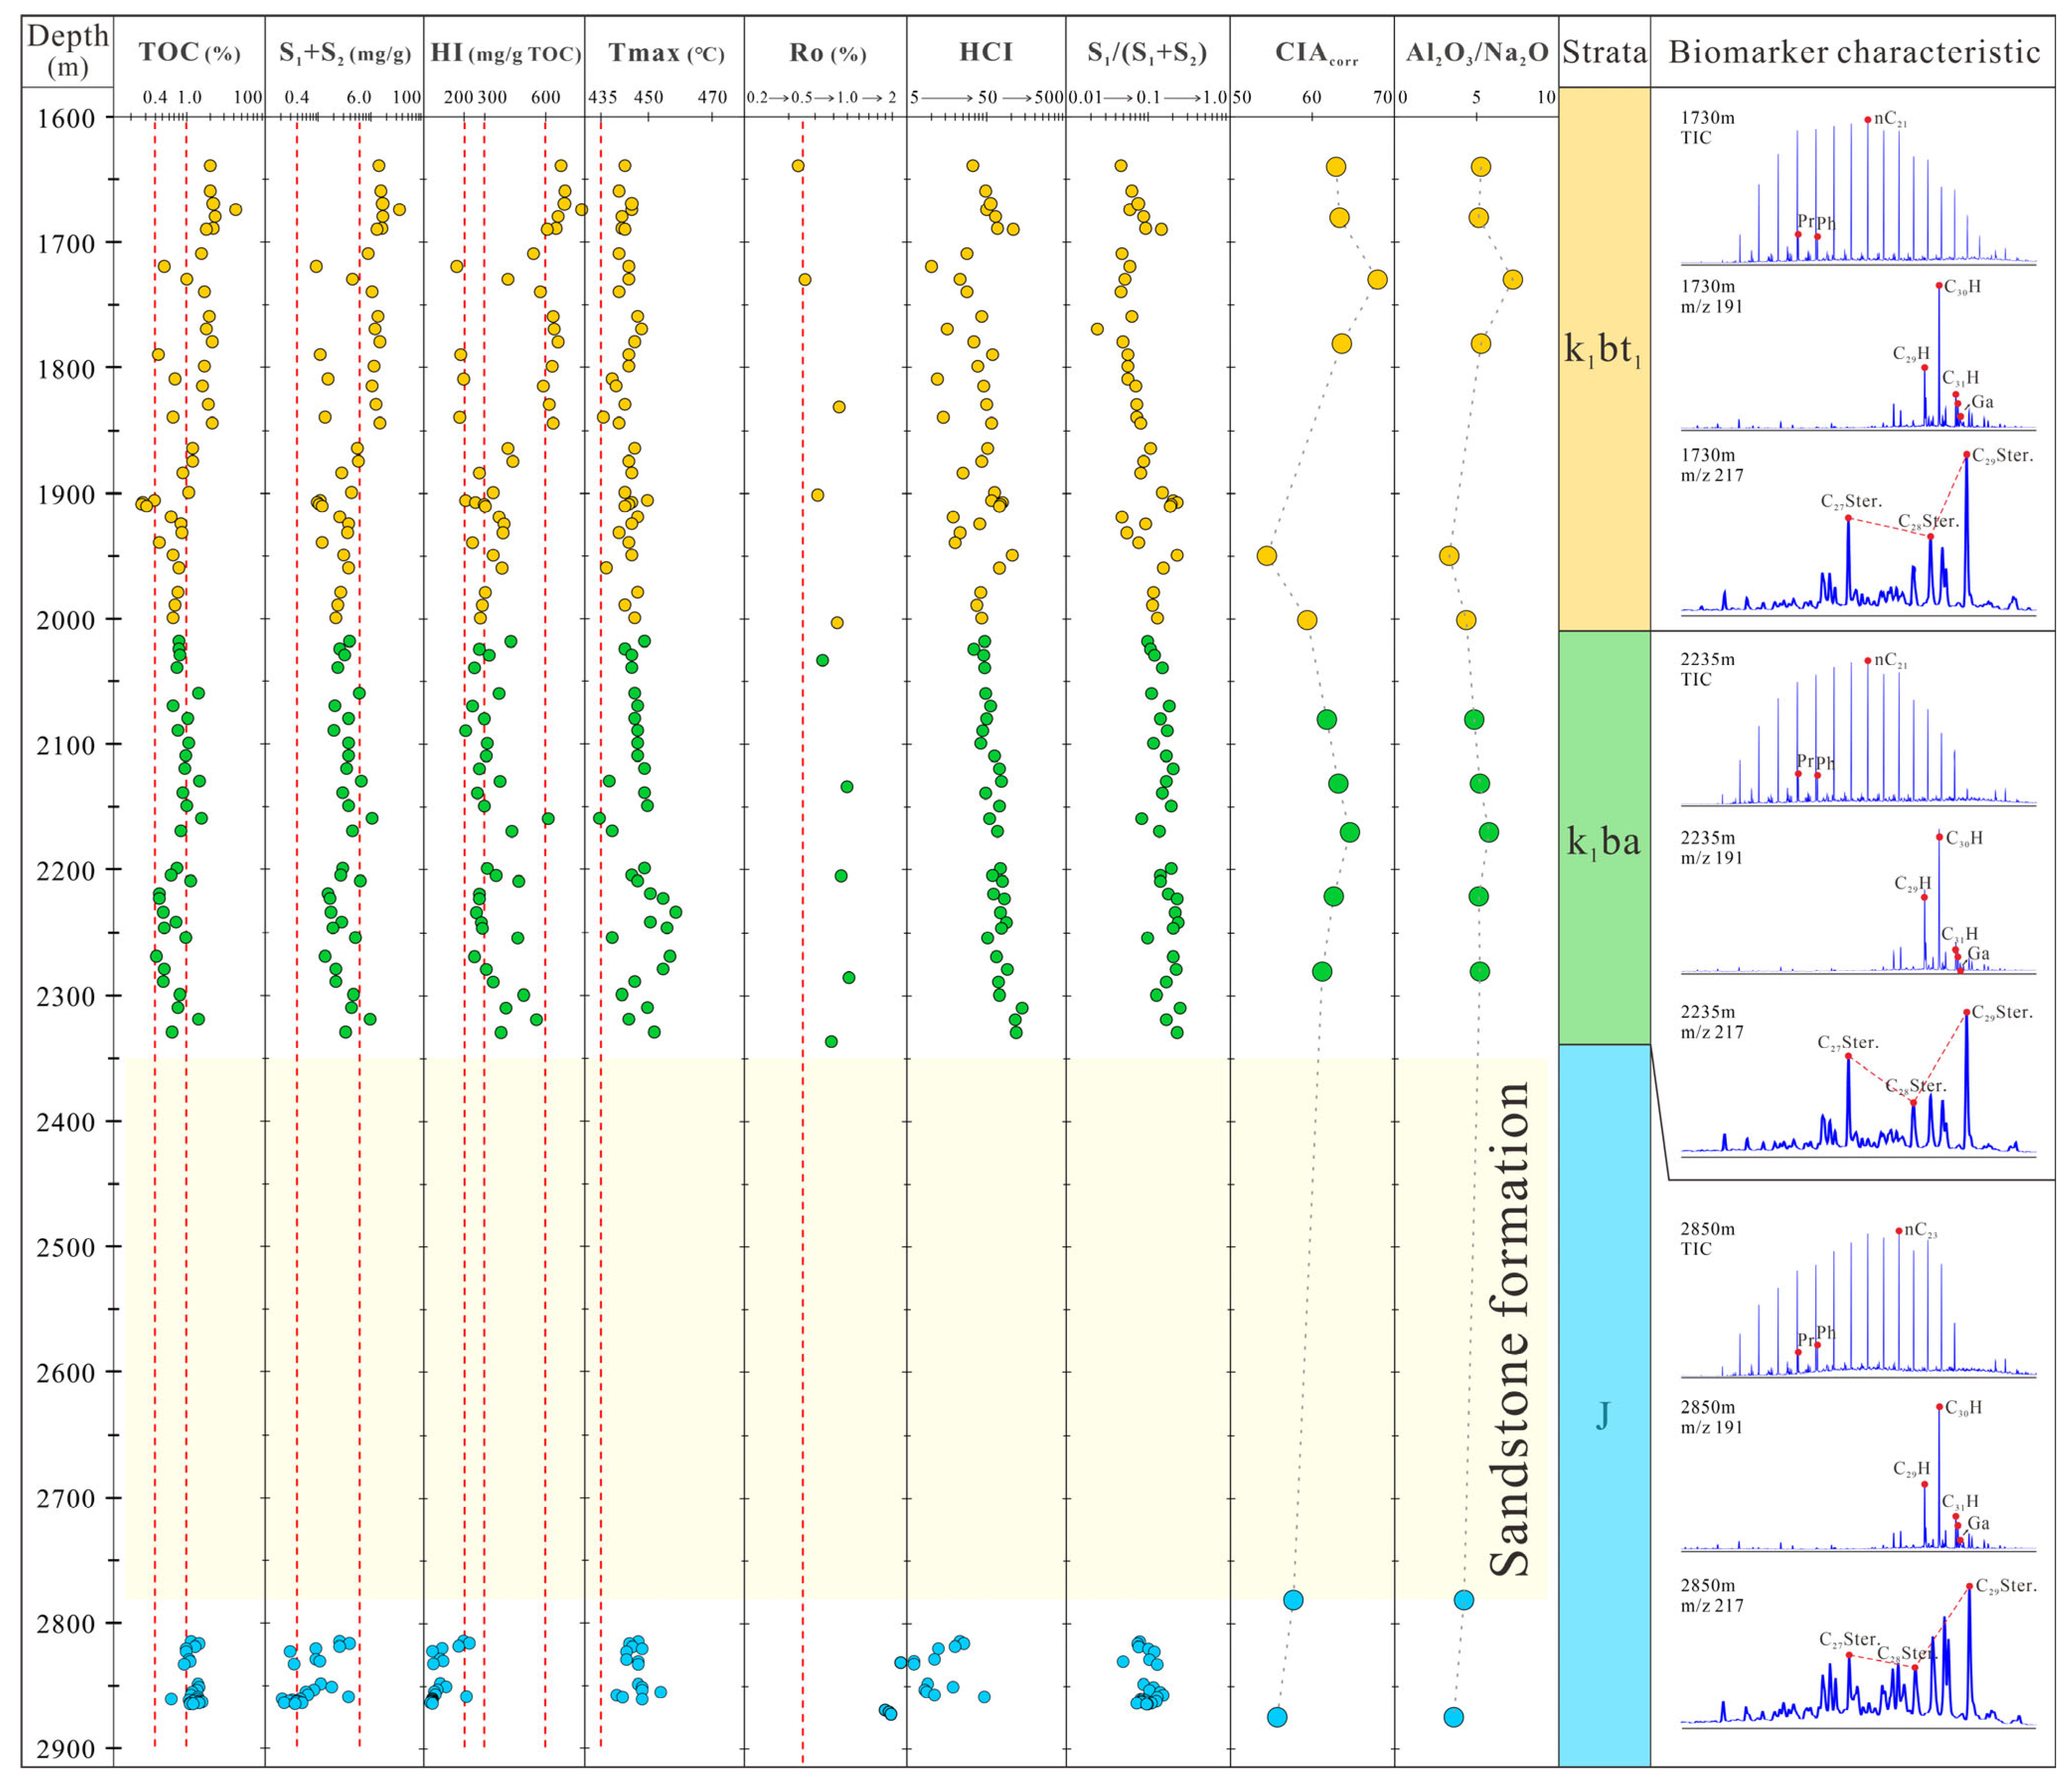
Comprehensive analysis shows that the K1bt1 and K1ba formations share similar source rock characteristics, as both developed in comparable environments, continuous humid to semi-humid climates with shallow to semi-deep lacustrine deposits (Figure 2) [21], resulting in their overall similarity (Figure 14). The chemical index of alteration (CIA) is widely used to evaluate the degree of chemical weathering in sediment provenance areas [26,59]. CIA value is closely linked to weathering intensity and climate: higher CIA values indicate stronger chemical weathering and warmer, more humid climates. The Al2O3/Na2O ratio has a similar indicative effect [60,61]. In the Baorao Trough, the CIA values and Al2O3/Na2O ratios from well L29X show consistent trends across the sedimentary stages. Both indices are lowest during the Jurassic, increase during the K1ba period, then decline before rising again through the K1bt1 period. This pattern reflects a cold, dry climate with weak weathering in the Early Jurassic, transitioning to a warm, humid climate with moderate weathering in the Early Cretaceous (K1ba), followed by a slightly cooler, drier phase in early K1bt1, and finally a warm, humid climate in the middle to late K1bt1. This climatic evolution aligns with previous findings [21].
The K1ba source rocks display greater heterogeneity, reflected in their wider TOC range (Figure 9), variable sterane and tricyclic terpene distributions (Figure 11), and broader gammacerane and homohopane indices (Figure 13). This variability may result from their widespread distribution, long sedimentary period, and extended transport distance of terrigenous organic matter. In contrast, Jurassic source rocks show markedly different characteristics. Lower Jurassic deposition occurred under semi-arid conditions with minimal environmental fluctuations, leading to relatively stable organic inputs and depositional settings (Figure 2). Dominated by terrestrial higher plants and deposited rapidly in weakly reducing, brackish to saline waters, these rocks are relatively thin and uniform with moderate quality and Types II2~III kerogen, suggesting limited gas-generation potential (Figure 14).
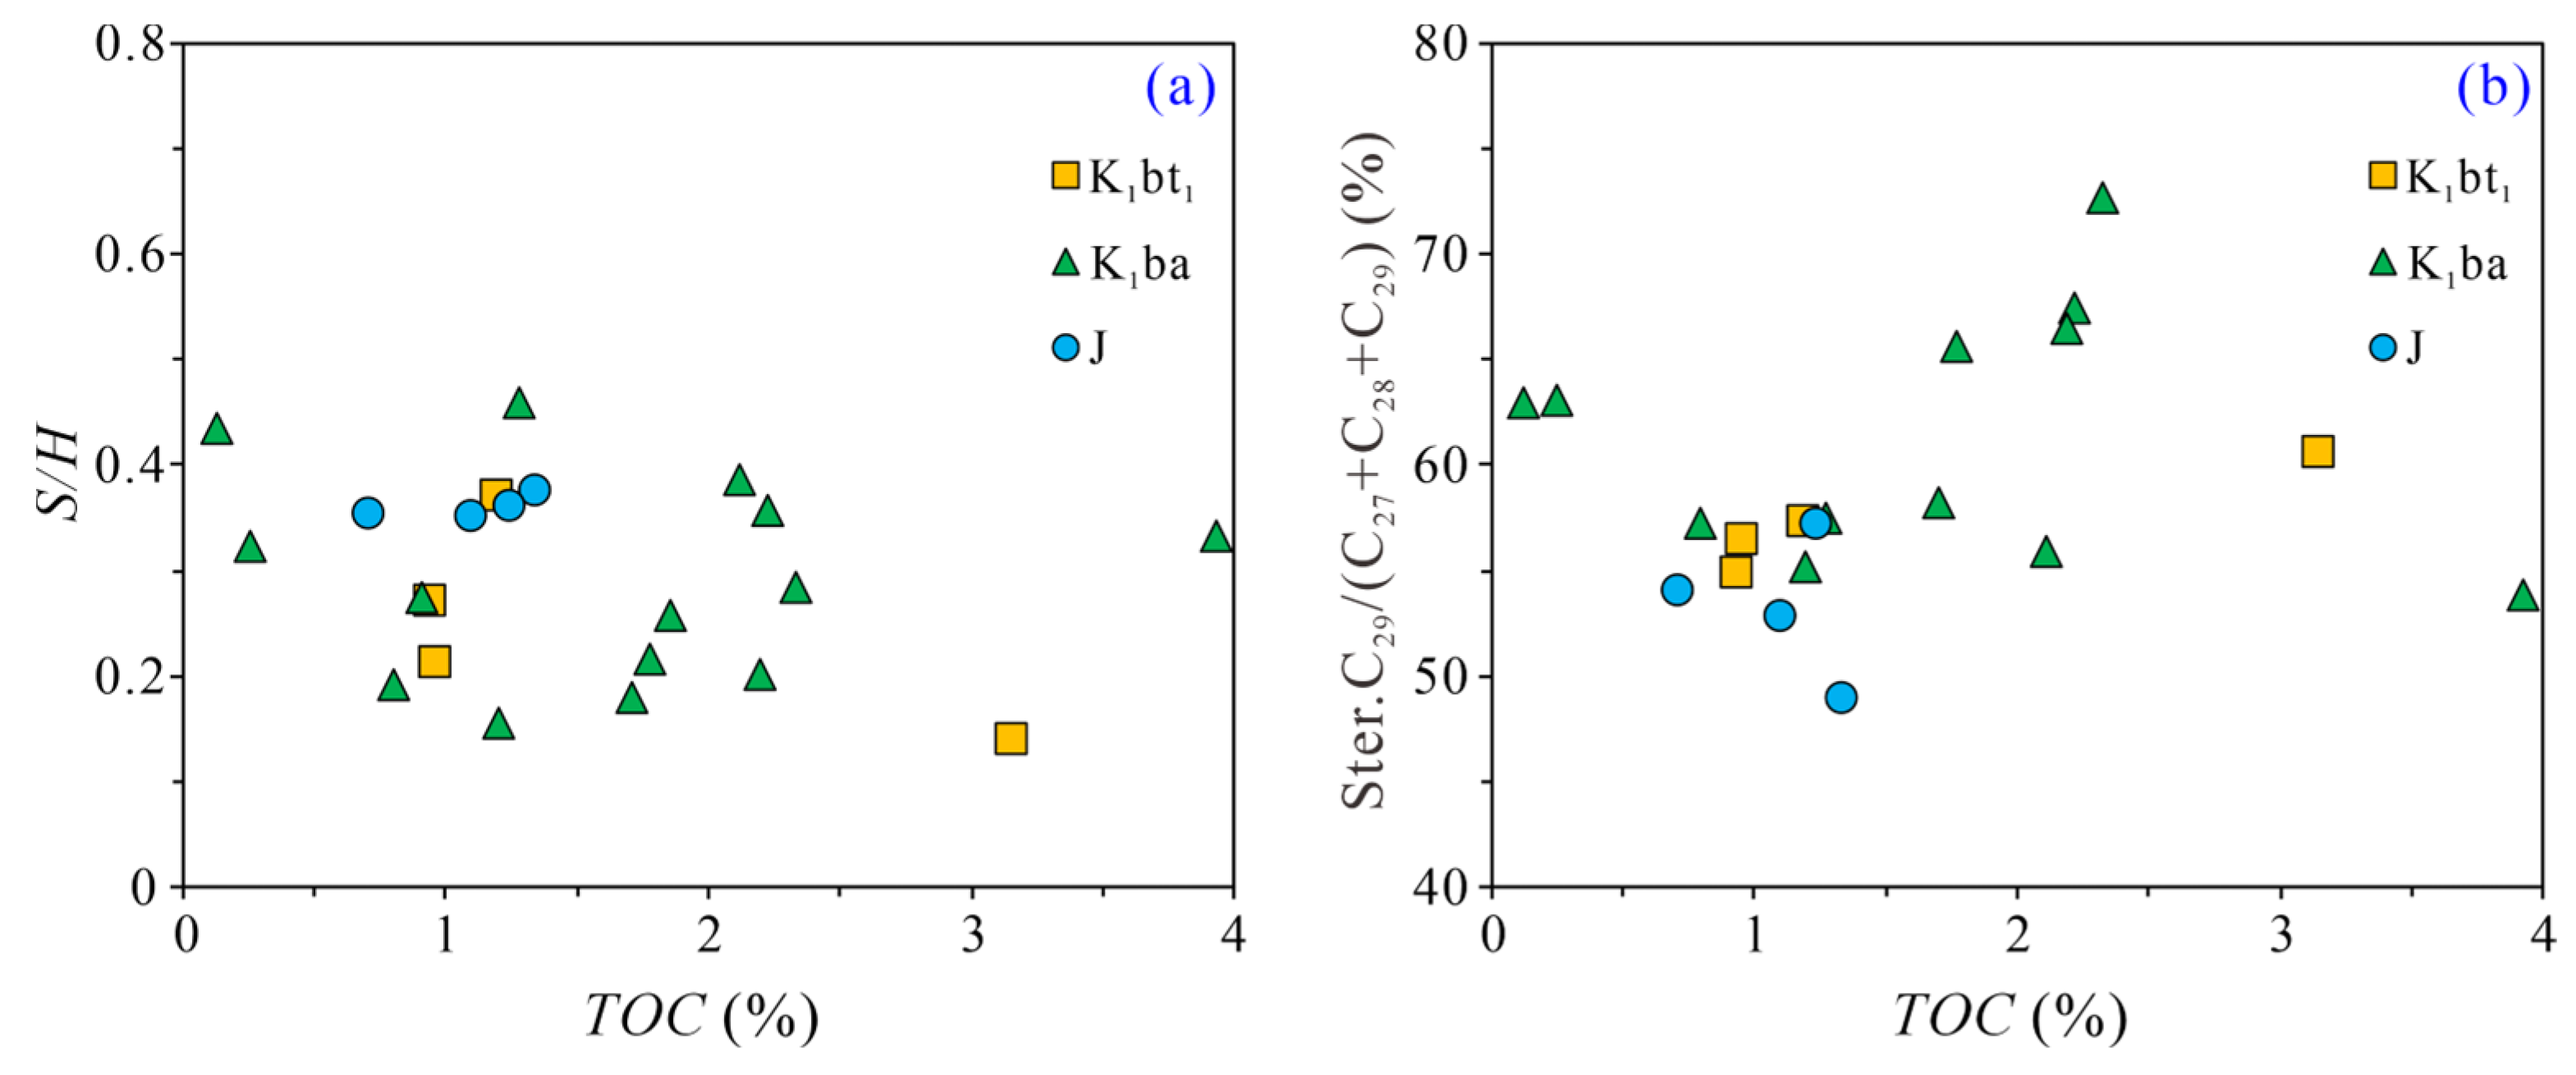
Two primary factors govern the development of high-quality source rocks: the depositional environment, which controls organic matter preservation, and organic matter input, which influences paleoproductivity and thus source rock quality. Organic matter enrichment can be evaluated through a correlation analysis between TOC content and representative parameters. In this study, TOC content shows clear correlations with the gammacerane index and Pr/Ph ratio. Higher gammacerane values correspond to higher TOC (R2 = 0.44), while lower Pr/Ph ratios are associated with increased TOC (R2 = 0.22). These relationships indicate that saline water and reducing environments favor the development of high-quality source rocks (Figure 15). By contrast, organic matter indicators, such as S/H (reflecting algae, higher plants and bacteria) and C29 sterane (reflecting terrestrial higher plants) show no correlation with TOC (Figure 16), suggesting that organic matter preservation is the dominant control on source rock quality in the study area, while the biological source type plays only a minor role.
Terrestrial lacustrine basins exhibit two primary source rock development models: the high-productivity model and the organic matter preservation model, or a combination of both. High primary productivity increases the organic carbon content of source rocks and promotes bottom-water anoxia by oxidizing excess organic matter, thereby enhancing preservation [62]. For example, the Bohai Bay Basin, a rift basin of China’s eastern coast, experienced tectonic subsidence and climatic changes during the syn-rift evolution of the Bozhong Sub-basin. These changes altered lake hydrology and water chemistry, influencing phytoplankton communities and primary productivity, and resulting in source rock assemblages with varying hydrocarbon potential and biomarker profiles [63].
In contrast, the preservation model emphasizes sustained anoxic bottom-water conditions as critical for forming organic-rich sediments [64]. For example, during deposition of the Third Member of the Shahejie Formation in the northern Dongpu Sag (southwestern Bohai Bay Basin), the environment was predominantly brackish to saline with deep, stratified water. This created an anaerobic–anoxic bottom-water setting, where there is limited input of terrestrial organic matter. High-quality source rocks formed primarily through preservation under saline, anoxic conditions [65].
The development model in the Jirgalangtu Sag aligns more closely with this preservation-dominated model. Due to the structural segmentation typical of rift basins, the sag comprises several troughs without clear barriers. During lake salinization, deeper sub-sags exhibited higher salinity and stronger anoxic conditions, promoting the formation of high-quality source rocks.

5.3. Hydrocarbon Generation and Expulsion Characteristics

Source rocks in the study area exhibit favorable hydrocarbon generation potential, with effectiveness depending on successful hydrocarbons expulsion. A key requirement is that generated hydrocarbons must first reach saturation within the rock matrix before migrating into carrier beds and reservoirs [66,67].
For source rocks with similar organic matter types and maturity, hydrocarbon generation potential positively correlates with TOC content [68]. If generation does not exceed rocks’ retention capacity, low TOC prevents effective expulsion. Expulsion occurs only when generation surpasses retention, enabling the rock to act as an effective hydrocarbon source. Thus, higher TOC enhances both generation and expulsion capacities. The minimum TOC content required for expulsion is known as the expulsion threshold.
The pyrolysis parameter S1 and bitumen content represent residual hydrocarbons. In source rocks without hydrocarbon expulsion, they reflect the amount of hydrocarbons already generated [69]. Therefore, the S1/(S1 + S2) and bitumen/TOC ratios indicate residual hydrocarbons per unit of organic matter. For source rocks with similar organic matter types and maturity, these ratios generally increase with TOC. In the study area, both ratios rise with TOC up to 0.8%, then decline, marking the onset of expulsion (Figure 17). Therefore, the expulsion threshold corresponds to a TOC content of 0.8%.
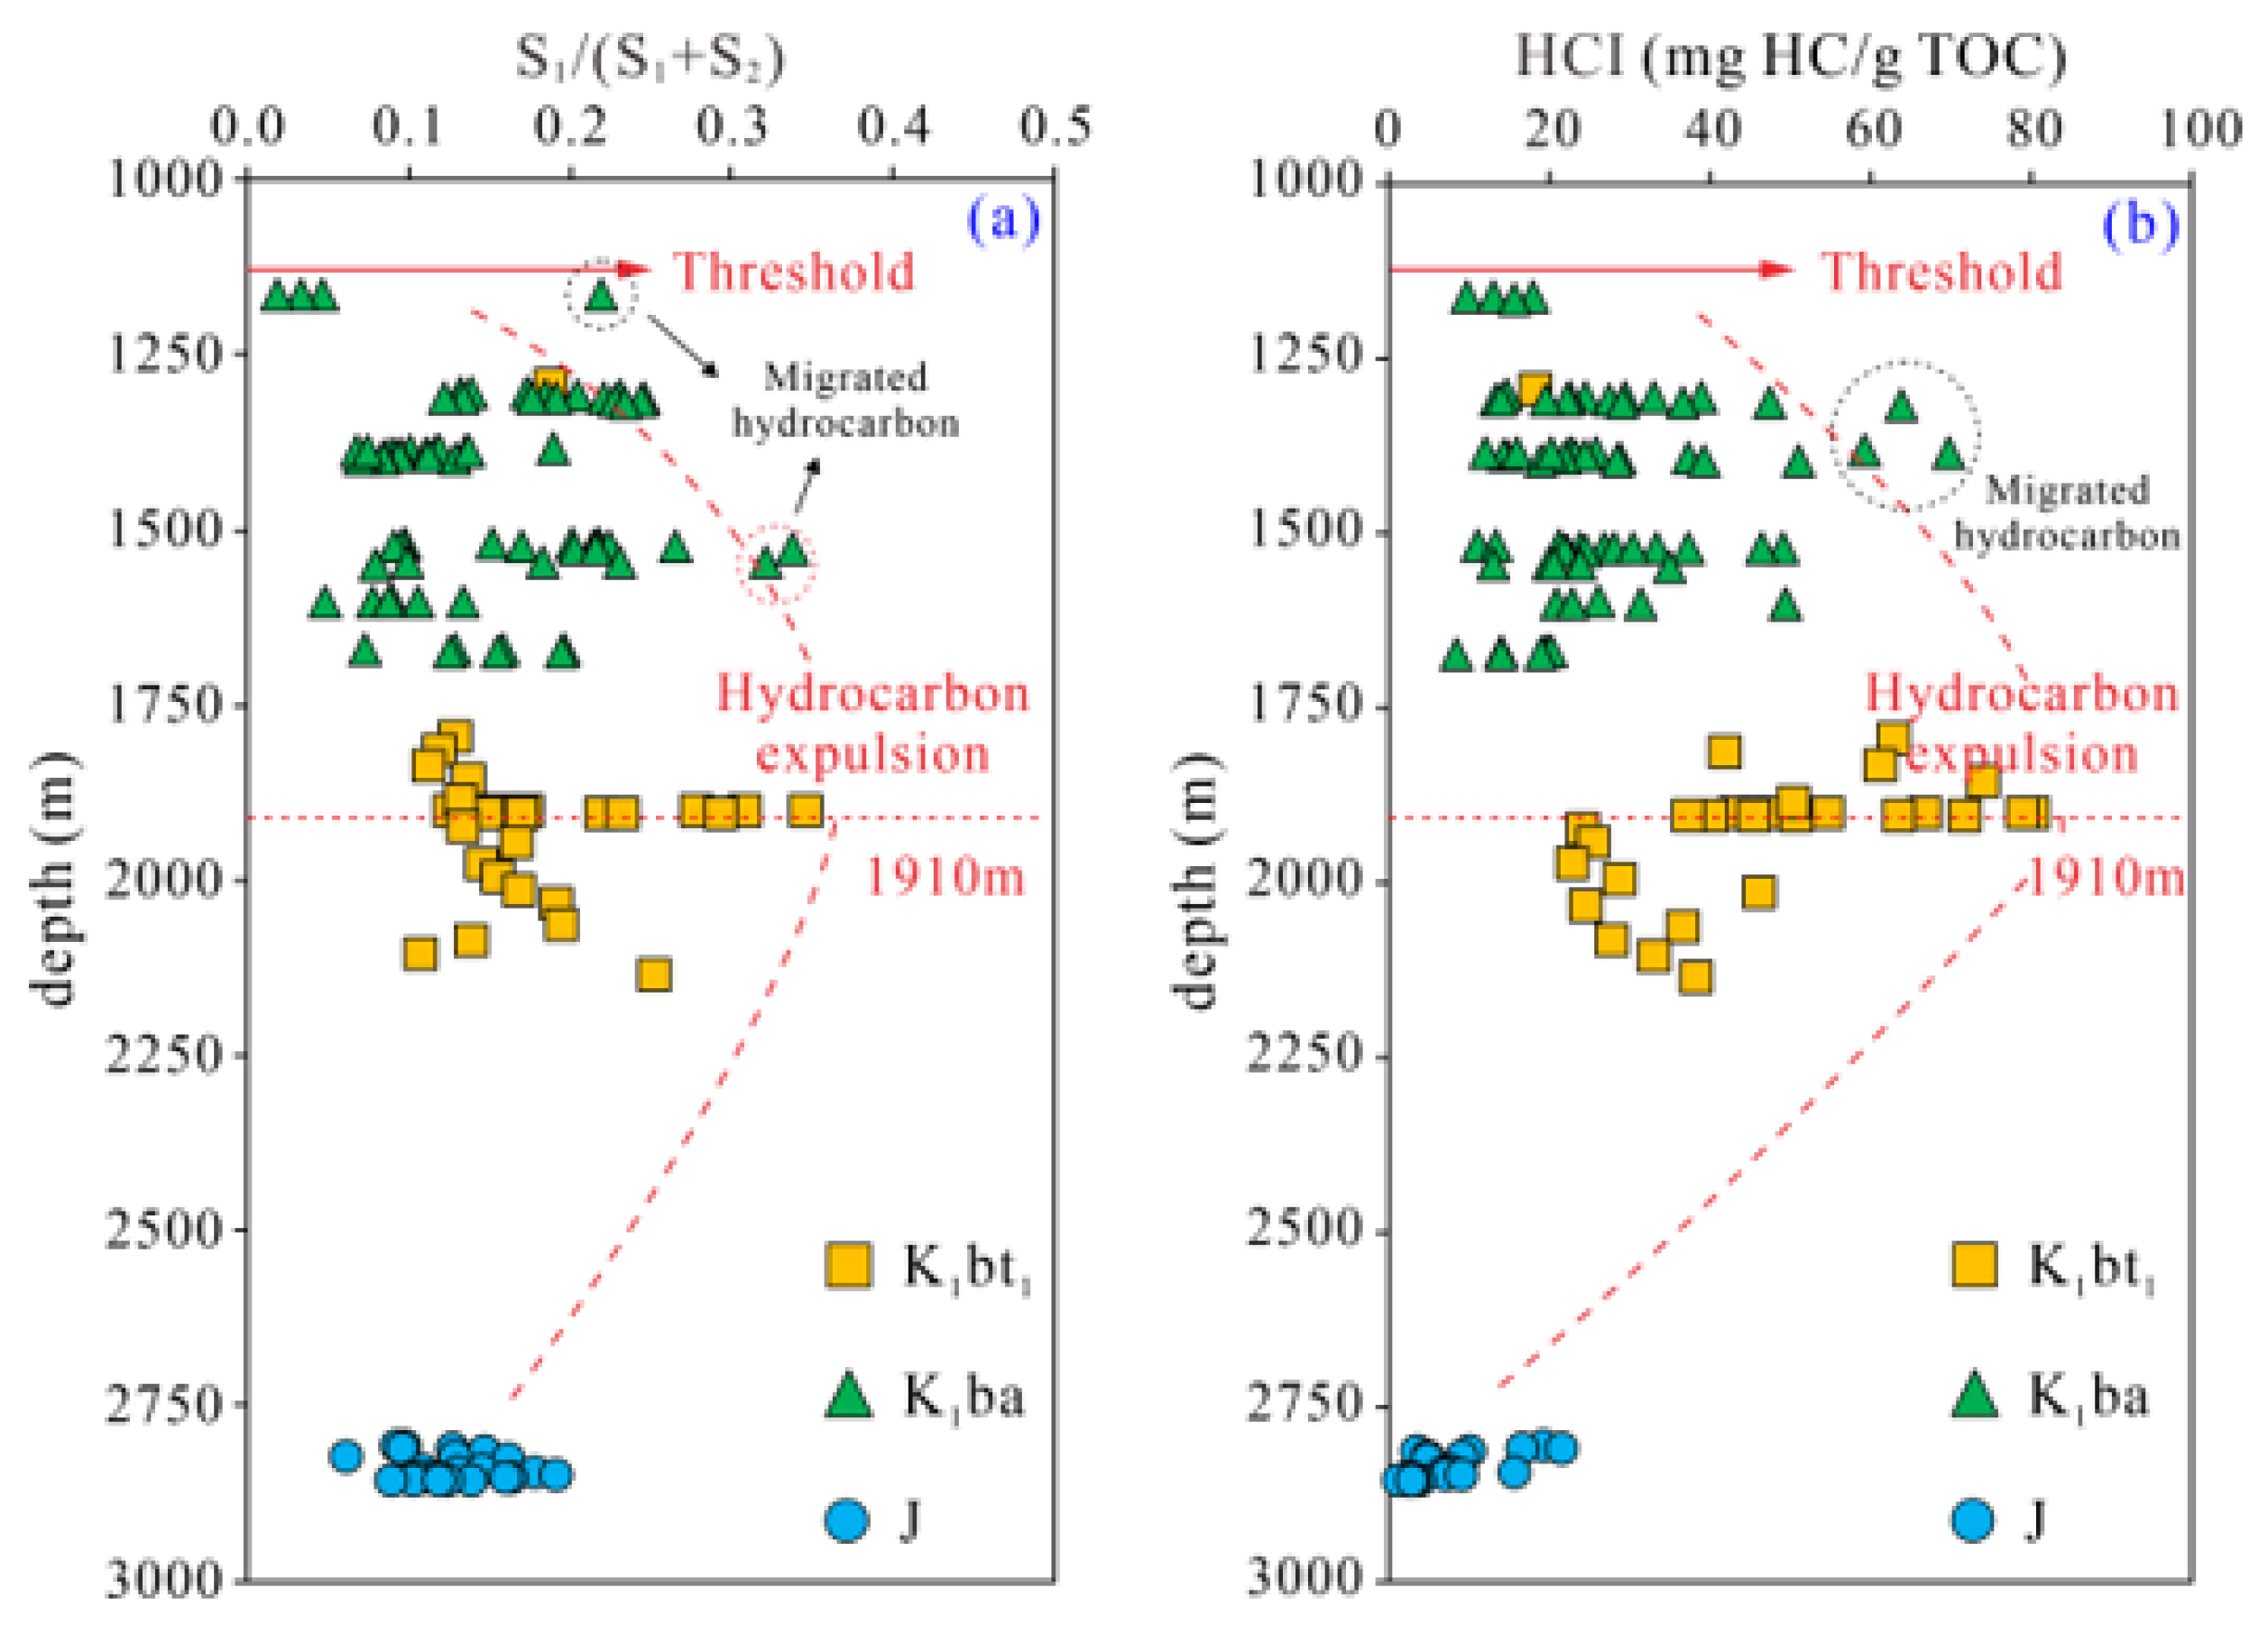
Regarding the thermal maturity threshold, the envelope curves of the soluble organic matter transformation ratio [S1/(S1 + S2)] and hydrocarbon index (HCI = S1/TOC, mg HC/g TOC) increase with burial depth, peak at around 1910 m, corresponding to the hydrocarbon expulsion threshold, and then decline. Some elevated K1ba values may reflect the influence of migrated hydrocarbons (Figure 18).
Although the Ro range is narrow, the transformation ratio of soluble organic matter, bitumen/TOC, [S1/(S1 + S2)], and HCI all show an initial increase followed by a gradual decline with depth. The Ro and RTmax values at the peak of their envelope curves are around 0.8%, corresponding to the hydrocarbon expulsion threshold (Figure 19).
In summary, compared to the mature-stage K1bt1 and K1ba formations, the Jurassic source rocks are over-mature, with hydrocarbon generation and expulsion largely complete, as indicated by the extremely low transformation ratios of soluble organic matter. However, some gas-generating potential still remains.

6. Conclusions

The K1bt1, K1ba, and Jurassic source rocks in the Baorao Trough of the Jirgalangtu Sag all meet or exceed the medium-quality standard for source rocks (TOC > 0.6%). K1bt1 and K1ba source rocks contain abundant organic matter, relatively favorable kerogen types (Type II1~II2), and have reached the low to medium maturity, making them favorable oil-generating formations. In contrast, Jurassic source rocks are dominated by Type III kerogen, have reached high maturity, and are gas-prone.
K1bt1 and K1ba source rocks share similar geochemical characteristics, indicating organic matter input from both aquatic algae and terrestrial plants, whereas Jurassic source rocks are mainly derived from terrestrial higher plants. The depositional environment of K1bt1 was weakly oxidizing to reducing and brackish, while K1ba was deposited under weakly reducing, relatively high saline conditions. Meanwhile, Jurassic source rocks formed in weakly reducing, brackish to saline settings. Additionally, saline, reducing environments favor the development of high-quality source rocks overall.
The effective TOC threshold for source rocks in the study area is 0.8%. Hydrocarbon expulsion begins when TOC exceeds these values in K1bt1 and K1ba The organic matter conversion rate peaks at around 1900 m, with a corresponding Ro value of approximately 0.8%, marking the thermal maturity threshold for expulsion. Analytical results show that K1bt1 and K1ba have undergone partial hydrocarbon expulsion but remain within the oil-generating window, retaining strong oil-generating potential. By contrast, Jurassic source rocks experienced early thermal cracking of Type III kerogen, with generated oil largely expelled or lost during early geological processes, though some gas-generating potential remains today.

Author Contributions

Conceptualization, X.X.; Methodology, Y.X.; Software, Y.H.; Validation, Y.S.; Formal analysis, H.L.; Investigation, H.Y.; Resources, J.W.; Writing—original draft, J.Z.; Writing—review & editing, Y.Q.; Visualization, R.Y. and H.Z.; Supervision, N.T.; Project administration, J.Z. All authors have read and agreed to the published version of the manuscript.

Funding

National Natural Science Foundation of China (no. 42302165).

Data Availability Statement

The original contributions presented in the study are included in the article. Further inquiries can be directed to the corresponding author.

Conflicts of Interest

Author Jieqiong Zhu, Ruichang Yan, Xin Xiang, Yawen Xing, Yulei Shi, Huili Yang, Jianping Wu, Ning Tian are employees of PetroChina Huabei Oilfield Company. The paper reflects the views of the scientists and not the company. Author Hao Zhang is an employees of China National Petroleum Corporation. The paper reflects the views of the scientists and not the company.

References

  1. Momper, J.A. Oil migration limitations suggested bygeological and geochemical considerations. AAPG Bull. 1978, 62, 545. [Google Scholar]
  2. Hunt, J.M. Petroleum Geochemistry and Geology; Free Man and Company: San Franciso, CA, USA, 1979; p. 524. [Google Scholar]
  3. Li, H.W.; Qi, Q.H.; Han, F.; Zhang, P.B.; Nie, Z.K.; Guan, X.Q. Analysis of Low-rank Coal Distribution and Coalbed Methane Enrichment Rules in Erlian Basin. China Coalbed Methane 2019, 16, 19–23, (In Chinese with English Abstract). [Google Scholar]
  4. Xiang, X.; Huang, C.Y.; Cao, L.Z.; Cao, Q.; Jiang, T.; Zhang, Y.F.; Song, Y.; Xu, J. Enrichment model and exploration potential for unconventional oi land gas in troughs, Erlian Basin. Earth Sci. Front. 2023, 30, 462–472, (In Chinese with English Abstract). [Google Scholar] [CrossRef]
  5. Wang, J.; Wang, Q.; Zhong, X.M.; Dong, X.Y.; Ma, X.F.; Sui, L.M. Characteristics of high-quality hydrocarbon source rocks and their contributions to reservoirs in the Erlian Basin. Pet. Geol. Exp. 2015, 37, 641–647, (In Chinese with English Abstract). [Google Scholar] [CrossRef]
  6. Wu, Z.Q. Source Rock and Petroleum Accumulation in Jiergalangtu Sag, Erlia Basin. Master’s Thesis, China University of Petroleum, Beijing, China, 2019. (In Chinese with English Abstract). [Google Scholar] [CrossRef]
  7. Yi, D.H.; Jia, Y.R.; Lei, M.; Shi, L.T. Analysis of hydrocarbon reservoir characteristics and its key control factors in Baorao trough, jiergalangtu sag. Xinjiang Oil Gas 2006, 2, 15–18+98, (In Chinese with English Abstract). [Google Scholar]
  8. Shi, L.T. Erlian Subtle Reservoir Studies and Reservoir DescriptionStudy on Subtle Reservoirs in Jiergalangtu Sag, Erlian Basin. Ph.D. Thesis, Chengdu University of Technology, Chengdu, China, 2012. (In Chinese with English Abstract). [Google Scholar]
  9. Wang, S.X.; Zhang, Z.H.; Zhang, Z.P.; Wang, Q.L. Geochemical Characteristics and Oil-source Correlation of the Jurassic Source Rocks in the Erlian Basin. Bull. Mineral. Petrol. Geochem. 2012, 31, 396–403, (In Chinese with English Abstract). [Google Scholar]
  10. Ding, X.J.; Liu, G.D.; Zhao, L.M.; Gao, D.K.; Zhang, K.; Kuang, D.Q. Organic Matter Enrichment and Hydrocarbon Source Rock Forming Mechanism in Small—Scale Faulted Lacustrine Basins: A Case from the First Member of Lower Cretaceous Tenger Formation in Erlian Basin. Xinjiang Pet. Geol. 2017, 38, 650–657, (In Chinese with English Abstract). [Google Scholar] [CrossRef]
  11. Yan, W.H.; Zhang, W.F.; Zhang, L.X.; Chen, Y.N. Integrative geologic evaluation and objective optimization of Saihantala sag, Erlian basin. Oil Geophys. Prospect. 2008, 139–145+196+12–13, (In Chinese with English Abstract). [Google Scholar] [CrossRef]
  12. Zhao, X.Z.; Jin, F.M.; Qi, J.F.; Wang, Q.; Yang, M.H.; Shi, Y.P.; Dong, X.Y. The Structural Types and Petroleum Geological Significance of Early Cretaceous Complex Faulted Sag in Erlian Basin. Nat. Gas Geosci. 2015, 26, 1289–1298, (In Chinese with English Abstract). [Google Scholar] [CrossRef]
  13. Zhu, Y.H.; Zhang, W.C. Type of stratigraphic sequence in Erlian basin and its significance in oil/gas exploration. Pet. Explor. Dev. 1999, 26, 49–53+5, (In Chinese with English Abstract). [Google Scholar]
  14. Jiao, G.H.; Wang, T.H.; Xing, H.S. Evolution of Rift Valley Structure and Oil-Gas in Erlian Basin; Petroleum Industry Press: Beijing, China, 2003. (In Chinese) [Google Scholar]
  15. Jiang, S.Q.; Si, J.W.; Zhao, A.J.; Wu, J.P.; Shen, J.S. Exploration of lithologic Oi Reservoirs in Jiergalangtu Depression of Erlian Basin. China Pet. Explor. 2004, 3, 46–53+7, (In Chinese with English Abstract). [Google Scholar]
  16. Sun, J.M.; Pang, X.Q.; Shen, J.S.; Liang, F.; Lang, J. Non-Structural Reservoir Exploration in Jiergalangtu Sag, Erlian Basin. Xinjiang Pet. Geol. 2005, 26, 380–382, (In Chinese with English Abstract). [Google Scholar]
  17. Fei, B.S. Petroleum Exploration of Rift Basin Group in Area of Northeast Asia, Shown by the Erlian Basin. Pet. Geol. Oilfield Dev. Daqing 2002, 21, 7–11+81, (In Chinese with English Abstract). [Google Scholar]
  18. Wu, P. The Hydrocarbon Accumulation Mechanism of Typical Depression Troughs in Erlian Basin. Master’s Thesis, China University of Geosciences, Beijing, China, 2020. (In Chinese with English Abstract). [Google Scholar] [CrossRef]
  19. Yu, X.L.; Yang, H.L.; Zu, Z.Y.; Lv, D.S.; Li, X.Y.; Zhang, L.Y. Exploration Practice and Direction in Jiergalangtu Sag, Erlian Basin. China Pet. Explor. 2013, 18, 51–55, (In Chinese with English Abstract). [Google Scholar] [CrossRef]
  20. Qi, J.F.; Zhao, X.Z.; Li, X.P.; Yang, M.H.; Xiao, Y.; Yu, F.S.; Dong, Y.Q. The distribution of Early Cretaceous faulted-sags and their relationship with basement structure within Erlian Basin. Earth Sci. Front. 2015, 22, 118–128, (In Chinese with English Abstract). [Google Scholar] [CrossRef]
  21. Mao, G.Z. Meso-Cenozoic Paleoclimate Evolution of Erlian Basin. Energy Res. Manag. 2015, 4, 92–96, (In Chinese with English Abstract). [Google Scholar] [CrossRef]
  22. Sun, Q.P.; Wang, S.W.; Tian, G.W.; Sun, B.; Chen, Y.J.; Yang, Q.; Chen, H.; Yang, M.F.; Qi, L. Accumulation patterns of low-rank coalbed methane gas in the Jiergalangtu Sag of the Erlian Basin. Nat. Gas Ind. 2018, 38, 59–66, (In Chinese with English Abstract). [Google Scholar] [CrossRef]
  23. GB/T 19145-2022; Determination for Total Organic Carbon in Sedimentary Rock. Standardization Administration of the People’s Republic of China: Beijing, China, 2022.
  24. GB/T 18602-2012; Rock Pyrolysis Analysis. Standardization Administration of the People’s Republic of China: Beijing, China, 2012.
  25. GBW07107; Standard Material for Rock Composition Analysis. Institute of Geophysical and Geochemical Exploration, Chinese Academy of Geological Sciences: Heibei, China, 1988.
  26. Nesbitt, H.; Young, G.M. Early Proterozoic climates and plate motions inferred from major element chemistry of lutites. Nature 1982, 299, 715–717. [Google Scholar] [CrossRef]
  27. McLennan, S.M. Weathering and global denudation. J. Geol. 1993, 101, 295–303. [Google Scholar] [CrossRef]
  28. GB/T 19144-2010; Isolation Method for Kerogen from Sedimentary Rock. Standardization Administration of the People’s Republic of China: Beijing, China, 2010.
  29. SY/T 5124-2012; Method of Determining Microscopically the Reflectance of Vitrinite in Sedimentary. Standardization Technical Committee for Petroleum Geological Exploration: Beijing, China, 2012.
  30. GB/T 19143-2017; Analytical Method of Element for Carbon, Hydrogen, Oxygen and Nitrogen in Rock Organics. Standardization Administration of the People’s Republic of China: Beijing, China, 2017.
  31. SY/T 5238-2019; Analysis Method for Carbon and Oxygen Isotope of Organic Matter and Carbonate. Standardization Technical Committee for Petroleum Geological Exploration: Beijing, China, 2019.
  32. GB/T 18340.5-2010; Organic Geochemical Analysis Methods for Geological Samples—Part 5: Analysis of Saturated Hydrocarbons in Rock Extracts and Crude Oils—Gas chromatography. Standardization Administration of the People’s Republic of China: Beijing, China, 2010.
  33. GB/T 18606-2017; The Test Method for Biomarkers in Sediment and Crude Oil by GC-MS. Standardization Administration of the People’s Republic of China: Beijing, China, 2017.
  34. Espitalie, J.; Madec, M.; Tissot, B.P.; Mennig, J.J.; Leplat, P. Source rock characterization method for petroleum exploration. In Proceedings of the Offshore Technology Conference, Houston, TX, USA, 5–8 May 1977. [Google Scholar]
  35. Tissot, B.P.; Welte, D.H. Petroleum Formation and Occurrence; Springer: Berlin/Heidelberg, Germany; New York, NY, USA, 1978. [Google Scholar]
  36. Peters, K.E.; Cassa, M.R. Applied source rock geochemistry. Pet. Syst.—Source Trap 1994, 60, 93–120. [Google Scholar]
  37. Forsman, J.P.; Hunt, J.M. Insoluble organic matter (kerogen) in sedimentary rocks. Geochim. Cosmochim. Acta 1958, 15, 170–182. [Google Scholar] [CrossRef]
  38. Van Krevelen, D.W. Coat; Elservier Publishing Co.: Amsterdam, The Netherlands, 1961; pp. 514–515. [Google Scholar]
  39. Rigby, D.; Batts, B.D.; Smith, J.W. The effect of maturation on the isotopic composition of fossil fuels. Org. Geochem. 1981, 3, 29–36. [Google Scholar] [CrossRef]
  40. Golyshev, S.I.; Verkhovskaya, N.A.; Burkova, V.N.; Matis, E.Y. Stable carbon isotopes in source-bed organic matter of West and East Siberia. Org. Geochem. 1991, 14, 277–291. [Google Scholar] [CrossRef]
  41. Jarvie, D.M.; Claxton, B.L.; Henk, F.; Breyer, J.T. Oil and shale gas from the Barnett Shale, Ft. In Worth Basin Texas. In Proceedings of the AAPG Annual Meeting Program, Denver, CO, USA, 3–6 June 2001. [Google Scholar]
  42. Cranwell, P.A.; Eglinton, G.; Robinson, N. Lipids of aquatic organisms as potential contributors to lacustrine sediments—II. Org. Geochem. 1987, 11, 513–527. [Google Scholar] [CrossRef]
  43. Rommerskirchen, F.; Plader, A.; Eglinton, G.; Chikaraishi, Y.; Rullktter, J.R. Chemotaxonomic significance of distribution and stable carbon isotopic composition of long-chain alkanes and alkan-1-ols in C4 grass waxes. Org. Geochem. 2006, 37, 1303–1332. [Google Scholar] [CrossRef]
  44. Volkman, J.K. A review of sterol markers for marine and terrigenous organic matter. Org. Geochem. 1986, 9, 83–99. [Google Scholar] [CrossRef]
  45. Hu, Y.M.; Yang, H.F.; Wang, F.L.; Gao, Y.F.; Tang, G.M.; Tang, Y.G.; Sun, P. Organic facies characteristics of source rocks and its indication for high qualitysource rocks of Miaoxi area, Bohai Sea. Nat. Gas Geosci. 2023, 34, 226–239, (In Chinese with English Abstract). [Google Scholar] [CrossRef]
  46. Van Aarssen, B.G.K.; Cox, H.C.; Hoogendoorn, P.; De Leeuw, J.W. A cadinene biopolymer in fossil and extant dammar resins as a source for cadinanes and bicadinanes in crude oils from South East Asia. Geochim. Cosmochim. Acta 1990, 54, 3021–3031. [Google Scholar] [CrossRef]
  47. Peters, K.E.; Walters, C.C.; Moldowan, J.M. The Biomarker Guide; Cambridge University Press: Cambridge, UK, 2005. [Google Scholar]
  48. Sepúlveda, J.; Wendler, J.; Leider, A.; Kuss, H.; Summons, R.E.; Hinrichs, K. Molecular isotopic evidence of environmental and ecological changes across the Cenomanian-Turonian boundary in the Levant Platform of central Jordan. Org. Geochem. 2009, 40, 553–568. [Google Scholar] [CrossRef]
  49. Zhang, K.; Liu, R.; Ding, W.; Li, L.; Liu, Z. The influence of Early Cretaceous paleoclimate warming event on sedimentary environment evolution and organic matter sources in Yin’E Basin:evidence from petrology and molecular geochemistry. Int. J. Coal Geol. 2022, 254, 103972. [Google Scholar] [CrossRef]
  50. Powell, T.G. Pristane/phytane ratio as environmental indicator. Nature 1988, 6174, 604. [Google Scholar] [CrossRef]
  51. Kruge, M.A.; Hubert, J.F.; Akes, R.J.; Meriney, P.E. Biological markers in Lower Jurassic synrift lacustrine black shales, Hartford basin, Connecticut, U.S.A. Org. Geochem. 1990, 15, 281–289. [Google Scholar] [CrossRef]
  52. Xiao, H.; Li, M.J.; Nettersheim, B.J. Short chain tricyclic terpanes as organic proxies for paleo-depositional conditions. Chem. Geol. 2024, 652, 122023. [Google Scholar] [CrossRef]
  53. Neto, F.R.A.; Trendel, J.M.; Restlé, A.; Connan, J.; Albrecht, P. Occurrence and formation of tricyclic terpanes in sediments and petroleums. In Advances in Organic Geochemistry; Pergamon Press: Oxford, UK, 1983; pp. 659–667. [Google Scholar]
  54. Simoneit, B.R.T.; Schoell, M.; Dias, R.F.; Neto, F.R.A. Unusual carbon isotope compositions of biomarker hydrocarbons in a Permian tasmanite. Geochim. Cosmochim. Acta 1993, 57, 4205–4211. [Google Scholar] [CrossRef]
  55. Peters, K.E.; Moldowan, J.M. Effects of source, thermal maturity, and biodegradation on the distribution and isomerization of homohopanes inpetroleum. Org. Geochem. 1991, 17, 47–61. [Google Scholar] [CrossRef]
  56. Yang, X.Y.; Lv, X.X.; Huang, Y.H.; He, Y.L.; Yang, R.; Wang, R.Y.; Peng, P. The Depositional Environment of the Lacustrine Source Rocks in the Eocene Middle Number of the Liushagang Formation of the Weixinan Sag, Beibuwan Basin, China: Implications from Organic Geochemical Analyses. Minerals 2023, 13, 575. [Google Scholar] [CrossRef]
  57. Sinninghe Damste, J.S.; Kenig, F.; Koopmans, M.P.; Koster, J.; Schouten, S.; Hayes, J.M.; De Leeuw, J.W. Evidence for gammacerane as an indicator of water column stratification. Geochim. Cosmochim. Acta 1995, 59, 1895–1900. [Google Scholar] [CrossRef]
  58. Quan, Y.B.; Liu, J.Z.; Hao, F.; Cai, Z.; Xie, Y. Paleosalinity assessment and its influence on source rock deposition in the western Pearl River Mouth Basin, South China Sea. GSA Bull. 2020, 132, 1741–1755. [Google Scholar] [CrossRef]
  59. Shen, J.; Yin, R.; Zhang, S. Intensified continental chemical weathering and carbon-cycle perturbations linked to volcanism during the Triassic–Jurassic transition. Nat. Commun. 2022, 13, 299. [Google Scholar] [CrossRef]
  60. Zhang, P.; Yang, M.; Lu, J. Middle Jurassic terrestrial environmental and floral changes linked to volcanism: Evidence from the Qinghai-Tibet Plateau, China. Glob. Planet. Change 2023, 223, 104094. [Google Scholar] [CrossRef]
  61. Montero-Serrano, J.C.; Foellmi, K.B.; Adatte, T. Continental weathering and redox conditions during the early Toarcian oceanic anoxic event in the northwestern Tethys: Insight from the Posidonia shale section in the Swiss Jura Mountain. Palaeogeogr. Palaeoclimatol. Palaeoecol. 2015, 429, 83–99. [Google Scholar] [CrossRef]
  62. Calvert, S.E. Oceanographic controls on the accumulation of OM in marine sediments. Geol. Soc. Lond. Spec. Publ. 1987, 26, 137–151. [Google Scholar] [CrossRef]
  63. Hao, F.; Zhou, X.H.; Zhu, Y.M.; Yang, Y.Y. Lacustrine source rock deposition in response to co-evolution of environments and organisms controlled by tectonic subsidence and climate, Bohai Bay Basin, China. Org. Geochem. 2012, 42, 323–339. [Google Scholar] [CrossRef]
  64. Demaison, G.J.; Moore, G.T. Anoxic environments and oil source bed genesis. Org. Geochem. 1980, 2, 9–31. [Google Scholar] [CrossRef]
  65. Ma, X.X.; Yao, S.P.; Zhang, B.L.; Zhang, Y.X.; Peng, J. Redox Conditions of Paleogene Paleolake and Development Models of High-quality Source Rocks in the Dongpu Sag, Bohai Bay Basin. Geol. J. China Univ. 2019, 25, 801–812. [Google Scholar] [CrossRef]
  66. England, W.A.; Mackenzie, A.S.; Mnn, D.M.; Quigley, T.M. The movement and entrapment of petroleum fluids in the subsurface. J. Geol. Soc. 1987, 144, 327–347. [Google Scholar] [CrossRef]
  67. Michele, M.T.J.A. Scaled Physical Model of Secondary Oil Migration. AAPG Bull. 1995, 79, 19–28. [Google Scholar] [CrossRef]
  68. Cobbold, P.R.; Meisling, K.E.; Mount, V.S. Reactivation of an obliquely rifted margin, Campos and Santos basins, southeastern Brazil. AAPG Bull. 2001, 85, 1925–1944. [Google Scholar] [CrossRef]
  69. Pang, X.Q.; Li, M.W.; Li, S.M.; Jin, Z.J. Geochemistry of petroleum systems in the Niuzhuang South Slope of Bohai Bay Basin. Part 2: Evidence for significant contribution of mature source rocks to “immature oils” in the Bamianhe field. Org. Geochem. 2003, 34, 931–950. [Google Scholar] [CrossRef]
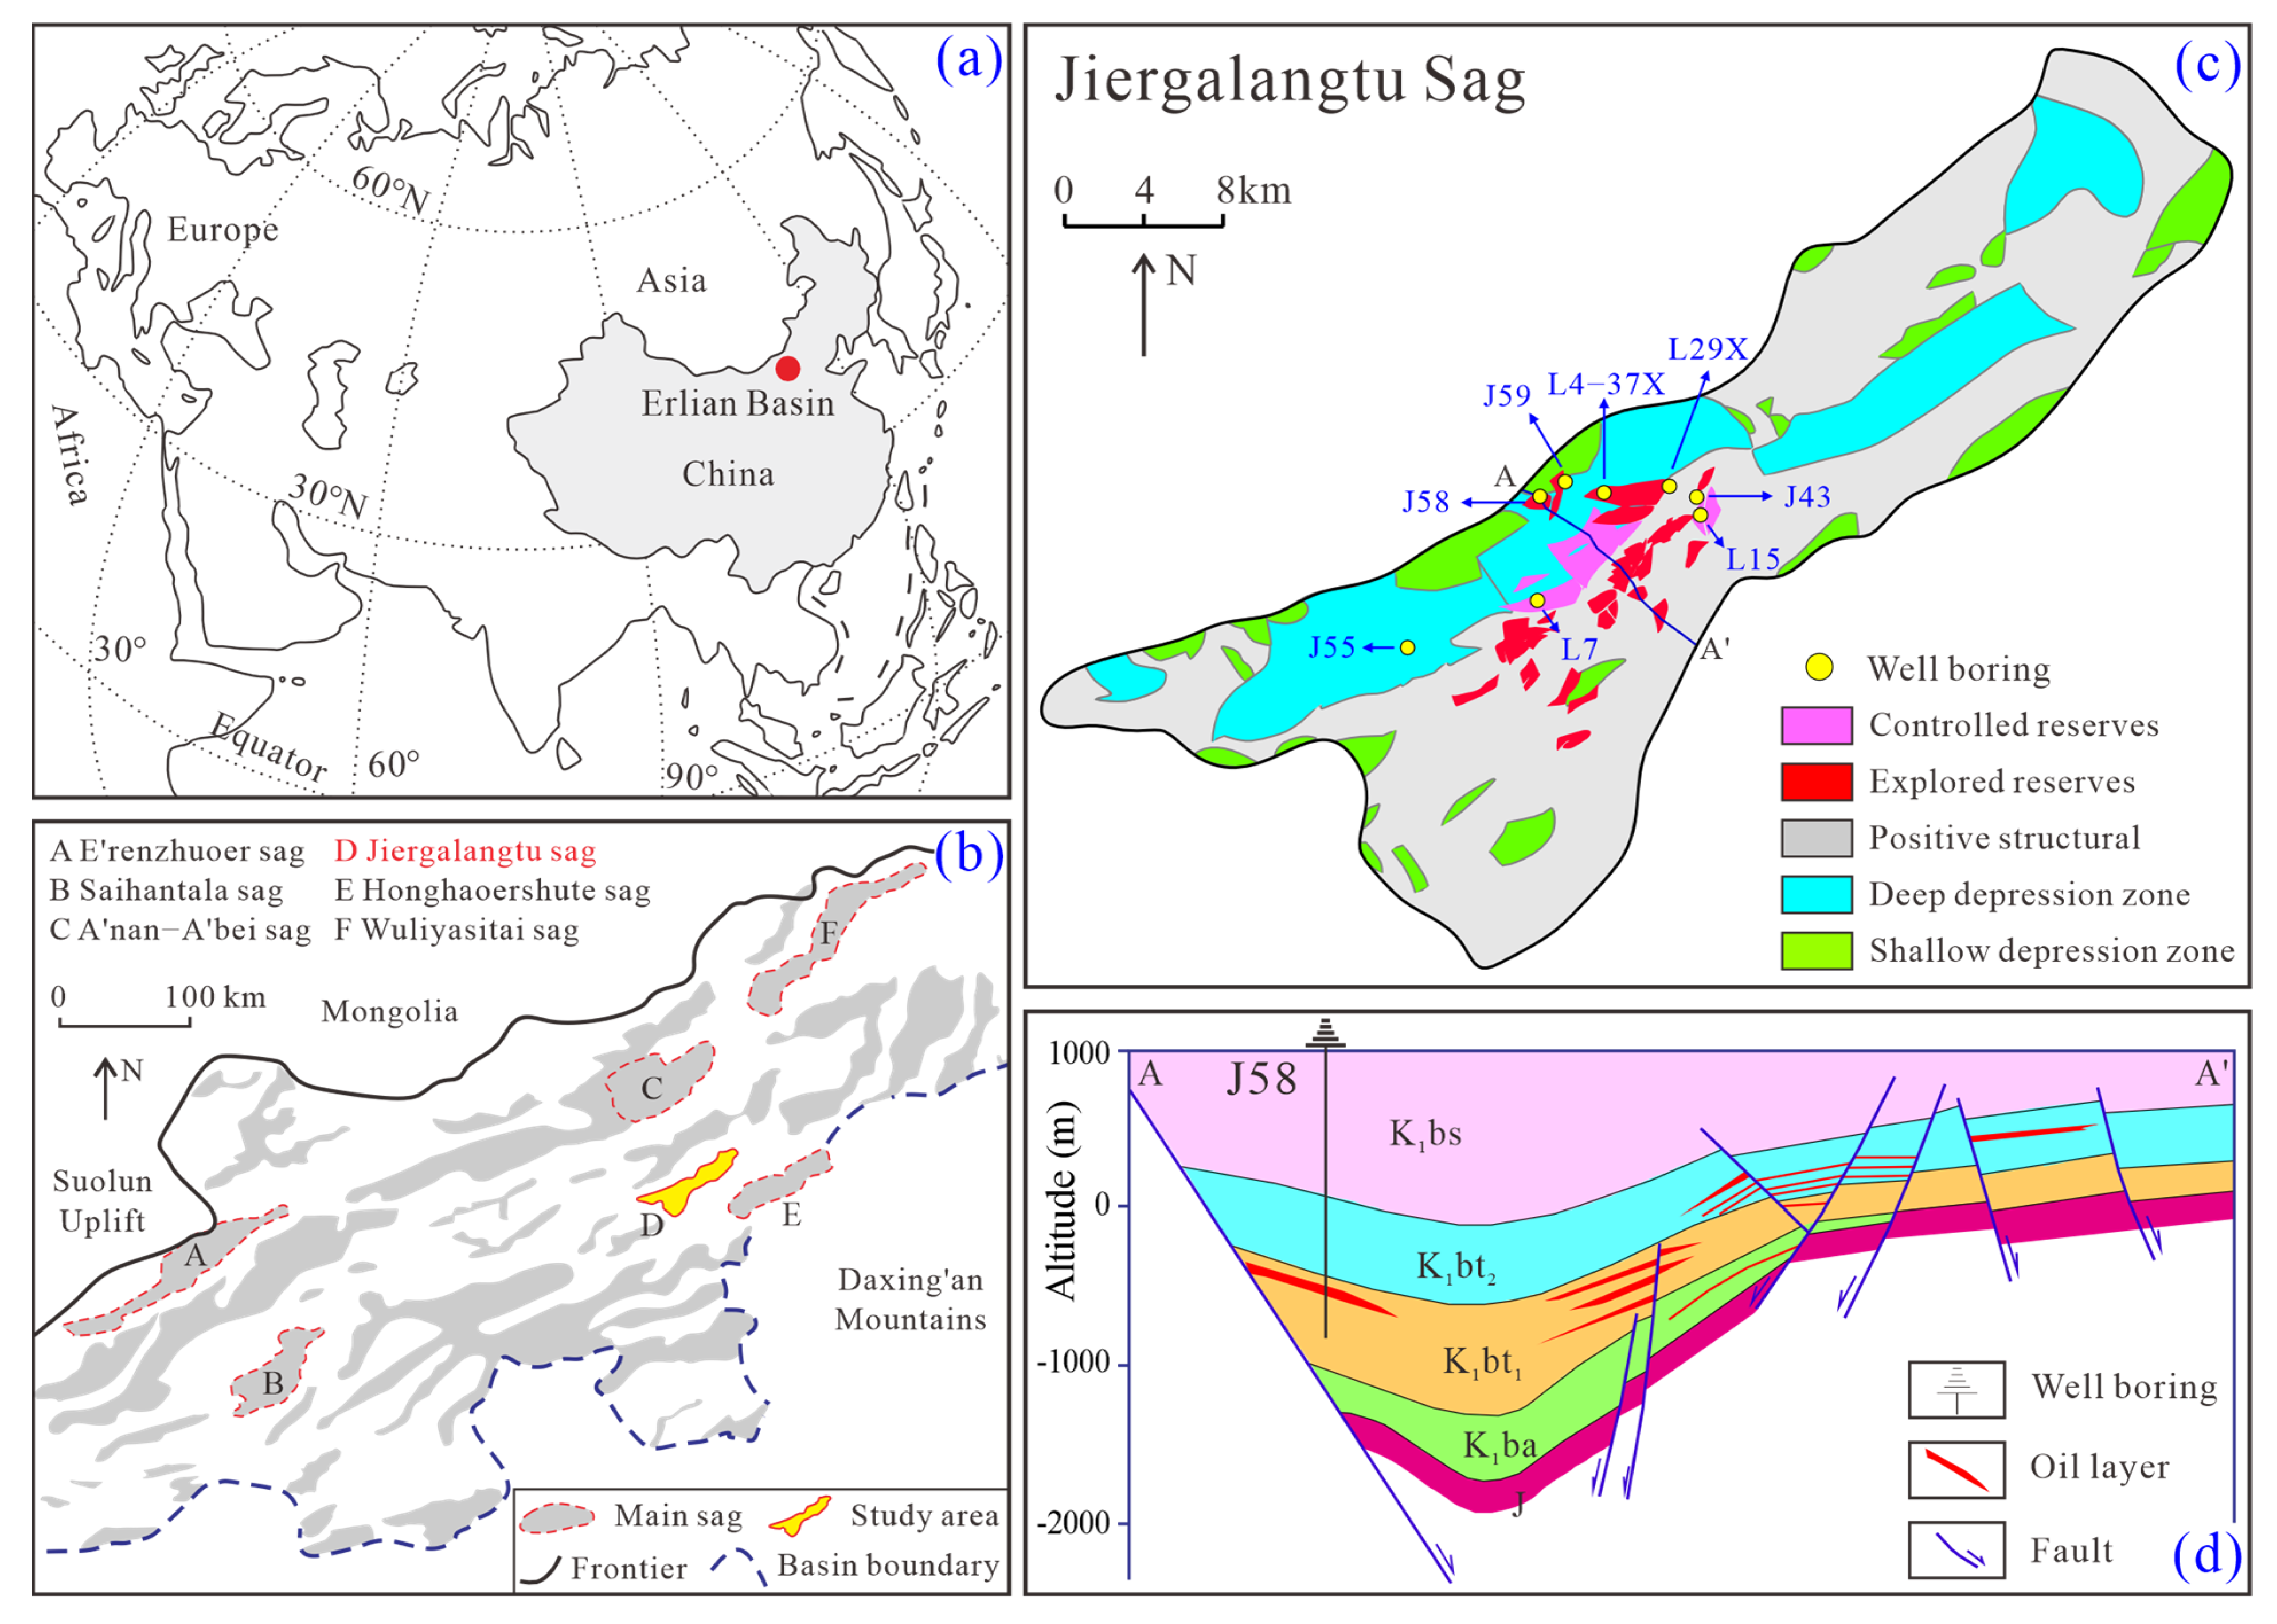
Figure 1. (a) Location of the Erlian Basin in China; (b) structural units and location of the Jiergalangtu Sag within the Erlian Basin; (c) hydrocarbon accumulations and sub-units of the Jiergalangtu Sag; (d) cross-section showing the structural framework of the Baorao Trough.
Minerals 15 01002 g001
Figure 3. TOC distribution frequency histogram, showing TOC contents difference of (a) K1bt1; (b) K1ba and (c) Jurassic in the Baorao Trough.
Minerals 15 01002 g003
Figure 4. S1+ S2 distribution frequency histogram, showing S1 + S2 values difference of (a) K1bt1, (b) K1ba and (c) Jurassic in the Baorao Trough.
Minerals 15 01002 g004
Figure 5. HI distribution frequency histogram, showing HI values difference of (a) K1bt1, (b) K1ba and (c) Jurassic in the Baorao Trough.
Minerals 15 01002 g005
Figure 6. Fingerprint characteristic diagrams of saturated hydrocarbon GC analysis of representative samples, showing n-alkanes and characteristic isoprenoids.
Minerals 15 01002 g006
Figure 7. Fingerprint characteristic diagram of saturated hydrocarbon GC–MS analysis (m/z 191) of representative samples, showing characteristic terpenoids.
Minerals 15 01002 g007
Figure 8. Fingerprint characteristic diagram of Saturated hydrocarbon GC–MS analysis (m/z 217) of representative samples, showing characteristic steroids.
Minerals 15 01002 g008
Figure 9. Scatter diagram of organic matter abundance and types evaluation: (a) HI vs. Tmax [34]; (b) H/C vs. O/C [35]; (c) S2 vs. TOC [35].
Minerals 15 01002 g009
Figure 10. Relationship diagrams of depth vs. (a) Ro and (b) RTmax.
Minerals 15 01002 g010
Figure 11. Ternary diagrams: (a) C27-C28-C29 steranes [44,45], (b) tricyclic terpenes series [47,48].
Minerals 15 01002 g011
Figure 12. Correlation analysis of RTmax and (a) C29 Ster. αααS/(S + R), (b) C29Ster. αββ/(ααα + αββ).
Minerals 15 01002 g012
Figure 13. Scatter diagram of biomarker parameters showing redox: (a) Pr/nC17 vs. Ph/nC18, and salinity: (b) Ga/C30H vs. Pr/Ph; (c) Ga/C31H vs. C35H/C31H + C32H.
Minerals 15 01002 g013
Figure 14. L29X well geochemical comprehensive histogram.
Minerals 15 01002 g014
Figure 15. Relationship diagrams of (a) Ga/[C31H(S + R)/2] vs. TOC and (b) Pr/Ph vs. TOC.
Minerals 15 01002 g015
Figure 16. Relationship diagrams of (a) S/H vs. TOC and (b) Ster.C29/C27+28+29(%) vs. TOC.
Minerals 15 01002 g016
Figure 17. Relationship diagrams of (a) S1/(S1 + S2) vs. TOC and (b) bitumen/TOC vs. TOC, showing the hydrocarbon expulsion characteristics and the low organic matter abundance limit of the Baorao Trough.
Minerals 15 01002 g017
Figure 18. Relationship diagrams of (a) depth vs. S1/(S1 + S2), and (b) depth vs. HCI, showing depth of hydrocarbon expulsion threshold.
Minerals 15 01002 g018
Figure 19. Relationship diagrams of (a) Ro vs. bitumen/TOC, (b) RTmax vs. S1/(S1 + S2), and (c) RTmax vs. HCI, showing thermal maturity of hydrocarbon expulsion threshold.
Minerals 15 01002 g019
Table 1. Representative biomarker parameters for source rock samples in the Baorao Trough.
WellStrataDepth
(m)
Pr/PhPr/nC17Ph/nC18OEPC27 Ster.
(%)
C29 Ster.
(%)
C19+20 TT
(%)
C21 TT
(%)
C23 TT
(%)
Ga/C30HGa/C31HS/HC35H/C31+32H
L4-37XK1bt11860~18700.980.190.191.1325.6760.490.440.300.260.070.140.140.08
L4-37XK1bt11950~19601.070.220.231.0827.6656.430.450.290.270.100.210.210.19
L4-37XK1bt12040~20501.020.150.141.0027.8654.830.440.310.250.110.210.270.19
L4-37XK1bt12140~21501.000.120.131.0327.2457.250.480.370.150.130.270.370.24
J43K1ba1390.580.640.520.891.2014.9671.680.430.270.300.442.280.280.22
J43K1ba1394.40.550.631.221.2118.7667.450.400.260.350.100.420.360.24
J43K1ba1400.20.570.510.981.1915.3172.640.380.280.340.110.500.280.18
J55K1ba1306.81.400.370.261.0225.1757.480.460.280.260.170.390.460.49
J55K1ba1315.341.450.460.311.0126.6355.940.400.270.330.120.330.390.33
J58K1ba1520.751.080.280.211.0222.2063.100.420.260.310.150.300.320.30
J58K1ba1523.550.880.280.281.0828.8155.260.400.320.280.200.610.160.42
J58K1ba1527.60.990.280.301.0121.7062.980.460.310.220.210.500.440.48
J58K1ba1548.381.120.400.321.1330.1657.280.440.290.260.230.640.190.41
J58K1ba1602.260.790.220.271.0317.0366.520.410.330.260.280.890.200.30
J58K1ba1603.760.750.220.291.0618.8665.620.410.340.250.200.650.220.27
J59K1ba1166.010.590.641.191.2428.8853.870.400.350.260.251.530.330.29
J7K1ba1673.061.080.170.181.1726.7158.270.340.290.380.120.440.180.34
J15K1ba1388.251.500.640.431.2352.9838.530.500.220.270.110.280.260.29
J29XJ2820~28240.890.230.220.9629.8552.720.390.280.330.100.240.350.24
J29XJ2857.10.600.330.550.9129.6053.970.400.280.320.160.480.350.22
J29XJ2858.950.610.180.290.9832.9848.930.350.260.390.150.370.370.26
J29XJ2860.60.620.140.190.8226.4657.200.370.270.370.180.490.360.24
Note: Pr/Ph = pristane/phytane; Pr/nC17 = pristane/nC17; Ph/nC18 = phytane/nC17; OEP (odd–even predominance) = [ ( c i + 6 c i + 2 + c i + 4 ) / 4 c i + 1 + 4 c i + 3 ] ( 1 ) i + 1 , in which i stands for the carbon number of the main peak carbon; C27Ster. (%) = C29Sterane/(C27Sterane + C28Sterane + C29Sterane); C29Ster. (%) = C29Sterane/(C27Sterane + C28Sterane + C29Sterane); Ga/C30H = gammacerane/C30hopane; Ga/C31H = gammacerane/C31hopane; S/H = steranes/hopanes; C35H/C31+32H = C35hopane/(C31hopane + C32hopane.
Disclaimer/Publisher’s Note: The statements, opinions and data contained in all publications are solely those of the individual author(s) and contributor(s) and not of MDPI and/or the editor(s). MDPI and/or the editor(s) disclaim responsibility for any injury to people or property resulting from any ideas, methods, instructions or products referred to in the content.