Article

Mineral Liberation Analysis (MLA)-Based Characterization of Lithium Source: Biotite and Associated Minerals in Nepheline Syenites

by
Zeynep Üçerler-Çamur
1,*,
Ozgul Keles
2 and
Murat Olgaç Kangal
1
1
Mineral Processing Engineering Department, Faculty of Mines, Istanbul Technical University, Maslak, Istanbul 34469, Türkiye
2
Metallurgy and Material Engineering Department, Faculty of Chemistry and Metallurgy, Istanbul Technical University, Maslak, Istanbul 34469, Türkiye
*
Author to whom correspondence should be addressed.
Minerals 2025, 15(8), 876; https://doi.org/10.3390/min15080876 (registering DOI)
Submission received: 22 July 2025 / Revised: 8 August 2025 / Accepted: 18 August 2025 / Published: 20 August 2025
(This article belongs to the Section Mineral Processing and Extractive Metallurgy)

Abstract

Due to the rapid advancement of technology, lithium carbonate has become a crucial raw material for battery storage applications. Brines remain the primary source, while lithium carbonate production from ores is limited. Therefore, expanding resources, identifying potential deposits, and characterizing existing sources are essential. Direct lithium detection via MLA is challenging due to its atomic number being below 6; however, it can be indirectly identified through lithium-bearing biotite. This study characterizes lithium-bearing biotite in nepheline syenite ore, considering biotite as the primary lithium source. Analytical methods included MLA, modal mineralogy, XRD, ICP-OES, XRF, SEM-BSE, and EDS. The ore contained 4% biotite, with a liberation degree exceeding 70% in particles finer than 500 µm. Biotite formed binary, ternary, and complex associations with K-feldspar, nepheline, and albite. Finer particle sizes increased biotite liberation while reducing associations; no binary biotite–nepheline associations were detected below 75 µm. EDS spectra confirmed biotite as the sole lithium-bearing mineral.

1. Introduction

Electrical-driven appliances and vehicles have become part of our lives. In the last decades, to reduce the great risk of climate change on our planet, using zero-emission electric vehicles has been one of the options. The batteries used to run these vehicles are lithium-bearing, so-called lithium-ion batteries, where lithium serves as the most critical raw material. Currently, the production of lithium carbonate directly from primary ore sources is relatively limited, with lithium carbonate predominantly being extracted directly from brines or boron waste [1,2]. Lithium has been classified as a critical element in multiple studies due to its significance for green technologies. Furthermore, it was recognized as one of the 15 essential minerals in the International Strategic Minerals Inventory (ISMI) during the 1980s and 1990s, with the involvement of several countries [3]. Therefore, the characterization of Li-bearing ores has been emphasized as a critical step for its future recovery and utilization as a primary raw material. Lithium minerals are primarily found in pegmatitic and sedimentary rocks, brines, and as secondary sources in recycled waste batteries [2]. However, nepheline syenite, a coarse-grained, silica-poor plutonic rock, is predominantly composed of 48–54% albite (NaAlSi3O8), 18–23% microcline (KAlSi3O8), and 20–25% nepheline ((Na,K)AlSiO4), along with minor amounts of mafic silicates, such as mica, hornblende, and magnetite. Notably, biotite, a mafic mica mineral present within nepheline syenite, is capable of incorporating trace amounts of lithium into its structure, highlighting the potential of nepheline syenite as a secondary lithium source. Within nepheline syenites, both muscovite and biotite are present as mica minerals. Muscovite, a potassium-rich alumina-silicate, contrasts with biotite, which contains iron and magnesium in its structure and demonstrates a capacity to host trace lithium [4,5,6]. The feldspathic nature and low silica content of nepheline syenite not only distinguish it from other igneous rocks but also significantly influence its physical, chemical, and industrial properties [7,8].
Lithium recovery from nepheline syenite ores requires the effective removal of iron- and titanium-bearing minerals, commonly through magnetic separation and flotation techniques. In this context, characterizing the mineralogical composition of the ore, especially identifying lithium-bearing phases such as biotite, is essential for determining the most suitable beneficiation method, such as flotation or magnetic separation. Detailed characterization not only guides process selection but also enables the reassessment of traditionally discarded minerals as potential lithium sources [7,9,10].
Biotite- and lithium-bearing zinnwaldites can coexist in nature, and together with siderophyllite and lepidolite, they form a continuous compositional progression within trioctahedral micas. This transformation is driven by metasomatic ion exchange, where lithium substitutes for divalent cations such as Fe2+ and Mg2+. The process primarily occurs in granite, particularly in transitional forms between biotite and lithium-mica granite. Ion exchange leads to the replacement of Fe and Mg by Li, alongside the removal of Ca from plagioclase feldspar and Na enrichment. Siderophyllite, an Fe-rich, Li-poor variant of biotite, marks the starting point of this progression, which is facilitated by Li enrichment in the surrounding granite. This enrichment produces a Li-rich aureole around granite intrusions, conducting the gradual conversion of biotite into zinnwaldite and ultimately lepidolite [11].
Zinnwaldite serves as an intermediate in this sequence, characterized by a higher lithium content (1–2.5 Li atoms per formula unit) and lower Fe content (8–20 wt.% FeO) than siderophyllite, which contains less than 1 Li atoms and more than 20 wt.% FeO. Lepidolite, the most Li-rich and Fe-poor mica, represents the final stage of this progression. Textural evidence, such as zoning within mica grains, shows an increase in Li2O and a decrease in FeO from the core to the edge, indicating the continuous nature of this transformation. Furthermore, the replacement of K-feldspar by zinnwaldite suggests late-stage growth, reinforcing the progressive metasomatic process that evolves from siderophyllite to lepidolite within granitic environments [11].
The characterization of such minerals is crucial for the future design of beneficiation processes. Even though the analysis does not focus on biotite, the MLA-based studies of lithium-bearing minerals like zinnwaldite provide insight into potential processes for their extraction. This methodology offers a critical understanding of how mineral characteristics can inform the development of future processing strategies, highlighting the significance of such research in enhancing the process efficiency and optimizing recovery outcomes. The research studied by Sandmann and Gutzmer [12] evaluated the use of mineral liberation analysis (MLA) for characterizing lithium-bearing zinnwaldite. The study evaluated two comminution methods for lithium-bearing zinnwaldite ore, finding MLA to be effective at optimizing processing by identifying the optimal size fraction for beneficiation and demonstrating its potential for improving mineral liberation in response to the future lithium demand. However, Leißner et al. [13] developed an alternative model for determining the mineral liberation of zinnwaldite and associated gangue minerals. This model utilized SEM-based image analysis and ICP-OES for data acquisition, providing critical information necessary for the analysis of mineral liberation in this context. However, studies have utilized MLA-based characterization to investigate biotite in conjunction with accessory minerals such as apatite, monazite, xenotime, and zircon, focusing on their spatial distribution and liberation behavior. Clarke et al. [14] expanded on this approach by examining the mechanisms responsible for the further enrichment of these accessory minerals, which exhibit a strong spatial association with biotite. The capabilities and applications of MLA cover a scanning electron microscope equipped with energy-dispersive X-ray spectrometers and automated software for mineralogical analysis. The MLA enables the high-throughput, unbiased quantification of the mineral composition, modal mineralogy, porosity, grain size and shape, mineral associations, and textural mapping [15].
In this study, Li-bearing biotite minerals in nepheline syenite rocks from the Central Anatolia region in Türkiye were characterized. The primary objectives were to identify the source of lithium, analyze its mineral associations, and evaluate the degrees of liberation of these minerals. This comprehensive approach aimed to provide a deeper understanding of the distribution and behavior of lithium within the geological context of nepheline syenite rocks by advanced analytical techniques, including MLA analyses, SEM-BSE imaging, EDS spectra, and modal mineralogy.
In the region, where nepheline syenite is actively mined, biotite has historically been regarded as waste material. In this research, detailed characterization studies were carried out on the potential for recovering lithium associated with biotite through advanced beneficiation and extraction processes from ore, such as flotation.
The ability to efficiently and economically extract lithium from biotite highlights the region’s potential as a significant resource base while simultaneously addressing critical sustainability challenges by transforming waste into a valuable secondary resource. This approach not only aligns with principles of sustainable mining by minimizing waste streams but also contributes to the global lithium supply chain, meeting the increasing demand for this strategic material. Furthermore, the recovery of lithium from biotite as a byproduct establishes a technical framework for the development of a sustainable lithium extraction industry in the region, potentially positioning nepheline syenite rocks as a contributor to the production of Li-ion batteries, a fundamental component of future electrical vehicle technologies.

2. Materials and Methods

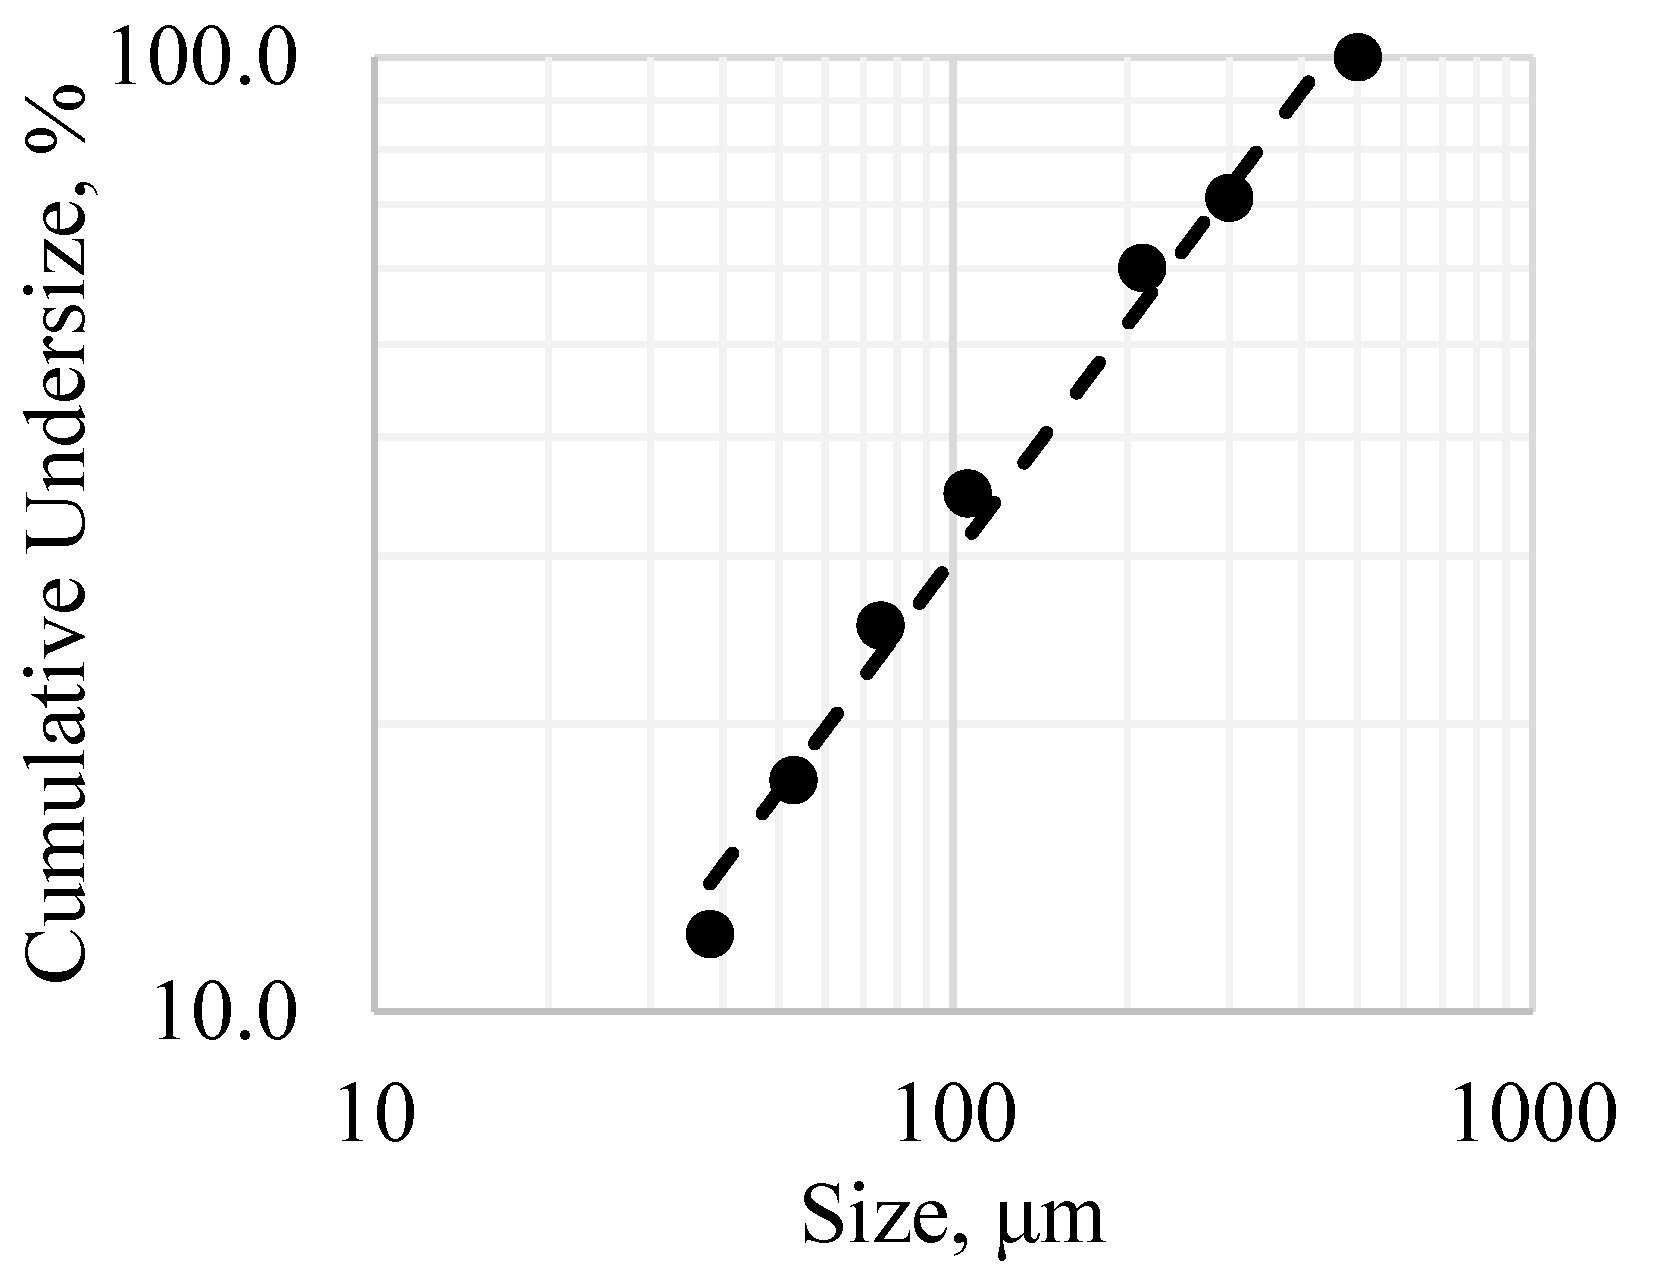
The representative sample originated from Kırşehir-Buzlukdağı-Türkiye. The elemental chemical analysis was performed with an ICP-OES (inductively coupled plasma–optical emission spectrometer) (Agielent 5800, Santa Clara, CA, USA), resulting in 242.57 ppm Li (see Table 1). The oxide compound chemical analysis by XRF (X-ray fluorescence) (Atomika Epsilon 4-Malvern Panalytical, Malvern, UK) of the representative sample is illustrated in Table 1, and the cumulative undersize distribution curve of the sample, fractional lithium analysis of the sample, and XRPD (X-ray powder diffraction) pattern are shown in Figure 1, Table 2, and Figure 2, respectively.
Based on the cumulative undersize distribution curve of the sample, the d80 was calculated to be 335 μm.
Based on the fractional lithium analysis, due to the absence of size liberation, the highest lithium distribution was determined within the −500 + 300 μm size fraction, which was also associated with the quantity of material present in this size range.
The mineralogical compositions of the selected samples were analyzed using X-ray diffraction (XRPD) semi-quantitatively. The evaluations were conducted on 5 g samples below 75 μm and performed using a Bruker D8 Advance diffractometer (Madison, WI, USA) equipped with a Lynxeye detector. The measurements were conducted under operating conditions of 40 mA current and 40 kV voltage, utilizing Cu Kα radiation without a filter. Data were collected within the 2θ range of 5° to 72° at a scan speed of 2° 2θ/min. The resulting X-ray diffractograms were subsequently analyzed using Jade 6.5 data analysis software (MDI, Los Angeles, CA, USA) in conjunction with the PDF-2 (Powder Diffraction File) database for phase identification and structural analysis. As identified in the XRPD pattern, the ore was present within a nepheline syenite rock, with peaks corresponding to nepheline, albite, microcline, and biotite.
Moreover, a 0.25 g portion of the ground sample was transferred to a Teflon beaker and treated sequentially with 10 mL of aqua regia (HCl:HNO3 = 3:1), 5 mL of HClO4, and 5 mL of HF, followed by heating at 200–250 °C until dry. After adding ~2 mL of HCl and re-evaporating, the beaker was cooled and rinsed with deionized water, and 30 mL of concentrated HCl was added. The solution was boiled, cooled, filtered using white-band filter paper, and transferred to a 100 mL volumetric flask, with rinsing to remove any yellow residue. The volume was adjusted to 100 mL with deionized water, and the resulting solution was analyzed for the elemental assay using the ICP-OES method. The same procedure was applied to a reference sample, and the ICP-OES instrument was calibrated daily. MLA (mineral liberation analysis), EDS (energy-dispersive X-ray spectroscopy), modal mineralogy, and image analysis SEM-BSE (scanning electron microscope—backscattered electrons) were performed to characterize the structure of the ore in detail.
The analyses of the samples were conducted using a Bruker XFlash 6/60 dual EDS (energy-dispersive X-ray spectroscopy, Madison, WI, USA) system integrated with a TFS (Thermo Fisher Scientific) Apreo 2C HiVac FEG-SEM (Field Emission Gun-Scanning Electron Microscope, Waltham, MA, USA). For the evaluation of the results, the TFS Maps Mineralogy and TFS Nanomin software 3.28 packages, along with associated mineral libraries, were utilized. EDS analyses were performed in Grid analysis mode with a 5-micron X-ray spacing interval, ensuring precise and systematic data acquisition. The powder sample, separated into specific fractions, was initially quartered using a rotary riffler. The quartered representative samples were then mixed with a cold mounting resin (4 parts resin + 1 part hardener) and poured into 30 mm molds, which were solidified at room temperature. Once fully solidified, the samples were removed from the molds, and their surfaces were polished in approximately 8 stages using an automatic grinding–polishing machine. The polished surfaces of the samples were coated with carbon to ensure their suitability for analysis. Following the loading of the samples into the device and the completion of calibration, the analysis process was initiated. At this stage, BSE images of particles (minerals) within each fraction were automatically acquired, and EDS data were collected to determine the chemical composition of distinct points on each particle. Upon completion of the data acquisition, the subsequent stages involved mineral identification, grouping, classification, the identification of undefined particles, and the segregation of artificially locked particles. In the final phase, essential outputs, including modal mineralogy, calculated elemental assay, elemental deportment, mineral liberation, and other pertinent data, were systematically generated.
To characterize the rock, the sample was ground under 500 microns and divided into different particle size fractions, such as −500 + 212, −212 + 106, −106 + 75, −75 + 53, and −53 + 38 μm. MLA and EDS were performed for all size groups, while the image analysis by SEM-BSE was performed for the −500 + 212 and −212 + 106 μm size fractions. SEM imaging reveals the surface topography of a sample, while BSE imaging provides information about its composition. Elements with higher atomic numbers scatter more electrons, appearing brighter in BSE images compared to elements with lower atomic numbers. Consequently, BSE imaging produces a Z-contrast image, highlighting compositional differences within the sample. This technique is widely used for phase identification, compositional mapping, and the detection of heavy and light elements in mineral, material, and metallurgical analyses.

3. Results and Discussion

Modal mineralogy, elemental assay and deportment, mineral liberation degree, and mineral association and free-surface area analyses, as well as image analyses using both BSE, SEM-EDS and EDS mapping, were conducted to characterize the nepheline syenite rock in detail.

3.1. Modal Mineralogy, Elemental Assay, and Deportment

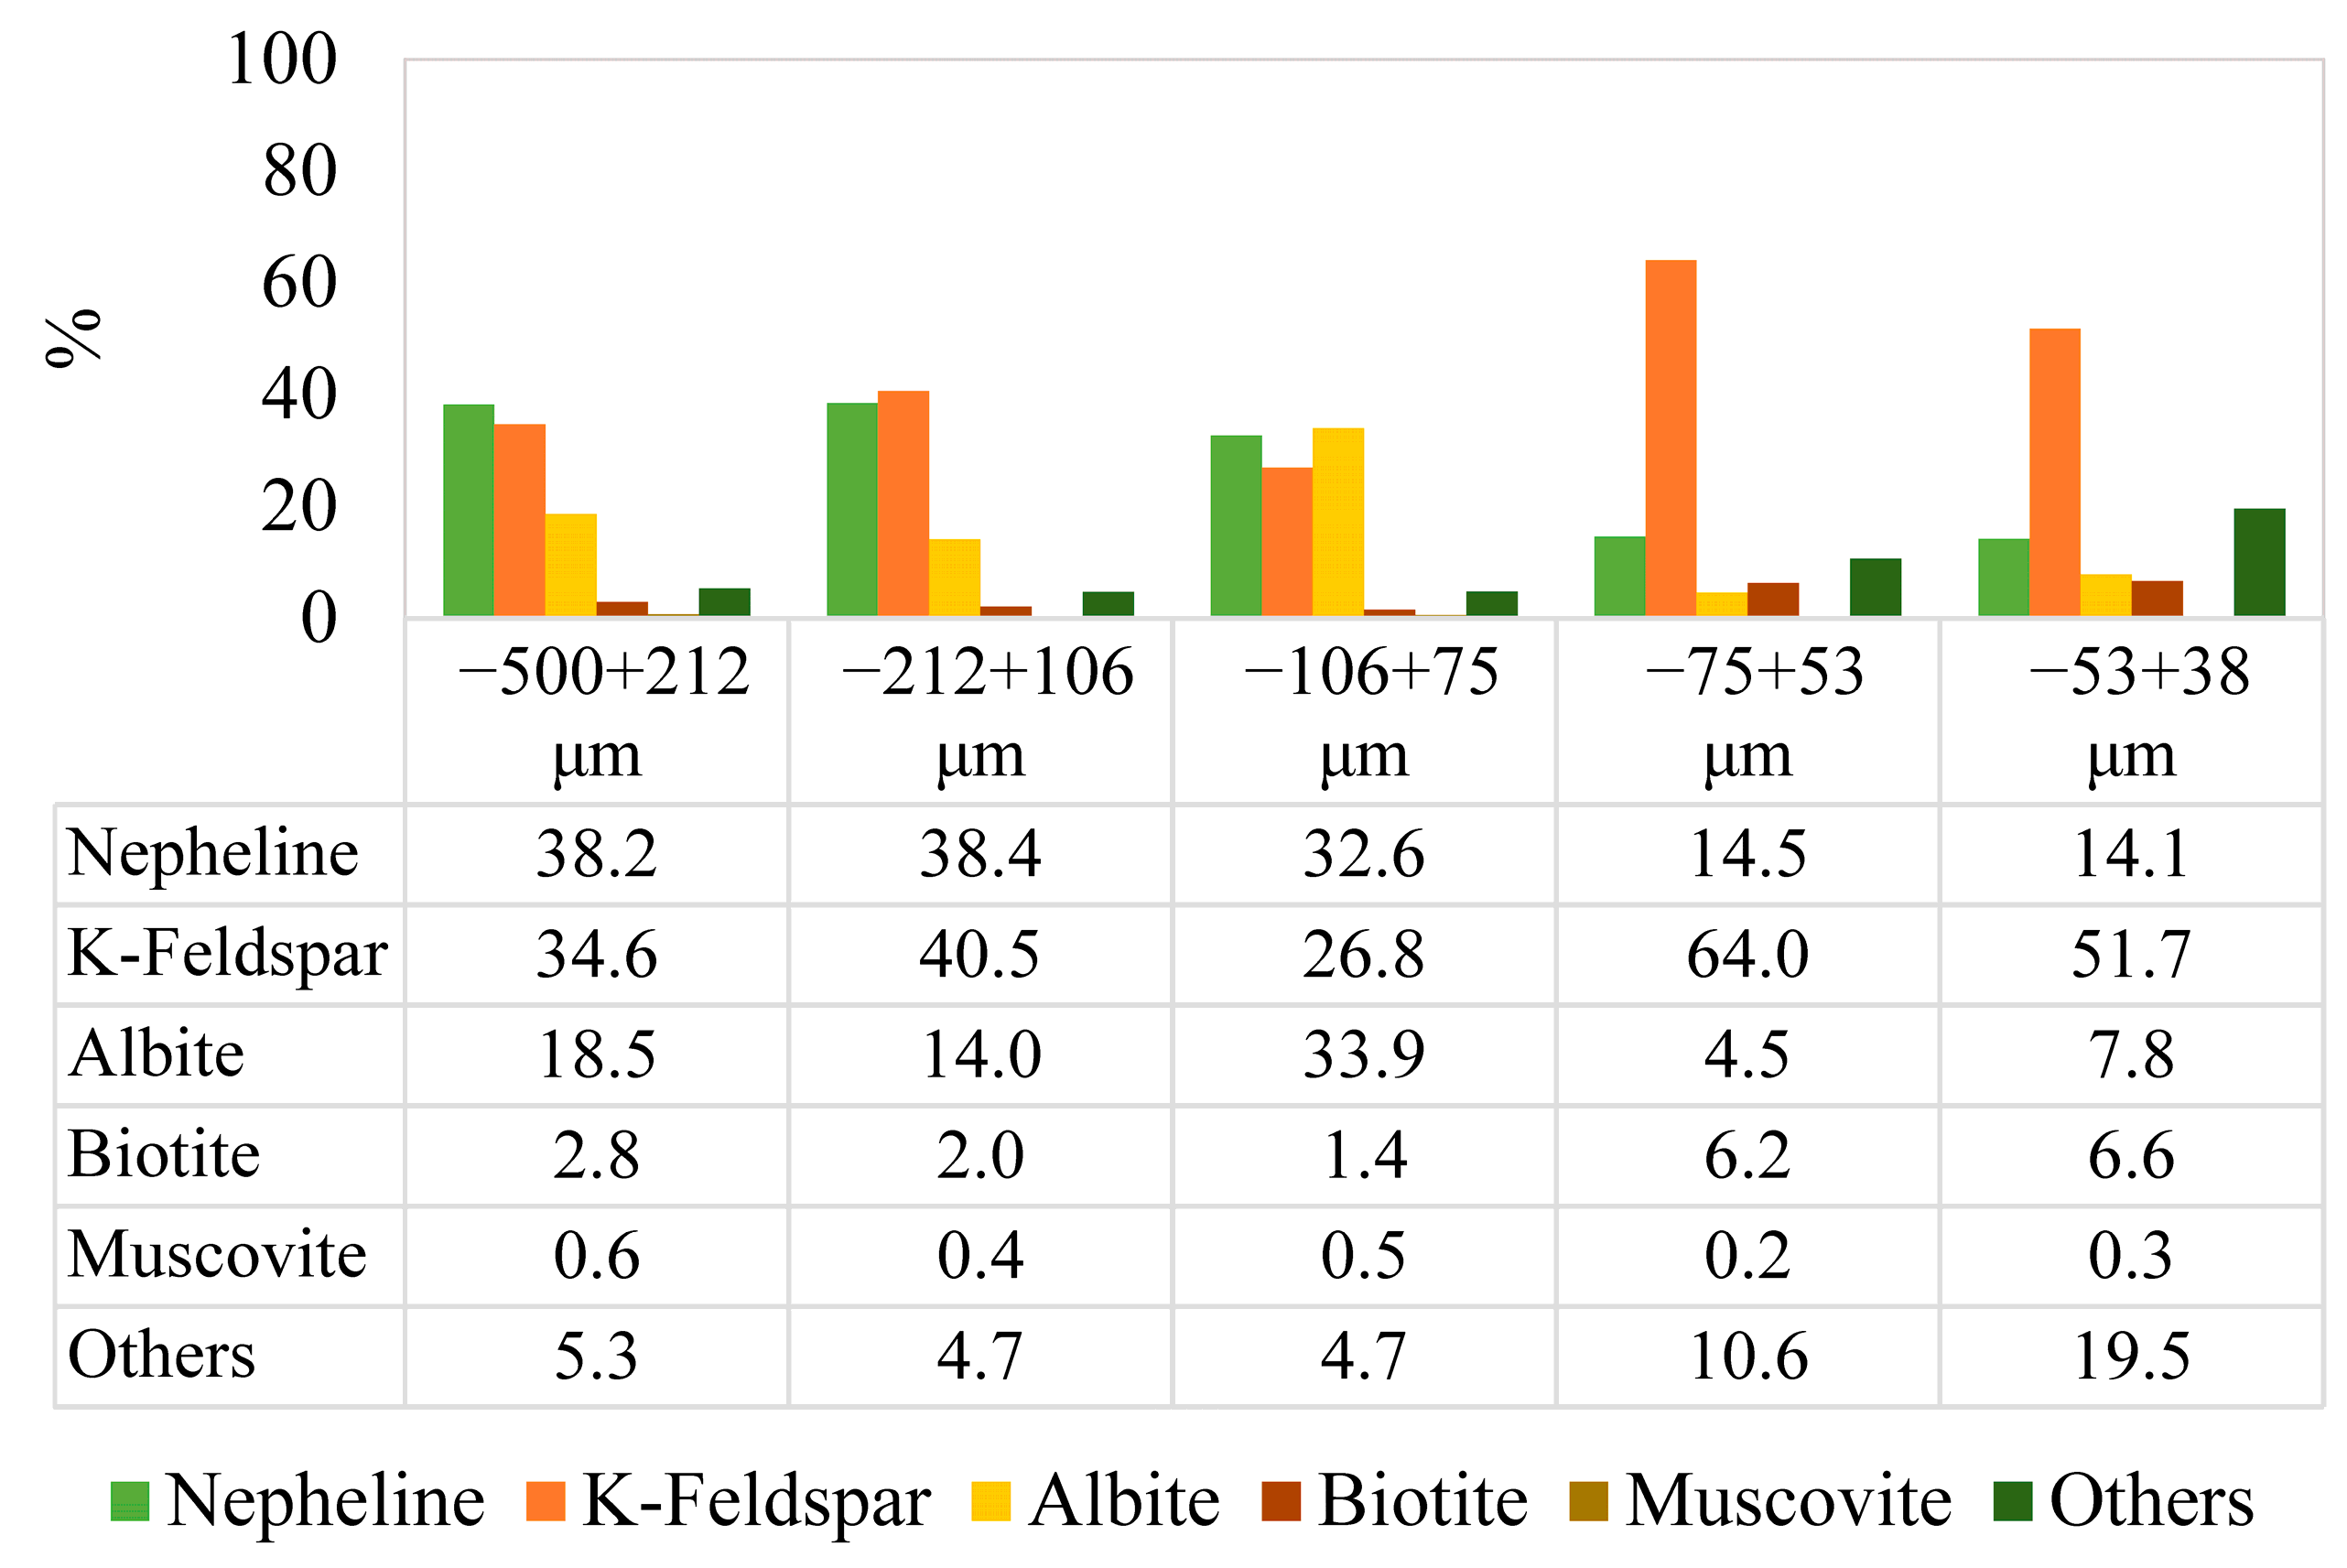
The whole-sample modal mineralogy was calculated by combining the results for individual size fractions, weighted by their relative mass contributions. In Figure 3, the fractional ratios of the minerals are given, and the fractional bases of the minerals in the different particle size ranges, −500 + 212, −212 + 106, −106 + 75, −75 + 53, and −53 + 38 μm, are illustrated in Figure 4.
It was detected that K-feldspar was the dominant mineral, accompanied by lower proportions of nepheline, albite, biotite, and other minor minerals.
Due to differences in the breakage characteristics of minerals, the distribution of the mineral phases by weight (%) can differ among particle size fractions. Related to the fractional modal mineralogy analysis, the proportion of biotite increased as the particle size decreased, with values of 2.83%, 1.99%, 1.45%, 6.23%, and 6.62% for progressively finer size fractions. In contrast, the nepheline content showed a declining trend as the particle size decreased, with nepheline contents of 38.15%, 38.43%, 32.61%, 14.46%, and 14.11% through finer size fractions. In Figure 5, the calculated elemental assay is illustrated. Based on the results, it was observed that the Na% content decreased from 6.06% to 2.57% as the particle size decreased. This trend aligned with the findings from the modal mineralogical analyses conducted for the different size fractions, which revealed that the nepheline content (the primary source of sodium) was higher in coarser size fractions, whereas the biotite content was more prominent in finer sizes. Furthermore, the increase in the Fe% content in finer fractions further supported this observation, as it correlated with the higher concentration of biotite in smaller particle sizes. In Figure 6a–f, the elemental deportments of K, Al, Fe, Mn, Mg, and Na based on the size fractions and sourced from biotite and other minerals are presented.
Since biotite minerals are composed of biotite (K(Mg,Fe2+)3AlSi3O10(OH,F)2), annite (KFe3+AlSi3O10(OH,F)2), and siderophyllite (KFe2+Al(Al2Si2)O10(F,OH)2) [16], the elemental deportment values for K, Fe, Al, and particularly Mg are presented in the results. The contents of all the elements, except for Mn% and Mg%, are shown in Figure 5, which illustrates the total elemental contents for each particle size fraction. However, the Mn% contents from the coarsest fraction to the finest fraction were 0.043%, 0.045%, 0.024%, 0.101%, and 0.100%, and the Mg% contents were 0.162%, 0.137%, 0.242%, 0.186%, and 0.237, respectively. Moreover, the elemental assays associated with biotite were calculated using Equation (1), based on the elemental deportment values indicated in Figure 6a–f and the elemental contents for each particle size fraction demonstrated in Figure 5. The calculated results are displayed in Figure 7.
T o t a l   E l e m e n t a l   C o n t e n t x E l e m e n t a l   D e p o r t m e n t 100 = E l e m e n t a l   c o n t e n t   %   f r o m   B i o t i t e
Potassium was primarily sourced from K-feldspar, as confirmed by mineralogical analyses, which revealed the distribution of K within K-feldspar across the particle size fractions. The distributions of potassium from the coarse to fine particle sizes were 66.51%, 70.50%, 64.71%, 86.49%, and 83.51%, respectively. Although biotite inherently contained potassium due to its chemical composition, its contribution to the overall elemental assay and elemental deportment was negligible. Additionally, the distributions of K within nepheline across the particle size fractions from coarse to fine were 29.16%, 26.48%, 31.26%, 7.70%, and 9.08%, respectively.
The primary sources of magnesium in the ore were albite and biotite, with pyroxene and a small amount of muscovite also presented at relatively consistent proportions across all size fractions. The magnesium (Mg) content within albite varied across the particle size fractions, showing values of 0.087%, 0.065%, 0.159%, 0.0212%, and 0.037% from the coarse to fine size fractions, respectively. The presence of magnesium (Mg) within the crystal structure of albite (NaAlSi3O8) is typically not attributed to its direct incorporation into the albite lattice but is rather associated with the presence of other coexisting minerals. The identification of minerals that could serve as sources for elements such as iron, titanium, calcium, and magnesium is critical in the characterization of ore deposits containing albite. However, the occurrence of these elements does not necessarily imply their inclusion within the albite crystal structure itself; instead, they can often present in the composition of other minerals coexisting with albite [17]. However, albite grains generally exhibit negligible levels of magnesium (Mg), consistent with the intrinsic chemical composition of albite, which naturally lacks Mg. The crystal structure of albite is specific to Na and Al ions, and the incorporation of Mg is chemically unfavorable due to ionic radius disparities and charge balance constraints, which induce structural instability. Furthermore, Mg can preferentially be stabilized in coexisting minerals such as pyroxenes rather than within the albite structure. It was recorded that magnesium (with Mg contents typically not exceeding 1%) was found not within albite grains but in pyroxenes associated with albite [18]. As previously mentioned, minerals such as annite and siderophyllite were closely associated with biotite, and their distinction was directly linked to the magnesium content. Similarly, since the biotite contained trace amounts of manganese (Mn), elemental assay and elemental deportment data for Mn were also obtained. These data played a crucial role in the identification of biotite within the ore. However, as previously highlighted, it was essential to separate the three distinct biotite minerals. The mineral types presented in the nepheline syenite rocks were primarily biotite and annite, with siderophyllite typically not present [16]. Additionally, although there were no significant differences in the Mg and Mn contents between annite and biotite, the Ti content served as the key differentiating elemental assay. The total elemental assays of titanium were 0.036%, 0.037%, 0.022%, 0.09%, and 0.094% as the particle size decreased. Furthermore, the Ti elemental deportments from biotite were 99.17%, 64.64%, 79.65%, 80.95%, and 87.37%, respectively.
Regardless of the particle size, the primary sources of iron in the ore were iron–spinel and biotite, with minor contributions from Mg-Fe spinel. The characterization of this ore aimed to provide a basis for the accurate design of future beneficiation processes. In this context, the iron content served as a key indicator in chemical analyses for the recovery of biotite, underscoring its critical importance. Furthermore, it also indicated that the biotite was a paramagnetic mineral, which had significant implications for the selection of the appropriate separation methods.
Based on the Al deportment (%) and assay (%), it was evident that aluminum was not a selective elemental component for biotite. The primary sources of Al in the ore were nepheline and K-feldspar. Regarding sodium (Na), regardless of the particle size, its main source was nepheline, followed by albite and, finally, K-feldspar.
For fluorine (F), which was present in the chemical composition of the biotite, the elemental deportment revealed that its distribution was 0% across all size fractions, while the majority (approximately 99–100%) of the fluorine content originated from fluorite. Modal mineralogical analysis revealed the presence of fluorine-containing minerals across all size fractions, including bastnäsite, parisite-Th, apatite, and fluorite. On average, the elemental fluorine distribution in bastnäsite ranged from 0.01% to 0.07%, in parisite-Th it ranged from 0.01% to 0.16%, and in apatite it ranged from 0.19% to 0.65%. In contrast, the fluorine distribution in fluorite was significantly higher, ranging from 99.27% to 99.72% across all size fractions.

3.2. Mineral Liberation Degree, Mineral Associations, and Free-Surface Area

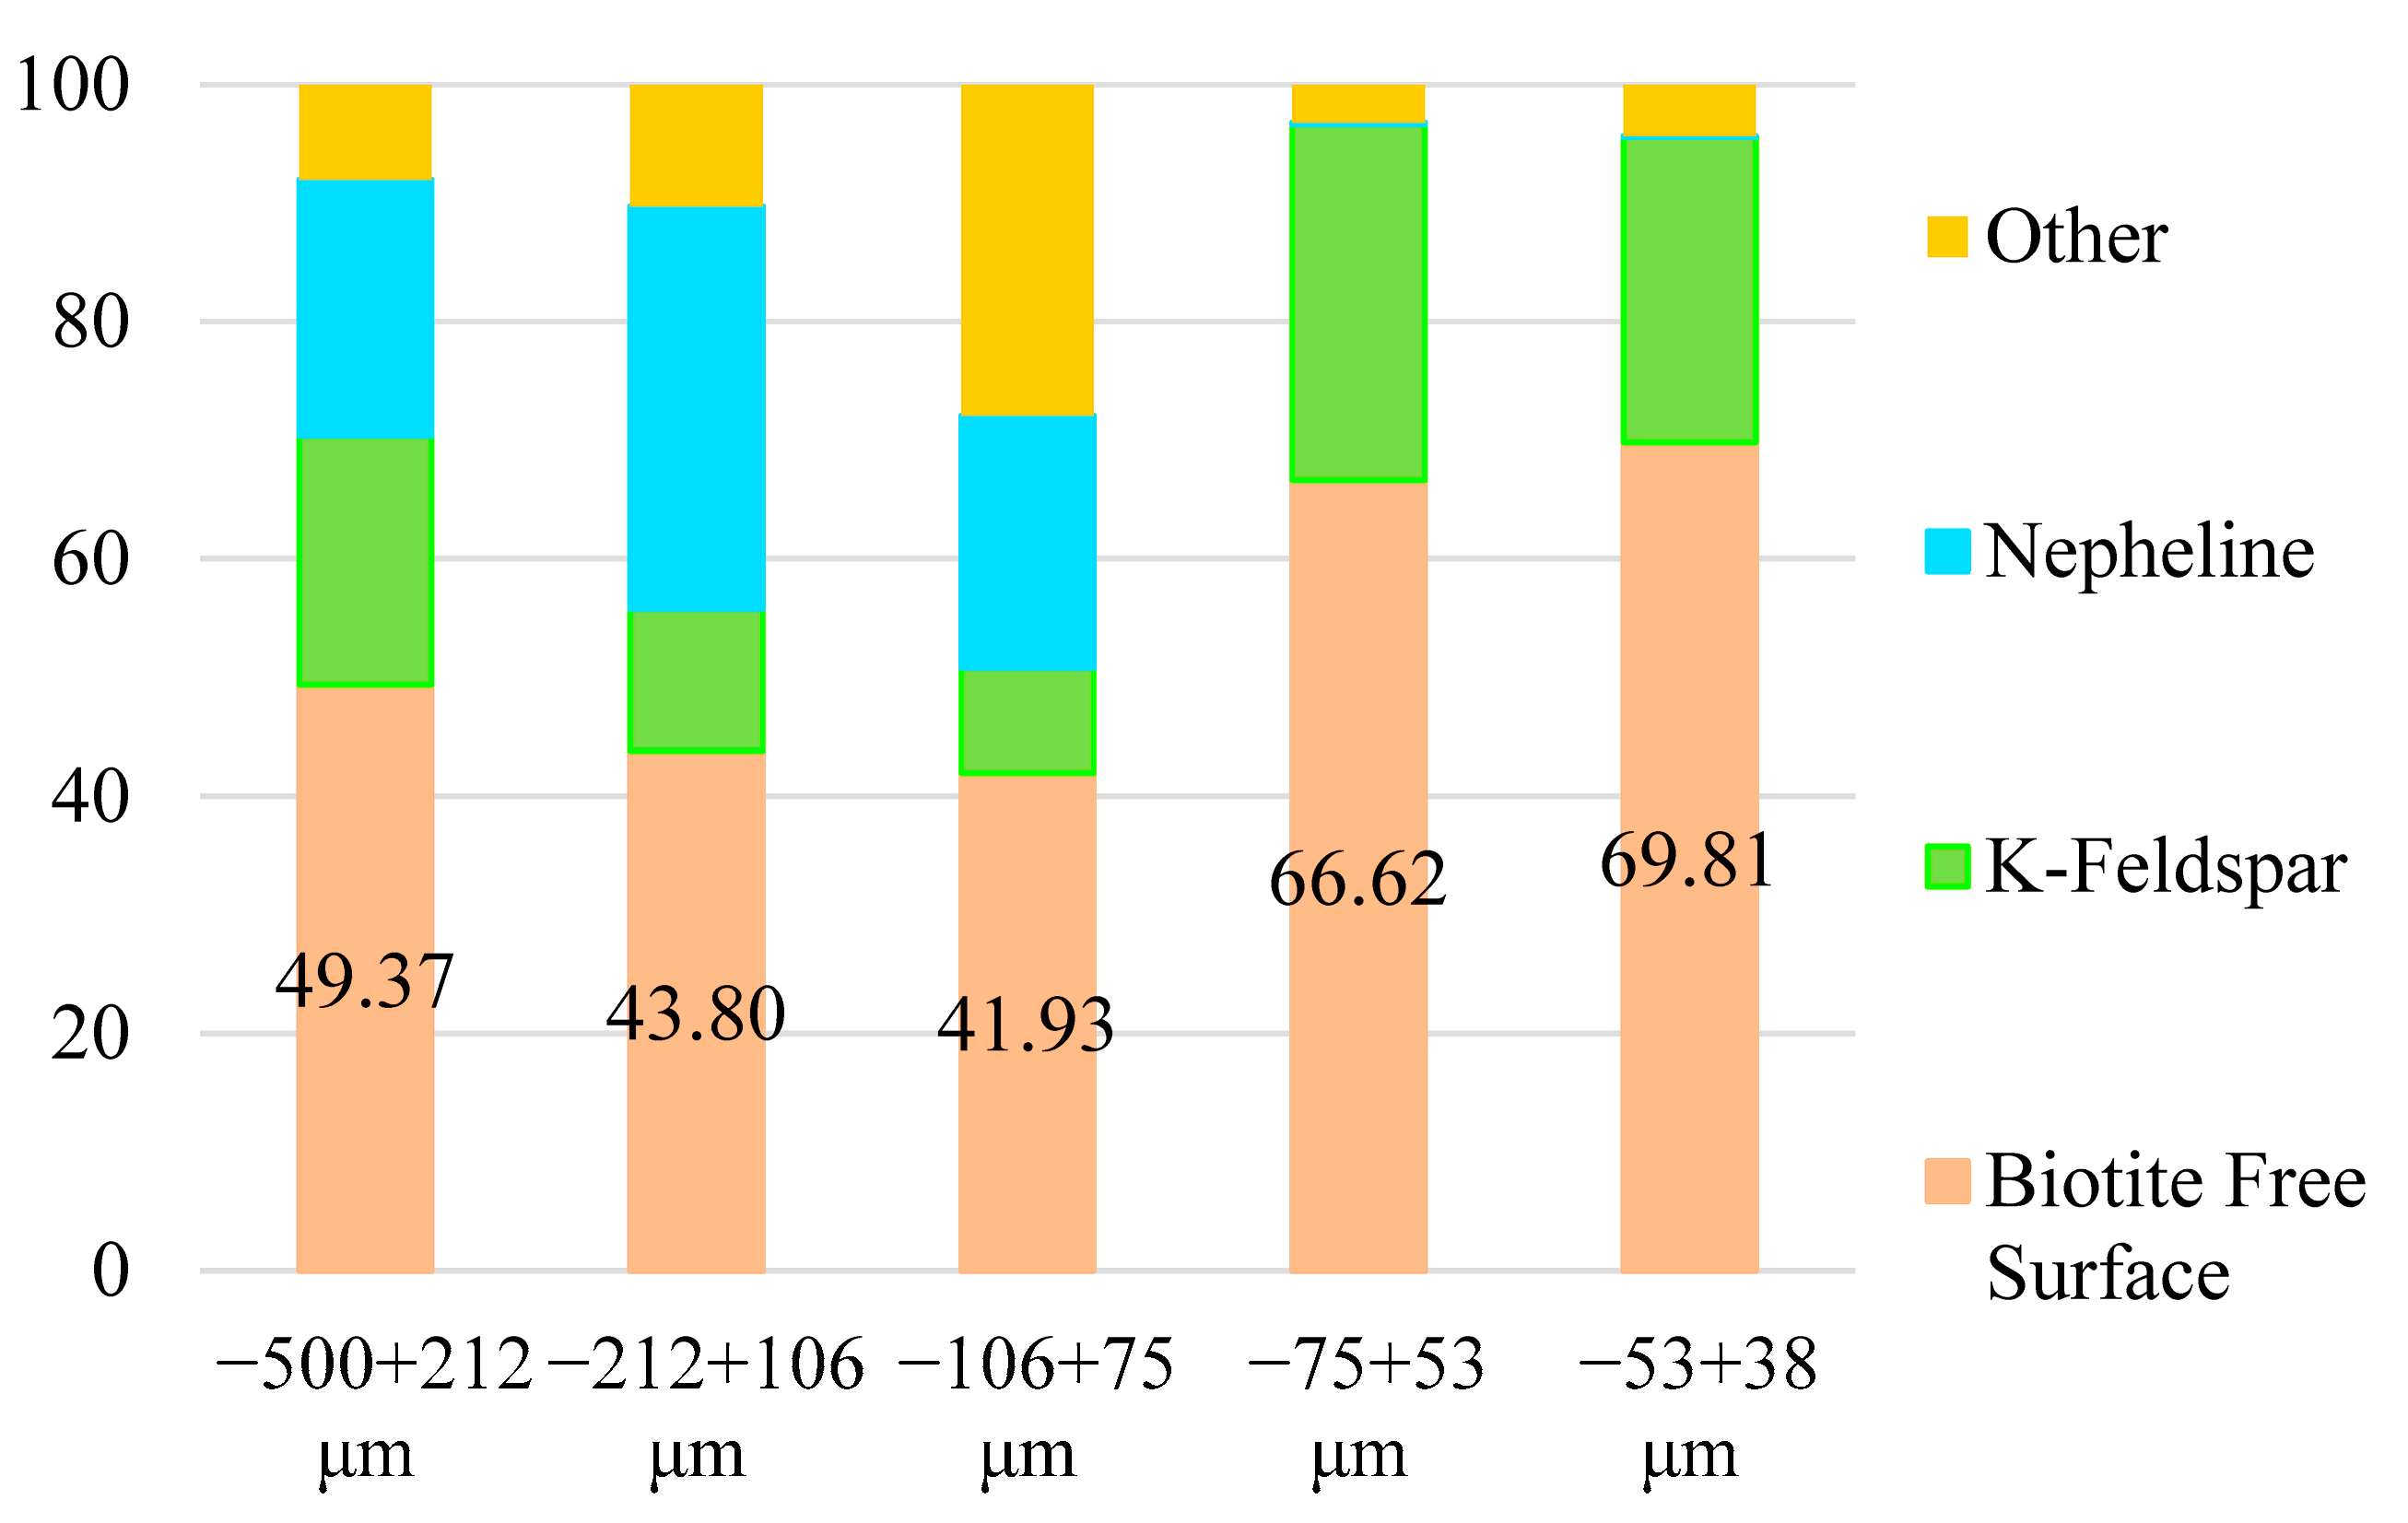
The mineral locking and mineral association data obtained through MLA analysis provided critical insights into the distribution and occurrence of associated minerals (e.g., gangue), facilitating a more accurate assessment of their grades. This information plays a pivotal role in optimizing mineral beneficiation processes by enabling more effective separation processes and enhancing the overall process efficiency [12]. The particle size fractions examined in the liberation study were −500 + 212, −212 + 106, −106 + 75, −75 + 53, and −53 + 38 μm. Within these size fractions, the proportions of biotite mineral particles that presented as liberated and binary-, ternary-, and complex-associated were analyzed and were depicted in Figure 8. Moreover, the mineral associations and free surface of the biotite were illustrated in Figure 9.
The particle liberation tests revealed that as the particle size decreased, the proportion of liberated biotite increased, peaking in the −75 + 53 µm size fraction. Consistent with the results of the XRPD and modal mineralogy analyses, the biotite was primarily associated with K-feldspar and nepheline. Typically, biotite occurred in binary locked with K-feldspar, as well as in ternary and complex locked structures with both K-feldspar and nepheline. Although the degree of liberation increased with the decreasing particle size, the mineral association and free-surface ratio analyses indicated that biotite was predominantly associated with K-feldspar rather than with nepheline. While the proportion of ternary and complex structures decreased as the particle size diminished, the fraction of binary associations involving biotite and K-feldspar increased, except for the −75 + 53 µm size range, where biotite liberation reached its maximum. Additionally, the free-surface area of biotite increased with finer particle sizes, while its association with nepheline decreased, confirming that biotite was mostly associated with K-feldspar. The free-surface areas of K-feldspar and nepheline in the different size fractions progressed as follows: 21.35%, 44.88%, 55.24%, 90.42%, and 97.51% for K-feldspar, and 47.95%, 79.43%, 67.04%, 95.23%, and 99.37% for nepheline, as the particle size decreased from coarser to finer size fractions. In addition, the liberation rates of K-feldspar progressively increased from coarse to fine particle sizes, with values of 46.75%, 69.20%, 65.88%, 98.66%, and 98.64%, respectively. Similarly, the liberation rates for nepheline were 68.03%, 89.33%, 81.12%, 94.81%, and 98.37% across the same size fractions. This trend demonstrated a significant enhancement in the liberation of K-feldspar and nepheline as the particle size decreased, indicating reduced mineral interlocking with biotite. Notably, for the −75 + 53 µm and −53 + 38 µm size fractions, the liberation of nepheline was of minimal relevance, as biotite exhibited negligible mineral associations with nepheline in these fractions. The level of liberation achieved during comminution processes plays a critical role in determining the efficiency of the subsequent mineral processing operations. Assessing the liberation properties of zinnwaldite is vital for optimizing comminution methods. As highlighted, while its liberation was essential and dependent on the particle size, the magnetic separation stage served as the primary limitation in its beneficiation. Their findings emphasized that prioritizing the optimization of the separation process was the key to enhancing zinnwaldite recovery, with additional potential for improving the liberation of coarser particles [13]. However, Sandmann and Gutzmer [12] asserted that, although the study did not provide a specific target for the degree of liberation, optimization efforts should have been primarily concentrated on refining the separation process rather than on further enhancing the liberation degree.

3.3. SEM-BSE and Energy-Dispersive X-Ray Spectroscopy (EDS)

Imaging was conducted using both the BSE and MLA techniques, focusing on coarser particles (−500 + 212 µm and −212 + 106 µm), where the imaging quality was higher. EDS mapping was made for a more representative assessment of the elemental composition. In Figure 10, the SEM-BSE images of the representative samples and the EDS spectra corresponding to the particles in these images are presented. Moreover, individual EDS sum spectra of albite, nepheline, K-feldspar, and biotite are given in Figure 11. EDS spectra were not obtained from a single point; instead, analyses were performed on all particles within the size fractions. Moreover, EDS mapping was conducted for each particle size fraction and is illustrated in Figure 12, along with SEM-BSE images of all particles in each size fraction.
In Figure 10, the images illustrate the presence of liberated biotite particles (Figure 10a) and binary associated particles with nepheline within the −500 + 212 µm size fraction (Figure 10b). Similarly, within the −212 + 106 µm size fraction, a binary association between albite and biotite was revealed (Figure 10c). However, Figure 10d–f also present the corresponding EDS spectra of the particles visualized in the SEM-BSE images.
In Figure 10a–c, the analysis confirms that the attached particle comprised free biotite, nepheline–biotite, and albite–biotite. The EDS spectrum presented in Figure 10d further demonstrates that the particle illustrated in Figure 10c consisted entirely of biotite, with a possible modal composition of 89.86% annite and 10.14% siderophyllite. This finding substantiated the identification of the particle as biotite, with a dominant annite component, attributed to its closer structural and compositional affinity with biotite compared to siderophyllite. Furthermore, the presence of nepheline and albite attached to biotite was corroborated by the EDS spectra provided in Figure 10e–f.
Figure 11 illustrates the total EDS spectra of the major minerals present in the ore along with the weight percentages of the elements constituting these minerals. For example, Figure 11a indicates that the nepheline mineral consisted of 44.96% oxygen, 11.30% sodium, 17.99% aluminum, 21.14% silicon, and 54.61% potassium by weight. Similar characterizations were conducted for all minerals and are presented in Figure 11a–d.
In Figure 11d, the elemental composition of biotite is detailed, which includes 0.19% hydrogen, 42.51% oxygen, 0.55% sodium, 2.26% magnesium, 8.67% aluminum, 19.03% silicon, 7.64% potassium, 1.27% titanium, 1.51% manganese, and 16.35% iron. Despite the lithium (Li) content being extremely low and not visible in the EDS spectra, biotite was characterized as the only lithium source in the ore. Thus, it was inferred that the lithium-bearing mineral in the nepheline syenite was likely to be zinnwaldite, based on the presence of lithium in the biotite. Both the degree of liberation presented in Figure 8 and the EDS spectra associated with biotite shown in Figure 11d serve as valuable key factors for the design of future beneficiation processes. These data provide critical insights that can guide the development and optimization of processing strategies in subsequent studies. Geological studies have indicated that both zinnwaldite and biotite are phyllosilicate minerals, which can coexist in certain geological formations. The structure of phyllosilicates allows for cation exchanges within their tetrahedral and octahedral layers, which contain varying levels of hydroxyl groups. Furthermore, these cation exchanges also take place within the interlayer sites of mica minerals, contributing to their unique chemical properties [19,20,21,22,23]. However, lepidolite, one of the lithium minerals, is a mica-type mineral, and its geological structure is similar to that of zinnwaldite. The key distinguishing factor, however, lies in the impurities present in zinnwaldite, primarily iron oxide and manganese oxide. These impurities differentiate zinnwaldite from lepidolite despite the structural similarities between the two minerals [24].
In coarser size fractions, particularly in the −500 + 212 µm and −212 + 106 µm size ranges, nepheline appeared more concentrated. As the particle size decreased, the particle liberation increased, with albite becoming more dominant. Further reduction in the size revealed a stronger concentration of K-feldspar compared to nepheline. Additionally, the biotite mineral, initially less frequent in coarser fractions, exhibited a progressive increase in concentration as the particle size decreased. This trend was consistently confirmed through fractional modal mineralogy analysis, with EDS mapping highlighting biotite’s intensification across finer fractions due to the color contrast observed.
To conclude, in this study, the chemical, mineralogical, and physical characteristics of nepheline syenite rocks were investigated in detail. The behavior of the constituent minerals, including albite, K-feldspar, nepheline, and biotite, was comprehensively characterized. Biotite was identified as the target mineral, either due to its role as a host mineral for lithium or as a result of its partial geological transformation into zinnwaldite. Since biotite, a mica mineral, is currently discarded as waste during nepheline syenite production, its beneficiation presents a viable opportunity for lithium recovery. This approach would not only reduce the amount of industrial waste but also enable the recovery of a valuable byproduct, thereby contributing to the supply of raw materials for electric vehicle battery production from a potential domestic source.
Due to the fact that biotite is the only paramagnetic mineral in the ore, magnetic separation can be applied to produce a pre-concentrate. In a related study carried out with the same rock type, both the dry and wet high-intensity magnetic separation methods were tested with different devices, and even the effects of the particle size fractions were thoroughly examined [25]. It was found that dry magnetic separation played a critical role in achieving the highest lithium content in the concentrate. However, physical beneficiation processes alone are generally insufficient to achieve high process efficiency. Therefore, combining magnetic separation with flotation as a physicochemical process can significantly improve lithium recovery. For this reason, the magnetic product can be subjected to conventional flotation to produce lithium-enriched concentrates with higher grades in further studies.
4. Conclusions

In this study, the characterization of lithium-bearing biotite minerals within nepheline syenite rocks was conducted to determine the lithium source, mineral associations, liberation degrees, and surface properties. The primary minerals associated with biotite were identified as nepheline, K-feldspar, and albite. The liberation degree of biotite was determined to exceed 70% across all five particle size fractions. Biotite was confirmed as the sole lithium-bearing mineral in the sample. This study demonstrated the potential for lithium recovery from the ore, highlighting the viability of extracting lithium from this defined deposit. It was also established that nepheline production, combined with lithium concentrate recovery from processing waste, could significantly reduce the overall waste generated during mineral processing operations. By characterizing these materials, this study highlights the potential of repurposing processing waste to improve resource efficiency, enhance sustainability, and support the advancement of lithium extraction technologies.
Lithium’s association with biotite indicates that the application of processes such as magnetic separation and flotation in further studies is going to enable the production of a lithium concentrate by taking advantage of the mineral’s distinct surface and magnetic properties.

Author Contributions

Z.Ü.-Ç., experimental data provision, writing—original draft, methodology; O.K., visualization, writing—review and editing; M.O.K., methodology, conceptualization, supervision, writing—review and editing. All authors have read and agreed to the published version of the manuscript.

Funding

This research did not receive any specific grant from funding agencies from the public, commercial, or not-for-profit sectors.

Data Availability Statement

The original contributions presented in this study are included in the article. Further inquiries can be directed to the corresponding author.

Acknowledgments

The authors are thankful to BS Yatırım A.Ş., ITU—Mineral Processing Engineering Department, ITU—Geology Engineering Department, the General Directorate of Mineral Research and Exploration, and the NumLabs Laboratory of Mining Analysis and Technology.

Conflicts of Interest

Zeynep Üçerler Çamur, Ozgul Keles, and M. Olgaç Kangal declare that they have no competing interests.

References

  1. Vega-Muratalla, V.O.; Ramírez-Márquez, C.; Lira-Barragán, L.F.; Ponce-Ortega, J.M. Review of Lithium as a Strategic Resource for Electric Vehicle Battery Production: Availability, Extraction, and Future Prospects. Resources 2024, 13, 148. [Google Scholar] [CrossRef]
  2. Celep, O.; Yazıcı, E.; Deveci, H. Recovery of lithium from ores and brines. Sci. Min. J. 2022, 61, 105–120, (In Turkish with English Abstract). [Google Scholar] [CrossRef]
  3. Üçerler, Z.; Güney, A. The investigation of lithium extraction by roasting with sulfating agent and water leaching from nepheline syenite rocks. Physicochem. Probl. Min. Process. 2022, 58, 146–154. [Google Scholar] [CrossRef]
  4. Haner, S.; Demir, M. Nepheline Syenite: A review. J. Geol. Eng. 2018, 42, 107–120, (In Turkish with English Abstract). [Google Scholar] [CrossRef]
  5. Deniz, K.; Kadioglu, Y.K. The potential usage of nepheline syenite in ceramic industry: Example of Buzlukdag. Pamukkale Univ. J. Eng. Sci. 2018, 24, 1209–1219, (In Turkish with English Abstract). [Google Scholar] [CrossRef]
  6. Holdaway, M.J. Chemical formulae and activity models for biotite, muscovite, and chlorite applicable to pelitic metamorphic rocks. Am. Miner. 1980, 65, 711–719. [Google Scholar]
  7. Kangal, M.O.; Bulut, G.; Yeşilyurt, Z.; Basturkcu, H.; Burat, F. Characterization and production of Turkish nepheline syenites for industrial applications. Physicochem. Probl. Min. Process. 2019, 55, 605–616. [Google Scholar] [CrossRef]
  8. Kangal, M.O. Nepheline Syenites. In Industrial Minerals Handbook, 1st ed.; Yüce, A.E., Kangal, M.O., Onal, G., Ergunalp, D., Eds.; Mineral Exporters’ Association: Istanbul, Türkiye, 2023; pp. 228–232. (In Turkish) [Google Scholar]
  9. Burat, F.; Kangal, M.O.; Onal, G. An alternative mineral in the glass and ceramic industry: Nepheline syenite. Miner. Eng. 2006, 19, 370–371. [Google Scholar] [CrossRef]
  10. Kangal, M.O.; Bulut, G.; Yeşilyurt, Z.; Güven, O.; Burat, F. An alternative source for ceramics and glass raw materials: Augen-Gneiss. Minerals 2017, 7, 70. [Google Scholar] [CrossRef]
  11. Stone, M.; Exley, C.S.; George, M.C. Compositions of trioctahedral micas in the Cornubian batholith. Mineral. Mag. 1988, 52, 175–192. [Google Scholar] [CrossRef]
  12. Sandmann, D.; Gutzmer, J. Use of mineral liberation analysis (MLA) in the characterization of lithium-bearing micas. Miner. Mater. Charact. Eng. 2013, 1, 285. [Google Scholar] [CrossRef]
  13. Leißner, T.; Mütze, T.; Bachmann, K.; Rode, S.; Gutzmer, J.; Peuker, U.A. Evaluation of mineral processing by assessment of liberation and upgrading. Miner. Eng. 2013, 53, 171–173. [Google Scholar] [CrossRef]
  14. Clarke, D.B.; Renno, A.D.; Hamilton, D.C.; Gilbricht, S.; Bachmann, K. The spatial association of accessory minerals with biotite in granitic rocks from the South Mountain Batholith, Nova Scotia, Canada. Geosphere 2022, 18, 1–18. [Google Scholar] [CrossRef]
  15. Sylvester, P.J. Use of the mineral liberation analyzer (MLA) for mineralogical studies of sediments and sedimentary rocks. Miner. Assoc. Can. Short Course 2012, 42, 1–16. [Google Scholar]
  16. Lalonde, A.E.; Rancourt, D.G.; Chao, G.Y. Fe-bearing trioctahedral micas from Mont Saint-Hilaire, Québec, Canada. Miner. Mag. 1996, 60, 447–460. [Google Scholar] [CrossRef]
  17. Şen, G.A.; Yılmaz, H. Importance of flotation method in feldspar ore characterization. Baun. J. Inst. Sci. 2022, 24, 359–372, (In Turkish with English Abstract). [Google Scholar] [CrossRef]
  18. Newton, R.C.; Smith, J.V. Investigations concerning the breakdown of albite at depth in the earth. J. Geol. 1967, 75, 268–286. [Google Scholar] [CrossRef]
  19. Botula, J.; Rucký, P.; Řepka, V. Extraction of zinnwaldite from mining and processing wastes. Min. Geol. Ser. 2005, 2, 9–16. [Google Scholar]
  20. Üçerler, Z. Lithium. In Industrial Minerals Handbook, 1st ed.; Yüce, A.E., Kangal, M.O., Onal, G., Ergunalp, D., Eds.; Mineral Exporters’ Association: Istanbul, Türkiye, 2023; pp. 192–199. (In Turkish) [Google Scholar]
  21. Dubacq, B.; Forshaw, J.B. The composition of metapelitic biotite, white mica, and chlorite: A review with implications for solid-solution models. Eur. J. Miner. 2024, 36, 657–685. [Google Scholar] [CrossRef]
  22. Bray, A.W.; Benning, L.G.; Bonneville, S.; Oelkers, E.H. Biotite surface chemistry as a function of aqueous fluid composition. Geoch. Cosm. Act. 2014, 128, 58–70. [Google Scholar] [CrossRef]
  23. Zhang, L.; Zhu, Y.; Wu, X.; Jun, Y.S. Effects of sulfate on biotite interfacial reactions under high temperature and high CO2 pressure. Phys. Chem. Chem. Phys. 2019, 21, 6381–6390. [Google Scholar] [CrossRef] [PubMed]
  24. Tadesse, B.; Makuei, F.; Albijanic, B.; Dyer, L. The beneficiation of lithium minerals from hard rock ores: A review. Miner. Eng. 2019, 131, 170–184. [Google Scholar] [CrossRef]
  25. Üçerler-Çamur, Z.; Keles, O.; Kangal, M.O. Primary Stage of Zinnwaldite Concentrate Production from Nepheline Syenite Rocks via Magnetic Separation. In Proceedings of the 9th International ICONTECH Congress, Baku, Azerbaijan, 1–2 April 2025; Ataşov, B., Caferov, E., Eds.; Liberty Academic Publishers: New York, NY, USA, 2025; pp. 1–9, ISBN 979-8-89695-057-8. [Google Scholar]
Figure 1. The cumulative undersize distribution curve of the sample.
Minerals 15 00876 g001
Figure 2. XRPD pattern of run-of-mine ore.
Minerals 15 00876 g002
Figure 3. The average of the modal mineralogy of all the size fractions.
Minerals 15 00876 g003
Figure 4. Fractional modal mineralogy analysis of run-of-mine ore.
Minerals 15 00876 g004
Figure 5. Calculated elemental assays.
Minerals 15 00876 g005
Figure 6. The elemental deportments of (a) K, (b) Mg, (c) Fe, (d) Al, (e) Mn, and (f) Na based on the size fractions and sourced from biotite and other minerals.
Minerals 15 00876 g006
Figure 7. The elemental assays associated with biotite.
Minerals 15 00876 g007
Figure 8. The proportions of biotite mineral particles that presented as liberated and binary-, ternary-, and complex-associated.
Minerals 15 00876 g008
Figure 9. Mineral associations and biotite free-surface ratio (%).
Minerals 15 00876 g009
Figure 10. Representative SEM-BSE images of (a) −500 + 212 μm liberated biotite, (b) −500 + 212 μm biotite binary-associated with nepheline, and (c) −212 + 106 μm biotite binary-associated with albite; EDS spectra of (d) biotite, (e) nepheline, and (f) albite.
Minerals 15 00876 g010
Figure 11. EDS sum spectra of (a) nepheline, (b) K-feldspar, (c) albite, and (d) biotite.
Minerals 15 00876 g011
Figure 12. EDS mapping of (a) −500 + 212 μm, (b) −212 + 106 μm, (c) −106 + 75 μm, (d) −75 + 53 μm, and (e) −53 + 38 μm; SEM-BSE images of (f) −500 + 212 μm, (g) −212 + 106 μm, (h) −106 + 75 μm, (i) −75 + 53 μm, and (j) −53 + 38 μm.
Minerals 15 00876 g012
Table 1. The chemical elemental analysis via ICP-OES and compound analysis via XRF of the representative sample.
Li, ppmGa, ppmAl, %Ba, ppmBe, ppmBi, ppmCa, %
242.5739.794.6743.425.5115.500.82
Cd, ppmCe, ppmCo, ppmCu, ppmFe, %As, ppmHf, ppm
<119.7010.9718.190.6811.14<1
K, %La, ppmAg, ppmMg, %Mn, ppmMo, ppmNa, %
4.6714.03<0.50.05458.751.526.54
Ni, ppmP, %Pb, ppmS, %Sb, ppmSr, ppmTi, %
6.01<0.01208.460.038.55175.010.03
Tl, ppmV, ppmW, ppmZn, ppmZr, ppmAl2O3, %BaO, %
<56.59<5124.2167.9323.21<0.01
CaO, %Fe2O3, %K2O, %MgO, %MnO, %Na2O, %P2O5, %
<0.011.116.780.160.069.23<0.01
SO3, %SiO2, %SrO, %TiO2, %LOI, %
0.0457.220.040.030.89
LOI: loss on ignition (%), by weight.
Table 2. The fractional lithium analysis.
Size, μmWeight, %Li, ppmDistribution, %
−500 + 30028.8264.1330.6
−300 + 21211.1270.6412.1
−212 + 10625.2258.3226.2
−106 + 759.5263.6610.1
−75 + 537.9233.037.4
−53 + 385.4215.284.7
−3812.0182.668.8
Total100.0248.43100.0
Disclaimer/Publisher’s Note: The statements, opinions and data contained in all publications are solely those of the individual author(s) and contributor(s) and not of MDPI and/or the editor(s). MDPI and/or the editor(s) disclaim responsibility for any injury to people or property resulting from any ideas, methods, instructions or products referred to in the content.