Article

Recycling Quarry Dust as a Supplementary Cementitious Material for Cemented Paste Backfill

1
Department of Resource and Mechanical Engineering, Lyuliang University, Lvliang 033001, China
2
School of Mining Engineering, Taiyuan University of Technology, Taiyuan 030024, China
3
Jinneng Holding Coal Industry Group Co., Ltd., Datong 037001, China
*
Author to whom correspondence should be addressed.
Minerals 2025, 15(8), 817; https://doi.org/10.3390/min15080817 (registering DOI)
Submission received: 14 July 2025 / Revised: 26 July 2025 / Accepted: 30 July 2025 / Published: 1 August 2025

Abstract

Quarry dust (QD) landfill causes environmental issues that cannot be ignored. In this study, we systematically explore its potential application as a supplementary cementitious material (SCM) in cemented paste backfill (CPB), revealing the activated mechanism of modified QD (MQD) and exploring the hydration process and workability of CPB containing QD/MQD. The experimental results show that quartz, clinochlore and amphibole components react with CaO to form reactive dicalcium silicate (C2S) and amorphous glass phases, promoting pozzolanic reactivity in MQD. QD promotes early aluminocarbonate (Mc) formation through CaCO3-derived CO32− release but shifts to hemicarboaluminate (Hc) dominance at 28 d. MQD releases active Al3+/Si4+ due to calcination and deconstruction, significantly increasing the amount of ettringite (AFt) in the later stage. With the synergistic effect of coarse–fine particle gradation, MQD-type fresh backfill can achieve a 161 mm flow spread at 20% replacement. Even if this replacement rate reaches 50%, a strength of 19.87 MPa can still be maintained for 28 days. The good workability and low carbon footprint of MQD-type backfill provide theoretical support for—and technical paths toward—QD recycling and the development of low-carbon building materials.

1. Introduction

With rapid industrialization and urbanization, the generation of solid waste such as quarry dust (QD) has significantly increased, presenting serious environmental concerns. QD is a fine residue generated during quarry operations and aggregate processing; due to limited landfill space, potential air pollution, soil degradation, and threats to groundwater quality, QD presents considerable disposal challenges [1,2,3]. Its uncontrolled disposal can exacerbate environmental deterioration, affecting ecosystems and human health. Meanwhile, extensive mining activities across the globe have produced substantial mined-out areas, known as goaf areas, causing severe geological hazards such as land subsidence, surface instability, and surrounding infrastructure risk [4,5,6]. Therefore, developing sustainable methods for reutilizing QD in industrial applications, particularly for mine backfill purposes, emerges as an urgent environmental and socio-economic necessity, offering practical solutions to mitigate adverse environmental impacts and effectively stabilize mining sites.
Substantial research efforts across the globe are currently focused on exploring sustainable reutilization pathways for QD. The construction industry in particular has been at the forefront of QD reuse, with researchers extensively investigating its potential role as an aggregate and supplementary cementitious material (SCM) [7,8]. QD can be effectively utilized to enhance the mechanical properties of concrete and address natural sand scarcity [9,10]. The material not only serves as an aggregate replacement but also contributes to reducing concrete production costs, making it an attractive option for construction projects. Research also indicates that incorporating limited QD into concrete mixes can, to some extent, improve the compressive strength and elastic modulus; however, over 20% fine QD would lead to a decline in mechanical performance [11]. Additionally, the development of both plasticized and non-plasticized concrete mixes utilizing QD has demonstrated favorable properties for both fresh and hardened concrete, further validating its application in construction [12]. The artificial neural network models employed have shown that QD enhances particle shape and grading, which are crucial for achieving optimal concrete performance [13]. Moreover, QD is marketed as a replacement for natural sand; various applications have been identified, including its use in asphalt mixes and as bedding sand for block paving. Optimal asphalt concrete performance can be obtained when the maximum QD aggregate particle size is 10 mm [14]. This versatility not only helps in managing waste from quarrying activities but also supports sustainable construction practices, aligning with global initiatives for reducing environmental harm. However, despite these documented advantages, the broader commercial adoption of untreated QD remains limited by critical constraints, primarily its inherent low pozzolanic reactivity and insufficient hydration activity. Consequently, further research and effective activation strategies are needed to overcome these limitations.
Several activation techniques have been extensively explored to address these inherent limitations. Mechanical activation via prolonged grinding has been reported to increase surface area and improve pozzolanic reactions, although this approach often involves considerable energy consumption and demonstrates limited long-term effectiveness. It has been found that after 120 min of mechanical activation (400 rpm), the Si dissolution percentage increases from 1.55% to 6.25%, while that of Al increases from 4.83% to 20.86% [15]. Chemical activation, involving alkali- or sulfate-based activators, has been extensively investigated, showing promising improvements in early-age strength development and hydration processes [16]. Samples with a sodium hydroxide to sodium silicate ratio of 1 exhibited the best mechanical performance, regardless of curing time [17]. However, chemical activation often leads to increased complexity in formulation control and concerns regarding potential environmental impacts. Thermal activation, notably calcination, has emerged as a highly effective method for enhancing the pozzolanic reactivity of QD. By transforming crystalline phases into amorphous ones, this process significantly improves its reactive potential and cementitious activity. Zhang et al. proved that, after 825 °C calcination, disordered silicate phases are generated, thus improving the dissolution of free Al and Si [18]. Zhao et al. also demonstrated that calcined QD-based binders exhibit excellent compressive strength at 1000 °C, indicating a lower cost and more favorable environmental performance [19].
However, due to the comprehensive effects of raw materials, processes, equipment and environmental factors, the chemical composition of QD varies greatly. During iron ore beneficiation, QD is generated as an inevitable by-product, primarily originating from dust collection during crushing, grinding, screening, and transportation. These dust particles are captured through removal systems (such as bag filters, electrostatic precipitators, or wet scrubbers) and form QD, the composition of which is complex. It predominantly consists of iron oxides (Fe2O3, Fe3O4), along with associated silica (SiO2), alumina (Al2O3), calcium–magnesium compounds, and trace heavy metals (e.g., lead, zinc, and arsenic). Physically speaking, QD exhibits an extremely fine particle size, low bulk density, and high susceptibility to airborne dispersion. Current resource utilization strategies include recycling iron elements through sintering feed reuse, pellet blending, or hydrometallurgical techniques [20,21]. QD with elevated hazardous components requires solidification/stabilization treatment prior to secure landfill disposal in order to comply with environmental regulations. Nevertheless, improving the reactivity and hydration potential of iron-rich QD via calcination remains a rare strategy.
Recognizing these research gaps, the present study introduces an approach that integrates calcination and calcium-increasing modification techniques for substantially enhancing QD hydration activity. Initially, QD was mixed and calcined with calcite (CaCO3) at 900 °C to optimize its reactive properties. A comprehensive suite of characterization techniques—including X-ray diffraction (XRD), Fourier transform infrared spectroscopy (FTIR), and scanning electron microscopy (SEM) [1]—was applied to systematically investigate the modification-induced structural, chemical, and morphological changes in order to clarify the activation mechanisms. Then, we rigorously evaluated the practical performance of the modified QD (MQD) as a SCM in cement-based materials. Key performance metrics, including fluidity and strength behaviors, were systematically assessed. These experimental evaluations aim to verify not only the improved fundamental properties of QD, but also its suitability and efficacy for applications in practical engineering scenarios, particularly in mine backfill operations.

2. Materials and Methods

2.1. Materials

In this paper, QD was taken from an iron ore dressing plant in Shanxi province. QD powder was sieved using a 1 mm sieve and dried in an oven at 50 °C before being stored for later use. Calcite, obtained from the local building materials market, was employed as a calcium-enhancing agent and mixed with QD for calcination. It is mainly composed of calcium carbonate, with a purity of 99.6%. Ordinary Portland cement (OPC, 425 R), also obtained from the local market, was used as the main cementitious material for backfill preparation; its chemical composition is shown in Table 1. Tap water was used to prepare fresh backfill slurry.

2.2. Sample Preparation

Performing X-ray Fluorescence Spectroscopy (XRF) on QD showed that it contained 48.46% SiO2, 6.55% CaO, 12.20% Al2O3, 19.75% Fe2O3, and 7.05% MgO (see Table 1). The main consideration is that dicalcium silicate (C2S) and aluminate are the main products during low-temperature calcination, and this requires reducing the calcium–silicon ratio to promote solid-state reactions. As such, the optimal range for producing active silicate is 1.0~1.2 (molar ratio), while that for generating the aluminate phase is approximately 0.15. Therefore, the QD/calcite mass ratio was set to 2:1. With this proportion, the total CaO in mixed materials reached 23.86%, with QD contributing 4.26 g, calcite 19.6 g, SiO2 31.5 g, and Ca/Si ≈ 0.8, while the aluminum–silicon ratio approached 0.15. This formula compensates for calcium deficiency in QD while retaining Al2O3 (7.93 g) and Fe2O3 (12.84 g), promoting cementitious activity. The MgO decreased to 4.58% after mixing and dilution, preventing excessive formation.
At 600 to 750 °C, CaCO3 generally decomposes at an accelerated rate. Its decomposition rate is affected by the raw material particle size and the atmosphere inside the muffle furnace; however, not all the CaCO3 is completely decomposed. At 750 to 850 °C, decomposition is nearly complete, and CaO becomes the active component, participating in the subsequent solid-state reaction [18]. Hence, calcination temperature is set to 900 °C to ensure complete CaCO3 decomposition while balancing the silicate network, promoting amorphous phase formation, and triggering MQD reaction activity, avoiding the vitrification or excessive sintering caused by high temperatures. The heating rate is 10 °C/min, and the calcination holding time is 60 min.
To evaluate the workability of modified QD as an SCM in cemented paste backfill (CPB), fresh samples were prepared based on the experimental scheme shown in Table 2. For comparison, both raw and modified QD were mixed with OPC. To reduce pipeline transportation resistance, inhibit segregation and settlement, and shorten the solidification period to enhance early strength, a mass concentration of 75% was selected. The mass ratios were set at 1:9, 2:8, 3:7, and 5:5, respectively. Such mass ratios enable the backfill to achieve greater mechanical strength, meaning it meets the strength requirements for filling along the side of the abandoned roadways in coal mines.

2.3. Analytical Methods

To access the transformation of MQD and CPB hydration, serval microscopic detection technologies were applied; their technical parameters are described in the following. It is worth noting that the samples were vacuum-dried at 60 °C for 12 h to largely remove the physically adsorbed water.
(1) XRD test: The phase changes in MQD and CPB hydration were characterized using the Shimadzu 7000 X-ray diffraction analyzer (Tokyo, Japan). The test samples need to be ground and sieved through a 200-mesh sieve. They should present no granular feel when touched, and have a uniform particle size and a sample mass above 0.1 g. Test parameters: X-ray source of Cu-Kα, counting time of 0.24 s/step, slit width of 0.02°, scanning range of 5 to 70°, and scanning speed of 5°/min.
(2) FTIR test: The chemical structure and functional group changes in MQD were analyzed using a Thermo Scientific Nicolet iS50 Fourier transform infrared spectrometer (Waltham, MA, USA). The spectral range was set from 4000 to 400 cm−1 with a resolution of 4 cm−1, and each spectrum was acquired through 32 scan accumulations. The potassium bromide (KBr) pellet method was employed for sample preparation to ensure optimal infrared transmission characteristics.
(3) SEM observation: The surface morphology and microstructure evolution of MQD were examined using a Zeiss Sigma 300 scanning electron microscope (Oberkochen, Germany). The samples were platinum-coated using a Leica EM ACE600 sputter coater (Leica Microsystems, Wetzlar, Germany) to enhance conductivity, followed by imaging under high-vacuum mode with an accelerating voltage of 10 kV. Secondary electron (SE) detectors were employed to capture topographical and compositional contrasts, respectively.
(4) TG analysis: The thermal decomposition behavior and mass loss characteristics of CPB hydration were investigated using a Netzsch STA 449 F5 Jupiter simultaneous thermal analyzer (Selb, Germany). Tests were conducted under a nitrogen atmosphere (50 mL/min) at a heating rate of 10 °C/min from room temperature to 1000 °C. Approximately 15 mg powder samples were placed in alumina crucibles, with an empty crucible serving as a reference. Derivative thermogravimetry (DTG) curves were analyzed using Proteus software (https://www.labcenter.com/ (accessed on 29 July 2025), Labcenter Electronics, Burnsall, UK) to identify dehydration and decarbonation.
(5) Fluidity measurement: The rheological performance was evaluated according to [18] using a mini-cone slump. Fresh mixtures were filled into truncated cone molds (height 60 mm, top/bottom diameters 36/60 mm) and lifted vertically at 0.5 mm/s. The final spread diameter was measured at least twice, and the average value was taken as fluidity.
(6) Compressive strength test: A hydraulic universal testing machine equipped with a 200 kN load cell was employed following the C39/C39-18 standard [22]. Cylindrical specimens (φ50 × 100 mm) were axially loaded at a speed of 1 mm/min until failure. Strength values were calculated as Fmax/A, with results normalized to 3- and 28-day cured samples.
It needs to be emphasized that fluidity and compressive strength tests must be conducted more than three times, with the average value taken to reduce errors. Moreover, when obvious incorrect data are obtained during the test, the samples need to be retested until the results of the two tests are close.

3. Results and Discussion

3.1. MQD Mineral Phase Transformation

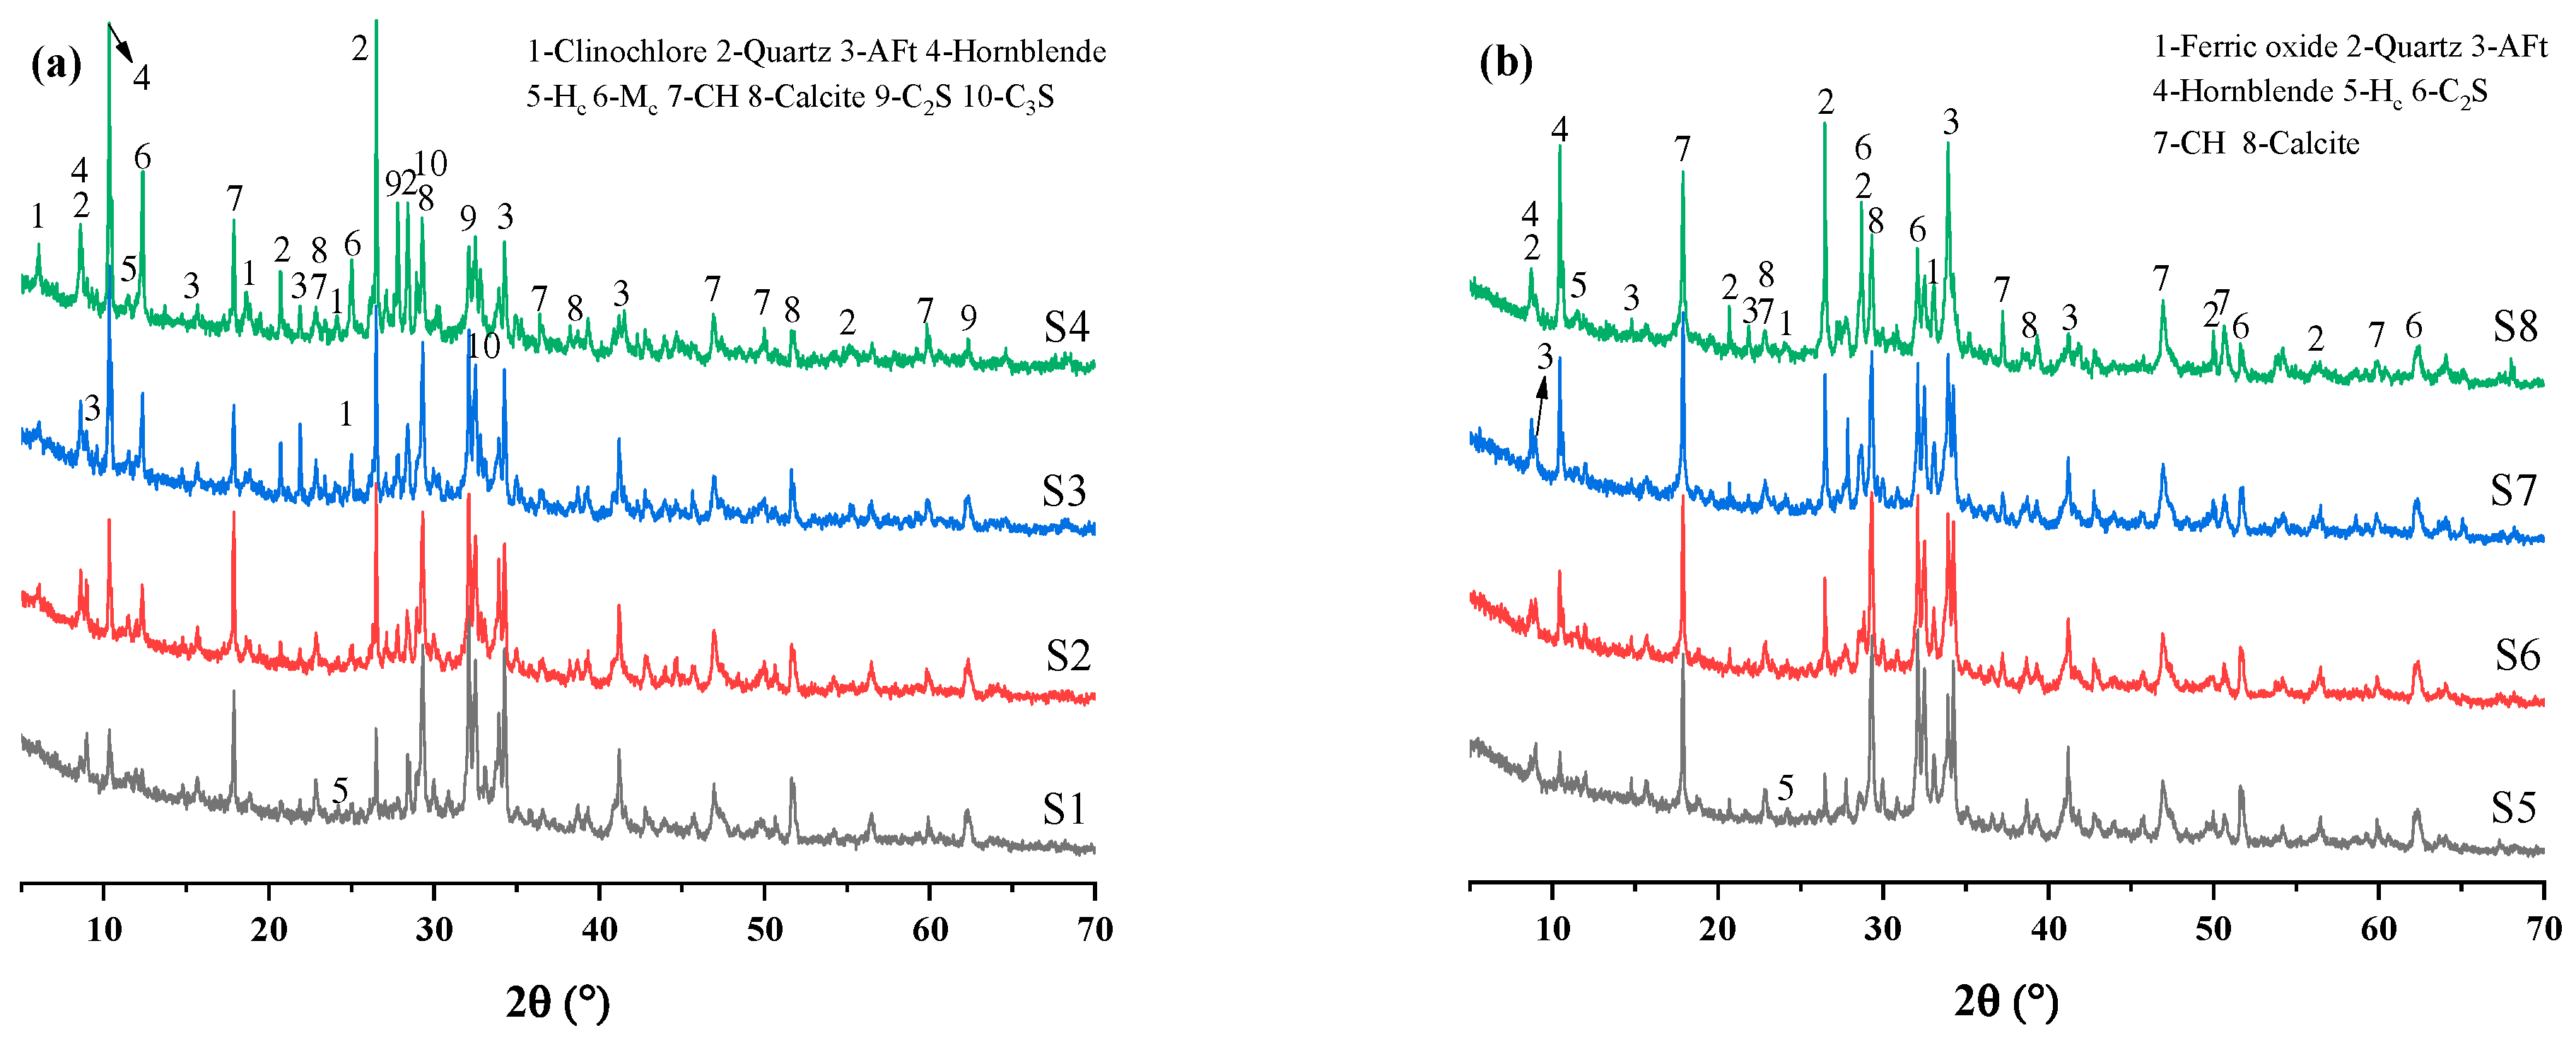
3.1.1. XRD Analysis of QD/MQD

The XRD spectrum of the raw materials (Figure 1a) before calcination shows that the surrounding rock of the iron ore is mainly composed of quartz (SiO2), clinochlore ((Mg, Fe)5Al2Si3O10 (OH)8) and hornblende (Ca2 (Mg, Fe, Al)5Si8O22 (OH)2). Among them, quartz is mainly marked by characteristic reflections at 2θ = 26.6° (d = 3.34 Å), 20.8° (d = 4.26 Å) and in the range of 25°~30°; clinochlore’s characteristic reflections are distributed at 2θ = 6.2° (d = 14.2 Å) and 12.4° (d = 7.1 Å); and hornblende’s characteristic reflections are concentrated at 2θ = 8.9° (d = 9.9 Å) and 29.9° (d = 2.99 Å). The existence of these mineral phases indicates that the raw materials are mainly silicate minerals, including iron–magnesium layered silicate and chain silicate, and their structural stability is controlled by the state of coordination between the hydroxyl group and metal cation [23]. The significant existence of quartz in the XRD pattern of calcined products indicates its high-temperature stability (see Figure 1b) [24]. At the same time, dicalcium silicate (Ca2SiO4, C2S, 2θ = 32.1°, 34.3°), anorthite (CaAl2Si2O8, 2θ = 27.8°, 30.5°), calcium iron oxides (CaFe2O4, 2θ = 33.2°, 35.6°) and iron oxides (Fe2O3, 2θ = 35.4°) were newly formed. Furthermore, the broad gentle dispersion band of the amorphous glass phase (2θ = 20°~35°) indicates that part of the silicate melt is not crystallized during cooling, while the hornblende residual reflections suggest its incomplete decomposition [25].
During the calcination process, calcium carbonate (CaCO3) decomposes into CaO and CO2 at roughly 600 °C~800 °C. The resulting CaO acts as an alkaline flux and undergoes a solid-phase reaction with silicate minerals in the surrounding iron ore rock [26]. Quartz and CaO form C2S through a diffusion control mechanism at 900 °C. The reaction can be expressed as 2CaO + SiO2→Ca2SiO4. The decomposition of clinochlore and hornblende releases Al3+, Fe2+/Fe3+ and Mg2+, where Al3+ combines with CaO and SiO2 to form anorthite (CaO·Al2O3·2SiO2), while Fe3+ reacts with CaO to form CaFe2O4. The generation of iron oxides may originate from the oxidation of Fe2+ in hornblende (4FeO + O2→2Fe2O3). The existence of residual hornblende indicates that its thermal decomposition kinetics is hindered, perhaps by the strong Si-O-Si bond in its chain structure and local anoxic environment [27]. The formation of the amorphous glass phase is related to the cooling of low-melting-point eutectic mixture [28]. The complexity of its composition leads to insufficient crystallization driving force. To sum up, the heterogeneous coexistence of calcined products reflects the combined effect of thermodynamic equilibrium and kinetic limitations in the reaction path, and the ratio of CaO addition and calcination time may need to be further optimized to achieve complete mineral conversion [29].

3.1.2. FTIR Analysis

Compared with the raw material, the infrared spectrum of the calcined product showed significant structural reorganization characteristics (see Figure 2). The decrease in band intensity at 450 cm−1 and 454 cm−1 indicates that the bending vibration mode of Si-O tetrahedron in silicate minerals has changed, which may be related to the collapse of clinochlore and hornblende lamellar/chain structures in the raw materials [30]. The thermal decomposition of such minerals leads to the breakage of their Si-O-M (M = Mg, Fe, Al) bonds, the depolymerization of local silicon–oxygen networks and their recombination into amorphous phases, thus weakening the intensity of low- wavenumber bands [31]. The sharpening of the band around 750 cm−1 is related to the enhancement of Si-O-Si symmetrical stretching vibration and Si-O-Al asymmetric stretching vibration, suggesting increased newly formed anorthite after calcination [32]. In addition, the disappearance of the band at 924 cm−1, which is attributed to Al-O-Si or Mg-O vibration, confirms the complete destruction of clinochlore and/or partial decomposition of hornblende in the raw material at high temperatures [33]. The sharpening of the band at 990 cm−1, corresponding to Si-O-Al/Fe vibration in anorthite/calcium ferrite, directly reflects the crystallization process of the new silicate phase [34]. The significant enhancement of the asymmetric stretching vibration of CO32− at 1413 cm−1 indicates the incomplete decomposition of calcium carbonate during calcination. This might be related to the uneven heating of mixed materials [35].
The broadening and enhancement of hydroxyl (-OH) absorption bands in the 3417–3557 cm−1 region reveal the complexity of hydroxyl evolution in calcined systems [36]. Although, in theory, a high temperature promotes layered/chain silicate dehydroxylation, the enhanced band may originate from the following mechanisms: (1) the high specific surface area of the nascent amorphous glass phase promotes the chemisorption of ambient water molecules on its surface during cooling, forming Si-OH or Fe-OH bonds [37]. (2) The partial dehydroxylation of residual hornblende leads to the reconstruction of the hydrogen bonding network of hydroxyl groups in its structure, enhancing the vibration dipole moment [38]. (3) The surfaces of iron oxides undergo hydroxylation in an oxidizing calcination atmosphere [39]. The above process is consistent with the detection results of hornblende residues, iron oxides and amorphous phases in XRD, indicating that the apparent enrichment of the hydroxyl group is actually the superposition effect of mineral decomposition kinetics lag and interfacial re-reaction. In addition, the band changes in the 450–990 cm−1 interval further verify the transformation of the silicate network from a layered/chain topology to a framework or island structure, driven by the CaO charge compensation effect on the silicon–oxygen tetrahedron [40].

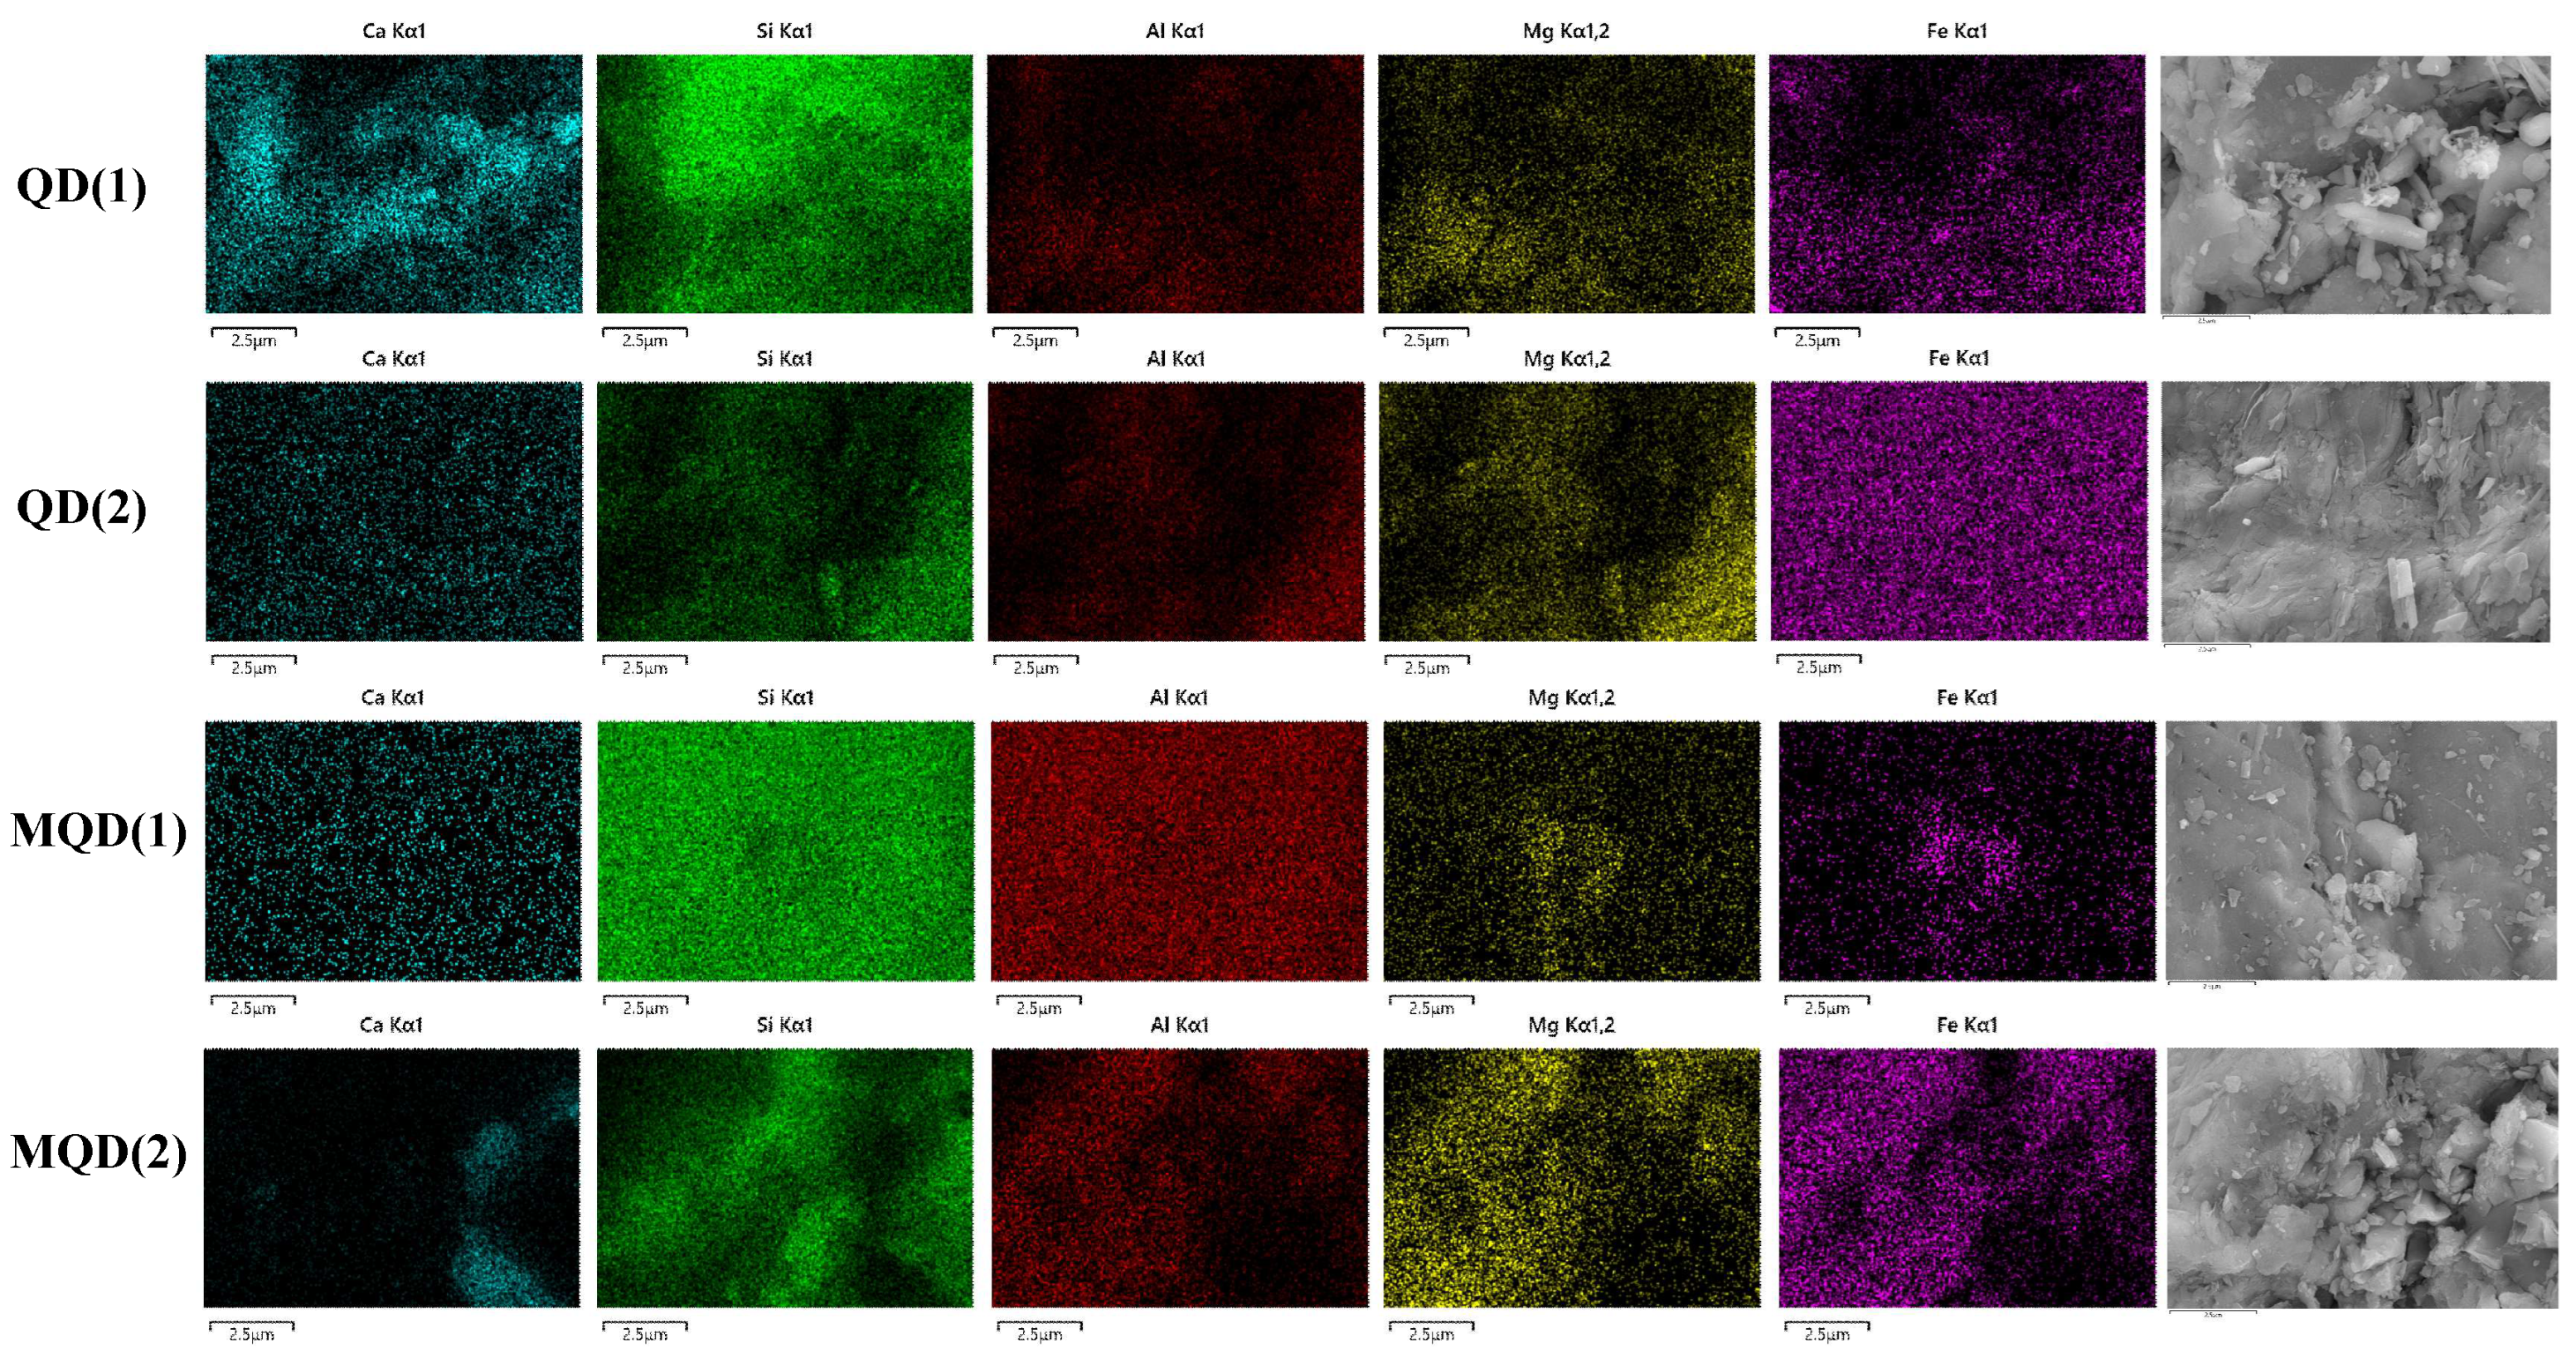
3.1.3. SEM-EDS Analysis

Figure 3 shows the QD and MQD SEM-Mapping results. It can be seen that the local enrichment of Ca and Si in QD(1) is consistent with the primary occurrence state of quartz and a small amount of carbonate, while the wide area of Fe distribution suggests that it may exist in the form of hornblende or cryptocrystalline iron oxide [41]. The relative scarcity of Al and Mg indicates that clinochlore accounts for a limited proportion in this area [42]. The global enrichment of Fe in QD(2) may originate from the Fe-Mg chain structure of hornblende or the dispersive distribution of secondary magnetite (Fe3O4) in the raw material, while the local enrichment points of Si and Mg may correspond to clinochlore and hornblende [43]. The above differentiation phenomena reveal the microscopic heterogeneity of mineral phases in the raw materials, and the symbiotic mode of Fe-Mg-Al silicate and quartz/carbonate is controlled by the geochemical distribution of elements under the original diagenesis [44].
MQD(1) mapping after calcination shows the global distribution of Ca, Si, and Mg, indicating that CaO, derived from the decomposition of CaCO3, undergoes a solid-phase diffusion reaction with silicate minerals at high temperatures to form homogenized dicalcium and a glass phase [45].The local enrichment of Fe and Mg may correspond to calcium ferrite or incompletely reacted hornblende debris; their migration ability is limited by the low diffusion coefficient of Fe3+ in silicate [46]. The local enrichment of Ca in MQD(2) is spatially separated from the main enrichment areas of Si, Al, Mg, and Fe, suggesting that phase separation has occurred. The localization of Ca may originate from unreacted CaO particles or anorthite crystal core sites, and the wide distribution of Si-Al-Mg-Fe is related to the formation of amorphous glass phases and magnesium silicates. This spatial differentiation indicates that the diffusion of Ca2+ during calcination dominates silicate network reorganization; however, high-valence cations such as Al3+ and Fe3+ are limited to local areas due to charge balance requirements, resulting in multiphase coexistence. This phenomenon highlights the decisive influence of differences in cation migration rates in solid-state reactions on the final product microstructure [47].
Overall, under calcination at 900 °C, we see the complete decomposition of clinochlore and partial decomposition of hornblende in the raw materials. Their layered/chain siloxane networks disintegrate due to dehydroxylation and metal-O bond breaking; these bonds correspond to reconstructed -OH peaks at 3417–3557 cm−1 and the disappearance of Al-O-Si/Mg-O peaks at 924 cm−1 in the FTIR results. The released Al3+ and Fe3+ combine with the CaO derived from the decomposition of CaCO3, forming anorthite and calcium ferrite. Concurrently, CaO reacts with reactive SiO2 via solid-phase diffusion to generate C2S, though most of the quartz remains intact due to its high thermal stability. The incomplete decomposition of hornblende is closely linked to the resistance of its chain-like Si-O-Si bonds to thermal breakdown, as well as the hindered oxidation of Fe2+ under local oxygen-deficient conditions [48]. The amorphous glass phase originates from the cooling of a multicomponent silicate melt, whose compositional complexity reduces crystallization driving forces. SEM-Mapping reveals kinetic competition between the global diffusion of Ca2+ and the localized enrichment of Fe3+/Al3+, ultimately leading to the multiphase coexistence of crystalline and glass phases and residual minerals. Additionally, incomplete CaCO3 decomposition and enhanced hydroxyl adsorption may arise from uneven heat transfer due to material mixing heterogeneity and the chemisorption of water molecules on the surface of the nascent amorphous phase [49].

3.2. Hydration Evolution of QD/MQD-Containing CPB

3.2.1. XRD Analysis of QD/MQD-Containing CPB
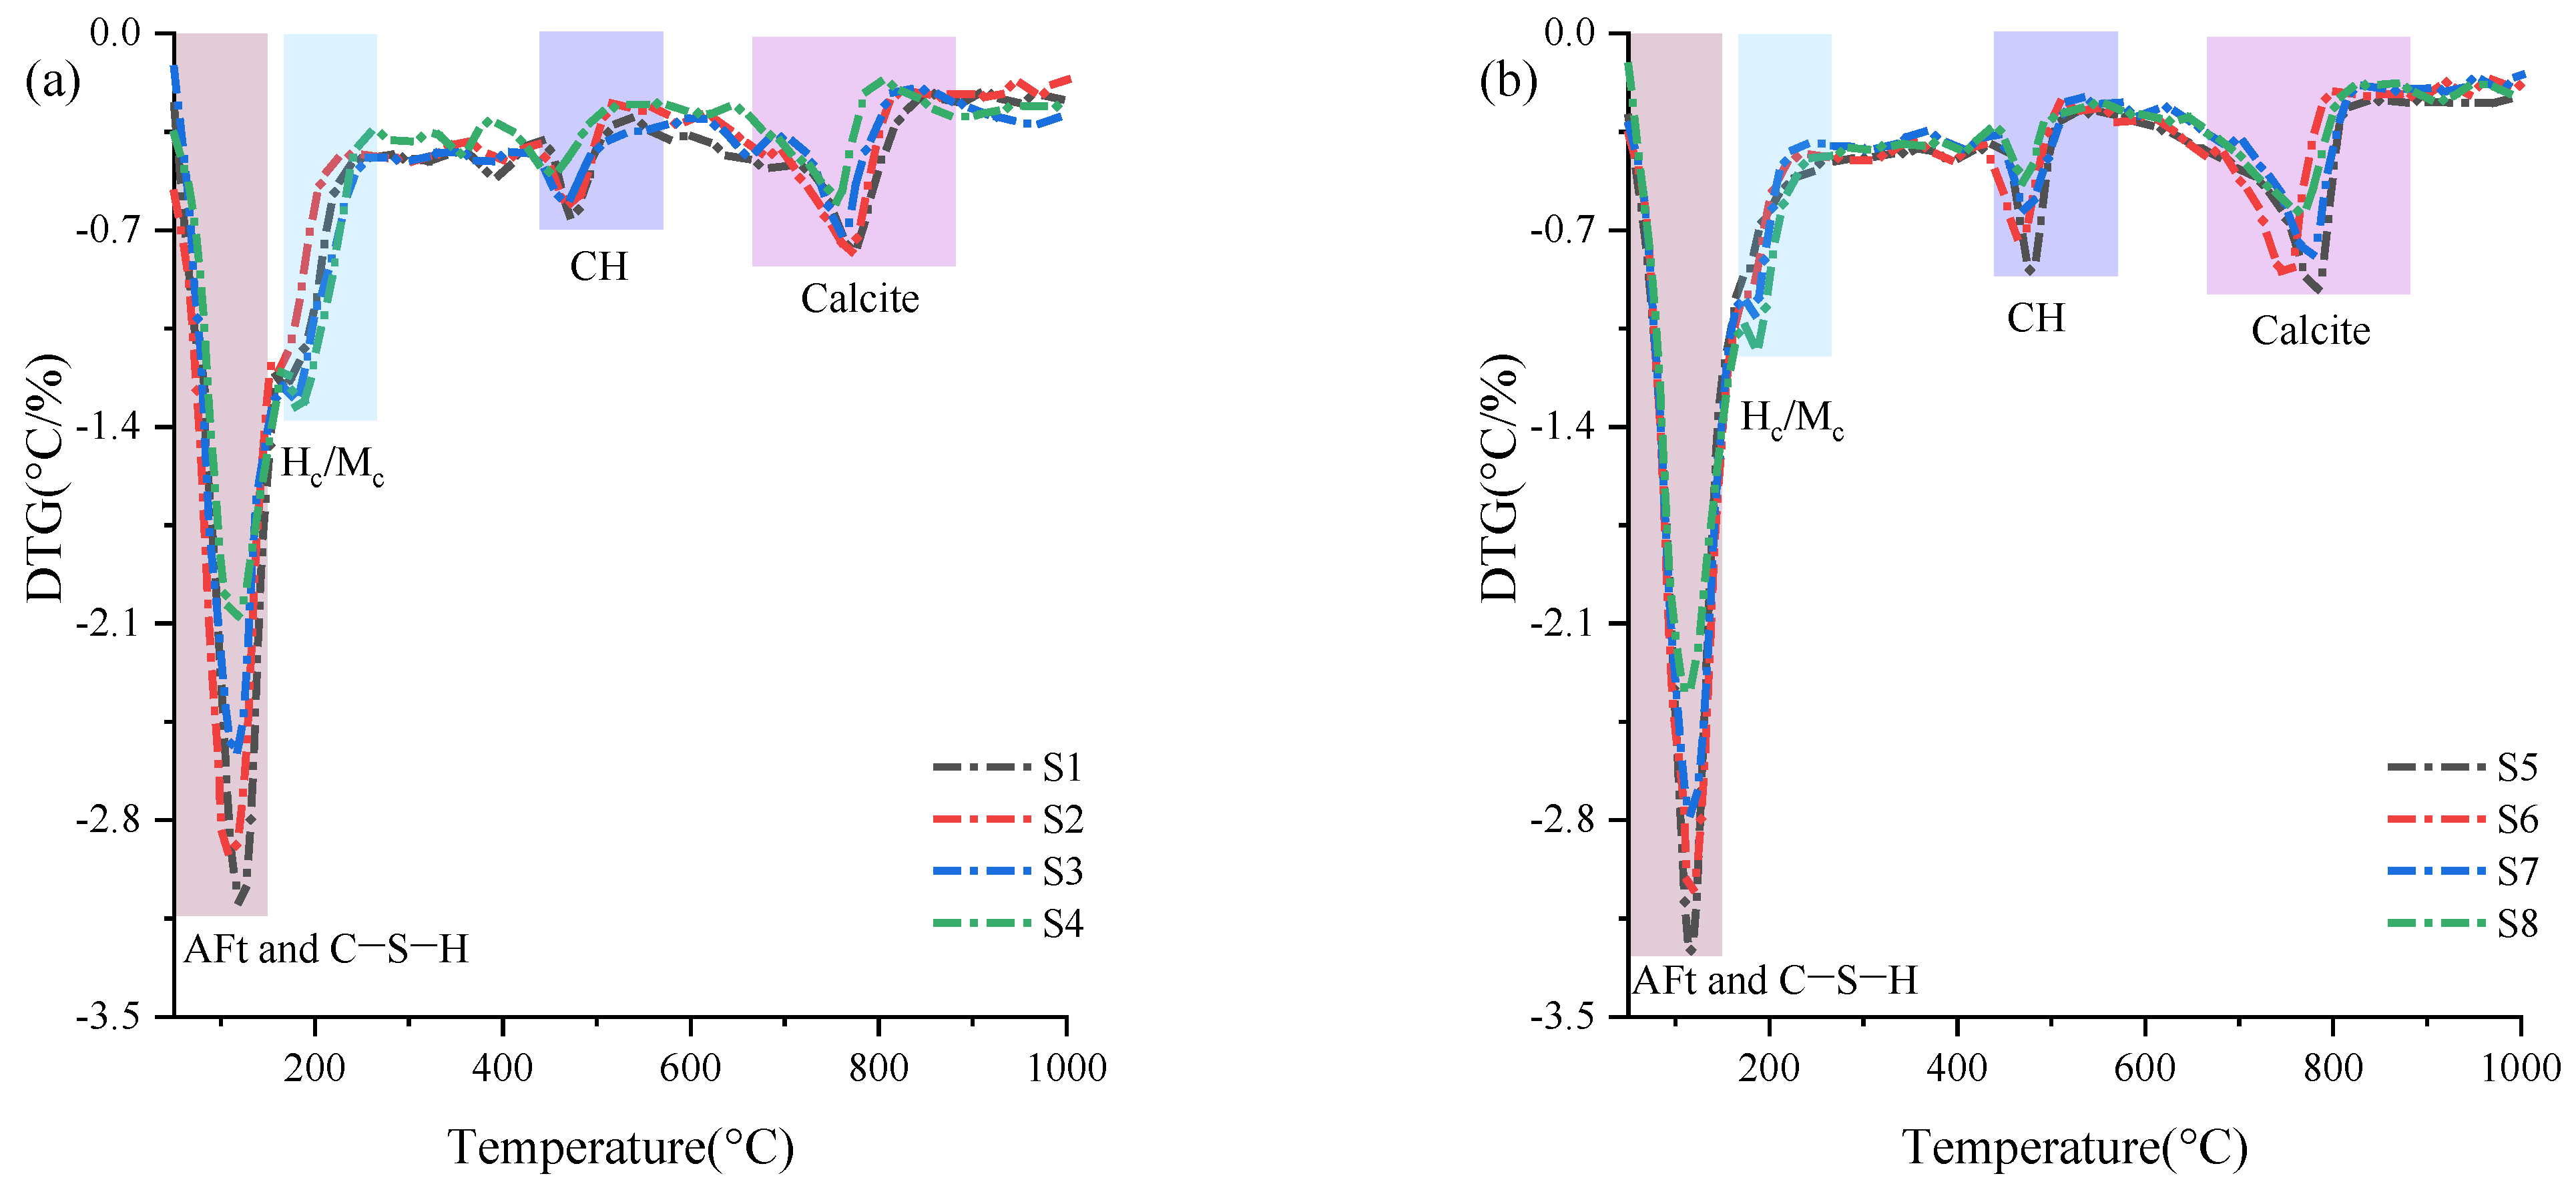
The XRD results in Figure 4 revealed the significant regulatory effects of QD and MQD on the hydration product compositions of CPB (S1~S8). At 3 days of hydration, the reflection intensity of monocarboaluminate (Mc, Ca4Al2 (CO3)(OH)12·6H2O) increased with QD dosage. This is attributed to the partial dissolution of residual trace carbonate in raw materials under highly alkaline conditions, releasing CO32− that promotes the preferential combination of tricalcium aluminate (C3A) to form Mc. The weak presence of hemicarboaluminate (Hc, Ca4Al2(CO3)0.5 (OH)13·6H2O) was limited by the increased mole ratio of CO3/(CO3 + 2OH) in the early stage [50]. At 28 days of hydration, Mc intensity decreased while Hc significantly increased. This occurred because, despite the continuous dissolution of CaCO3 in QD replenishing CO32−, the massive consumption of free CO32− by ettringite (Ca6Al2 (SO4)3 (OH)12·26H2O, AFt) formation and calcium hydroxide carbonation reduced its concentration below a critical threshold, making Hc the thermodynamically stable phase. Notably, chinochlore and hornblende exhibited high chemical inertness under ambient alkaline conditions due to their layered/chain silicate structures, whereas Al3+/Fe3+ remained unreacted. The evolution of aluminate phases was solely governed by cement-derived C3A and QD carbonates [51].
In contrast, the MQD-containing system showed extremely low Hc intensity and undetectable Mc at 3 days; however, it displayed relatively significant Hc enhancement at 28 days. This is attributed to the calcination-induced dissociation of mineral topological structures, enabling the rapid release of free Al3+ to directly participate in Hc nucleation. The evolution of AFt reflection intensity further confirmed MQD’s relatively high reactivity. At equivalent dosages, the AFt intensity in MQD-cement systems consistently exceeded that in QD-cement systems, with amplified intensity growth at 28 days. This indicates that calcination-generated calcium ferrites and amorphous phases accelerated Fe3+/Al3+-sulfate interfacial reactions [52]. Notably, CH intensity decreased with increasing QD/MQD dosage, while samples with QD exhibited lower CH reflection intensity than MQD-containing samples. This suggests that calcined MQD products contained reactive silicates/aluminosilicates and extra quicklime, generating additional CH during hydration. The calcite reflection intensity decreased with QD/MQD dosage but increased with curing time, revealing kinetic competition between aluminate phase formation and carbonate precipitation [53]. The residual unreacted quartz/ferric oxide content showed positive correlations with QD/MQD dosage, highlighting mass transfer limitations at inert mineral–cement interfaces.

3.2.2. TG Analysis

As illustrated in Figure 5, the derivative thermogravimetric (DTG) profiles recorded for 28-day hydrated specimens revealed multiple distinct peaks associated with thermal decomposition processes. These characteristic mass loss events were principally attributed to structural dehydroxylation reactions and carbonate-containing compound decomposition within cementitious hydrates; this is consistent with previous observations in the literature [54]. Through thermogravimetric analysis, three critical phase parameters were systematically quantified: (1) chemically bound water (CBW) content, as determined through 50–550 °C mass variation (see Chemical Equations (1) and (2)); (2) calcium hydroxide (CH) concentration, derived from 400 to 550 °C decomposition characteristics (see Chemical Equation (3)); and (3) carbonate (C) proportion, as calculated using 550–850 °C mass differentials (see Chemical Equation (4)) [55].
C-S-H·nH2O→C-S-H + nH2O
3CaO·Al2O3·3CaSO4·32H2O→3CaO·Al2O3·3CaSO4 + 32 H2O
Ca(OH)2→CaO + H2O
CaCO3→CaO + CO2
According to the calculation results in Figure 6, the contents of CBW, CH, and C all decrease with increasing QD and MQD dosages; however, the MQD-containing systems exhibit significantly higher values than their QD-containing counterparts. For example, sample S5 (10% MQD) shows CBW, CH, and C contents of 22.45%, 12.14%, and 17.89%, respectively, which are 3.2%, 3.1%, and 2.5% higher than those of sample S1 (10% QD). Even at 50% dosage, sample S8 (MQD) maintains higher values (13.28% CBW, 6.08% CH, 10.02% C) than sample S4 (QD). This difference is attributed to the high reactivity of calcined products. C2S formed during calcination enhances hydration by releasing calcium ions and silicon–oxygen tetrahedra, promoting C-S-H gel formation and increasing CBW [56]. Additionally, aluminum ions from MQD’s amorphous glassy phases accelerate ettringite nucleation, which consumes CH, leading to CH consumption. The XRD results further validate this, as intensified ettringite peaks confirm enhanced aluminum release and interfacial reactivity [57]. MQD-containing systems have high CH values as reactive silicates/aluminosilicates generate additional CH during hydration.
The C content in the QD-incorporated sample decreased by 40.9% with increasing dosage, while the MQD-incorporated sample showed a 44.0% reduction, indicating that calcination promotes calcium carbonate decomposition and recarbonation synergy. FTIR detects residual CO32− peaks in calcined products, where alkaline dissolution replenishes carbon sources and stabilizes calcite via carbonation. In contrast, raw ore’s intact calcium carbonate crystals and low solubility limit carbonation, while inert minerals like clinochlore and hornblende occupy interfacial space, hindering hydration [58]. Consequently, a high QD dosage reduced CBW and CH to 56.5% and 45.2% of S1’s values. Calcination enhances MQD’s contribution by destroying inert mineral structures, releasing active Al/Si ions, and optimizing interfacial reactions, whereas QD’s stability and mass transfer limitations dominate performance degradation.

3.3. Workability of QD/MQD-Containing CPB

Fluidity and uniaxial compressive strength (UCS) are two core indexes for evaluating CPB properties. The former quantifies the deformation capacity of slurry during transportation through a slump or flow spread test; this directly affects construction feasibility and must take pipeline transportation efficiency and anti-segregation stability into account. UCS characterizes the bearing capacity of the solidified backfill, which must meet engineering mechanical design requirements; its development law is related to the hydration process and long-term durability of backfill.

3.3.1. Fluidity

As shown in Figure 7, the change in slurry flow spread of 10%~50% when QD and MQD replace cement, respectively, shows a nonlinear law of first rising and then falling, with the two systems showing differentiated attenuation characteristics. In detail, the flow spread of the QD system is 148 mm, 156 mm, 135 mm and 102 mm at 10%, 20%, 30% and 50% substitution ratios, respectively. In turn, the packing densities are 0.647, 0.662, 0.638 and 0.591 [6,59]. The flow spread of the MQD-containing systems corresponds to 141 mm, 161 mm, 144 mm, and 118 mm, and the packing density is 0.653, 0.678, 0.659, and 0.624. It can be seen that the flow spread of both increases at a low dosage of below 20%, and the fluidity peak of MQD reaches 161 mm at 20%; this is significantly higher than QD’s performance at the same dosage. However, at a high dosage of 50%, QD expansion decreases sharply to 102 mm, while MQD remains at 118 mm with a more moderate attenuation amplitude. The D50 (D50: The median diameter, indicating that 50% of the particle volume is smaller than this size.) values of QD and MQD are 12.2 μm and 11.5 μm, respectively; these are significantly larger than that of cement (8.84 μm). Its coarse particles can fill the voids formed by fine particles in cement, reducing water demand. At this time, the packing densities of QD and MQD systems increased to 0.662 and 0.678 at 20% dosage, respectively, indicating that a tightly packed structure was formed between particles, the yield stress of the slurry was reduced, and the flow spread was improved [60]. The D[3,2] (D[3,2]: A surface area-weighted average that characterizes particle size based on surface area) value of MQD is 4.33 μm, which is slightly higher than that of QD (4.84 μm), indicating that the average surface area of MQD particles is smaller and the water demand is further optimized; as such, its peak fluidity (161 mm) exceeds that of QD (156 mm). In MQD-containing systems, more water can be employed to wrap solid particles to form a water film; fluidity is positively correlated with water film thickness [61,62]. After the dosage exceeds 30%, the proportion of coarse particles is too high, resulting in gradation imbalance, and the original, fine particle-dominant system is destroyed. The D[4,3] (D[4,3]: The volume mean diameter, a volume-weighted average that emphasizes the size distribution based on particle volume.) value of QD is 17.0 μm, which is significantly higher than that of MQD (16.7 μm), and the D90 (D90: The diameter at which 90% of the particle volume is smaller.) of QD and MQD are 39.1 μm and 40 μm, indicating QD’s wider particle size distribution. As such, the friction resistance between coarse particles intensifies, and the packing density drops sharply to 0.591 at 50% dosage. Slurry flow resistance increases sharply, and the flow spread drops to 102 mm. For MQD, the high D[3,2] value of 4.33 μm and the low D[4,3] value of 16.7 μm indicate that its particle shape may be closer to spherical or the surface may be smoother; as such, a 0.624 density can still be maintained at high dosage and flow property attenuation can be slowed down. Due its better particle size parameters balancing coarse particle proportions, its surface area and its morphological characteristics, MQD shows stronger adaptability in both high and low dosage ranges.

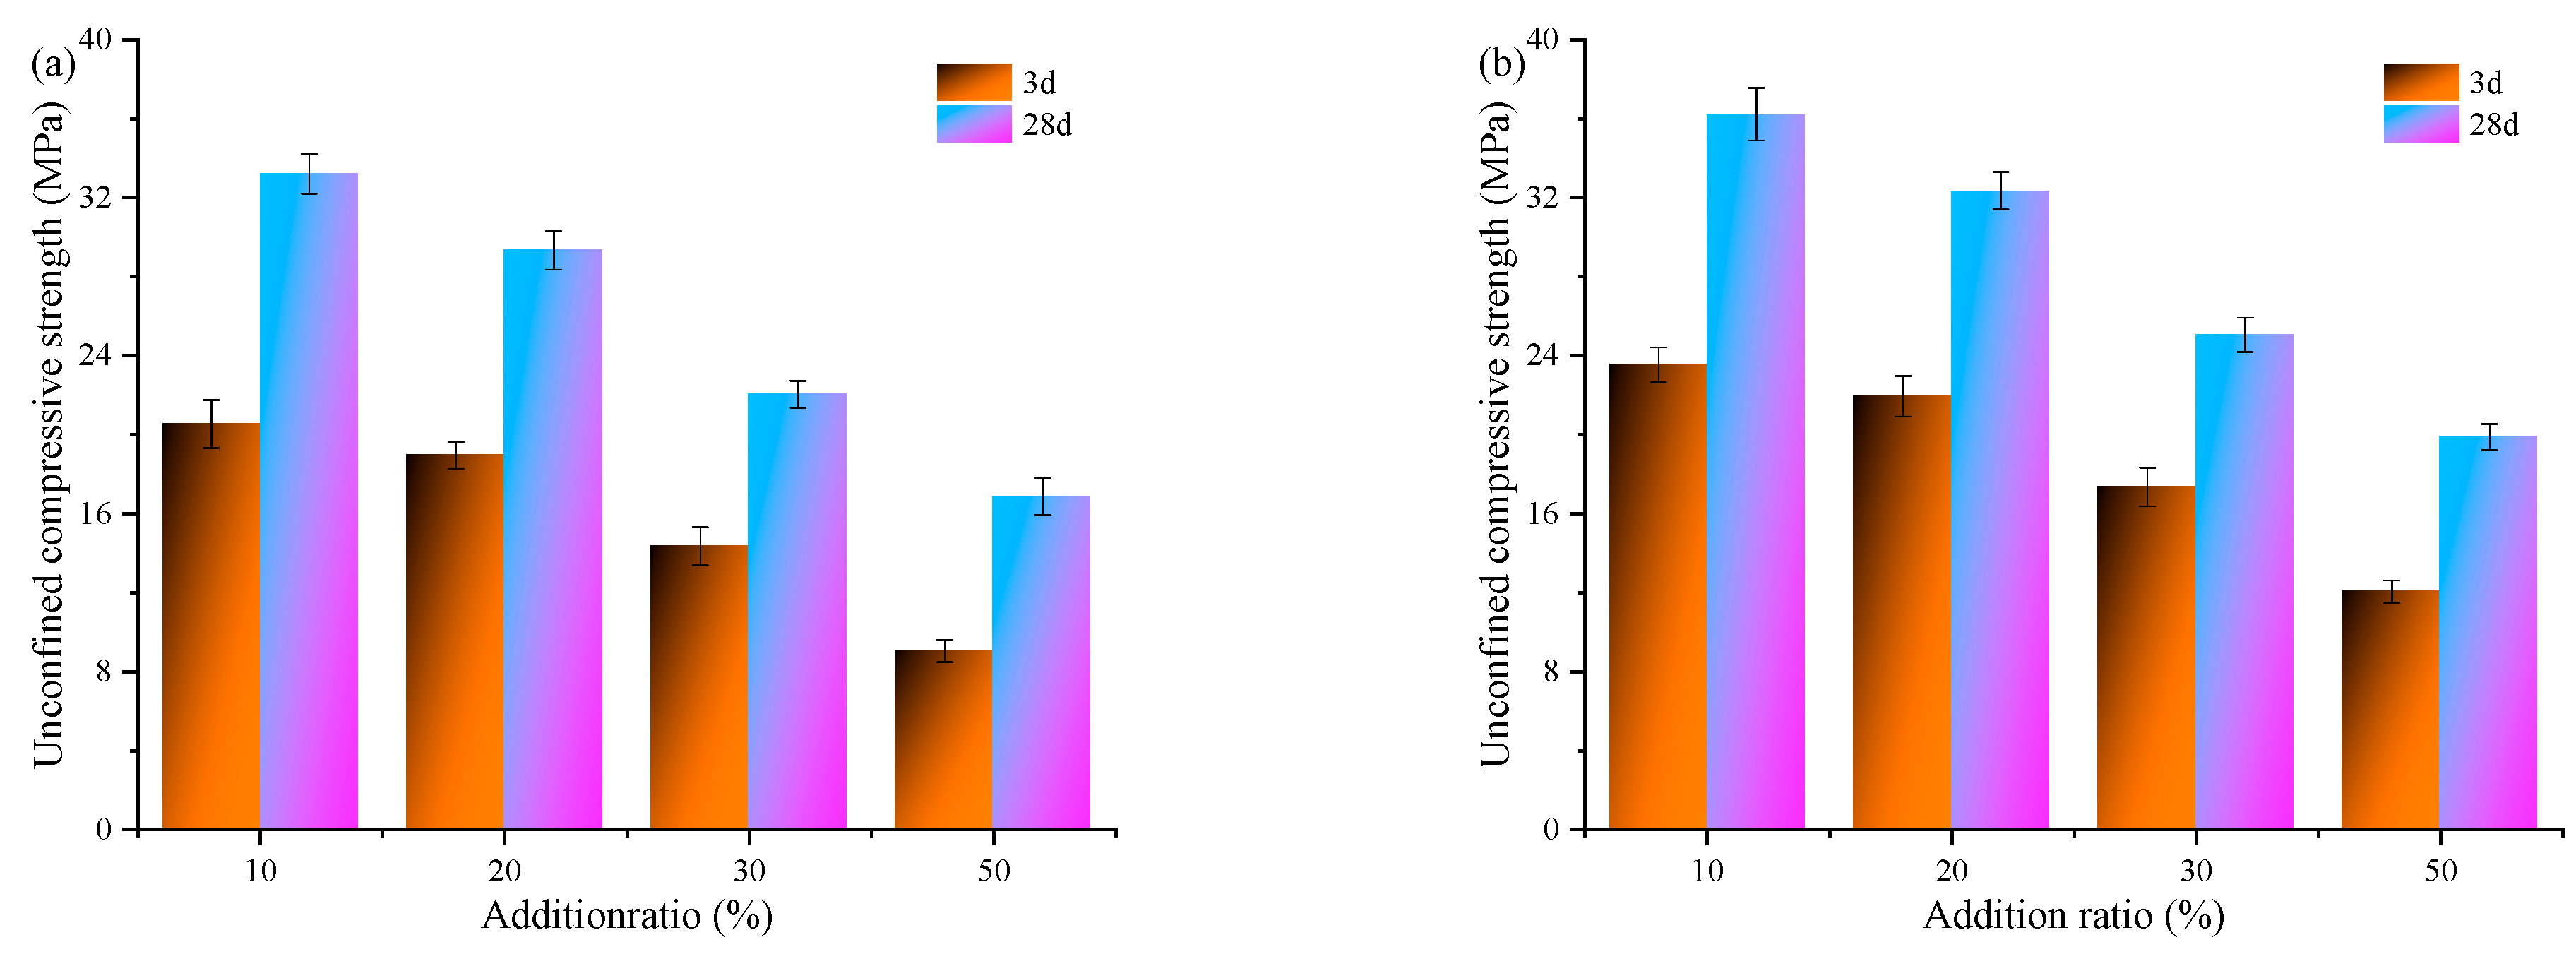
3.3.2. Compressive Strength

As seen in Figure 8, the strength of QD/MQD-containing backfill decayed nonlinearly with increasing substitution ratio, but S5~S8 showed significant mechanical advantages due to its better packing density and chemical activity. Under a replacement rate of 10% to 50%, the UCS value of QD-containing backfill (S1~S4) dropped sharply from 20.54 MPa to 9.05 MPa at 3-day hydration, marking a decrease of 55.9%, and the strength dropped sharply from 33.21 MPa to 16.87 MPa at 28-day hydration (a decrease of 49.2%). The strength of the MQD-containing backfill decreased by 48.8% and 45.1%, respectively, at the same hydration times. It is worth noting that the 28-day strength (19.87 MPa) of S8 under a high replacement rate of 50% is still close to the UCS value of S3 at 30%, revealing that its effective strength support ability is maintained even at high dosages. This phenomenon is partially related to their differing particle size distribution. The D[3,2] of MQD is 4.33 μm, which is smaller than the 4.84 μm shown by QD; the corresponding specific surface area is increased, promoting the rapid nucleation of early hydration products. The D50 of MQD is 11.5 μm while that of cement is 8.84 μm, forming complementary gradation. The particle packing efficiency is optimized, and the packing density at a 20% replacement rate is 0.678; this is significantly higher than the 0.662 seen in QD at the same dosage. The compact physical structure delays defect formation under a high substitution rate. MQD’s compactness only decreases by 2.8% to 0.659 at a 30% dosage, while that of the QD system decreases by 3.6% to 0.638, resulting in a sharps drop of 34.7% and 24.9% in S3’s mechanical performance at 3 and 28 days at 30% dosage, respectively.
MQD backfill displays stable strength due to the mineral phase reconstruction and multi-scale reactivity activated by calcination. The XRD results showed that the 28-day peak intensity of hydration products such as AFt and calcite in the MQD-type backfill was higher than that in the QD-type samples (see Figure 9). This can be attributed to the destruction of the layered clinochlore structure by calcination; the release of active Al3+ directly participated in hydration product nucleation [63]. At the same time, residual calcium carbonate was calcined, continuously supplementing CO32−. The TG data proved that MQD’s carbonate content was 10.02% higher than that of QD (8.17%) at 50% dosage. These data further revealed that the CBW (13.28%) and CH (6.08%) contents of MQD-type backfill were 12.3% and 18.6% higher, respectively, than those of QD-type at high dosages. This indicates that the active C2S generated by calcination continuously hydrates to form C-S-H gel (see Figure 9) and that the released Si4+/Al3+ accelerates CH consumption by adsorbing hydroxyl groups, forming a dynamic enhancement mechanism. On the other hand, in QD-type samples, the chemical inertness of minerals such as clinochlore and hornblende leads to decreased interfacial transfer efficiency, attenuating the hydration process of cementitious systems. Nevertheless, the synergistic effect of physical gradation optimization and chemical activity release enables MQD-type backfill to achieve enhanced particle filling and hydration regulation when used to replace cement.
Speaking broadly, in this article, the performance of QD/MQD-based cementitious material was studied and compared. Due to its better particle gradation, MQD has a D[3,2] value of 4.33 μm and a D50 of 11.5 μm, enabling better slurry fluidity. Calcination releases active aluminum ions and silica ions from MQD, promoting hydration product formation and leading to better backfill mechanical performance [64]. This advantage stems from the synergistic effect of physical filling and MQD’s chemical activity; this not only optimizes particle density, but also continuously enhances the hydration reaction through mineral phase reconstruction [65].
As evidenced by the authors of [66,67,68,69], the CO2 emissions in OPC production are 0.82 kg/kg, at a cost of 60.0 USD/ton. Considering the energy consumption of grinding and calcination, the CO2 emissions of MQD production are 0.12, while the cost is 13.1 USD/ton. According to the mix proportions of MQD-cement-based CPB, as shown in Table 2, the CO2 emissions of S5~S8 are around 0.75, 0.68, 0.61 and 0.47 kg/kg, respectively. In addition, the cost per compressive strength of S5~S8 are roughly calculated to be 1.53, 1.57, 1.83 and 1.84 USD/ton/MPa; taking into account the influence of certain experimental factors, these values are 0.82 kg/kg and 2.02 USD/ton/MPa for the control sample. It can be seen that MQD-cement-based CPB displays lower CO2 emissions and costs. As such, we have developed low-cost backfill materials that perform well; we did this by replacing cement with MQD, which not only reduces cement consumption, but also reutilizes industrial waste, providing a feasible solution for environmental protection and low-carbon building materials in mining.

4. Conclusions

This study aims to recycle QD as an SCM to reduce costs and cement consumption and lower the carbon footprint in construction. We comprehensively investigated the mineral phase transformations of MQD, the hydration of QD/MQD-cement-based CPB, and their workability. Based on the experimental results, we draw the following conclusions:
(1) During calcination, QD reacts with CaO at high temperatures, forming C2S, anorthite, calcium ferrite, Fe2O3 and amorphous glass phases. Most of the quartz remains due to its high thermal stability, while residual hornblende peaks indicate incomplete decomposition; this is attributed to the strong Si-O bonds in its chain structure.
(2) QD promotes early Mc formation through CaCO3-derived CO32− release; however, it shifts to Hc dominance at 28 days due to CO32− depletion via AFt formation and carbonation. In contrast, MQD’s calcination-induced structural dissociation enables rapid Al3+ release, suppressing early Mc foration while significantly enhancing Hc and AFt formation at later stages due to reactive aluminates/ferrites. TG analyses confirm MQD-type backfill exhibits higher CBW, CH, and carbonate retention than QD-type samples; this is attributed to pozzolanic reactivity being promoted.
(3) At 20% substitution, slurry containing MQD achieves a flow spread of 161 mm and a packing density of 0.678 by balancing coarse–fine particle ratios. Even at 50% substitution, MQD-type backfill retains a 28-day strength of 19.87 MPa, which is close to that of the QD-type sample at 30% replacement. The former exhibits superior performance over the latter in both fluidity and mechanical strength due to its optimized particle gradation and enhanced chemical reactivity. This synergy positions MQD as a sustainable cement substitute with robust adaptability across substitution ranges.

Author Contributions

Conceptualization, S.Z.; Methodology, Z.S.; Investigation, Z.S.; Writing—original draft, Y.Z.; Writing—review & editing, S.Z.; Visualization, K.W.; Funding acquisition, Y.Z. All authors have read and agreed to the published version of the manuscript.

Funding

This research was funded by the Fundamental Research Program of Shanxi Province (Grant No. 202303021221176), the Key R&D Project of Lvliang City (Grant No. 2023SHFZ27) and the National Natural Science Foundation of China (Grant No. 52304148). The APC was funded by MDPI Minerals Editorial Office.

Data Availability Statement

The data are not publicly available in this study due to privacy, but can be presented are available on request from the corresponding author via E-mail.

Acknowledgments

The authors would like to thank Zhenyu Duan from Shiyanjia Lab (www.shiyanjia.com) for the XRD, FTIR, and SEM tests.

Conflicts of Interest

Author Shiyu Zhang was employed by the company Jinneng Holding Coal Industry Group Co., Ltd. The remaining authors declare that the research was conducted in the absence of any commercial or financial relationships that could be construed as a potential conflict of interest.

References

  1. Mustasem, E.-F.; Salah, S.; Chahine, W. Environmental management of quarries as waste disposal facilities. Environ. Manag. 2001, 27, 515–531. [Google Scholar] [CrossRef]
  2. Nur Fatin Amira Mohamed, Y.; Aidah, J.; Ummu Raihanah, H.; Muhd Norhasri Muhd, S.; Haris, N.A. Morphological Characteristics and Mechanical Properties of Quarry Dust Waste as Sand Replacement in Mortar. Int. J. Integr. Eng. 2024, 16, 213–221. [Google Scholar] [CrossRef]
  3. Thete Swapnil, T.; Arpitha, D.; Suman, S.; Rajasekaran, C. Suitability of Quarry Dust as a Partial Replacement of Fine Aggregate in Self Compacting Concrete. Appl. Mech. Mater. 2018, 877, 248–253. [Google Scholar] [CrossRef]
  4. Zhao, D.; Zhang, S.; Zhao, Y. Recycling arsenic-containing bio-leaching residue after thermal treatment in cemented paste backfill: Structure modification, binder properties and environmental assessment. Int. J. Miner. Metall. Mater. 2024, 31, 2136–2147. [Google Scholar] [CrossRef]
  5. Guo, Z.; Qiu, J.; Jiang, H.; Zhang, S.; Ding, H. Improving the performance of superfine-tailings cemented paste backfill with a new blended binder. Powder Technol. 2021, 394, 149–160. [Google Scholar] [CrossRef]
  6. Qiu, J.; Guo, Z.; Yang, L.; Jiang, H.; Zhao, Y. Effects of packing density and water film thickness on the fluidity behaviour of cemented paste backfill. Powder Technol. 2020, 359, 27–35. [Google Scholar] [CrossRef]
  7. Aamar, D.; Togay, O.; Mohammad Ali, M.; Muhammad Usama, S.; Muhammed, B.; Jung Heum, Y.; Komael, J. Sustainability benefits and commercialization challenges and strategies of geopolymer concrete: A review. J. Build. Eng. 2022, 58, 105005. [Google Scholar] [CrossRef]
  8. Magdalena, D.; Bagcal, O.; Ahmet, B.; Dimitrios, G.G.; Köksal, F.; Błażej, P.; Hüsamettin, Ü. Utilization of rock dust as cement replacement in cement composites: An alternative approach to sustainable mortar and concrete productions. J. Build. Eng. 2023, 69, 106180. [Google Scholar] [CrossRef]
  9. Burak, F. Utilisation of high volumes of limestone quarry wastes in concrete industry (self-compacting concrete case). Resour. Conserv. Recycl. 2007, 51, 770–791. [Google Scholar] [CrossRef]
  10. Job, T.; Harilal, B. Properties of cold bonded quarry dust coarse aggregates and its use in concrete. Cem. Concr. Compos. 2015, 62, 67–75. [Google Scholar] [CrossRef]
  11. Diogo, S.; Filipe, G.; Jorge de, B. Mechanical Properties of Structural Concrete Containing Fine Aggregates from Waste Generated by the Marble Quarrying Industry. J. Mater. Civ. Eng. 2014, 26, 04014008. [Google Scholar] [CrossRef]
  12. Naganathan, S.; Abdul Razak, H.; Abdul Hamid Siti, N. Effect of quarry dust addition on the performance of controlled low-strength material made from industrial waste incineration bottom ash. Int. J. Miner. Metall. Mater. 2012, 19, 536–541. [Google Scholar] [CrossRef]
  13. Martins, P. Structural and Geo-Environmental Applications of Waste Quarry Dust. Ph.D. Thesis, Cardiff University, Cardiff, UK, 2014. [Google Scholar]
  14. Kenneth Miebaka, O.; Tamunoemi Alu, L.; Kaniyeh Anthony, I. Suitability of Saw Dust Ash and Quarry Dust as Mineral fillers in Asphalt Concrete. Int. J. Eng. Manag. Res. 2022, 12, 24–29. [Google Scholar] [CrossRef]
  15. Yong-Heng, L.; Shenxu, B.; Shuo, L.; Yimin, Z.; Shefeng, L.; Yang, P. Enhancing reactivity of granite waste powder toward geopolymer preparation by mechanical activation. Constr. Build. Mater. 2024, 414, 134981. [Google Scholar] [CrossRef]
  16. Rana Muhammad, W.; Mohammed, K.A.; Eyad, A.; Faheem, B.; Faisal, S. Experimental investigation of quarry rock dust incorporated fly ash and slag based fiber reinforced geopolymer concrete circular columns. Dent. Sci. Rep. 2024, 14, 20953. [Google Scholar] [CrossRef]
  17. Zhang, S.; Ren, F.; Zhao, Y.; Qiu, J.; Guo, Z. The effect of stone waste on the properties of cemented paste backfill using alkali-activated slag as binder. Constr. Build. Mater. 2021, 283, 122686. [Google Scholar] [CrossRef]
  18. Zhang, S.; Zhang, X.; Bai, H.; Wang, K. Resource utilization of stone waste and loess to prepare grouting materials. J. Environ. Manag. 2024, 354, 120452. [Google Scholar] [CrossRef]
  19. Yingliang, Z.; Jingping, Q.; Hui, L.; Zhengyu, M. Utilization of quarry dust for low carbon cementitious materials and the immobilization capacity for mine tailings. Constr. Build. Mater. 2020, 262, 120091. [Google Scholar] [CrossRef]
  20. Jiansong, Z.; Yuzhu, Z.; Yue, L.; Chen, T.; Du, P.; Qianqian, R. Characterization of Physical and Chemical Properties of Multi-Source Metallurgical Dust and Analysis of Resource Utilization Pathways. Superalloys 2024, 14, 1378. [Google Scholar] [CrossRef]
  21. Daniel, F.-G.; Íñigo, R.-B.; Javier, M.; González-Gasca, C.; Verdeja, L.F. Iron Ore Sintering: Process. Miner. Process. Extr. Metall. Rev. 2017, 38, 215–227. [Google Scholar] [CrossRef]
  22. C39/C39M-18; Standard Test Method for Compressive Strength of Cylindrical Concrete Specimens. ASTM International: West Conshohocken, PA, USA, 2018.
  23. Omer, D.H.; Mohammad, Y.O.; Yara, I.O. Metamorphic Evolution of the Garnet Amphibolite Schist from Mawat Ophiolite, Kurdistan Region, Northeast Iraq: Geochemistry, Mineral Chemistry and Thermodynamic Approach. Iraqi Geol. J. 2023, 56, 127–148. [Google Scholar] [CrossRef]
  24. Vázquez, F.; Torres, L.M.; Garza, L.L.; Martínez, A.; López, W. A Mexican kaolin deposit: XANES characterization, mineralogical phase analysis and applications. Mater. Constr. 2009, 59, 113–121. [Google Scholar] [CrossRef]
  25. Abel da Silveira, R.; Evaristo, L.; Soria Pereira, A.; Buchner, S. Pressure-induced transformations in a glass: In situ X-Ray diffraction and Raman spectroscopy. Ceram. Int. 2024, 50, 15642–15648. [Google Scholar] [CrossRef]
  26. Chen, Y.; Kanan, M. Thermal Ca2+/Mg2+ Exchange Reactions to Transform Abundant Silicates Into Alkaline Materials for Carbon Dioxide Removal. ChemRxiv 2024. [Google Scholar] [CrossRef]
  27. Khodorevskaya, L.I.; Varlamov, D.A.; Safonov, O.G. Experimental Investigation of the Interaction of Amphibole with Highly Salted H2O-NaCl-KCl Fluid at 750°C, 700 MPa: Application to Alkaline Metasomatism of Amphibole Rocks. Петрoлoгия 2023, 31, 388–407. [Google Scholar] [CrossRef]
  28. Li, Y. Bulk metallic glasses Eutectic coupled zone and amorphous formation. JOM 2005, 57, 60–63. [Google Scholar] [CrossRef]
  29. Scaltsoyiannes, A.; Lemonidou, A. CaCO3 decomposition for calcium-looping applications: Kinetic modeling in a fixed-bed reactor. Chem. Eng. Sci. X 2020, 8, 100071. [Google Scholar] [CrossRef]
  30. Ventura, G.D.; Robert, J.L.; Hawthorne, F.C.; Prost, R. Short-range disorder of Si and Ti in the tetrahedral double chain unit of synthetic Ti-bearing potassium-richterite. Am. Mineral. 1996, 81, 56–60. [Google Scholar] [CrossRef]
  31. Li, Y.; Huang, F.; Gao, W.; Zhu, Q.; Shen, C.; Li, M.; Sun, X.; Wang, X. Raman spectroscopy and XPS study of the thermal decomposition of Mg-hornblende into augite. J. Raman Spectrosc. 2022, 53, 820–831. [Google Scholar] [CrossRef]
  32. Du, M.; Xiao, Y.; Liu, X.; Ma, Y.; Han, Y.; Li, Z.; Wei, T.; Zou, Y.; Li, Y.; Gao, D.; et al. Effects of calcination treatments on phases and properties of (La0.2Nd0.2Sm0.2Eu0.2Gd0.2)2Zr2O7/YSZ mixture, and of pressure on photoluminescence emission of calcined mixture. Ceram. Int. 2024, 50, 14980–14986. [Google Scholar] [CrossRef]
  33. Kloprogge, J.T.; Frost, R.L. Thermal decomposition of Ferrian chamosite an infrared emission spectroscopic study. Contrib. Mineral. Petrol. 2000, 138, 59–67. [Google Scholar] [CrossRef]
  34. Liu, S.-y.; Xue, W.-h.; Wang, L.-j.; Chou, K.-c. Synthesis of mullite by high temperature reaction to realize nontoxic and efficient recycling of vanadium slag chlorination residue. Trans. Nonferrous Met. Soc. China 2023, 33, 2523–2534. [Google Scholar] [CrossRef]
  35. Martinez, J.; Wardini, J.L.; Zheng, X.; Moghimi, L.; Rakowsky, J.; Means, J.; Guo, H.; Kuzmenko, I.; Ilavsky, J.; Zhang, F.; et al. Precision Calcination Mechanism of CaCO3 to High-Porosity Nanoscale CaO CO2 Sorbent Revealed by Direct In Situ Observations. Adv. Mater. Interfaces 2024, 11, 2300811. [Google Scholar] [CrossRef]
  36. Golub, N.P.; Golub, E.O.; Kozma, A.A.; Kuznietsova, A.O.; Hurch, A.V. Infrared Spectroscopic Analysis of Complex Oxide Catalyst 50%Cu3(PO4)2•50%Ni3(PO4)2. Sci. Bull. Uzhhorod Univ. Ser. Chem. 2023, 48, 95–99. [Google Scholar] [CrossRef]
  37. Isaienko, O.; Borguet, E. Hydrophobicity of Hydroxylated Amorphous Fused Silica Surfaces. Langmuir 2013, 29, 7885–7895. [Google Scholar] [CrossRef]
  38. Iezzi, G. Low-T neutron powder-diffraction and synchrotron-radiation IR study of synthetic amphibole Na(NaMg)Mg5Si8O22(OH)2. Am. Mineral. 2005, 90, 695–700. [Google Scholar] [CrossRef]
  39. Lin, P.-J.; Yeh, C.-H.; Jiang, J.-C. Theoretical insight into hydroxyl production via H2O2 decomposition over the Fe3O4(311) surface. RSC Adv. 2021, 11, 36257–36264. [Google Scholar] [CrossRef]
  40. Shan, T.; Sun, L.; Liu, C.; Fang, J.; Li, Z.; Wen, Y.; Wang, B.; Guo, S.; Zhang, J. Microstructure and mechanical properties of SiC joint using anorthite based glass-ceramic and first principles calculation of joint interface. Ceram. Int. 2023, 49, 40149–40157. [Google Scholar] [CrossRef]
  41. Balassa, C.; Kristály, F.; Németh, N. Mineral Composition of Rare Element Enriched Rock Bodies from the Bükk Mts., NE Hungary. Geosci. Eng. 2022, 10, 22–36. [Google Scholar] [CrossRef]
  42. Chukanov, N.V.; Krzhizhanovskaya, M.G.; Pekov, I.V.; Varlamov, D.A.; Van, K.V.; Ermolaeva, V.N.; Vozchikova, S.A. Extremely Al-Depleted Chlorites from Dolomite Carbonatites of the Kovdor Ultramafic-Alkaline Complex, Kola Peninsula, Russia. Clays Clay Miner. 2024, 68, 81–88. [Google Scholar] [CrossRef]
  43. Brigatti, M.F.; Affronte, M.; Elmi, C.; Malferrari, D.; Laurora, A. Trioctahedral Fe-rich micas: Relationships between magnetic behavior and crystal chemistry. Am. Mineral. 2015, 100, 2231–2241. [Google Scholar] [CrossRef]
  44. Duncanson, S.; Brengman, L.; Johnson, J.; Eyster, A.; Fournelle, J.; Moy, A. Reconstructing diagenetic mineral reactions from silicified horizons of the Paleoproterozoic Biwabik Iron Formation, Minnesota. Am. Mineral. 2023, 109, 339–358. [Google Scholar] [CrossRef]
  45. Swansbury, L.A.; Mountjoy, G. Homogeneity of modifier ion distributions and the mixed alkaline earth effect in MgO–CaO–SiO2 silicate glasses using molecular dynamics. Phys. Chem. Glas. Eur. J. Glass Sci. Technol. Part B 2017, 58, 165–170. [Google Scholar] [CrossRef]
  46. Fourmont, J.; Blanc, W.; Guichaoua, D.; Chaussedent, S. Phase-separated Ca and Mg-based nanoparticles in SiO2 glass investigated by molecular dynamics simulations. Sci. Rep. 2022, 12, 11959. [Google Scholar] [CrossRef] [PubMed]
  47. Du, Y.; Wei, X.; Guo, X.M. Competitive Formation Behavior of Calcium Silicate and Calcium Ferrite in Sintering of Iron Ore Fines. Steel Res. Int. 2024, 95, 2400086. [Google Scholar] [CrossRef]
  48. De Keyser, W.L. La Synthèse Thermique des Silicates de Calcium. Bull. Des Sociétés Chim. Belg. 2010, 62, 235–252. [Google Scholar] [CrossRef]
  49. Giammaria, G.; Lefferts, L. Catalytic effect of water on calcium carbonate decomposition. J. CO2 Util. 2019, 33, 341–356. [Google Scholar] [CrossRef]
  50. Matschei, T.; Lothenbach, B.; Glasser, F.P. The AFm phase in Portland cement. Cem. Concr. Res. 2007, 37, 118–130. [Google Scholar] [CrossRef]
  51. de Souza Oliveira, A.; Dweck, J.; de Moraes Rego Fairbairn, E.; da Fonseca Martins Gomes, O.; Toledo Filho, R.D. Crystalline admixture effects on crystal formation phenomena during cement pastes’ hydration. J. Therm. Anal. Calorim. 2019, 139, 3361–3375. [Google Scholar] [CrossRef]
  52. Salzmann, M.F.; Kahlenberg, V.; Krüger, B.; Krüger, H.; Grabowski, J. Ca2.68Fe10.32Si1.00O20—A strongly disordered SFCA-related phase in the system CaO-Fe2O3-SiO2. Mineral. Petrol. 2024, 118, 485–499. [Google Scholar] [CrossRef]
  53. Marinos, D.; Kotsanis, D.; Alexandri, A.; Balomenos, E.; Panias, D. Carbonation of Sodium Aluminate/Sodium Carbonate Solutions for Precipitation of Alumina Hydrates—Avoiding Dawsonite Formation. Crystals 2021, 11, 836. [Google Scholar] [CrossRef]
  54. Mehdizadeh, H.; Jia, X.; Mo, K.H.; Ling, T.C. Effect of water-to-cement ratio induced hydration on the accelerated carbonation of cement pastes. Environ. Pollut. 2021, 280, 116914. [Google Scholar] [CrossRef] [PubMed]
  55. De Weerdt, K.; Haha, M.B.; Le Saout, G.; Kjellsen, K.O.; Justnes, H.; Lothenbach, B. Hydration mechanisms of ternary Portland cements containing limestone powder and fly ash. Cem. Concr. Res. 2011, 41, 279–291. [Google Scholar] [CrossRef]
  56. Okada, Y.; Ishida, H.; Sasaki, K.; Young, J.F.; Mitsuda, T. Characterization of C-S-H from Highly Reactive β-Dicalcium Silicate Prepared from Hillebrandite. J. Am. Ceram. Soc. 2005, 77, 1313–1318. [Google Scholar] [CrossRef]
  57. Hao, H.; Wang, Y.; Jin, Z.; Wang, X. Interfacial reaction of alumina with Ag-Cu-Ti. J. Mater. Sci. 1995, 30, 1233–1239. [Google Scholar] [CrossRef]
  58. Ambarita, M.; Pusparizkita, Y.M.; Schmahl, W.W.; Lamura, M.D.P.; Jamari, J.; Bayuseno, A.P. The effect of carbon dioxide absorption using buton asphalt residue through carbonation on calcium carbonate precipitated efficiency. IOP Conf. Ser. Earth Environ. Sci. 2023, 1268, 012037. [Google Scholar] [CrossRef]
  59. Wong, H.H.; Kwan, A.K. Packing density of cementitious materials: Part 1—Measurement using a wet packing method. Mater. Struct. 2008, 41, 689–701. [Google Scholar] [CrossRef]
  60. Yang, Y.-J.; Corti, D.S.; Franses, E.I. Use of Close-Packed Vesicular Dispersions to Stabilize Colloidal Particle Dispersions against Sedimentation. Langmuir 2015, 31, 8802–8808. [Google Scholar] [CrossRef]
  61. Ghasemi, Y.; Emborg, M.; Cwirzen, A. Effect of water film thickness on the flow in conventional mortars and concrete. Mater. Struct. 2019, 52, 62. [Google Scholar] [CrossRef]
  62. Ye, H.; Gao, X.; Wang, R.; Wang, H. Relationship among particle characteristic, water film thickness and flowability of fresh paste containing different mineral admixtures. Constr. Build. Mater. 2017, 153, 193–201. [Google Scholar] [CrossRef]
  63. Wang, C.; Ren, Z.; Huo, Z.; Zheng, Y.; Tian, X.; Zhang, K.; Zhao, G. Properties and hydration characteristics of mine cemented paste backfill material containing secondary smelting water-granulated nickel slag. Alex. Eng. J. 2021, 60, 4961–4971. [Google Scholar] [CrossRef]
  64. Lu, Q.; Zhang, S.; Sun, G.; Wang, X.; Fu, S. Preparation of Paste Backfill Material from Mix-Calcined Sludge Ash. Waste Biomass Valoriz. 2020, 12, 1633–1646. [Google Scholar] [CrossRef]
  65. Zhu, Z.; Gu, X.; Wang, S.; Xu, X.; Wang, H.; Liu, J.; Zhan, K. Investigation of synergistic effects of lithium slag and granulated blast furnace slag from the perspectives of physics and hydration. J. Build. Eng. 2024, 89, 109337. [Google Scholar] [CrossRef]
  66. Long, G.; Gao, Y.; Xie, Y. Designing more sustainable and greener self-compacting concrete. Constr. Build. Mater. 2015, 84, 301–306. [Google Scholar] [CrossRef]
  67. Turner, L.K.; Collins, F.G. Carbon dioxide equivalent (CO2-e) emissions: A comparison between geopolymer and OPC cement concrete. Constr. Build. Mater. 2013, 43, 125–130. [Google Scholar] [CrossRef]
  68. Ren, C.; Wang, W.; Yao, Y.; Wu, S.; Qamar; Yao, X. Complementary use of industrial solid wastes to produce green materials and their role in CO2 reduction. J. Clean. Prod. 2020, 252, 119840. [Google Scholar] [CrossRef]
  69. Zhao, Y.; Qiu, J.; Xing, J.; Sun, X. Chemical activation of binary slag cement with low carbon footprint. J. Clean. Prod. 2020, 267, 121455. [Google Scholar] [CrossRef]
Figure 1. QD and MQD XRD patterns: (a) QD, (b) MQD.
Minerals 15 00817 g001
Figure 2. The infrared spectrum of QD and MQD: Wavenumber (a) of 400~800 cm−1, (b) 800~1800 cm−1 and (c) 3000~4000 cm−1.
Minerals 15 00817 g002
Figure 3. QD and MQD mapping and SEM observations.
Minerals 15 00817 g003
Figure 4. XRD patterns of CPB containing (a) QD at 3-day hydration, (b) MQD at 3-day hydration, (c) QD at 28-day hydration, and (d) MQD at 28-day hydration.
Minerals 15 00817 g004aMinerals 15 00817 g004b
Figure 5. DTG curves of CPB containing (a) QD and (b) MQD at 28−day hydration.
Minerals 15 00817 g005
Figure 6. Semi-quantitative calculation of hydration products in CPB containing (a) QD and (b) MQD at 28-day hydration.
Minerals 15 00817 g006
Figure 7. (a) Flow spread of samples; (b) particle size of OPC, QD and MQD; (c) packing density of both QD- and MQD-containing systems.
Minerals 15 00817 g007
Figure 8. Compressive strength of CPB: (a) S1~S4 and (b) S5~S8.
Minerals 15 00817 g008
Figure 9. SEM observation of CPB: S1~S8 (CSH: calcium silicate hydrate; AFt: ettringite; CH: Porlandite; C: calcite).
Minerals 15 00817 g009
Table 1. Chemical compositions of QD and OPC (%).
OxidesSiO2Fe2O3Al2O3MgOCaONa2OK2OTiO2P2O5SO3LOI
QD48.4619.7512.207.056.552.471.390.910.610.274.53
OPC20.853.685.283.0861.540.210.68--1.53-
Table 2. The mix proportions of cemented paste backfill (CPB) samples (%).
SampleOPCQDMQDSolid Concentration
S19010-75
S28020-75
S37030-75
S45050-75
S590-1075
S680-2075
S770-3075
S850-5075
Disclaimer/Publisher’s Note: The statements, opinions and data contained in all publications are solely those of the individual author(s) and contributor(s) and not of MDPI and/or the editor(s). MDPI and/or the editor(s) disclaim responsibility for any injury to people or property resulting from any ideas, methods, instructions or products referred to in the content.

