Article

Differential Evolutionary Mechanisms of Tight Sandstone Reservoirs and Their Influence on Reservoir Quality: A Case Study of Carboniferous–Permian Sandstones in the Shenfu Area, Ordos Basin, China

1
School of Earth Science, East China University of Technology, Nanchang 330013, China
2
Development and Research Center, China Geological Survey, Beijing 100037, China
3
Basic Geological Survey Institute, Geological Survey and Exploration of Jiangxi Province, Nanchang 330030, China
4
China United Coalbed Methane Corporation Limited, Beijing 100015, China
*
Authors to whom correspondence should be addressed.
Minerals 2025, 15(7), 744; https://doi.org/10.3390/min15070744
Submission received: 15 June 2025 / Revised: 12 July 2025 / Accepted: 13 July 2025 / Published: 16 July 2025
(This article belongs to the Section Mineral Exploration Methods and Applications)

Abstract

The Carboniferous–Permian tight sandstone gas reservoirs in the Shenfu area of the Ordos Basin in China are characterized by the widespread development of multiple formations. However, significant differences exist among the tight sandstones of different formations, and their formation mechanisms and key controlling factors remain unclear, hindering the effective selection and development of favorable tight gas intervals in the study area. Through comprehensive analysis of casting thin section (CTS), scanning electron microscopy (SEM), cathodoluminescence (CL), X-ray diffraction (XRD), particle size and sorting, porosity and permeability data from Upper Paleozoic tight sandstone samples, combined with insights into depositional environments, burial history, and chemical reaction processes, this study clarifies the characteristics of tight sandstone reservoirs, reveals the key controlling factors of reservoir quality, confirms the differential evolutionary mechanisms of tight sandstone of different formations, reconstructs the diagenetic sequence, and constructs an evolution model of reservoir minerals and porosity. The research results indicate depositional processes laid the foundation for the original reservoir properties. Sandstones deposited in tidal flat and deltaic environments exhibit superior initial reservoir qualities. Compaction is a critical factor leading to the decline in reservoir quality across all formations. However, rigid particles such as quartz can partially mitigate the pore reduction caused by compaction. Early diagenetic carbonate cementation reduces reservoir quality by occupying primary pores and hindering the generation of secondary porosity induced by acidic fluids, while later-formed carbonate further densifies the sandstone by filling secondary intragranular pores. Clay mineral cements diminish reservoir porosity and permeability by filling intergranular and intragranular pores. The Shanxi and Taiyuan Formations display relatively poorer reservoir quality due to intense illitization. Overall, the reservoir quality of Benxi Formation is the best, followed by Xiashihezi Formation, with the Taiyuan and Shanxi Formations exhibiting comparatively lower qualities.

1. Introduction

The Ordos Basin, as the largest tight gas producing area of China, holds approximately 14.5 × 10¹² m3 of tight gas resources. Due to the widespread distribution of coal-bearing source rocks in the Upper Paleozoic, several billion-cubic-meter-scale tight gas fields such as Sulige, Daniudi, and Shenmu have been discovered, with cumulative proven geological reserves exceeding 3.8 × 10¹² m3, demonstrating the rich tight gas resources of the basin [1]. Specifically, the Shenmu Gas Field has been reported significant proven reserves in the Upper Paleozoic Permian Taiyuan Formation, Shanxi Formation, the He 8 of the Xiashihezi Formation, and other primary gas-producing intervals [2]. In recent years, with the continuous improvement of exploration efforts, the Upper Carboniferous Benxi Formation tight sandstone gas has gradually attracted attention. Therefore, the tight gas reservoirs in the Shenfu area exhibit a multi-layered stacked characteristic.
Tight gas wells show significant differences in gas production characteristics. Even within the same well location, the gas production efficiency of different stratigraphic intervals varies significantly, indicating strong heterogeneity in the tight sandstone reservoirs, with distinctly different reservoir qualities in each formation [3,4,5]. Previous research suggests that the different depositional environments of the Upper Paleozoic tight sandstone reservoirs directly determine the inherent characteristics of the tight sandstone reservoirs, particularly the composition and structural features of the tight sandstones [6,7]. Different stratigraphic intervals of tight sandstone have experienced different burial histories, which implies different diagenetic processes, ultimately leading to variations in reservoir quality [8]. However, previous studies have largely focused on detailed petrological, petrophysical, and diagenetic evolution models for single reservoir layers [9,10,11]. There is a lack of systematic comparative studies between different stratigraphic intervals, which has resulted in unclear differential evolutionary mechanisms of tight sandstones in different formations, severely restricting the “sweet spot” prediction and efficient development of tight gas reservoirs.
Therefore, this paper focuses on the Upper Paleozoic Benxi Formation, Taiyuan Formation, Shanxi Formation, and Xiashihezi Formation tight sandstone reservoirs in the Shenfu area of the Ordos Basin. Through observations of casting thin sections, scanning electron microscopy, and cathodoluminescence on tight sandstone samples, coupled with tests of their grain size, sorting, and petrophysical properties, as well as analyses of depositional environments, burial history, and chemical reaction kinetics, this study aims to clarify the development characteristics of tight sandstones in different formations, reveal the differential evolutionary mechanisms of the reservoirs, and explore the formation mechanisms of high-quality reservoirs, in order to provide a theoretical basis for efficient exploration and development of tight sandstone gas in the Shenfu area.

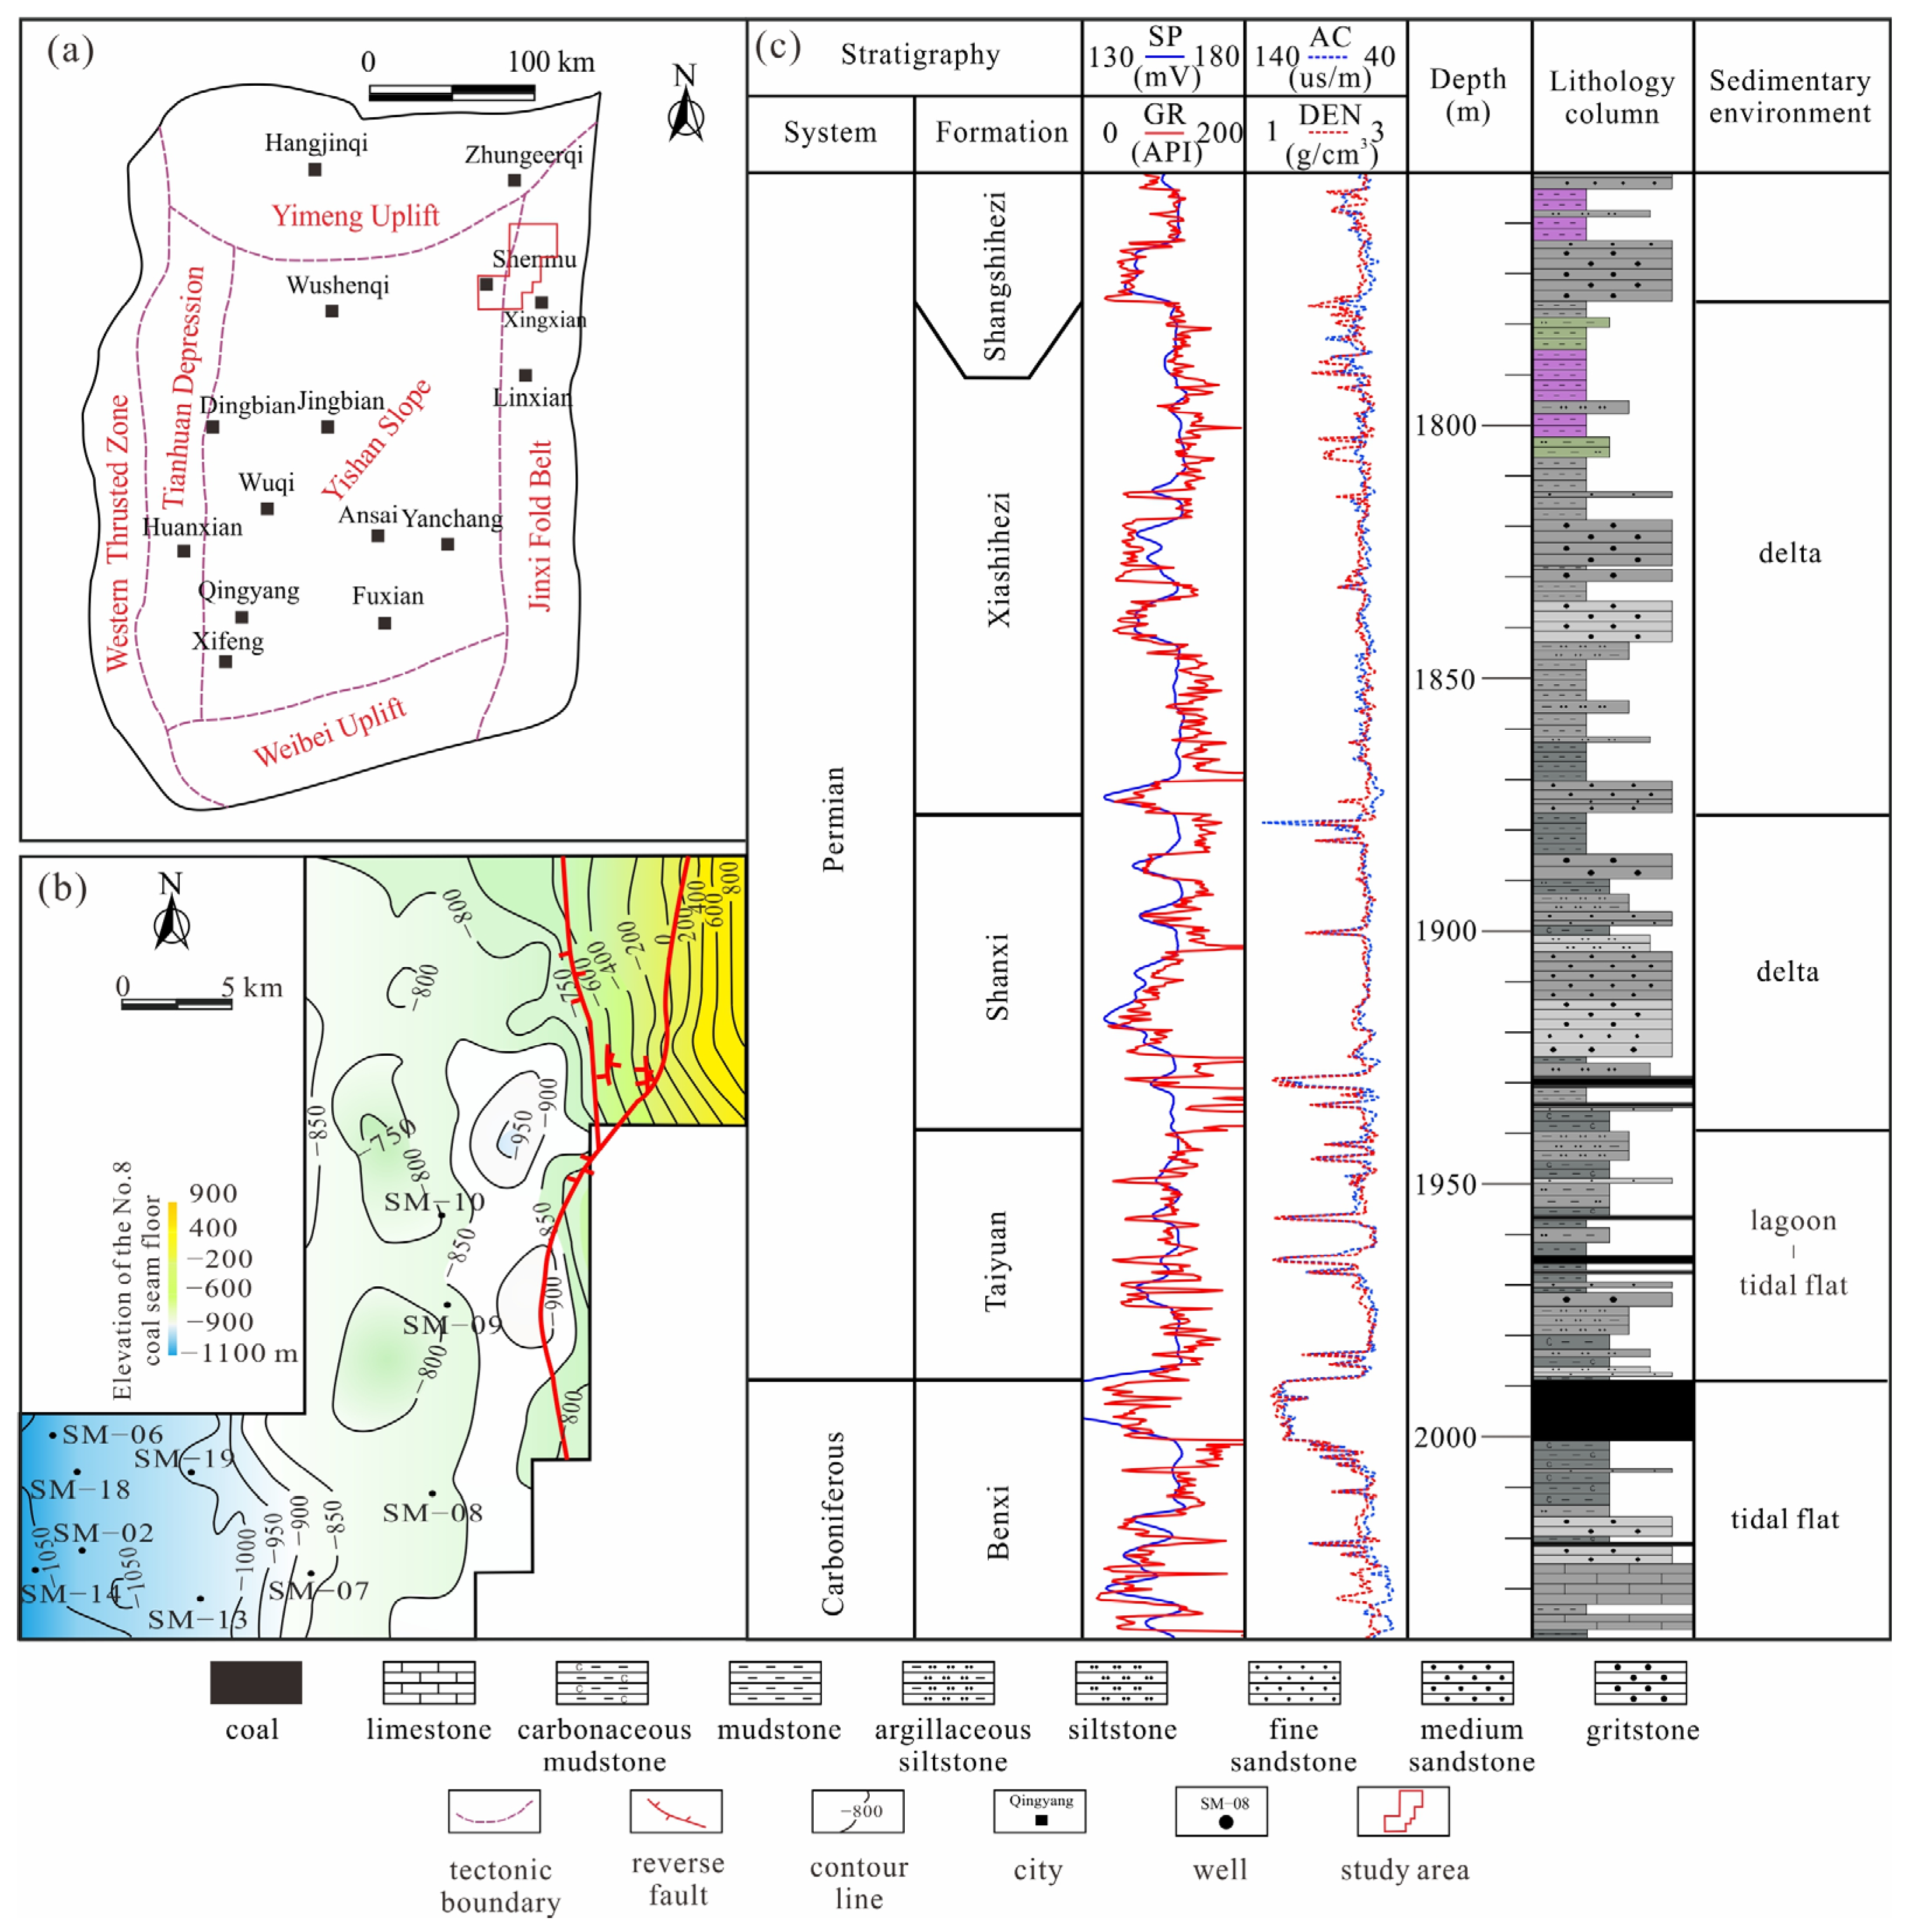
2. Geological Setting

The Ordos Basin, as the second-largest sedimentary basin of China with a total area of approximately 25 × 104 m2, is rich in resources such as uranium, coal, oil, natural gas, and so on [12]. This basin is a large, multi-cycle cratonic basin that has undergone five major sedimentary evolution stages above the Archean-Early Proterozoic basement: Middle-Late Proterozoic aulacogen, Early Paleozoic shallow-sea platform, Late Paleozoic nearshore plain, Mesozoic inland lacustrine basin, and Cenozoic peripheral fault depression [13]. According to current tectonic development characteristics, it can be divided into six tectonic units: the Yimeng Uplift, Weibei Uplift, Jinxi Fold Belt, Yishan Slope, Tianhuan Depression, and Western Thrusted Zone (Figure 1a). The overall structural characteristics of the basin is well-developed peripheral structures, with the interior being a west-dipping large monocline with strata dips less than 1° [14].
In the Early Paleozoic, the Ordos Basin belonged to the western region of the North China Platform, mainly depositing a set of carbonate rocks in an epeiric sea environment. Subsequently, influenced by the Caledonian tectonic movement, the basin uplifted at the end of the Early Ordovician, resulting in a long period of sedimentary hiatus and the formation of an Ordovician weathering crust [15,16]. Since the Late Carboniferous, the basin subsided again, with the North China Sea and the Qilian Sea entering from the east and west sides, resulting in a thick sedimentary cover. Among them, delta, barrier coast, and shelf depositional systems developed in different areas of the basin during the Late Carboniferous–Early Permian, while inland lake–delta depositional systems developed during the Middle Permian–Late Permian [17,18,19].
The main tectonic location of the study area is the Jinxi Fold Belt, and the entire area is a west-dipping monocline structure (Figure 1b). During the Late Carboniferous–Early Permian Benxi and Taiyuan formations deposit periods, barrier coast depositional systems developed in the study area. During the Early-Middle Permian Shanxi and Xiashihezi Formations, it evolved into delta facies deposition [20,21,22]. The Benxi Formation, Taiyuan Formation, and Shanxi Formation are the coal-bearing strata in the study area, with coal-measure carbonaceous mudstones and coal seams serving as significant hydrocarbon source rocks. Notably, the No. 8/8 + 9 coal seam in the Benxi Formation represents the thickest coal seam in the region, developed at the top of the formation, while coal-measure sandstones constitute important reservoir rocks (Figure 1c).

3. Samples and Methods

The research samples were collected from 17 wells within the study area, ranging in depth from 1300~2300 m. With the help of the China United Coalbed Methane Corporation Limited, the experimental data of CTS, CL, SEM, XRD, structure, porosity, permeability, and carbonate content of tight sandstones were collected.
A total of 206 core sample thin sections were observed to obtain the composition and structural information of tight sandstone. Some samples were stained with blue epoxy resin and alizarin red S enhancing the identification of carbonates and pores under the microscope. In addition, CL analysis of some samples, based on the physical principle that minerals emit fluorescence when excited by an electron beam, could further clarify the type and evolution process of minerals. It was carried out after thin section identification.
A total of 179 samples were gold-coated and then observed using a SEM under controlled conditions (25 °C, 50% humidity). The characteristics of mineral shape, occurrence state, combination relationship, and pore systems were analyzed.
XRD analysis was employed to quantify clay mineral relative content in the sandstone. Powdered samples with grain size less than 5 mm were dispersed in distilled water using ultrasound, and then the fraction with grain size less than 2 μm was isolated and dried. Finally, 182 dried samples were used for clay mineral content analysis.
In the determination of sandstone carbonate, the samples were degreased, crushed and dried, and then reacted with 10% dilute hydrochloric acid. The experiment was carried out referring to the similar method of Gao et al. [10].
Sandstone grain size and sorting of 210 samples were analyzed after samples were crushed into small pieces using an iron mortar and oil was removed by solvent extraction.
Porosity and permeability of 899 cylindrical core plugs (25 mm in diameter and 50 mm in length) were measured with helium by automated permeameter-porosimeter.

4. Results

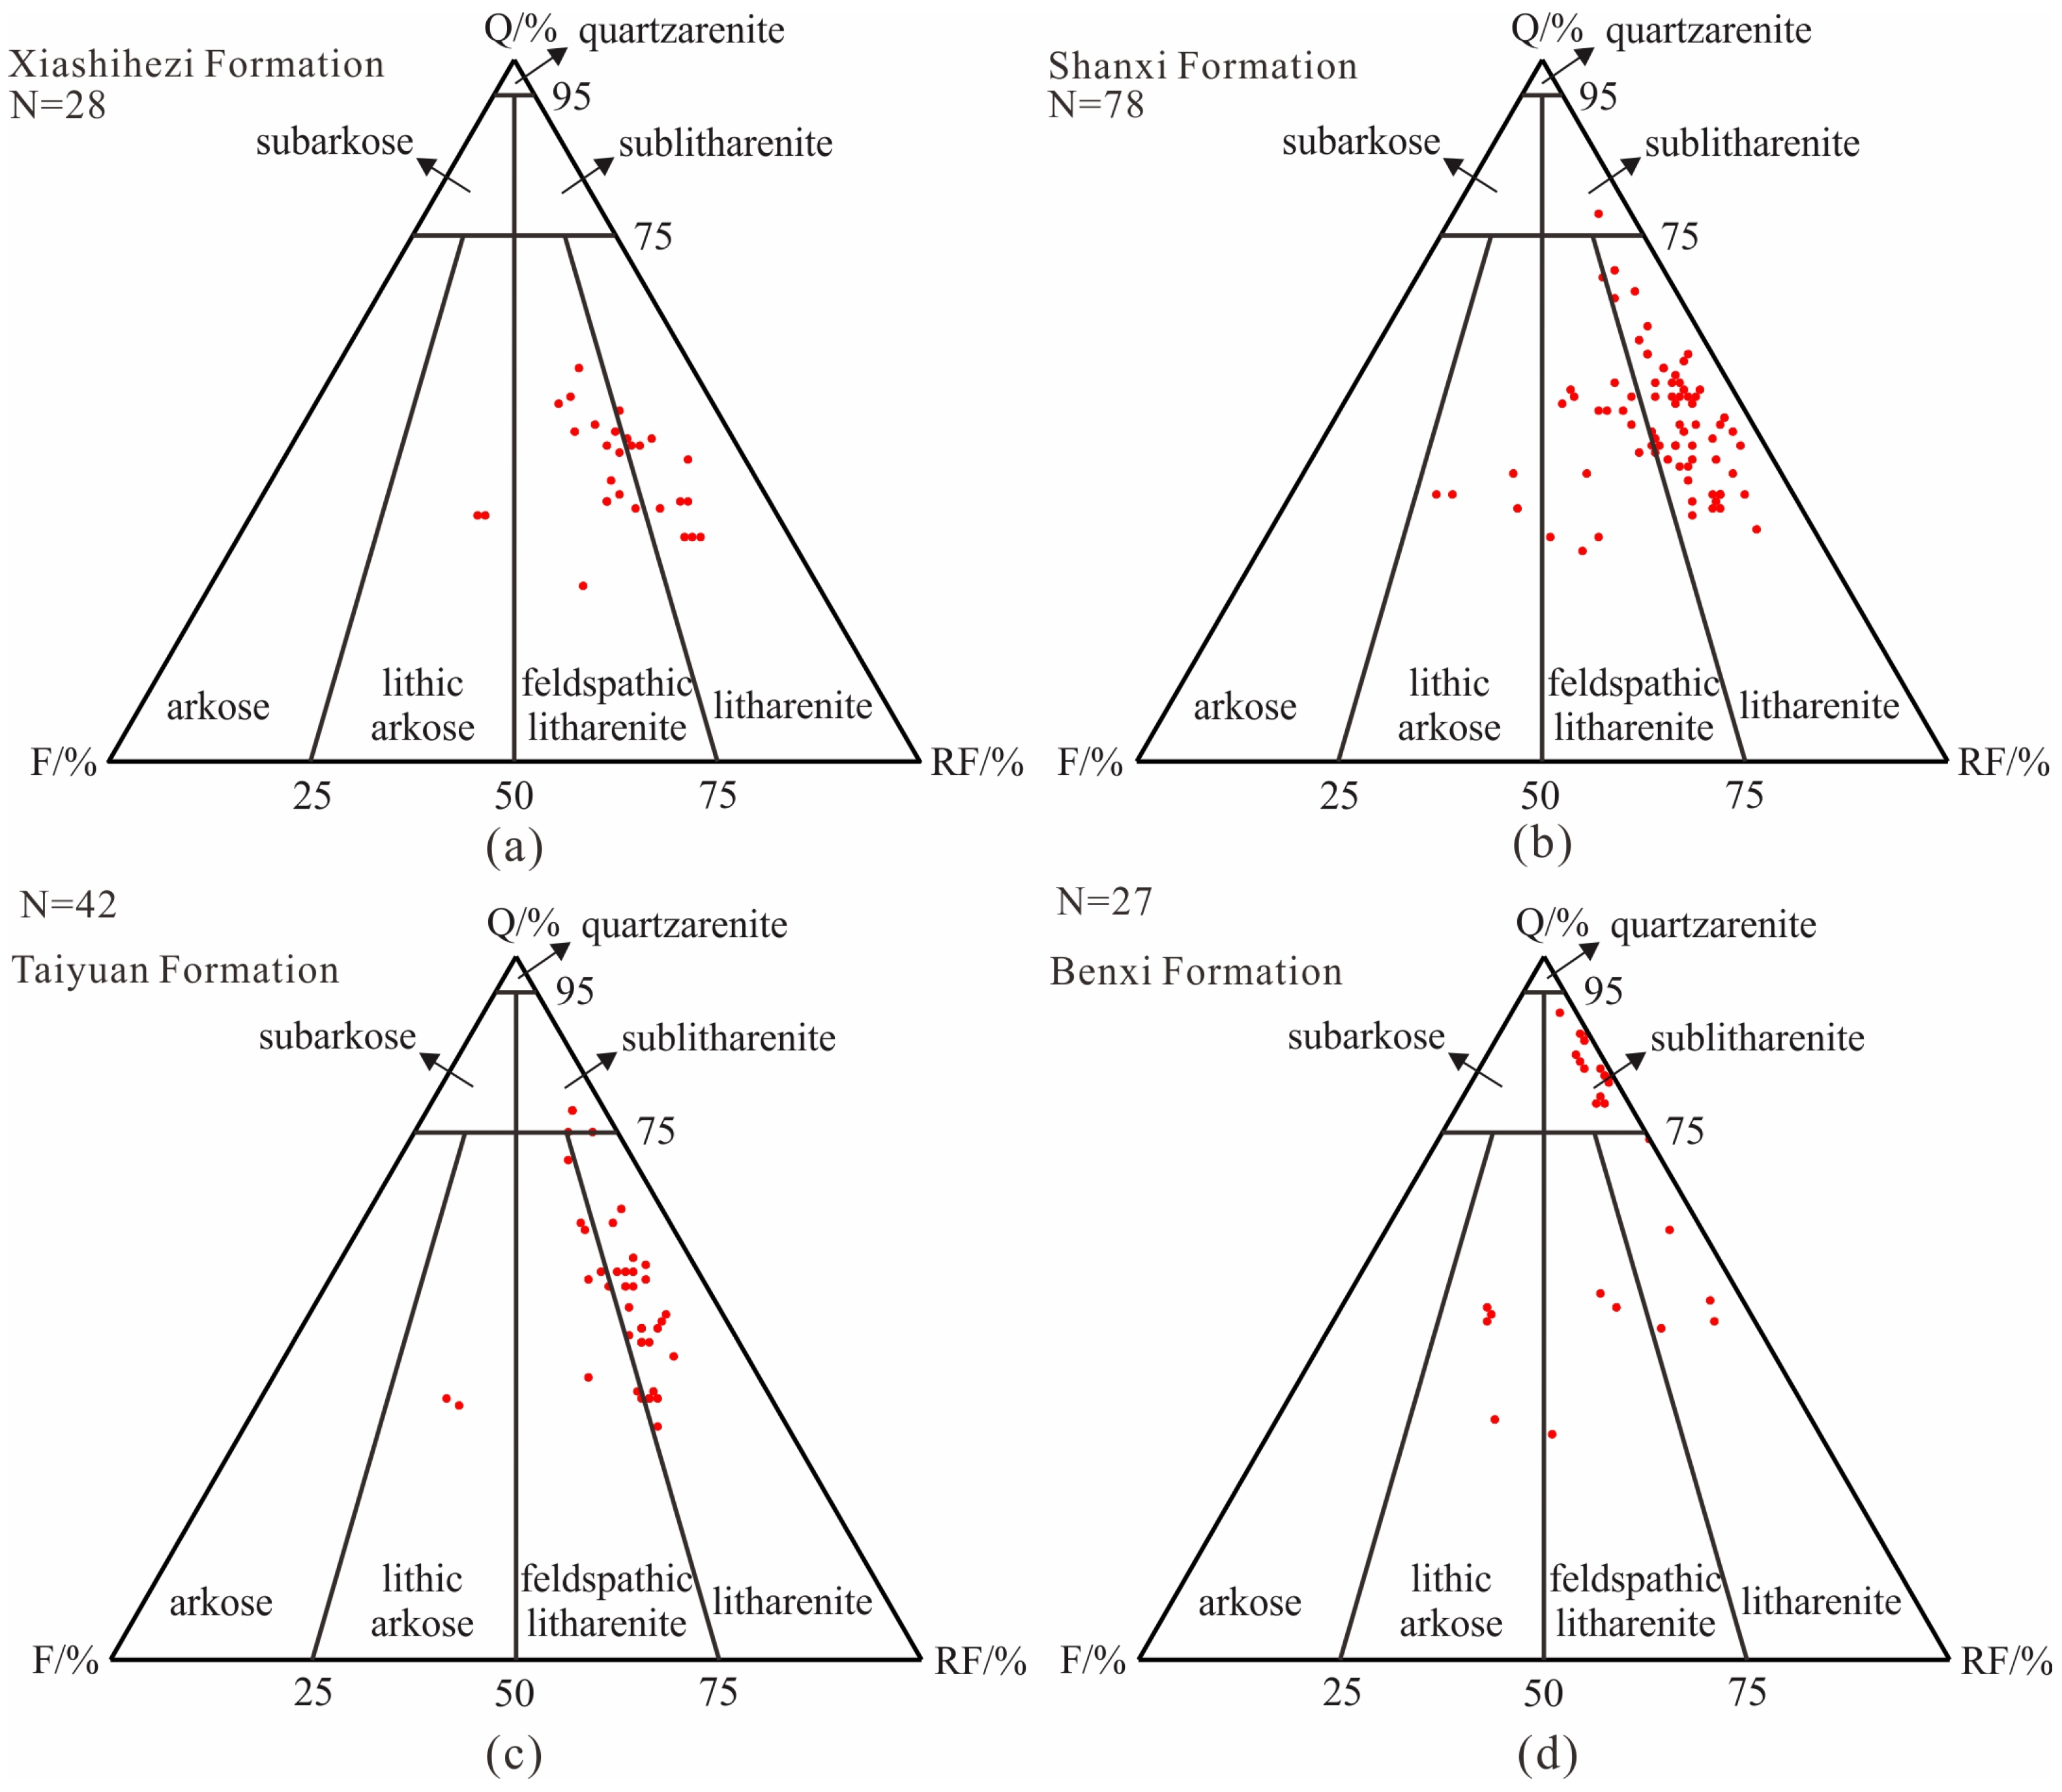
4.1. Composition of Sandstone

4.1.1. Compositions of Framework
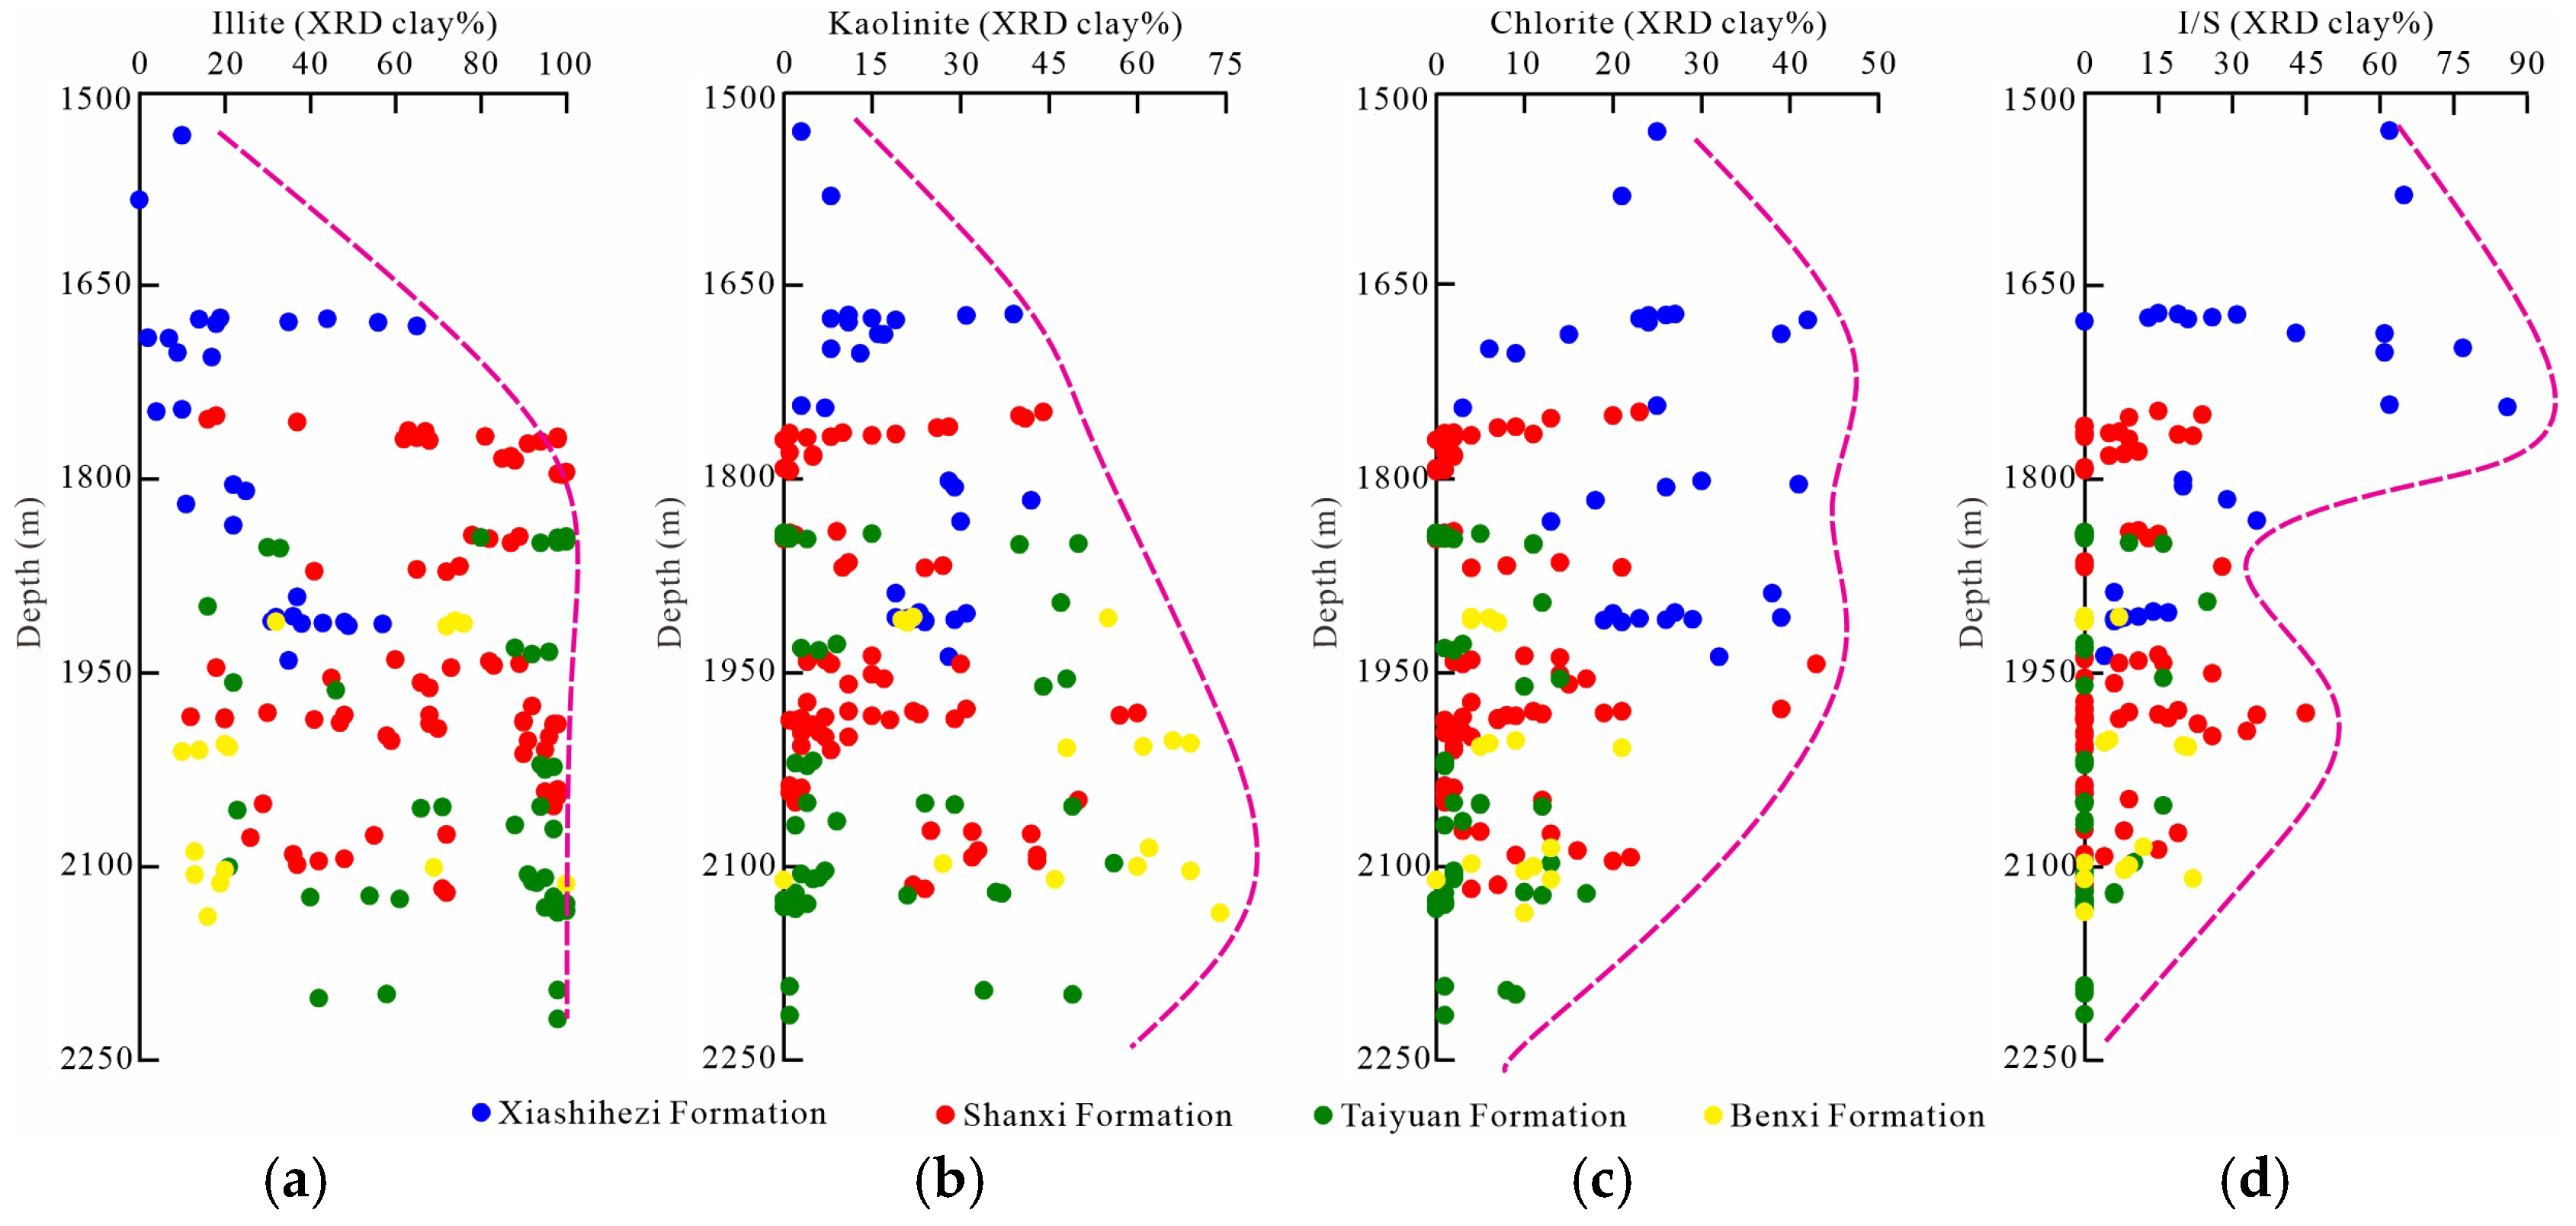
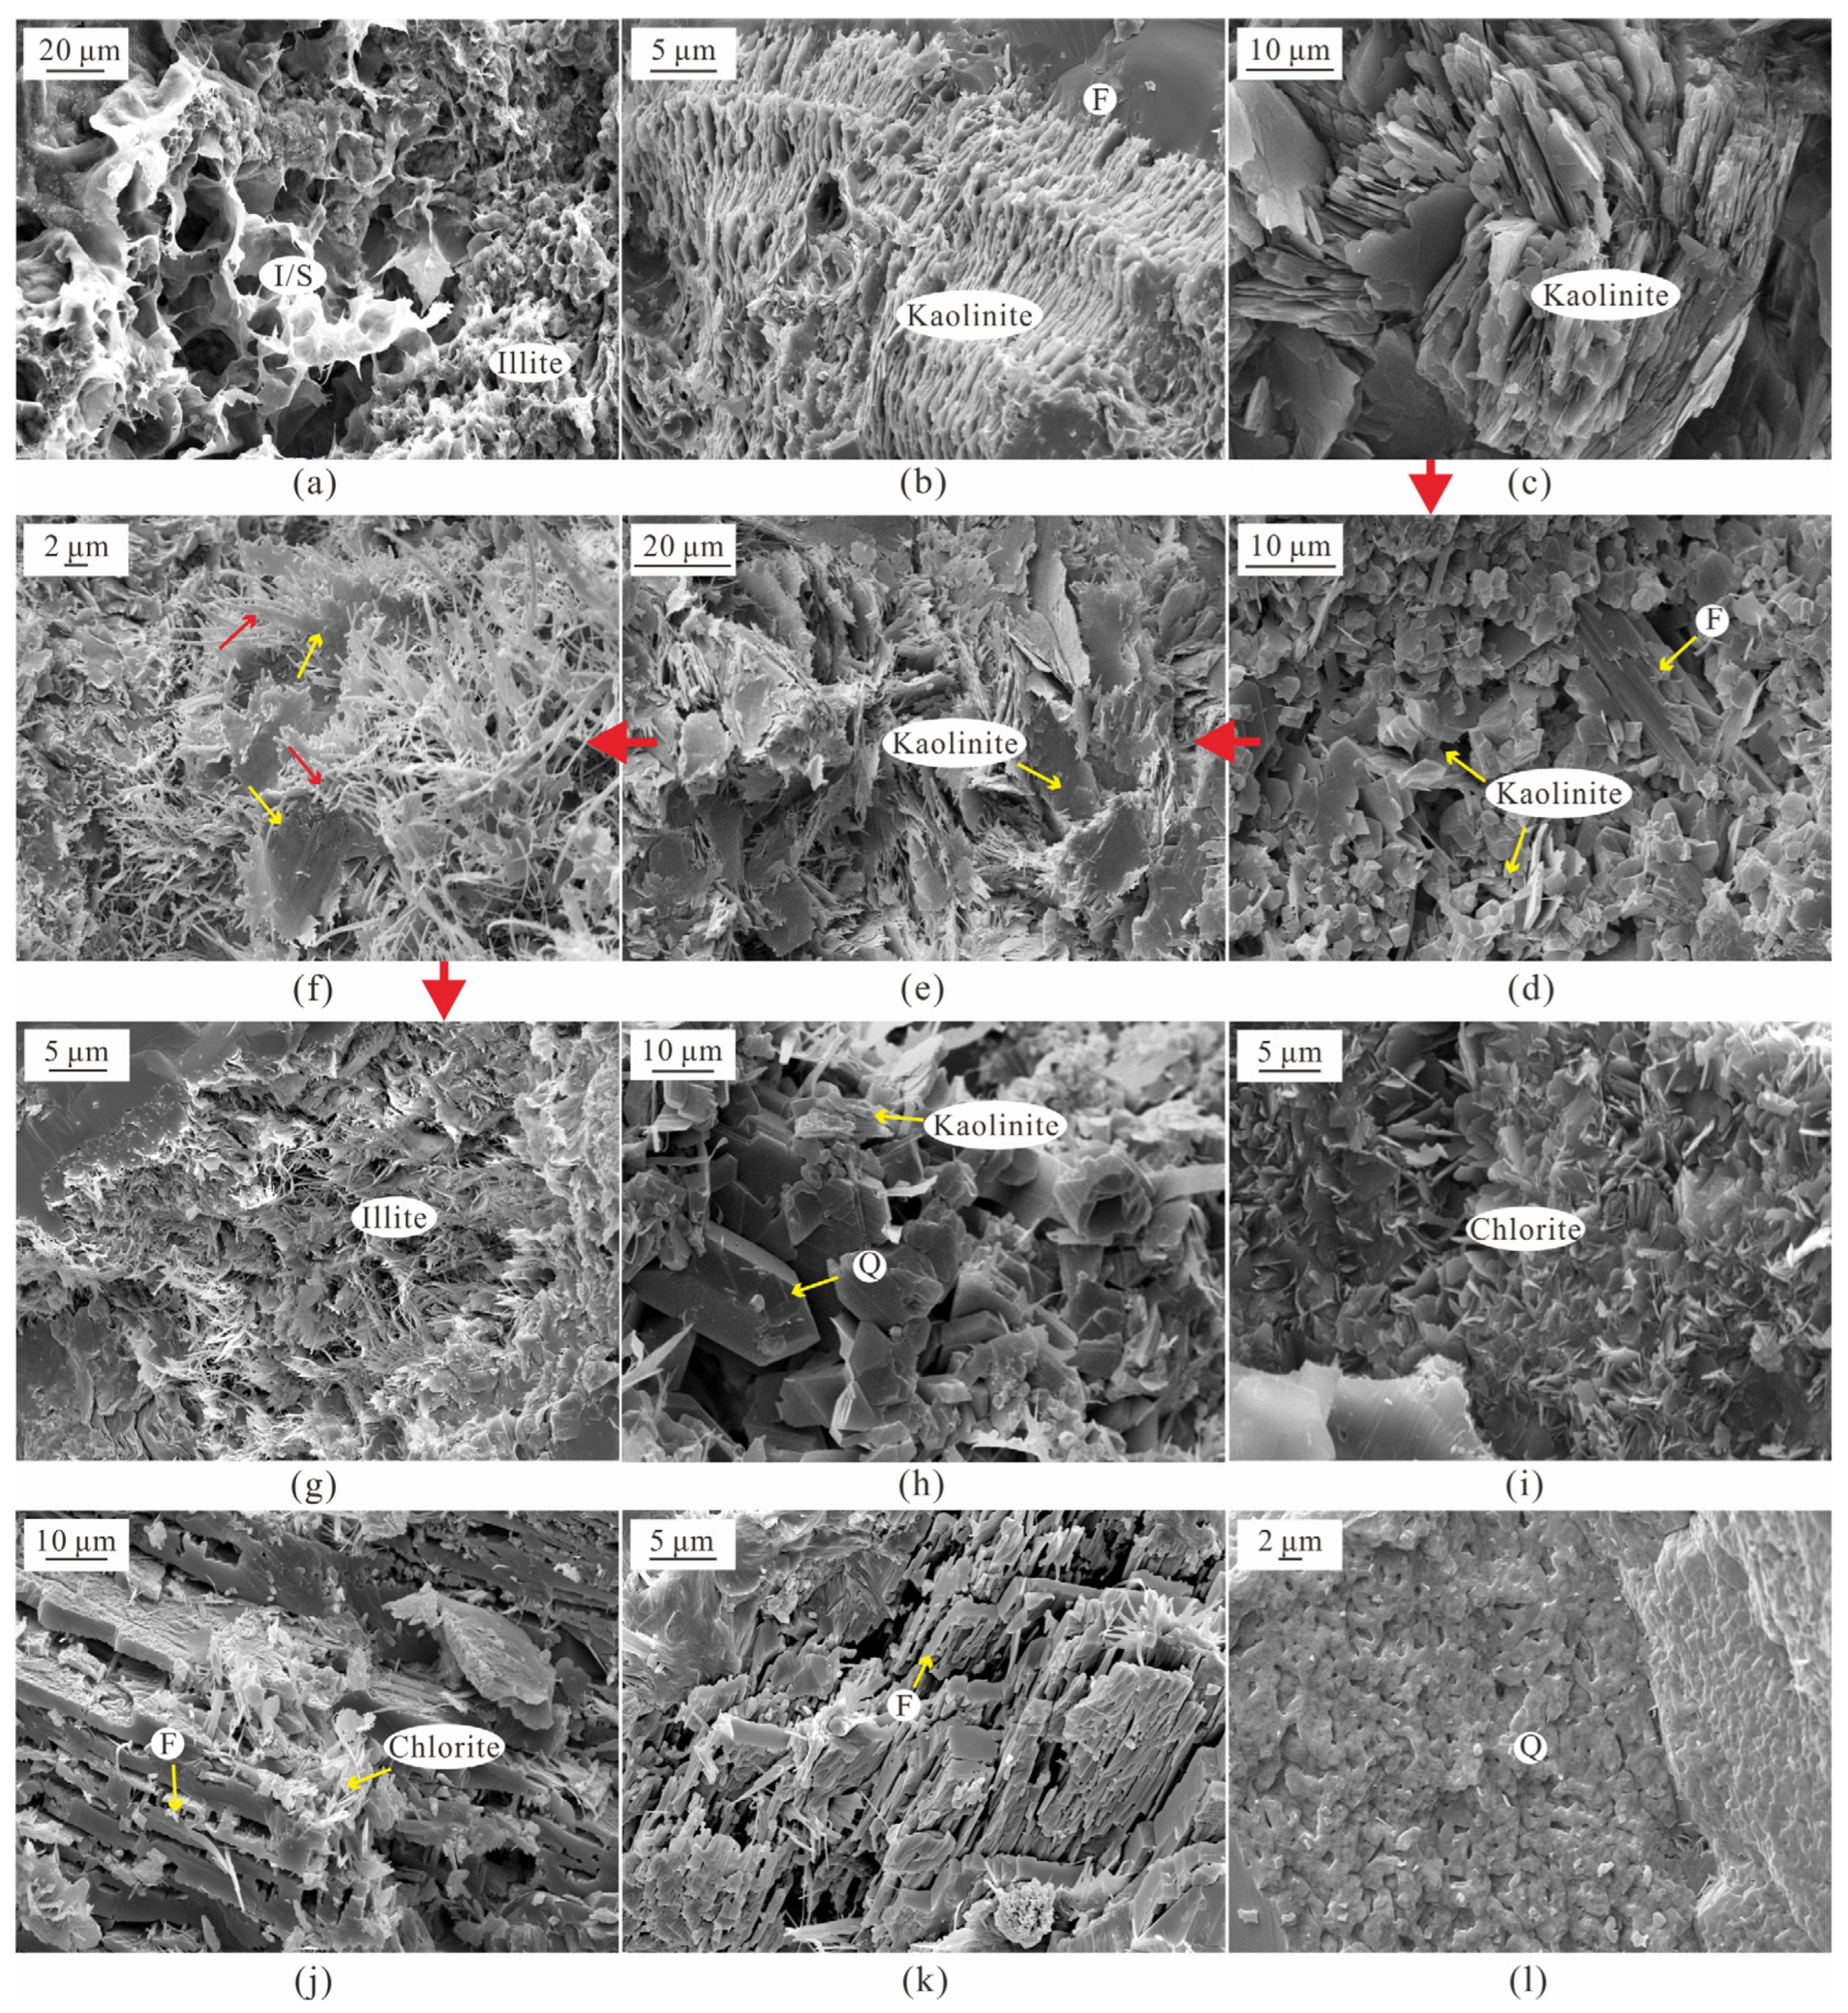
Based on thin section analysis results, the detrital grain content of tight sandstones ranges from 7% to 98%, with an average of 78%. In general, there are three types of framework grains: quartz (Q), feldspar (F), and rock fragment (RF). To analyze the component of framework grain more accurately, the content of Q, F, and RF was considered to be 100%, and a triangle diagram of sandstone classification was drawn based on the framework grain content (Figure 2). Q is the dominant framework grain component, ranging from 25% to 92% and averaging 50% (Figure 3a). In fact, a small amount of chert was also classified as Q in data statistics (Figure 3b). However, the content of Q varies among different strata, with the average content of Benxi Formation, Taiyuan Formation, Shanxi Formation, and Xiashihezi Formation being 67%, 50%, 48%, and 41%, respectively. The average content of F, which exists in tight sandstone as potash feldspar and plagioclase, is 13%, with a range extending from trace amounts to 44% (Figure 3c). The content of potash feldspar (with an average of 9%) is greater than that of plagioclase (with an average of 4%). The content of RF ranges from 6% to 60%, with an average of 37%, including metamorphic rock fragments, magmatic rock fragments, and sedimentary rock fragments. The metamorphic rock fragment content varies within a relatively wide range of trace amounts to 50%, averaging 23%. It is predominantly composed of quartzite, along with minor phyllite and slate (Figure 3d,e). The content of magmatic rock fragments ranges from trace amounts to 30%, with an average of 11%, and is mainly composed of acidic granitic rocks (Figure 3f). Sedimentary rock fragments constitute the lowest proportion of all rock fragment types, with a relatively narrow variation range of 0–4% and an average content of 2%.
As a whole, litharenite (Q50F13RF37) predominates in the tight sandstones, with minor amount of other types sandstone. From the Benxi Formation to the Xiashihezi Formation, the quartz content of tight sandstones gradually decreases, indicating that the Benxi Formation has the highest compositional maturity.

4.1.2. Cements

The cements of tight sandstone are predominantly carbonate minerals, clay minerals, and silica in the study area. These components collectively control the petrophysical properties of sandstone reservoir (Figure 4).
The content of carbonate cement averages 5.8%, ranging from 0.3% to 46.6%. Carbonate cements are primarily composed of calcite (Figure 4a), ferroan calcite (Figure 4b,c), ankerite (Figure 4d), and a minor amount of siderite (Figure 4c). Calcite content averages 5.8% (ranging from 3.0% to 25.0%), while ferroan calcite content averages 4.0% (ranging from 1.0% to 20.0%), and ankerite content averages 4.6% (ranging from 1.0% to 25.0%). Casting thin section observations reveal that carbonate cement generally occurs as fillers of dissolved pores and intergranular pores (Figure 4b–d).
Siliceous cements include quartz overgrowth and authigenic quartz crystals. Casting thin section analysis shows that quartz overgrowths occupy part of intergranular pores (Figure 4e), and SEM images reveal that authigenic quartz crystals are well developed (Figure 4f).
Statistical analysis of XRD data indicates that clay mineral cement content ranges from 3.0% to 67.0%, with an average of 21.8%. Clay mineral cements are predominantly composed of illite, kaolinite, chlorite, illite–smectite mixed layer (I/S), and minor chlorite-smectite mixed layer (C/S). Scanning electron microscopy observations reveal that clay mineral cement generally fills pores or adheres to grain surfaces.
Illite content averages 62.5%, spanning a range from trace amounts up to 100%. Kaolinite has an average content of 18.4%, varying from trace levels to 74.0%. Chlorite registers an average level of 9.4%, with a range from minimal to 43.0%. I/S content averages at 9.7%, with a variability extending from trace amounts to 86.0%.
Vertically, the distribution of clay mineral cement exhibits notable variations across different geological formations. In the Xiashihezi Formation, I/S emerges as the predominant clay mineral cement, with an average content of 28.1%, closely trailed by illite, which averages 27.4%. Moving to the Shanxi and Taiyuan Formations, illite is the main clay mineral cement, boasting average abundances of 69.6% and 82.1%, respectively, while kaolinite follows with mean values of 15.5% and 12.7%. In contrast, the Benxi Formation is characterized by a predominance of kaolinite, averaging 46.7%, with illite ranking second at an average of 37.9%. As burial depth increases, the content of both illite and kaolinite progressively rises (Figure 5a,b), whereas chlorite and I/S contents initially increase before subsequently declining (Figure 5c,d).

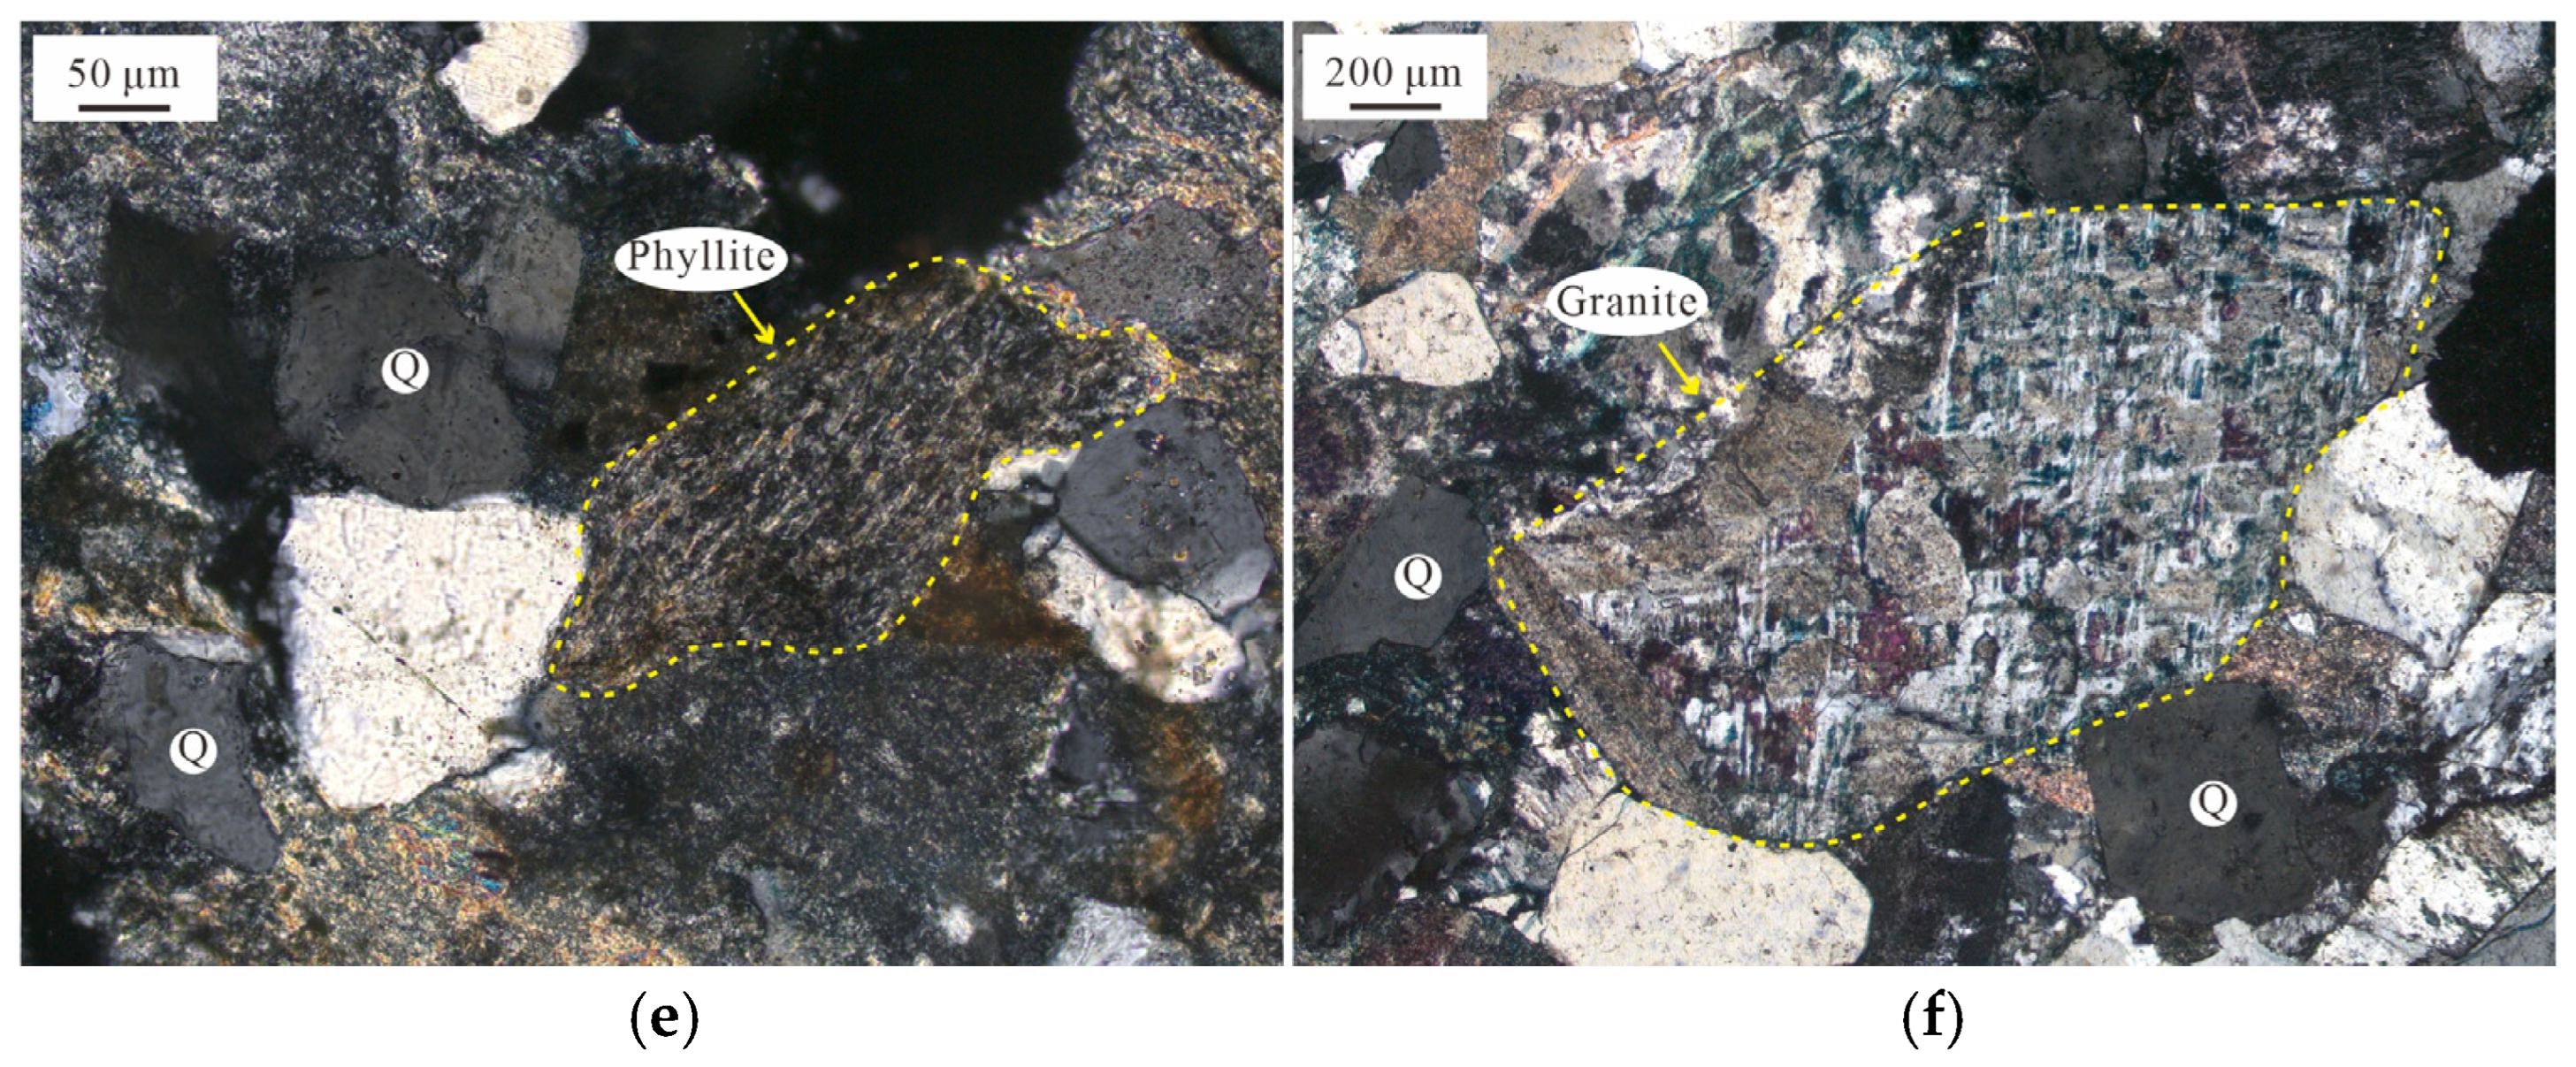
4.2. Texture of Detrital Grains

When analyzing detrital grains, the sorting coefficient (So) and median grain size (Md) are crucial textural parameters. According to the study of the grain size distribution in sandstone, the majority of the Md ranges from 0.25 to 0.50 mm (averaging 0.30 mm), with a secondary concentration between 0.125 and 0.25 mm (Figure 6a). The sandstone composition is dominated by medium sandstones, followed by fine sandstones. Notably, the Md of sandstones varies among formations. Specifically, the Md values for the Benxi Formation, Taiyuan Formation, Shanxi Formation, and Xiashihezi Formations are 0.34 mm, 0.31 mm, 0.29 mm, and 0.27 mm, respectively. The So generally ranges from 2.5 to 4.0, with a mean value of 2.8 (Figure 6b). The So of sandstones also varies among stratigraphic units, with mean values of 2.61, 2.92, 2.81, and 2.73 for the Benxi Formation, Taiyuan Formation, Shanxi Formation, and Xiashihezi Formation, respectively.

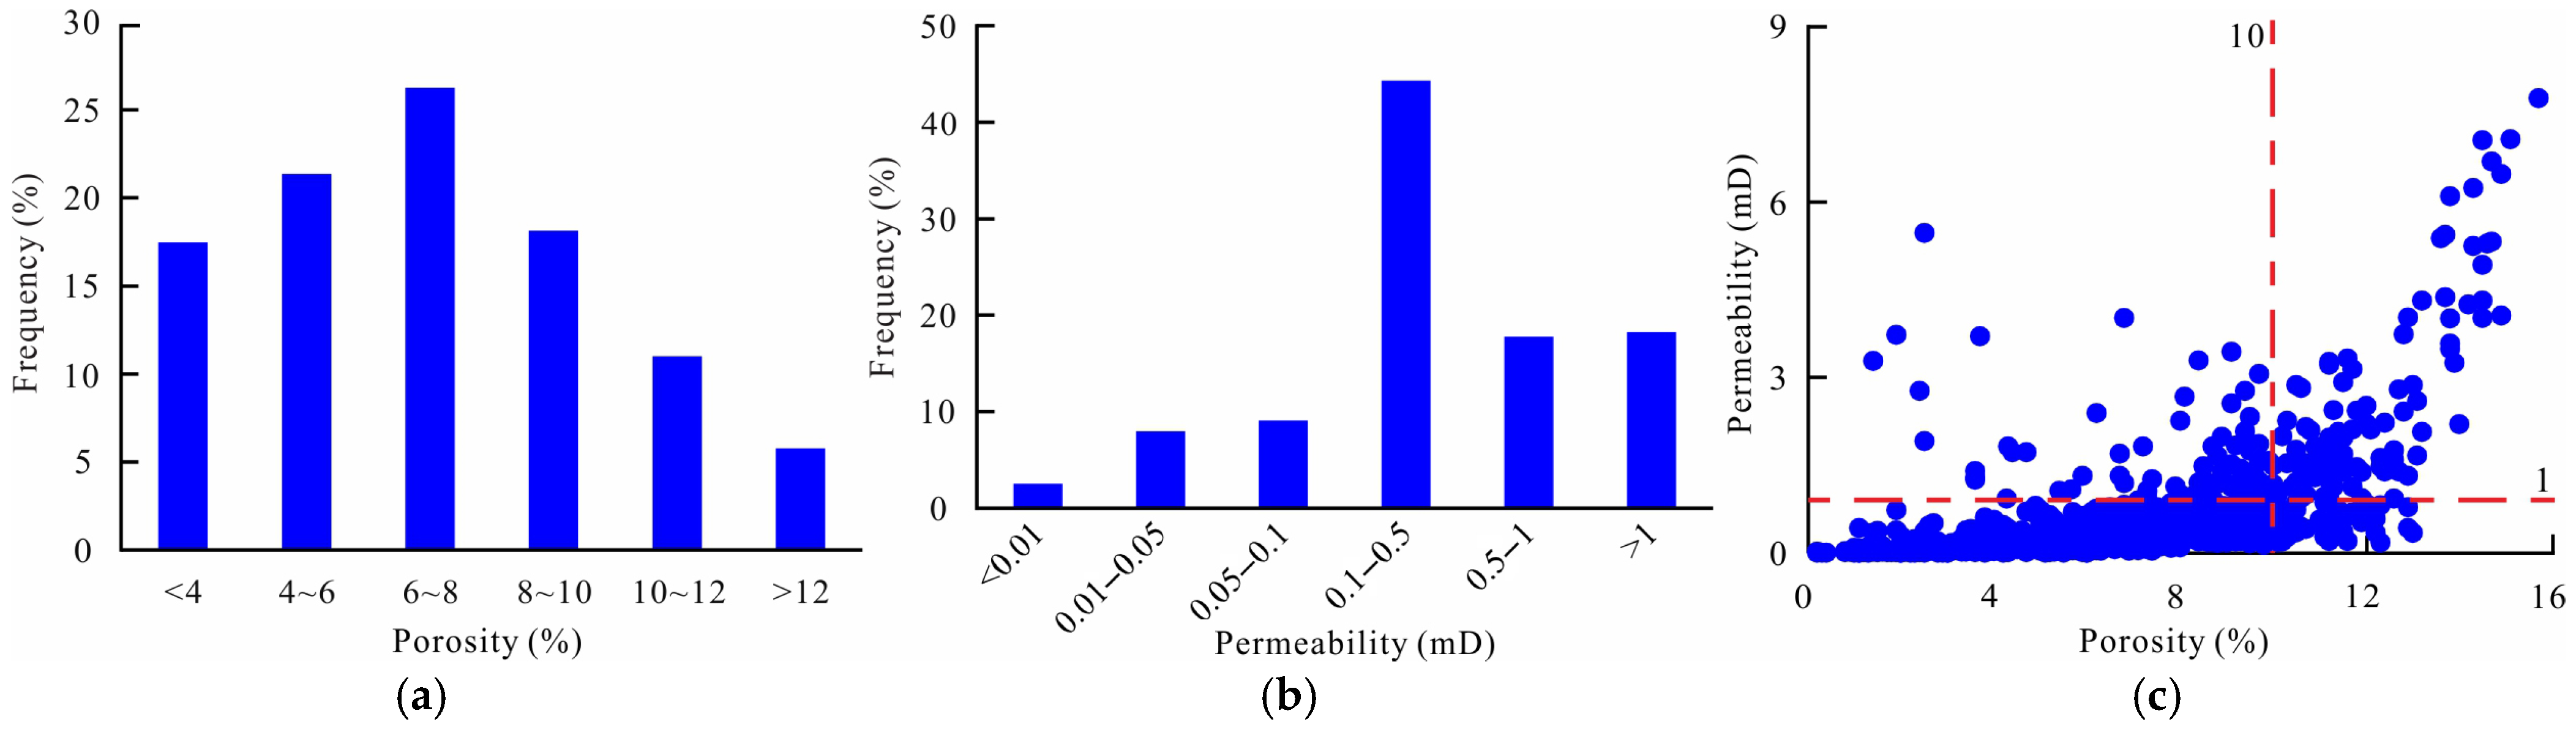
4.3. Porosity and Permeability

Porosity and permeability constitute the two most critical parameters for evaluating reservoir quality [23]. Analysis of 899 samples reveals that the sandstone in the study area has an average porosity of 7.1%, ranging from 0.2% to 15.7%. The majority of the porosity values fall within the 6.0% to 8.0% range (26.3% of the samples), and 83.2% of the samples have a porosity less than 10% (Figure 7a). The average permeability is 0.68 mD. The permeability distribution is primarily concentrated between 0.1 and 0.5 mD, representing 44.3% of the total data. Additionally, 81.8% of all samples show permeability values below 1 mD (Figure 7b). Porosity and permeability exhibit a positive correlation (Figure 7c). Furthermore, within the samples with porosity < 10%, 91.4% demonstrate permeability < 1 mD, confirming the classification of the reservoir as a typical tight sandstone with low porosity and low permeability.

5. Discussion

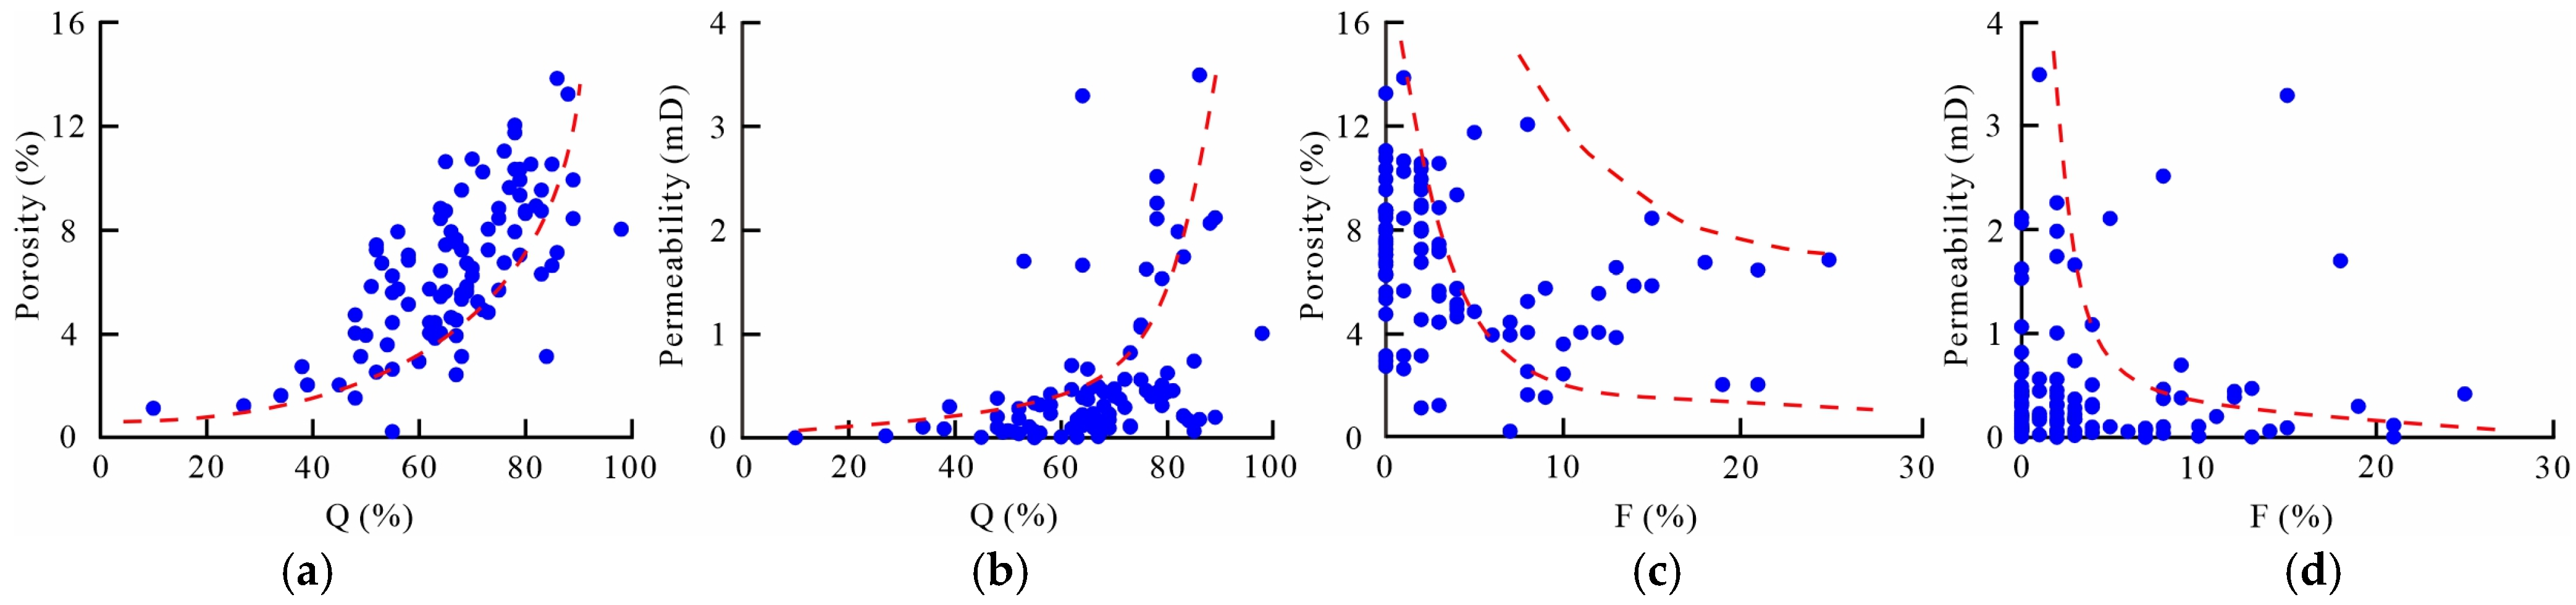
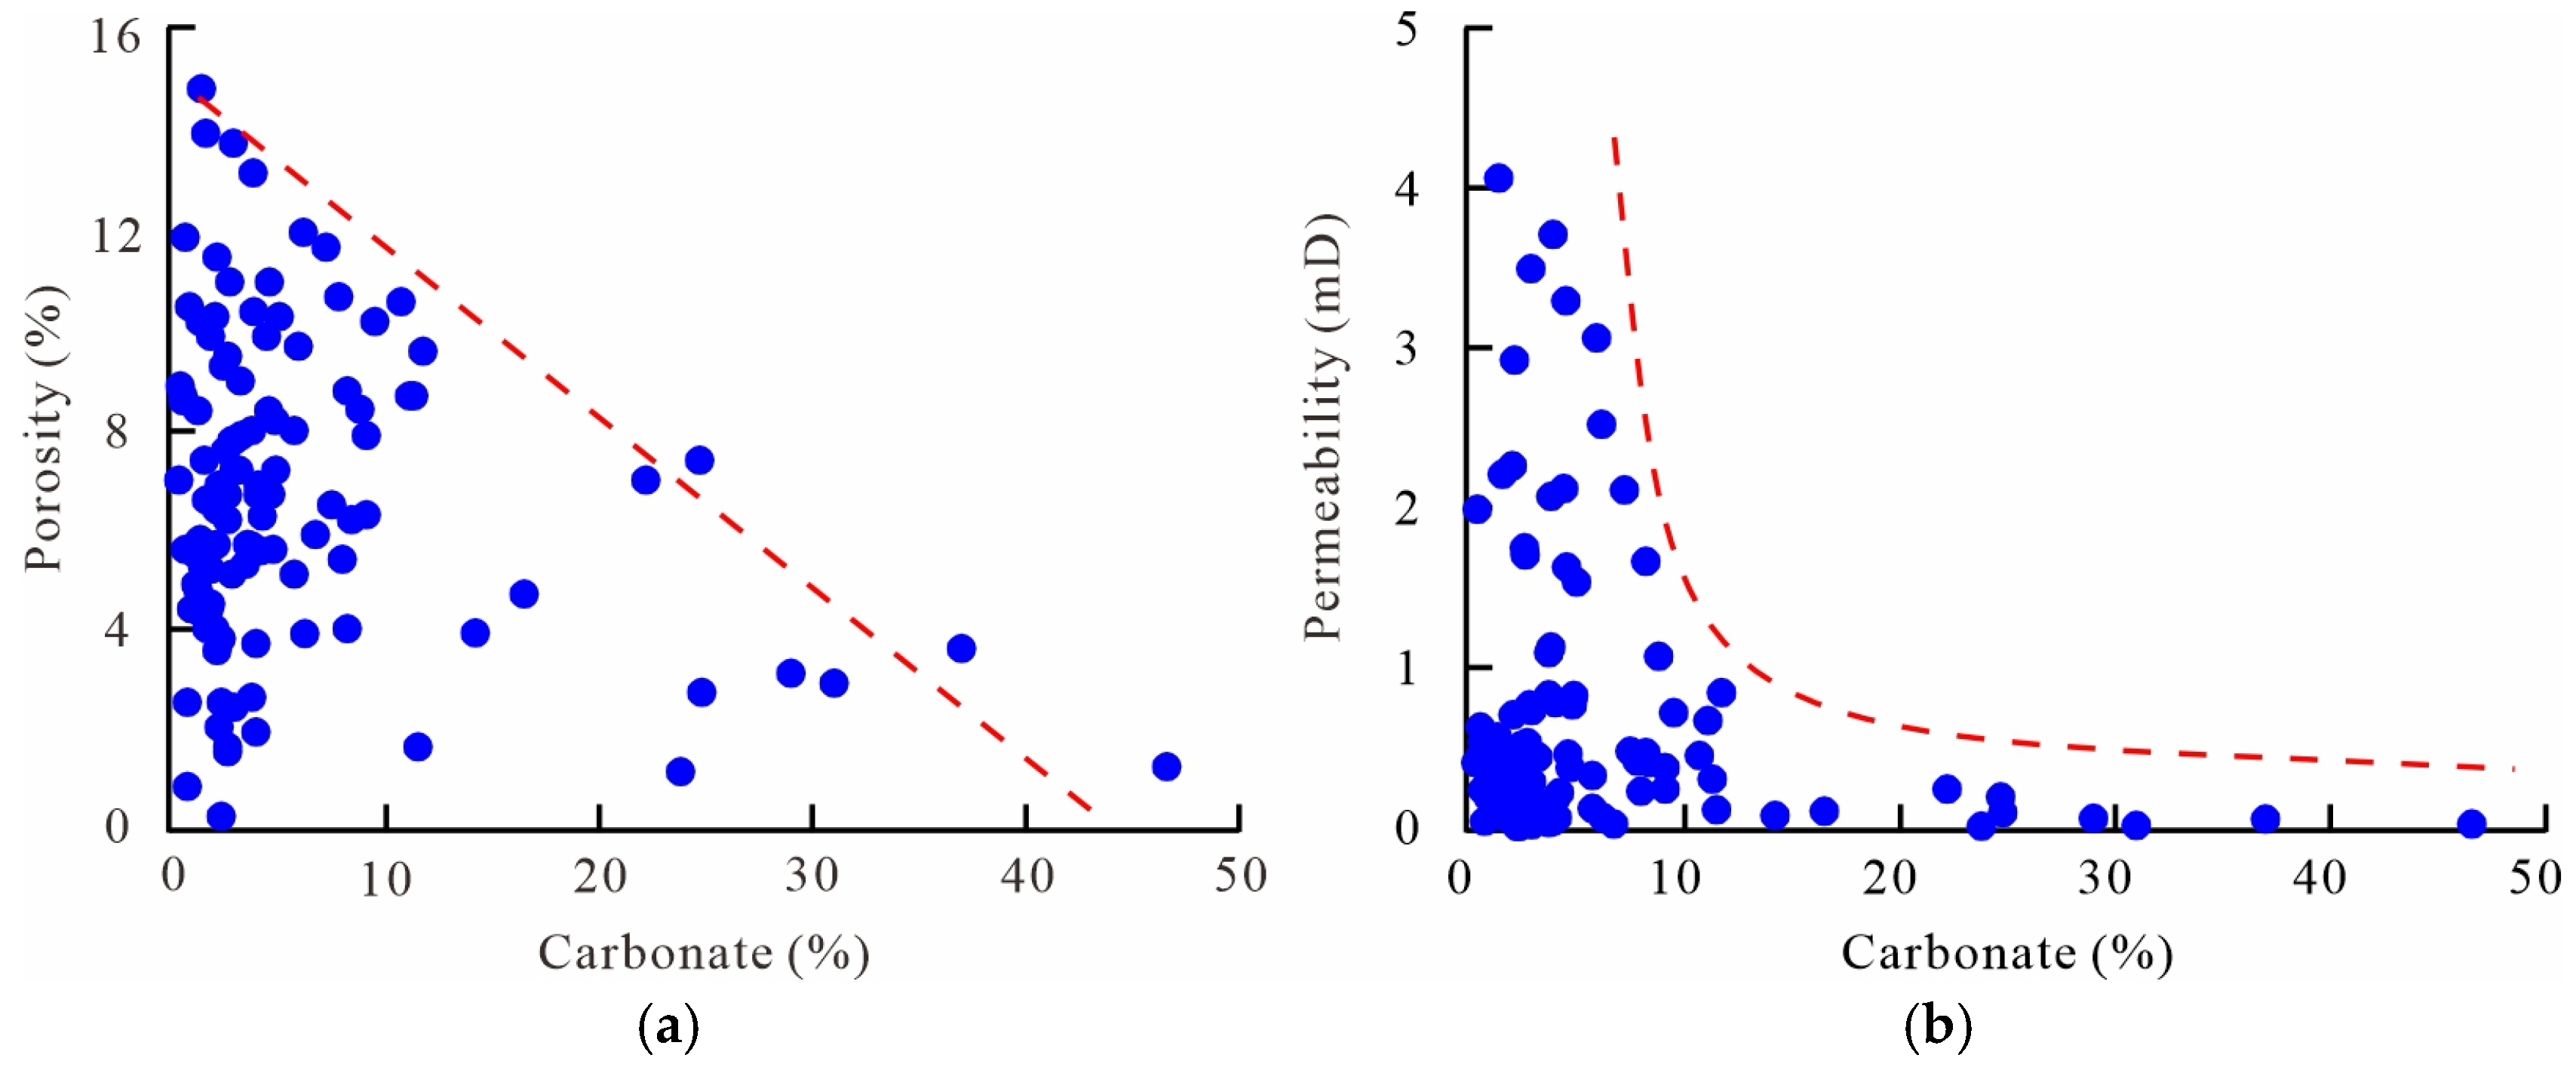
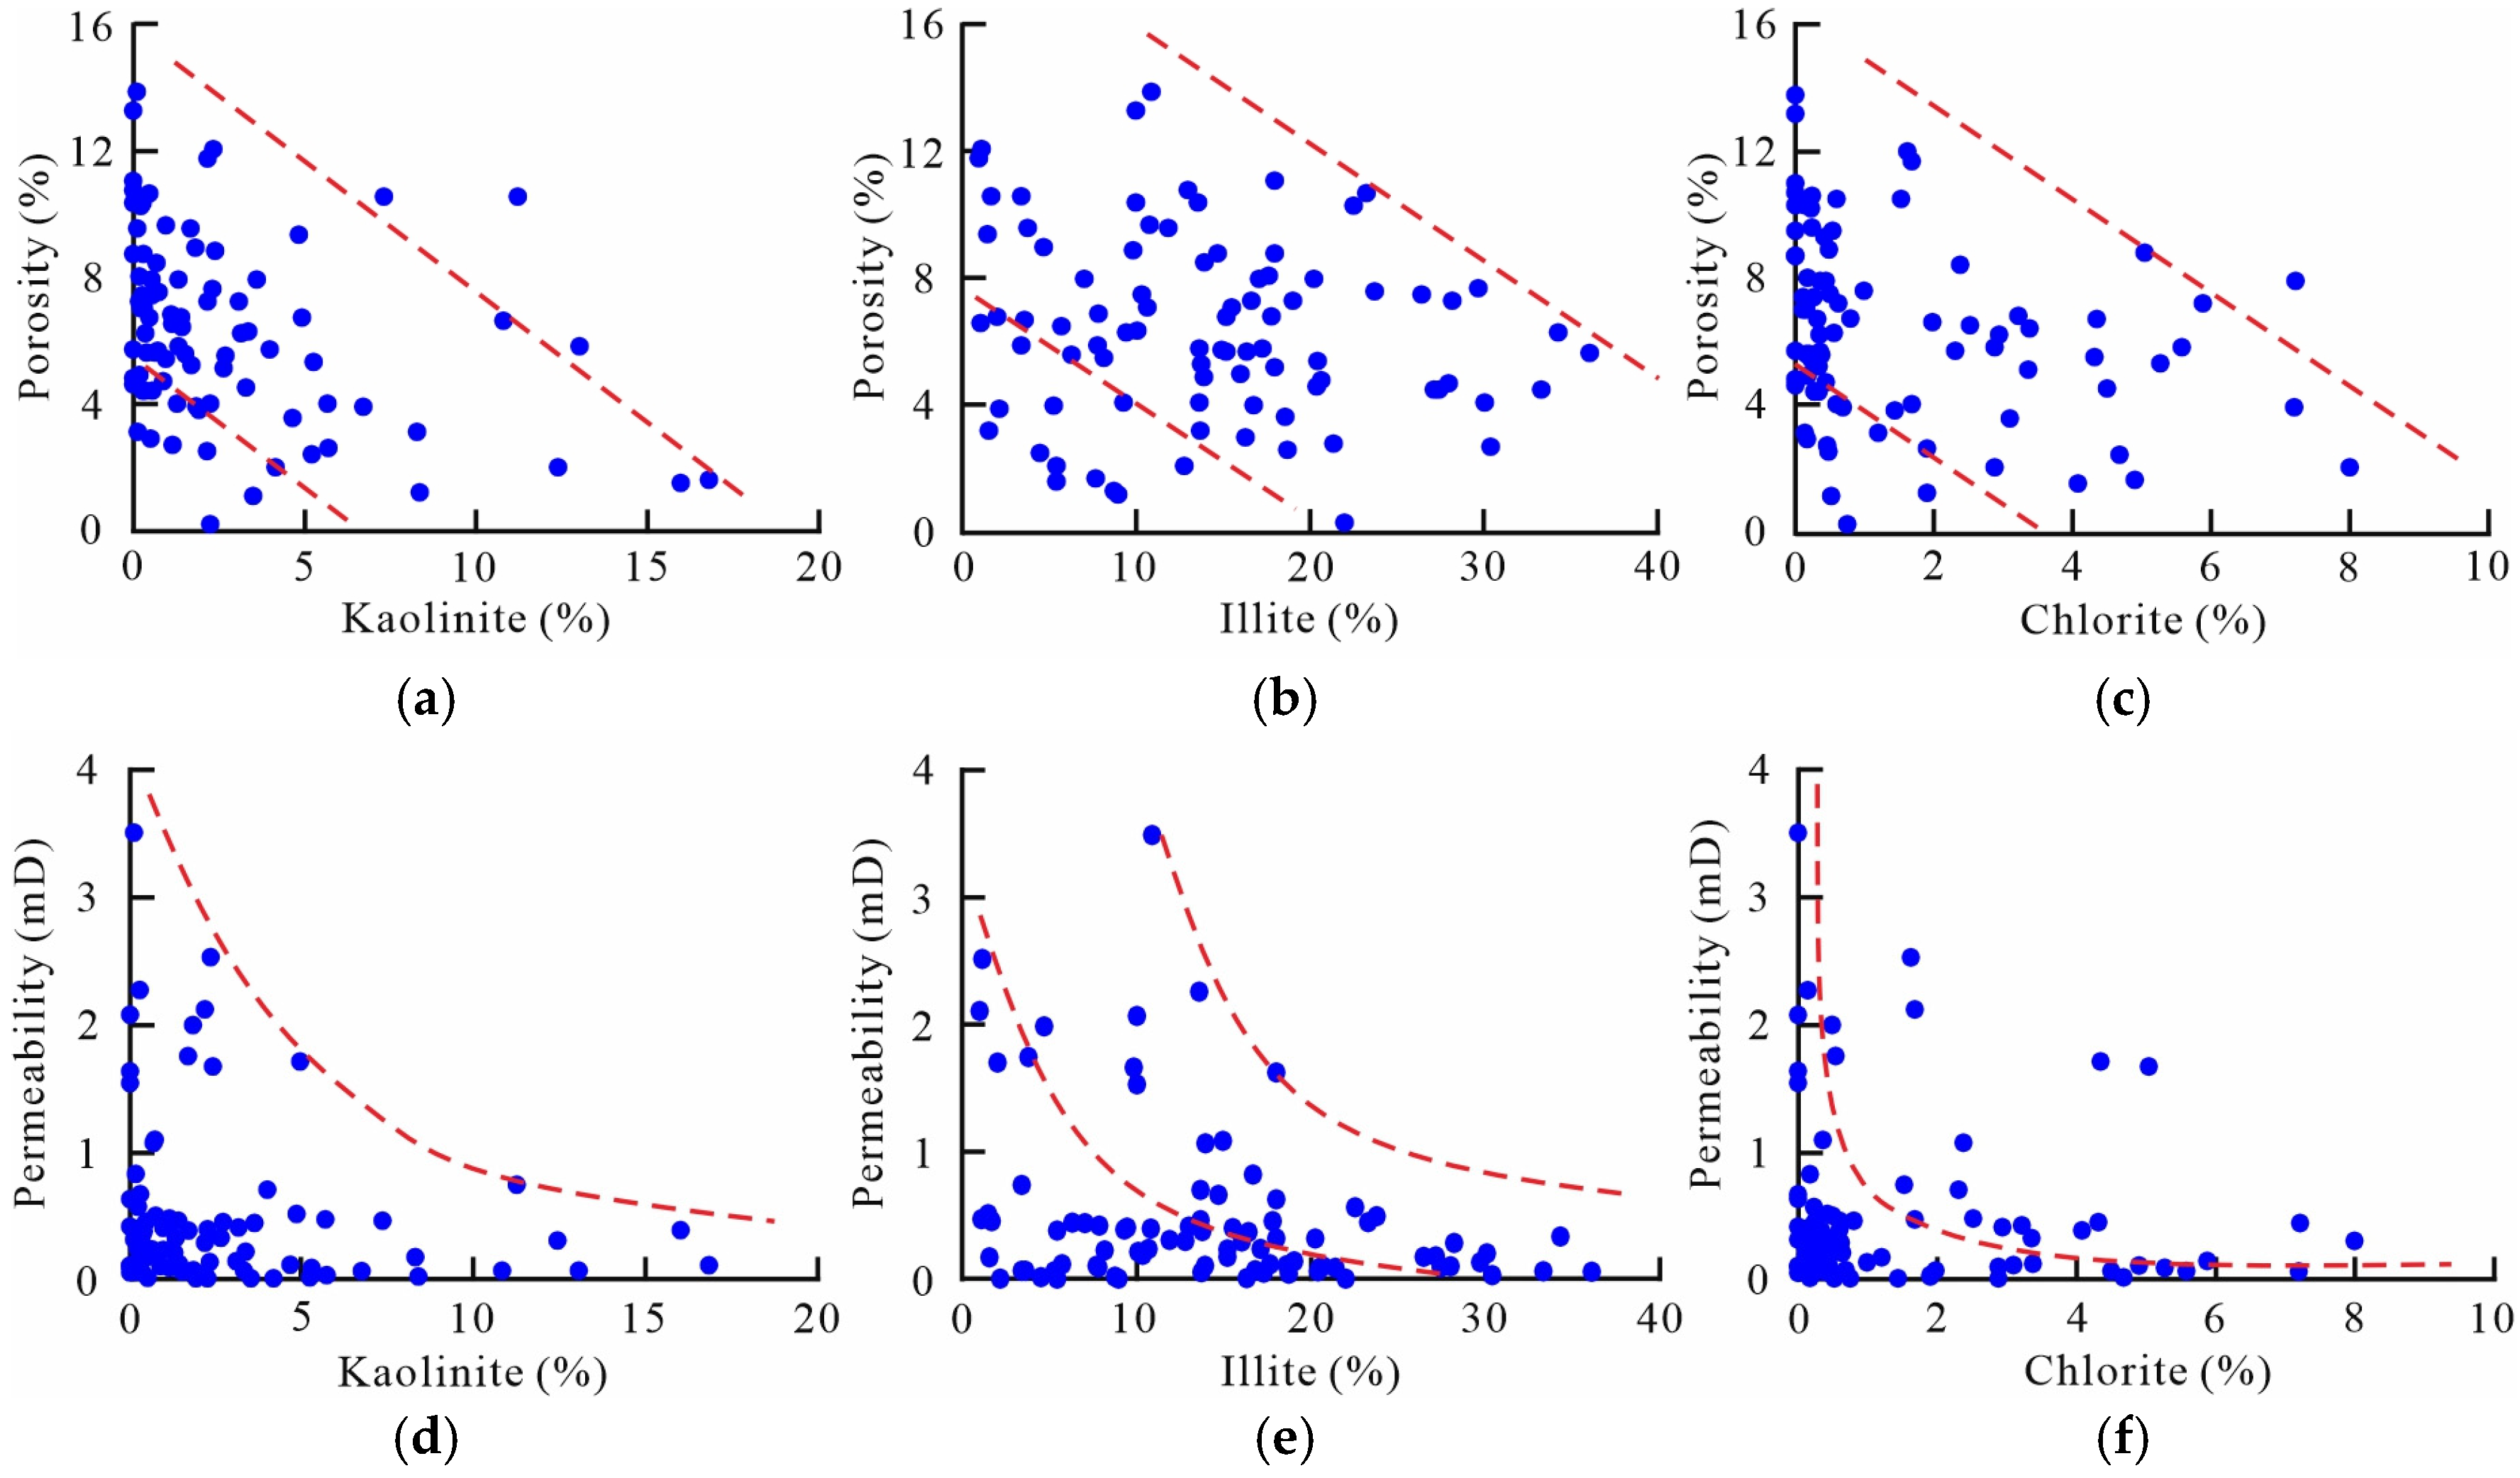
5.1. Influence of Composition and Texture on Reservoir Quality

Variations in framework grain composition and texture, shaped by different sedimentary environments, ultimately affect reservoir quality [24,25].
Quartz exhibits exceptional diagenetic stability and resistance to mechanical compaction, effectively preserving primary intergranular pores. Consequently, increasing quartz content correlates positively with enhanced reservoir porosity and permeability (Figure 8a,b). Feldspar, in contrast, is less stable than quartz and is prone to dissolution, creating secondary pores that improve reservoir quality. Analysis reveals an inverse relationship between feldspar content and porosity and permeability. Lower feldspar content corresponds to higher porosity and permeability (Figure 8c,d). Furthermore, a negative correlation exists between the sorting coefficient of sandstone and both porosity and permeability (Figure 9a,b), while porosity and permeability show a positive correlation with the median grain size (Figure 9c,d).
Previous studies indicate that the sedimentary environments of the Benxi to Xiashihezi formations evolved sequentially from tidal flat facies to tidal flat-lagoon facies, and then to delta facies [26,27]. The Benxi Formation, primarily deposited in tidal flat environment, experienced strong hydrodynamic action. This led to significant transformation of the sandstones within the Benxi Formation, resulting in high quartz content, low feldspar content, and good sorting (Figure 2d and Figure 6b). Consequently, the sandstone of Benxi Formation exhibits the best texture condition (Figure 6). In contrast, the overlying formations were deposited primarily in tidal flat-lagoon and deltaic environments with comparatively weaker hydrodynamic regimes, as evidenced by their higher sorting coefficients. From a sedimentological perspective, these conditions contributed to the relatively inferior reservoir quality of these formations compared to the Benxi sandstones (Figure 10).

5.2. Influence of Diagenesis on Reservoir Quality

5.2.1. Compaction

Compaction occurs during burial processes following sediment deposition. By the end of the Early Cretaceous period, the study area reached a maximum burial depth of approximately 3500 m. Two primary types of compactions were observed in the study area: mechanical compaction and pressure dissolution. Due to strong compaction, the original intergranular pores in sandstone were compressed, and the reservoir quality has declined, resulted in linear contacts of detrital grains (Figure 11a), deformation of plastic grains (Figure 11b), and directional arrangement of the flake or columnar minerals (Figure 11b,c). However, when the extrusion pressure exceeded the compressive strength of rigid grains (such as quartz and feldspar), fractures appeared in the detrital grains (Figure 11d), which can improve the reservoir physical properties to some extent. Pressure dissolution initiated as reservoir temperature and pressure increased with burial depth, characterized by concave–convex contact of detrital grains and selective dissolution of unstable minerals at grain contacts (Figure 11a).

5.2.2. Cementation

Cementation in the sandstone is primarily composed of carbonate cement, clay mineral cement, and a minor proportion of siliceous cement.
The porosity and permeability of the sandstone, particularly permeability, show a rapid decrease with increasing carbonate cement content (Figure 12). Carbonate cementation occurred in two distinct phases. Calcite and siderite, which are characteristic of the early-stage carbonate cement, filled the original intergranular pores within the sandstone framework grains and impeded acid fluid invasion. It resulted in the densification of the sandstone, with framework grains dispersed within the calcite cement (Figure 4c). Later-stage carbonate cementation is characterized by the presence of ankerite and ferroan calcite, typically filling residual intergranular pores or existing within dissolution pores. In general, both early and late carbonate cementation negatively impacts the quality of sandstone reservoirs. Furthermore, when carbonate cement content is high, sandstone exhibits extremely low permeability and porosity. However, even with low carbonate content, porosity and permeability are not necessarily high, indicating that other factors also influence the reservoir quality of the sandstone [28].
SEM observations show that I/S usually fills the pores in a honeycomb shape (Figure 13a). The illite ratio within I/S varies significantly among stratigraphic units, with average illite proportions of 92%, 91%, 88.6%, and 73.4% in the Benxi, Taiyuan, Shanxi, and Xiashihezi Formations, respectively. This trend indicates that the Xiashihezi Formation has undergone the least advanced diagenetic evolution, which also accounts for its relatively high residual I/S content. Under increasing reservoir temperature and pressure, smectite within I/S undergoes progressive illitization, as documented in previous studies [29,30].
In the study area, kaolinite forms predominantly through feldspar dissolution (Figure 13b–d). During early diagenesis, plagioclase dissolution facilitates kaolinite precipitation while releasing calcium ions that later contribute to carbonate cementation (Equations (1) and (2)). As diagenesis progresses, organic acids infiltrate the sandstone reservoir, promoting further feldspar dissolution. Notably, K-feldspar dissolution also drives kaolinite precipitation and supplies potassium ions essential for illite formation (Reaction 3). The relevant diagenetic reactions are summarized as follows:
2 NaAl Si 3 O 8 + 2 H + + H 2 O = Al 2 Si 2 O 5 ( OH ) 4 + 4 Si O 2 + 2 Na +
CaAl Si 3 O 8 + 2 H + + H 2 O = Al 2 Si 2 O 5 ( OH ) 4 + Ca 2 +
2 KAl Si 3 O 8 + 2 H + + H 2 O = Al 2 Si 2 O 5 ( OH ) 4 + 4 Si O 2 + 2 K +
In the equation, NaAlSi3O8 refers to albite. Al2Si2O5(OH)4 refers to kaolinite. SiO2 refers to quartz. CaAlSi3O8 refers to anorthite. KAlSi3O8 refers to potash feldspar.
The Benxi, Taiyuan, and Shanxi Formations are coal-bearing strata that generate substantial quantities of organic acids during organic matter decomposition (Figure 1). These organic acids promote the extensive feldspar dissolution and kaolinite precipitation. In particular, the thick coal seams and carbonaceous mudstones in the Benxi Formation generate a greater amount of organic acids, resulting in intense feldspar dissolution and substantial kaolinite precipitation within the sandstones. In contrast, the Xiashihezi Formation, located farther from coal-bearing intervals, exhibits comparatively weaker feldspar dissolution and kaolinite formation. Based on Equations (1) and (3), the dissolution of feldspar also releases silica, serving as a critical precursor for siliceous cementation (Figure 13h). Kaolinite typically occurs as flaky, book-sheet aggregates within pores (Figure 13c,d), with increasing kaolinite content correlating with reduced porosity and permeability in sandstone reservoirs (Figure 14a,d).
Illite originates primarily from two diagenetic pathways in the study area: transformation from I/S and illitization of kaolinite (Figure 13e–g). The corresponding reaction is represented by Equation (4):
KAl Si 3 O 8 + Al 2 Si 2 O 5 ( OH ) 4 = K Al 3 Si 3 O 10 ( OH ) 2 + 2 Si O 2 + H 2 O
In the equation, KAlSi3O8 refers to potash feldspar. KAl3Si3O10(OH)2 refers to illite.
It can be seen from Equation (4) that kaolinite illitization requires potassium ions. In the Benxi Formation, strong hydrodynamic conditions facilitate rapid removal of potassium ions released during K-feldspar dissolution, restricting the illitization of kaolinite. Consequently, kaolinite is preserved while illite formation diminishes. Illite typically occurs as flake- or filament-like aggregates filling pores (Figure 13f,g). In contrast, the Shanxi and Taiyuan Formations exhibit weaker hydrodynamic conditions, promoting K+ retention. Here, kaolinite illitization proceeds with a content decrease in kaolinite abundance and increase in illite content (Figure 10b). In the Xiashihezi Formation, I/S undergoes gradually illite. However, limited K-feldspar dissolution restricts K+ supply, resulting in low illite yields. Generally, illite occurs as fibrous or flake-like crystals in pores, which tend to obstruct pore throats. Thus, the content of illite is negatively correlated with porosity and permeability of sandstone (Figure 14b,e).
Chlorite predominantly occurs as leaf-like aggregates filling intergranular pores (Figure 13i) and dissolution voids (Figure 13j), with chlorite coatings being rarely observed. Consequently, porosity and permeability of sandstone reservoir exhibit an inverse correlation with chlorite abundance (Figure 14c,f). It is considered that magnesium ions released during the transformation from smectite to illite provide a material source for the formation of chlorite [31].
As previously discussed, the abundant secondary pores generated by feldspar dissolution and kaolinite intercrystalline pores accounts for the superior porosity and permeability display in the Benxi Formation sandstones. (Figure 10c,d). With the increase in illite cement in the Taiyuan and Shanxi Formations, the porosity and permeability of sandstone reservoirs exhibit progressive deterioration (Figure 10b,c).

5.2.3. Dissolution

The primary object of dissolution is feldspar, followed by rock fragments and fillings, and the dissolution of quartz is rare. Due to the cleavage development of feldspar, a large amount of acidic substances generated during the organic matter maturation will invade along this structural plane, causing partial or complete dissolution of feldspar along the cleavage plane and forming intragranular dissolution pores (Figure 13j,k). Concurrently, certain unstable lithic fragments and interstitial fillings also undergo partial dissolution. Although quartz is considered to be a relatively stable clastic grains, it also has dissolution phenomenon as the burial depths increase (Figure 13l). Therefore, compared with compaction and cementation, dissolution plays a constructive role in reservoir quality.

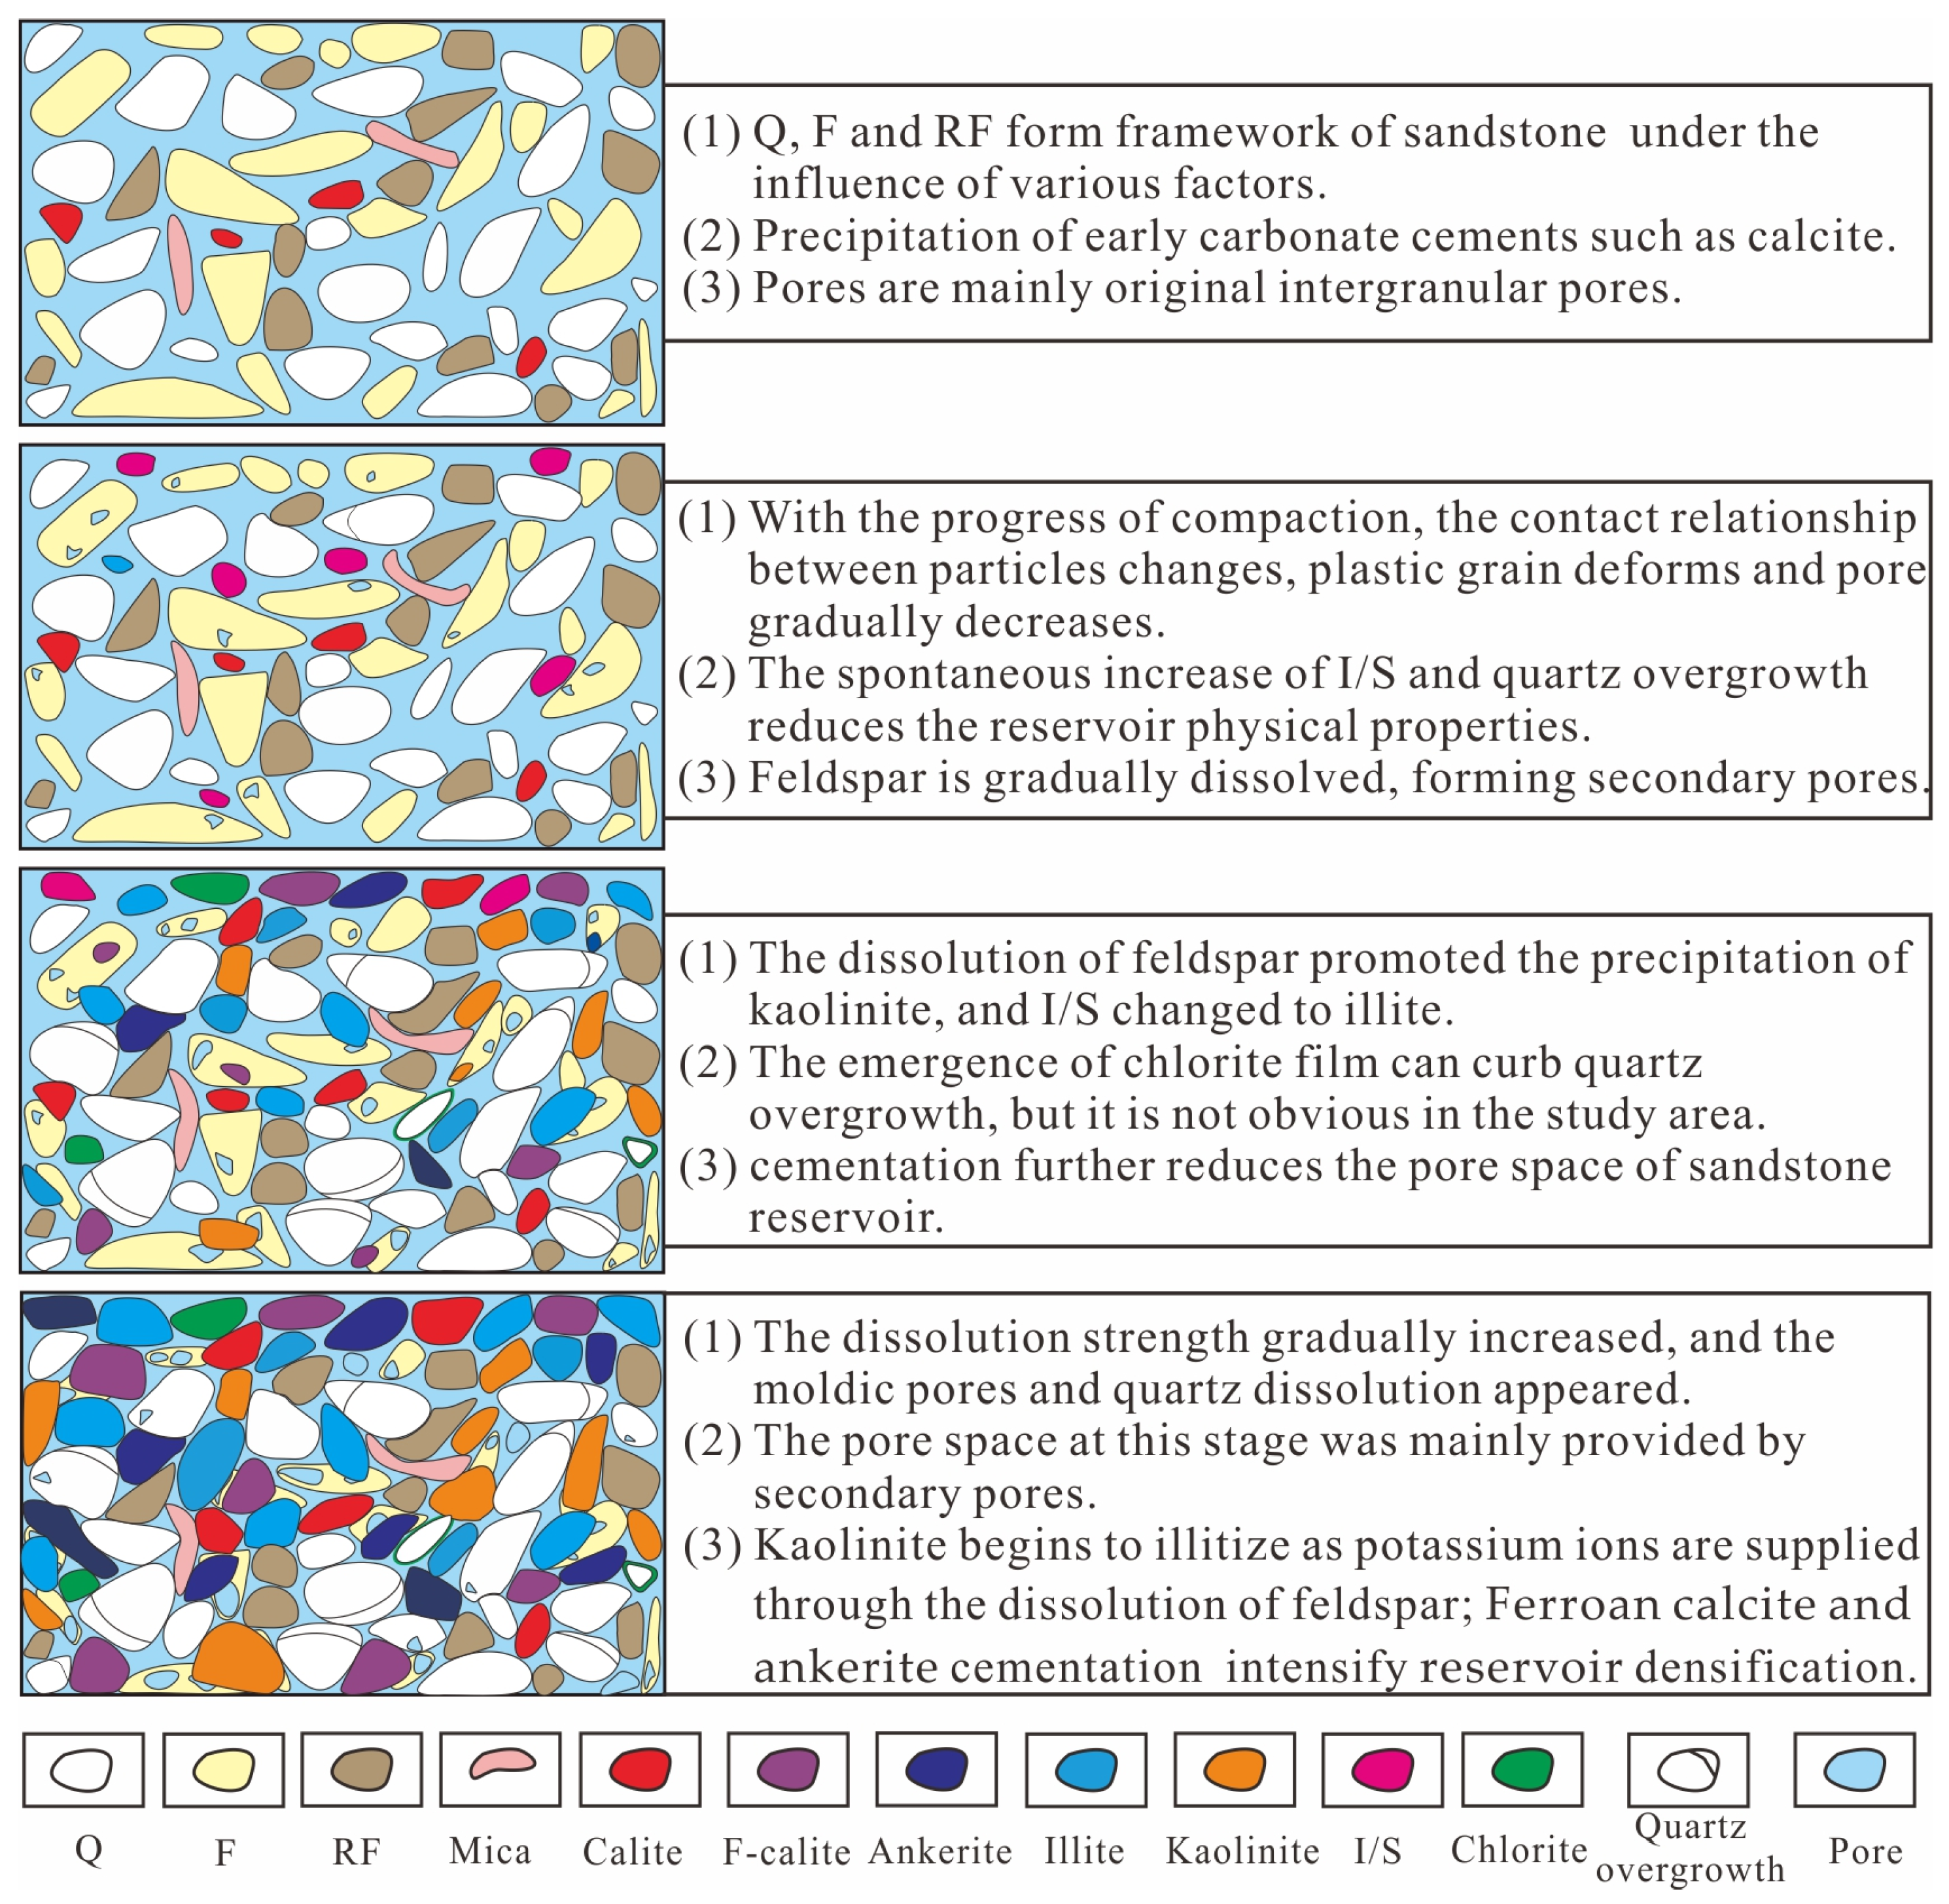
5.3. Diagenetic History

Based on integrated analysis of Carboniferous–Permian stratigraphic burial history, source rock maturity evolution, and tight sandstone cement mineralogy, the complex diagenetic evolution sequence of tight sandstone in the study area has been constructed. The specific evolution process is as follows (Figure 15).

5.3.1. Eodiagenesis

The events within eodiagenesis include changes in particle contact relationships, precipitation of calcite and siderite, feldspar dissolution, and the transformation of I/S. During this stage, unconsolidated sediments underwent mechanical compaction, leading to pore water expulsion, sediment volume reduction, and a transition of detrital grain contacts from loose to linear contacts, thereby progressively decreasing primary porosity (Figure 16). Siderite was formed in the early stage from syngenetic to eogenetic [32]. The casting thin section shows that siderite is lumpy and fills pores (Figure 4c). Early calcite was precipitated directly in pore water [33]. The early appearance of siderite and calcite further reduced the original porosity. At this stage, unstable plagioclase begins to dissolve due to the presence of organic acids. The proportion of illite in the I/S begins to increase, initiated when reservoir temperatures exceeded 70 °C, but smectite still dominates. Chlorite rims is precipitated with early compaction [34]. Thus, in the eodiagenesis, mechanical compaction and the formation of some cements reduced the original porosity.

5.3.2. Mesodiagenesis

With increasing reservoir temperature and pressure, the sandstone system transitions into the mesodiagenetic stage, characterized by the following diagenetic processes: (1) reservoir quality deterioration caused by pressure dissolution; (2) continued kaolinization of feldspar, continued illitization of I/S, and gradual illitization of kaolinite; (3) quartz overgrowth development; and (4) precipitation of ferroan calcite and ankerite cements (Figure 16).
Compaction proceeded to decrease the initial porosity during mesodiagenesis, resulting in grain deformation and fracture, and the contact relationship between grains changed into concave–convex contact (Figure 11a).
As the system enters the mesodiagenetic stage, extensive feldspar dissolution, caused by organic acids released during organic matter maturation, promotes the large-scale generation of kaolinite. Illite in the study area originates from two sources: the conversion of I/S to illite and the illitization of kaolinite. During this stage, I/S continues to convert to illite until it is largely depleted. Therefore, the illite content increases and the I/S content decreases with increasing burial depth (Figure 5a,d), accompanied by the formation of intergranular chlorite (Figure 13i). The illitization of kaolinite is controlled by temperature and potassium ions. Kaolinite illitization initiates only when the temperature exceeds 120 °C [35]. The presence of acidic substances promotes the dissolution of potassium feldspar (Figure 13e), thereby providing a source of potassium ions for the illitization of kaolinite. Thus, K-feldspar dissolution and the development of secondary porosity are both facilitated by kaolinite illitization.
Carbonate cements formed during mesodiagenesis mainly include ferroan calcite and ankerite. The conversion of I/S to illite and the dissolution of plagioclase are accompanied by a release of Ca2+, Fe2+, Mg2+, and Si4+, which provides important sources for carbonate cements. In addition, CO2 would also be released during the decarboxylation of organic matter. The dissolution of feldspar and rock fragment consuming organic acids provides an alkaline environment for the carbonate precipitation. The precipitation of ferroan calcite and ankerite would gradually stop with the decrease of CO2 content.
Dissolution plays a critical role in improving reservoir quality. During the maturation of organic matter in the study area, a large amount of organic acids are released, providing an acidic environment that promotes feldspar dissolution. The dominant pore types at this stage are secondary pores formed by particle dissolution. However, the pores created by dissolution can later be filled by cements, thus reducing the reservoir porosity to a certain extent.
Consequently, during the mesodiagenetic stage, compaction and cementation collectively degrade reservoir quality, whereas dissolution exerts constructive effects on pore development.

6. Conclusions

(1) The tight sandstone in the study area primarily consists of litharenite (Q50F13RF37). From the Benxi Formation to the Xiashihezi Formation, sandstone maturity gradually decreases. The Benxi Formation sandstones are characterized by superior sorting compared to the other three formations which show minimal variation in sorting quality.
(2) Compaction is the main factor causing the loss of original pores, though rigid grains (e.g., quartz) partially mitigate this effect by resisting deformation. Carbonate and clay mineral cements negatively impact on reservoir quality, whereas feldspar dissolution plays an important role in improving reservoir quality.
(3) Feldspar dissolution, accompanied by kaolinite precipitation, serves as a precursor material for the formation of calcareous and siliceous cements. Illite predominantly originates from two processes: the transformation of I/S and the illitization of kaolinite. Additionally, chlorite forms concurrently during the I/S-to-illite conversion.
(4) The Benxi Formation sandstones exhibit superior reservoir quality owing to their high compositional maturity, excellent sorting, and strong feldspar dissolution. In contrast, the tight sandstones of the Taiyuan and Shanxi formations are characterized by elevated clay mineral contents and intense illitization, leading to degraded reservoir properties. The Xiashihezi Formation sandstones retain abundant primary porosity due to their coarser grain size and moderate sorting, coupled with weak late-stage compaction, resulting in comparatively favorable reservoir quality.

Author Contributions

Conceptualization, X.G., Y.G. and H.S.; methodology, X.G., Y.G., H.G. and J.D.; validation, X.G. and X.W.; formal analysis, X.G., Y.G., H.G. and M.Z.; investigation, X.G., X.L. and Y.G.; resources, X.G.; data curation, X.G., Y.G., H.S. and M.Z.; writing—original draft preparation, X.G. and Y.G.; writing—review and editing, H.G.; supervision, H.G.; project administration, H.G.; funding acquisition, X.G. All authors have read and agreed to the published version of the manuscript.

Funding

This work was funded by the National Science and Technology Major Project of China (2016ZX05066001–002).

Data Availability Statement

The original contributions presented in this study are included in the article. Further inquiries can be directed to the corresponding authors.

Conflicts of Interest

Author Xiang Wu was employed by the company China United Coalbed Methane Corporation Limited. The remaining authors declare that the research was conducted in the absence of any commercial or financial relationships that could be construed as a potential conflict of interest.

References

  1. Song, F.; Kong, Q.Y.; Su, N.N.; Jiao, G.H.; Xu, M.M. Formation mechanism of the upper Paleozoic tight sandstone gas reservoir in the Daniudi gas field, Ordos Basin, China. Front. Earth Sci. 2024, 12, 1355494. [Google Scholar] [CrossRef]
  2. Wang, Z.Y.; Zhou, N.W.; Lu, S.F.; Liu, Y.C.; Lin, L.M.; Liu, Y.; Song, B. Generation, accumulation, and distribution of Upper Paleozoic tight sandstone gas in the northeastern margin of the Ordos Basin. Mar. Pet. Geol. 2023, 156, 106463. [Google Scholar] [CrossRef]
  3. Wang, M.H.; Sung, M.; Cao, C.; Xue, H.F.; Zhang, Q.; Yang, L.B.; Wang, W. Optimization of fracturing fluid system and fracturing technology in tight sandstone reservoirs. Fresenius Environ. Bull. 2021, 30, 9237–9243. [Google Scholar]
  4. Li, Y.; Gao, X.D.; Meng, S.Z.; Wu, P.; Niu, X.L.; Qiao, P.; Elsworth, D. Diagenetic sequences of continuously deposited tight sandstones in various environments: A case study from upper Paleozoic sandstones in the Linxing area, eastern Ordos basin, China. AAPG Bull. 2019, 103, 2757–2783. [Google Scholar] [CrossRef]
  5. Chen, J.Y.; Zhang, H.W.; Chang, H.L.; Wang, Q.W. Research on main controlling factors of tight sandstone gas accumulation in coal-bearing strata in the southern North China Basin: Comparison with the Ordos Basin. Front. Earth Sci. 2023, 10, 1037658. [Google Scholar] [CrossRef]
  6. Lan, C.L.; Yang, M.H.; Zhang, Y.Z. Impact of sequence stratigraphy, depositional facies and diagenesis on reservoir quality: A case study on the Pennsylvanian Taiyuan sandstones, northeastern Ordos Basin, China. Mar. Pet. Geol. 2016, 69, 216–230. [Google Scholar] [CrossRef]
  7. Liu, J.L.; Liu, K.Y.; Huang, X. Effect of sedimentary heterogeneities on hydrocarbon accumulations in the Permian Shanxi Formation, Ordos Basin, China: Insight from an integrated stratigraphic forward and petroleum system modelling. Mar. Pet. Geol. 2016, 76, 412–431. [Google Scholar] [CrossRef]
  8. Su, N.N.; Song, F.; Qiu, L.W.; Zhang, W. Diagenetic evolution and densification mechanism of the Upper Paleozoic tight sandstones in the Ordos Basin, Northern China. J. Asian Earth Sci. 2021, 205, 104613. [Google Scholar] [CrossRef]
  9. Yang, H.; Fu, J.H.; Liu, X.S.; Meng, P.L. Accumulation conditions and exploration and development of tight gas in the Upper Paleozoic of the Ordos Basin. Pet. Explor. Dev. 2012, 39, 315–324. [Google Scholar] [CrossRef]
  10. Gao, X.D.; Wang, Y.B.; Li, Y.; Guo, H.; Ni, X.M.; Wu, X.; Zhao, S.H. Characteristics of tight sandstone reservoirs and controls of reservoir quality: A case study of He 8 sandstones in the Linxing area, eastern ordos basin, China. Acta Geol. Sin.-Engl. Ed. 2019, 93, 637–659. [Google Scholar] [CrossRef]
  11. Cao, B.F.; Luo, X.R.; Worden, R.H.; Wang, X.Z.; He, Y.H.; Qiao, X.Y.; Zhang, L.K.; Lei, Y.H.; Zhou, J.S.; Deng, C. Contrasting diagenetic evolution and hydrocarbon charge of tight gas sandstones in the lower Permian Shanxi Formation, southeastern Ordos Basin, China. J. Asian Earth Sci. 2024, 276, 106330. [Google Scholar] [CrossRef]
  12. Ding, X.; Yang, P.; Han, M.; Chen, Y.; Zhang, S.; Zhang, S.; Liu, X.; Gong, Y.; Nechval, A.M. Characteristics of gas accumulation in a less efficient tight-gas reservoir, He 8 interval, Sulige gas field, Ordos Basin. Russ. Geol. Geophys. 2016, 57, 1064–1077. [Google Scholar] [CrossRef]
  13. Wang, S.M. Tectonic evolution and tectonic coal control in Ordos Basin. Geol. Bull. China 2011, 30, 544–552. [Google Scholar]
  14. Dou, W.C.; Liu, L.F.; Wu, K.J.; Xu, Z.J.; Feng, X. Origin and significance of secondary porosity: A case study of upper Triassic tight sandstones of Yanchang Formation in Ordos Basin, China. J. Pet. Sci. Eng. 2017, 149, 485–496. [Google Scholar] [CrossRef]
  15. Guo, Y.Q.; Li, B.Q.; Li, B.; Li, W.H.; Cao, H.X.; Liao, X.; Wu, Z.Z.; Fei, S.X.; Zhang, Q.; Chen, Q.; et al. Sedimentary system and palaeogeographic evolution of Ordos Basin, northern China. J Palaeogeogr. 2025, 14, 501–534. [Google Scholar] [CrossRef]
  16. Anees, A.; Zhang, H.; Ashraf, U.; Wang, R.; Liu, K.; Abbas, A.; Ullah, Z.; Zhang, X.N.; Duan, L.Z.; Liu, F.W.; et al. Sedimentary facies controls for reservoir quality prediction of XiaShihezi member-1 of the Hangjinqi area, Ordos Basin. Minerals 2022, 12, 126. [Google Scholar] [CrossRef]
  17. Ran, X.; Fu, J.; Wei, X.; Ren, J.; Sun, L.; Bao, H. Evolution of the Ordovician top boundary and its relationship to reservoirs’ development, Ordos Basin. Pet. Explor. Dev. 2012, 39, 165–172. [Google Scholar] [CrossRef]
  18. Li, P.; Zheng, M.; Bi, H.; Wu, S.T.; Wang, X.R. Pore throat structure and fractal characteristics of tight oil sandstone: A case study in the Ordos Basin, China. J. Pet. Sci. Eng. 2017, 149, 665–674. [Google Scholar] [CrossRef]
  19. Liu, C.Y.; Zhao, H.G.; Sun, Y.Z. Tectonic background of Ordos Basin and its controlling role for basin evolution and energy mineral deposits. Energy Explor. Exploit. 2009, 27, 15–27. [Google Scholar] [CrossRef]
  20. Wu, P.; Wu, J.G.; Xu, W.K.; Deng, J.M.; Ju, Y.W. Nanopore Structure Distribution of the Upper Paleozoic Tight Sandstones and Its Controls on Gas Production Performance in the Shenfu Area, Northeastern Ordos Basin, China. J. Nanosci. Nanotechnol. 2021, 21, 98–107. [Google Scholar] [CrossRef] [PubMed]
  21. Wang, C.W.; Jia, C.S.; Peng, X.L.; Chen, Z.X.; Zhu, S.Y.; Sun, H.S.; Zhang, J. Effects of wellbore interference on concurrent gas production from multilayered tight sands: A case study in eastern Ordos Basin, China. J. Pet. Sci. Eng. 2019, 179, 707–715. [Google Scholar] [CrossRef]
  22. Zhao, Z.F.; Pang, X.Q.; Jiang, F.J.; Wang, K.; Li, L.; Zhang, K.; Zheng, X.W. Hydrocarbon generation from confined pyrolysis of lower Permian Shanxi Formation coal and coal measure mudstone in the Shenfu area, northeastern Ordos Basin, China. Mar. Pet. Geol. 2018, 97, 355–369. [Google Scholar] [CrossRef]
  23. Ajdukiewicz, J.M.; Lander, R.H. Sandstone reservoir quality prediction: The state of the art. AAPG Bull. 2010, 94, 1083–1091. [Google Scholar] [CrossRef]
  24. Taylor, T.R.; Giles, M.R.; Hathon, L.A.; Diggs, T.N.; Braunsdorf, N.R.; Birbiglia, G.V.; Kittridge, M.G.; Macaulay, C.L.; Espejo, I.S. Sandstone diagenesis and reservoir quality prediction: Models, myths, and reality. AAPG Bull. 2010, 94, 1093–1132. [Google Scholar] [CrossRef]
  25. Lai, J.; Wang, G.W.; Chai, Y.; Wu, Q.K.; Zhang, X.T.; Sun, Y.H. Deep burial diagenesis and reservoir quality evolution of high-temperature, high-pressure sandstones: Examples from Lower Cretaceous Bashijiqike Formation in Keshen area, Kuqa depression, Tarim basin of China. AAPG Bull. 2017, 101, 829–862. [Google Scholar] [CrossRef]
  26. Chen, Y.H.; Wang, Y.B.; Guo, M.Q.; Wu, H.Y.; Li, J.; Wu, W.T.; Zhao, J.Z. Differential enrichment mechanism of organic matters in the marine-continental transitional shale in northeastern Ordos Basin, China: Control of sedimentary environments. J. Nat. Gas Sci. Eng. 2020, 83, 103625. [Google Scholar] [CrossRef]
  27. He, Q.Y.; Li, D.L.; Sun, Q.; Gao, J.W.; Li, H.B.; Li, X.H.; Zhao, X.C.; Wang, S.F.; Ji, G.Z. Constraints of palaeoenvironment on organic matter of Benxi Formation shale and discussion on enrichment mechanism under different facies. Frontiers of Earth Science 2023, 18, 148–171. [Google Scholar] [CrossRef]
  28. Jiu, B.; Huang, W.H.; Li, Y.; He, M.Q. Influence of clay minerals and cementation on pore throat of tight sandstone gas reservoir in the eastern Ordos Basin, China. J. Nat. Gas Sci. Eng. 2021, 87, 103762. [Google Scholar] [CrossRef]
  29. Li, M.P.; Shao, L.Y.; Dong, D.X.; Lu, J.; Li, J.Q. Clay mineral characteristics and its geological significance in argillaceous rock in eastern margin of Ordos basin. Coal Geol. Explor. 2017, 45, 39–44. [Google Scholar] [CrossRef]
  30. Wang, R.; Shi, W.Z.; Xie, X.Y.; Zhang, W.; Qin, S.; Liu, K.; Busbey, A.B. Clay mineral content, type, and their effects on pore throat structure and reservoir properties: Insight from the Permian tight sandstones in the Hangjinqi area, north Ordos Basin, China. Mar. Pet. Geol. 2020, 115, 104281. [Google Scholar] [CrossRef]
  31. Cao, Z.; Liu, G.D.; Meng, W.; Wang, P.; Yang, C.Y. Origin of different chlorite occurrences and their effects on tight clastic reservoir porosity. J. Pet. Sci. Eng. 2017, 160, 384–392. [Google Scholar] [CrossRef]
  32. Xu, N.N.; Qiu, L.W.; Eriksson, K.A.; Klyukin, Y.I.; Wang, Y.; Yang, Y.Q. Influence of detrital composition on the diagenetic history of tight sandstones with implications for reservoir quality: Examples from the Permian Xiashihezi Formation and Carboniferous Taiyuan Formation, Daniudi gas field, Ordos Basin, China. Mar. Pet. Geol. 2017, 88, 756–784. [Google Scholar] [CrossRef]
  33. Zhang, H.; Jiang, X.W.; Wan, L.; Ke, S.; Liu, S.A.; Han, G.L.; Guo, H.M.; Dong, A.G. Fractionation of Mg isotopes by clay formation and calcite precipitation in groundwater with long residence times in a sandstone aquifer, Ordos Basin, China. Geochim. Cosmochim. Acta 2018, 237, 261–274. [Google Scholar] [CrossRef]
  34. Zhu, S.F.; Wang, X.X.; Qin, Y.; Jia, Y.; Zhu, X.M.; Zhang, J.T.; Hu, Y.Q. Occurrence and origin of pore-lining chlorite and its effectiveness on preserving porosity in sandstone of the middle Yanchang Formation in the southwest Ordos Basin. Appl. Clay Sci. 2017, 148, 25–38. [Google Scholar] [CrossRef]
  35. Huang, S.J.; Huang, K.K.; Feng, W.L.; Tong, H.P.; Liu, L.H.; Zhang, X.H. Mass exchanges among feldspar, kaolinite and illite and their influences on secondary porosity formation in clastic diagenesis A case study on the Upper Paleozoic, Ordos Basin and Xuiiahe Formation, Western Sichuan Depression. Geochimica 2009, 38, 498–506. [Google Scholar] [CrossRef]
Figure 1. (a) Tectonic units of Ordos Basin and location of the study area. (b) Contour lines of the No.8 coal seam floor. (c) Stratigraphic column of coal-bearing strata in the study area.
Minerals 15 00744 g001
Figure 2. Framework composition of tight sandstones in the study area. (a) Xiashihezi Formation. (b) Shanxi Formation. (c) Taiyuan Formation. (d) Benxi Formation.
Minerals 15 00744 g002
Figure 3. Thin section observations showing the compositions of tight sandstones in the study area. (a) Typical sandstone sample displaying the composition of rock framework, including Q, F, and RF (Well SM-17 2009.87 m). (b) Q characterized by quartz and chert (Well SM-17 2011.74 m). (c) F characterized by potash feldspar and plagioclase (Well SM-18 1867.64 m). (d) RF characterized by quartzite and SRF (Well SM-14 2113.33 m). (e) RF characterized by phyllite (Well SM-16 1940.01 m). (f) RF characterized by granite (Well SM-9 1674.17 m).
Minerals 15 00744 g003aMinerals 15 00744 g003b
Figure 4. CTS and SEM images reveal the cementation characteristics of sandstones in the study area. (a) Calcite (C) cementing detrital grains (Well SM-17 1990.00 m). (b) Ferroan calcite (Fe-C) filling the intergranular pores (Well SM-7 1838.7 m). (c) F-calcite, siderite, and clay mineral cement filling the pores created by the partial dissolution of the detrital grains (Well SM-16 1941.31 m). (d) Ankerite and clay minerals occupying the intergranular pores (Well SM-16 2023.03 m). (e) Quartz overgrowth (Well SM-14 2140.02 m). (f) Authigenic quartz occupying intergranular pores (Well SM-4 1747.86 m).
Minerals 15 00744 g004aMinerals 15 00744 g004b
Figure 5. Characteristics of changes in clay minerals with depth. (a) Relationship between illite content and depth. (b) Relationship between kaolinite content and depth. (c) Relationship between chlorite content and depth. (d) Relationship between I/S content and depth.
Minerals 15 00744 g005
Figure 6. Distribution of detrital grain texture parameters. (a) Md distribution characteristics. (b) So distribution characteristics.
Minerals 15 00744 g006
Figure 7. Porosity and permeability of tight sandstones in the study area. (a) Distribution of porosity. (b) Distribution of permeability. (c) The connection between permeability and porosity.
Minerals 15 00744 g007
Figure 8. Effects of framework grain composition on sandstones reservoir quality. (a) Relationship between Q content and porosity. (b) Relationship between Q content and permeability. (c) Relationship between F content and porosity. (d) Relationship between F content and permeability.
Minerals 15 00744 g008
Figure 9. Effects of sandstone texture on reservoir quality. (a) Relationship between So and porosity. (b) Relationship between So and permeability. (c) Relationship between Md and porosity. (d) Relationship between Md and permeability.
Minerals 15 00744 g009
Figure 10. Comparison of components and physical properties of tight sandstone in different formations. (a) Framework grain content of tight sandstone. (b) Clay mineral content of tight sandstone. (c) Porosity of tight sandstone. (d) Permeability of tight sandstone. I is illite. K is kaolinite. Chl is chlorite. I/S is illite/smectite.
Minerals 15 00744 g010
Figure 11. Evidence of compaction effect of tight sandstones in the study area. (a) Contact relationships of detrital grains include linear contact (shown by yellow arrows) and concave–convex contact (shown by red arrows) (Well SM-9 1909.96 m). (b) Deformation of mica grains (Well SM-11 1849.34 m). (c) Orientational arrangement of flake or columnar minerals (Well SM-18 1957.61 m). (d) Quartz fractures caused by mechanical compaction (Well SM-4 2162.00 m).
Minerals 15 00744 g011
Figure 12. Impact of carbonate cement on sandstone reservoir quality. (a) Effect on porosity. (b) Effect on permeability.
Minerals 15 00744 g012
Figure 13. Cementation and dissolution characteristics of sandstone in the study area. (a) Illite and I/S filled intergranular pores (Well SM-9 1792.51 m). (b) The conversion of feldspar to kaolinite is at its incipient stage (Well SM-10 1844.78 m). (c) Feldspar is undergoing significant transformation into kaolinite (Well SM-15 2111.48 m). (d) Feldspar has undergone near-complete transformation into kaolinite (Well SM-7 2007.72 m). (e) The conversion of kaolinite to illite is at its incipient stage (Well SM-7 1934.05 m). (f) Kaolinite is undergoing significant transformation into illite (Well SM-6 1987.39 m). (g) Kaolinite has undergone near-complete transformation into illite (Well SM-4 2120.50 m). (h) Intergranular pores filled by kaolinite and authigenic quartz (Well SM-17 1990.00 m). (i) Intergranular pores filled foliated chlorite (Well SM-9 1674.17 m). (j) Dissolution pores of feldspar filled by foliated chlorite (Well SM-5 1912.00 m). (k) Intragranular pores generated by feldspar dissolution (Well SM-10 1849.64 m). (l) Pores generated by quartz dissolution (Well SM-8 1751.10 m).
Minerals 15 00744 g013
Figure 14. Impact of clay mineral cements on the sandstone reservoir quality. (a) Relationship between kaolinite content and porosity. (b) Relationship between illite content and porosity. (c) Relationship between chlorite content and porosity. (d) Relationship between kaolinite content and permeability. (e) Relationship between illite content and permeability. (f) Relationship between chlorite content and permeability.
Minerals 15 00744 g014
Figure 15. Burial history and diagenetic sequence of sandstones in the study area [4].
Minerals 15 00744 g015
Figure 16. The generalized model of mineral and pore evolution observed in tight sandstone in the study area.
Minerals 15 00744 g016
Disclaimer/Publisher’s Note: The statements, opinions and data contained in all publications are solely those of the individual author(s) and contributor(s) and not of MDPI and/or the editor(s). MDPI and/or the editor(s) disclaim responsibility for any injury to people or property resulting from any ideas, methods, instructions or products referred to in the content.

