Article

Shear Wave Velocity Estimation for Shale with Preferred Orientation Clay Minerals

1
Key Laboratory of Grain Information Processing and Control (Henan University of Technology), Ministry of Education, Zhengzhou 450001, China
2
Henan Key Laboratory of Grain Storage Information Intelligent Perception and Decision Making, Henan University of Technology, Zhengzhou 450001, China
3
College of Information Science and Engineering, Henan University of Technology, Zhengzhou 450001, China
4
College of Geoexploration Sicence and Technology, Jilin University, Changchun 130026, China
*
Author to whom correspondence should be addressed.
Minerals 2025, 15(7), 738; https://doi.org/10.3390/min15070738
Submission received: 10 June 2025 / Revised: 10 July 2025 / Accepted: 12 July 2025 / Published: 15 July 2025

Abstract

Accurate shear wave velocity is important for shale reservoir exploration and characterization. However, the effect of the ubiquitous preferred orientation of clay minerals on the velocities of shale has rarely been considered in existing S-wave velocity estimation methods, resulting in limited accuracy of the estimation method. In this study, a S-wave velocity estimation method is proposed for shale while considering the effect of the preferred orientation of clay. First, a compaction model is built by taking the effects of the orientation distribution of clay and the aspect ratio of pores into account. Then, the compaction model is utilized in a workflow to obtain the model parameters by fitting the estimated P-wave velocity with the bedding-normal P-wave velocity from well logging. Finally, the S-wave velocity is estimated using the compaction model and calculated model parameters. The proposed method is verified by laboratory data and successfully applied to a shale gas reservoir. The result shows that the root mean square error almost halves compared with the Xu–White model. Additionally, the correlation coefficient also improves. The improvement in S-wave velocity estimation indicates that the effect of the preferred orientation of clay on the velocities of shale is effectively corrected. The proposed method improves the accuracy of velocity modeling and reservoir characterization for shale.

1. Introduction

Shale has emerged as a major research focus because of its unconventional hydrocarbon reserve [1,2]. The shear wave velocity of shale is essential for shale reservoir exploration and characterization [3,4]. The accurate S-wave velocity can be measured by well logging in the reservoir. However, the high cost and absence of logging technology limit the measurement [5]. Therefore, current methods used to obtain the S-wave velocity usually rely on estimation by fitting the modeled and measured P-wave velocity from well logging data. An existing challenge for shale velocity modeling is that the complex microstructures and inherent anisotropy of shale make its P- and S-wave velocities vary with different incident angles [6]. The inherent anisotropy is mainly caused by the preferred orientation of clay minerals in the well logging frequency [7]. Although fractures significantly affect the anisotropy, they only develop in fractured shale. In contrast, the anisotropy caused by the preferred orientation of clay minerals is ubiquitous for shale, which cannot be ignored [8,9].
The rock physics model is an important approach used for S-wave velocity estimation. Many rock physics models describe the microstructures of rock and build the relationship between the properties of microstructures and velocities. Xu and White [10,11] proposed the Xu–White model for shaly sandstone, which was focused on two types of pores with different aspect ratios (the ratio of the minor axis and long axis). The Xu–White model was then extended to carbonate rock, with the type of pores expanding into four categories [12]. Inclusion models introduce ellipsoidal inclusions to describe the minerals and pores of rock. Among them, the self-consistent approximation (SCA) model mixes inclusions together [13], and the differential effective medium (DEM) model gradually adds inclusions into a matrix [14] to model the elastic moduli of rock. Ruiz and Dvorkin [15] found that a narrow aspect ratio range for ellipsoidal inclusions can be applied in DEM for S-wave velocity estimation from the P-wave velocity in nonclastic rock. Vernik et al. [16] proposed a hybrid method to take the effect of the organic content in unconventional shale reservoirs into account, which improved the Greenberg–Castagna S-wave velocity prediction method. Zhang et al. [17] built a statistical rock physics model to estimate the S-wave velocity and provided a confidence interval for the estimation. Then, this model was applied to volcanic rock [18]. Considering the effects of the kerogen distribution and pore shape, a rock physics model for S-wave velocity estimation of organic-rich rock was built [19]. In recent years, rock physics model have combined with neural networks to form new methods for S-wave estimation [20,21,22,23,24]. Overall, rock is generally regarded as isotropic, and the S-wave velocity is estimated based on rock physics models and well logging data by fitting the bedding-normal P-wave velocity.
The accuracy of S-wave velocity estimation for shale is limited by the isotropic rock physics model because shale is generally anisotropic. The main reason for this is that clay minerals are plate-like and have a preferred orientation [25]. The SCA and DEM were extended to an anisotropic medium to model the effect of fully aligned clay minerals on shale [26]. The orientation distribution function (ODF) can be utilized to describe the preferred orientation of clay and model its effect on the elastic tensor of shale [27]. The ODF has also been improved by defining the preferred orientation of clay using a distribution or the reduction in porosity [28,29]. Research studies also regarded kerogen as plate-like and found it to usually be embedded with clay to form the background of shale, in which pores and silt minerals are included [26,30]. The preferred orientation of the mixture also contributes to the inherent anisotropy of shale [31,32]. Figure 1 presents the microstructures of shale, in which, in the preferred orientation of the background, pores with different aspect ratios, spherical-like silt minerals are observed. The inherent anisotropy affects other components, such as pores and fractures, in rock physics modeling. Some models used for the isotropic background are not applicable, such as the Xu–White model, Hudson model [33], and Eshelby–Cheng model [34]. A solution is introducing components as inclusions into the anisotropic background using the anisotropic DEM to model the elastic properties of shale [35,36]. However, the sequence of inclusions added in the background affects the modeling [37]. Also, the differential computation of DEM is computationally intensive [38].
The inherent anisotropy of shale is weak. Research studies have verified the application of the Hudson model and Eshelby–Cheng model for a weak anisotropic background using experiments [39,40]. Typical S-wave velocity estimation methods were evaluated, and the modified Xu–White model was considered as the optimal choice [41]. Additionally, the Xu–White model has been extended in other research studies [12,17,42]. Compared with neural network-related methods, the rock physics model-based approach can obtain model parameters using the measured P-wave velocity and then estimate S-wave velocity, during which the measured S-wave velocity is not entirely necessary. Based on the above knowledge, we propose a new S-wave velocity estimation method considering the effect of preferred orientation of clay minerals on the velocities of shale. Firstly, a compaction model is built to model the orientation distribution of clay and aspect ratio of pores by combining ODF and the Xu–White model. Then, a workflow based on the compaction model is summarized to estimate the velocities of shale using well logging data. The proposed method is verified by laboratory data and applied to a shale gas reservoir, in which the S-wave velocity estimation result is evaluated quantitatively. As prior information or calibration, the improved velocity estimation can benefit seismic inversion and reservoir petrophysical parameter inversion for shale.

2. Theory and Methodology

2.1. The Xu–White Model Used for Velocity Modeling of Rock

The components of rock are minerals, pores, and fluids in the pore space. The geometry and elastic properties of components affect the elastic properties of rock, the relationships between which are built using the rock physics model. P- and S-wave velocities in isotropic rock are determined by its moduli and density:
V P = K + 4 3 μ ρ
V S = μ ρ
where K, μ , and ρ indicate the bulk modulus, shear modulus, and density of rock, respectively.
In the modeling of rock velocities, the elastic properties of components are available from rock physics experiments, but the geometry of minerals and pores is more complex, which significantly affects the elastic properties of rock. For rock minerals, clay is plate-like, but silt minerals, such as quartz and calcite, are stiff, with a spheroid-like shape. Meanwhile, pores of rock have different geometries due to the diagenesis and their surroundings. The Xu–White model utilizes two types of pores to describe pores in the clay and sand of rock:
ϕ s = f s ϕ 1 ϕ
ϕ c = f c ϕ 1 ϕ
where ϕ s and ϕ c are sand-related porosity and clay-related porosity respectively, whose sum is the porosity of rock ( ϕ ); f s and f c are the volume fraction of sand and clay, respectively.
In the Xu–White model, the matrix of rock consists of sand and clay, whose moduli ( K 0 and μ 0 ) are provided by the time-average [10,11]:
T P 0 = 1 f c T P s + f c T P c
T S 0 = 1 f c T S s + f c T P c
where T P 0 and T S 0 are the P- and S-wave transit times of the matrix, T P s and T S s are P- and S-wave transit times of sand, and T P c and T S c are P- and S-wave transit times of clay. The transit time of the wave is the reciprocal value of the wave velocity, from which the moduli of the matrix are calculated by combining Equations (1) and (2). The moduli of the matrix can also be calculated using the effective medium theory, such as Hill’s average [43].
Then, pores are added into the matrix to obtain the moduli of the dry rock ( K d and μ d ) using the following formulas [38]:
K d = K 0 1 ϕ p
μ d = μ 0 1 ϕ q
where p and q are geometry coefficients given by Berryman [13]. For fluid-saturated rock, the moduli ( K s and μ s ) are provided by Gassmann’s equations [44]:
K s = K d + 1 K d K 0 2 ϕ K f + 1 ϕ K 0 K d K 0 2
μ s = μ d
where K f is the bulk modulus of fluid in pores of rock.

2.2. The Effect of Preferred Orientation Clay Minerals on Velocities of Shale

Shale is usually transversely isotropic with a vertical symmetry axis (VTI) due to the inherent anisotropy. In high-frequency conditions, such as well logging and experiments, the inherent anisotropy is mainly decided by the preferred orientation of inclusions, such as plate-like clay minerals [27]. The orientation distribution function (ODF) describes the orientation property of inclusions and models its effect on the elastic properties of shale, which is decided by a tensor:
C VTI = c 11 c 12 c 13 0 0 0 c 12 c 11 c 13 0 0 0 c 13 c 13 c 33 0 0 0 0 0 0 c 44 0 0 0 0 0 0 c 44 0 0 0 0 0 0 c 66
where c i j is the component of the tensor, and c 66 = 1 2 c 11 c 12 . Shale wave velocities are decided by the tensor:
c 11 = ρ V P 2 90 ° ,   c 12 = c 11 2 ρ V SH 2 90 ° ,   c 33 = ρ V P 2 0 ° ,   c 44 = ρ V SH 2 0 °
where the degree indicates the included angle between the wave vector and the symmetry axis of the shale. For the VTI medium, V P 0 ° and V SH 0 ° are the measured P- and S-wave velocities from well logging.
Taking the effect of preferred orientation clay into account, the tensor of VTI shale is denoted as c i j v , and the formulae from Voigt averaging are provided [27]:
c 11 v = L + 2 M + 4 2 π 2 105 2 5 a 3 W 200 + 3 a 1 W 400 c 33 v = L + 2 M 16 2 π 2 105 5 a 3 W 200 2 a 1 W 400 c 12 v = L 4 2 π 2 315 2 5 ( 7 a 2 a 3 ) W 200 3 a 1 W 400 c 13 v = L + 4 2 π 2 315 5 ( 7 a 2 a 3 ) W 200 3 a 1 W 400 c 44 v = M 2 2 π 2 315 5 ( 7 a 2 + a 3 ) W 200 + 24 a 1 W 400 c 66 v = c 11 v c 12 v 2
where W 200 and W 400 are two Legendre coefficients; a 1 = c 11 a + c 33 a 2 c 13 a c 44 a , a 2 = c 11 a c 12 a + 2 c 13 a 2 c 44 a , a 3 = 4 c 11 a 3 c 33 a c 13 a 2 c 44 a , L = 1 15 c 11 a + c 33 a + 5 c 12 a + 8 c 13 a 4 c 44 a , M = 1 30 7 c 11 a + 2 c 33 a 5 c 12 a 4 c 13 a + 12 c 44 a ; c i j a is the tensor for the domain, whose components are all fully aligned. For the VTI medium, the following applies:
W 200 = 5 2 1 1 W ( ξ ) P 2 ( ξ ) d ξ
W 400 = 9 2 1 1 W ( ξ ) P 4 ( ξ ) d ξ
where ξ = cos ϕ , and ϕ indicates the included angle between the major axis of inclusions and the plane of layers; W ( ξ ) is the orientation distribution function, which provides the probability density for a particular orientation. W ( ξ ) can be reconstructed by a Gaussian ODF [28]:
W ( ξ ) = f G ( ϕ ) + f G ( π ϕ ) 4 π
f G ( ϕ ) = k G σ exp 1 2 ϕ σ 2
where k G σ is a normalization coefficient; σ is the standard deviation of ϕ , named the orientation parameter in this paper. The orientation parameter decides the preferred orientation condition of inclusions.
The tensor for the domain whose components are all fully aligned ( c i j a ) can be calculated by the anisotropic SCA:
c a = n = 1 N v n c n I + G ^ c n c a 1 p = 1 N v p I + G ^ c p c a 1 1
where each n and p indicates an inclusion with the volume fraction v; tensor G ^ is decided by the geometry of the inclusion.

2.3. The Compaction Model for Shale Velocity Modeling

Due to the preferred orientation of clay minerals, the velocities of shale are affected by the anisotropy. Thus, a new rock physics model is necessary to obtain accurate velocity estimation for shale. The Xu–White model, a common choice for velocity modeling, has been evaluated as the best V S predictor [41]. However, this model is only applied to an isotropic medium. In recent years, experiments have validated the application of the isotropic rock physics model to a weak anisotropic medium, including the Hudson model and Eshelby–Cheng model [39,40]. In these research studies, the anisotropic P- and S-wave velocities with a weak anisotropic background are averaged to obtain effective isotropic P- and S-wave velocities, from which the moduli of background are obtained and then used in the isotropic rock physics model. Based on the above research, the rock physics model is built as follows:
(1) Clay and kerogen are first mixed together using the anisotropic SCA (Equation (18)) to form the fully aligned background of shale, whose tensor is indicated as C b a . Kerogen and clay often intermingle with each other and form the background of shale. Moreover, similar to clay minerals, kerogen can also be regarded as ellipsoid and has a preferred orientation [8].
(2) The ODF is utilized to model the preferred orientation of a clay and kerogen mixture to form the anisotropic background with partly aligned inclusions. The orientation parameter σ determines the tensor of the mixture, which is indicated as C b p . Anisotropic velocities of the background are indicated as V P 0 ° , V SH 0 ° , V P 90 ° , and V SH 90 ° .
(3) It is important to obtain the effective isotropic P- and S-wave velocities ( V P e and V S e ) to form the effective isotropic background: V P e = [ V P 0 ° + V P 90 ° ] / 2 , V S e = [ V SH 0 ° + V SH 90 ° ] / 2 . Then, the bulk and shear moduli of the effective isotropic background ( K 0 e and μ 0 e ) are obtioned using Equations (1) and (2).
(4) The effective isotropic background and silt minerals of shale are mixed together to form the matrix, whose bulk and shear moduli ( K 1 and μ 1 ) are obtained using Hill’s average.
(5) Clay-related pores and sand-related pores are added into the matrix using the Xu–White model to obtain the bulk and shear moduli of the dry shale ( K 2 and μ 2 ).
(6) Gassmann’s equation (Equations (9) and (10)) is applied to obtain the bulk and shear moduli of fluid saturated shale ( K 3 and μ 3 ). Then, the P- and S-wave velocities of fluid-saturated shale ( V P and V S ) are calculated from the moduli.
(7) The effect of the effective isotropic background is substituted with the anisotropic background to model the effects of preferred orientation clay and kerogen on the velocities of shale. Although anisotropic velocities of the background are averaged to obtain the effective isotropic velocities for the Xu–White model, measured wave velocities from well logging are directional and parallel to the symmetry axis of shale. So, velocities of the background should be substituted to recover the effects of preferred orientation clay and kerogen on the measured velocities.
The time average is a simple but common choice used to determine the integrity attribute of rock from its components’ properties. In the Xu–White model, the moduli of the matrix are provided by the time-average method [10,11]. Similarly, Wyllie’s equation provides the P-wave velocity of rock from velocities of matrix and pores using the time-average method [45]. Here, velocities of the fluid-saturated shale can also be provided by the effective isotropic background and the inclusions based on the time average:
T P = 1 f c T P i + f c T P e
T S = 1 f c T S i + f c T S e
where T P and T S are the reciprocal value of V P and V S in step 6, respectively; f c is the total volume fraction of clay and kerogen; T P i and T S i are the P- and S-wave transit times of inclusions; and T P e and T S e are the P- and S-wave transit times of the effective isotropic background in step 3.
For real fluid-saturated anisotropic shale, wave velocities from well logging should be described by the velocities parallel to the symmetry axis of shale and the time average:
T ˜ P = 1 f c T P i + f c T P 0 °
T ˜ S = 1 f c T S i + f c T SH 0 °
where T ˜ P and T ˜ S are vertical incidence P- and S-wave transit times of shale considering the preferred orientation of clay; T P 0 ° and T SH 0 ° are the vertical incidence P- and S-wave transit times of the anisotropic background. Here, the P- and S-wave transit times of inclusions are assumed not to be affected by the background. Combining Equations (19)–(22), the formulae for vertical-incidence P- and S-wave velocities ( V ˜ P and V ˜ S ) of shale considering the preferred orientation of clay are
V ˜ P = 1 1 V P f c V P e + f c V P 0 °
V ˜ S = 1 1 V S f c V S e + f c V SH 0 °
The velocities V ˜ P and V ˜ S are modeled velocities in well logging of shale.
The above processes are used to build a rock physics model for the velocity modeling of shale, which is named the compaction model. The compaction model considers the effect of preferred orientation clay minerals, which can be applied to S-wave velocity estimation for shale.

2.4. S-Wave Velocity Estimation for Shale Based on the Compaction Model

The rock physics model builds the relationship between the wave velocities and microstructures of shale. The properties of microstructures are necessary for velocity estimation based on the rock physics model. Although well logging provides a significant amount of information on the microstructures of shale, some important factors are unavailable from the measurements, such as the aspect ratio of pores and the orientation condition of clay minerals. In the Xu–White model, the aspect ratio of clay-related pores ( α c ) significantly affects the velocities of shale, but the effect of the aspect ratio of sand-related pores ( α s ) is not significant [17]. The reason for this is that clay minerals always have pores with a small aspect ratio, but sand tends to form pores with a large aspect ratio [10,42].
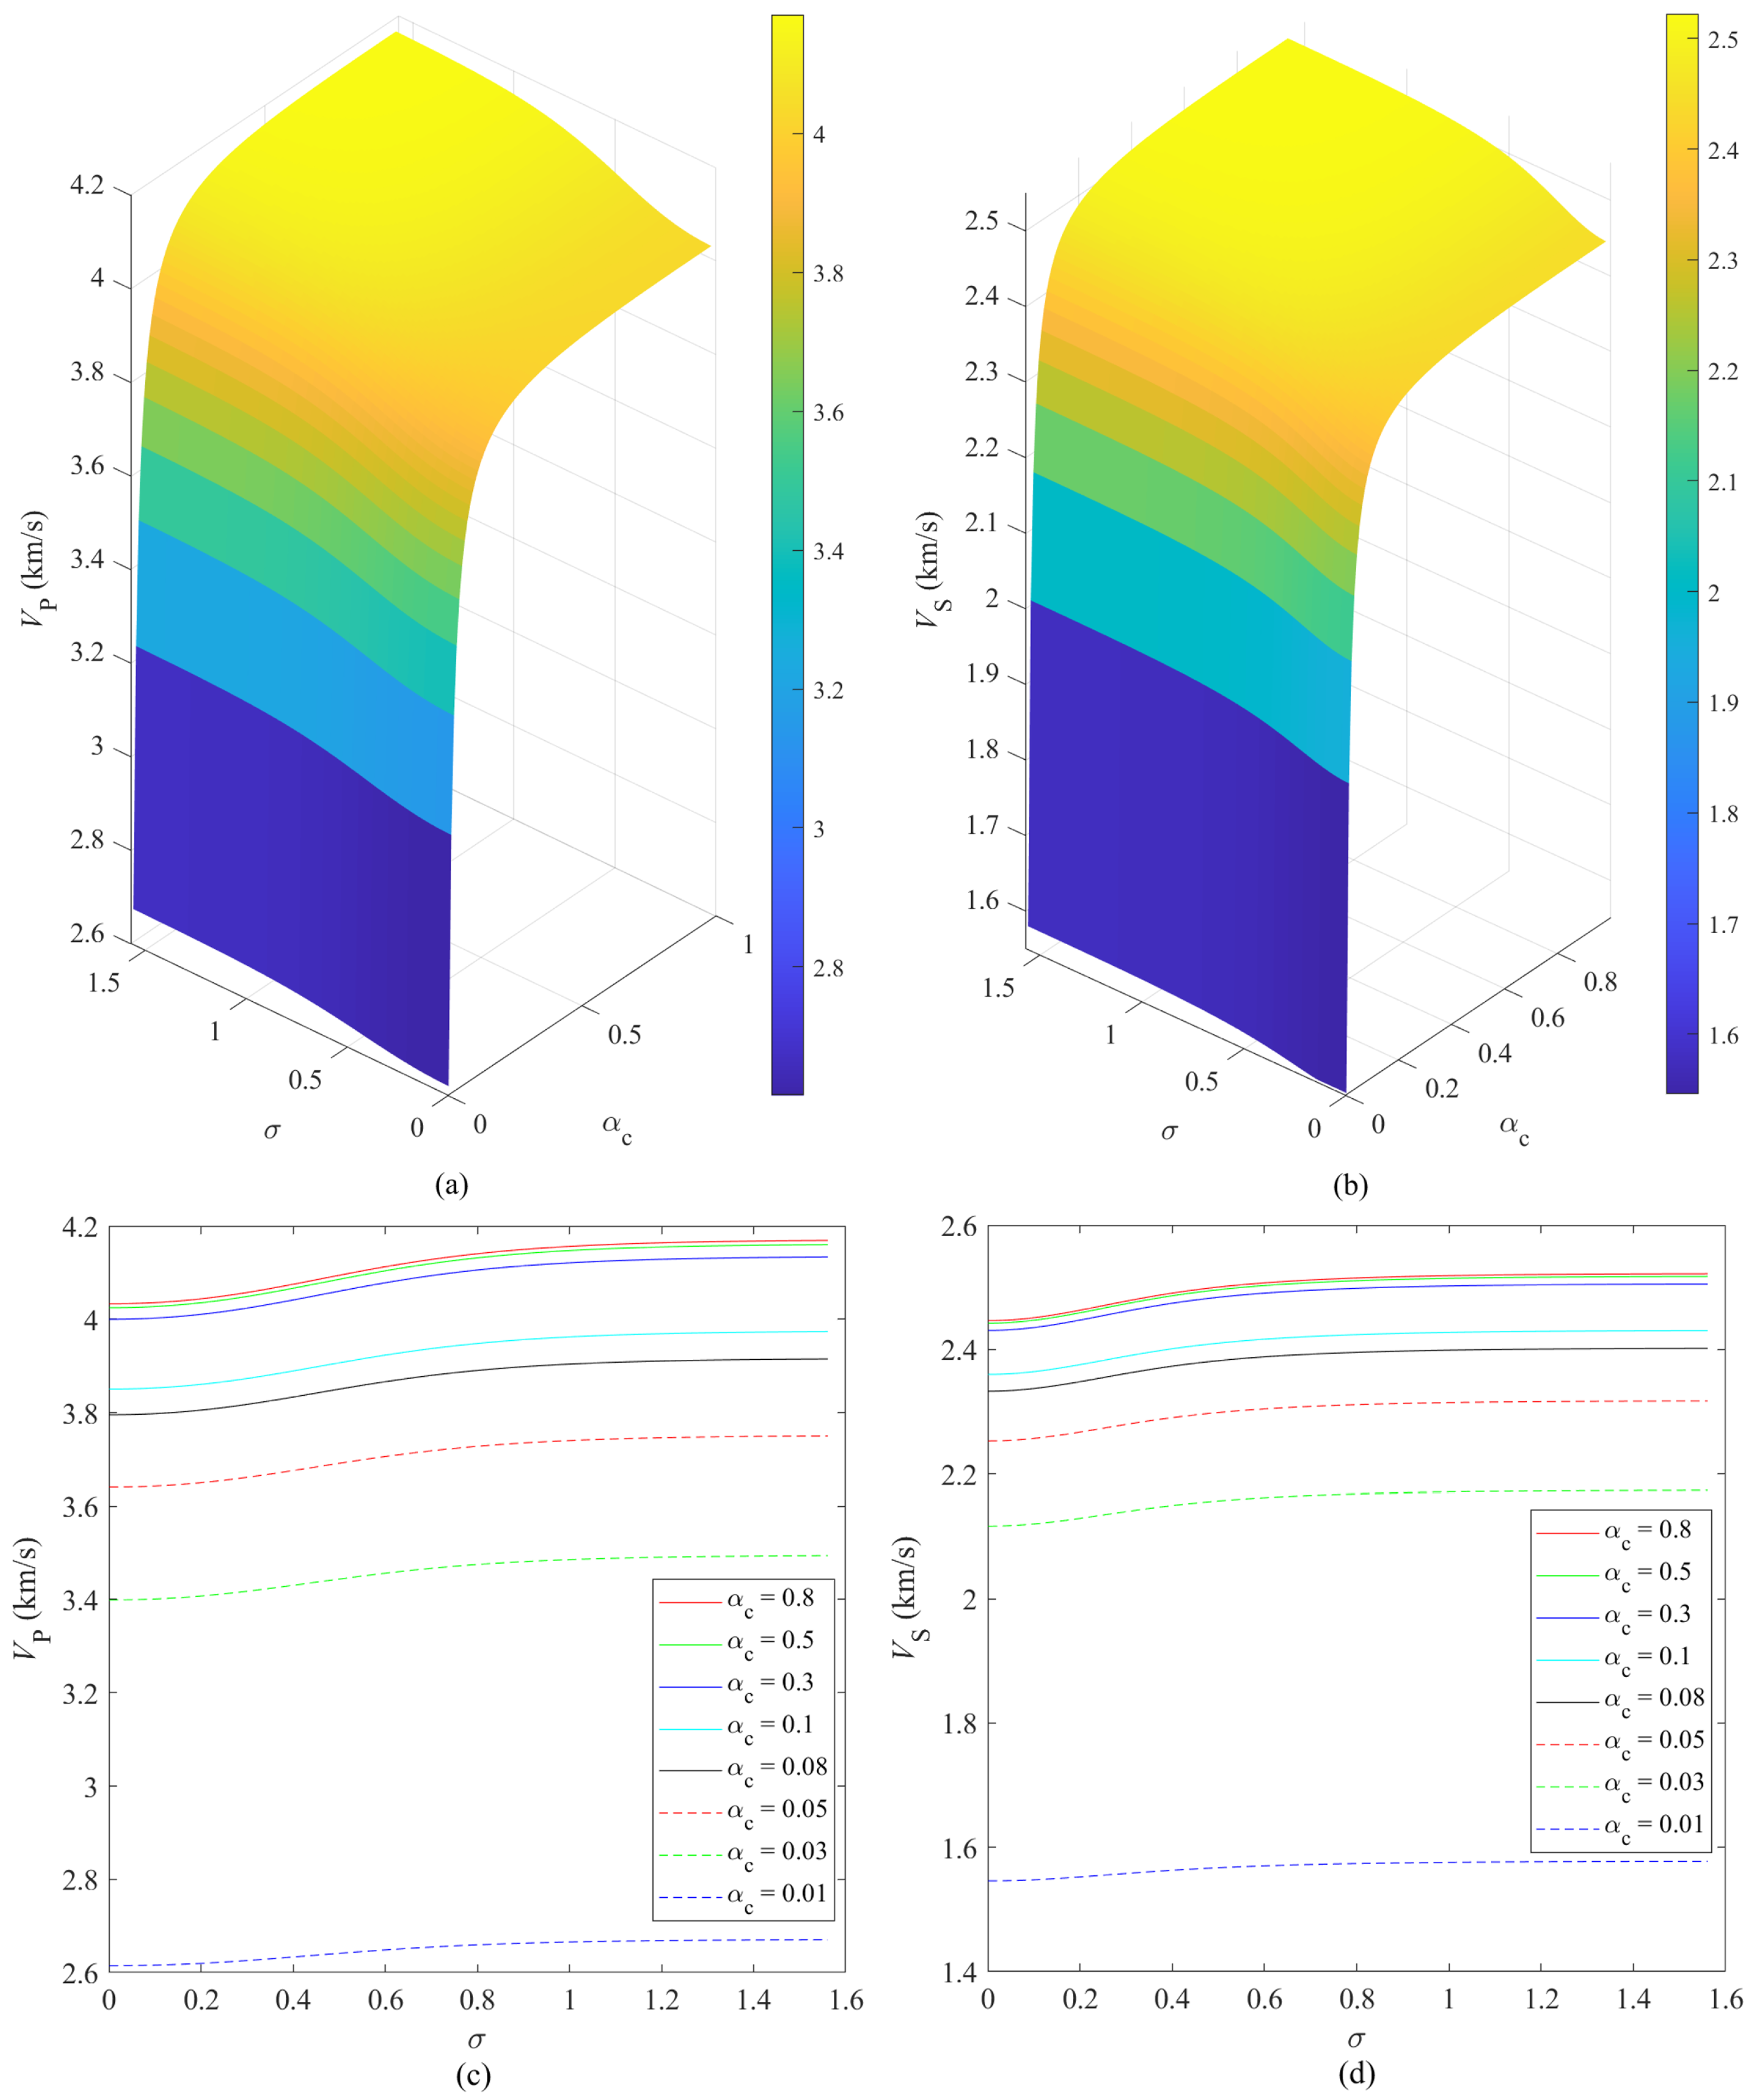
The P- and S-wave velocities of shale modeled by the compaction model with different aspect ratios of clay-related pores ( α c ) and orientation parameters ( σ ) are presented in Figure 2. In the process, α s is provided by the following formula [17,46]:
α s = 0.17114 0.24477 ϕ + 0.004314 f s
Figure 2 shows that P- and S-wave velocities increase with α c and σ . The velocities increase rapidly with α c when α c is smaller than 0.05. However, the increase is slower when α c is bigger than 0.05. This is reflected in the speed variation in the surface elevation (Figure 2a,b) and the positional changes of the differently colored curves along the y-axis (Figure 2c,d). Meanwhile, the velocities increase with σ . Compared with the effect of α c , the contribution of σ cannot be ignored, especially for bigger α c . Thus, to model the velocities of shale, both α c and σ are important and need to be determined.
In shale reservoirs, the S-wave velocity is always estimated based on well logging data of the P-wave velocity and other properties of shale. The properties of shale are utilized to initialize the rock physics model. The important factors unavailable from measurements are obtained from the objective function:
α c , σ = arg min V ˜ P V Pm
where V ˜ P is the modeled P-wave velocity of shale from the compaction model, and V P m is the measured P-wave velocity. The particle swarm optimization algorithm improved by simulated annealing (SA-PSO) is utilized in this study to solve the objective function. Zhang et al. [17] provided details of this algorithm in the Appendix. Then, the S-wave velocity is estimated based on the inversion result and compaction model. Figure 3 presents the workflow of the method, in which α c and σ are valued form 0 ,   1 and 0 ,   π 2 , respectively.

3. Result and Discussion

3.1. Model Test Using Laboratory Data

The S-wave velocity estimation method was first verified by laboratory data from a shale gas reservoir. The moduli and densities of rock components are presented in Table 1. The objective function used for the estimation is Equation (26), in which the modeled P-wave velocity approximates the measured P-wave velocity in Figure 4a. The estimated and measured S-wave velocities are shown in Figure 4b. The Xu–White model with the variable α c is also utilized here as a reference. In Figure 4a, the P-wave velocity calculated from the compaction model is very close to the measured P-wave velocity. In Figure 4b, the S-wave velocity estimated from the compaction model matches well with the measured S-wave velocity, which is better than the Xu–White model.
The root mean square error (RMSE) and correlation coefficient (r) are usually applied to quantify errors between the estimation and measurements. Their formulae are as follows:
RMSE = 1 N i = 1 N V i ˜ V i V i
r = c o v V ˜ , V δ V ˜ δ V
where i indicates sample points, and N indicates the total number of sample points; V i ˜ and V i are corresponding estimated and measured velocities, respectively; c o v · indicates covariance; δ indicates the standard deviation of velocities. For the laboratory data, the RMSE of P-wave velocities from the compaction model and Xu–White model are 0.0011 and 0.0653, respectively. For the S-wave velocities from the compaction model and Xu–White model, the RMSEs are 0.0305 and 0.0828, respectively. The quantification of errors between estimated and measured velocities shows the validity and superiority of the compaction model in S-wave velocity estimation for shale. The modeling and calculation presented in this study were implemented by utilizing MATLAB R2024b software (MathWorks, Inc., Natick, MA, USA) on a PC. Alternative programming languages may also be employed during the implementation phase.

3.2. Application in a Shale Gas Reservoir

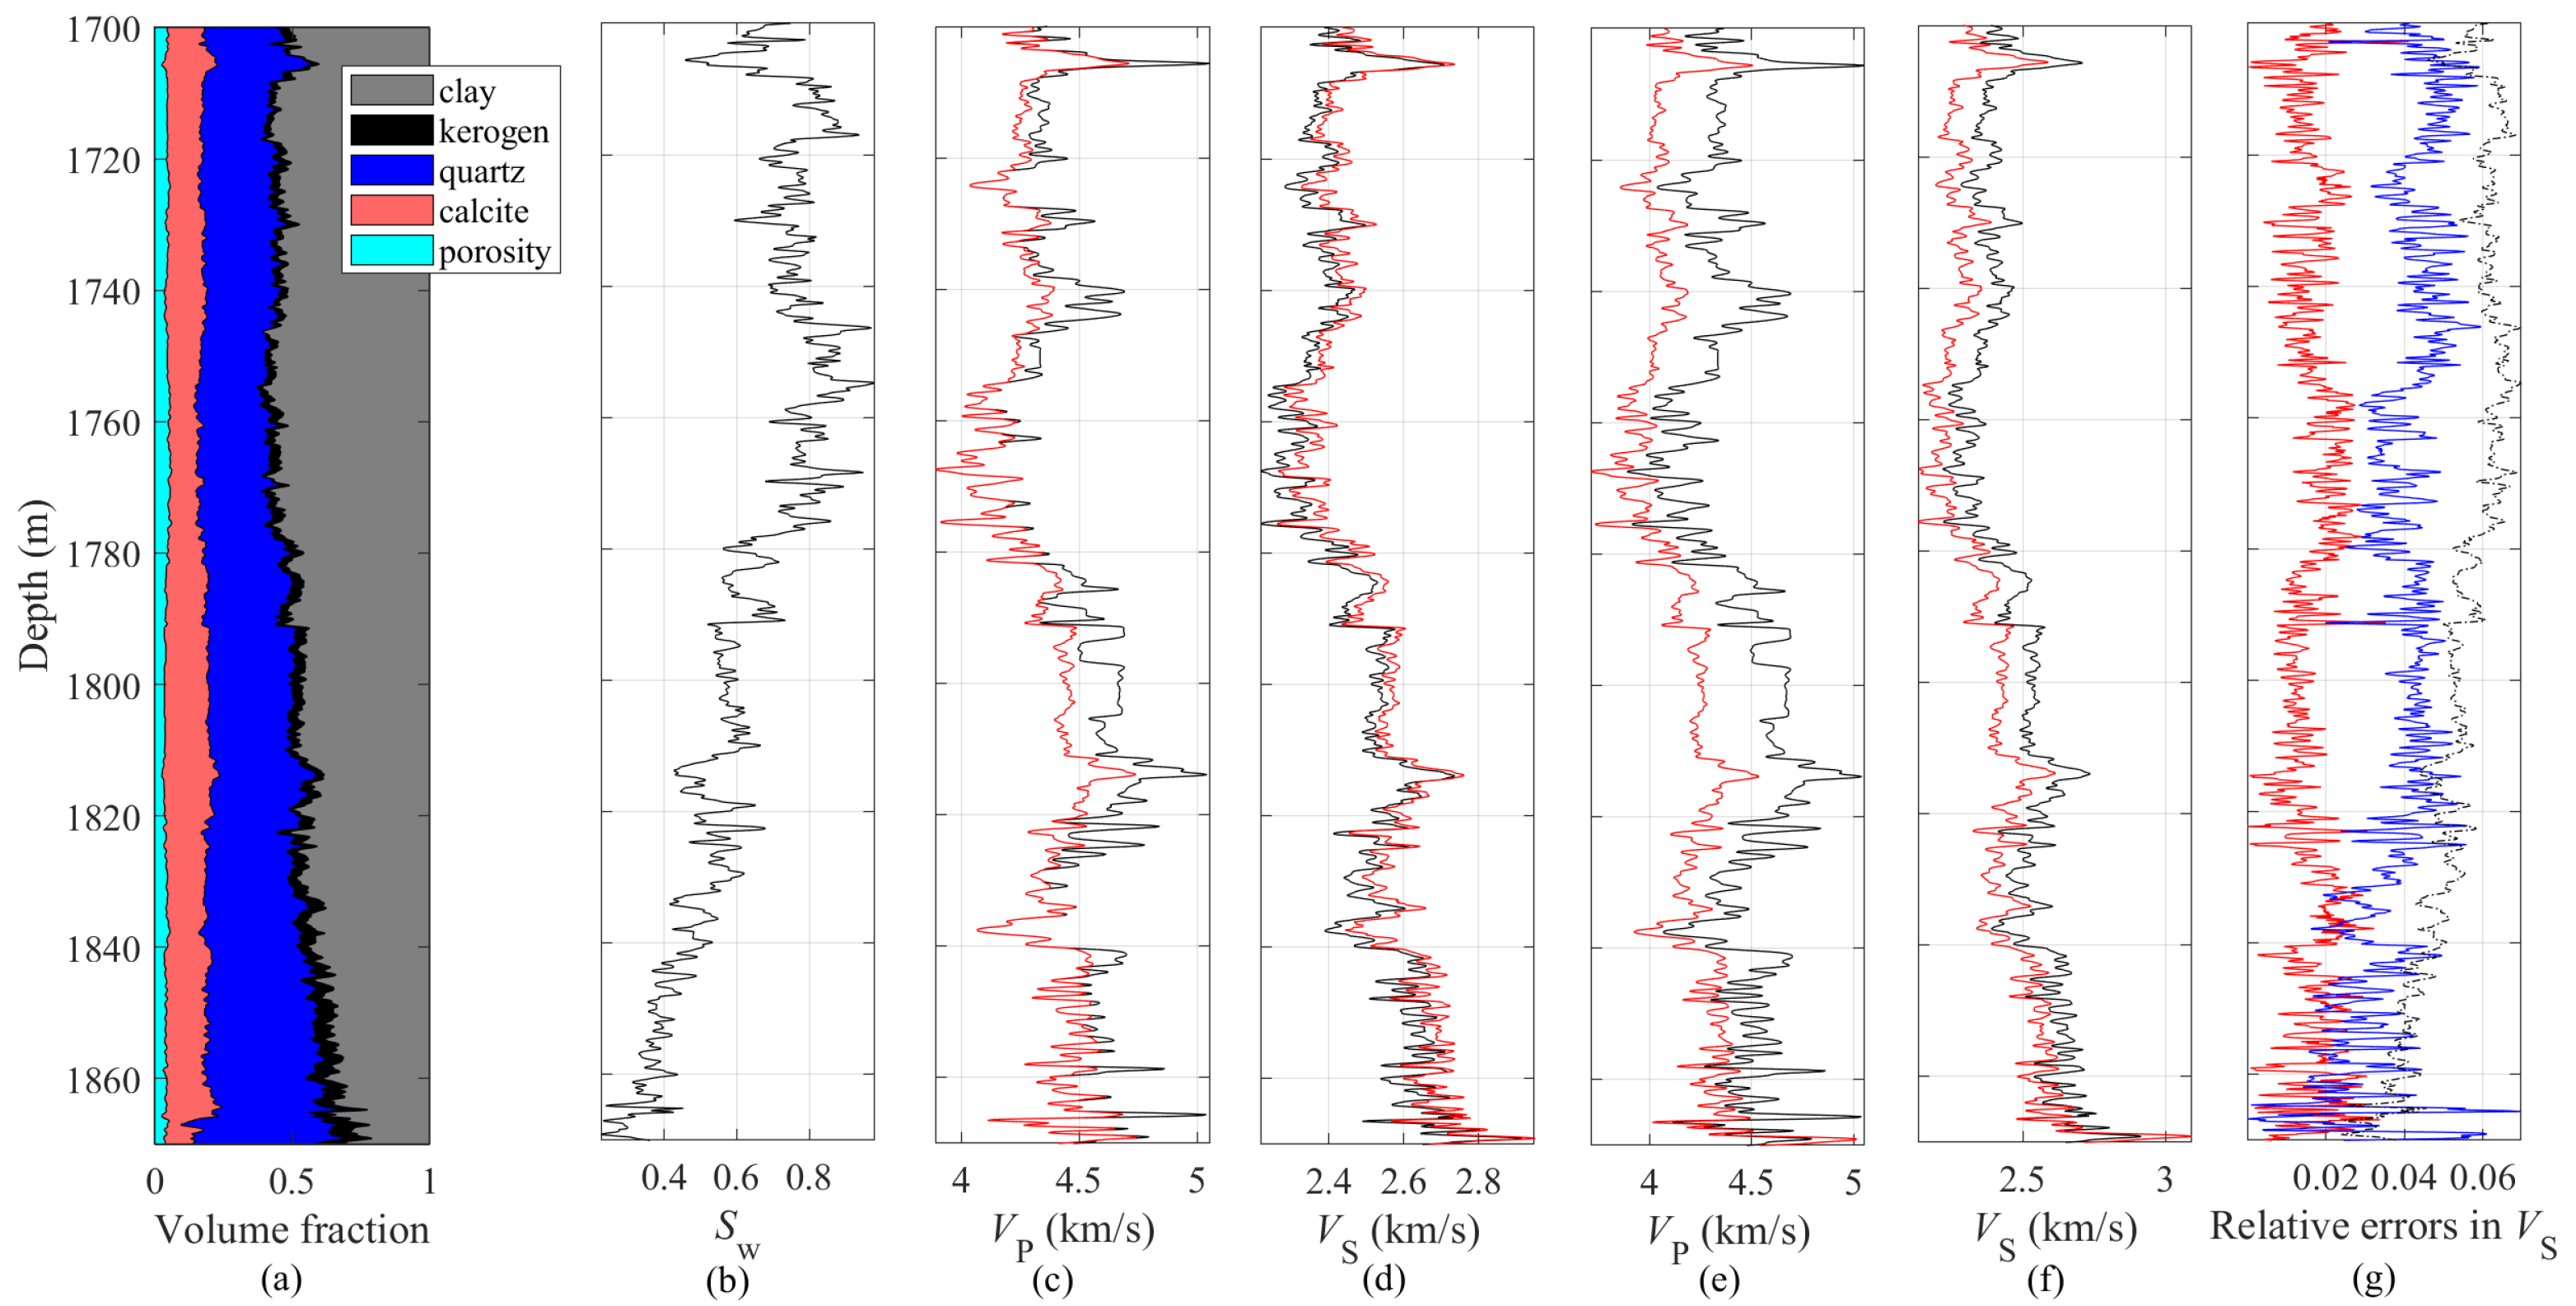
The S-wave velocity estimation method based on the compaction model was applied to a shale gas reservoir in the south of China. Most wells in the reservoir adopt conventional well logging, and their silt minerals are simply identified. We used two conventional wells to validate the proposed method for conventional well logging of shale reservoirs. Figure 5 and Figure 6 show the well logging data of well 1 and well 2. The volume fraction of clay mineral is about 0.4–0.6 in the upper section of well 1, while the volume fraction in the lower section is about 0.25–0.4. The volume fractions of kerogen in the upper section and the bottom of well 1 are about 0.05 and 0.1, respectively, which indicates that the bottom is a gas-rich section. The modeled P-wave velocity based on the compaction model is very close to the measured P-wave velocity, except for section 1440–1450, and this result is much better than the Xu–White model. The estimated S-wave velocity based on the compaction model has small errors and good correlation with the measured S-wave velocity. The estimation of S-wave velocity is improved by the proposed method compared with the Xu–White model in the whole well section, especially in section 1400–1450. Relative errors between the estimated S-wave velocity and real data using the two methods, which were calculated using Equation (29), are presented in Figure 5g. Relative errors from the compaction model are about 0.02 for the whole well logging, whereas the errors from the Xu–White model are obviously greater. The volume fraction of clay mineral is normalized by Equation (30) to be presented with errors.
R e = V ˜ S V Sm V Sm
f clay n = f clay max R e
where R e is the relative error of S-wave velocity estimation; V ˜ S is the estimated S-wave velocity; V Sm is the measured S-wave velocity; f clay n is the normalized volume fraction of clay; f clay is the volume fraction of clay.
It is noticeable that the relative errors from the Xu–White model are related to the volume fraction of clay. Moreover, the relative errors increase with the volume fraction. However, the relative errors from the compaction model are not affected by the volume fraction of clay. The result of well 1 indicates that the compaction model reduces the error deduced by the preferred orientation of clay and improves the accuracy of S-wave velocity estimation. The estimation of S-wave velocity for well 2 is presented in Figure 6, which is similar to well 1. A quantitative evaluation of the estimation result for the two wells is presented in Table 2. The RMSE between the calculated and measured velocities of well 1 and well 2 decreases by half when using the compaction model. Meanwhile, r of well 1 and well 2 slightly increases and is approximately 1. The above results of the two wells indicate the validity and accuracy of the S-wave velocity estimation method for shale based on the compaction model.
The proposed method was also applied in a high-quality well logging from the shale gas reservoir. High-quality well logging uses unconventional logging methods and provides core samples. Therefore, information of shale in these wells is more sufficient and accurate. The estimation result of high-quality well logging, named well 3, is presented in Figure 7. The mineral information of well 3 is more accurate than conventional wells. The compaction model and Xu–White model are utilized in well 3. Calculated P-wave and S-wave velocities, as well as the relative errors, are also presented. The RMSE and r of the estimation are provided in Table 2. The estimation based on the compaction model is significantly better than the Xu–White model. The calculated P-wave velocity is almost identical to the measured P-wave velocity, whose RMSE is 0.0009 and r is 0.9999. S-wave velocity estimation is improved based on the compaction model, whose RMSE decreases by over half, and r increases compared with the Xu–White model. Meanwhile, the improvement in S-wave estimation based on the compaction model is related to the volume fraction of clay. The result of the high-quality well logging is consistent with the two conventional well loggings.

4. Conclusions

An S-wave velocity estimation method for shale is proposed in this study. This method takes the effect of the preferred orientation clay minerals on the velocities of shale into account, which improves the accuracy of S-wave velocity estimation for shale. A compaction model is developed based on the ODF and Xu–White model to model the effects of the orientation distribution of clay minerals and aspect ratio of pores on the velocities of shale. It should be noted that the compaction model is only applicable to a weak anisotropic medium. Then, the workflow of S-wave velocity estimation for shale based on the compaction model is summarized. The proposed method is validated by laboratory data and an actual shale gas reservoir, with a result obviously better than the Xu–White model.
Clay is a main component of shale, and its preferred orientation is ubiquitous. This study indicates that the error of S-wave velocity estimation based on the traditional method is related to the volume fraction of clay. But this correlation vanishes using the proposed method; moreover, the error almost halves. The correction of the effect of preferred orientation clay minerals on the velocities of shale will improve velocity modeling, which can provide more accurate information for the following processes of shale reservoir characterization.

Author Contributions

Conceptualization, B.Z.; methodology, B.Z.; software, M.L.; validation, B.Z.; formal analysis, B.Z.; investigation, B.Z.; resources, C.L.; data curation, C.L.; writing—original draft preparation, B.Z.; writing—review and editing, B.Z.; visualization, Z.Y.; supervision, C.L.; project administration, Y.Q.; funding acquisition, B.Z. All authors have read and agreed to the published version of the manuscript.

Funding

This research was funded by the Open Topics of Research Platform from the Grain Information Processing Center of Henan University of Technology (KFJJ2022016), the Key Scientific Research Project of Colleges and Universities in Henan Province (23A170012), and the Research Foundation for Advanced Talents of Henan University of Technology (2021BS037).

Data Availability Statement

The original contributions presented in this study are included in the article. Further inquiries can be directed to the corresponding author.

Conflicts of Interest

The authors declare no conflicts of interest.

References

  1. Han, H.; He, C.; Xiao, S.; Chen, J.; Kalmykov, A.; Wu, W.; Wang, Y.; Wang, J. The Formation of Organic Matter Pores in Shales: Implications from Combined Thermal Heating and Scanning Electron Microscopy Imaging. Minerals 2025, 15, 336. [Google Scholar] [CrossRef]
  2. Peng, S.; Feng, C.; Qiu, Z.; Zhang, Q.; Liu, W.; Feng, J.; Hu, Z. Prediction of Lithofacies in Heterogeneous Shale Reservoirs Based on a Robust Stacking Machine Learning Model. Minerals 2025, 15, 240. [Google Scholar] [CrossRef]
  3. Schuster, G.T.; Li, J.; Lu, K.; Metwally, A.; AlTheyab, A.; Hanafy, S. Opportunities and pitfalls in surface-wave interpretation. Interpretation 2017, 5, T131–T141. [Google Scholar] [CrossRef]
  4. Guo, Z.; Lv, X.; Liu, C.; Liu, X.; Liu, Y. Prediction of organic richness in shale gas reservoirs using a novel organic-inorganic decoupling seismic inversion method. Gas Sci. Eng. 2023, 110, 204864. [Google Scholar] [CrossRef]
  5. Tan, M.; Peng, X.; Cao, H.; Wang, S.; Yuan, Y. Estimation of shear wave velocity from wireline logs in gas-bearing shale. J. Pet. Sci. Eng. 2015, 133, 352–366. [Google Scholar] [CrossRef]
  6. Sethi, C.; Motra, H.B.; Hazra, B.; Ostadhassan, M. Influence of lithological contrast on elastic anisotropy of shales under true-triaxial stress and thermal conditions. Int. J. Rock Mech. Min. Sci. 2025, 190, 106100. [Google Scholar] [CrossRef]
  7. Vernik, L.; Anantharamu, V. Estimating the elastic properties of mica and clay minerals. Geophysics 2020, 85, MR83–MR95. [Google Scholar] [CrossRef]
  8. Sayers, C.M. The effect of kerogen on the elastic anisotropy of organic-rich shales. Geophysics 2013, 78, D65–D74. [Google Scholar] [CrossRef]
  9. Ding, J.; Clark, A.C.; Vanorio, T.; Jew, A.D.; Bargar, J.R. Elastic anisotropy of shales: The roles of crack alignment and compliance ratio. Geophysics 2022, 87, A13–A17. [Google Scholar] [CrossRef]
  10. Xu, S.; White, R.E. A new velocity model for clay-sand mixtures. Geophys. Prospect. 1995, 43, 91–118. [Google Scholar] [CrossRef]
  11. Xu, S.; White, R.E. A physical model for shear-wave velocity prediction. Geophys. Prospect. 1996, 44, 687–717. [Google Scholar] [CrossRef]
  12. Xu, S.; Payne, M.A. Modeling elastic properties in carbonate rocks. Lead. Edge 2009, 28, 66–74. [Google Scholar] [CrossRef]
  13. Berryman, J.G. Long-wavelength propagation in composite elastic media II. Ellipsoidal inclusions. J. Acoust. Soc. Am. 1980, 68, 1820–1831. [Google Scholar] [CrossRef]
  14. Norris, A. A differential scheme for the effective moduli of composites. Mech. Mater. 1985, 4, 1–16. [Google Scholar] [CrossRef]
  15. Ruiz, F.; Dvorkin, J. Predicting elasticity in nonclastic rocks with a differential effective medium model. Geophysics 2010, 75, E41–E53. [Google Scholar] [CrossRef]
  16. Vernik, L.; Castagna, J.; Omovie, S.J. S-wave velocity prediction in unconventional shale reservoirs. Geophysics 2018, 83, MR35–MR45. [Google Scholar] [CrossRef]
  17. Zhang, B.; Jin, S.; Liu, C.; Guo, Z.; Liu, X. Prediction of shear wave velocity based on a statistical rock-physics model and Bayesian theory. J. Pet. Sci. Eng. 2020, 195, 107710. [Google Scholar] [CrossRef]
  18. Qiao, H.; Zhang, B.; Liu, C. Research on Prediction Method of Volcanic Rock Shear Wave Velocity Based on Improved Xu-White Model. Energies 2022, 15, 3611. [Google Scholar] [CrossRef]
  19. Liu, Z.S.; Lu, H.; Liu, J.Z.; Bao, Q.Z.; Shi, L.; Wang, Z.Y. Estimation of S-wave velocity from wire-line logs for organic-rich rocks. J. Pet. Sci. Eng. 2021, 205, 108928. [Google Scholar] [CrossRef]
  20. Miah, M.I.; Ahmed, S.; Zendehboudi, S. Model development for shear sonic velocity using geophysical log data: Sensitivity analysis and statistical assessment. J. Nat. Gas Sci. Eng. 2021, 88, 103778. [Google Scholar] [CrossRef]
  21. Zhang, J.; Liu, Z.; Zhou, Y.; Ai, H.; Han, H. Joint Inversion Method of Rock Physics Based on Hunger Games Search Correction and Bidirectional Long-Short-Term Memory Network. IEEE Trans. Geosci. Remote Sens. 2024, 62, 5914310. [Google Scholar] [CrossRef]
  22. Zhao, L.; Liu, J.; Xu, M.; Zhu, Z.; Chen, Y.; Geng, J. Rock-physics-guided machine learning for shear sonic log prediction. Geophysics 2024, 89, D75–D87. [Google Scholar] [CrossRef]
  23. Dang, Y.; Zhang, Y.; Wu, B.; Li, H.; Gao, J. An efficient method of predicting S-wave velocity using sparse Gaussian process regression for a tight sandstone reservoir. J. Appl. Geophys. 2024, 229, 105480. [Google Scholar] [CrossRef]
  24. Fang, Z.; Ba, J.; Guo, Q.; Xiong, F. Shear-wave velocity prediction of tight reservoirs based on poroelasticity theory: A comparative study of deep neural network and rock physics model. Geoenergy Sci. Eng. 2024, 240, 213028. [Google Scholar] [CrossRef]
  25. Wang, Z. Seismic anisotropy in sedimentary rocks, part 2: Laboratory data. Geophysics 2002, 67, 1423–1440. [Google Scholar] [CrossRef]
  26. Hornby, B.E.; Schwartz, L.M.; Hudson, J.A. Anisotropic effective-medium modeling of the elastic properties of shales. Geophysics 1994, 59, 1570–1583. [Google Scholar] [CrossRef]
  27. Sayers, C. Anisotropic velocity analysis1. Geophys. Prospect. 1995, 43, 541–568. [Google Scholar] [CrossRef]
  28. Johansen, T.A.; Ruud, B.O.; Jakobsen, M. Effect of grain scale alignment on seismic anisotropy and reflectivity of shales. Geophys. Prospect. 2004, 52, 133–149. [Google Scholar] [CrossRef]
  29. Bachrach, R. Elastic and resistivity anisotropy of shale during compaction and diagenesis: Joint effective medium modeling and field observations. Geophysics 2011, 76, E175–E186. [Google Scholar] [CrossRef]
  30. Pan, X.P.; Zhang, G.Z.; Chen, J.J. The construction of shale rock physics model and brittleness prediction for high-porosity shale gas-bearing reservoir. Pet. Sci. 2020, 17, 658–670. [Google Scholar] [CrossRef]
  31. Bandyopadhyay, K. Seismic Anisotropy: Geological Causes and Its Implications to Reservoir Geophysics. Ph.D. Thesis, Stanford University, Stanford, CA, USA, 2009. [Google Scholar]
  32. Qian, K.; Zhang, F.; Chen, S.; Li, X.; Zhang, H. A rock physics model for analysis of anisotropic parameters in a shale reservoir in Southwest China. J. Geophys. Eng. 2016, 13, 19–34. [Google Scholar] [CrossRef]
  33. Hudson, J.A. Overall properties of a cracked solid. Math. Proc. Camb. Philos. Soc. 1980, 88, 371–384. [Google Scholar] [CrossRef]
  34. Cheng, C.H. Crack models for a transversely isotropic medium. J. Geophys. Res. Solid Earth 1993, 98, 675–684. [Google Scholar] [CrossRef]
  35. Qian, K.R.; He, Z.L.; Chen, Y.Q.; Liu, X.W.; Li, X.Y. Prediction of brittleness based on anisotropic rock physics model for kerogen-rich shale. Appl. Geophys. 2017, 14, 463–479. [Google Scholar] [CrossRef]
  36. Zhang, F.; Li, X.y.; Qian, K. Estimation of anisotropy parameters for shale based on an improved rock physics model, part 1: Theory. J. Geophys. Eng. 2017, 14, 143–158. [Google Scholar] [CrossRef]
  37. Mavko, G.; Mukerji, T.; Dovorkin, J. The Rock Physics Handbook-Tools for Seismic Analysis of Porous Media, 2nd ed.; Cambridge University Press: Cambridge, UK, 2009. [Google Scholar]
  38. Keys, R.G.; Xu, S. An approximation for the Xu-White velocity model. Geophysics 2002, 67, 1406–1414. [Google Scholar] [CrossRef]
  39. de Figueiredo, J.J.S.; do Nascimento, M.J.S.; Hartmann, E.; Chiba, B.F.; da Silva, C.B.; de Sousa, M.C.; Silva, C.; Santos, L.K. On the application of the Eshelby-Cheng effective model in a porous cracked medium with background anisotropy: An experimental approach. Geophysics 2018, 83, C209–C220. [Google Scholar] [CrossRef]
  40. de Figueiredo, J.; Chiba, B.F.; do Nascimento, M.J.; da Silva, C.B.; Santos, L.K. Can Hudson-Crampin effective model be applied in cracked medium in which the background is weakly anisotropic (VTI)? J. Appl. Geophys. 2019, 161, 255–260. [Google Scholar] [CrossRef]
  41. Sohail, G.M.; Hawkes, C.D. An evaluation of empirical and rock physics models to estimate shear wave velocity in a potential shale gas reservoir using wireline logs. J. Pet. Sci. Eng. 2020, 185, 106666. [Google Scholar] [CrossRef]
  42. Bai, J.Y.; Yue, C.Q.; Liang, Y.Q.; Song, Z.X.; Ling, S.; Zhang, Y.; Wu, W. Variable aspect ratio method in the Xu-White model for shear-wave velocity estimation. J. Geophys. Eng. 2013, 10, 035008. [Google Scholar] [CrossRef]
  43. Hill, R. The Elastic Behaviour of a Crystalline Aggregate. Proc. Phys. Soc. Sect. A 1952, 65, 349–354. [Google Scholar] [CrossRef]
  44. Gassmann, F. Uber die elastizität poröser medien. Viertel. Naturforsch. Ges. Zürich 1951, 96, 1–23. [Google Scholar]
  45. Wyllie, M.R.J.; Gregory, A.R.; Gardner, G.H.F. An experimental investigation of factors affecting elastic wave velocities in porous media. Geophysics 1958, 23, 459–493. [Google Scholar] [CrossRef]
  46. Pillar, N.; Yan, J.; Lubbe, R. Variable Aspect Ratio Method in the Xu-White Model for AVO. In Proceedings of the 69th EAGE Conference and Exhibition Incorporating SPE EUROPEC 2007, London, UK, 11–14 June 2007; European Association of Geoscientists and Engineers: Bunnik, The Netherlands, 2007. [Google Scholar] [CrossRef]
Figure 1. The scanning electron microscope (SEM) image of shale. (a) Clay and kerogen mixture and pores; (b) silt mineral and pores included in the background. The image shows a preferred orientation plate-like clay and kerogen mixture, pores with different aspect ratios, and spherical-like silt minerals.
Minerals 15 00738 g001
Figure 2. (a,b) are the modeled P- and S-wave velocities of shale with different aspect ratios of clay-related pores ( α c ) and orientation parameters ( σ ). (c,d) are the profiles of modeled P- and S-wave velocities of shale with different σ and selected α c . The shale is made up of clay, kerogen, quartz, and pores, with volume fractions of 0.4, 0.1, 0.45, and 0.05, respectively.
Minerals 15 00738 g002
Figure 3. Workflow of S-wave velocity estimation based on the compaction model and well logging data for shale with orientation clay minerals.
Minerals 15 00738 g003
Figure 4. Crossplot of modeled velocities based on the compaction model and Xu–White model using laboratory data. (a) P-wave velocities; (b) S-wave velocities.
Minerals 15 00738 g004
Figure 5. Estimation of S-wave velocity for well 1. From left to right: (a) volume fraction of components; (b) fluid saturation; (c,d) estimated velocities based on the compaction model (red) and measured velocities (black); (e,f) estimated velocities based on the Xu–White model (red) and measured velocities (black); and (g) errors from the compaction model (red) and Xu–White model (blue), as well as the normalized volume fraction of clay (dotted black).
Minerals 15 00738 g005
Figure 6. Estimation of S-wave velocity for well 2. From left to right: (a) volume fraction of components; (b) fluid saturation; (c,d) estimated velocities based on the compaction model (red) and measured velocities (black); (e,f) estimated velocities based on the Xu–White model (red) and measured velocities (black); and (g) errors from the compaction model (red) and Xu–White model (blue), as well as the normalized volume fraction of clay (dotted black).
Minerals 15 00738 g006
Figure 7. Estimation of S-wave velocity for well 3. From left to right: (a) volume fraction of components; (b) fluid saturation; (c,d) estimated velocities based on the compaction model (red) and measured velocities (black); (e,f) estimated velocities based on the Xu–White model (red); and measured velocities (black) and (g) errors from the compaction model (red) and Xu–White model (blue), as well as the normalized volume fraction of clay (dotted black).
Minerals 15 00738 g007
Table 1. Elastic moduli and density of rock components [5,8,37].
Bulk Modulus
(Gpa)
Shear Modulus
(Gpa)
Density
( g · cm 3 )
Quartz37.944.32.65
Feldspar37.5152.62
Calcite76.8322.71
Dolomite94.9452.87
Pyrite147.4132.54.93
Clay2592.55
Kerogen5.533.21.25
Gas0.18-0.26
Brine2.65-0.99
Table 2. Errors and correlation coefficients of S-wave velocity estimation for wells using the two models.
ModelRMSERMSErr
of V P of V S of V P of V S
well 1Xu–White model (variable α c )0.24430.08550.92950.9879
Compaction model0.10060.04550.95700.9962
well 2Xu–White model (variable α c )0.28550.09990.84940.9724
Compaction model0.11500.04240.93220.9932
well 3Xu–White model (variable α c )0.06470.08270.98790.9391
Compaction model0.00090.03800.99990.9715
Disclaimer/Publisher’s Note: The statements, opinions and data contained in all publications are solely those of the individual author(s) and contributor(s) and not of MDPI and/or the editor(s). MDPI and/or the editor(s) disclaim responsibility for any injury to people or property resulting from any ideas, methods, instructions or products referred to in the content.