
Mineral Exploration in the Central Xicheng Ore Field, China, Using the Tectono-Geochemistry, Staged Factor Analysis, and Fractal Model

 ,
,
Abstract
1. Introduction
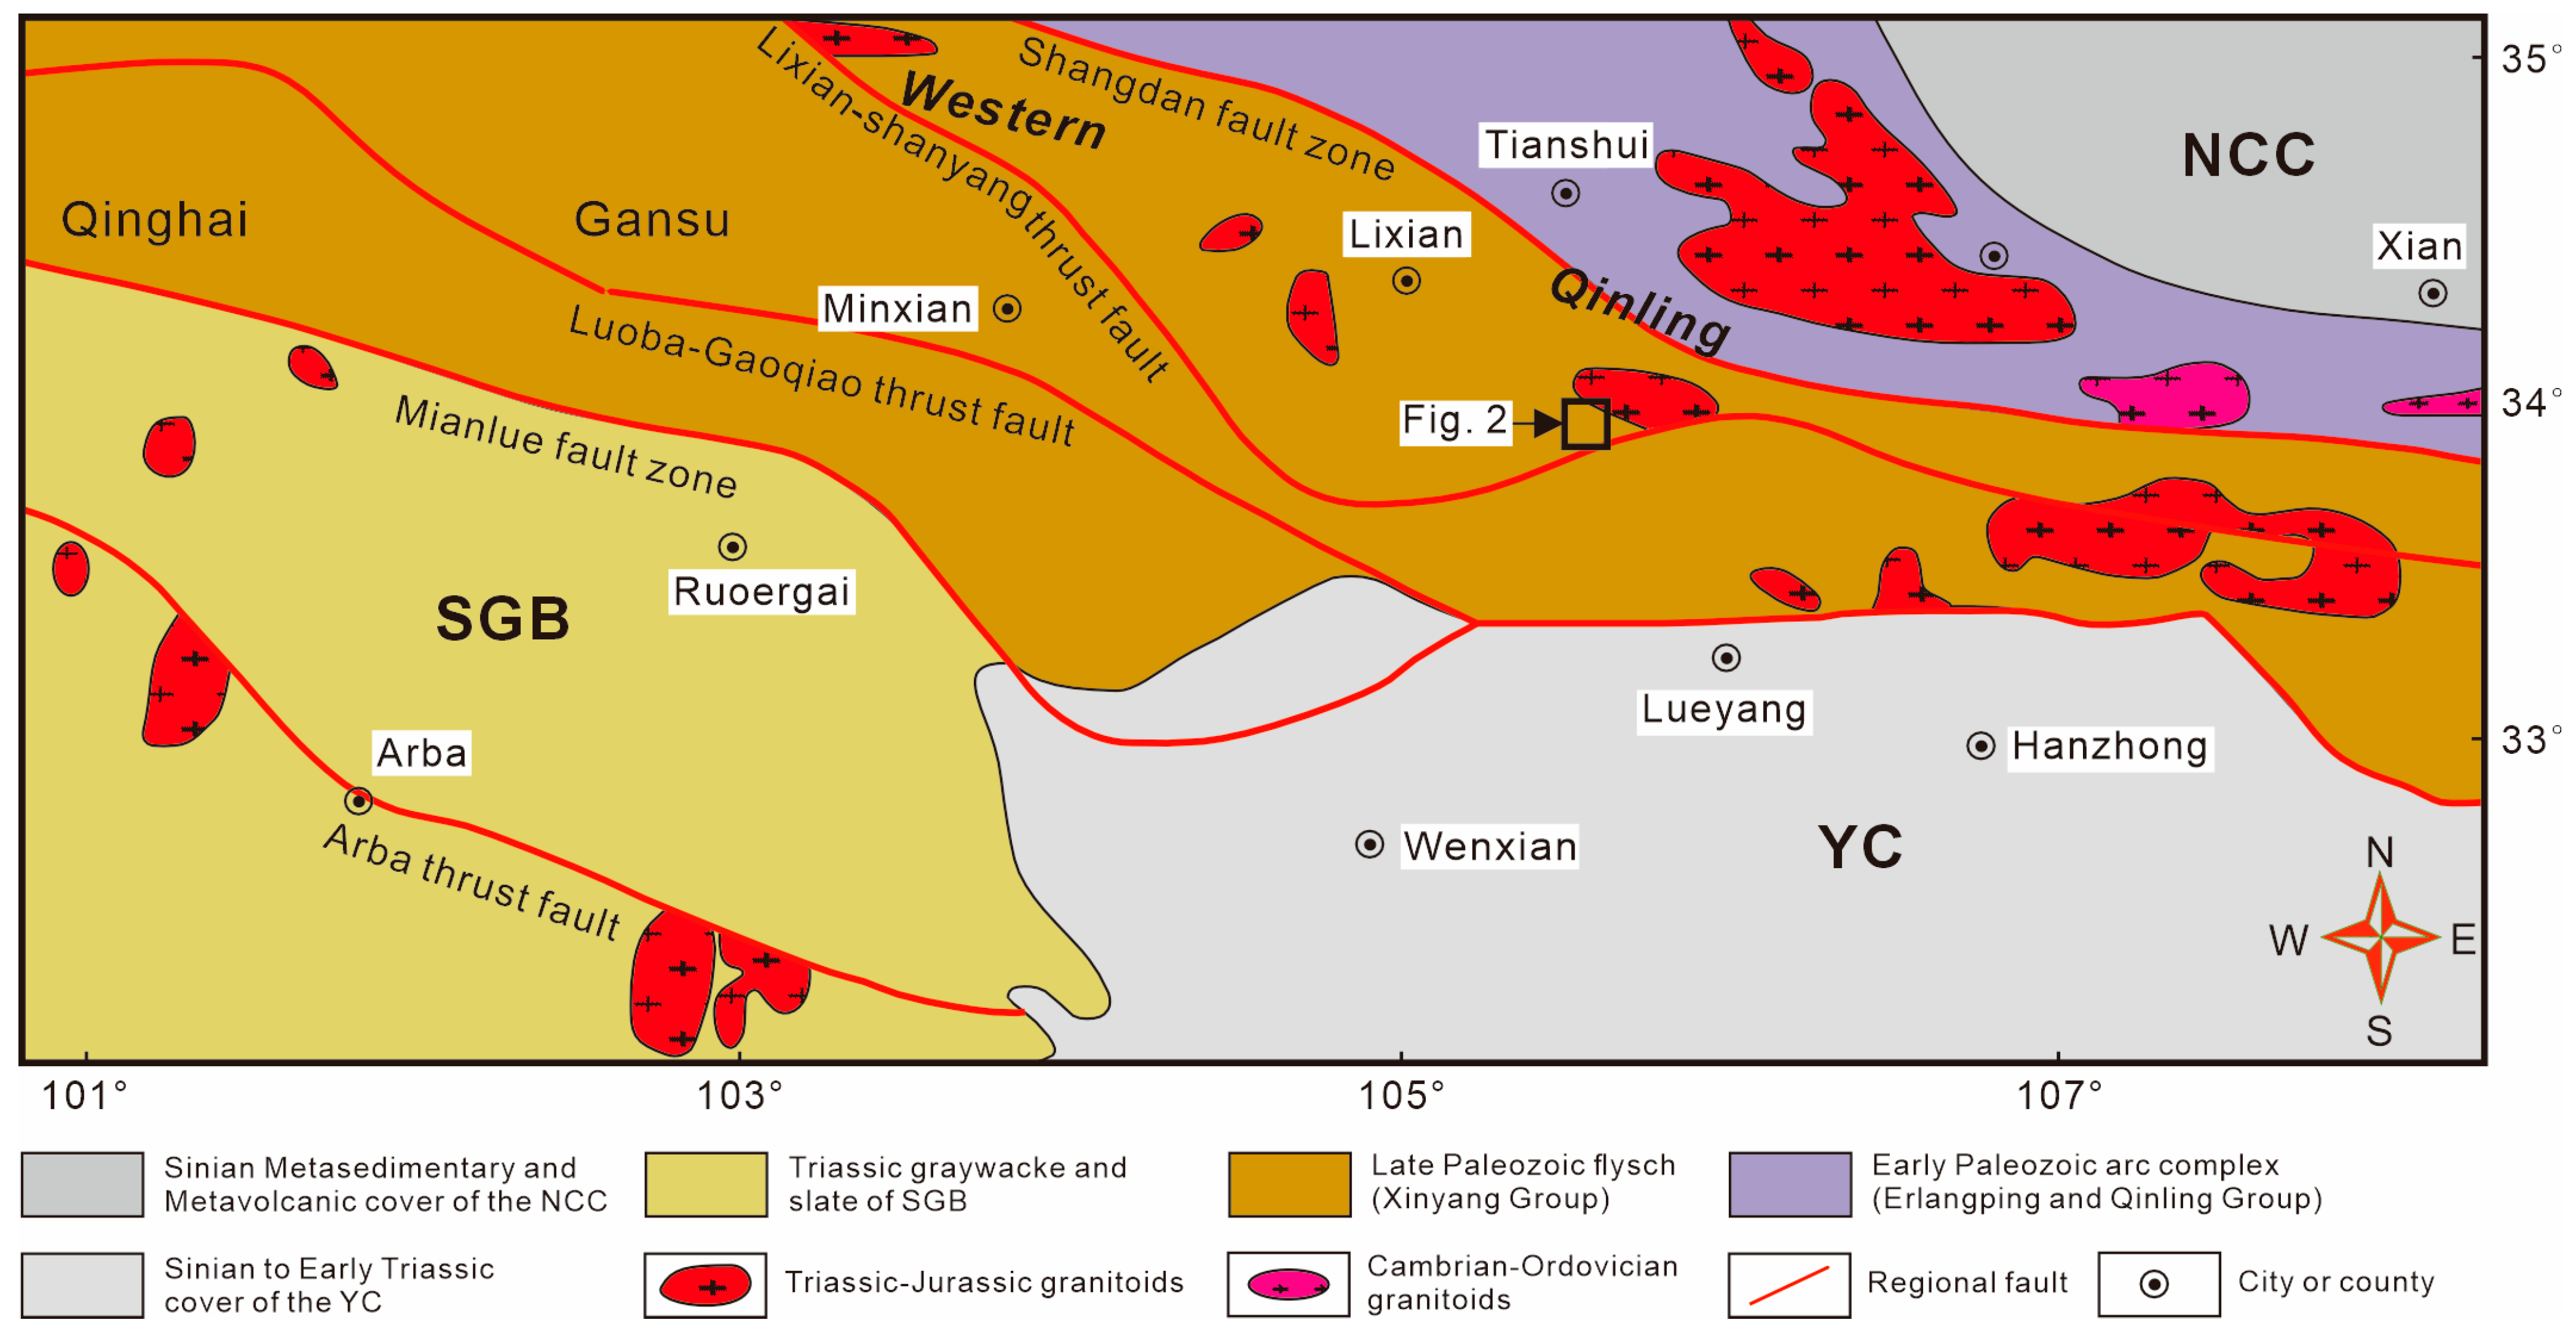
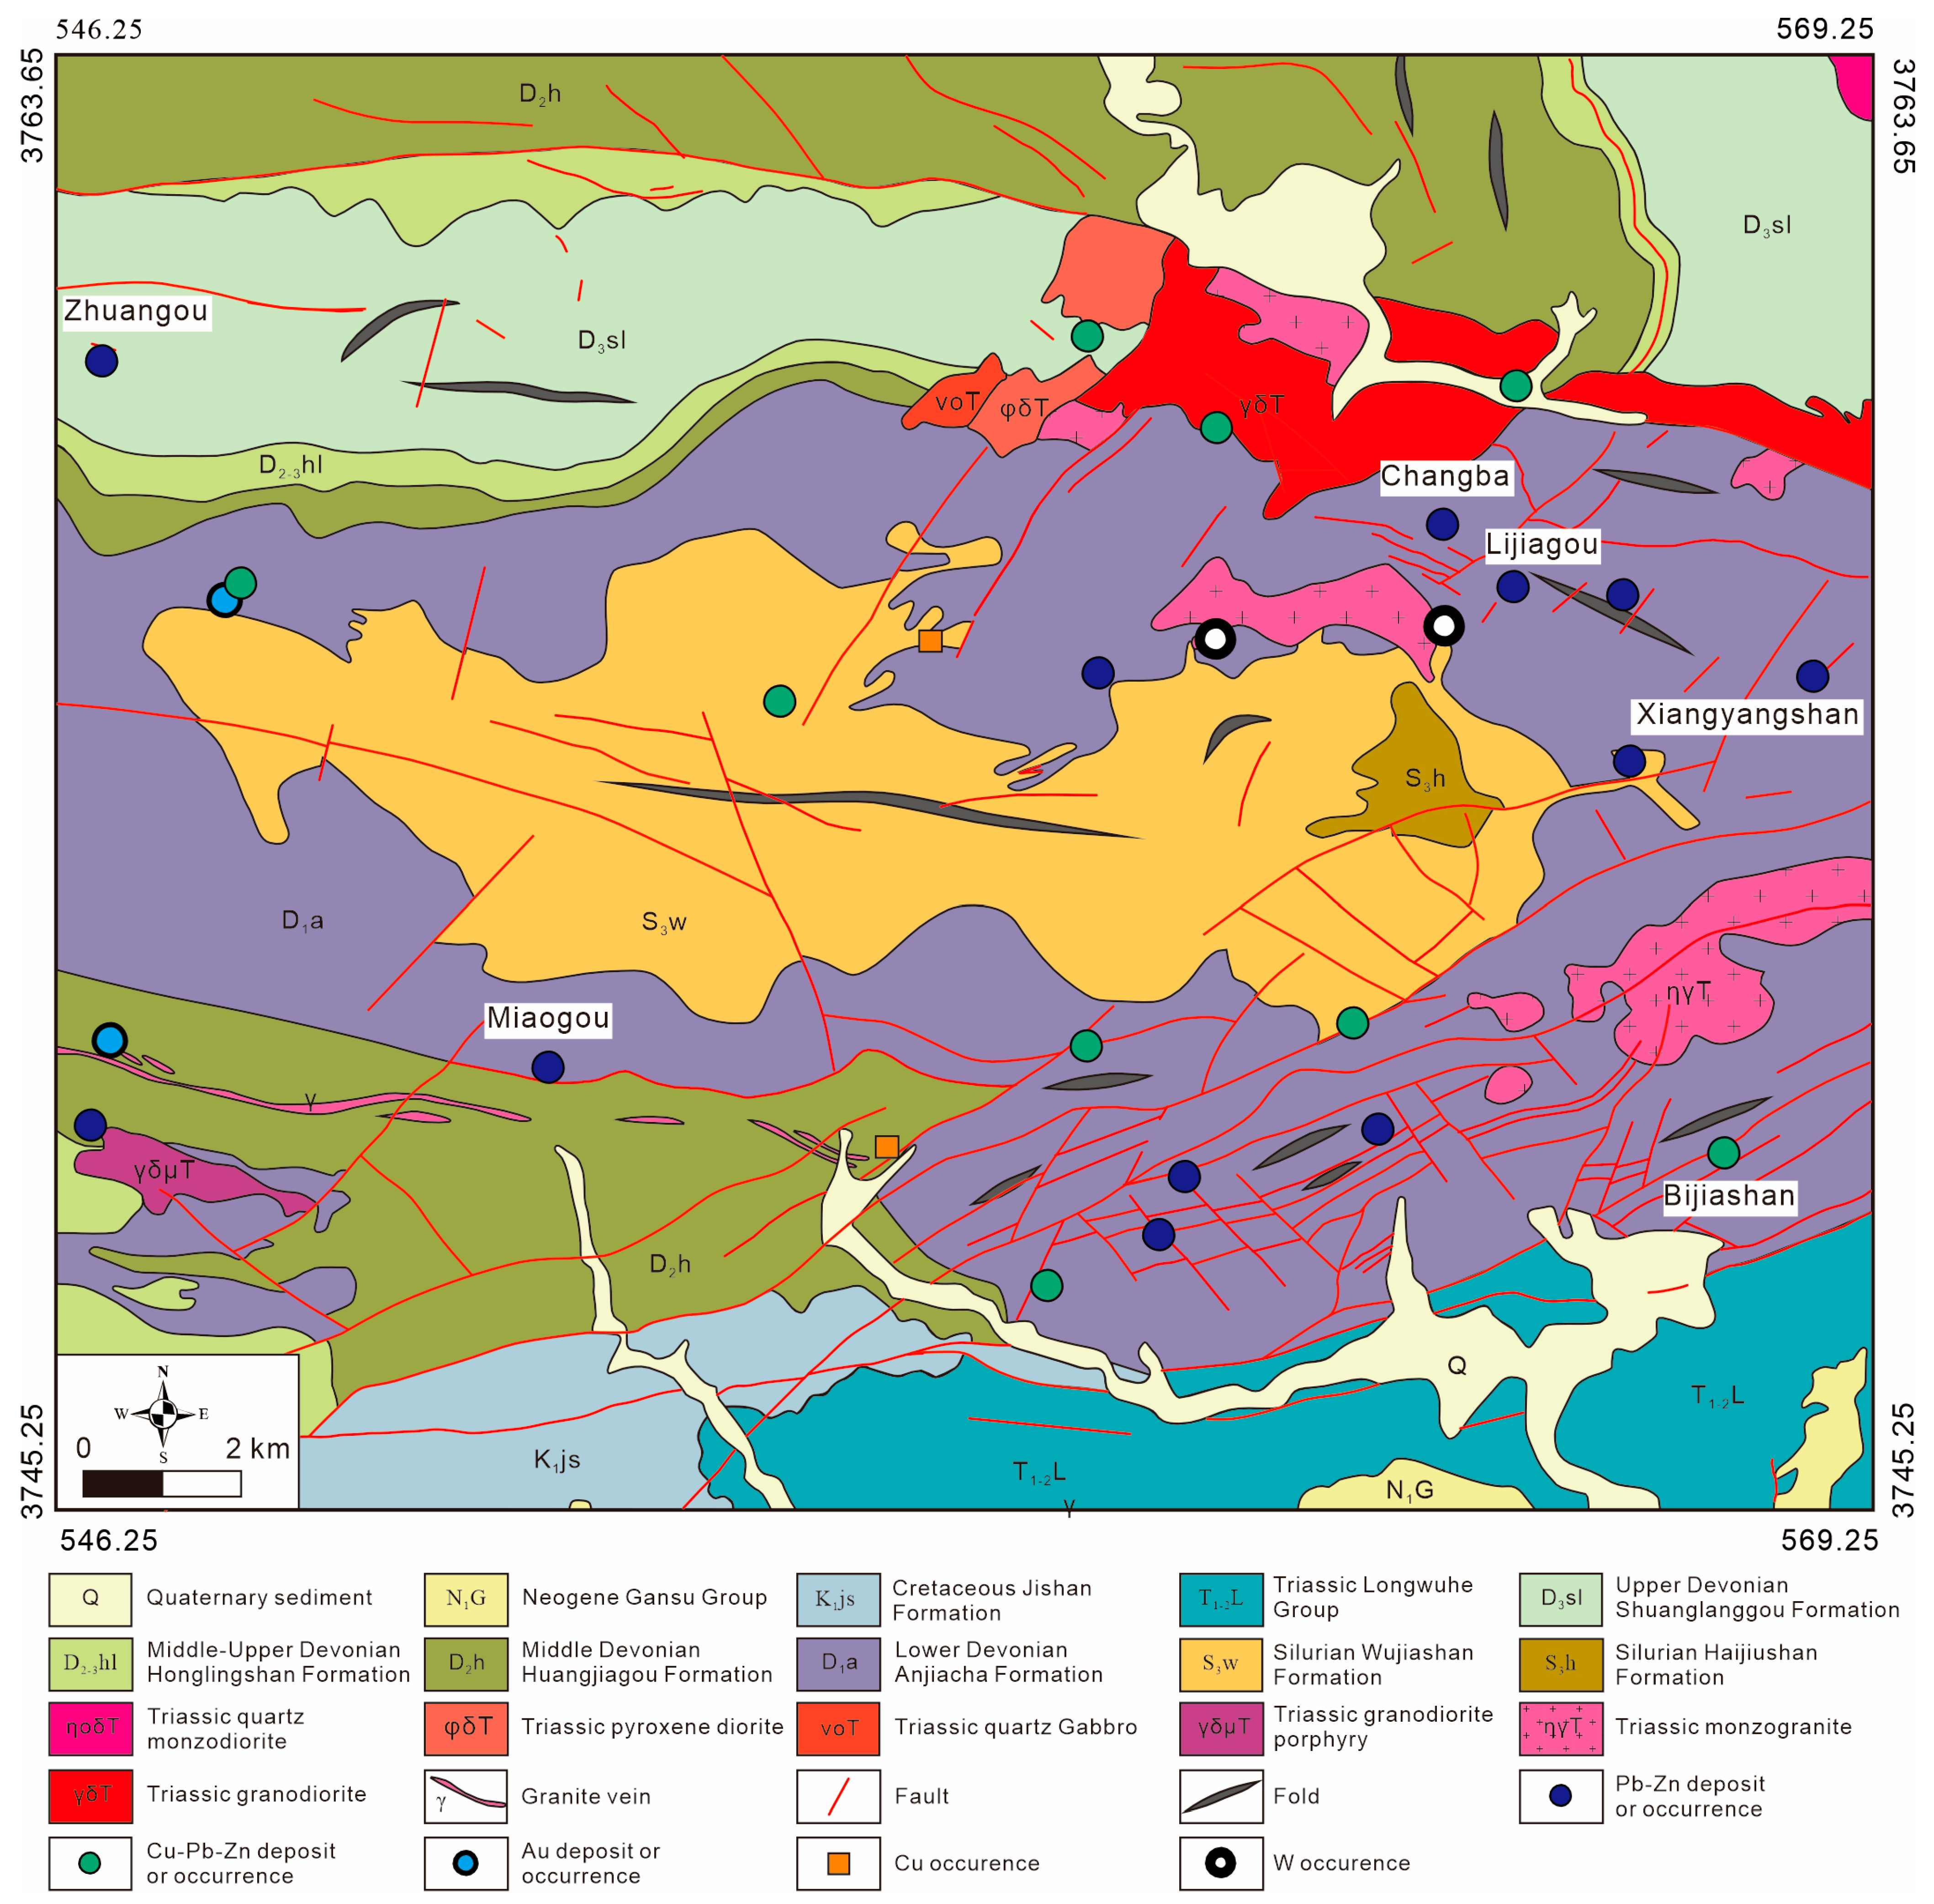
2. Regional Geology
3. Samples and Methods
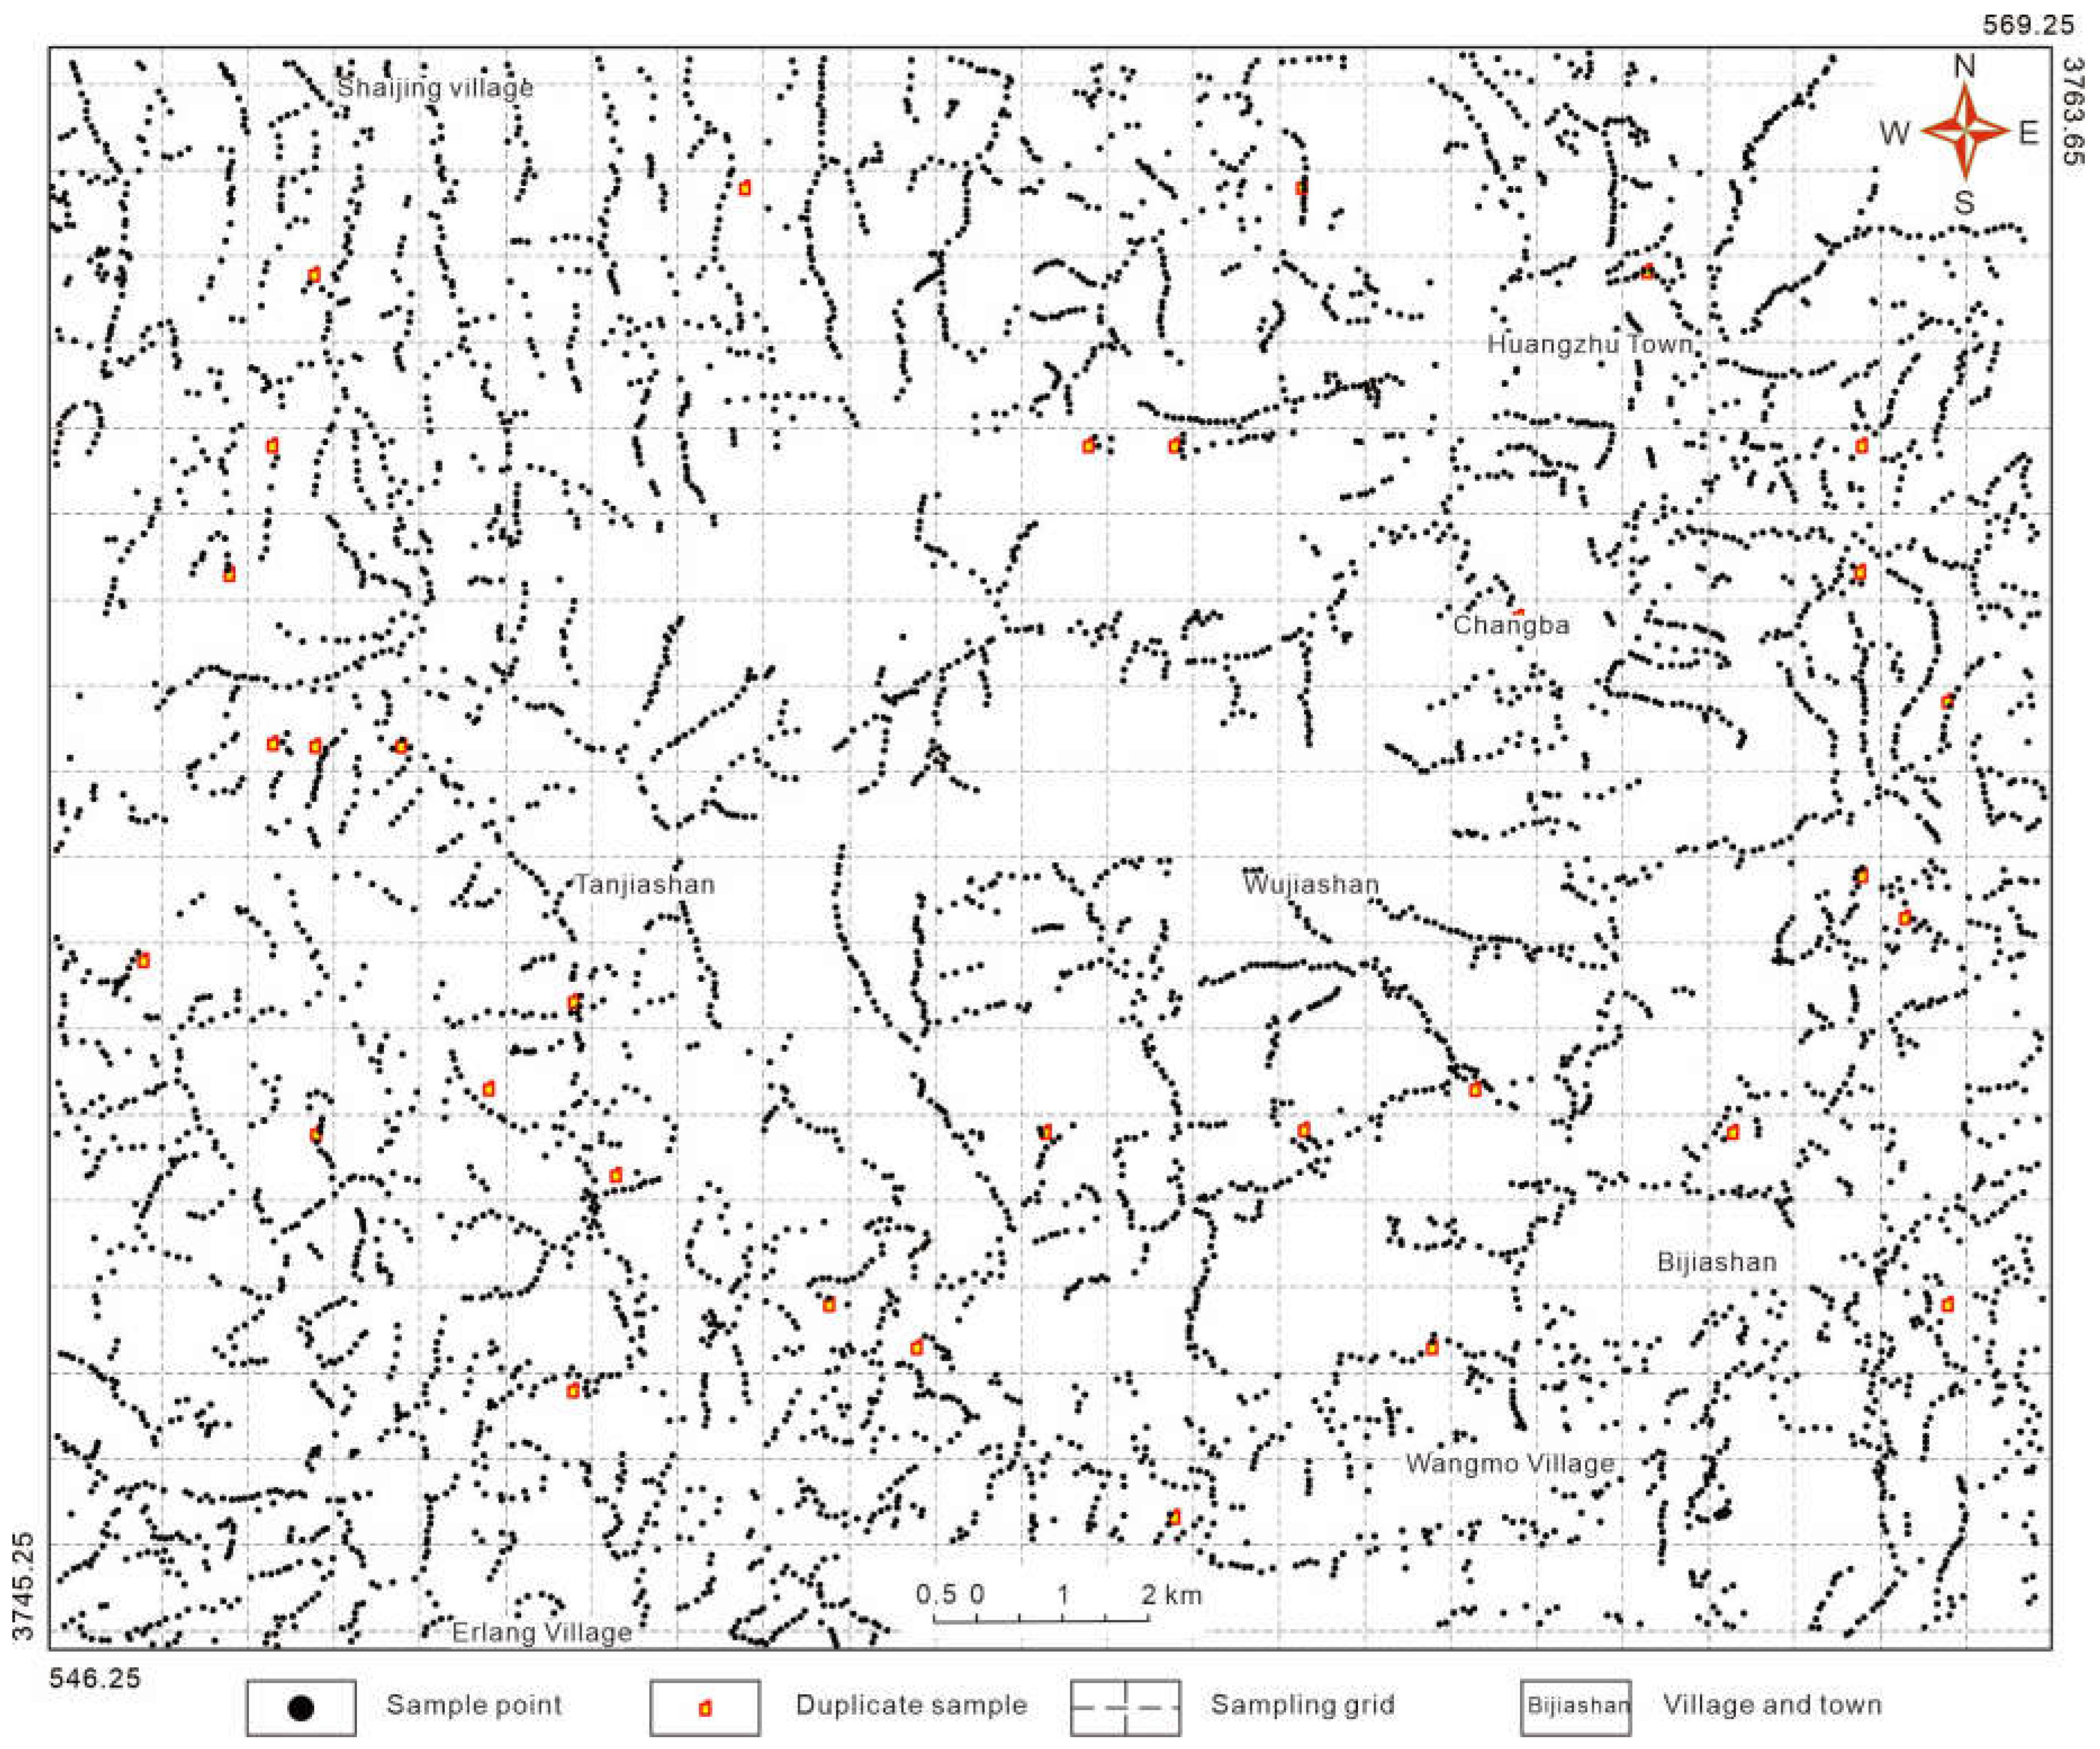
3.1. Sample Collection and Analysis
3.2. Staged Factor Analysis
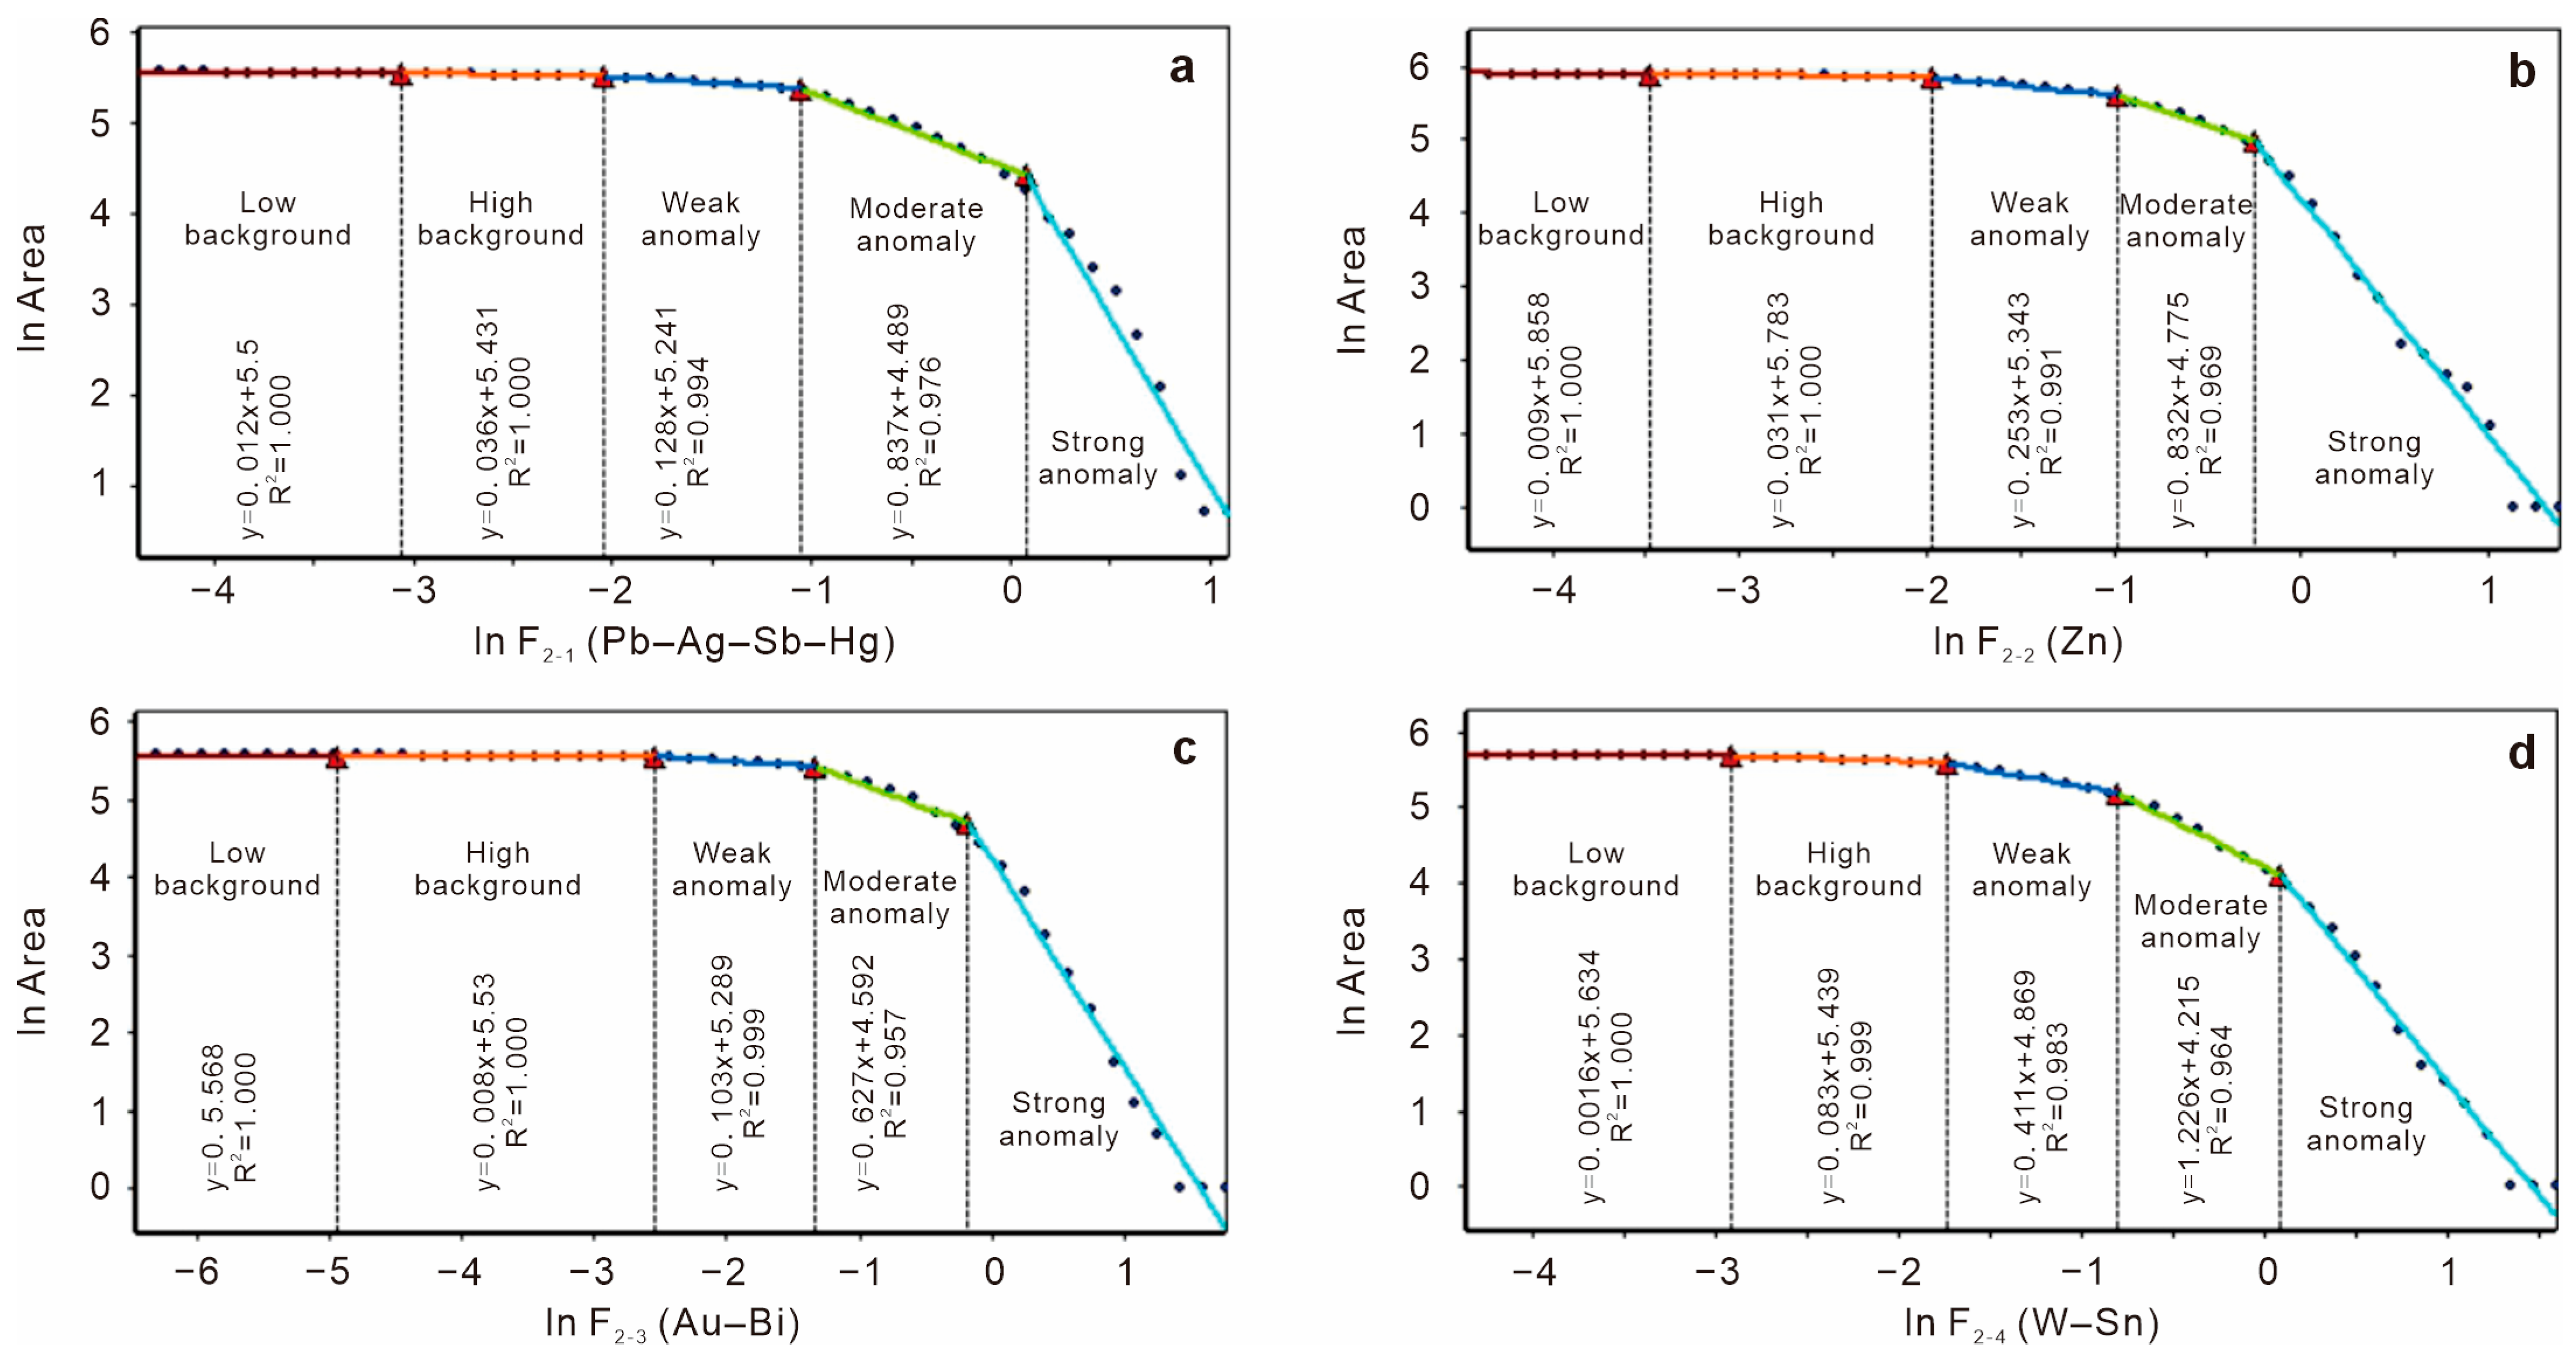
3.3. Concentration–Area (C–A) Fractal Model
4. Results
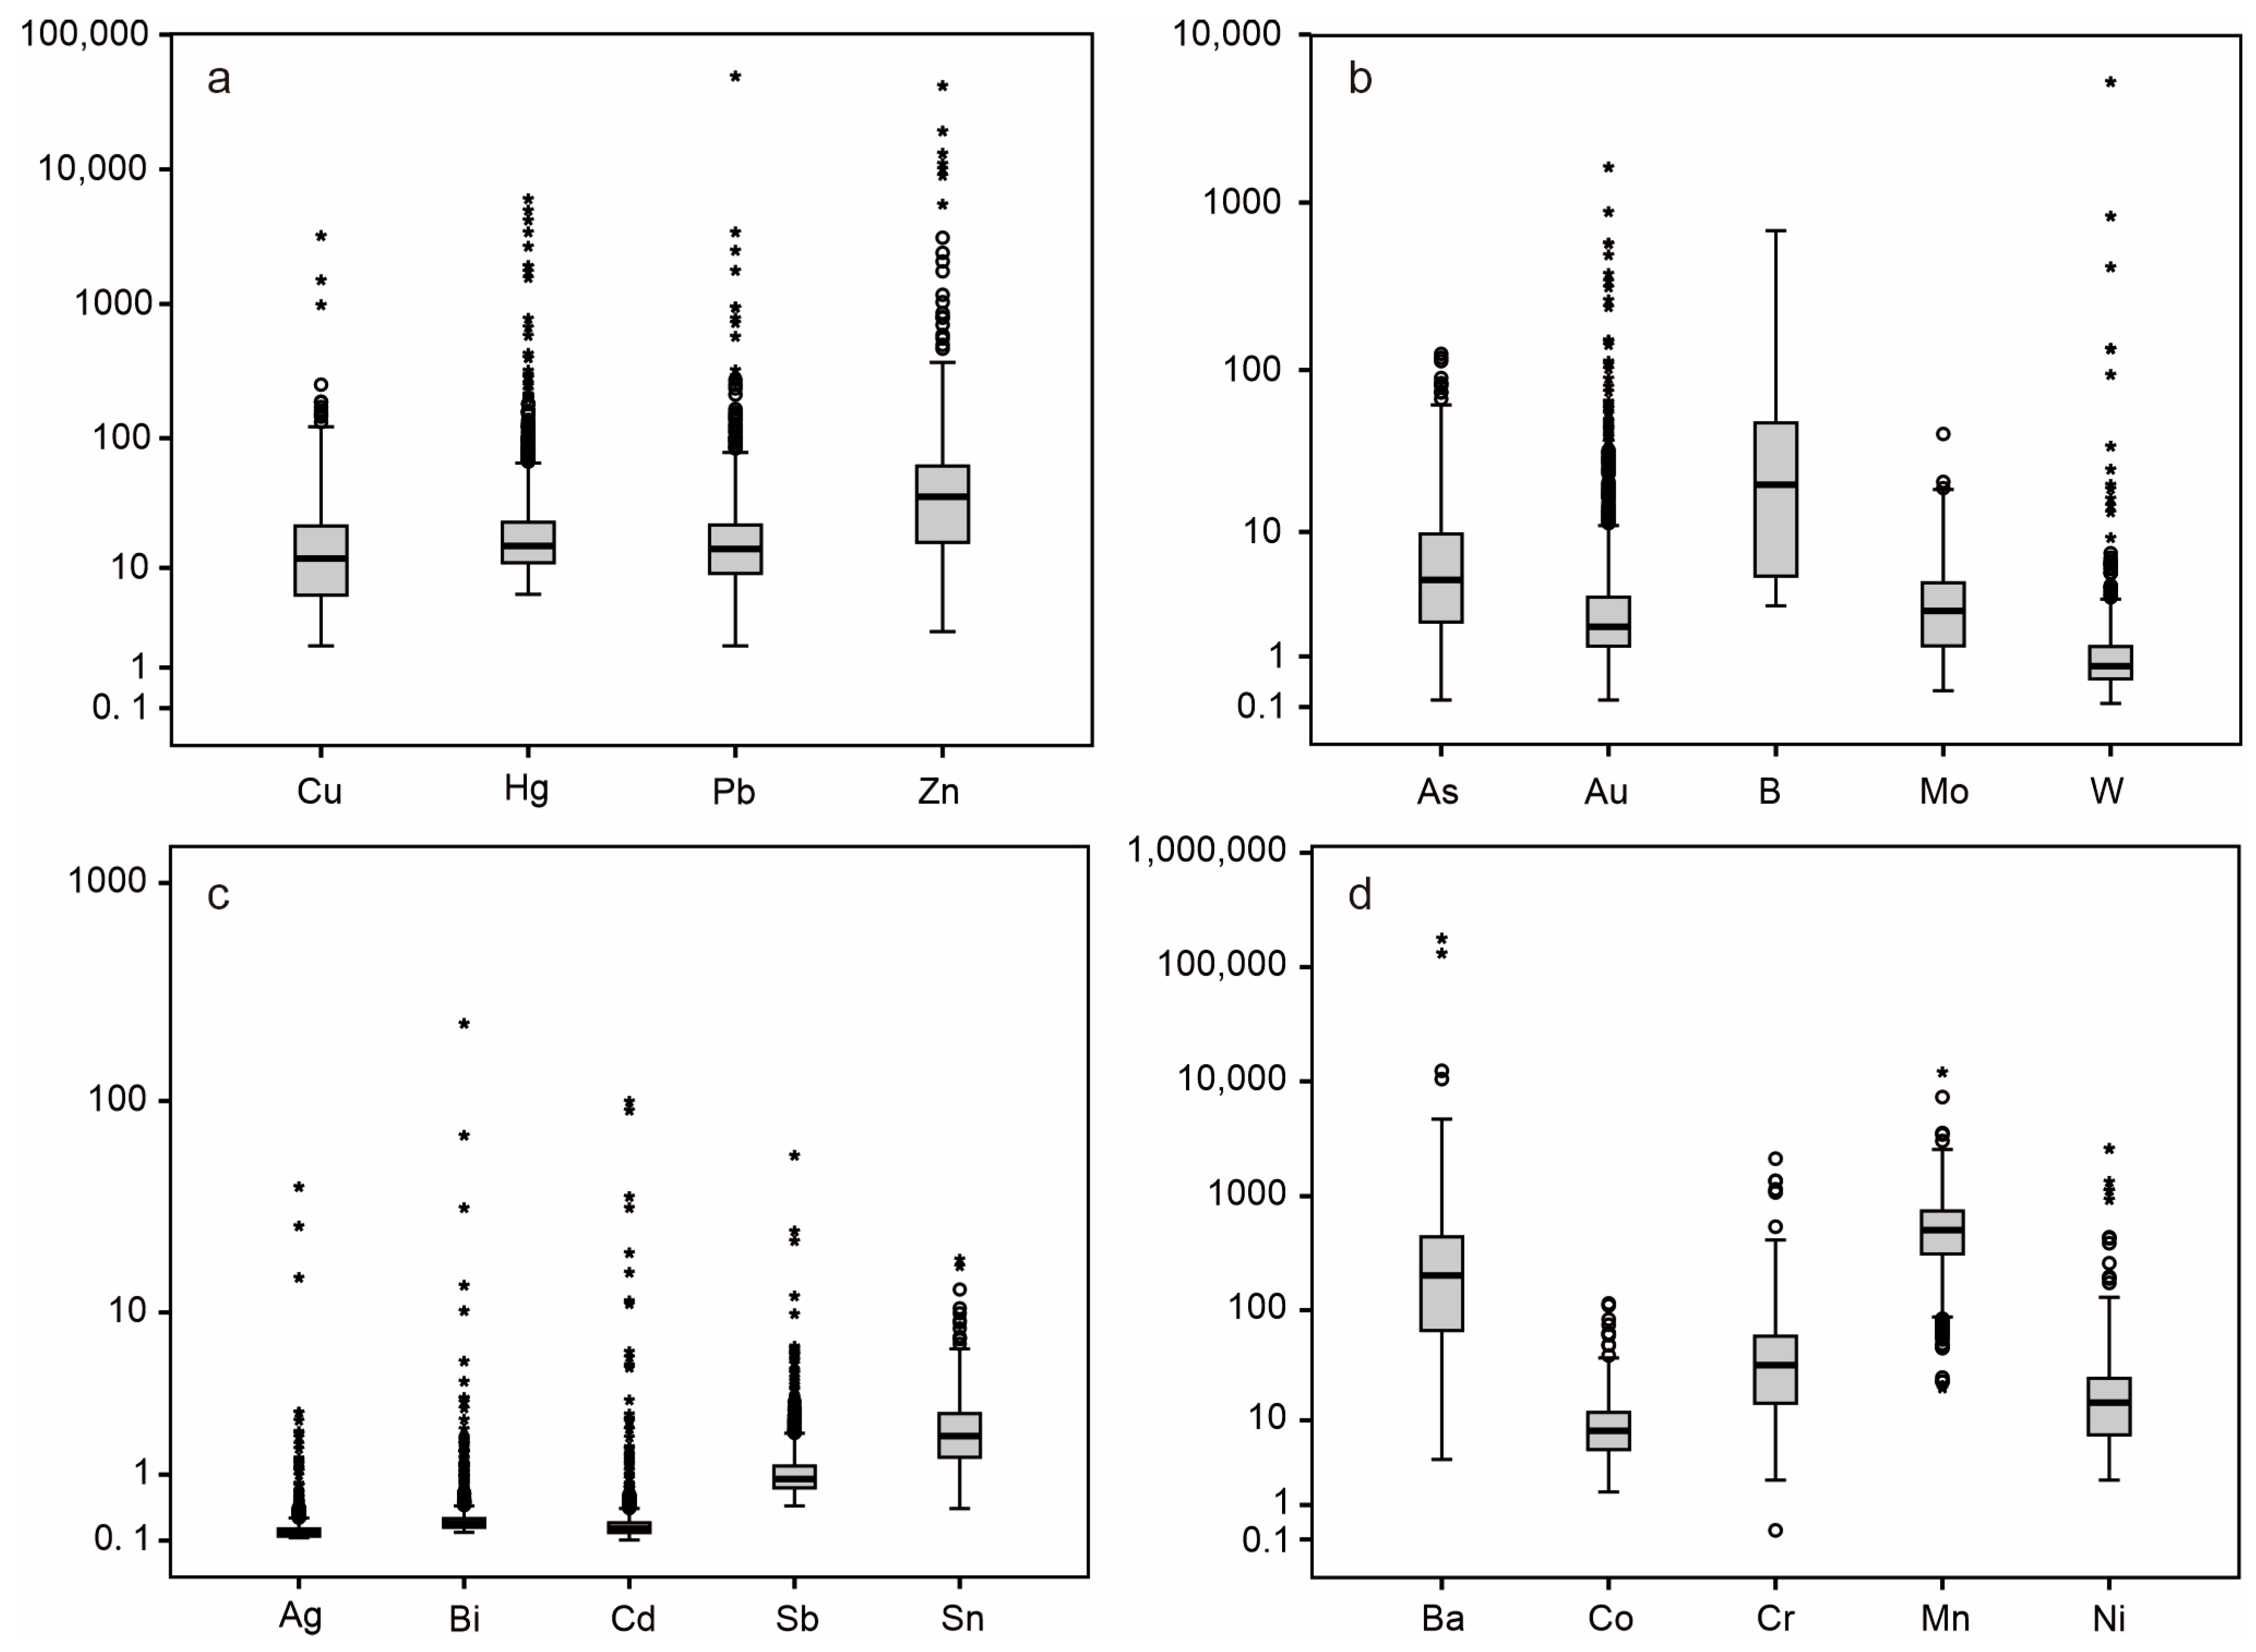
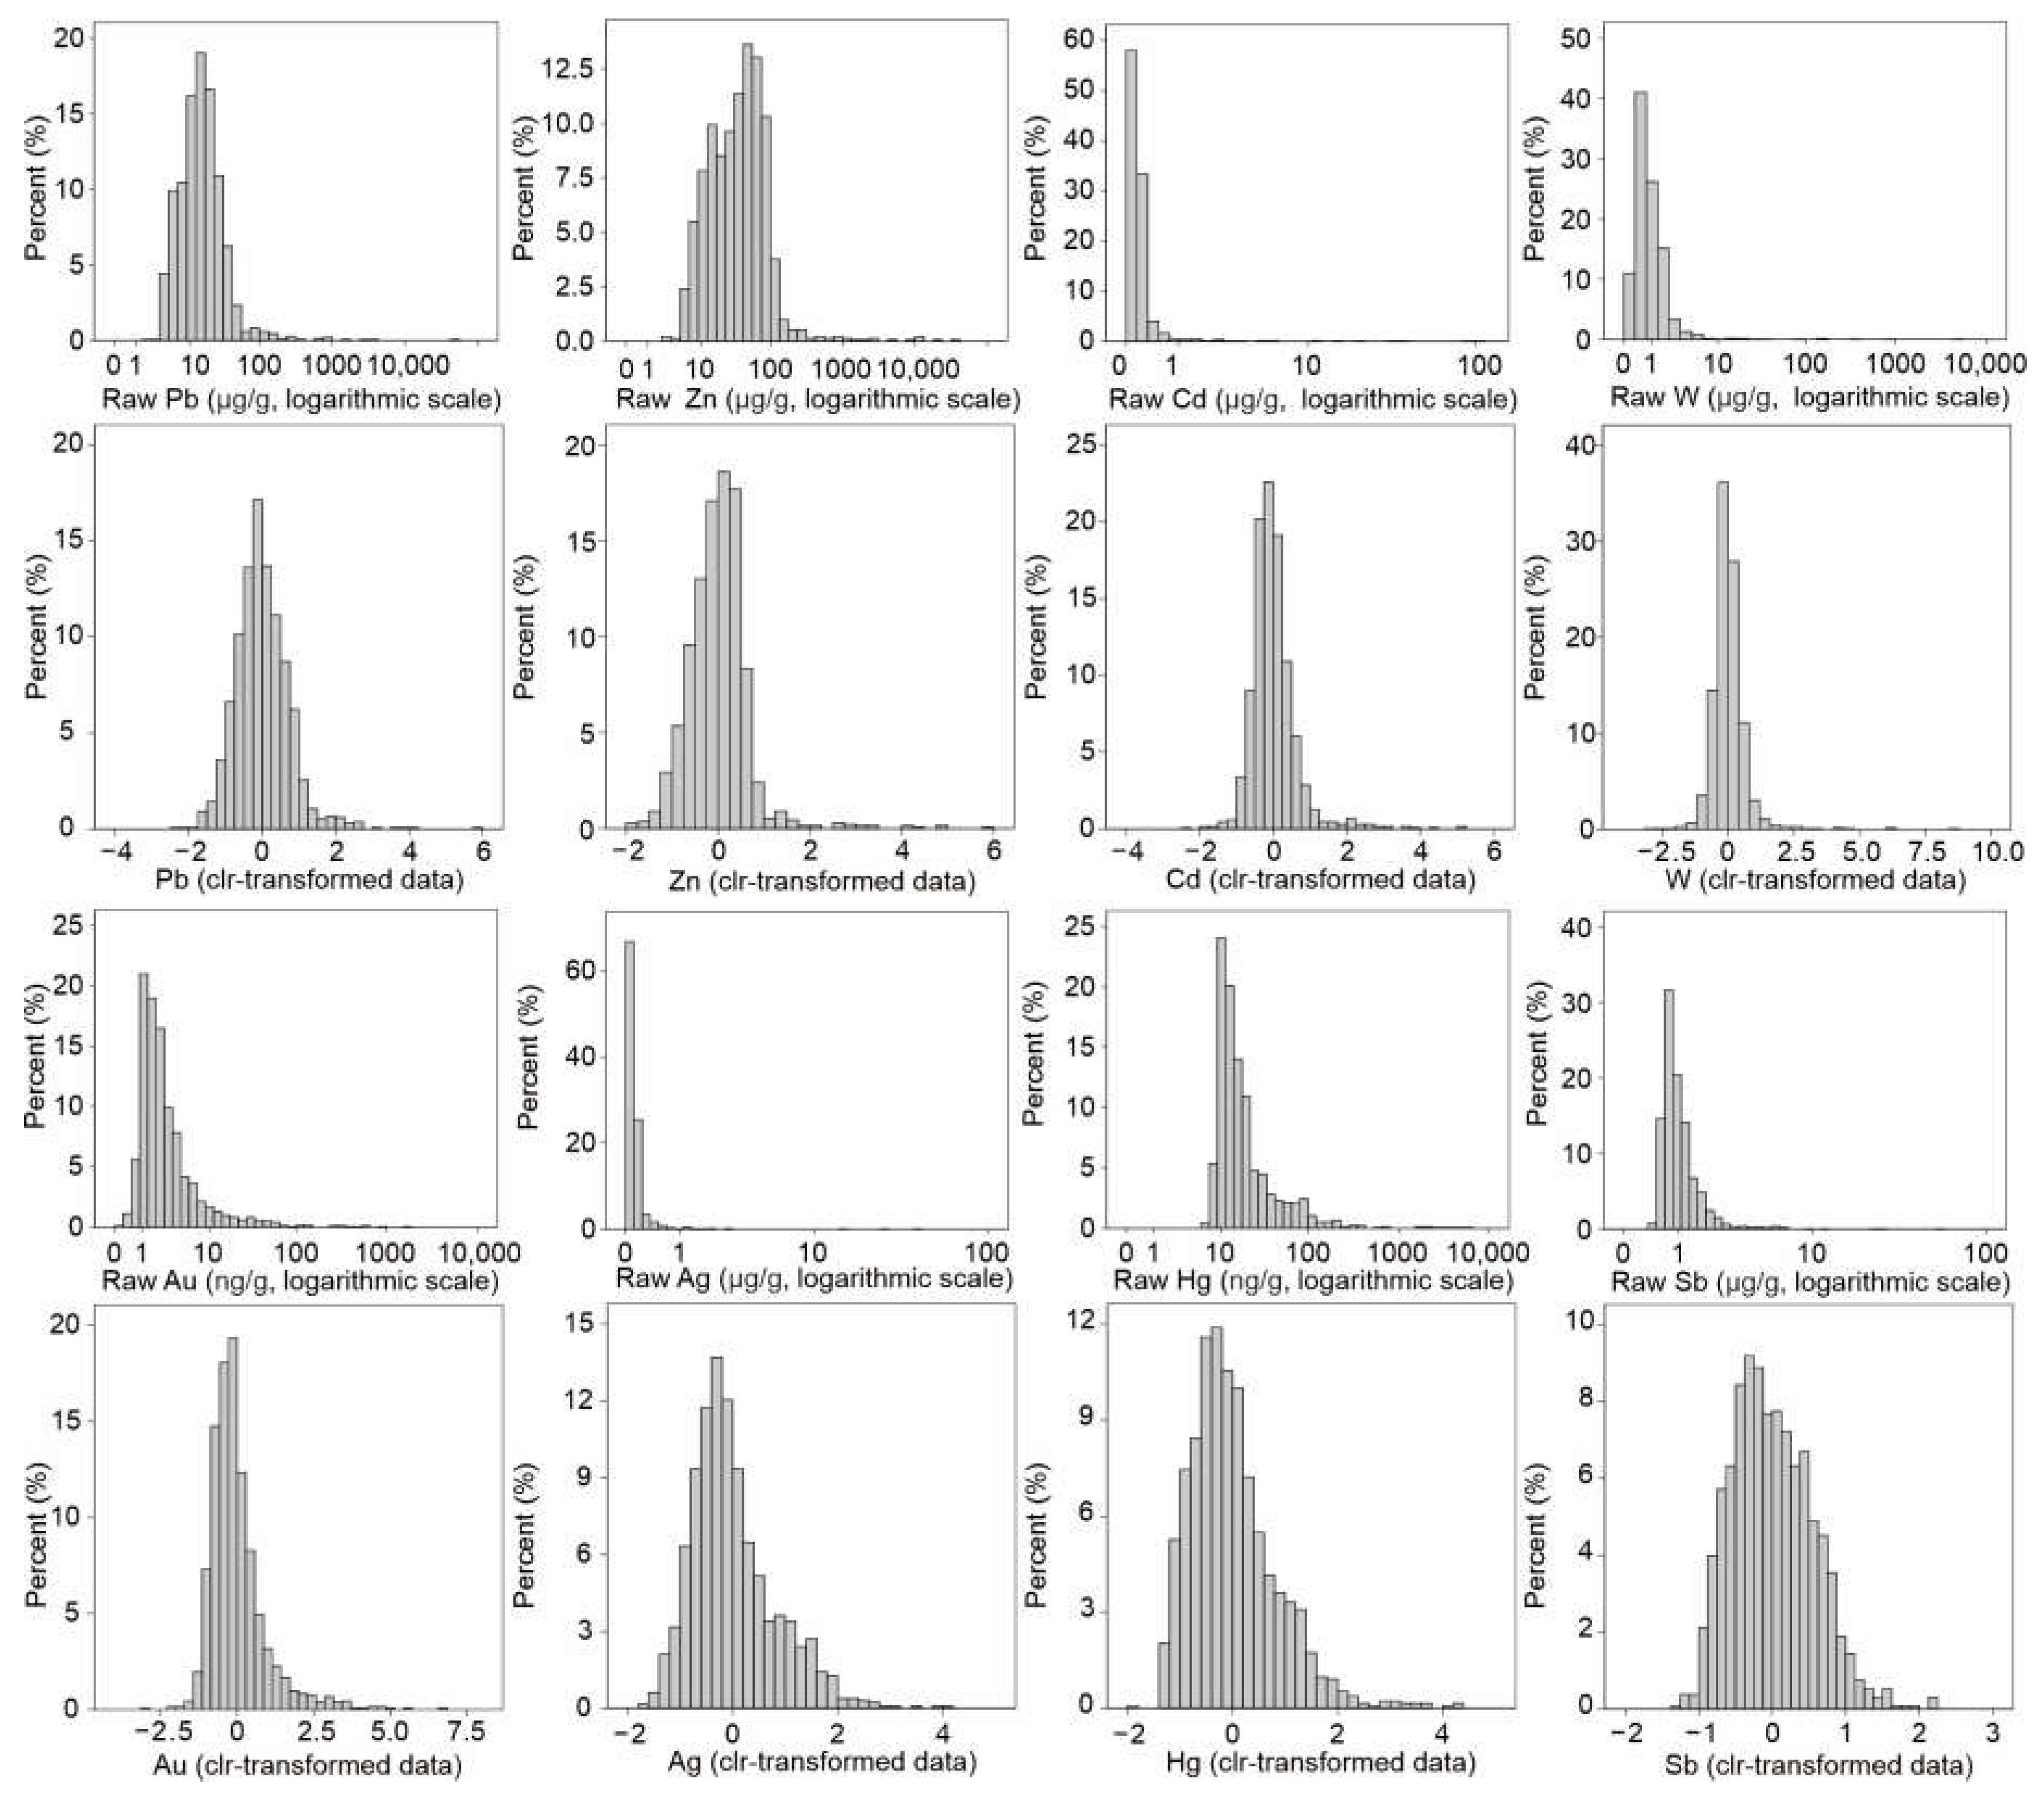
4.1. Statistical Analysis
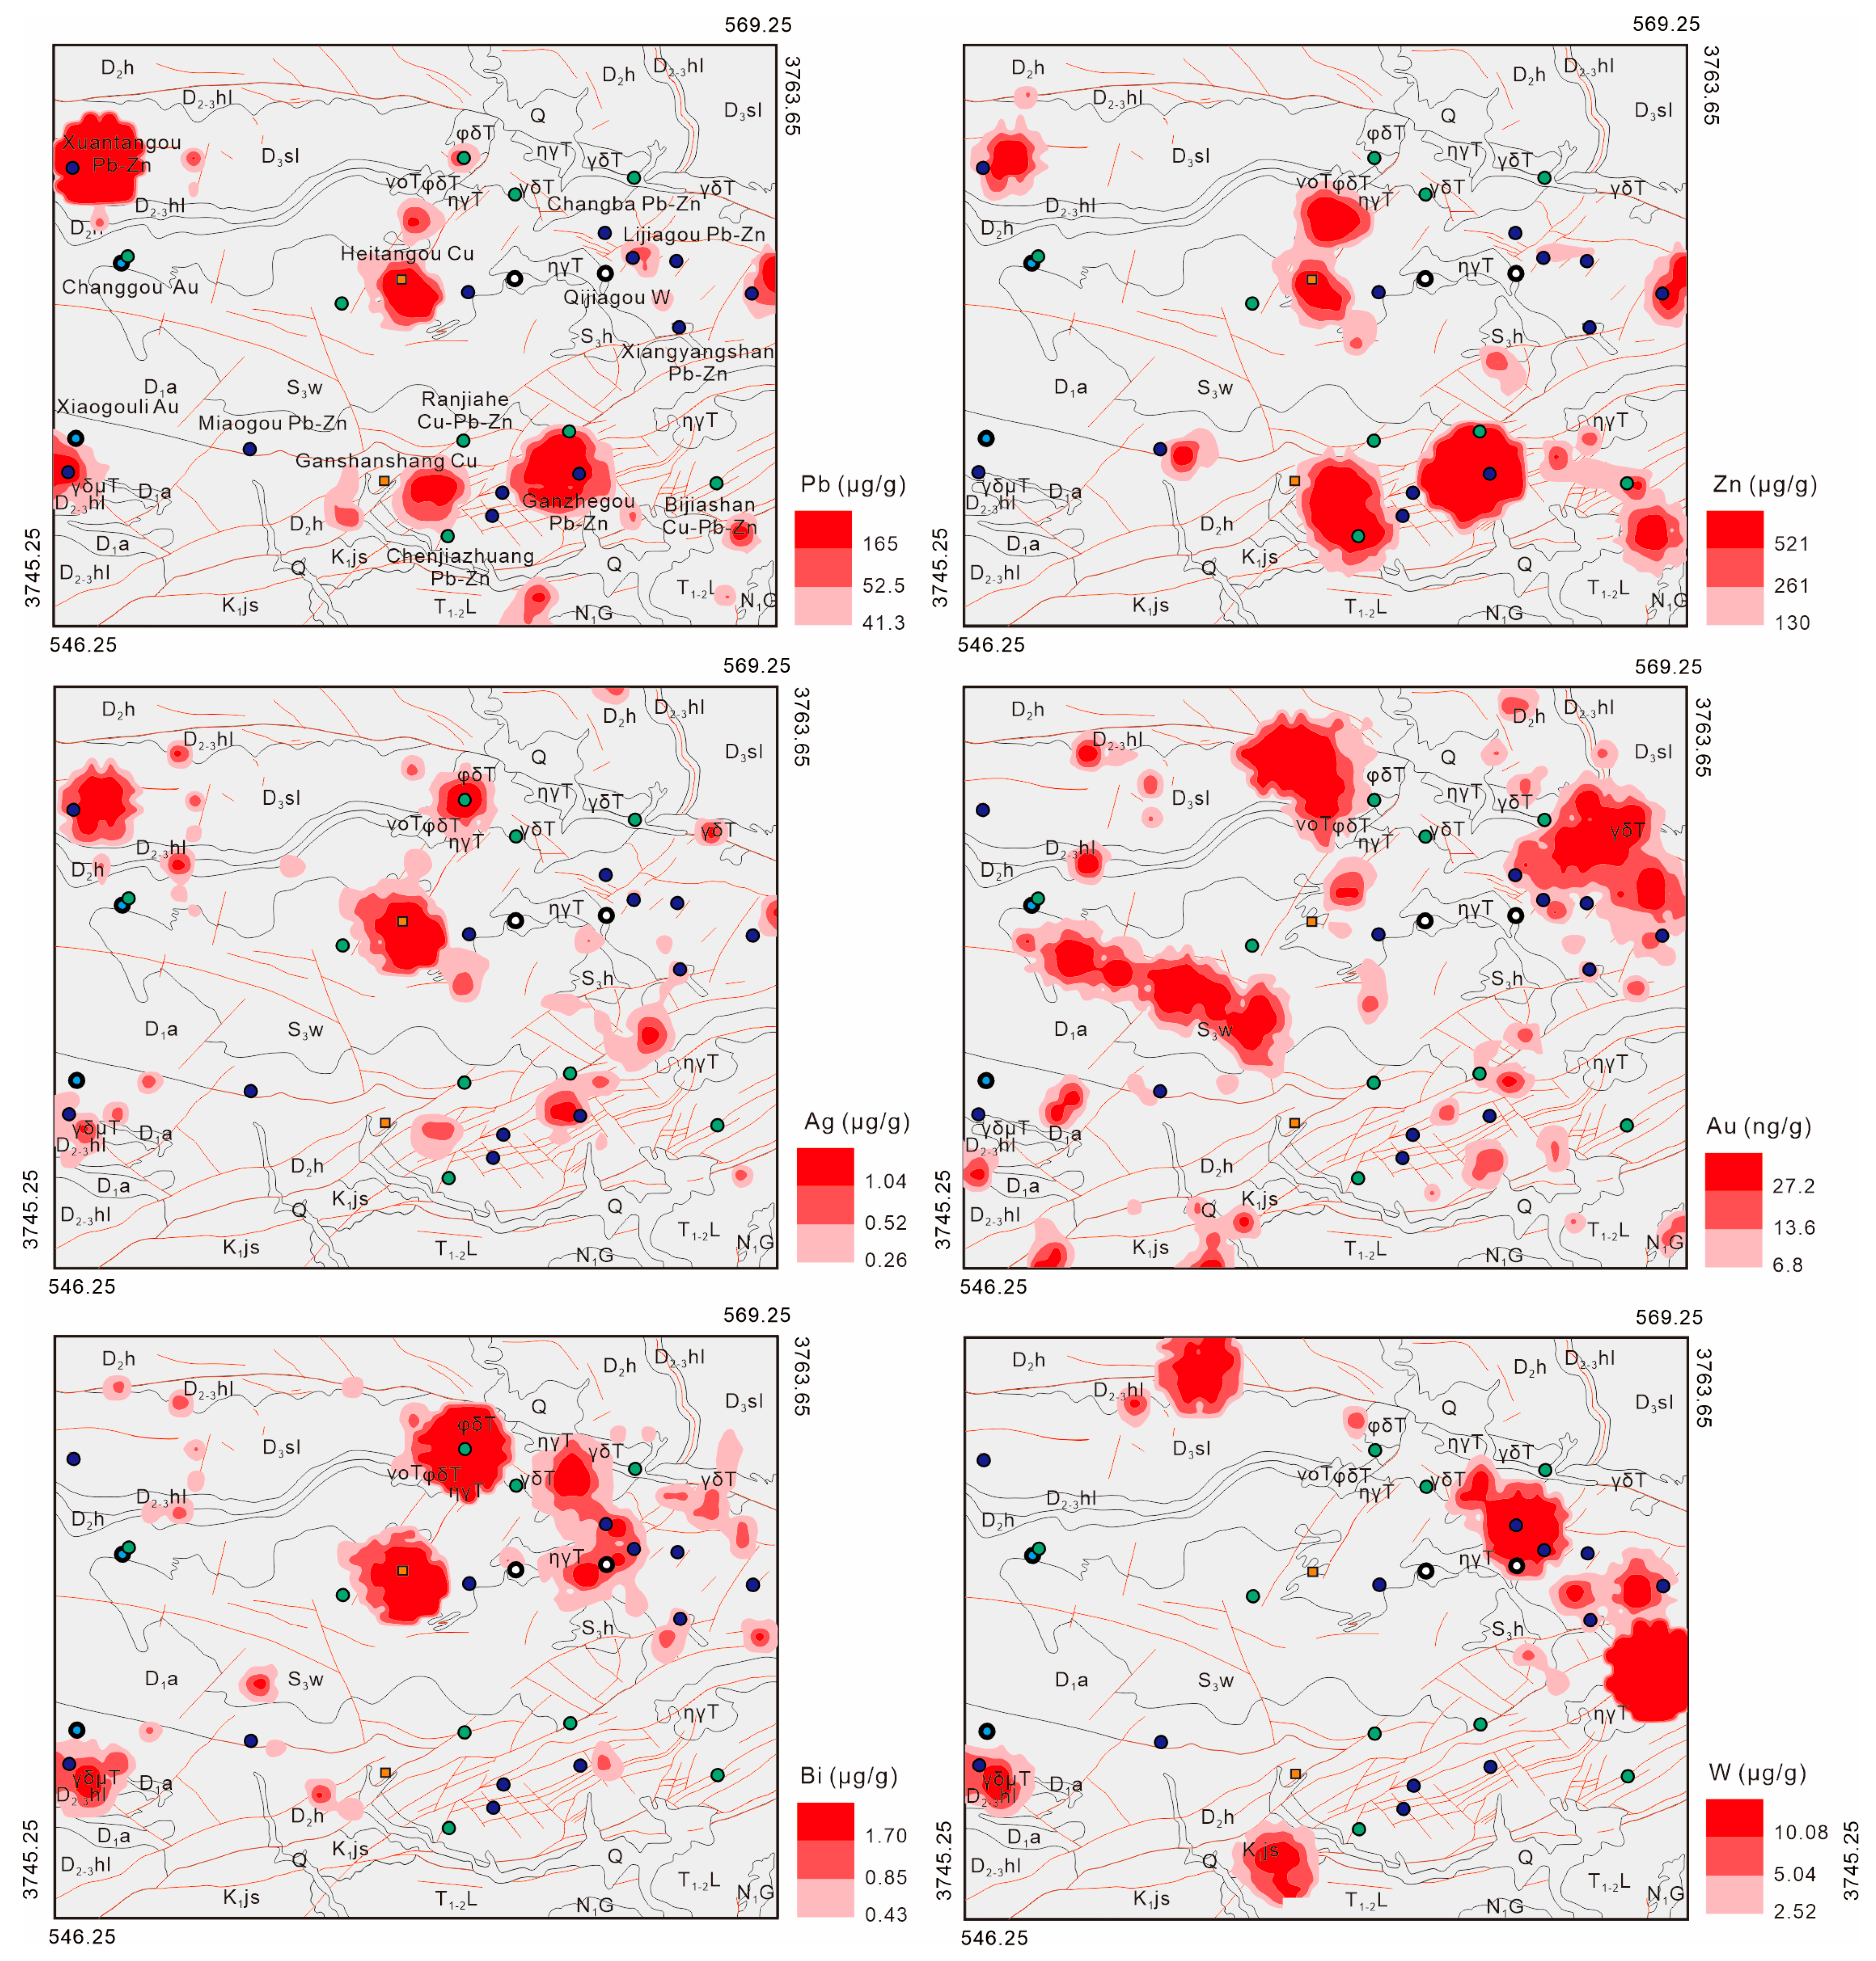
4.2. Single-Element Geochemical Signatures
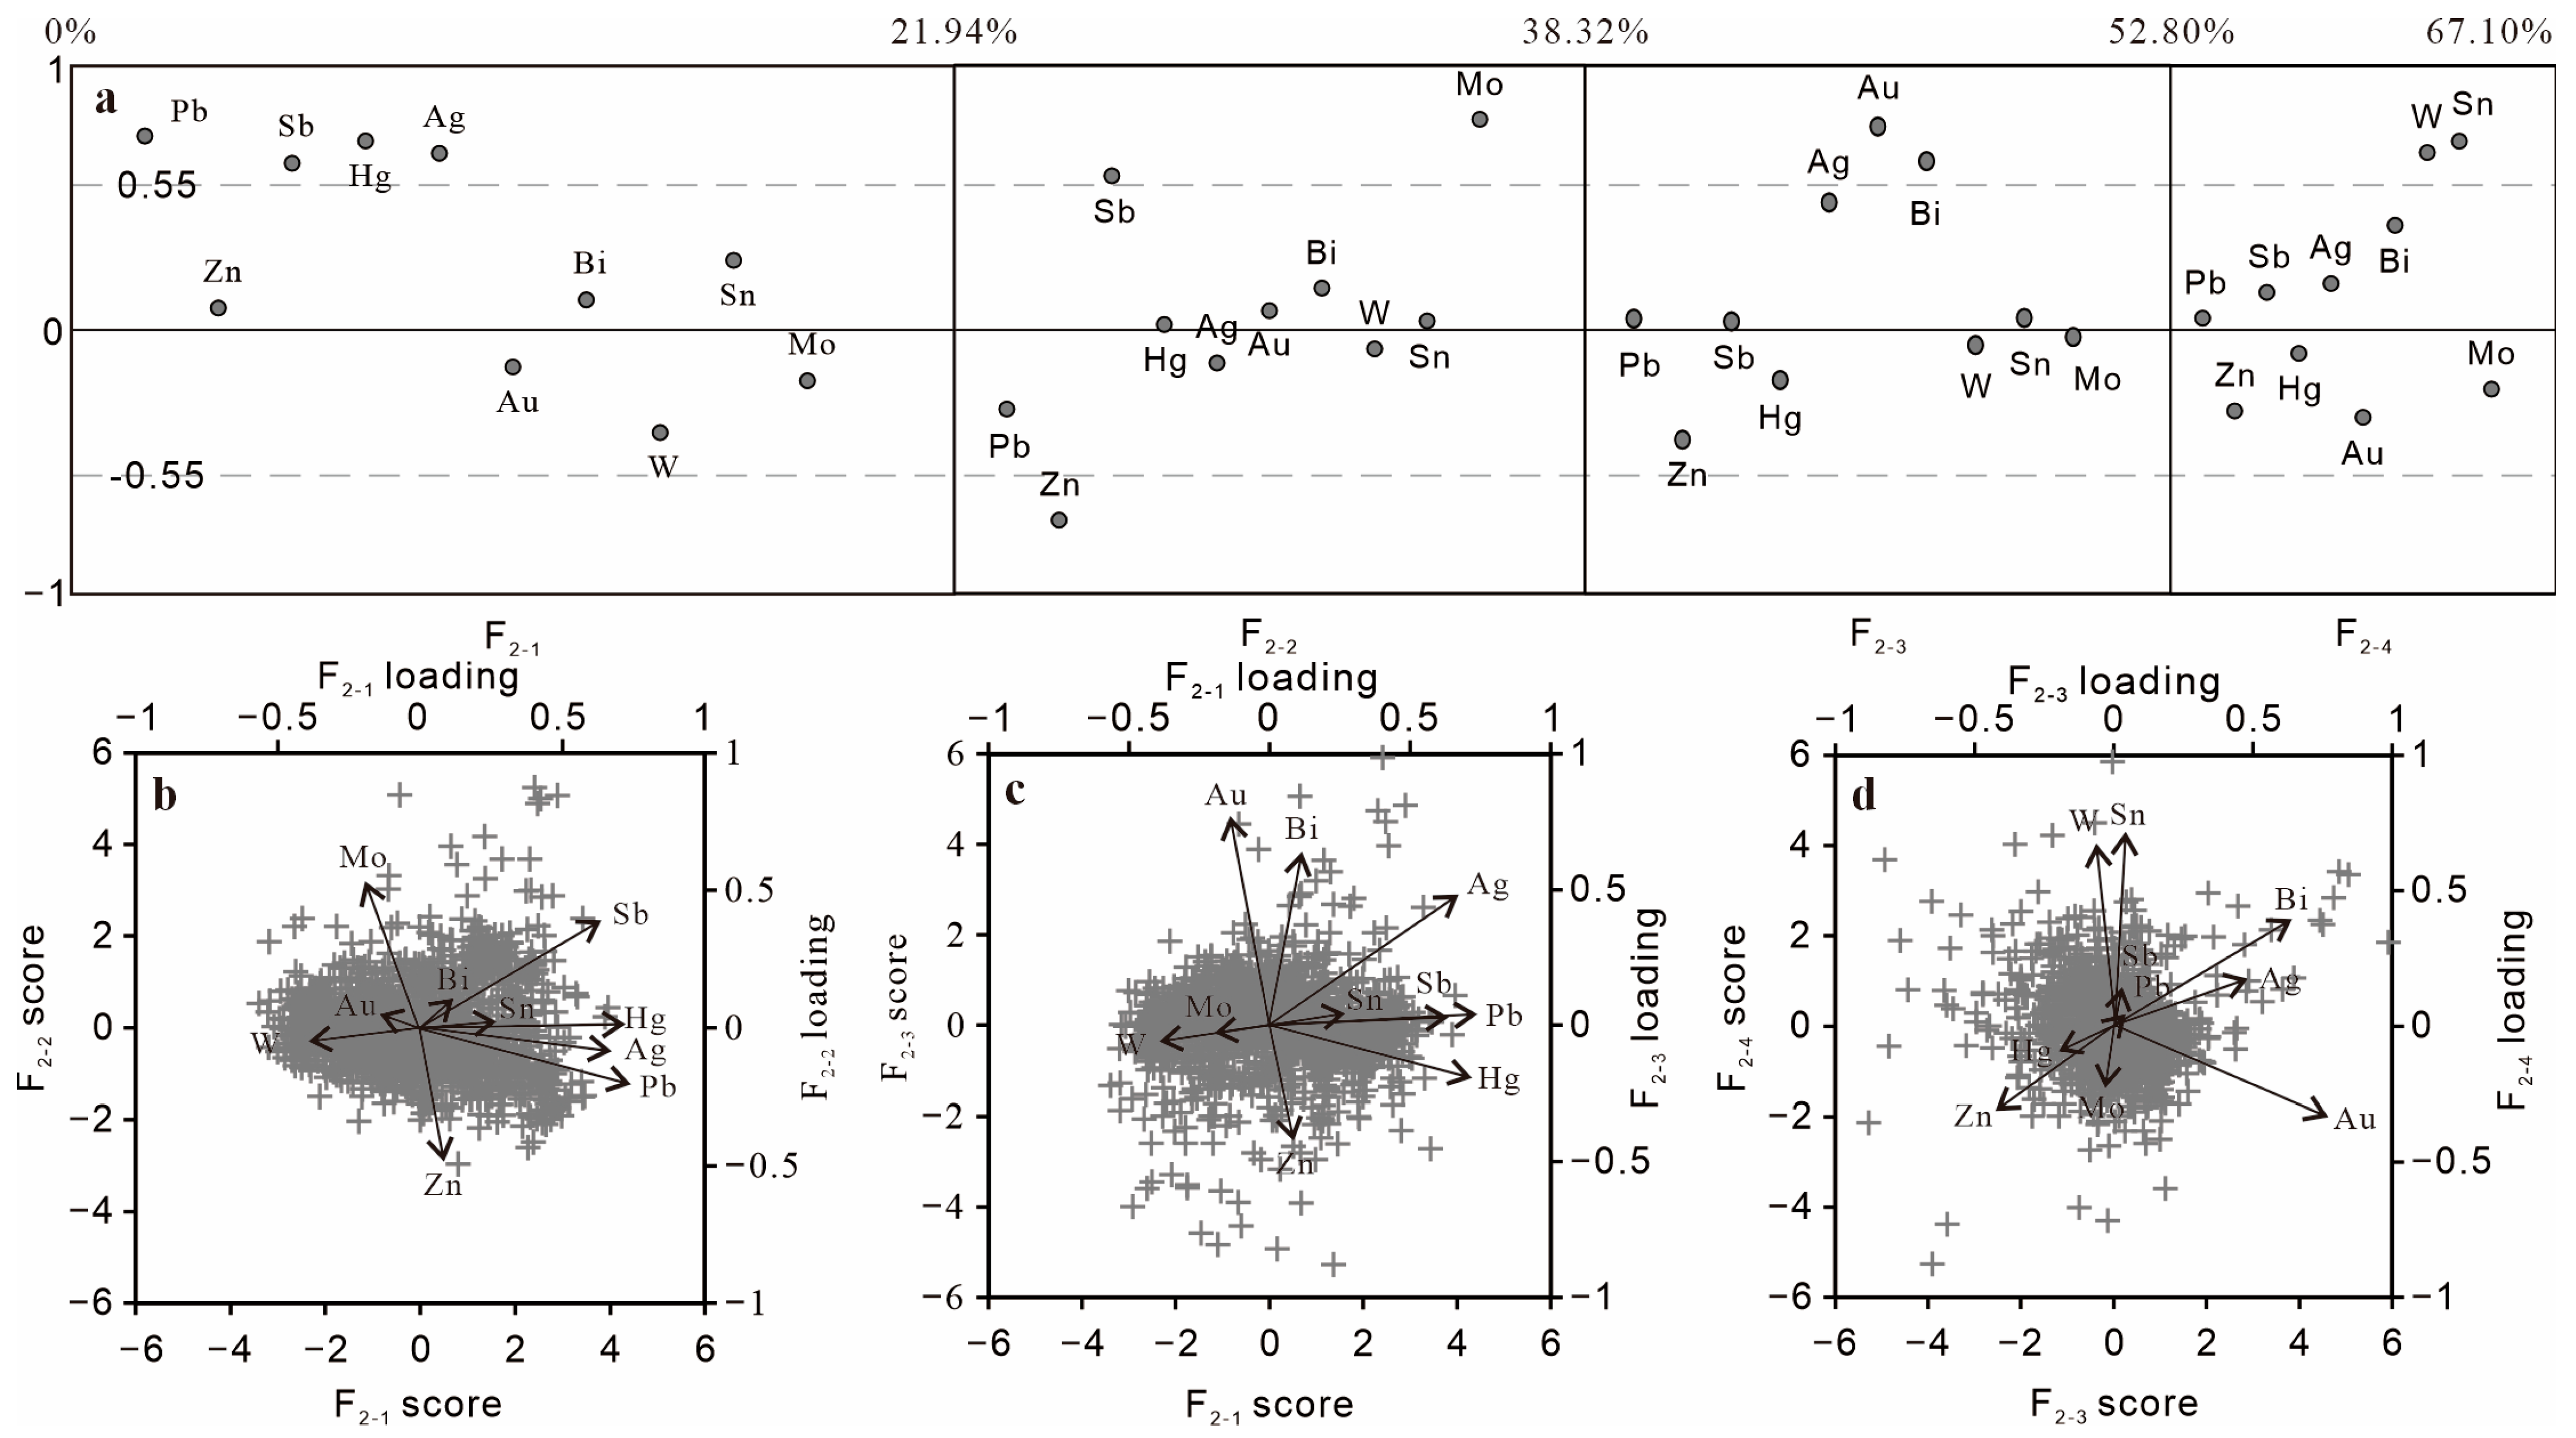
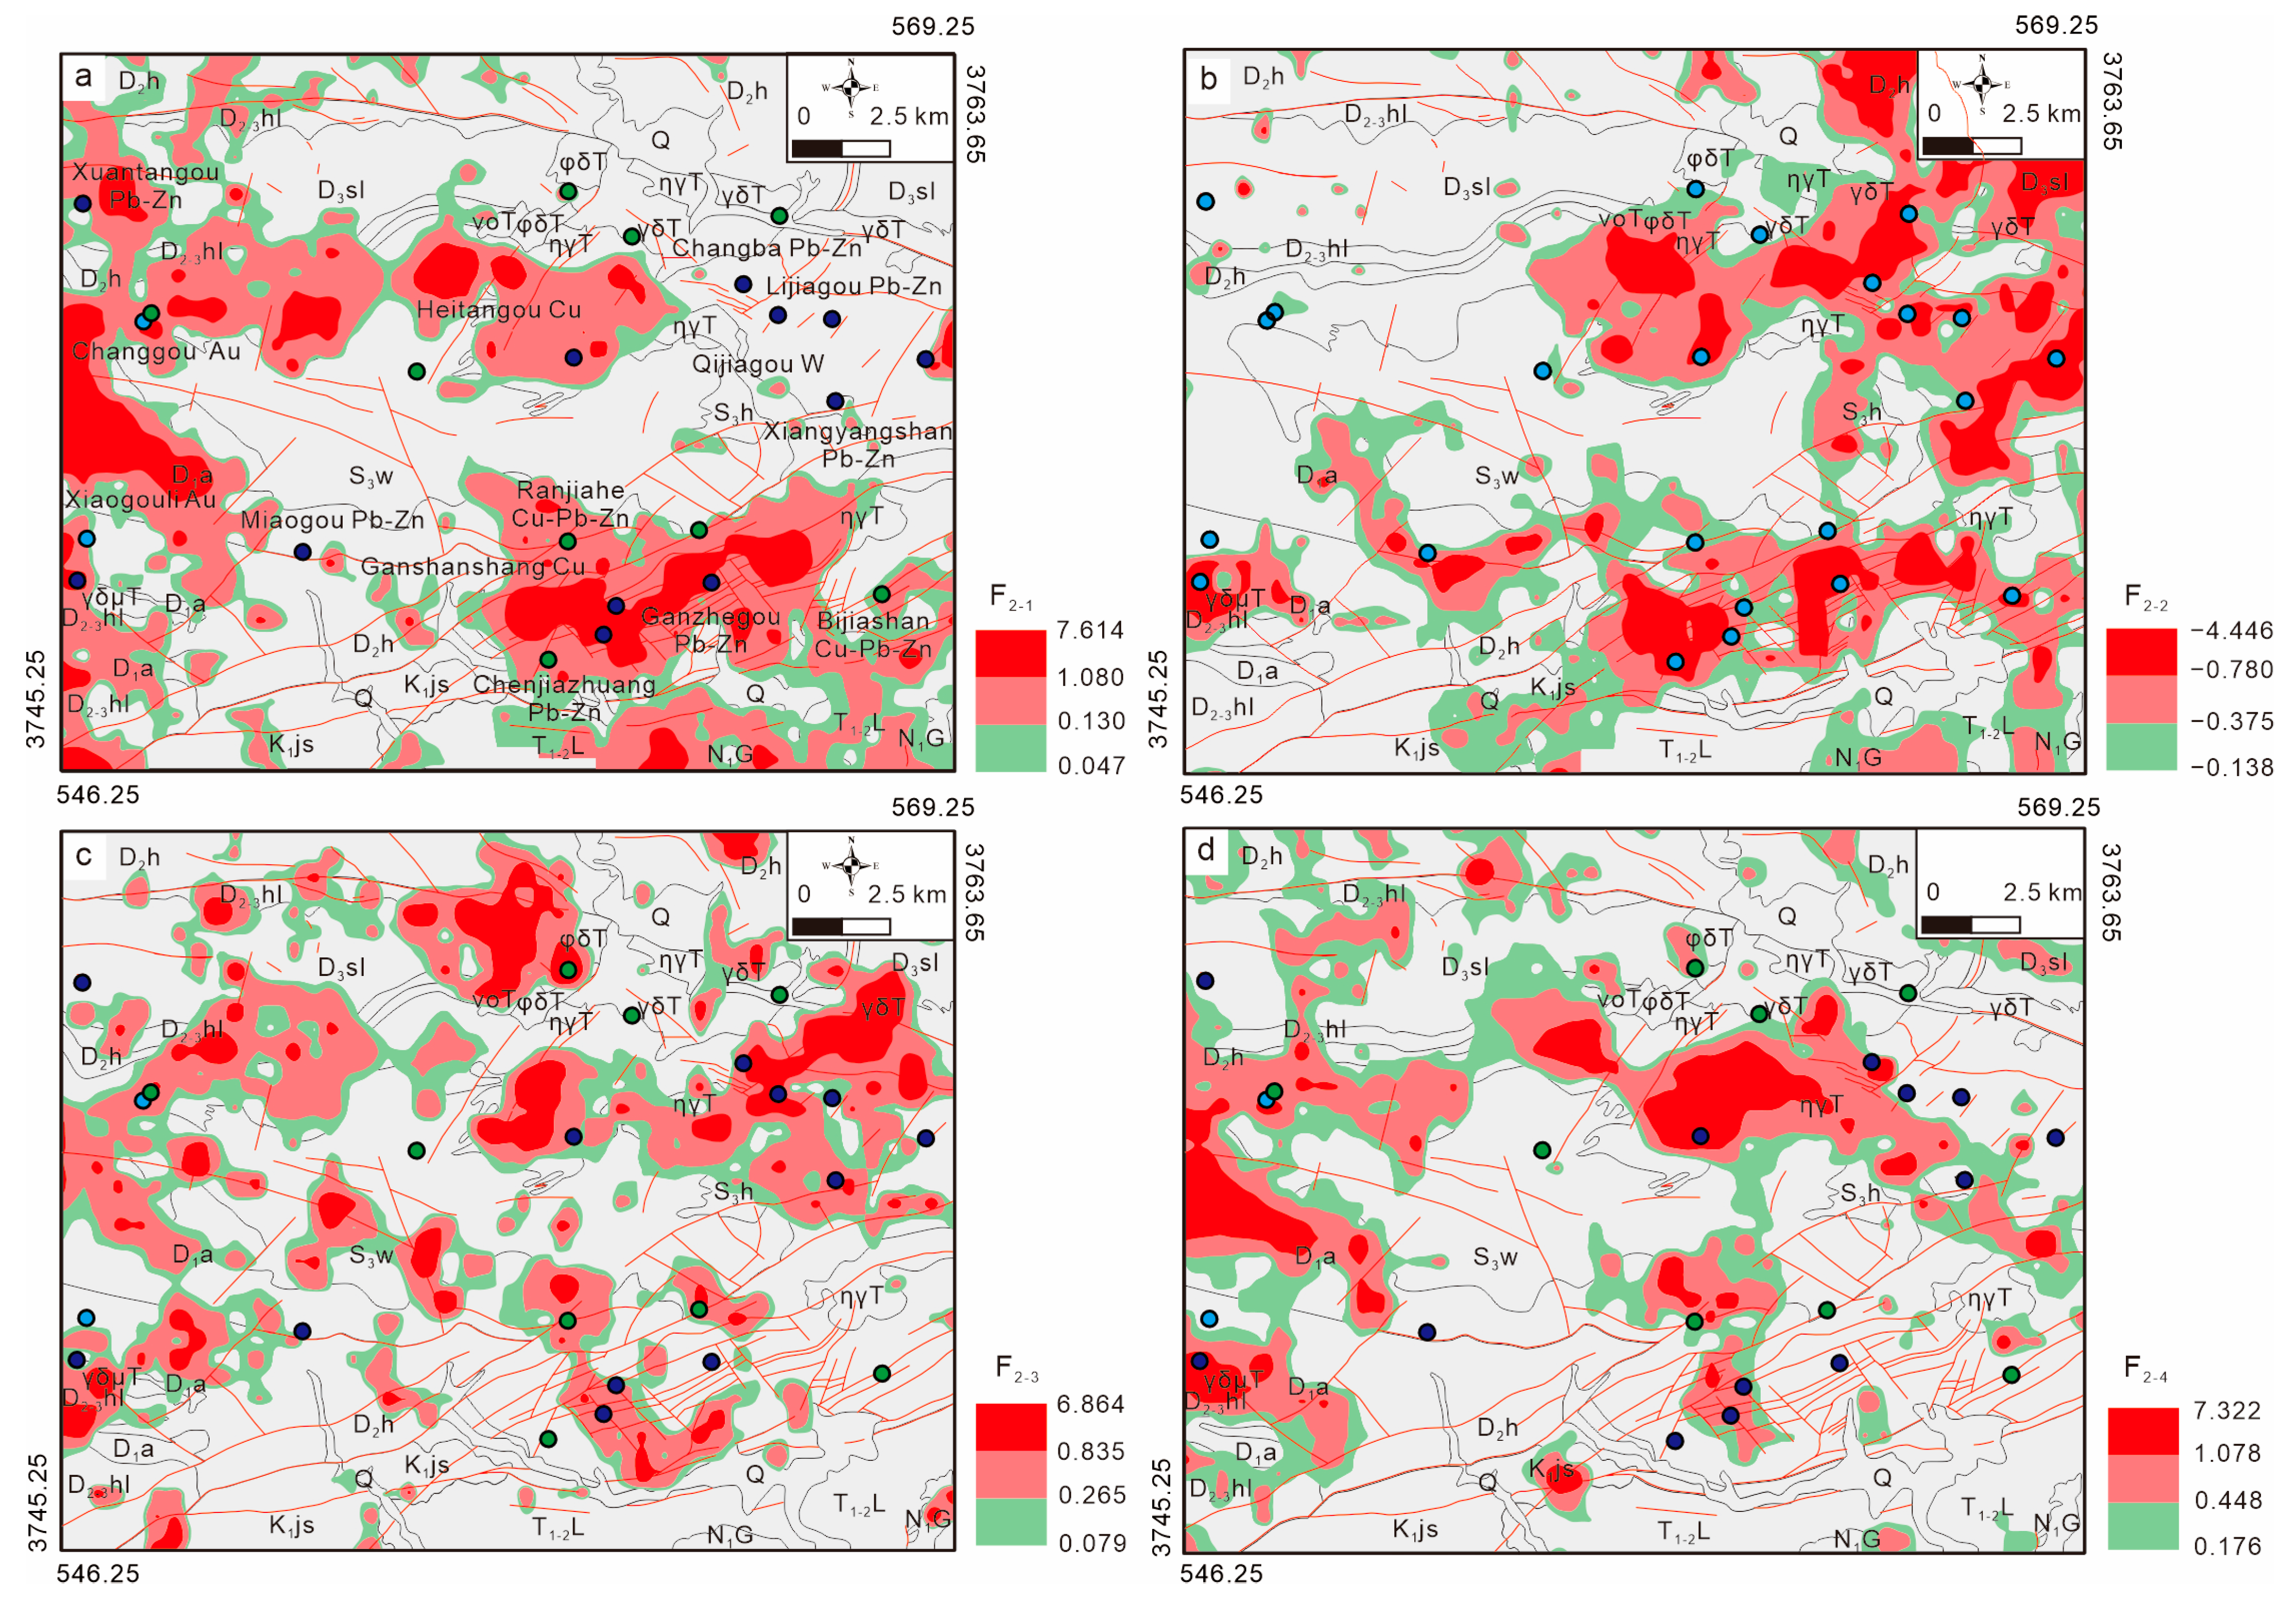
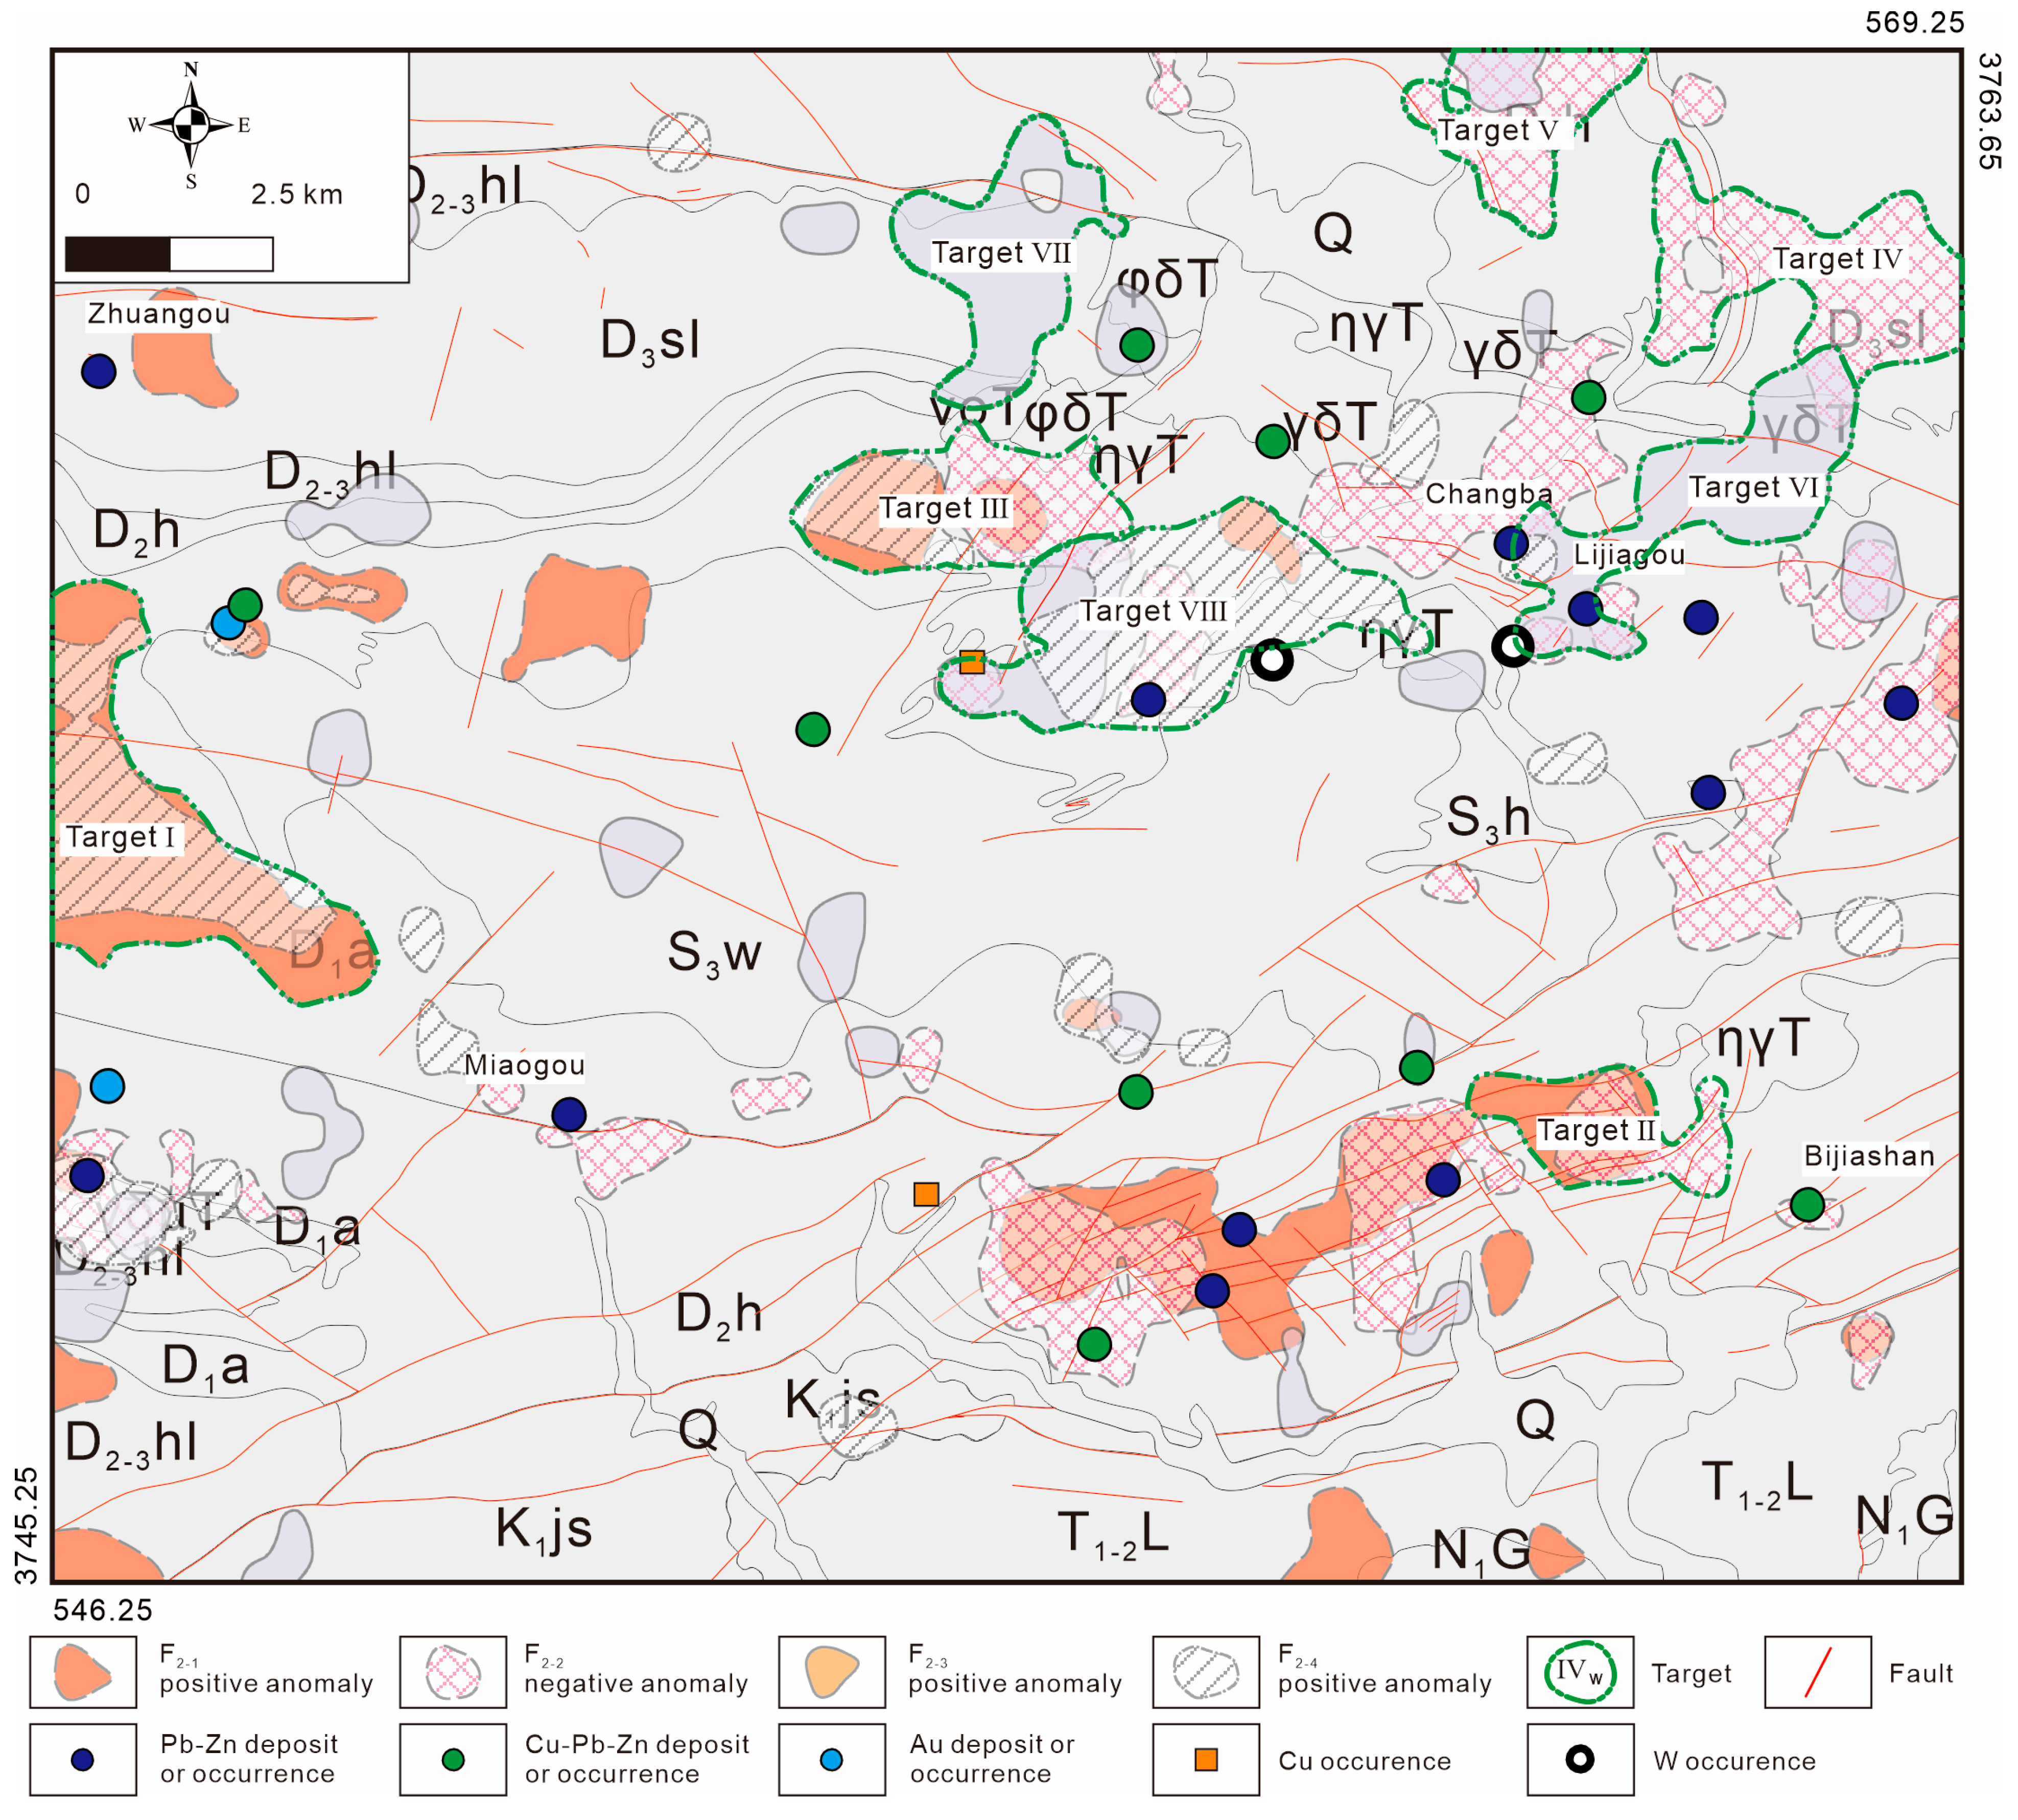
4.3. Multi-Element Geochemical Signatures and Target Delineation
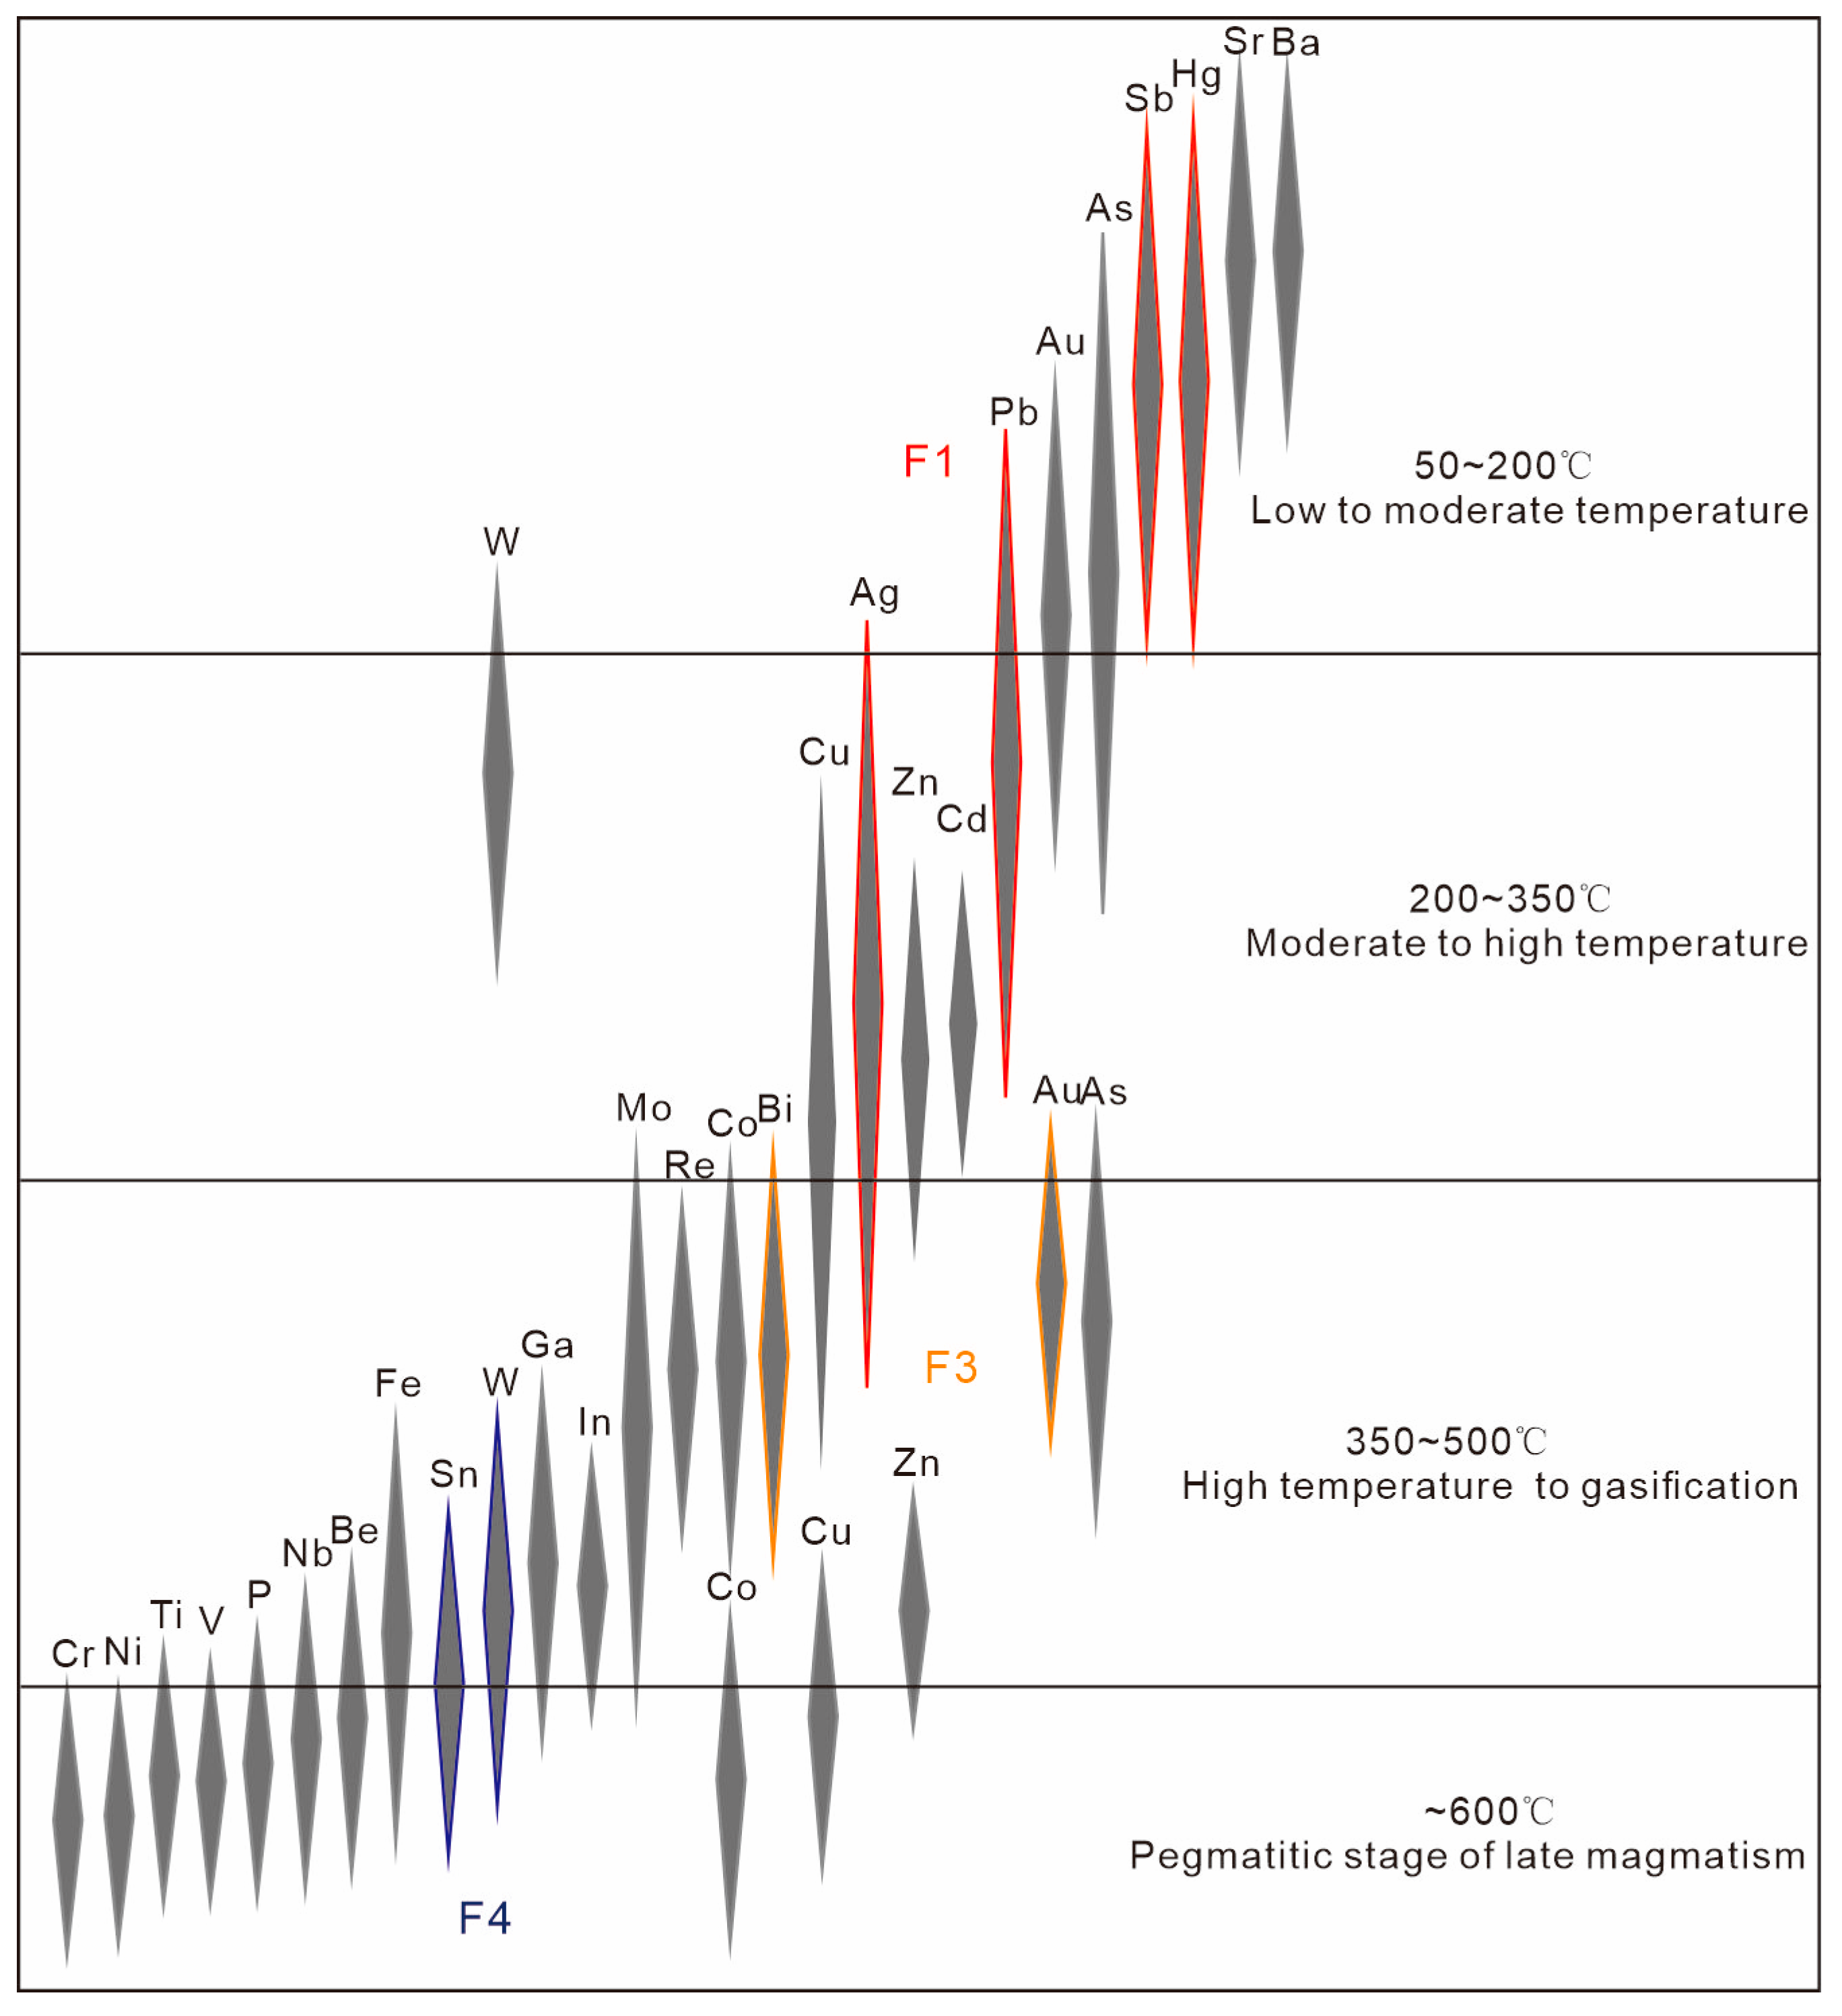
- F2-1 (22%) shows strong positive loadings for Pb, Ag, Sb, and Hg.
- F2-2 (16%) shows strong positive loadings for Mo and Sb, and a negative loading for Zn.
- F2-3 (14%) has positive loadings for Au and Bi.
- F2-4 (14%) shows strong positive loadings for W and Sn.
5. Discussion
6. Conclusions
- (1)
- As a regional lithogeochemical method, the tectono-geochemistry method—using tailored sampling media and a composite sampling scheme, combined with staged factor analysis (SFA) and C–A fractal model—can efficiently and economically identify ore-related geochemical anomalies.
- (2)
- With support from SFA and C–A fractal model, positive F2-1 (Pb–Ag–Sb–Hg) and negative F2-2 (Zn) anomalies are reliable indicators of Pb–Zn mineralization, while positive F2-3 (Au–Bi) and F2-4 (W–Sn) are vectors towards Au and W mineralization. Eight targets have been delineated based on strong anomaly signatures.
- (3)
- Based on empirical zoning patterns of hydrothermal deposits, Pb–Zn mineralization should be prioritized due to its likely shallow depths; Au and W also warrant focused exploration at greater depths, given the strong geochemical anomalies and limited existing discoveries.
Author Contributions
Funding
Data Availability Statement
Conflicts of Interest
References
- Zhang, S.Y.; Zhao, H.S.; Wu, J.M. Discussion on controlling conditions of metallogenesis and enrichment regularities of mineralization of lead-zinc deposits in Changba Lijiagou area. Miner. Resour. Geol. 1988, 2, 1–9, (In Chinese with English Abstract). [Google Scholar]
- Li, H.; Wang, Z.; Li, F. Ideal models of superimposed primary halos in hydrothermal gold deposits. J. Geochem. Explor. 1995, 55, 329–336. [Google Scholar] [CrossRef]
- Carranza, E.J.M.; Sadeghi, M. Primary geochemical characteristics of mineral deposits—Implications for exploration. Ore Geol. Rev. 2012, 45, 1–4. [Google Scholar] [CrossRef]
- Gong, Q.J.; Xia, X.Q.; Liu, N.Q. Research progress of applied geochemistry during the decade of 2011 to 2020 in China. Bull. Mineral. Petrol. Geochem. 2020, 39, 927–944, (In Chinese with English Abstract). [Google Scholar]
- Govett, G.J.S. Rock geochemistry in mineral exploration. In Handbook of Exploration Geochemistry; Govett, G.J.S., Ed.; Elsevier: Amsterdam, The Netherlands, 1983; Volume 3, pp. 1–461. [Google Scholar]
- MacLean, W.H.; Barrett, T.J. Lithogeochemical techniques using immobile elements. J. Geochem. Explor. 1993, 48, 109–133. [Google Scholar] [CrossRef]
- Harris, J.R.; Wilkinson, L.; Grunsky, E.C. Effective use and interpretation of lithogeochemical data in regional mineral exploration programs: Application of Geographic Information Systems (GIS) technology. Ore Geol. Rev. 2000, 16, 107–143. [Google Scholar] [CrossRef]
- Shao, Y.; Xie, X.J. Study on geochemical prospecting method of a lead-zinc deposit in Northeast China. Acta Geol. Sin. 1961, 41, 261–272, (In Chinese with English Abstract). [Google Scholar]
- Shao, Y. Rock Measurements (Primary Halo Method) in the Hydrothermal Deposits Prospecting; Geological Publishing House: Beijing, China, 1997; pp. 1–148. (In Chinese) [Google Scholar]
- Han, R.; Ma, D.; Wu, P.; Ma, G. Ore-finding method of fault tectono-geochemistry in the Tongchang Cu-Au polymetallic orefield, Shaanxi, China: I. Dynamics of tectonic ore-forming processes and prognosis of concealed ores. Chin. J. Geochem. 2009, 28, 397–404. [Google Scholar] [CrossRef]
- Cheng, Z.Z.; Yuan, H.X.; Peng, L.L.; Lu, G.A.; Jia, X.X.; Bing, M.M.; Lin, C.G. A geochemical method for finding concealed ore deposits in bedrock outcrop area: Application of tectono-geochemical survey. Earth Sci. Front. 2021, 28, 328–337, (In Chinese with English Abstract). [Google Scholar]
- Cheng, Z.Z.; Wang, Q.; Liu, J.C.; Pang, Z.S.; Yan, T.J.; Du, Z.Z.; Bing, M.M.; Yuan, H.X.; Lin, C.G. Hidden deposit exploration using the tectono-geochemistry method in the western Xicheng ore field, China. J. Geochem. Explor. 2024, 267, 107592. [Google Scholar] [CrossRef]
- Han, R.S.; Chen, J.; Wang, F.; Wang, X.K.; Li, Y. Analysis of metal–element association halos within fault zones for the exploration of concealed ore-bodies—A case study of the Qilinchang Zn–Pb–(Ag–Ge) deposit in the Huize mine district, northeastern Yunnan, China. J. Geochem. Explor. 2015, 159, 62–78. [Google Scholar] [CrossRef]
- Qian, J.; Chen, H.; Meng, Y. Geological characteristics of the Sizhuang gold deposit in the region of Jiaodong, Shandong Province—A study on tectono-geochemical ore prospecting of ore deposits. Chin. J. Geochem. 2011, 30, 539–553. [Google Scholar] [CrossRef]
- Mao, J.W.; Qiu, Y.M.; Goldfarb, R.J.; Zhang, Z.C.; Garwin, S.; Ren, F.S. Geology, distribution, and classification of gold deposits in the Western Qinling Belt, central China. Miner. Deposita 2002, 37, 352–377. [Google Scholar] [CrossRef]
- Zhang, S.X.; Hu, Q.Q.; Wang, Y.T.; Wei, R.; Ke, C.H. Characteristics of ore geology and ore-controlling factors of giant Guojiagou Pb-Zn deposit in Xicheng ore concentration area, western Qinling. Miner. Depos. 2019, 38, 1129–1146, (In Chinese with English Abstract). [Google Scholar]
- Wang, Y.T.; Mao, J.W.; Hu, Q.Q.; Wei, R.; Chen, S.C. Characteristics and metallogeny of Triassic polymetallic mineralization in Xicheng and Fengtai ore cluster Zones, West Qinling, China and their implications for prospecting targets. J. Earth Sci. Environ. 2021, 43, 409–435, (In Chinese with English Abstract). [Google Scholar]
- Wang, C.M. Exploration on metallogenic regularity of Bijiashan lead-zinc deposit in Cheng county, Gansu. Gold Sci. Technol. 2001, 9, 30–32, (In Chinese with English Abstract). [Google Scholar]
- Ma, G.L.; Beaudoin, G.; Qi, S.J.; Li, Y. Geology and geochemistry of the Changba SEDEX Pb-Zn deposit, Qinling orogenic belt, China. Miner. Deposita 2004, 39, 380–395. [Google Scholar] [CrossRef]
- Zhu, X.Y.; Wang, D.B.; Wei, Z.G.; Qiu, X.P.; Wang, R.T. Exhalative Lead-Zinc Deposits in Shallow Sea, Southern Xicheng Belt, Gansu Province. Acta Geol. Sin. (Engl. Ed.) 2008, 82, 811–819. [Google Scholar]
- Ni, P.; Wang, T.G.; Wang, G.G.; Li, W.S.; Pan, J.Y. Metamorphic fluid superimposition of the Changba–Lijiagou Pb–Zn deposit, West Qinling Orogen, Central China. Geol. Soc. Spec. Publ. 2019, 478, 265–286. [Google Scholar] [CrossRef]
- Dong, H.L. Preliminary discussion on geological characteristics and genesis of lead-zinc deposits in the Xicheng District, Gansu Province. Northwestern Geol. 1980, 42–48. (In Chinese) [Google Scholar]
- Wu, Z.Z.; Xie, H.C. Preliminary discussion on fourth dimension space-time structure modeling of Bijiashan polymetallic deposit. Geol. Prospect. 2004, 40, 39–42, (In Chinese with English Abstract). [Google Scholar]
- Reimann, C.; Filzmoser, P.; Garrett, R.G. Factor analysis applied to regional geochemical data: Problems and possibilities. Appl. Geochem. 2002, 17, 185–206. [Google Scholar] [CrossRef]
- Zuo, R.G. Identification of geochemical anomalies associated with mineralization in the Fanshan district, Fujian, China. J. Geochem. Explor. 2014, 139, 170–176. [Google Scholar] [CrossRef]
- Afzal, P.; Tehrani, M.E.; Ghaderi, M.; Hosseini, M.R. Delineation of supergene enrichment, hypogene and oxidation zones utilizing staged factor analysis and fractal modeling in Takht-e-Gonbad porphyry deposit, SE Iran. J. Geochem. Explor. 2016, 161, 119–127. [Google Scholar] [CrossRef]
- Hosseini, S.T.; Asghari, O.; Asghari, H.A. Multivariate anomaly modeling of primary geochemical halos by U-spatial statistic algorithm development: A case study from the Sari Gunay epithermal gold deposit, Iran. Ore Geol. Rev. 2020, 127, 103845. [Google Scholar] [CrossRef]
- Yousefi, M.; Kamkar-Rouhani, A.; Carranza, E.J.M. Geochemical mineralization probability index (GMPI): A new approach to generate enhanced stream sediment geochemical evidential map for increasing probability of success in mineral potential mapping. J. Geochem. Explor. 2012, 115, 24–35. [Google Scholar] [CrossRef]
- Yousefi, M.; Kamkar-Rouhani, A.; Carranza, E.J.M. Application of staged factor analysis and logistic function to create a fuzzy stream sediment geochemical evidence layer for mineral prospectivity mapping. Geochem. Explor. Environ. Anal. 2014, 14, 45–58. [Google Scholar] [CrossRef]
- Yousefi, M.; Carranza, E.J.M. Fuzzification of continuous-value spatial evidence for mineral prospectivity mapping. Comput. Geosci. 2015, 74, 97–109. [Google Scholar] [CrossRef]
- Fyzollahhi, N.; Torshizian, H.; Afzal, P.; Jafari, M.R. Determination of lithium prospects using fractal modeling and staged factor analysis in Torud region, NE Iran. J. Geochem. Explor. 2018, 189, 2–10. [Google Scholar] [CrossRef]
- Zhao, M.; Xia, Q.; Wu, L.; Liang, Y. Identification of multi-element geochemical anomalies for Cu–polymetallic deposits through staged factor analysis, improved fractal density and expected value function. Nat. Resour. Res. 2022, 31, 1867–1887. [Google Scholar] [CrossRef]
- Yousefi, M.; Barak, S.; Salimi, A.; Yousefi, S. Should geochemical indicators be integrated to produce enhanced signatures of mineral deposits? A discussion with regard to exploration scale. J. Min. Environ. 2023, 14, 1011–1018. [Google Scholar]
- Saremi, M.; Yousefi, S.; Yousefi, M. Combination of Geochemical and Structural Data to Determine Exploration Target of Copper Hydrothermal Deposits in Feizabad District. J. Min. Environ. 2024, 15, 1089–1101. [Google Scholar]
- Aitchison, J. The statistical analysis of compositional data. J. R. Stat. Soc. Ser. B Stat. Methodol. 1982, 44, 139–160. [Google Scholar] [CrossRef]
- Thió-Henestrosa, S.; Martín-Fernández, J.A. Dealing with Compositional Data: The Freeware CoDaPack. Math. Geol. 2005, 37, 773–793. [Google Scholar] [CrossRef]
- Thió-Henestrosa, S.; Martín-Fernández, J.A. Detailed guide to CoDaPack: A freeware compositional software. Geol. Soc. London Spec. Publ. 2006, 264, 101–118. [Google Scholar] [CrossRef]
- Cheng, Q.; Agterberg, F.P.; Ballantyne, S.B. The separation of geochemical anomalies from background by fractal methods. J. Geochem. Explor. 1994, 51, 109–130. [Google Scholar] [CrossRef]
- Carranza, E.J.M. Geochemical Anomaly and Mineral Prospectivity Mapping in GIS. In Handbook of Exploration and Environmental Geochemistry; Hale, M., Ed.; Elsevier: Amsterdam, The Netherlands, 2009; Volume 10, pp. 3–351. [Google Scholar]
- Zuo, R.G.; Carranza, E.J.M.; Cheng, Q.M. Fractal/multifractal modelling of geochemical exploration data. J. Geochem. Explor. 2012, 122, 1–3. [Google Scholar] [CrossRef]
- Shahriari, H.; Ranjbar, H.; Honarmand, M. Image segmentation for hydrothermal alteration mapping using PCA and concentration–area fractal model. Nat. Resour. Res. 2013, 22, 191–206. [Google Scholar] [CrossRef]
- Zuo, R.G.; Wang, J. ArcFractal: An ArcGIS add-in for processing geoscience data using fractal/multifractal models. Nat. Resour. Res. 2020, 29, 3–12. [Google Scholar] [CrossRef]
- Zuo, R.G.; Wang, J. Fractal/multifractal modeling of geochemical data: A review. J. Geochem. Explor. 2016, 164, 33–41. [Google Scholar] [CrossRef]
- Farhadi, S.; Afzal, P.; Boveiri Konari, M.; Daneshvar Saein, L.; Sadeghi, B. Combination of machine learning algorithms with concentration-area fractal method for soil geochemical anomaly detection in sediment-hosted Irankuh Pb-Zn deposit, Central Iran. Minerals 2022, 12, 689. [Google Scholar] [CrossRef]
- Hosseini, S.A.; Khah, N.K.F.; Kianoush, P.; Afzal, P.; Ebrahimabadi, A.; Shirinabadi, R. Integration of fractal modeling and correspondence analysis reconnaissance for geochemically high-potential promising areas, NE Iran. Results Geochem. 2023, 11, 100026. [Google Scholar] [CrossRef]
- Ma, H.; Wang, D.; Bai, F.; Zhang, X.; Wang, G.; Dong, S.; Wang, G. Mapping exploration targets through multifractal modelling of soil geochemical data in the Xiaohongshilazi Pb–Zn–(Ag) ore district, Jilin Province, NE China. Geochem. Explor. Environ. Anal. 2024, 24, geochem2023-067. [Google Scholar] [CrossRef]
- Ni, C.Z.; Zhang, S.T.; Chen, Z.; Yan, Y.F.; Li, Y. Mapping the spatial distribution and characteristics of lineaments using fractal and multifractal models: A case study from Northeastern Yunnan Province, China. Sci. Rep. 2017, 7, 10511. [Google Scholar] [CrossRef]
- Wedepohl, K.H. The composition of the continental crust. Geochim. Cosmochim. Acta 1995, 59, 1217–1232. [Google Scholar] [CrossRef]
- McLennan, S.M. Relationships between the trace element composition of sedimentary rocks and upper continental crust. Geochem. Geophys. Geosyst. 2001, 2, 2000GC000109. [Google Scholar] [CrossRef]
- Beus, A.A.; Grigorian, S.V. Geochemical Exploration Methods for Mineral Deposits; Applied Publ. Ltd: Wilmette, IL, USA, 1977; pp. 1–288. [Google Scholar]
- Levinson, A.A. Introduction of Exploration Geochemistry; Applied Publ. Ltd: Wilmette, IL, USA, 1974; pp. 1–612. [Google Scholar]
- Plant, J.; Hale, M. Drainage Geochemistry. Handbook of Exploration Geochemistry; Elsevier: Amsterdam, The Netherlands, 1994; p. 8. [Google Scholar]
- Robert, F.; Brommecker, R.; Bourne, B.T.; Dobak, P.J.; McEwan, C.J.; Rowe, R.R.; Zhou, X. Models and exploration methods for major gold deposit types. In Proceedings of the Exploration 07: Fifth Decennial International Conference on Mineral Exploration, Toronto, ON, Canada, 9–12 September 2007; Paper 48. pp. 691–711. [Google Scholar]
- Wang, D.; Mathur, R.; Zheng, Y.; Qiu, K.; Wu, H. Redox-controlled antimony isotope fractionation in the epithermal system: New insights from a multiple metal stable isotopic combination study of the Zhaxikang Sb–Pb–Zn–Ag deposit in Southern Tibet. Chem. Geol. 2021, 584, 120541. [Google Scholar] [CrossRef]
- Makshakov, A.S.; Kravtsova, R.G.; Tatarinov, V.V. Lithochemical Stream Sediments of the Dukat Gold–Silver Ore-Forming System (North–East of Russia). Minerals 2019, 9, 789. [Google Scholar] [CrossRef]
- Borrajo, I.; Tornos, F.; Stein, H.; Hanchar, J.M. Geochronology and decoupling controls of Sn-(Ta-Li) and W-(Sn) mineralization in the Iberian Variscan Massif, Spain and Portugal. Ore Geol. Rev. 2024, 173, 106253. [Google Scholar] [CrossRef]
- Wang, D.; Wang, X.L.; Cai, Y.; Li, J.Y.; Du, D.H.; Shu, X.J. Exploring the Sn–W metallogenic potential of Late Jurassic Ganfang-Guyangzhai granite suite, South China: Zircon and apatite geochemistry. Ore Geol. Rev. 2022, 144, 104863. [Google Scholar] [CrossRef]
- Hu, Q.; Wang, Y.; Mao, J.; Wei, R.; Liu, S.; Ye, D.; Yuan, Q.; Dou, P. Timing of the formation of the Changba–Lijiagou Pb–Zn ore deposit, Gansu Province, China: Evidence from Rb–Sr isotopic dating of sulfides. J. Asian Earth Sci. 2015, 103, 350–359. [Google Scholar] [CrossRef]
- Hawkes, H.E. Principles of Geochemical Prospecting (No. 1000); U.S. Government Printing Office: Washington, DC, USA, 1957; pp. 225–355.
- Rose, A.W.; Hawkes, H.E.; Webb, J.S. Geochemistry in Mineral Exploration, 2nd ed.; Academic Press: New York, NY, USA, 1979; pp. 1–657. [Google Scholar]
- Neff, T.R. Chemistry and the modern prospector. J. Chem. Educ. 1981, 58, 699–703. [Google Scholar] [CrossRef]
- Boyle, R.W. The prospect for geochemical exploration—Predictable advances and new approaches. J. Geochem. Explor. 1984, 21, 1–18. [Google Scholar] [CrossRef]
- Zhao, J.; Zuo, R.; Chen, S.; Kreuzer, O.P. Application of the tectono-geochemistry method to mineral prospectivity mapping: A case study of the Gaosong tin-polymetallic deposit, Gejiu district, SW China. Ore Geol. Rev. 2015, 71, 719–734. [Google Scholar] [CrossRef]
- Li, S.T.; Xu, L.Y.; Wang, Z.P.; Yang, C.F.; Tan, L.J.; Nie, R.; Meng, M.H.; Li, J.H.; Zhang, B.Q.; Liu, J.Z. Application of tectono-geochemistry method for weak information extraction of Carlin-type gold deposits in Yunnan–Guizhou–Guangxi, SW China. Ore Geol. Rev. 2023, 163, 105813. [Google Scholar] [CrossRef]
- Zhao, D.; Han, R.S.; Liu, F.; Fu, Y.X.; Zhang, X.P.; Qiu, W.L.; Tao, Q. Constructing the deep-spreading pattern of tectono-geochemical anomalies and its implications on the Huangshapin W–Sn–Pb–Zn polymetallic deposit in southern Hunan, China. Ore Geol. Rev. 2022, 148, 105040. [Google Scholar] [CrossRef]
- Liu, Y.; Xia, Q.L.; Cheng, Q.M. Sequential Gaussian co-simulation of tectono-geochemical anomaly for concealed ore deposit prediction. Appl. Geochem. 2023, 157, 105768. [Google Scholar] [CrossRef]
- Song, W.F.; Liu, J.Z.; Wu, P.; Li, J.H.; Wang, Z.P.; Yang, C.F.; Tan, Q.P.; Wang, D.F. A successful application of the tectono-geochemistry weak information extraction method in the prospecting of Carlin-type gold deposits in southwestern Guizhou Province. Geophys. Geochem. Explor. 2022, 46, 1338–1348, (In Chinese with English Abstract). [Google Scholar]
- Yan, Z.; Wang, Z.Q.; Wang, T.; Yan, Q.R.; Xiao, W.J.; Li, J.L. Provenance and tectonic setting of clastic deposits in the Devonian Xicheng Basin, Qinling orogen, Central China. J. Sediment. Res. 2006, 76, 557–574. [Google Scholar] [CrossRef]
- Wei, R.; Wang, Y.T.; Mao, J.W.; Hu, Q.Q.; Qin, S.T.; Liu, S.Y.; Ye, D.J.; Yuan, Q.H.; Dou, P. Genesis of the Changba–Lijiagou Giant Pb–Zn Deposit, West Qinling, Central China: Constraints from S–Pb–C–O isotopes. Acta Geol. Sin. (Engl. Ed.) 2020, 94, 884–900. [Google Scholar] [CrossRef]
- Wang, Q.; Wang, X.Q.; Liu, H.L.; Yan, T.T.; Zhang, B.M.; Tian, M.; Yang, D.P.; Xiong, Y.X. 3D geochemical modeling of the Qujia gold deposit, China: Implications for ore genesis and geochemical exploration of deep concealed ore bodies. Ore Geol. Rev. 2022, 144, 104819. [Google Scholar] [CrossRef]
- Wang, X.Q.; Zhang, Q.; Zhou, G.H. National-scale geochemical mapping projects in China. Geostand. Geoanal. Res. 2007, 31, 311–320. [Google Scholar] [CrossRef]
- Cicchella, D.; Lima, A.; Birke, M.; Demetriades, A.; Wang, X.; Vivo, B.D. Mapping geochemical patterns distribution at large scale using composite samples to reduce the analytical costs. J. Geochem. Explor. 2013, 124, 79–91. [Google Scholar] [CrossRef]
- Hosseini-Dinani, H.; Mokhtari, A.R.; Shahrestani, S.; Vivo, D.B. Sampling density in regional exploration and environmental geochemical studies: A review. Nat. Resour. Res. 2019, 28, 967–994. [Google Scholar] [CrossRef]
- Deng, H.J.; Zhu, D.L. Metallogenic series and ore-searching prospect in the Xicheng mineralization area of Gansu Province. Geol. Prospect. 2010, 46, 1045–1050, (In Chinese with English Abstract). [Google Scholar]
- Feng, J.Z.; Wang, D.B.; Wang, X.M.; Zeng, Y.S.; Li, T.F. Magmatic gold mineralization in the Western Qinling orogenic belt: Geology and metallogenesis of the Baguamiao, Liba and Xiaogouli gold deposits. Acta Geol. Sin. (Engl. Ed.) 2004, 78, 529–533. [Google Scholar]


| Elements | Analysis Methods | Units | Detection Limits |
|---|---|---|---|
| Au | Inductively coupled plasma–mass spectrometry | ng/g | 0.1 |
| Ag | Emission spectrometry | μg/g | 0.02 |
| As | Atomic fluorescence spectroscopy | μg/g | 0.2 |
| Bi | Inductively coupled plasma–mass spectrometry | μg/g | 0.05 |
| Cu | X-ray fluorescence spectroscopy | μg/g | 0.9 |
| Pb | X-ray fluorescence spectroscopy | μg/g | 2.0 |
| Zn | X-ray fluorescence spectroscopy | μg/g | 1.0 |
| Cd | Inductively coupled plasma–mass spectrometry | μg/g | 0.05 |
| Hg | Cold vapor atomic fluorescence spectroscopy | ng/g | 0.3 |
| B | Emission Spectrometry | μg/g | 1 |
| Sb | Atomic fluorescence spectroscopy | μg/g | 0.05 |
| W | Inductively coupled plasma–mass spectrometry | μg/g | 0.2 |
| Sn | Emission Spectrometry | μg/g | 0.6 |
| Mo | Emission Spectrometry | μg/g | 0.2 |
| Ba | X-ray fluorescence spectroscopy | μg/g | 18 |
| Co | X-ray fluorescence spectroscopy | μg/g | 0.8 |
| Cr | X-ray fluorescence spectroscopy | μg/g | 2.5 |
| Mn | X-ray fluorescence spectroscopy | μg/g | 10 |
| Ni | X-ray fluorescence spectroscopy | μg/g | 1.0 |
| Element | Min | Mean | Max | STD | Skewness | Kurtosis | UCC | CV | EC |
|---|---|---|---|---|---|---|---|---|---|
| W (μg/g) | 0.05 | 6.22 | 5222 | 146 | 34.9 | 1246 | 2.00 | 23.4 | 3.11 |
| Pb (μg/g) | 1.90 | 64.9 | 49,089 | 1353 | 35.9 | 1302 | 17.0 | 20.9 | 3.82 |
| Bi (μg/g) | 0.09 | 0.53 | 227 | 6.58 | 31.7 | 1066 | 0.13 | 12.4 | 4.18 |
| Zn (μg/g) | 2.70 | 138 | 41,654 | 1403 | 22.9 | 614 | 71.0 | 10.1 | 1.95 |
| Cd (μg/g) | 0.01 | 0.44 | 99.5 | 4.01 | 21.1 | 482 | 0.10 | 9.07 | 4.51 |
| Ag (μg/g) | 0.03 | 0.19 | 40.2 | 1.39 | 23.9 | 621 | 0.05 | 7.43 | 3.73 |
| Au (ng/g) | 0.10 | 8.90 | 1624 | 60.6 | 18.6 | 428 | 1.80 | 6.81 | 4.94 |
| Hg (ng/g) | 6.00 | 48.6 | 6019 | 289 | 15.0 | 253 | 56.0 | 5.94 | 0.87 |
| Cu (μg/g) | 1.90 | 21.0 | 3208 | 102 | 26.1 | 762 | 25.0 | 4.86 | 0.84 |
| Sb (μg/g) | 0.44 | 1.17 | 56.24 | 1.91 | 21.1 | 556 | 0.20 | 1.63 | 5.86 |
| Mo (μg/g) | 0.25 | 3.39 | 41.1 | 3.05 | 2.96 | 21.2 | 1.50 | 0.90 | 2.26 |
| Sn (μg/g) | 0.40 | 2.23 | 18.2 | 1.39 | 3.34 | 26.9 | 5.50 | 0.62 | 0.41 |
| Element | Lower Quartile | Upper Quartile | Threshold | Number of Anomalous Samples |
|---|---|---|---|---|
| Pb (μg/g) | 9.0 | 21.9 | 41.3 | 80 |
| Zn (μg/g) | 16.0 | 61.7 | 130 | 51 |
| Ag (μg/g) | 0.05 | 0.13 | 0.26 | 93 |
| Au (ng/g) | 1.3 | 3.5 | 6.8 | 151 |
| W (μg/g) | 0.47 | 1.29 | 2.52 | 65 |
| Bi (μg/g) | 0.15 | 0.26 | 0.43 | 106 |
| First Stage | Second Stage (Cd and Cu Are Excluded) | ||||||||
|---|---|---|---|---|---|---|---|---|---|
| Element | F1-1 | F1-2 | F1-3 | F1-4 | Element | F2-1 | F2-2 | F2-3 | F2-4 |
| Pb | 0.66 | 0.35 | 0.17 | −0.01 | Pb | 0.73 | −0.31 | 0.04 | 0.04 |
| Zn | 0.08 | 0.73 | −0.46 | −0.27 | Zn | 0.08 | −0.72 | −0.42 | −0.31 |
| Cd | 0.47 | 0.40 | −0.33 | −0.19 | Sb | 0.63 | 0.58 | 0.03 | 0.14 |
| Sb | 0.64 | −0.52 | 0.16 | 0.05 | Hg | 0.72 | 0.02 | −0.19 | −0.09 |
| Hg | 0.75 | 0.01 | −0.14 | −0.08 | Ag | 0.67 | −0.13 | 0.48 | 0.17 |
| Ag | 0.57 | 0.21 | 0.59 | 0.02 | Au | −0.14 | 0.07 | 0.77 | −0.33 |
| Mo | −0.09 | −0.79 | −0.10 | −0.22 | Bi | 0.11 | 0.16 | 0.64 | 0.40 |
| Au | −0.20 | −0.10 | 0.65 | −0.31 | W | −0.39 | −0.07 | −0.06 | 0.67 |
| Bi | 0.10 | −0.11 | 0.66 | 0.28 | Sn | 0.26 | 0.03 | 0.04 | 0.71 |
| W | −0.29 | 0.03 | −0.10 | 0.73 | Mo | −0.19 | 0.79 | −0.03 | −0.23 |
| Sn | 0.27 | 0.003 | 0.19 | 0.66 | Eigenvalue | 2.19 | 1.64 | 1.45 | 1.43 |
| Cu | −0.548 | 0.01 | 0.02 | −0.37 | % of Variance | 21.94 | 16.39 | 14.48 | 14.30 |
| Eigenvalue | 2.47 | 1.78 | 1.65 | 1.45 | Cumulative % | 21.94 | 38.34 | 52.82 | 67.12 |
| % of variance | 20.54 | 14.84 | 13.76 | 12.07 | |||||
| Cumulative % | 20.54 | 35.38 | 49.14 | 61.21 | |||||
| Factor | Background | Anomaly | |||
|---|---|---|---|---|---|
| Low | High | Weak | Moderate | Strong | |
| F2-1 (positive) | 0–0.05 | 0.05–0.13 | 0.13–0.35 | 0.35–1.1 | 1.1–7.6 |
| F2-2 (negative) | 0–−0.03 | −0.03–−0.14 | −0.14–−0.38 | −0.38–−0.78 | −0.78–−4.4 |
| F2-3 (positive) | 0–0.01 | 0.01–0.08 | 0.08–0.27 | 0.27–0.84 | 0.84–6.9 |
| F2-4 (positive) | 0–0.05 | 0.05–0.18 | 0.18–0.45 | 0.45–1.1 | 1.1–7.3 |
Disclaimer/Publisher’s Note: The statements, opinions and data contained in all publications are solely those of the individual author(s) and contributor(s) and not of MDPI and/or the editor(s). MDPI and/or the editor(s) disclaim responsibility for any injury to people or property resulting from any ideas, methods, instructions or products referred to in the content. |
© 2025 by the authors. Licensee MDPI, Basel, Switzerland. This article is an open access article distributed under the terms and conditions of the Creative Commons Attribution (CC BY) license (https://creativecommons.org/licenses/by/4.0/).
Share and Cite
Wang, Q.; Cheng, Z.; Li, H.; Yang, T.; Yan, T.; Bing, M.; Yuan, H.; Lin, C. Mineral Exploration in the Central Xicheng Ore Field, China, Using the Tectono-Geochemistry, Staged Factor Analysis, and Fractal Model. Minerals 2025, 15, 691. https://doi.org/10.3390/min15070691
Wang Q, Cheng Z, Li H, Yang T, Yan T, Bing M, Yuan H, Lin C. Mineral Exploration in the Central Xicheng Ore Field, China, Using the Tectono-Geochemistry, Staged Factor Analysis, and Fractal Model. Minerals. 2025; 15(7):691. https://doi.org/10.3390/min15070691
Chicago/Turabian StyleWang, Qiang, Zhizhong Cheng, Hongrui Li, Tao Yang, Tingjie Yan, Mingming Bing, Huixiang Yuan, and Chenggui Lin. 2025. "Mineral Exploration in the Central Xicheng Ore Field, China, Using the Tectono-Geochemistry, Staged Factor Analysis, and Fractal Model" Minerals 15, no. 7: 691. https://doi.org/10.3390/min15070691
APA StyleWang, Q., Cheng, Z., Li, H., Yang, T., Yan, T., Bing, M., Yuan, H., & Lin, C. (2025). Mineral Exploration in the Central Xicheng Ore Field, China, Using the Tectono-Geochemistry, Staged Factor Analysis, and Fractal Model. Minerals, 15(7), 691. https://doi.org/10.3390/min15070691