Article

Depositional and Paleoenvironmental Controls on Shale Reservoir Heterogeneity in the Wufeng–Longmaxi Formations: A Case Study from the Changning Area, Sichuan Basin, China

1
Natural Gas Geology Key Laboratory of Sichuan Province, Chengdu 610500, China
2
School of Geoscience and Technology, Southwest Petroleum University, Chengdu 610500, China
3
Branch of Key Laboratory of Carbonate Reservoirs, Southwest Petroleum University, CNPC, Chengdu 610500, China
4
CNOOC Co., Ltd. Shenzhen Branch, Shenzhen 518000, China
5
Sichuan Changning Gas Development Co., Ltd., Chengdu 610051, China
6
Shale Gas Research Institute, PetroChina Southwest Oil and Gas Company, Chengdu 610014, China
7
School of Geosciences and Engineering, Nanjing University, Nanjing 210023, China
*
Author to whom correspondence should be addressed.
Minerals 2025, 15(7), 677; https://doi.org/10.3390/min15070677
Submission received: 14 May 2025 / Revised: 13 June 2025 / Accepted: 21 June 2025 / Published: 24 June 2025
(This article belongs to the Special Issue Element Enrichment and Gas Accumulation in Black Rock Series)

Abstract

Numerous uncertainties persist regarding the differential enrichment mechanisms of shale gas reservoirs in southern China. This investigation systematically examines the sedimentary environments and reservoir characteristics of the Wufeng–Longmaxi formations in the Changning area of the Sichuan Basin, through the integration of comprehensive drilling data, core samples, and analytical measurements. Multivariate sedimentary proxies (including redox conditions, terrigenous detrital influx, basinal water restriction, paleoclimatic parameters, paleowater depth variations, and paleo-marine productivity) were employed to elucidate environmental controls on reservoir development. The research findings demonstrate that during the depositional period of the Wufeng Formation in the Changning area, the bottom water was characterized by suboxic to anoxic conditions under a warm-humid paleoclimate, with limited terrigenous detrital input and strong water column restriction throughout the interval. Within the Longmaxi Formation, the depositional environment evolved from intensely anoxic conditions in the LM1 through suboxic states in the LM3 interval, approaching toxic conditions by the LM2 depositional phase. Concurrently, the paleoclimate transitioned towards warmer and more humid conditions, accompanied by progressively intensified terrigenous input from the LM1-LM6, while maintaining semi-restricted water circulation. Both paleowater depth and paleoproductivity peaked from the Wufeng Formation to the LM1 interval, followed by gradual shallowing of water depth and declining productivity during the LM3–LM6 depositional phases. Comparative analysis of depositional environments and reservoir characteristics reveals that sedimentary conditions exert a controlling influence on multiple reservoir parameters, including shale mineral composition, organic matter enrichment, pore architecture, petrophysical properties (e.g., porosity, permeability), and gas-bearing potential.

1. Introduction

Shale gas, as a transitional clean energy source, plays a pivotal role in the global transition from conventional fossil fuels to renewable energy systems. China’s recent breakthroughs in the Sichuan Basin, particularly in the Wufeng–Longmaxi Formations, underscore its world-class shale gas potential, driven by technological advancements in horizontal drilling and hydraulic fracturing [1,2,3]. These reservoirs, characterized by ultra-low permeability and complex pore systems dominated by organic-hosted pores and clay mineral fractures, exhibit gas-bearing capacities strongly controlled by total organic carbon (TOC) and thermal maturity (Ro) [4,5]. While depositional environments—defined as physically, chemically, and biologically distinct surface domains [6]—act as fundamental architects of reservoir heterogeneity through redox gradients, terrigenous clastic influx, and paleoproductivity exerting first-order control on pore-network architecture and gas retention mechanisms [7,8,9,10,11], existing studies disproportionately focus on organic matter enrichment. This leaves critical gaps in systematically understanding how these depositional environment factors (e.g., redox gradients, paleoproductivity, and terrigenous clastic influx) govern multiscale reservoir properties and gas mobility.
Prior research has established foundational models linking organic-rich shale formation to marine redox conditions, paleoproductivity, and terrigenous clastic influx [12,13,14,15]. For instance, the preservation model emphasizes anoxic conditions for organic matter retention [16,17], while the productivity model highlights biogenic input [18,19]. Recently, depositional processes—particularly turbulence dampening during en masse emplacement—have been recognized as a primary control on organic matter enrichment. Hybrid event beds (HEBs) facilitate rapid burial and clay encapsulation of terrestrial organic matter through mud-forced suppression of turbulence, significantly enhancing preservation efficiency even without persistent anoxia or high biogenic production [20]. Additionally, paleoclimate fluctuations [21], water column stratification [22,23], and restricted hydrological settings further modulate TOC enrichment [24]. However, these studies predominantly isolate key reservoir parameters: organic matter accumulation is decoupled from mineralogical assemblages, pore connectivity, mechanical brittleness, and fracture networks. For example, while Bohacs et al. and Chen et al. identified terrigenous influx and stratification as TOC modifiers, they overlooked their coupled effects on pore-structure evolution and rock mechanical properties [25,26]. Consequently, this fragmented understanding constrains predictive models for sweet-spot identification, posing significant challenges for shale gas exploration in key stratigraphic units such as the Longmaxi Formation of the Sichuan Basin.
To address these gaps, this study conducted an integrated analysis of organic-rich shales from the Longmaxi Formation in the Changning area of the Upper Yangtze Block, incorporating geochemical characterization (major and trace elements), total organic carbon (TOC) quantification, scanning electron microscopy (SEM), permeability measurements, and gas content evaluation. Through the systematic reconstruction of the depositional environments and comparative analysis of reservoir characteristics across varying sedimentary settings, we aimed to identify favorable depositional conditions for high-quality shale reservoir development. This multi-proxy approach elucidates critical linkages between paleoenvironmental dynamics (e.g., redox-sensitive MoEF/UEF ratios, terrigenous input indices), organic-inorganic interactions, and reservoir heterogeneity. By coupling high-resolution SEM-EDS mineral mapping with mercury intrusion capillary pressure (MICP) analysis, we resolve pore-size distributions (macropores >50 nm to micropores <2 nm) and fracture connectivity, while correlating these features with depositional redox gradients and paleoproductivity trends. The resultant dataset establishes a predictive framework for reservoir sweet-spot identification based on depositional environment fingerprints, offering critical insights for optimizing exploration in heterogeneous shale systems.

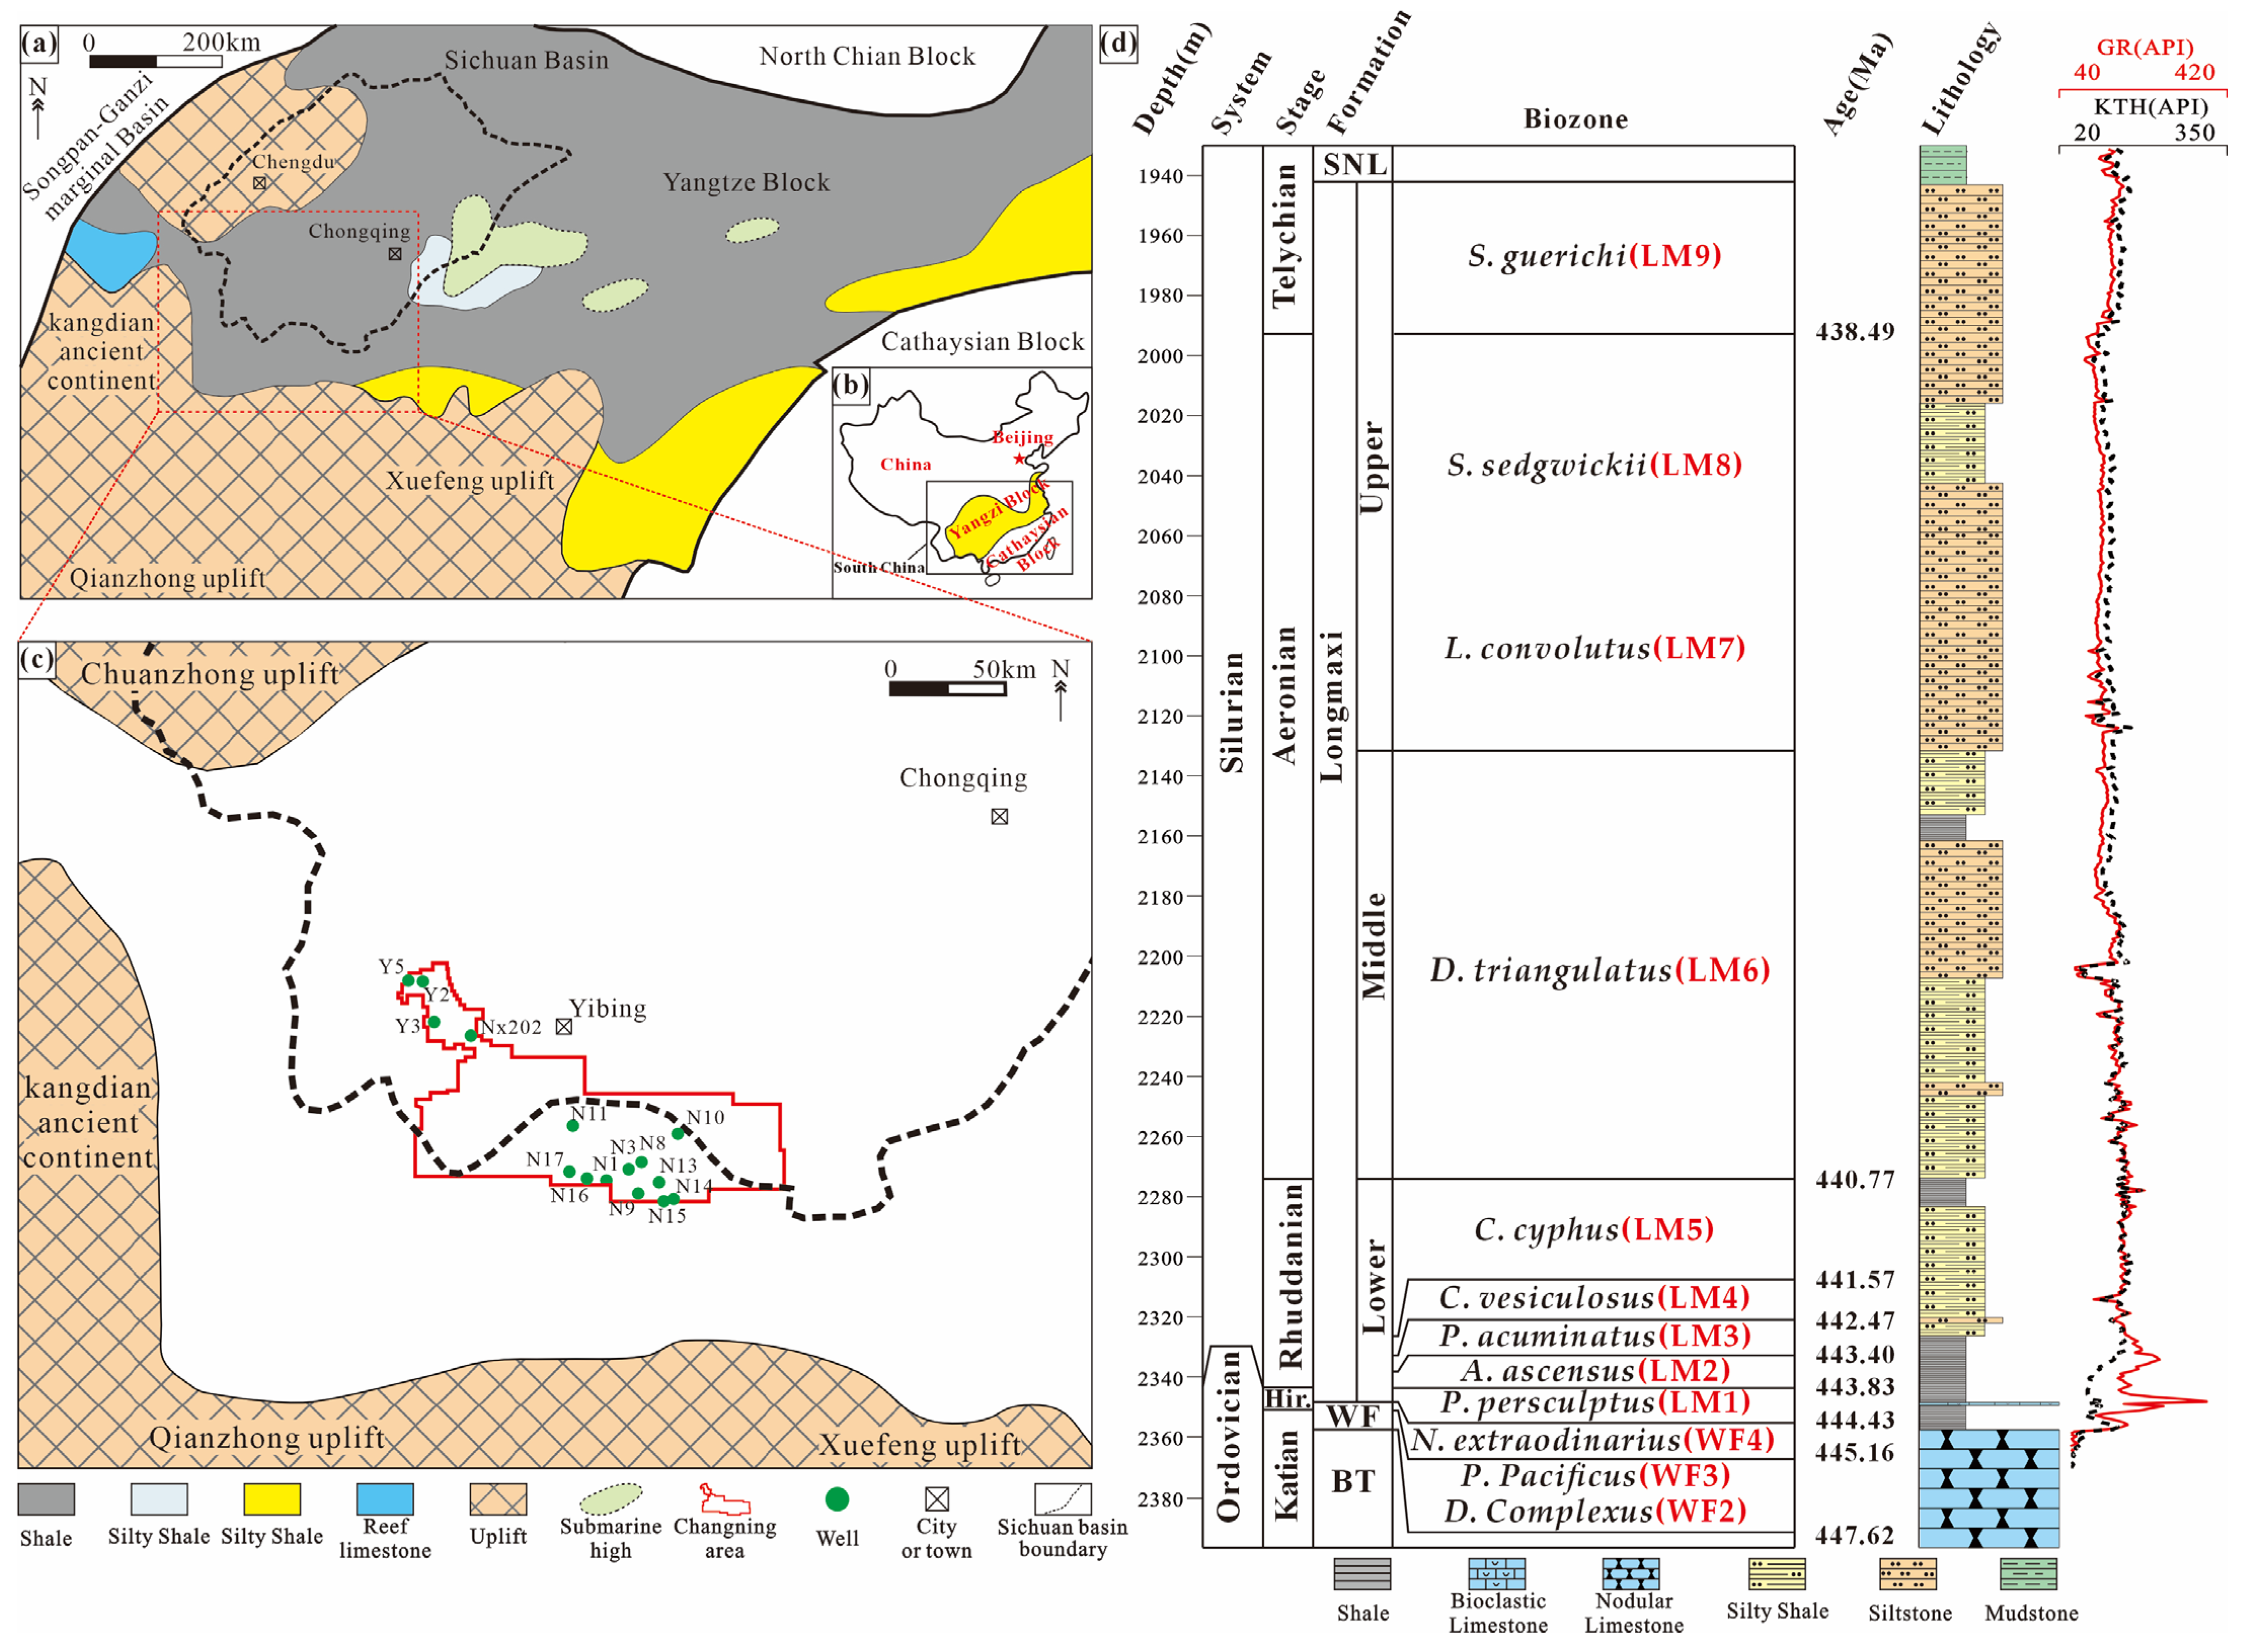
2. Geological Setting

The Changning area is situated between the low-amplitude anticlinal structural belt of the southern Sichuan Basin in the Upper Yangtze region and the broad (Figure 1a), gentle anticlinal fold belt of northwestern Guizhou. This region exhibits complex tectonic configurations, with the central portion hosting the Jianwu Syncline and Shuanglong-Luochang Syncline, while the Tiangongtang structure is situated in the northwestern part [26].
During the Late Ordovician to Early Silurian, under the compressional influence of the Caledonian movement, three major uplift belts—Chuanzhong Uplift (northwest), Qianzhong Uplift (south), and Xuefengshan Uplift (east)—controlled the formation of a northeast-opening semi-enclosed bay (Figure 1b) [27]. Within this depositional framework, the Late Ordovician Wufeng Formation and overlying Early Silurian Longmaxi Formation constitute critical shale gas targets. The Wufeng Formation exhibits a typical marine sequence: its lower section comprises black graptolitic shales formed under deep-water anoxic conditions, while the upper section records the global Hirnantian glacial event through thin-bedded gray bioclastic limestones and dark gray marls, reflecting carbonate compensation triggered by ice-driven sea-level regression. Postglacial warming led to rapid transgression during the Early Silurian Longmaxi period, facilitating widespread deposition of organic-rich black shales in the Upper Yangtze region under persistent anoxia [28]. The Changning area, located within the southern Sichuan Depression during Longmaxi deposition, accumulated thick and stable black-gray shales in the basal lower Longmaxi formation. Subsequent gradual relative sea-level fall resulted in gray silty shales and argillaceous siltstones in the middle Longmaxi formation, while the upper Longmaxi formation features interbedded sand-mudstone sequences with tempestites and calcareous nodules. The organic-rich shales in the Lower Longmaxi Formation, characterized by high TOC (>2%), prominent GR peaks, elevated thermal maturity, and well-developed pore-fracture systems, constitute the principal shale gas target in the Sichuan Basin and the focus of this study.
For a detailed investigation of the study area’s shale units, the lower Longmaxi formation interval is subdivided into four sections (LM1, LM2, LM3, and LM4 to LM5) based on the Ordovician-Silurian biostratigraphic framework [29]. LM1 exhibits peak gamma-ray (GR) log responses with elevated carbonaceous content, hosting the Persculptograptus persculptus graptolite zone. LM2 displays stepwise GR decline and sequentially develops the Akidograptus ascensus graptolite zones. LM3 contains calcareous nodules and is marked by the Parakidograptus acuminatus zone. LM4 to LM5 shows abrupt GR reduction with increased siltstone content in core samples, correlating with the Cystograptus vesiculosus and Coronograptus cyphus zone. The middle Longmaxi formation maintains stable low GR values, characterized by decreased graptolite abundance but enhanced diversity, hosting the Demirastrites triangulates zones (LM6) (Figure 1c) [30].

3. Samples and Experimental Methods

3.1. Samples

This study systematically scores logging and dynamic testing data from 15 boreholes in the Changning area, complemented by comprehensive core observations. Three representative geological cross-sections were constructed based on strategically selected boreholes: Well Y2 in the northwestern sector, Well N11 in the central zone, and Well N15 in the southeastern portion of the study area (Figure 1c). A three-stage experimental protocol was designed based on petrological correlations and reservoir evaluations: Stage 1: Compositional analysis using whole-rock X-ray diffraction (XRD) was performed on 242 core samples from the Changning area; Stage 2: Subsequent mineralogical comparisons guided the selection of 81 samples for comprehensive geochemical analysis, including major/trace elements and total organic carbon (TOC) quantification; Stage 3: Microstructural characterization via argon ion polished scanning electron microscopy (SEM) was conducted on 39 representative samples, with target selection informed by geochemical signatures.

3.2. Whole-Rock Geochemistry

Whole-rock geochemical analyses characterized major and trace element compositions. For major elements, accurately weighed shale samples (~1 g) were calcined at 950 °C for 3–4 h to remove organic matter, cooled, and re-weighed. Approximately 0.5 g of the calcined powder was mixed with anhydrous lithium tetraborate (Li2B4O7) at a 1:8 mass ratio (sample:flux), along with ammonium nitrate (NH4NO3), lithium oxide (LiO2), and lithium bromide (LiBr). The mixture was fused at 1200 °C to produce homogenized glass disks (XRF pellets) for analysis using an X-ray fluorescence (XRF) spectrometer. For trace elements, ~0.5 g of oven-dried powder was calcined. Approximately 0.5 mg of the residue underwent high-pressure acid digestion (HNO3:HF:HClO4 = 2:2:1 v/v) at 190 °C for 48 h in a Teflon vessel, followed by specific drying and secondary digestion steps. The final digestate was diluted 2000-fold with 2% HNO3 and analyzed via inductively coupled plasma mass spectrometry (Agilent 7800 ICP-MS spectrometer, Agilent Technologies Inc., Santa Clara, CA, USA). Matrix-matched calibrations ensured analytical errors <5%.

3.3. TOC Analysis

Accurately weighed ground samples (150 mg, 200-mesh) were decarbonated using 4 mol/L HCl for 24 h. After repeated washing/centrifugation cycles until neutral pH, the residue was freeze-dried to ensure complete inorganic carbon (IC) removal. Approximately 18 mg was analyzed using an elemental analyzer, achieving ±0.5% precision.

3.4. X-Ray Diffraction

The experiment was conducted at 22 °C and 30% RH. Mineral quantification employed the K-value method. Mineral standards and high-purity corundum powder were equilibrated at 30 °C for 2 h, cooled, precisely weighed, homogenized (<40 μm), and pelletized. Diffraction peak intensities of both standards and corundum were measured. The K-values, representing mineral content percentages, were calculated as the ratio of mineral diffraction intensity to corundum reference intensity. Each preparation was replicated five times.

3.5. Argon Ion Polishing Scanning Electron Microscopy and ImageJ Pore Identification

Rock thin sections prepared by argon ion polishing were imaged via field emission scanning electron microscopy (FE-SEM) at 10,000× magnification. To capture nanoscale pore characteristics (2–200 nm) and heterogeneity, at least six representative fields of view (FOVs) per sample were analyzed. Using ImageJ version 1.53e (National Institutes of Health, Bethesda, MD, USA), pore types (organic-hosted, interparticle, intraparticle) were manually classified, followed by a grid-point counting method to quantify equivalent diameter distributions, areal porosity, and type proportions. A region-weighted averaging algorithm applied to eliminate localized anomalies enabled integrated characterization of pore-size distributions and abundances.

3.6. Proxy Calculations

To mitigate the influence of detrital input and diagenetic alteration, elemental concentrations were normalized to aluminum (Al), as aluminosilicates represent the primary source of Al in sediments and remain relatively inert during diagenesis [31,32,33,34]. Elemental enrichment factors (XEF) were calculated as
XEF = (X/Al)Sample/(X/Al)PASS
where PAAS denotes Post-Archean Australian Shale [35]. This normalization minimizes lithological biases and dilution effects, enabling robust reconstruction of paleo-productivity and redox conditions.
Redox-sensitive elements (U, Mo) were analyzed using Mo-TOC covariation and UEF-MoEF relationships to assess basin water mass restriction [36]. The Mo-TOC correlation follows:
Mos = Moaq·TOCs or [Mo/TOC]s = Moaq
where Mos and TOCs represent sedimentary Mo and organic carbon contents, respectively, and Moaq denotes seawater Mo concentration.
Chemical weathering intensity was evaluated using the Chemical Index of Alteration (CIA):
CIA = [Al2O3/(Al2O3 + CaO* + Na2O + K2O)] × 100
where CaO* refers to silicate-bound CaO [37,38]. Potassium metasomatism corrections were applied to CIA values using
K2O = [m × A + m × (C* + N)]/(1 − m)
with m = K/(A + C* + N + K), where A, C*, N and K denote molar percentages of Al2O3, CaO*, Na2O, and K2O, respectively.
Biogenic contributions of Ba (Babio), Mo (Mobio), and Si (Sibio) were isolated from detrital inputs using
Babio = BaSample − AlSample × (Ba/Al)PAAS
Mobio = MoSample − AlSample × (Mo/Al)PAAS
Sibio = Siexcess = SiSample − AlSample × (Si/Al)PAAS
where (Ba/Al)PAAS = 0.0077, (Mo/Al)PAAS = 0.000012, and (Si/Al)PAAS = 3.11 [39,40].

4. Results

4.1. Mineralogical Composition

X-ray diffraction (XRD) analysis of 242 core samples from the Changning area revealed a mineralogical composition dominated by quartz, clay minerals, and carbonate minerals (calcite and dolomite) (Table S1). Minor components included pyrite and feldspar. Vertically, quartz content showed a gradual upward increase from the basal intervals to peak values in the middle LM1-LM2 intervals, followed by a slight decrease in the upper strata. Feldspar abundance exhibited a progressive enrichment trend toward shallower depths. Clay mineral concentrations displayed an initial decline in the middle intervals, followed by a resurgence in the upper layers. Carbonate minerals dominated the lower intervals but decreased systematically upward, paralleling enhanced terrigenous sediment supply during basin infilling. The LM1 and LM2 intervals were primarily influenced by biogenic sedimentation, whereas LM4-LM6 exhibited increased terrigenous input, leading to higher clay mineral content.

4.2. Total Organic Carbon (TOC) Content

TOC analysis of 81 samples demonstrated significant organic matter enrichment in the Longmaxi Formation shales (Table S2). The basal Wufeng Formation (WF2-WF4) exhibited moderate TOC values (avg. 3.53%), followed by a sharp increase to peak enrichment in LM1 (avg. 4.81%). TOC content gradually declined upward through LM2 (avg. 4.00%) and LM3 (avg. 3.47%), reaching lower values in LM4-LM5 (avg. 2.84%) and a minimum in the uppermost LM6 (avg. 0.84%). This vertical distribution defines a systematic decrease in organic enrichment from LM1 to LM6, aligning with lithostratigraphic transitions within the Wufeng-Longmaxi sequence.

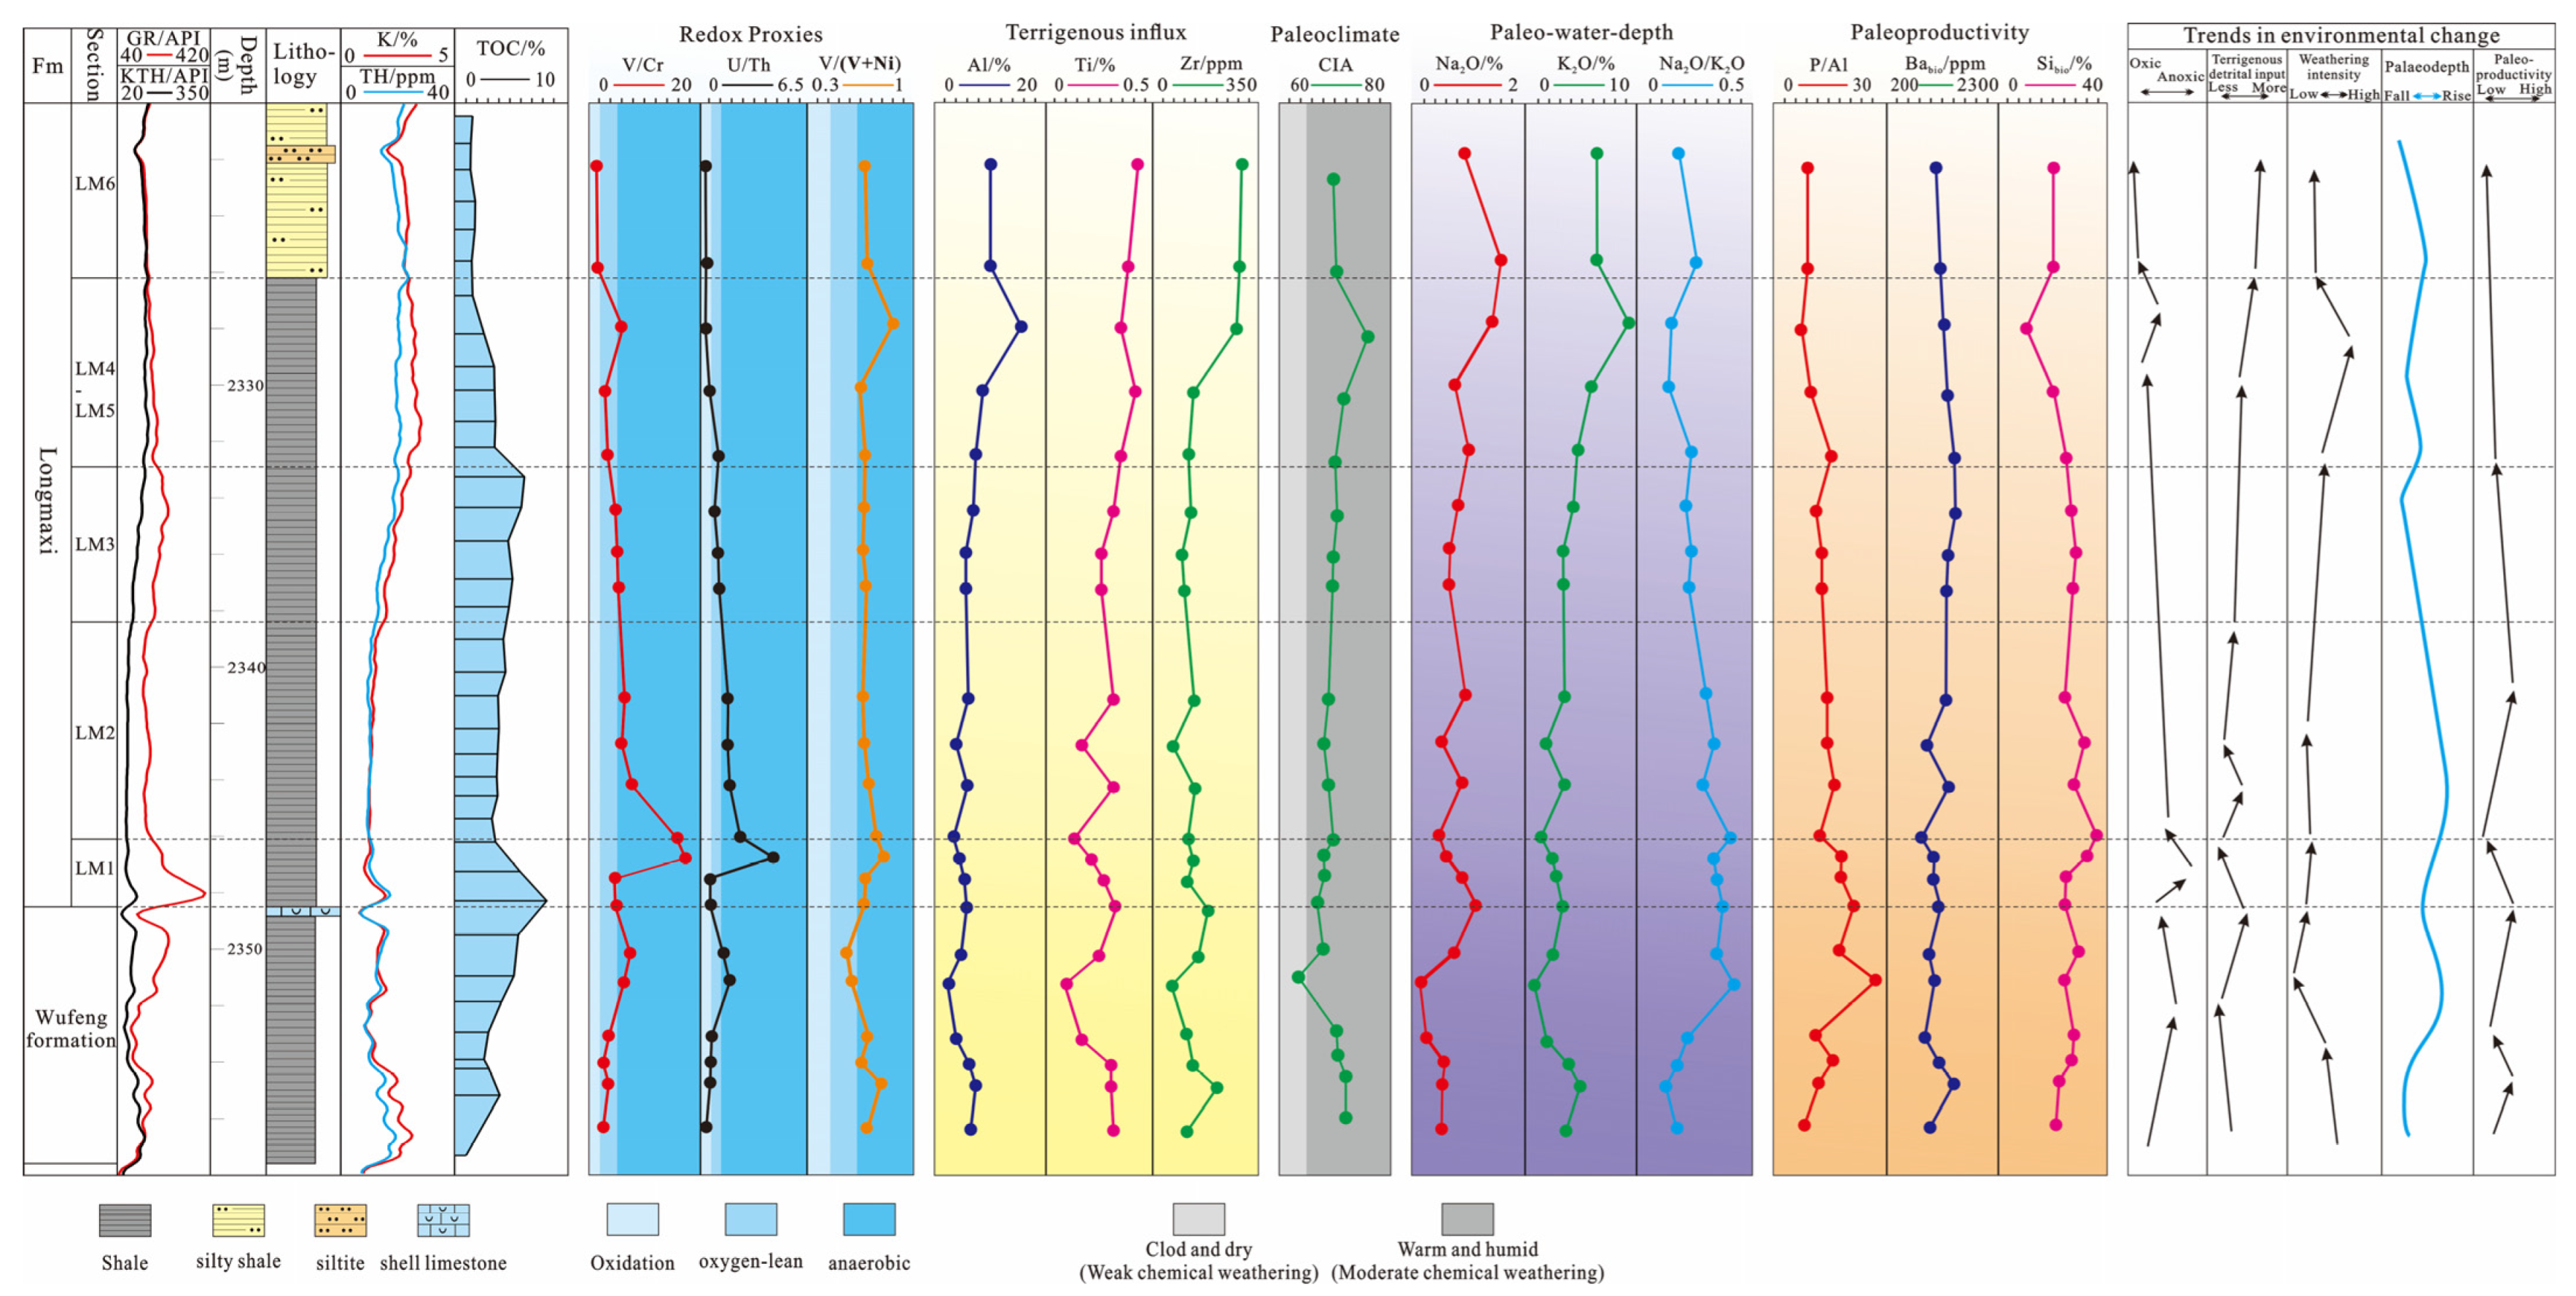
4.3. Element Geochemistry

The concentrations of major elements and trace elements are shown in Tables S2 and S3. The key geochemical indicators among them are shown in Figure 2. Whole-rock geochemical data for 91 samples highlighted siliciclastic dominance (SiO2: 58–72 wt.%; Al2O3: 12–18 wt.%) with moderate carbonate contribution (CaO: 3–11 wt.%; MgO: 1–5 wt.%).

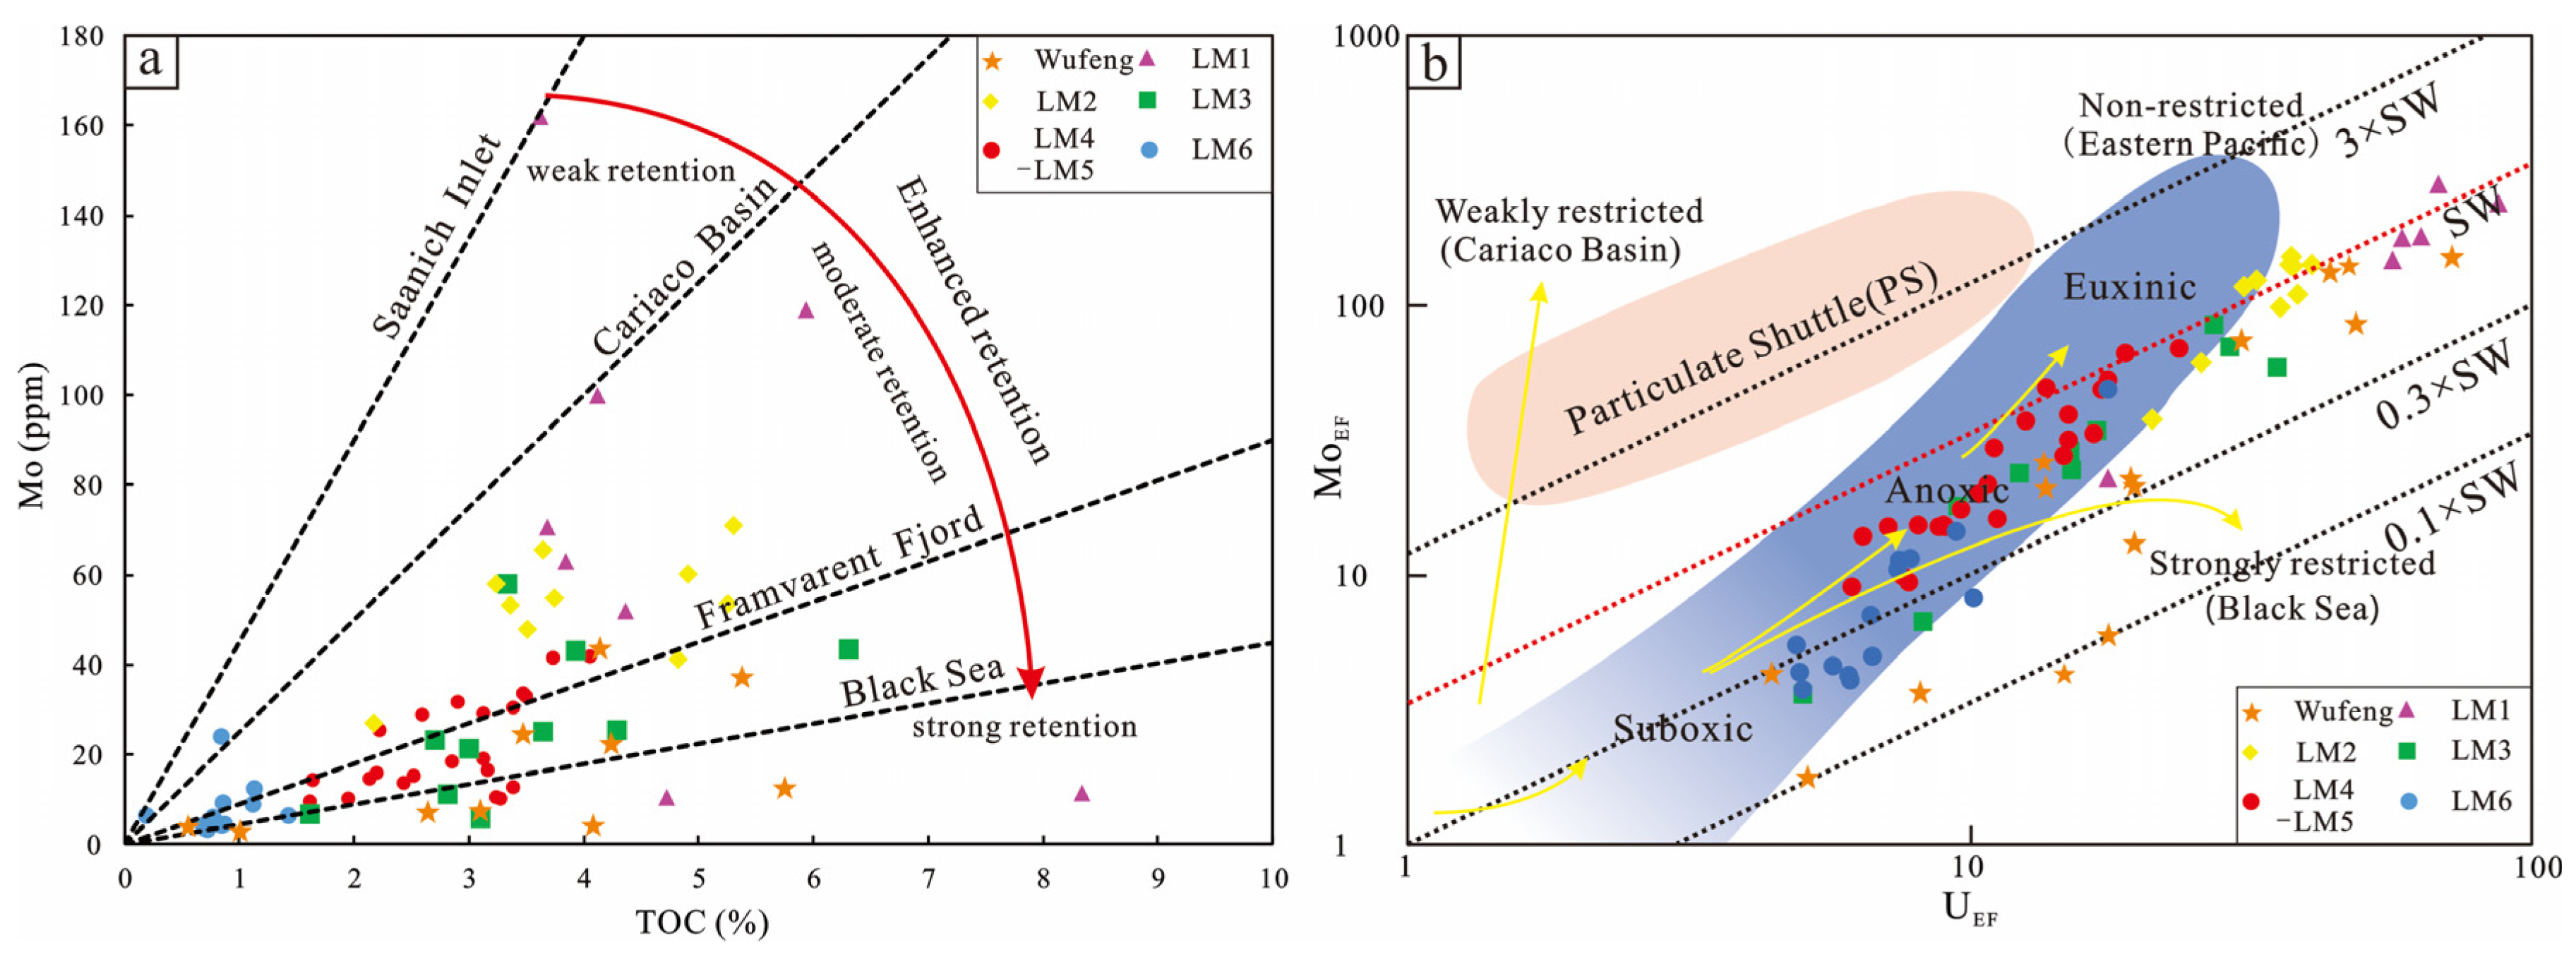
4.3.1. Redox Environment

Redox proxies (V/Cr, V/(V + Ni), U/Th) were employed to reconstruct water mass conditions, with statistically significant inter-formational differences confirmed by one-way ANOVA: V/Cr: F = 9.62, p < 0.001, η2 = 0.38; V/(V + Ni): F = 5.18, p < 0.001, η2 = 0.24; U/Th: F = 6.99, p < 0.001, η2 = 0.31(Table 1). Established numerical scales for these proxies (Jones and Manning, 1994; Wignall and Twitchett, 1996; Hatch and Leventhal, 1992 [41,42,43]) indicate distinct redox ranges: V/Cr < 2 = oxic, 2–4.25 = dysoxic, > 4.25 = anoxic; V/(V + Ni) < 0.45 = oxic, 0.45–0.60 = dysoxic, > 0.60 = anoxic; U/Th < 0.75 = oxic, 0.75–1.25 = dysoxic, >1.25 = anoxic.
For the Wufeng Formation, average values of V/Cr (4.01), V/(V + Ni) (0.66), and U/Th (0.97) collectively indicate dysoxic-anoxic bottom waters. Within the Longmaxi Formation, post-hoc tests demonstrate that LM1 shales are statistically distinct (p < 0.001 for all proxies), showing persistent anoxia (V/Cr = 6.55, U/Th = 3.49). This transitions to dysoxic conditions in LM3 (V/Cr = 2.18, U/Th = 0.75) and near-oxic conditions in LM6 (Table 2), where V/(V + Ni) ratios are significantly higher than Wufeng (Δ = +0.058, p < 0.001). Stable V/(V + Ni) ratios (0.68–0.73) reflect preferential V-organic complexation under reducing conditions, with η2 values >0.24 confirming redox state as a primary control, though influenced by organic matter type and enrichment mechanisms [44]. These patterns align with redox transitions during the Early Silurian postglacial marine expansion.

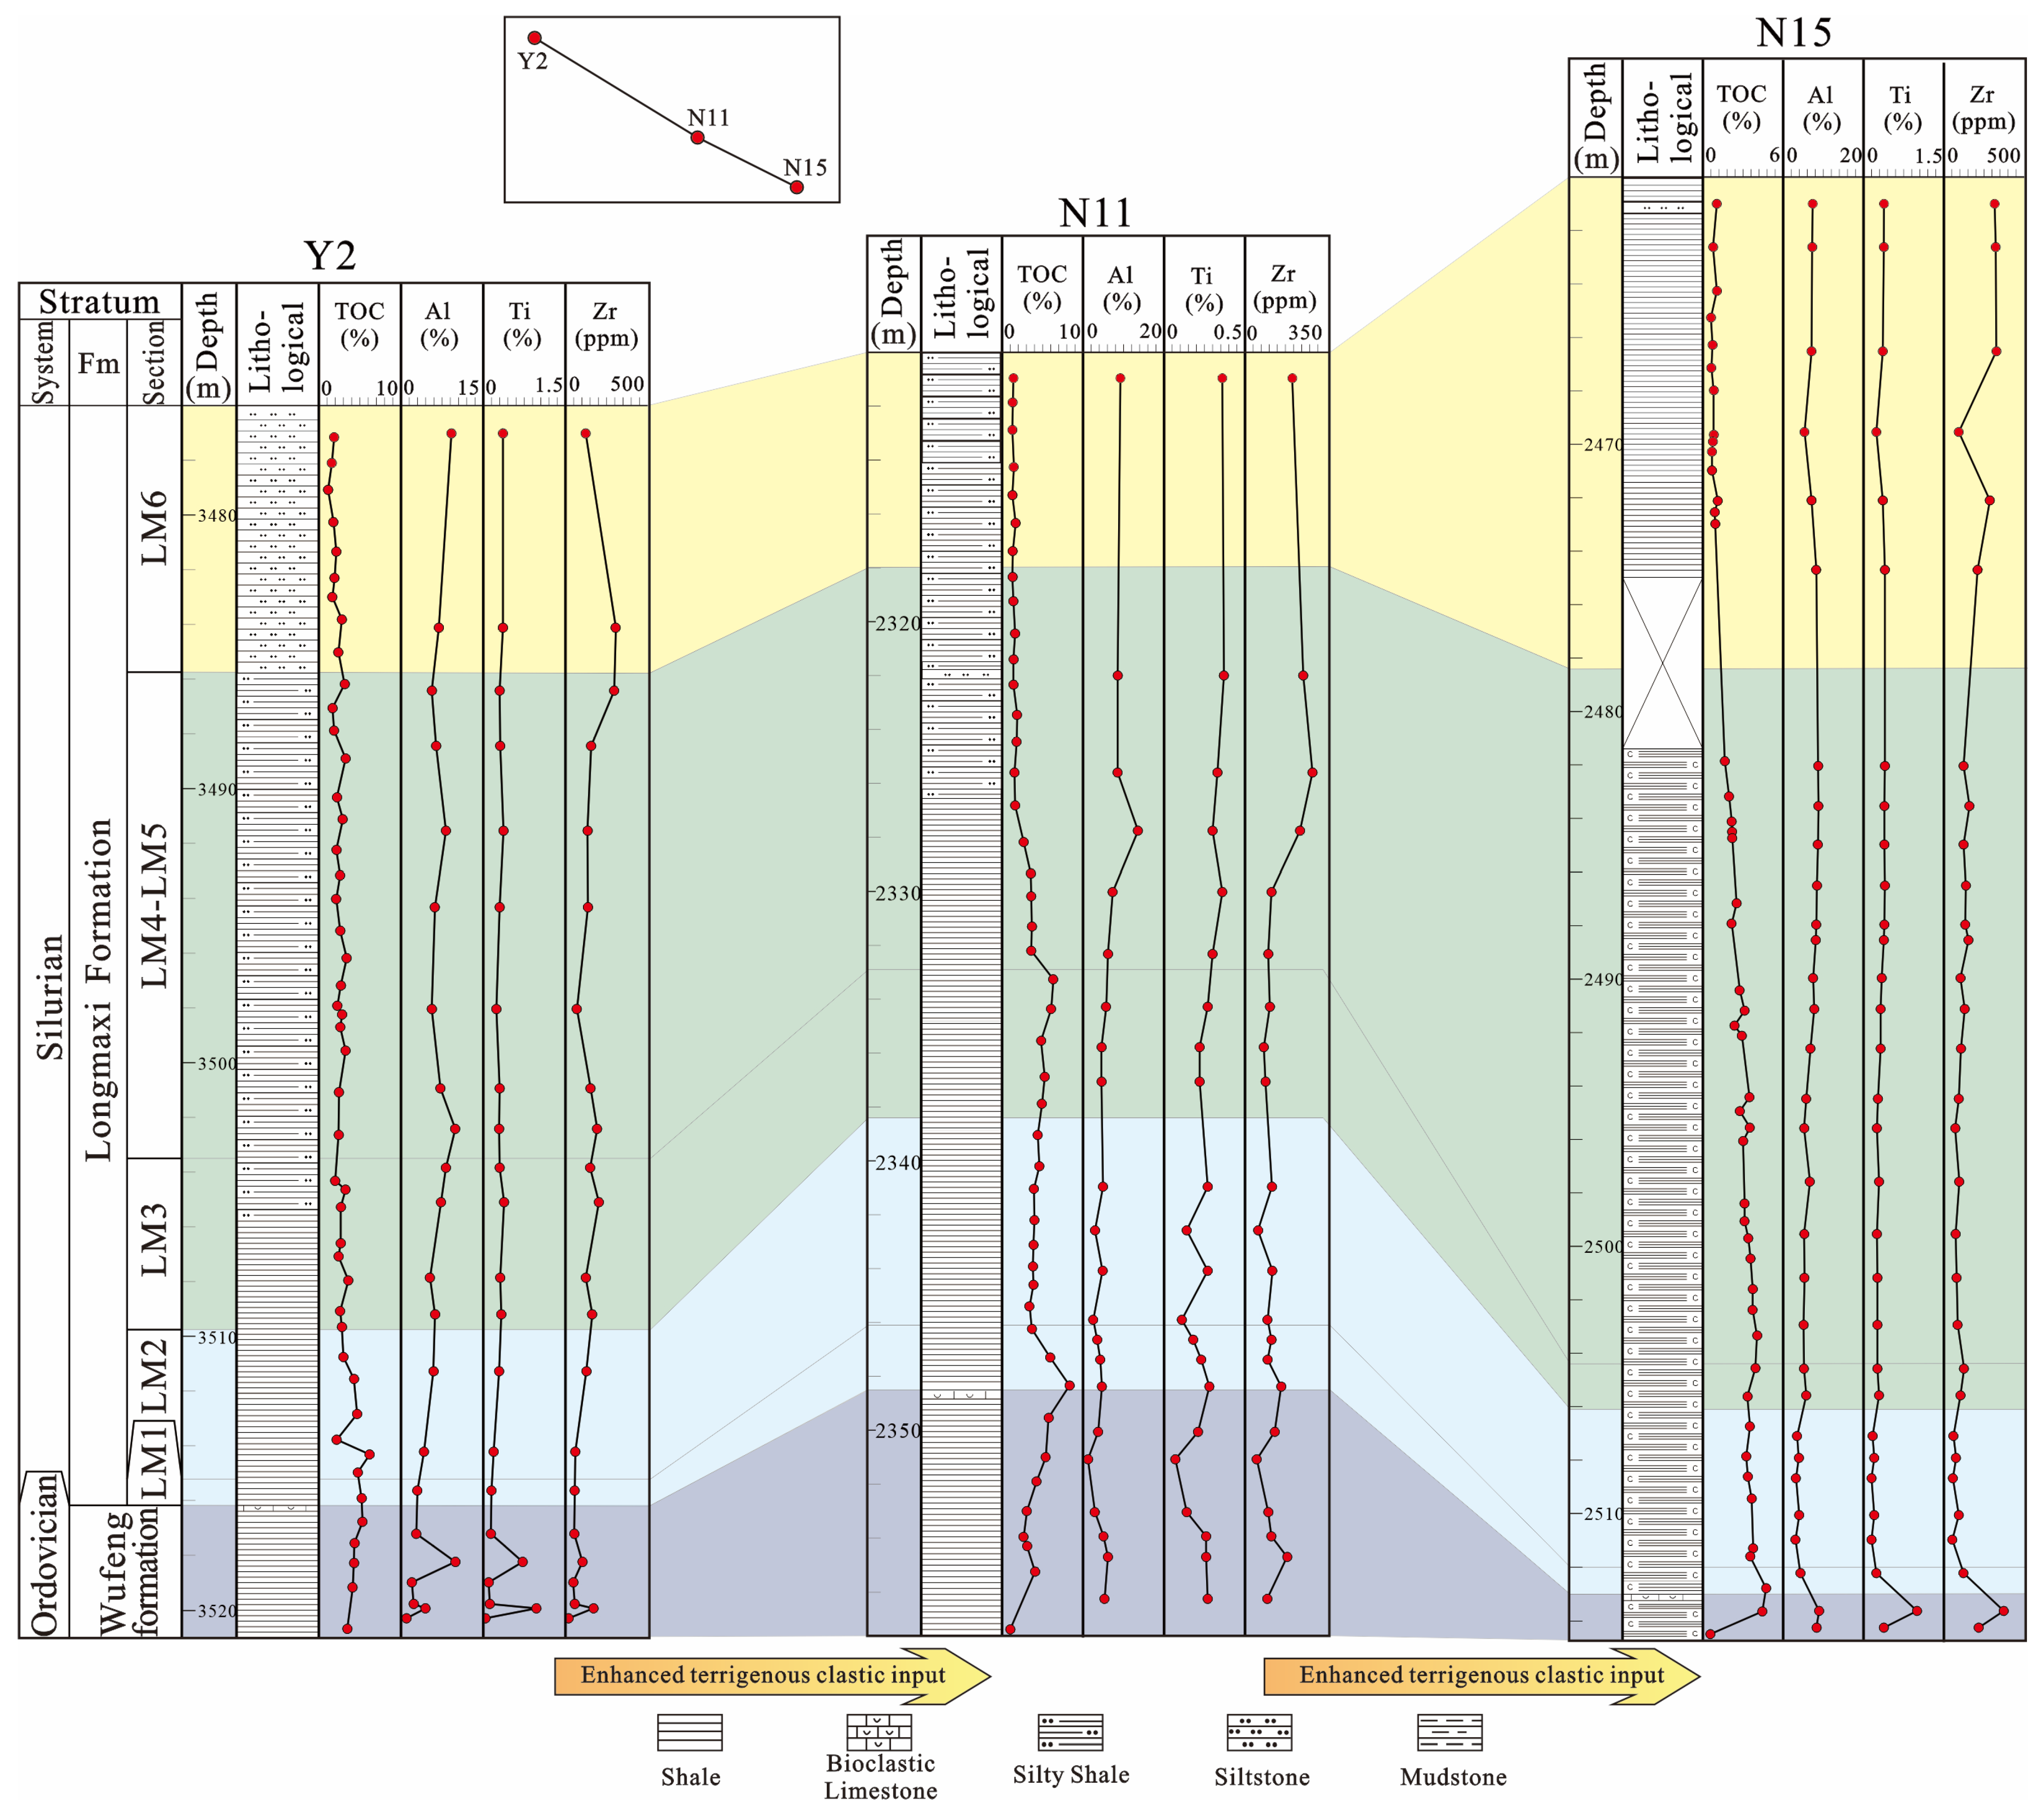
4.3.2. Terrigenous Detrital Influx Proxies

Strong Al-Zr-Ti correlations (R2 = 0.43–0.70) confirm terrigenous provenance (Figure 3), with one-way ANOVA validating significant stratigraphic variations in aluminosilicate indicators (Al: F = 3.57, p = 0.006, η2 = 0.21; Ti: F = 3.21, p = 0.012, η2 = 0.18; Zr: F = 3.19, p = 0.011, η2 = 0.18, Table 1). Vertical patterns reveal three phases: (1) Wufeng Formation with low input and glacial-influenced fluctuations, where post-hoc tests confirm significantly lower Al% compared to LM6 (Δ = −2.79%, p = 0.003); (2) LM1-LM2 intervals showing minimal influx (<2% Al2O3) in central basin depocenters (Well N11), with η2 > 0.18 indicating that stratigraphic differences account for >18% of elemental variance, which—when integrated with strong Al-Zr-Ti covariation (R2 > 0.43)—supports provenance shifts as the primary control mechanism; and (3) LM3-LM6 shales recording intensified input (>4% Al2O3) linked to Late Silurian regressive phases (Table 3). Lateral contrasts highlight paleogeographic controls: Well Y2 (northwest) and Well N15 (southeast) exhibited 18–23% higher Al2O3 than central Well N11 during Wufeng deposition (Figure 4), attributed to Ordovician glacial lowstand sediment routing [45,46].

4.3.3. Degree of Basin Water Retention Proxies

The hydrographic restriction regimes of the marine basin are effectively differentiated through Mo-TOC relationships and U-Mo covariation patterns (Equation (2)). The Wufeng Formation shales exhibit strong water mass restriction, evidenced by Mo/TOC ratios averaging 5.85 and Mo/U ratios of 1.39 (range: 0.28–3.01), values comparable to those documented in the modern Black Sea system (Figure 5a). In contrast, the Longmaxi Formation intervals display progressively reduced restriction: LM1-LM2 shales with elevated Mo/TOC (avg. 17.8) and Mo/U ratios (avg. 2.1) show affinity to semi-restricted environments analogous to the Cariaco Basin, while LM3-LM6 intervals with moderated Mo/TOC (avg. 7.56) and higher Mo/U ratios (avg. 4.8) reflect enhanced oceanic connectivity (Figure 5a). This transition is corroborated by UEF-MoEF covariation patterns, where LM1–LM2 data clusters align with Woodford Shale signatures characteristic of semi-restricted basins [47] (Figure 5b).
Tectonic-driven basin expansion during the Early Silurian transgression provides the mechanistic framework for this restriction gradient [49]. The Wufeng depositional phase coincided with the Yangtze Sea Basin contraction under compressional tectonics, where paleo-uplift development partitioned water masses and limited oceanic exchange. Subsequent Longmaxi deposition records marine inundation of these paleotopographic barriers through glacio-eustatic sea-level rise [50], establishing deeper anoxic conditions while improving basin-ocean connectivity. The upper intervals (LM3–LM6) particularly demonstrate this transition through their intermediate Mo/TOC ratios and U-Mo signatures, marking a shift towards more open marine conditions while retaining residual restriction influences.

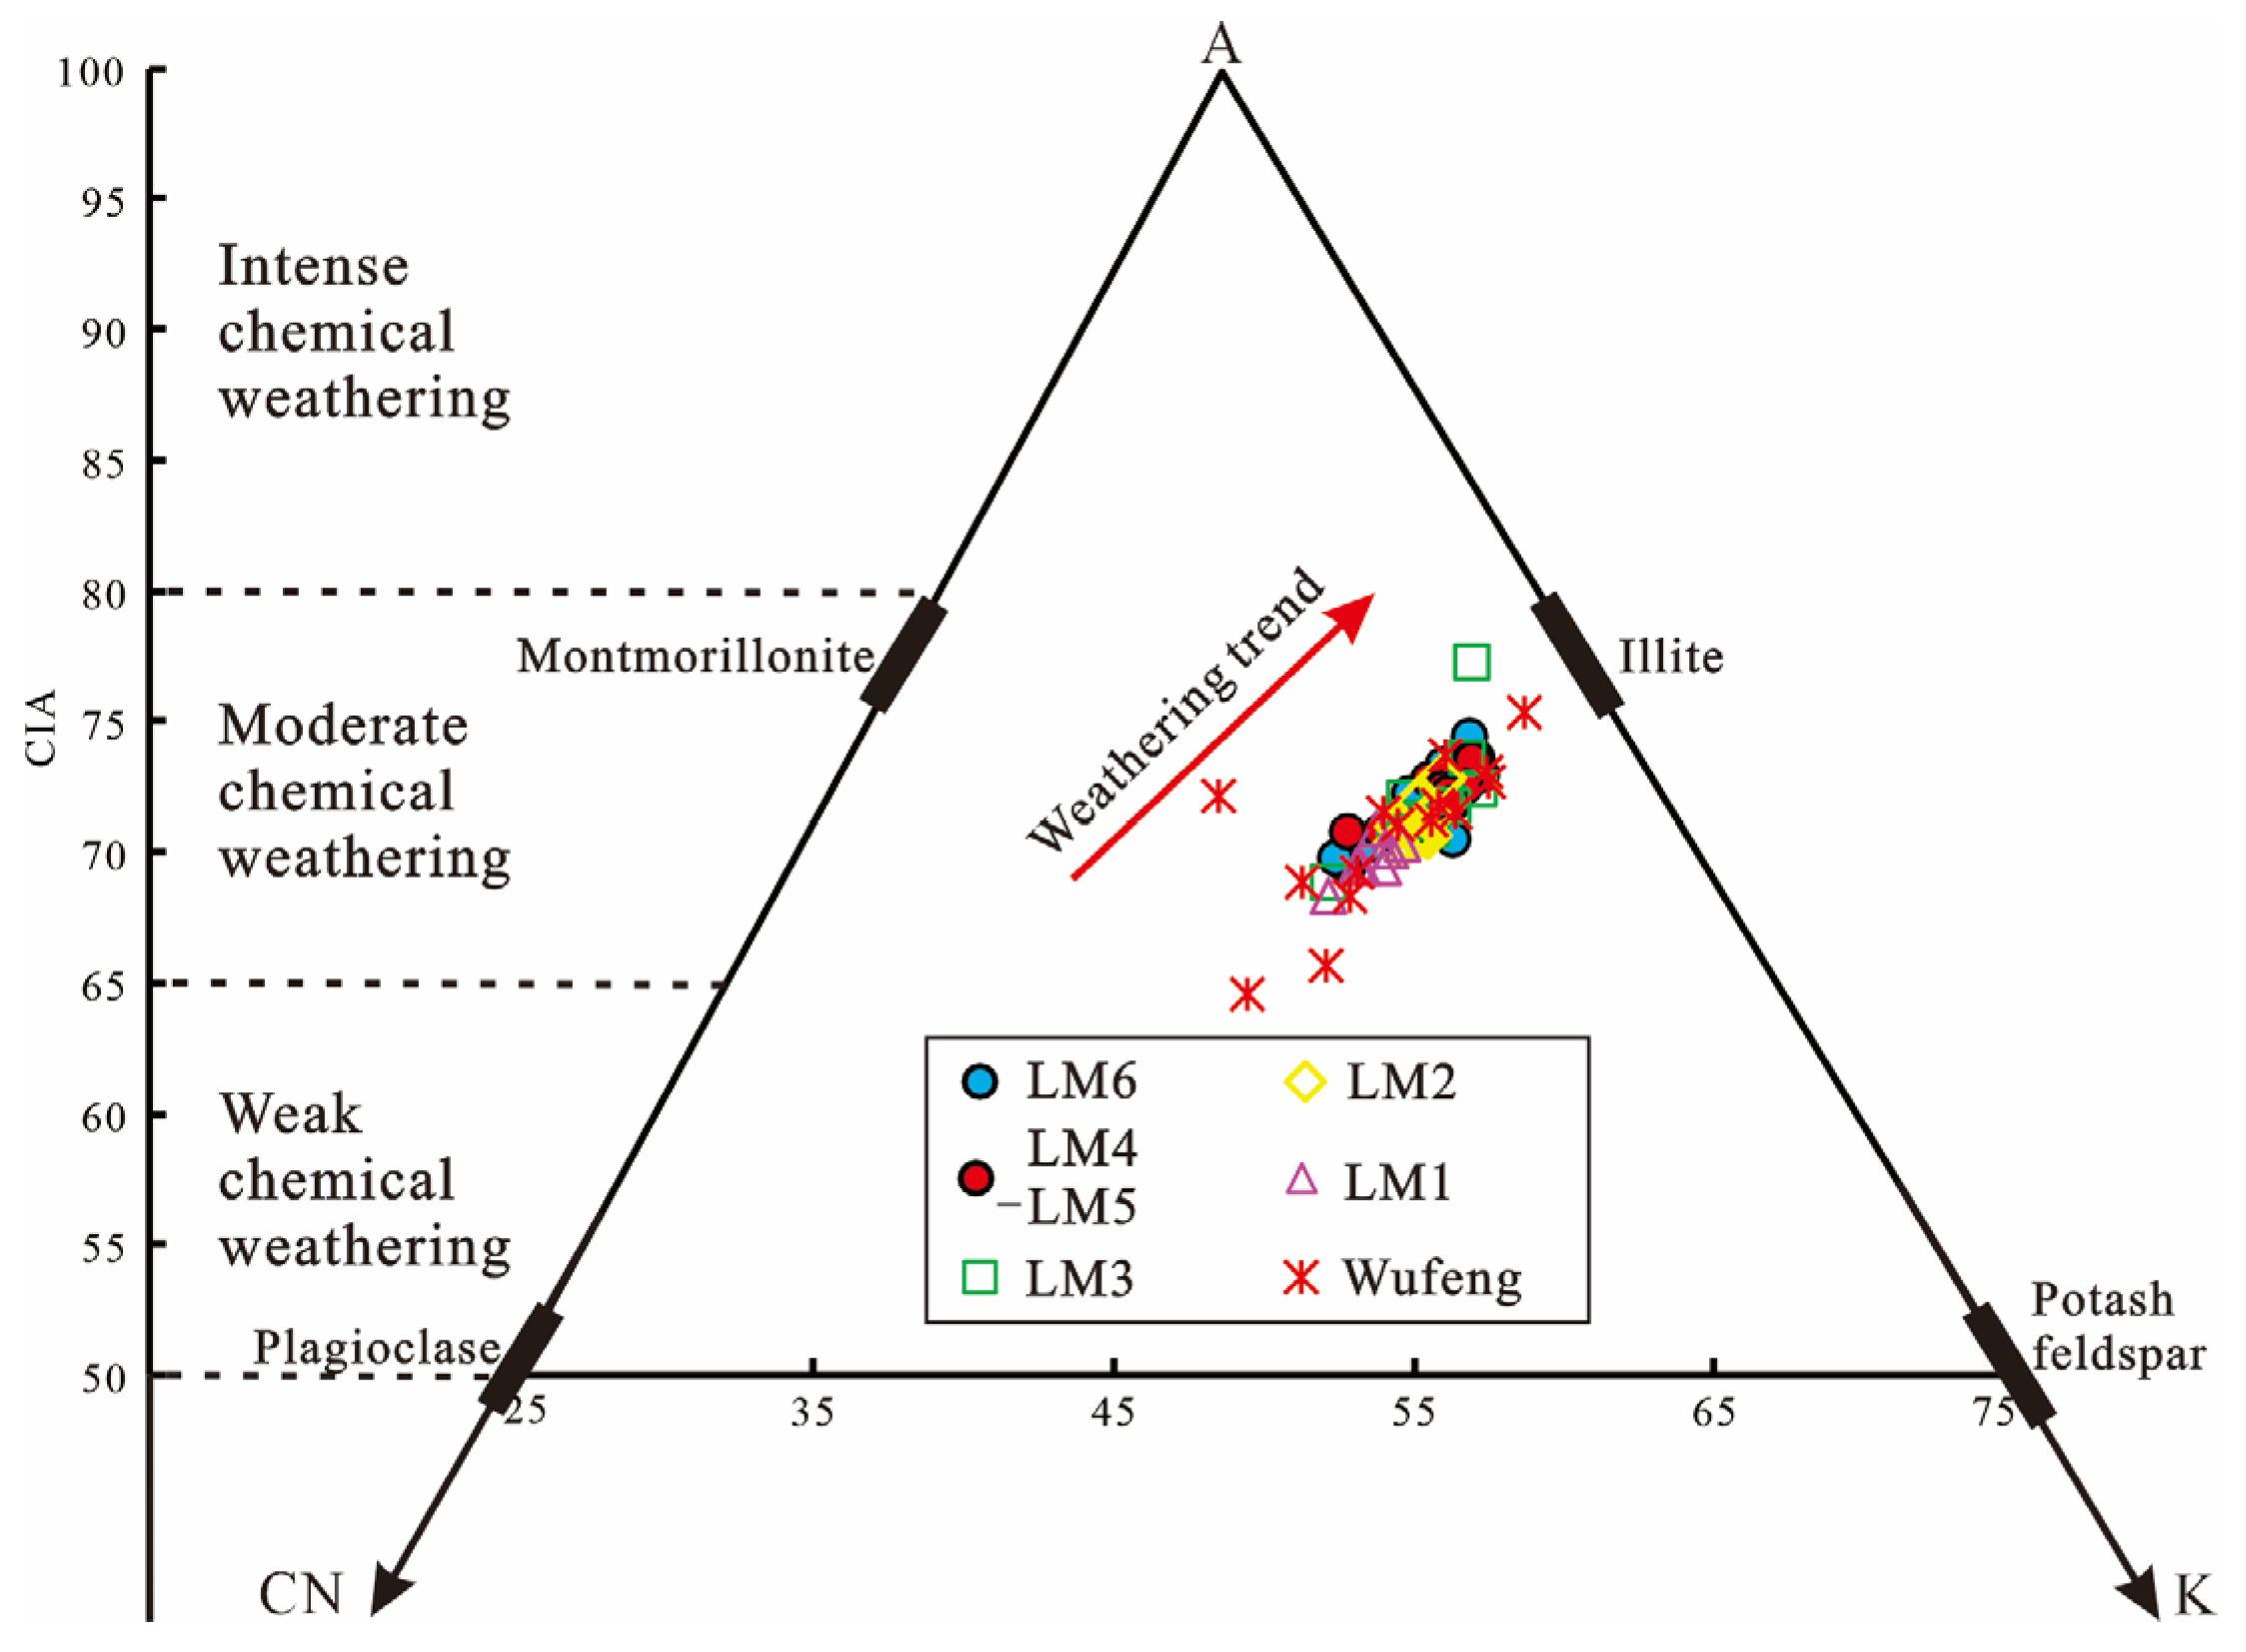
4.3.4. Paleoclimate Proxies

CIA values (64.60–76.04) corrected for K-metasomatism (Formula (3)) indicate warm-humid conditions [51], with one-way ANOVA confirming statistically significant stratigraphic differences (F = 5.62, p < 0.001, η2 = 0.26, indicating stratigraphic units account for 26% of weathering variance) (Table 1). A-CN-K ternary diagrams (Figure 6) reveal parallel weathering trends to the A-CN line, consistent with feldspar-dominated provenance. Post-hoc analysis demonstrates the Wufeng Formation records a significant CIA decline (72→65; ΔCIA = −5.4, p = 0.011) corresponding to Hirnantian glaciation, followed by progressive recovery (68→74) during early Longmaxi greenhouse warming (Table 4). Peak weathering intensities in LM2-LM3 (CIA = 75.2; significantly higher than Wufeng at p < 0.001) correlate with volcanic ash layers, suggesting enhanced nutrient fluxes that sustained high primary productivity.

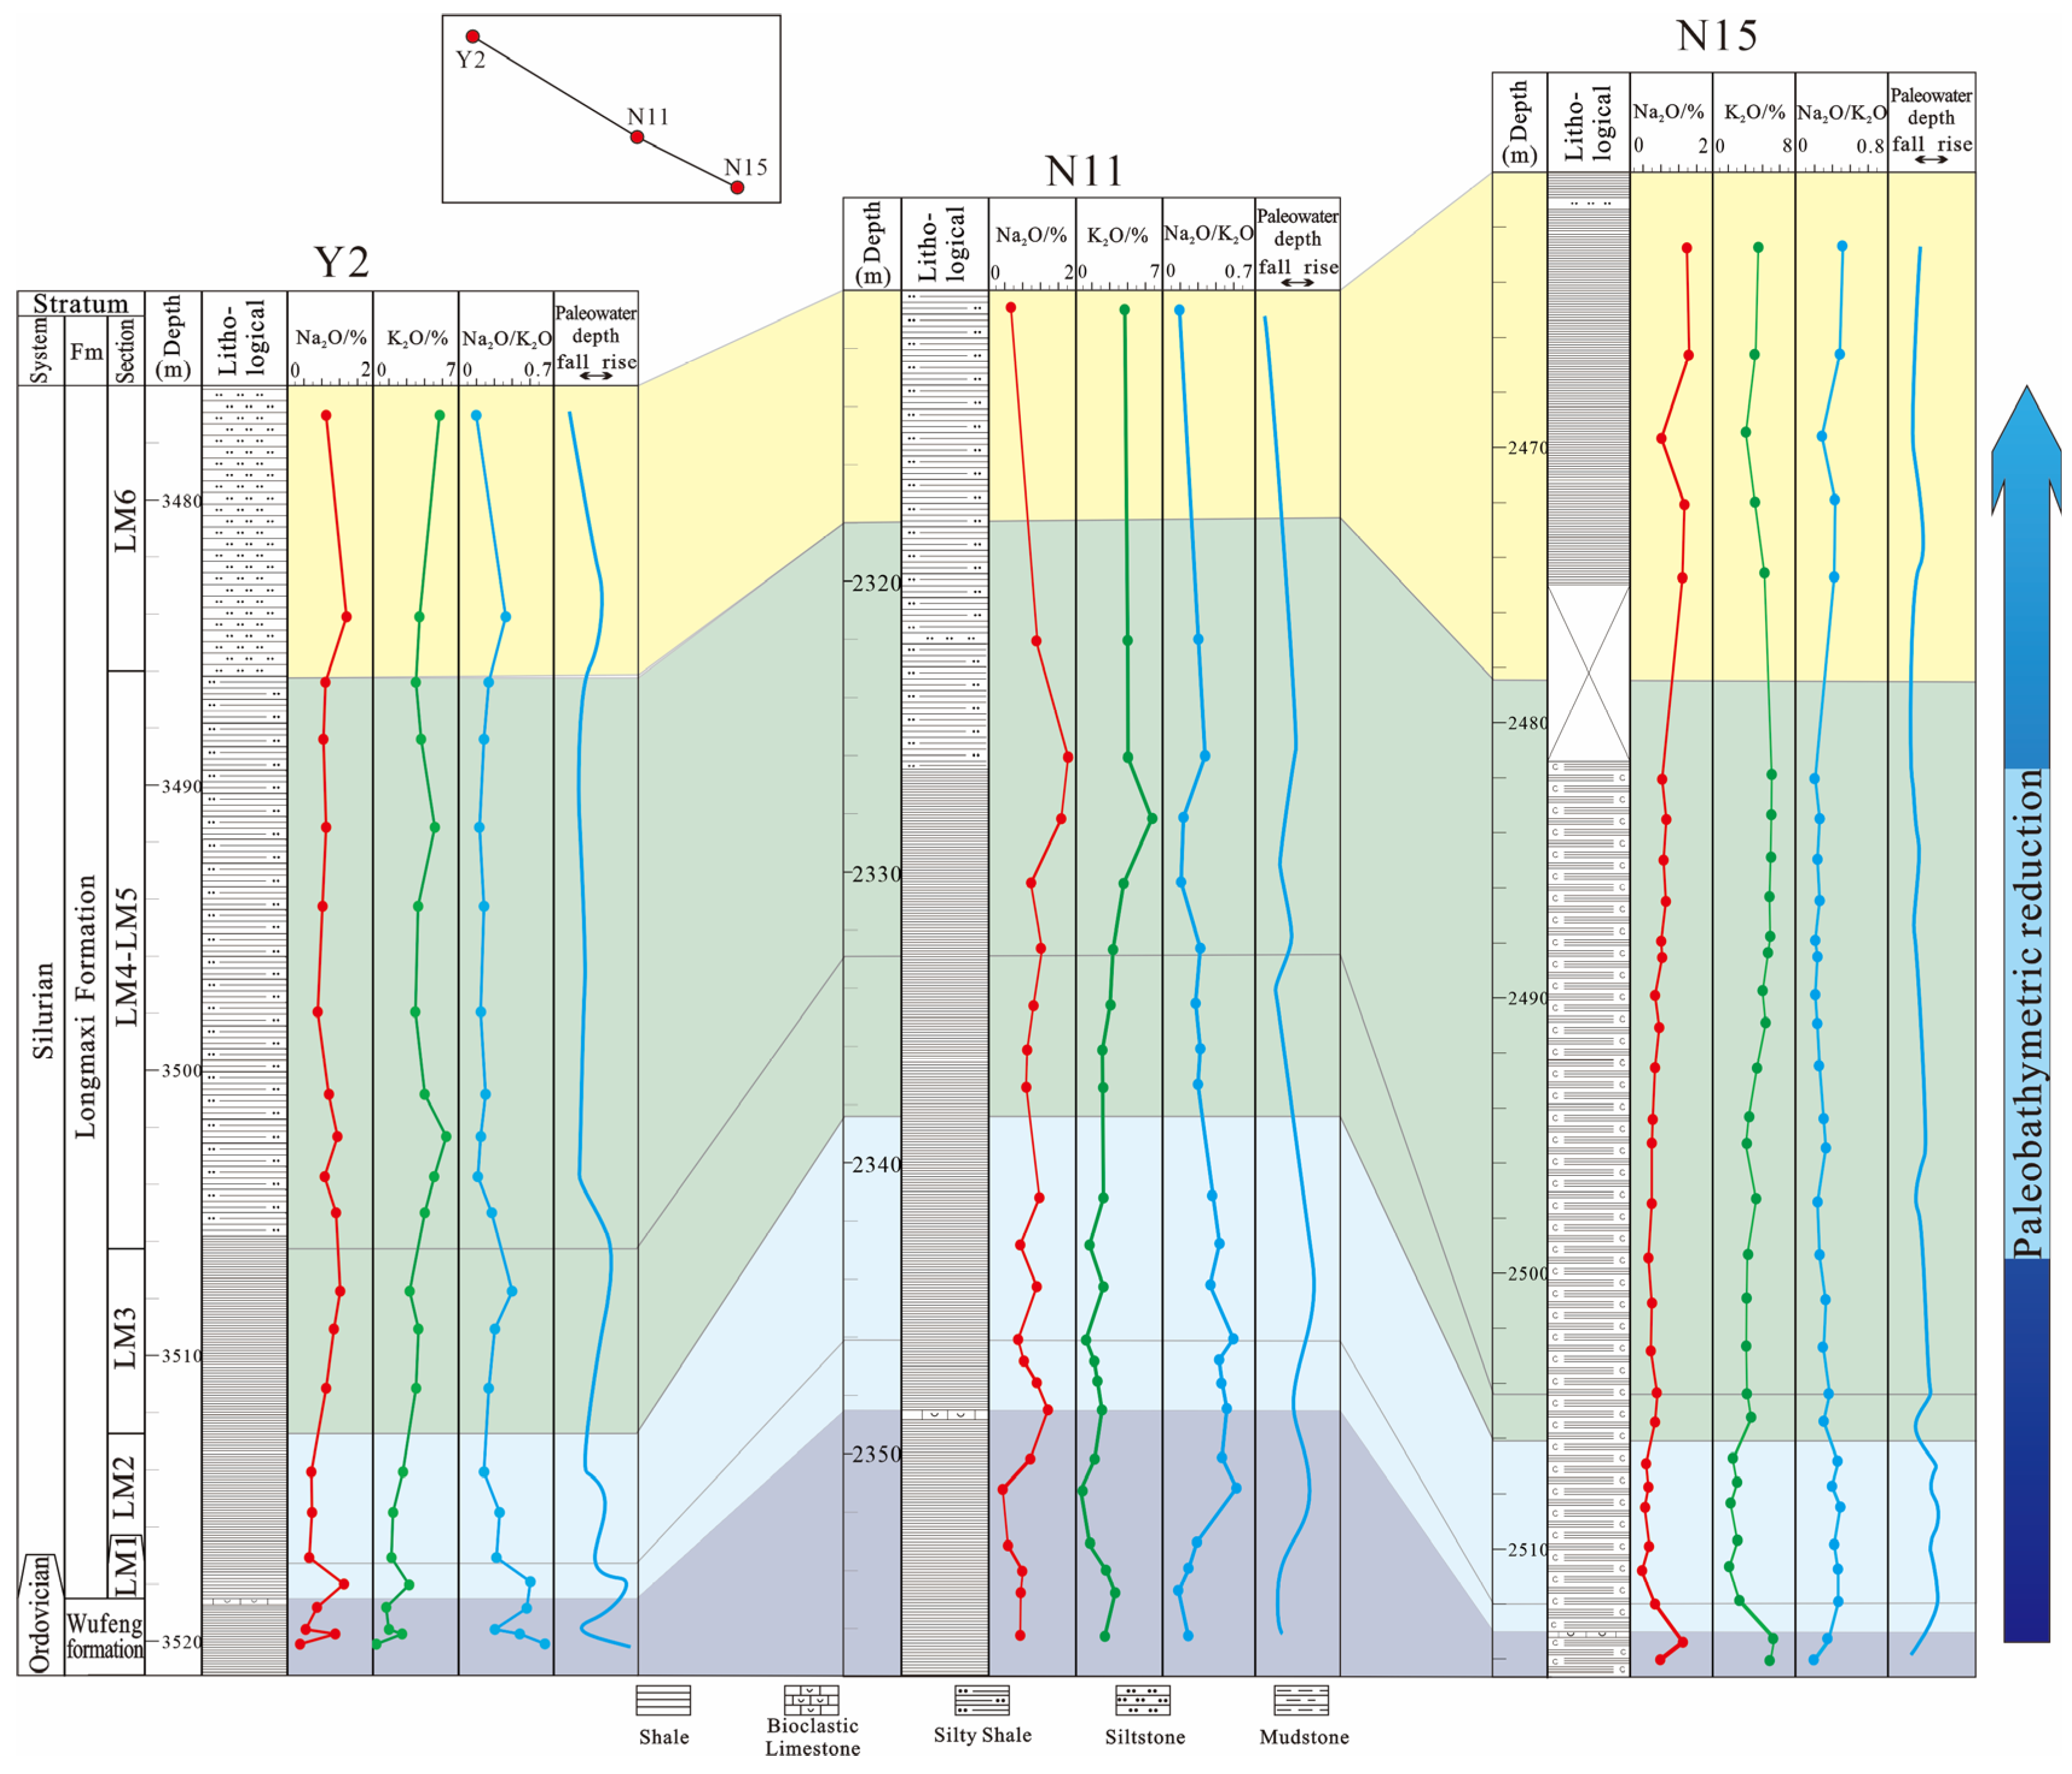
4.3.5. PaleoWater-Depth Proxies

Na2O/K2O ratios (0.18–0.29) track water depth variations (formula 4), with one-way ANOVA confirming significant stratigraphic control (F = 8.48, p < 0.001, η2 = 0.35, indicating paleobathymetry accounts for 35% of geochemical variance, Table 1). The Wufeng Formation shows initial deepening (Na2O/K2O = 0.24→0.27) followed by glacial-driven shallowing to significantly lower ratios (0.27→0.22; p = 0.008 vs. pre-glacial values). Longmaxi shales record sustained transgression: LM1 (0.29) marks maximum flooding (significantly higher than LM6: Δ = +0.11, p < 0.001), with progressive regression through LM6 (0.18) (Table 5). Laterally, Well N11 (central basin) exhibits 15–20% higher ratios than peripheral wells (Y2, N15), consistent with paleogeographic reconstructions of a deep central trough flanked by submerged paleo-uplifts (Figure 7).

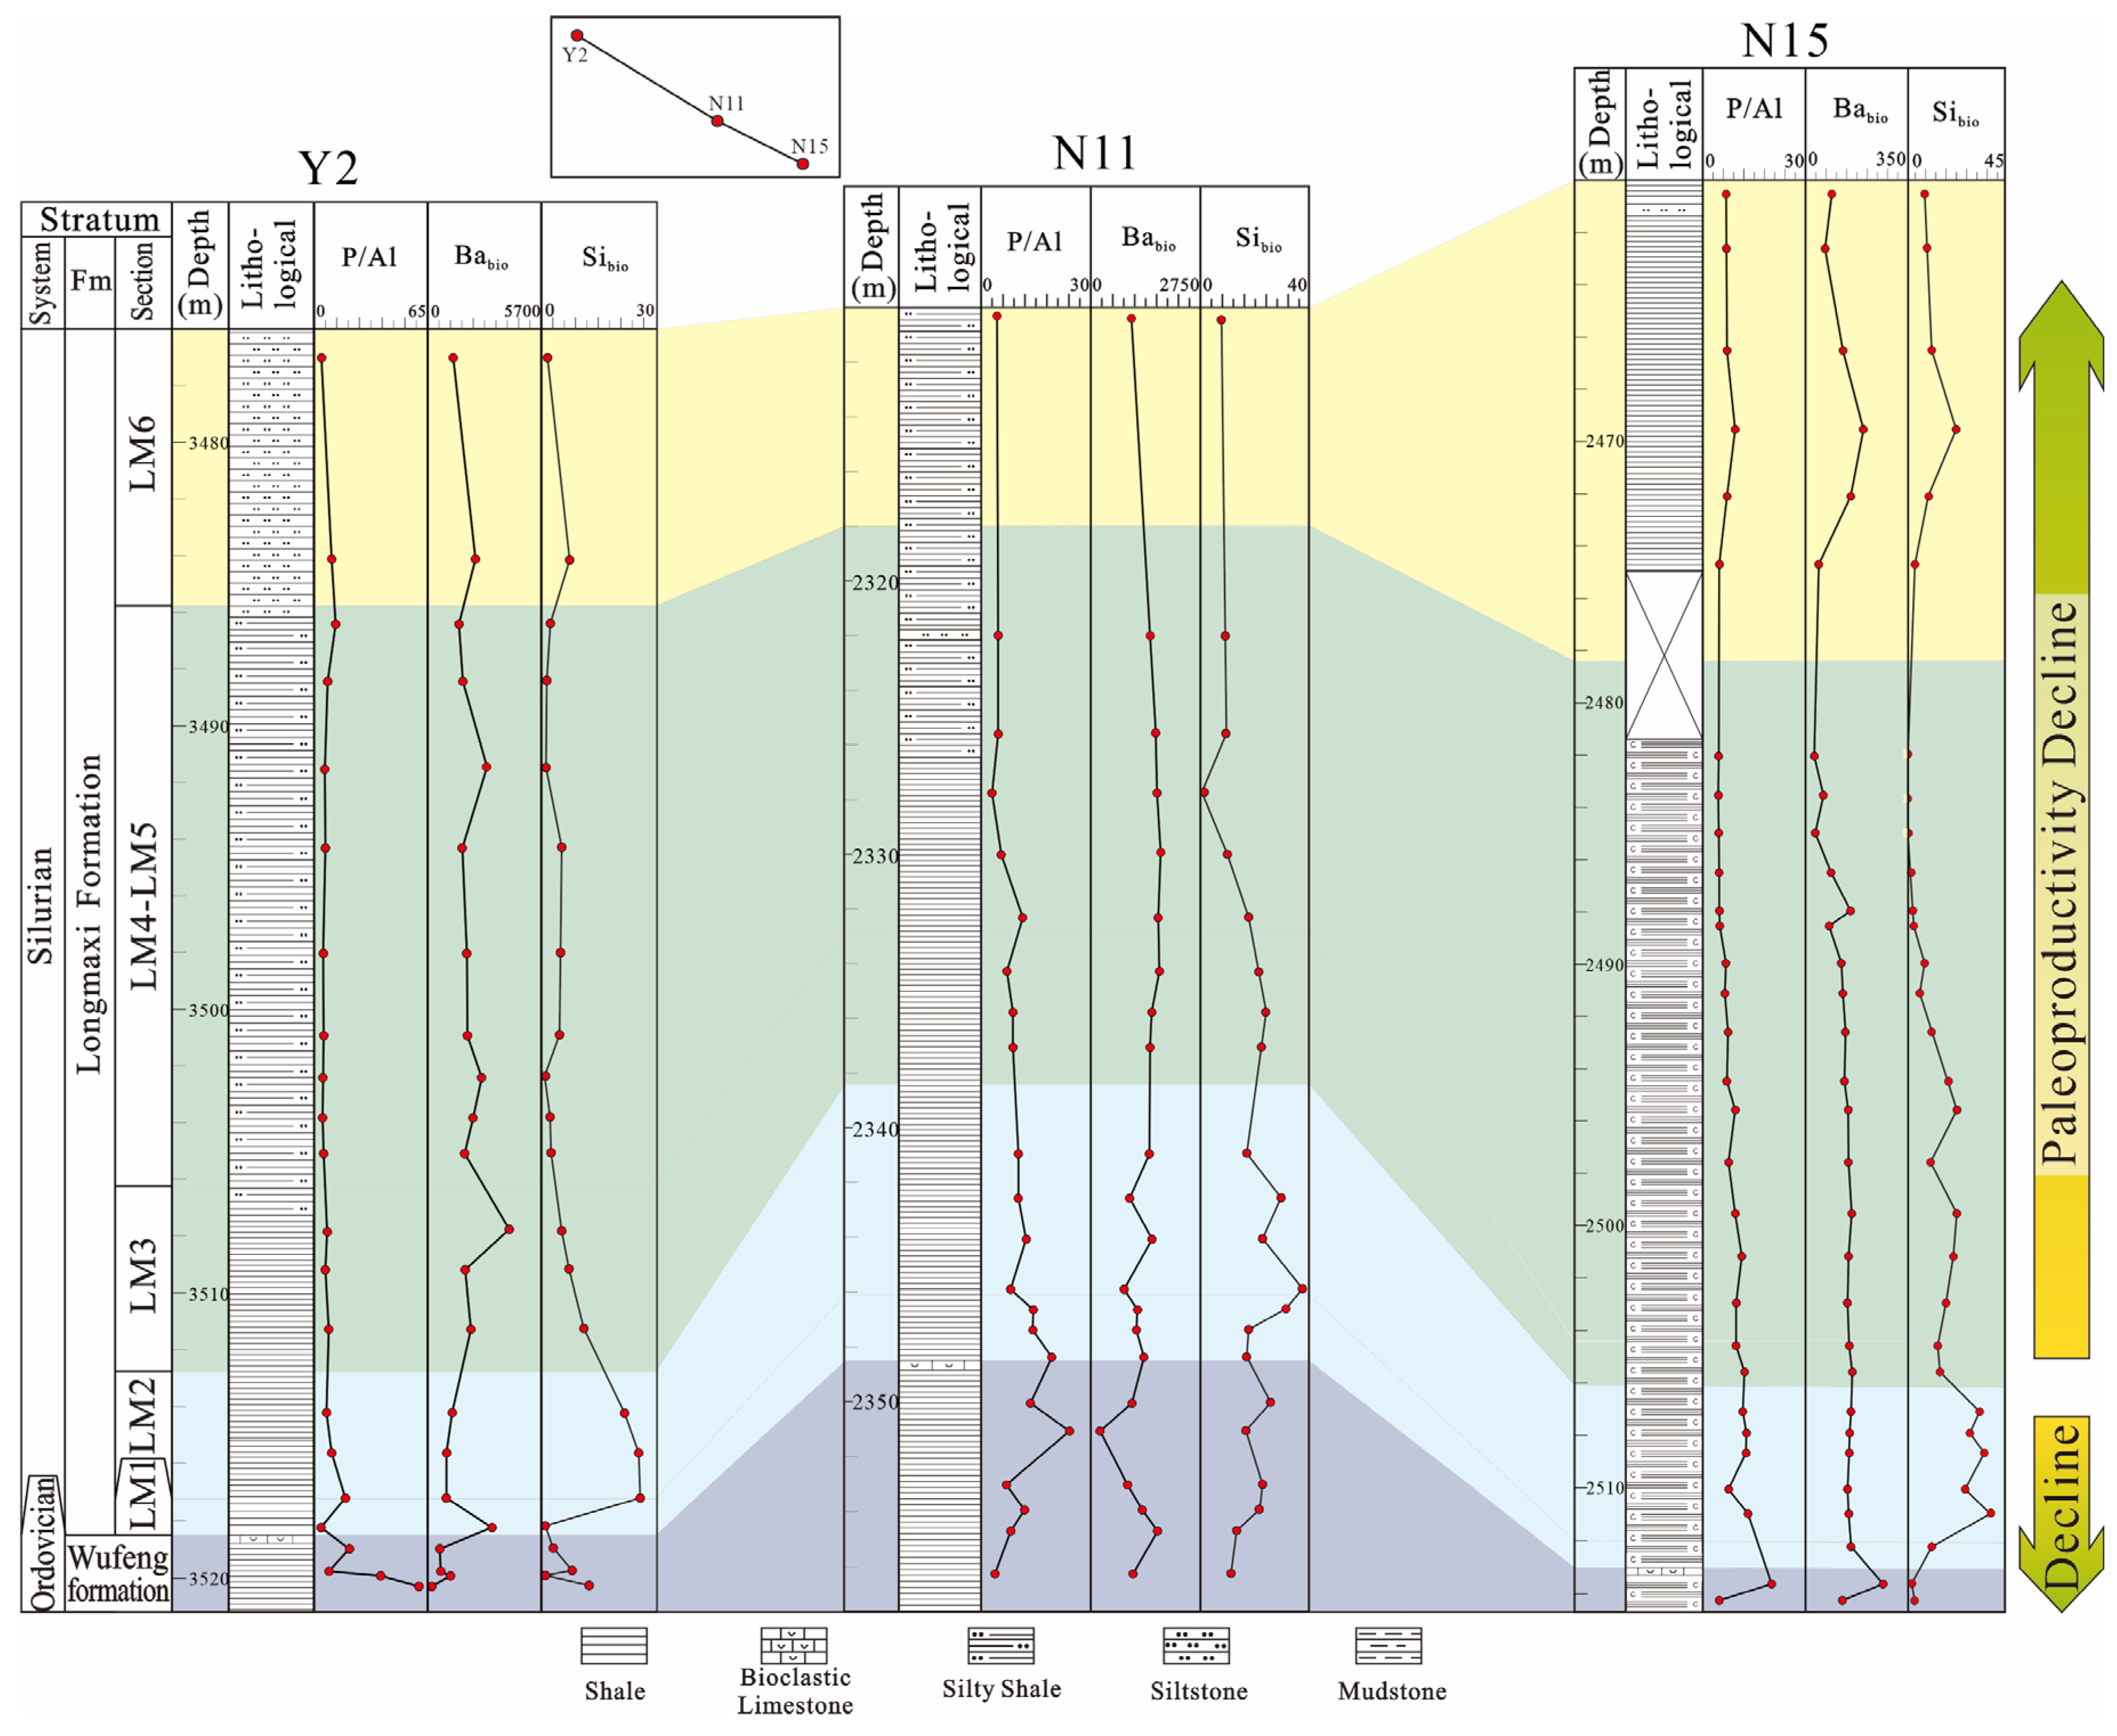
4.3.6. Paleoproductivity Proxies

Biogenic proxies (Babio, Sibio, P/Al, Mobio; Formulas (5)–(7)) reveal three productivity phases, with one-way ANOVA confirming significant stratigraphic differences across all proxies (Babio: F = 6.48, p < 0.001, η2 = 0.30; Sibio: F = 7.94, p < 0.001, η2 = 0.41; P/Al: F = 3.87, p = 0.004, η2 = 0.20; Mobio: F = 6.19, p < 0.001, η2 = 0.28, Table 1). WF2-LM2 intervals show peak values (Babio = 1280 ppm, Sibio = 8.2 wt.%), which were significantly higher than LM3-LM6 levels (p < 0.001 for Babio and Sibio), linked to radiolarian blooms [52]. Post-hoc analysis confirms LM3-LM6 shales exhibit 35–50% declines (Babio = 820 ppm, Sibio = 4.5 wt.%; p < 0.01 versus WF2-LM2) due to terrigenous dilution and reduced upwelling (Table 6). Spatial contrasts highlight 25% higher productivity in distal Well Y2 versus proximal Well N15 (Figure 8), reflecting bathymetric controls on nutrient cycling [53]. Volcanic ash-derived nutrients sustained high productivity during LM1-LM2 anoxia, with η2 > 0.20 for nutrient-sensitive proxies. These patterns are consistent with global observations of bathymetry-controlled productivity in restricted basins [54,55].

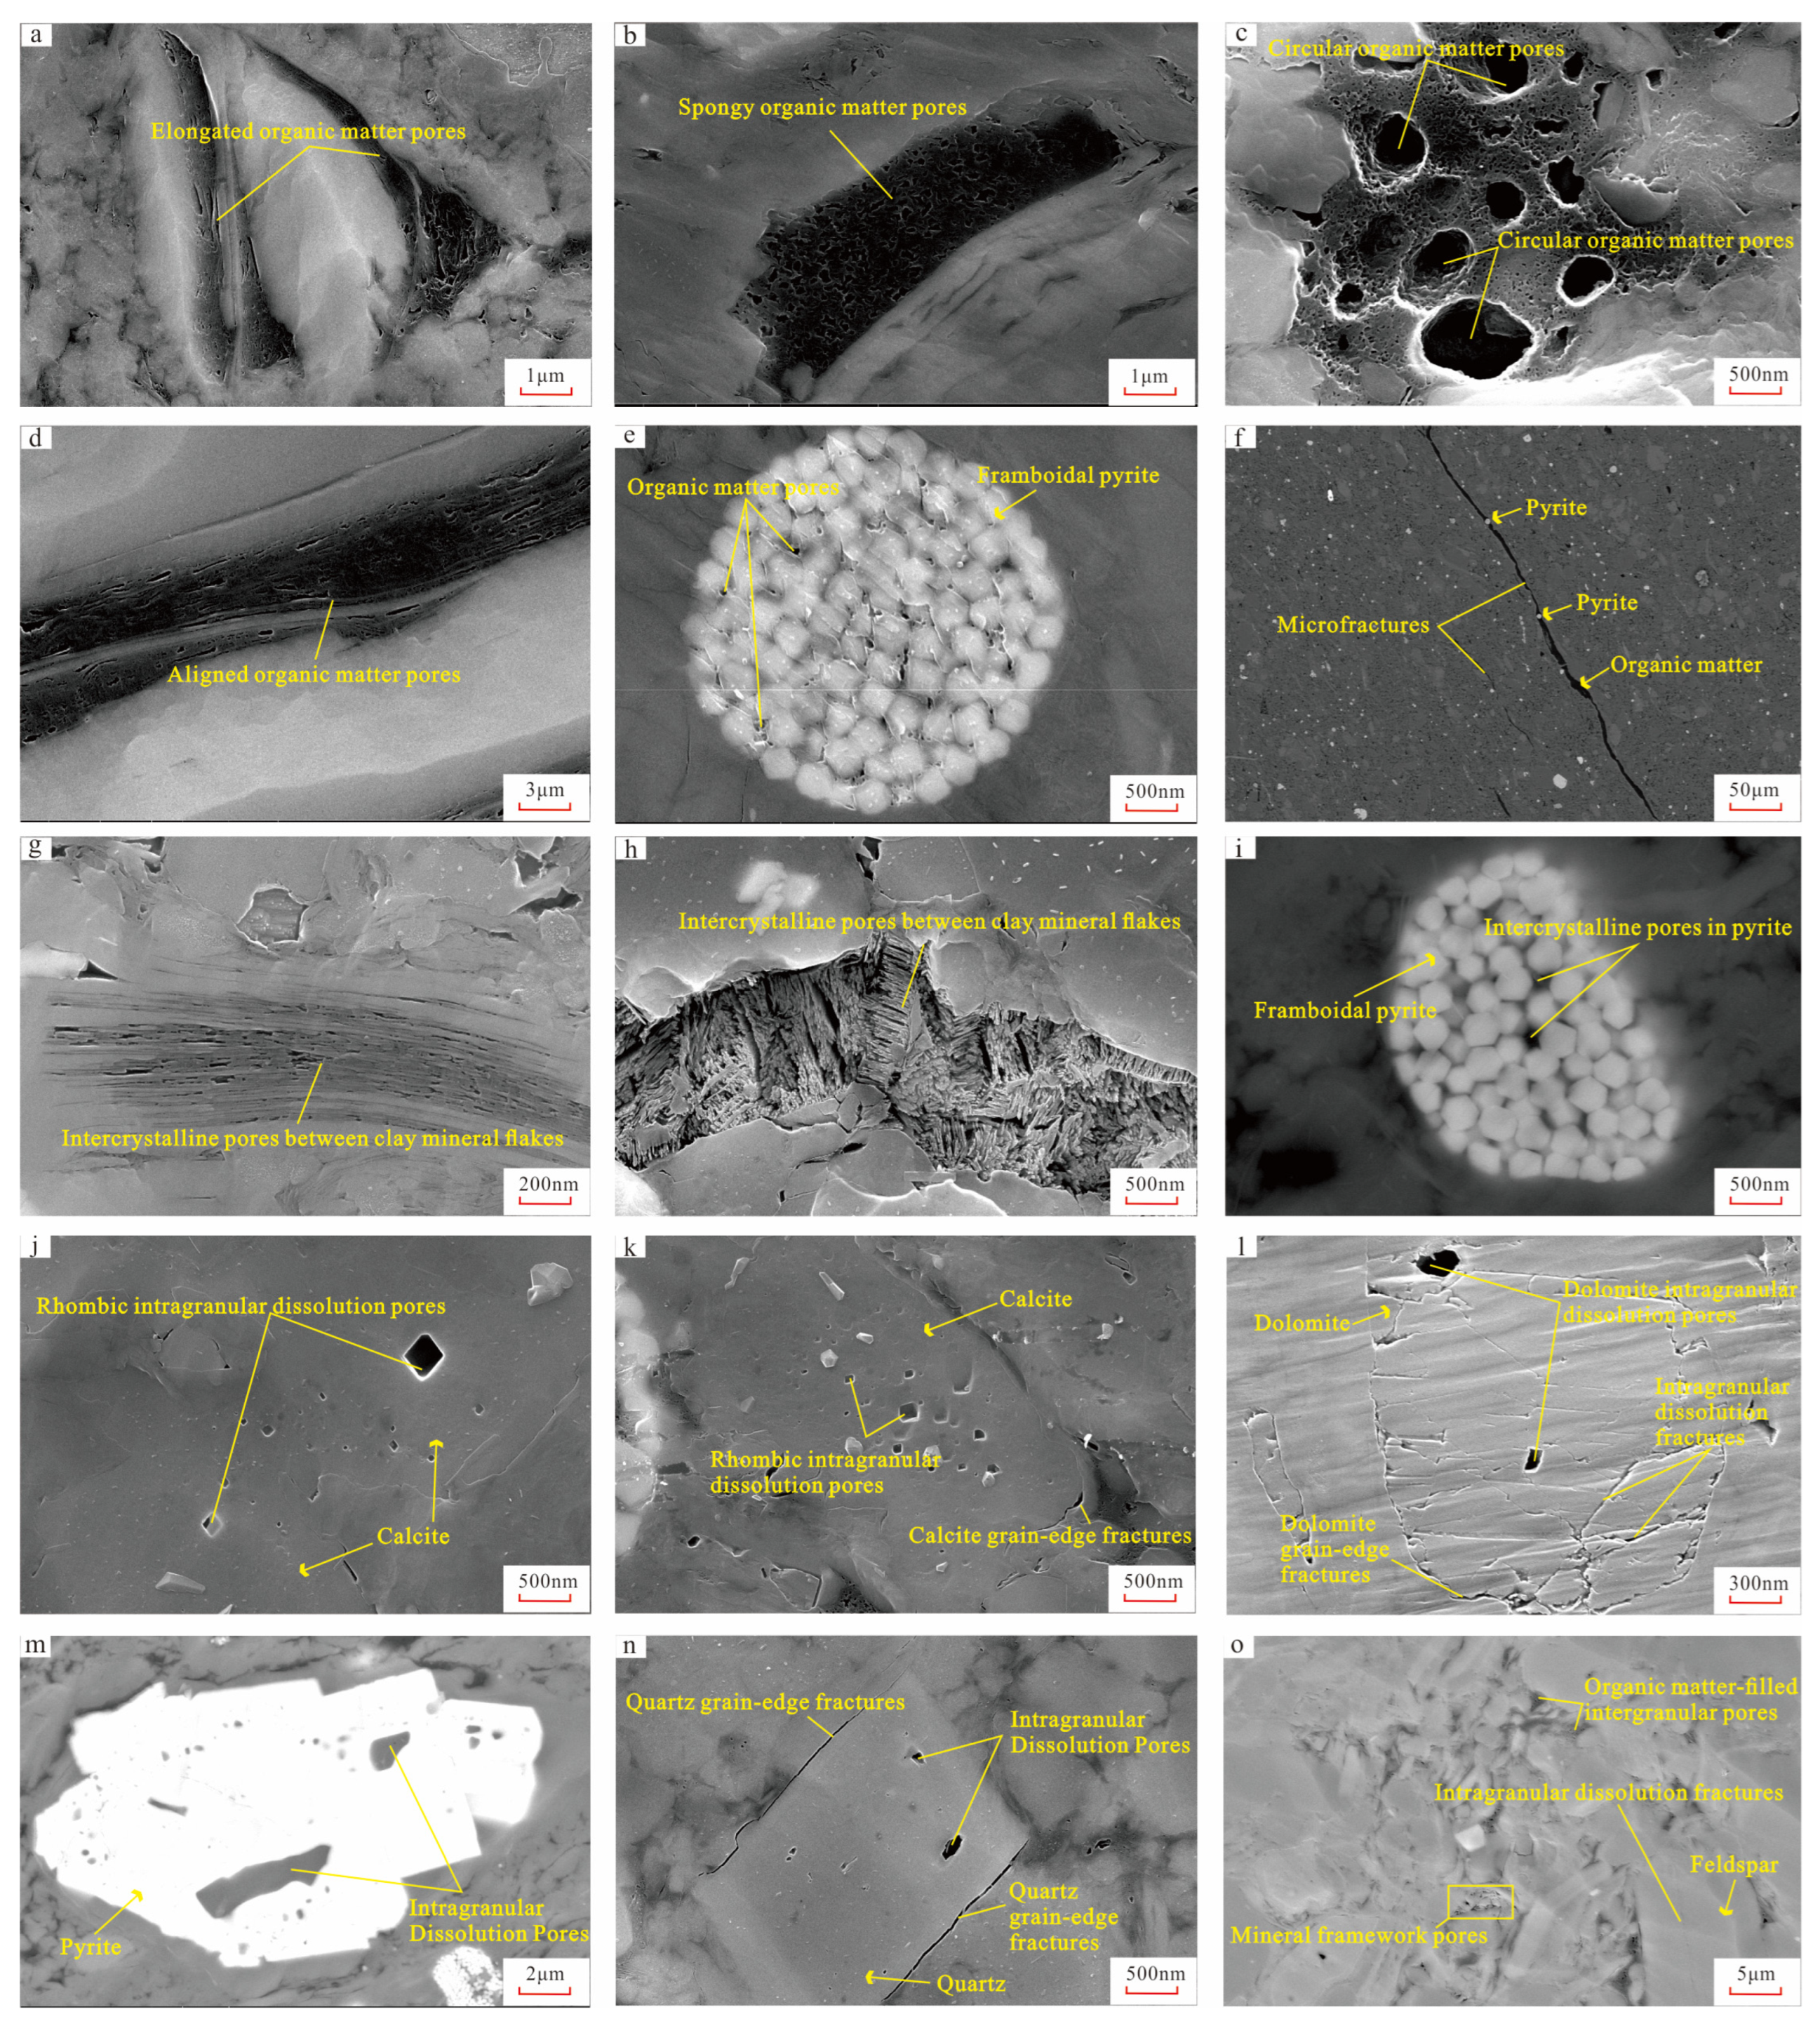
4.4. Microstructural Characteristics

Argon ion polishing-SEM imaging combined with ImageJ quantification revealed systematic pore system evolution in the Wufeng-Longmaxi shales of the Changning area (Figure 9 and Figure 10). During the strongly reducing Wufeng Formation deposition, high TOC content (>4 wt.%) promoted organic-hosted pore dominance (83.37% by count, 52.39% by area), characterized by fine mesopores (<25 nm, 60.9% of organic pores). Intraparticle inorganic pores (11.36% by count, 44.36% by area) primarily consisted of medium macropores (100–1000 nm, 54.4%) formed through diagenetic dissolution, while limited terrigenous input resulted in poorly developed interparticle pores (4.77% by count, 3.25% by area) (Figure 10).
Transition to the LM1-LM2 interval under persistent anoxia saw increased organic pore prevalence (89.26% by count, 64.43% by area), maintaining fine mesopore dominance (71.5%) with elevated coarse mesopores (25–50 nm, 12.2%). Inorganic pores decreased to 6.91% (29.60% by area), dominated by medium macropores (70.1%), while enhanced detrital influx initiated interparticle macropore development. In the LM3-LM4-LM5 phase, intensified oxygenation and terrigenous input reduced organic pore proportions (79.55% by count, 59.17% by area), exhibiting coexisting mesopores (31%) and medium macropores (29.4%). Inorganic pores expanded significantly, with interparticle pores showing a dramatic area increase (82.8%), dominated by loosely packed detrital grain-associated medium macropores (>57%. Under suboxic LM6 conditions, low TOC content (<2.5 wt.%) caused organic pore collapse (29.50% by count, 2.74% by area), shifting to inorganic-dominated systems. Interparticle pores emerged as the primary type (47.57% by count, 52.52% by area) with abundant medium macropores (52.7%), while pyrite intercrystalline intraparticle pores increased substantially (22.93% by count, 44.74% by area) (Figure 9 and Figure 10).
The stratigraphic analysis demonstrates an evolutionary trend from Wufeng to upper Longmaxi shales: decreasing organic pore abundance, increasing inorganic pore contribution, and progressive pore-size enlargement, reflecting coupled controls from declining paleoproductivity, enhanced oxygenation, and intensified terrigenous clastic input.

5. Discussion

5.1. Sedimentary Environmental Controls on Shale Reservoirs

5.1.1. Mineralogical Constraints of Sedimentary Environments

Depositional environments exert significant control on the mineral composition of rocks, with distinct formation, deposition, and distribution patterns observed for siliceous minerals, carbonate minerals, clay minerals, and pyrite under different conditions [56,57]. To investigate mineralogical variations in shale reservoirs across depositional settings, we analyzed mineral assemblages from different intervals based on redox conditions, terrigenous detrital influx, basin restriction intensity, and paleoproductivity (Table 7). The results demonstrate that the Wufeng Formation exhibits higher carbonate mineral content but lower quartz abundance compared to the Longmaxi Formation (Figure 11). This disparity is attributed to the anoxic, strongly restricted conditions during Wufeng shale deposition, where sulfate-reducing microorganisms facilitated carbonate precipitation through metabolic processes. Post-microbial activity, carbonate deposition persisted on microbially modified substrates [58,59]. Furthermore, frequent volcanic activities during Wufeng sedimentation altered seawater temperature, salinity, mineralization, and alkalinity, creating favorable environments for carbonate-precipitating bacteria proliferation, thereby directly enhancing carbonate deposition [60,61,62]. Within the Longmaxi Formation, quartz content progressively decreases upward, accompanied by increasing feldspar and clay mineral abundances (Figure 11). This vertical trend reflects the dominance of biogenic quartz in lower units (LM1 to LM2), where exceptionally high paleoproductivity supported extensive biogenic silica formation. The subsequent decline in paleoproductivity through the LM6 interval resulted in reduced biogenic quartz contribution. Conversely, terrigenous input exhibited an inverse pattern, transitioning from minimal clastic delivery in LM1 to enhanced detrital supply in LM6, driving the upward increase in feldspar and clay mineral contents.
Shales with distinct mineralogical compositions exhibit fundamentally different responses to subsequent diagenetic processes and pore-structure evolution. Unlike conventional sandstone or carbonate reservoirs, shales develop abundant nanoscale organic-hosted pores, necessitating not only organic matter abundance evaluation but also mineral-specific compaction resistance considerations in reservoir assessment. For instance, rigid minerals (e.g., siliceous minerals, carbonates, and pyrite) extensively deposited under suboxic to strongly restricted environments in the Wufeng and Longmaxi Formations demonstrate superior pore-preserving capabilities against mechanical compaction [63]; dissolution-prone minerals including feldspar, calcite, and dolomite can generate secondary dissolution pores that significantly enhance porosity development through dissolution processes. Notably, the formation of these mineral assemblages is fundamentally controlled by the paleoredox conditions and hydrodynamic regimes of depositional environments. Strongly reducing conditions in deep-water restricted basinal facies not only favor organic matter enrichment but also promote biogenic silica and pyrite deposition by suppressing terrigenous clastic influx, whereas moderate-energy settings in shallow-water shelf facies facilitate mechanical concentration of carbonate minerals. This environment-mineral coupling mechanism directly governs both the compaction resistance of primary pores and the development potential of secondary pores in shale reservoirs, constituting the material foundation for premium shale reservoir development.

5.1.2. Organic Matter Control by Sedimentary Environment

The debate on organic matter enrichment mechanisms in black shale and hydrocarbon source rocks dates back to the early 20th century. Building upon previous research on organic matter enrichment models [64,65], this study analyzes the organic matter enrichment in shales through three sedimentary environmental factors: redox conditions, paleoproductivity, and terrigenous detrital influx.
i.
Redox environment
Our petrochemical data from the Changning area reveal limited stratigraphic variation in V/(V + Ni) ratios throughout the Wufeng-Longmaxi shale succession. Consequently, V/Cr and U/Th ratios were selected as more sensitive redox proxies for investigating the relationship between redox conditions and TOC enrichment. Results revealed positive correlations between TOC and both V/Cr and U/Th ratios in the Wufeng and Longmaxi formations, with V/Cr exhibiting a stronger correlation. TOCs in the shale of the Wufeng Formation, LM1-LM2 shale, and LM3-LM4-LM5 shale show greater redox environmental influence compared to the LM6 shale. This discrepancy likely relates to organic matter preservation under reducing environments: the Wufeng Formation shale developed under anoxic to dysoxic conditions, LM1-LM2 under anoxic conditions, and LM3-LM4-LM5 under dysoxic conditions. In contrast, the LM6 interval experienced near-oxic depositional environments in the Changning area. Reducing conditions therefore favored organic matter preservation, while the LM6 shale’s TOC shows no significant correlation with redox parameters due to proximity to oxic conditions (Figure 12).
ii.
Primary Productivity
During the depositional initiation of the Wufeng Formation to LM1-LM5 the water column was predominantly characterized by anoxic conditions, resulting in partial reduction and dissolution of bioavailable barium (Babio), thus rendering measured values inadequate for accurately reflecting paleoproductivity levels. Additionally, biogenic silica (Sibio) analyses revealed zero values in some samples, demonstrating incomplete correlation with total organic carbon (TOC). Consequently, the phosphorus/aluminum ratio (P/Al) and bioavailable molybdenum (Mobio) were preferentially selected to evaluate the influence of paleo-marine productivity on organic matter enrichment.
Overall, the paleoproductivity of the Wufeng-Longmaxi Formation shales exerted a positive control on organic matter enrichment, with Total Organic Carbon (TOC) content showing significant responsiveness to paleoproductivity variations. However, the degree of this influence differed across stratigraphic intervals. During the deposition of the Wufeng Formation shale, elevated paleoproductivity levels corresponded to substantial TOC accumulation. The LM1-LM2 shales, deposited under exceptionally high paleoproductivity conditions, thus exhibited a stronger paleoproductivity influence on TOC. Conversely, the LM3-LM4-LM5 shales, associated with relatively lower paleoproductivity, demonstrated more limited TOC responsiveness to productivity fluctuations. Notably, the LM6 shale deposited under extremely low paleoproductivity conditions showed minimal TOC sensitivity to productivity variations (Figure 13).
iii.
Terrigenous detrital influx
To clarify the impact of terrigenous detrital influx on organic matter enrichment, we adopted aluminum (Al) and titanium (Ti) concentrations as indicators of terrigenous influx. As established earlier in this work, the strongest inter-element correlation (R2 = 0.7081) among terrigenous elements is observed between Al and Ti within the Wufeng-Longmaxi Formation shales. Although zirconium (Zr) displayed moderate correlations with both Ti and Al, its weaker association compared to the Al-Ti pair justified its exclusion. Analysis of TOC versus Al correlations demonstrated an overall negative relationship (Figure 14), suggesting that enhanced terrigenous input inhibited organic matter accumulation. The influence of terrigenous detrital influx on TOC varied significantly across depositional environments and stratigraphic intervals.
Based on the correlation analysis between Ti, Al elements, and total organic carbon (TOC) content, the influence of terrigenous detrital influx on TOC shows significant variations across different shale intervals. The Wufeng Formation shale and LM1-LM2 shale exhibit weak correlations between TOC and Ti/Al elements, with correlation coefficients (R) of 0.26 (Ti) and 0.01 (Al) for the Wufeng Formation, and 0.17 (Ti) and 0.10 (Al) for LM1-LM2, respectively, indicating minimal interference from terrigenous material input on organic matter enrichment. In contrast, the LM3-LM4-LM5 shale and LM6 shale demonstrate strong negative correlations between TOC and Ti/Al elements, with R values reaching 0.58 (Ti) and 0.52 (Al) for LM3-LM4-LM5, and substantially higher coefficients of 0.69 (Ti) and 0.77 (Al) for LM6. These enhanced correlations reveal that organic matter abundance in these intervals is predominantly controlled by terrigenous clastic influx intensity (Figure 14).
To sum up, terrigenous detrital influx negatively impacts organic matter enrichment by diluting organic content, but its influence is limited in the Wufeng Formation and LM1-LM2 shale intervals. In contrast, it exerts a significantly stronger dilutive effect on organic matter abundance in the LM3-LM4-LM5 and LM6 shale intervals.
In order to quantitatively assess the roles of different indicators in controlling TOC enrichment, regression significance tests were separately conducted for U/Th, Mobio, and Al% to evaluate redox conditions, paleoproductivity, and terrigenous input controls on total organic carbon (TOC). Results demonstrate that: (1) The paleoproductivity parameter (Mobio) exerts the most substantial influence on TOC (R² = 0.368, β = 0.033, p < 0.001), establishing it as the primary control on organic matter supply; (2) Though secondary in explanatory power (adjusted R² = 0.186), the redox parameter (U/Th) displays the strongest per-unit regulatory capacity (β = 0.744, p < 0.001), revealing the critical enhancement of preservation efficiency under anoxic conditions; (3) The terrigenous input parameter (Al%) exhibits significant but weaker negative control (adjusted R² = 0.114, β = −0.058, p = 0.002), reflecting the secondary limiting effect of detrital dilution. This hierarchy of importance clearly delineates: Paleoproductivity provides the material basis for enrichment (explaining 36.8% of variance), redox conditions regulate enrichment intensity, and terrigenous input functions as a subordinate inhibitory factor (Table 8).

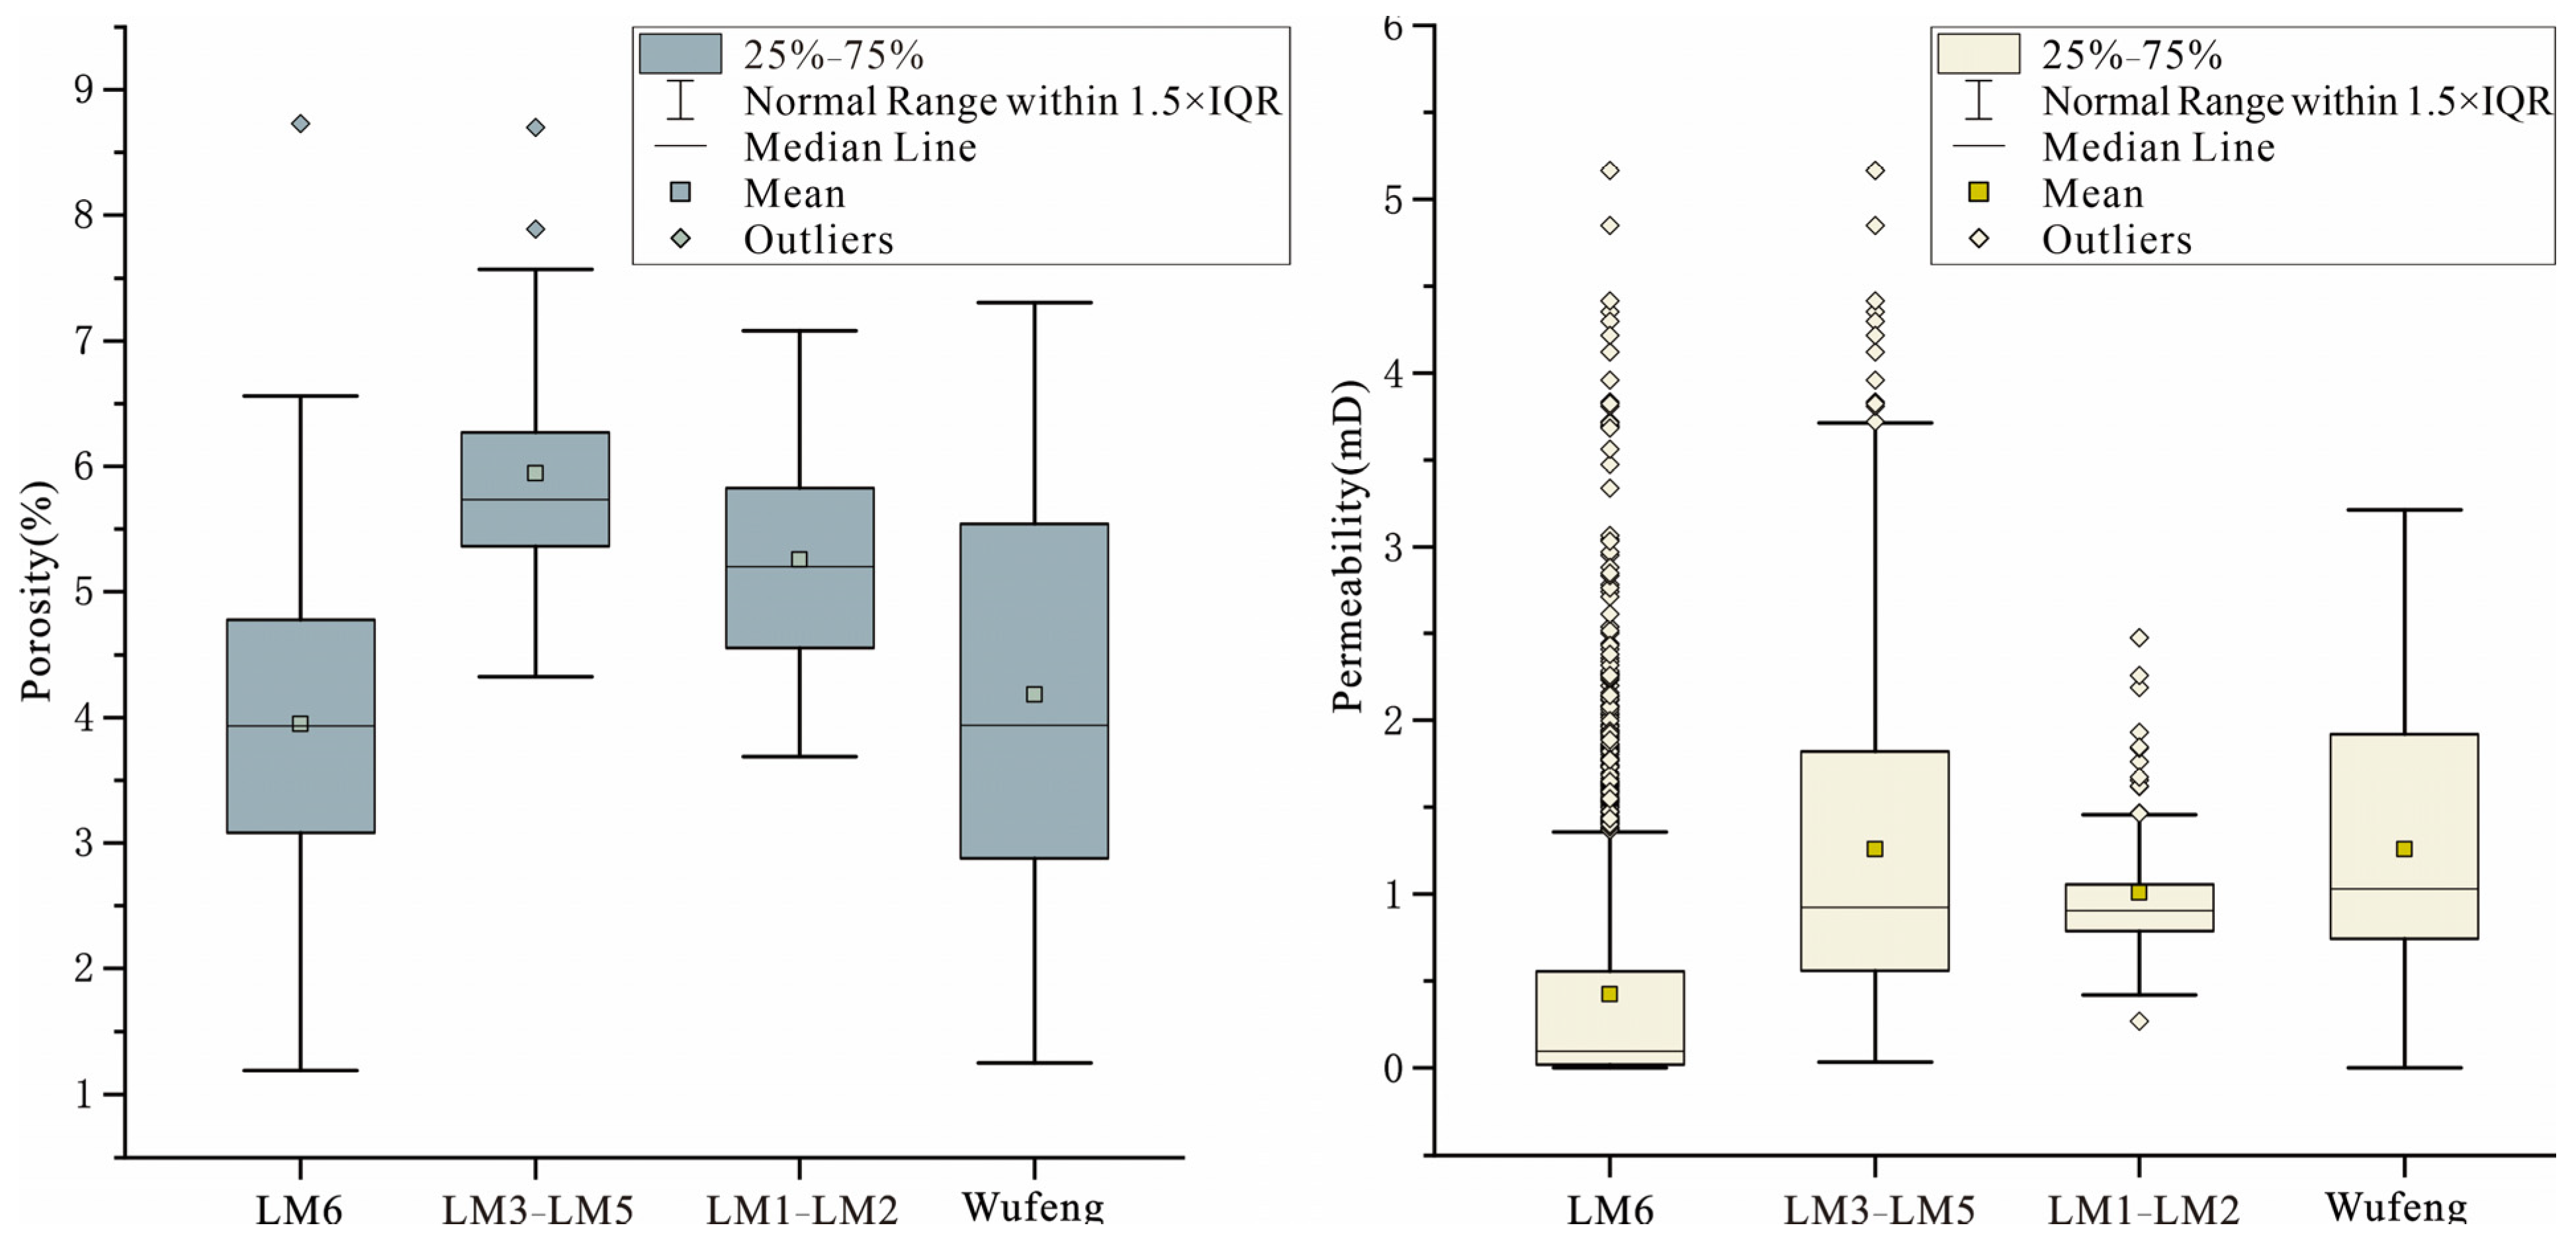
5.1.3. Porosity Evolution Under Sedimentary Environment Controls

Shale reservoirs exhibit lower porosity and permeability compared to conventional hydrocarbon reservoirs. Previous studies demonstrate that depositional environments influence both pore types and sizes in shales, with porosity being consequently controlled by these factors and thus varying across different depositional settings. Analysis of formation-specific porosities reveals that Wufeng Formation shales possess lower porosity (averaging 4%) than LM1-LM5 shales, with 54.54% of samples exhibiting porosities below 4%. The LM1-LM5 intervals show higher porosities (both >5% average), where 94.12% and 100% of samples, respectively, exceed 4% porosity—significantly above the 2% shale reservoir cutoff. The LM6 shales display the lowest porosity (3.65% average), with over 50% of samples below 4% (Figure 11 and Figure 15).
Shale porosity is primarily controlled by mineral composition, organic matter content/type, and thermal maturity [66,67]. The LM1-LM2 and LM3-LM4-LM5 shales exhibit relatively higher TOC under their depositional environments, promoting organic pore development. Coupled with elevated brittle mineral content, their rigid frameworks resist compaction-induced pore occlusion, resulting in higher porosities. Although Wufeng Formation shales possess high TOC, subsequent calcite cementation during diagenesis partially occludes pores, yielding lower porosity compared to the LM1-LM5 shale intervals. The LM6 shales demonstrate reduced porosity due to lower TOC under oxidizing conditions and enhanced terrigenous input, inhibiting organic pore development.
On the other hand, shale reservoirs exhibit significantly lower permeability compared to conventional reservoirs, typically ranging from nanodarcies (nD) to millidarcies (mD), and even extending into the microdarcy (μD) range [68]. The permeability cutoff for shale reservoirs is generally referenced to Schlumberger’s established lower limit of >1.0 × 10⁻⁴ mD [69]. Statistical analysis reveals that the Wufeng Formation shale, LM1-LM2 shale, and LM3-LM4-LM5 shale marginally exceed this cutoff with average permeabilities of 1.25 × 10⁻⁴ mD, 1 × 10⁻⁴ mD, and 1.24 × 10⁻⁴ mD respectively, while the LM6 shale demonstrates lower permeability averaging only 0.43 × 10⁻⁴ mD, below the established threshold. Further permeability analysis indicates that 54.13% of Wufeng Formation samples exceed 1.0 × 10⁻⁴ mD, whereas over 80% of LM6 shale samples exhibit permeability below 1.0 × 10⁻⁴ mD (Figure 11 and Figure 15).
Permeability variations are primarily pore-related. The Wufeng Formation shale demonstrates favorable permeability due to both sufficient organic pores and dissolution-enhanced channels from abundant carbonate minerals. In contrast, the LM1-LM5 shales exhibit higher permeability owing to their elevated porosity and better connectivity of dominant organic pores compared to inorganic pores. Although the LM6 shale displays lower permeability, its boxplot reveals abundant positive outliers, potentially associated with the prevalence of inorganic pores with larger apertures and poorer sorting of terrigenous clastics deposited during the Late Longmaxi Formation’s shallower water conditions.

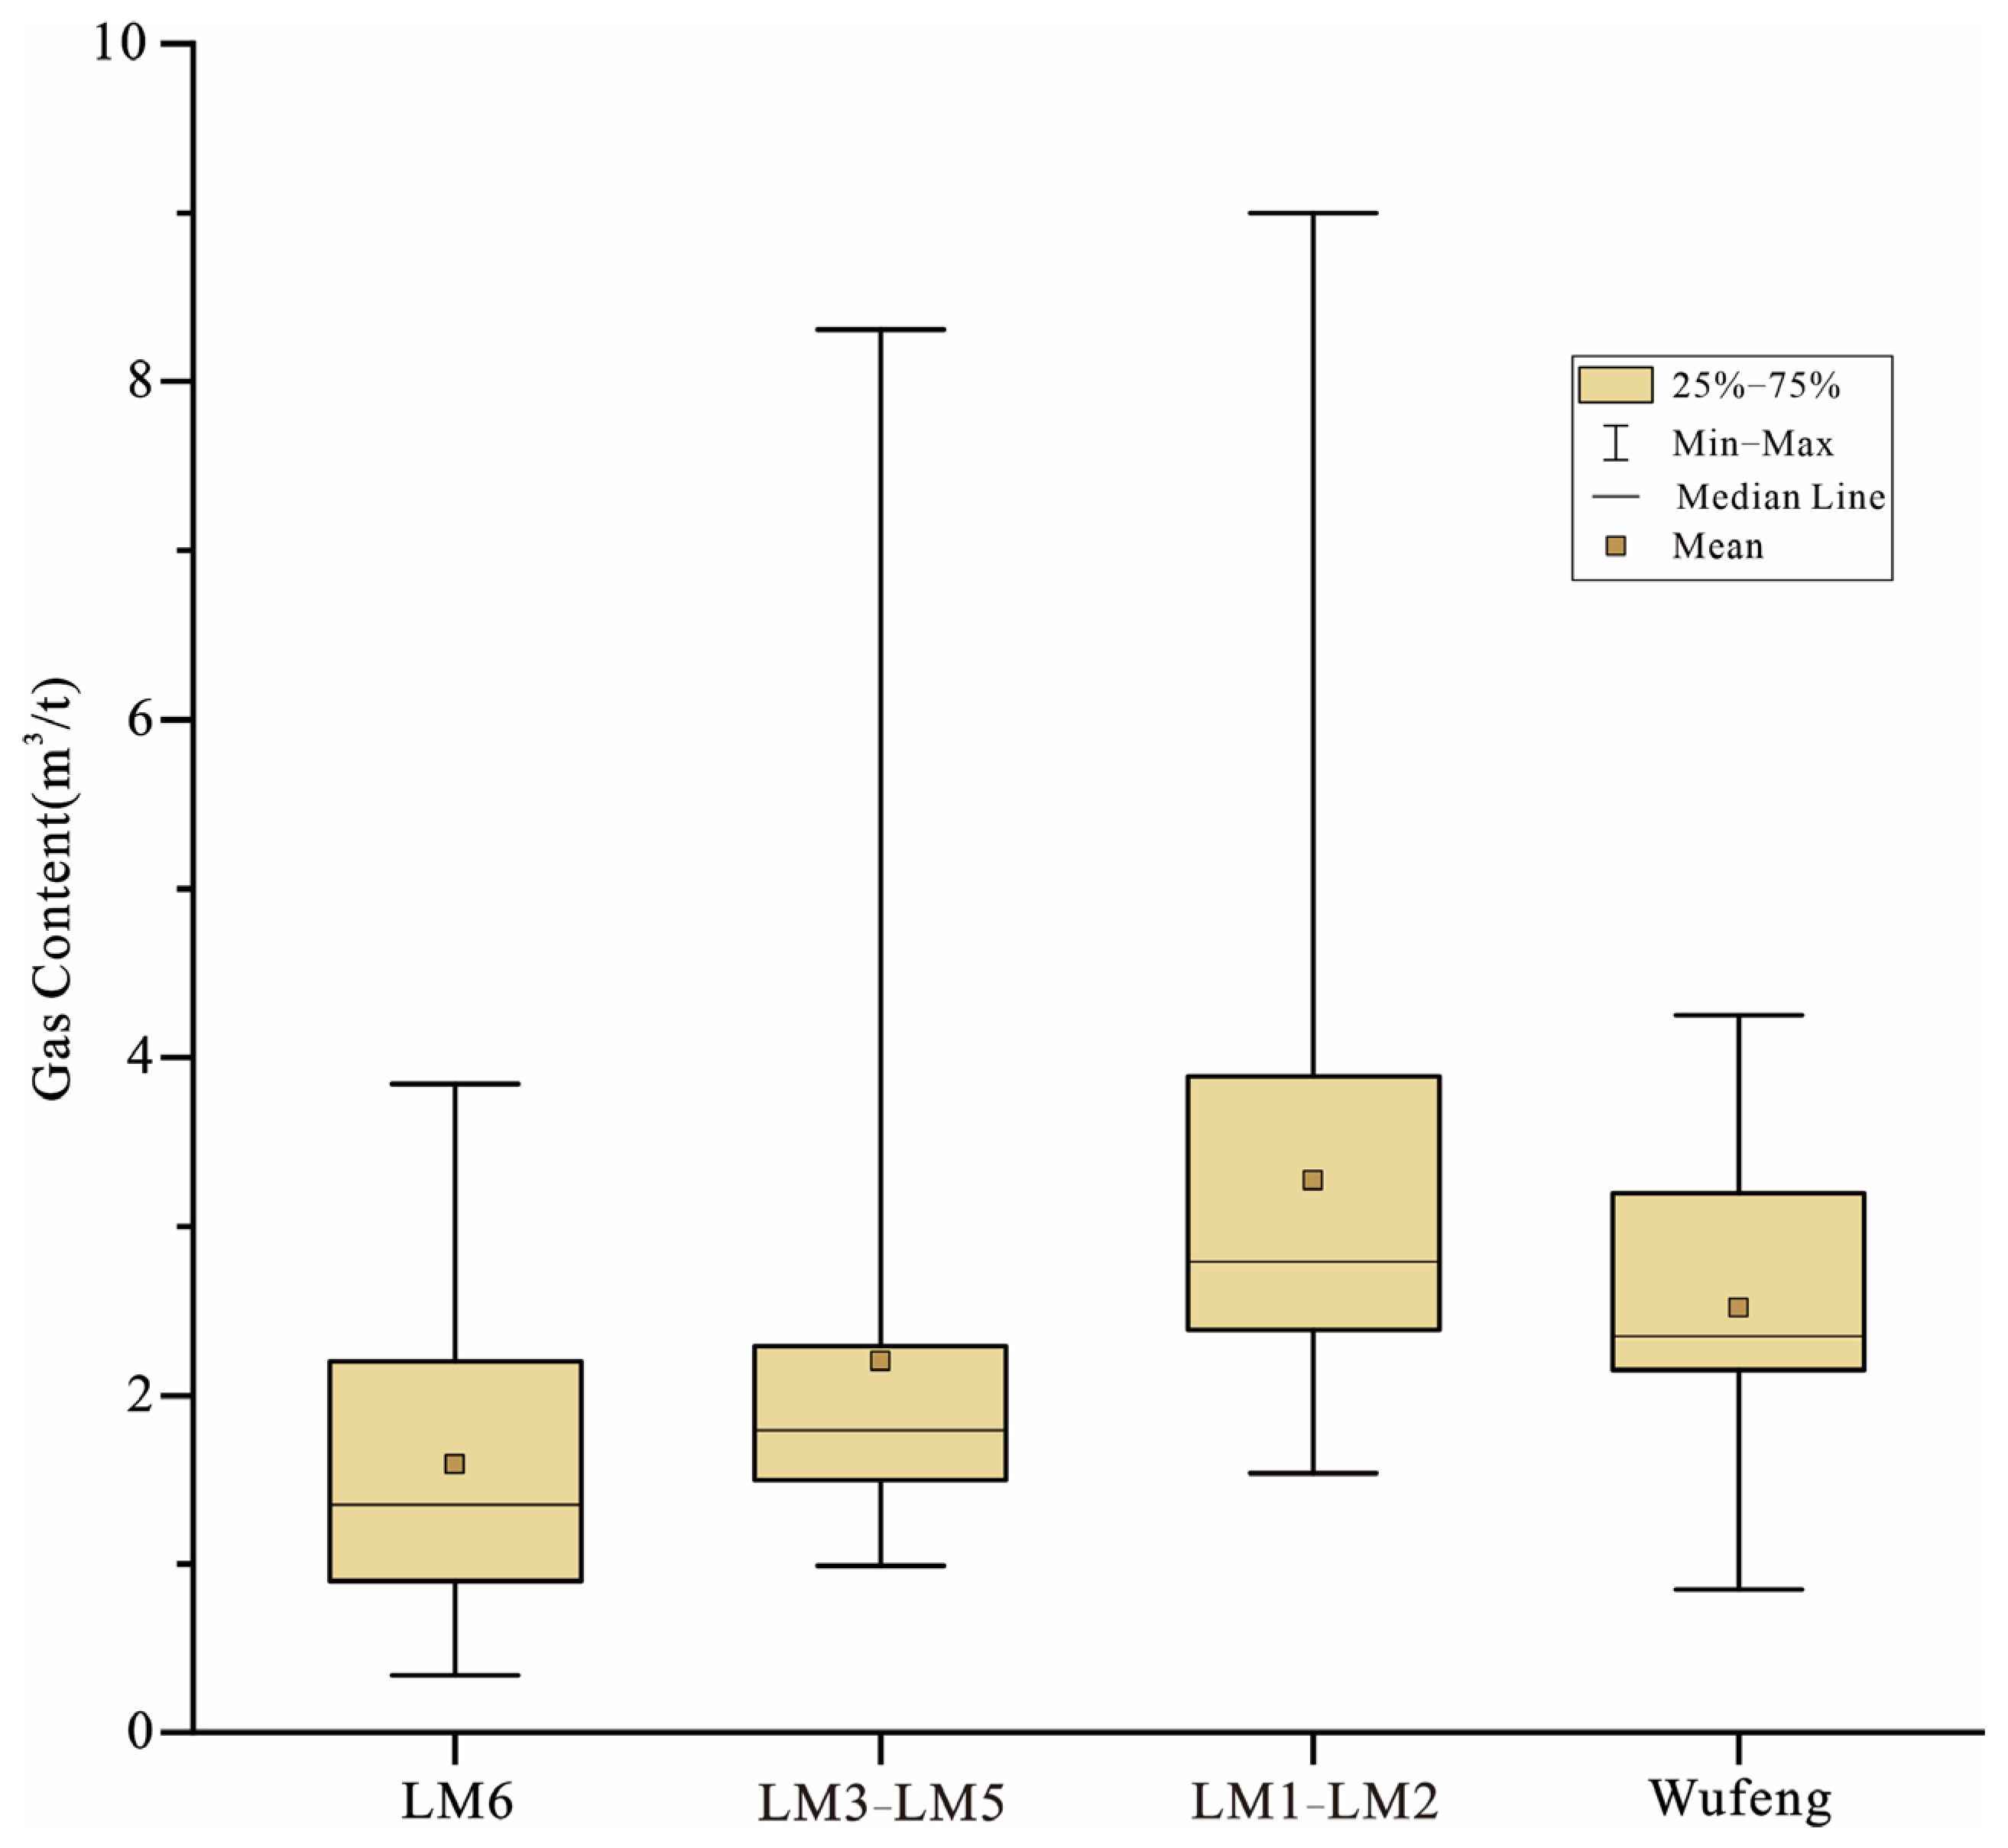
5.1.4. Sedimentary Environmental Controls on Shale Gas-Bearing Properties

Gas content serves as a critical parameter for shale reservoir evaluation and the ultimate indicator determining the commercial viability of shale gas development. Data from developed shale plays in North America demonstrate a minimum threshold gas content of 2 m3/t for favorable shale gas production zones [70]. Analysis of gas-bearing characteristics in the Changning region reveals significant vertical heterogeneity across stratigraphic intervals: The LM1-LM2 interval exhibits the highest gas content (>2 m3/t in 75.5% of samples), followed by the Wufeng Formation interval (66.7% exceeding 2 m3/t), while the LM3-LM4-LM5 interval shows slightly lower values (62.5% >2 m3/t). The LM6 interval demonstrates the poorest gas-bearing capacity (<2 m3/t in 75% of samples), indicating relatively limited commercial development potential (Figure 11 and Figure 16).
Gas content is influenced by TOC and pore-structure characteristics [71,72]. The LM1-LM2 shale’s depositional environment facilitated organic matter enrichment, resulting in exceptionally high TOC. This elevated TOC enhances organic pore development and provides adequate hydrocarbon generation potential, thereby yielding high gas content. While the Wufeng Formation shale also formed under organic-favorable depositional conditions, its TOC is lower than that of the LM1-LM2 interval. Combined with inferior pore development compared to LM1-LM2, these factors limit gas retention capacity, resulting in relatively lower (though still significant) gas content. The LM3-LM4-LM5 shale exhibits weaker depositional controls on TOC preservation, leading to reduced organic carbon content and consequently lower (but commercially viable) gas content. The LM6 shale developed in environments unfavorable for organic matter preservation, where terrigenous detrital influx diluted and degraded organic material, resulting in extremely low TOC. Coupled with poorly developed porosity, these conditions produce subeconomic gas content that fails to meet industrial development standards.
The analysis of redox conditions, paleoproductivity, and terrigenous input reveals a positive correlation between reducing environments/high paleoproductivity and TOC enrichment, whereas terrigenous detrital influx exhibits detrimental dilution effects. Both the Wufeng Formation and LM1-LM2 shales are jointly controlled by redox conditions and paleoproductivity, resulting in elevated TOC (>4% in 40% of samples) under low-oxygen, high-productivity settings. The LM3-LM4-LM5 shale’s TOC is predominantly governed by redox conditions and terrigenous input, with limited paleoproductivity influence, yielding only 11.48% of samples exceeding 4% TOC, while 81.97% fall within the 2–4% range. In contrast, the LM6 shale demonstrates markedly low TOC due to intense terrigenous dilution, with paleoproductivity and redox conditions exerting minimal control on organic matter accumulation: merely 3.18% of samples surpass 2% TOC, with the majority (<96.82%) below this threshold (Figure 11).

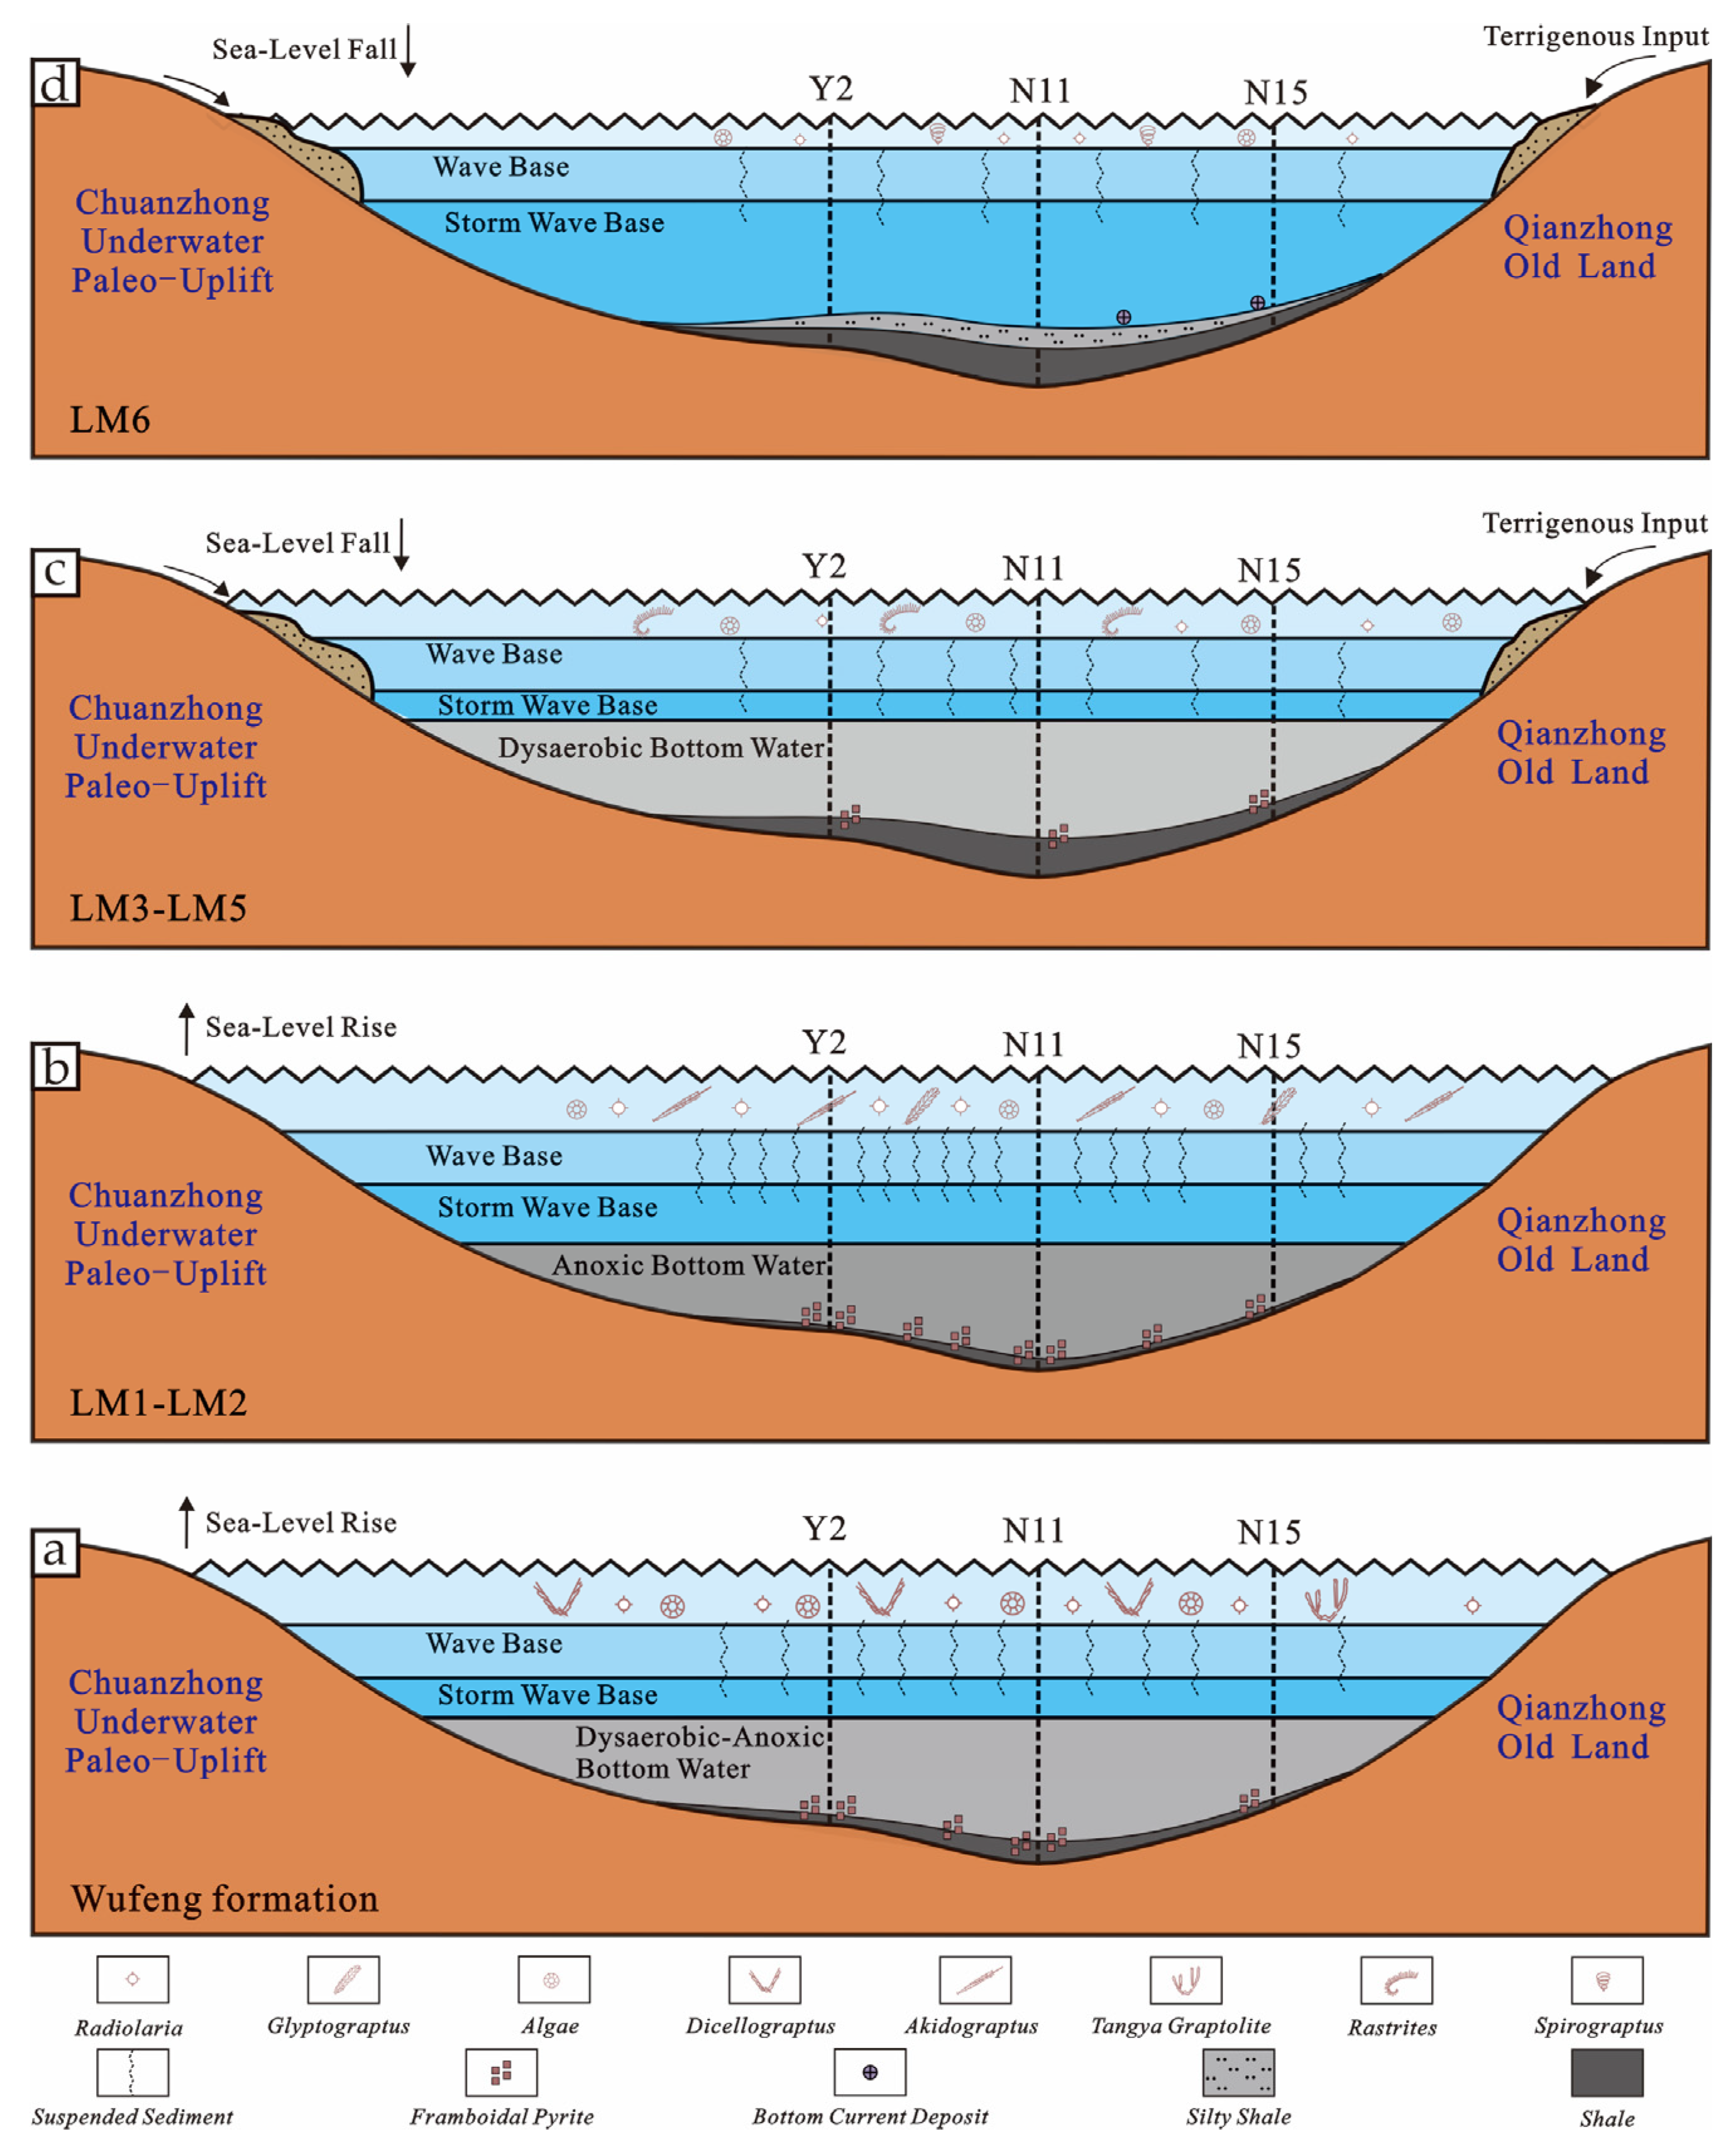
5.2. Sedimentary Evolution Patterns and Reservoir Characteristics

During the Wufeng-Longmaxi Formation depositional period, the Sichuan Basin developed under a “three-uplift-surrounding-one-depression” tectonic framework, creating a restricted water mass with a limited hydrodynamic exchange that facilitated a relatively confined deep-water setting. This environment sustained multiple sedimentation mechanisms including bottom-current deposition, biogenic sedimentation, and suspension deposition [73].
During the deposition of the Wufeng Formation shale, regional tectonic activity subsided to moderate levels, coinciding with a sustained sea-level rise to highstand. The Upper Yangtze Sea Basin evolved into a strongly restricted basin characterized by a highly restricted water mass with limited hydrodynamic exchange. Bottom waters exhibited dysoxic to anoxic conditions, with abundant framboidal pyrite development. These reducing conditions created optimal preservation environments for organic matter. Frequent but short-lived volcanic eruptions maintained warm-humid climatic conditions [74,75], fostering nutrient-rich surface waters that sustained prolific biological communities including radiolarians, echinoderms, diatoms, Dicellograptus, and Tangyagraptus [76]. These conditions elevated paleoproductivity, supplying organic enrichment precursors. Concurrently, sulfate-reducing bacteria proliferation under restricted/anoxic regimes enhanced carbonate mineral precipitation. Although cementation of carbonate minerals degraded shale porosity in the Wufeng Formation, preserved fluid pathways paradoxically improved permeability (Figure 17a).
During the deposition of LM1-LM2 shale following the Hirnantian glacial event, temperatures rose, transitioning the climate to warm-humid conditions, accompanied by rapid melting of global ice sheets and sustained sea-level rise. The basin was a semi-restricted environment during this period. The influx of glacial meltwater (low-salinity freshwater) led to the development of a stable water column stratification within the basin. This stratification resulted in an isolated deep bottom water mass, characterized by extremely low oxygen levels, an anoxic redox environment, and abundant development of framboidal pyrite in the rocks. In stark contrast, the overlying surface water, fueled by nutrients derived from the meltwater and basin processes (showing elevated Sibio and P/Al ratios), sustained highly prosperous paleontological communities dominated by siliceous radiolarians, siliceous algae, Glyptograptus, and Akidograptus [77,78]. This combination of stratification isolating the deep water and the surface layer exhibiting extremely high primary paleoproductivity, along with minimal terrigenous input, created exceptional conditions for organic matter production and preservation. Prolific siliceous organisms precipitated substantial quartz minerals, while enhanced organic preservation under anoxic bottom water conditions facilitated the development of organic pores and shale gas retention during burial thermal maturation (Figure 17b).
During the LM3-LM5 shale depositional period, sea-level decline triggered a gradual oxygenation of bottom water masses, transitioning to dysoxic conditions that weakened the favorable environments for organic matter enrichment and preservation. Concurrently, nutrient depletion in surface waters reduced primary paleoproductivity, as evidenced by diminished populations of siliceous radiolarians, diatoms, and Dicellograptus compared to the LM1-LM2 interval. Substantially increased terrigenous input from the Chuanzhong Paleo-uplift and Qianzhong Oldland diluted organic matter content within shales, resulting in reduced organic matter-hosted pores and diminished gas-bearing potential (Figure 17c).
During LM6 shale deposition, sea-level decline drove progressive oxygenation of bottom waters approaching oxic conditions. This interval exhibited reduced primary paleoproductivity (low Sibio and P/Al ratios) with paleontological assemblages comprising radiolarians, algae, and Monograptus [78]. Terrigenous input exceeded levels observed in LM3-LM4-LM5 shales, accompanied by localized bottom-current deposits. Organic preservation was compromised under these depositional regimes, resulting in lower gas content. Siltstone development coupled with low TOC created reservoir spaces dominated by inorganic pores, featuring underdeveloped porosity and reduced permeability relative to other intervals (Figure 17d).

6. Conclusions

The depositional environmental evolution of the Wufeng–Longmaxi Formation is characterized by a multi-stage coupling process exerting controls on shale reservoirs: During the Lower Member of the Wufeng Formation, suboxic–anoxic conditions in a strongly restricted basin, coupled with a warm and humid climate and limited terrigenous input, led to significant enhancement of paleoproductivity. Subsequently, the WF4 period experienced rapid sea-level fall triggered by the Hirnantian glaciation. In LM1 to LM2 intervals, large-scale marine transgression accompanied by ice-sheet melting established semi-restricted basin conditions, where anoxic bottom waters and flourishing siliceous organisms resulted in simultaneous peaks in both paleoproductivity and preservation efficiency. During this phase, synergistic interactions between silica-dominated brittle mineral frameworks and high organic matter preservation efficiency generated abundant interconnected organic pore networks, enhancing reservoir quality. The subsequent relative sea-level decline (from LM3 to LM6) intensified bottom water oxygenation and increased terrigenous detrital influx, thereby inducing a marked paleoproductivity decline. Enhanced terrigenous material flux from the Sichuan Basin Uplift and Qianzhong Paleo-Uplift promoted clay mineral enrichment, while oxidizing conditions inhibited organic matter preservation. These processes drove progressive deterioration in mineralogical composition (notably brittle-to-clay mineral shifts) and suppressed organic pore development, consequently leading to vertical degradation of reservoir porosity, permeability, and gas content. Collectively, these stage-specific mineralogical and pore-structure controls provide crucial predictive criteria for evaluating shale gas potential and heterogeneity within the formation.

Supplementary Materials

The following supporting information can be downloaded at: https://www.mdpi.com/article/10.3390/min15070677/s1, Table S1: Whole-rock XRD data from the Wufeng–Longmaxi Formations in wells N11, N15, and Y2 of the Changning area; Table S2: TOC and major element analytical data from the Wufeng–Longmaxi Formations in wells N11, N15, and Y2 of the Changning area; Table S3: Analytical data of trace and rare earth elements (REE) from the Wufeng–Longmaxi Formations in wells N11, N15, and Y2 of the Changning area.

Author Contributions

Conceptualization, C.L. (Chang Lu); Methodology, C.L. (Chongjie Liao) and G.W.; Software, C.L. (Chang Lu); Validation, L.C. and X.C.; Formal analysis, L.C.; Investigation, J.Z.; Resources, K.C. and J.Z.; Data curation, C.L. (Chang Lu) and K.C.; Writing—original draft, C.L. (Chongjie Liao); Writing—review & editing, L.C.; Visualization, C.L. (Chongjie Liao); Supervision, J.Z. and J.C.; Project administration, L.C.; Funding acquisition, L.C. All authors have read and agreed to the published version of the manuscript.

Funding

This study was supported by the National Natural Science Foundation of China (Grant NO. 41602147) and the Science and Technology Cooperation Project of the CNPC-SWPU Innovation Alliance (Grant No. 2020CX020000).

Data Availability Statement

The original contributions presented in this study are included in the article/supplementary material. Further inquiries can be directed to the corresponding author.

Acknowledgments

I sincerely thank Min Xiong and Shuaicai Wu for their invaluable support and contributions during the writing of this article.

Conflicts of Interest

Author Chang Lu was employed by the company CNOOC Co., Ltd. Shenzhen Branch. Authors Kelin Chen and Jian Zheng were employed by the company Sichuan Changning Gas Development Co., Ltd. Authors Xin Chen and Gaoxiang Wang were employed by the company PetroChina Southwest Oil and Gas Company. The remaining authors declare that the research was conducted in the absence of any commercial or financial relationships that could be construed as a potential conflict of interest.

References

  1. Zou, C.; Zhu, R.; Chen, Z.; Ogg, J.G.; Wu, S.; Dong, D.; Qiu, Z.; Wang, Y.; Wang, L.; Lin, S.; et al. Organic-matter-rich shales of China. Earth-Sci. Rev. 2019, 189, 51–78. [Google Scholar] [CrossRef]
  2. Nie, H.; Dang, W.; Zhang, K.; Su, H.; Ding, J.; Li, D.; Liu, X.; Li, P.; Yang, S.; Zhao, J.; et al. Two decades of shale gas research & development in China: Review and prospects. Nat. Gas Ind. 2024, 44, 20–52. [Google Scholar]
  3. Yong, R.; Yang, H.; Wu, W.; Yang, Y.; Huang, H. Controlling factors and potential of shale gas enrichment and high yield in the Permian Dalong Formation, Sichuan Basin, SW China. Pet. Explor. Dev. 2025, 52, 253–266. [Google Scholar] [CrossRef]
  4. Wang, T.; Tian, F.; Deng, Z.; Hu, H. Pore structure and fractal characteristics of Wufeng–Longmaxi formation shale in northern Yunnan–Guizhou, China. Front. Earth Sci. 2023, 10, 998958. [Google Scholar] [CrossRef]
  5. Chen, G.; Dong, D.; Wang, S.; Wang, L. A preliminary study on accumulation mechanism and enrichment pattern of shale gas. Nat. Gas Ind. 2009, 29, 17–21+134–135. [Google Scholar]
  6. Selley, R.C. Ancient Sedimentary Environments; Chapman and Hall, Ltd.: London, UK, 1970. [Google Scholar]
  7. Kennedy, M.; Droser, M.; Mayer, L.M.; Pevear, D.; Mrofka, D. Late Precambrian Oxygenation; Inception of the Clay Mineral Factory. Science 2006, 311, 1446–1449. [Google Scholar] [CrossRef] [PubMed]
  8. Pichevin, L.; Bertrand, P.; Boussafir, M.; Disnar, J. Organic matter accumulation and preservation controls in a deep sea modern environment: An example from Namibian slope sediments. Org. Geochem. 2004, 35, 543–559. [Google Scholar] [CrossRef]
  9. Tang, L.; Song, Y.; Jiang, S.; Jiang, Z.; Li, Z.; Yang, Y.; Li, X.; Xiao, L. Organic matter accumulation of the Wufeng-Longmaxi shales in southern Sichuan Basin: Evidence and insight from volcanism. Mar. Pet. Geol. 2020, 120, 104564. [Google Scholar] [CrossRef]
  10. Cichon-Pupienis, A.; Littke, R.; Lazauskiene, J.; Baniasad, A.; Pupienis, D.; Radzevicius, S.; Siliauskas, L. Geochemical and sedimentary facies study—Implication for driving mechanisms of organic matter enrichment in the lower Silurian fine-grained mudstones in the Baltic Basin (W Lithuania). Int. J. Coal. Geol. 2021, 244, 103815. [Google Scholar] [CrossRef]
  11. Peng, Y.; Guo, S. Lithofacies analysis and paleosedimentary evolution of Taiyuan Formation in Southern North China Basin. Geoenergy Sci. Eng. 2023, 220, 111127. [Google Scholar] [CrossRef]
  12. Arthur, M.A.; Dean, W.E.; Laarkamp, K. Organic carbon accumulation and preservation in surface sediments on the Peru margin. Chem. Geol. 1998, 152, 273–286. [Google Scholar] [CrossRef]
  13. Basilone, L.; Perri, F.; Sulli, A.; Critelli, S. Paleoclimate and extensional tectonics of short-lived lacustrine environments. Lower Cretaceous of the Panormide Southern Tethyan carbonate platform (NW Sicily). Mar. Pet. Geol. 2017, 88, 428–439. [Google Scholar] [CrossRef]
  14. Mort, H.; Jacquat, O.; Adatte, T.; Steinmann, P.; Föllmi, K.; Matera, V.; Berner, Z.; Stüben, D. The Cenomanian/Turonian anoxic event at the Bonarelli Level in Italy and Spain: Enhanced productivity and/or better preservation? Cretac. Res. 2007, 28, 597–612. [Google Scholar] [CrossRef]
  15. Wei, H.; Chen, D.; Wang, J.; Yu, H.; Tucker, M.E. Organic accumulation in the lower Chihsia Formation (Middle Permian) of South China: Constraints from pyrite morphology and multiple geochemical proxies. Palaeogeogr. Palaeoclimatol. Palaeoecol. 2012, 353–355, 73–86. [Google Scholar] [CrossRef]
  16. Demaison, G.J.; Moore, G.T. Anoxic environments and oil source bed genesis. Org. Geochem. 1980, 2, 9–31. [Google Scholar] [CrossRef]
  17. Fang, X.; Zhang, Q.; Wu, L.; Geng, A.; Liu, S.; Wang, P.; Liang, X. Origin and preservation mechanisms of organic matter in carbonate concretions from Lower Cambrian black shales in South China. Org. Geochem. 2024, 197, 104876. [Google Scholar] [CrossRef]
  18. Hatch, J.R.; Jacobson, S.R.; Witzke, B.J.; Risatti, J.B.; Anders, D.E.; Watney, W.L.; Newell, K.D.; Vuletich, A.K. Possible Late Middle Ordovician Organic Carbon Isotope Excursion: Evidence from Ordovician Oils and Hydrocarbon Source Rocks, Mid-Continent and East-Central United States1. AAPG Bull. 1987, 71, 1342–1354. [Google Scholar]
  19. Sequero, C.; Aurell, M.; Bádenas, B. Sedimentary evolution of a shallow carbonate ramp (Kimmeridgian, NE Spain): Unravelling controlling factors for facies heterogeneities at reservoir scale. Mar. Pet. Geol. 2019, 109, 145–174. [Google Scholar] [CrossRef]
  20. Hussain, A.; Haughton, P.D.W.; Shannon, P.M.; Morris, E.A.; Pierce, C.S.; Omma, J.E. Mud-forced turbulence dampening facilitates rapid burial and enhanced preservation of terrestrial organic matter in deep-sea environments. Mar. Pet. Geol. 2021, 130, 105101. [Google Scholar] [CrossRef]
  21. Song, Y.; Li, S.; Hu, S. Warm-humid paleoclimate control of salinized lacustrine organic-rich shale deposition in the Oligocene Hetaoyuan Formation of the Biyang Depression, East China. Int. J. Coal Geol. 2019, 202, 69–84. [Google Scholar] [CrossRef]
  22. Basilone, L.; Bernardini, S.; Grassa, F.; Sulli, A.; Nieto, L.M.; Abbassi, A.; Jovane, L. Paleo-redox conditions during the demise of a carbonate platform in the Tethyan ocean: Evidence from phosphatized and metals (Mn and Fe) rich hardgrounds. Mar. Pet. Geol. 2024, 170, 107121. [Google Scholar] [CrossRef]
  23. Zhang, X.; He, J.; Ren, Z.; Zhou, T.; Shi, S.; Zhao, Y. Paleo-lake Water Stratification in the Chang 7 Age of the Triassic and its Significance for Shale Gas Accumulation in the Ordos Basin. J. Coast. Res. 2019, 93, 170. [Google Scholar] [CrossRef]
  24. Mao, X.; Chen, X.; Li, Z.; Li, S.; Li, S.; Zhu, Q. Shale Sedimentary Patterns and Organic Matter Enrichment Patterns of the Wufeng-Longmaxi Formation in the Sichuan Basin. Acta Sedimentol. Sin. 2025, 43, 701. [Google Scholar]
  25. Bohacs, K.M., Jr.; Grabowski, G.J.; Carroll, A.R.; Mankiewicz, P.J.; Miskell-Gerhardt, K.J.; Schwalbach, J.R.; Wegner, M.B.; Simo, J.A.T. Production, Destruction, and Dilution—The Many Paths to Source-Rock Development. In The Deposition of Organic-Carbon-Rich Sediments: Models, Mechanisms, and Consequences; Harris, N.B., Ed.; SEPM Society for Sedimentary Geology: Tulsa, OK, USA, 2005. [Google Scholar]
  26. Chen, L.; Chen, X.; Tan, X.; Zheng, J.; Yang, Y.; Jing, C.; Zhou, H.; Wang, G. Factors controlling organic matter accumulation in the Longmaxi Formation shale, Changning area, South Sichuan Basin. Geomech. Geophys. Geo-Energy Geo-Resour. 2023, 9, 89. [Google Scholar] [CrossRef]
  27. Lu, R.; He, D.; Liu, J.Z.; Tao, W.; Huang, H.; Xu, F.; Liu, G. Seismogenic Faults of the Changning Earthquake Sequence Constrained by High-Resolution Seismic Profiles in the Southwestern Sichuan Basin, China. Seismol. Res. Lett. 2021, 92, 3757–3766. [Google Scholar] [CrossRef]
  28. Wang, Y.; Xu, S.; Hao, F.; Lu, Y.; Shu, Z.; Yan, D.; Lu, Y. Geochemical and petrographic characteristics of Wufeng-Longmaxi shales, Jiaoshiba area, southwest China: Implications for organic matter differential accumulation. Mar. Pet. Geol. 2019, 102, 138–154. [Google Scholar] [CrossRef]
  29. Chen, X.; Rong, J.; Fan, J.; Zhan, R.; Mitchell, C.; Harper, D.; Melchin, M.; Ping’An, P.; Finney, S.; Wang, X. The Global Boundary Stratotype Section and Point (GSSP) for the base of the Hirnantian Stage (the uppermost of the Ordovician System). Episodes 2006, 29, 183–195. [Google Scholar] [CrossRef]
  30. Chen, X.; Fan, J.; Zhang, Y.; Wang, H.; Chen, Q.; Wang, W.; Liang, F.; Guo, W.; Zhao, Q.; Nie, H.; et al. Subdivision and Delineation of the Wufeng and Lungmachi Black Shales In The Subsurface Areas of The Yangtze Platform. J. Stratigr. 2015, 39, 351–358. [Google Scholar]
  31. Tribovillard, N.; Algeo, T.J.; Lyons, T.; Riboulleau, A. Trace metals as paleoredox and paleoproductivity proxies: An update. Chem. Geol. 2006, 232, 12–32. [Google Scholar] [CrossRef]
  32. Tribovillard, N.; Riboulleau, A.; Lyons, T.; Baudin, F. Enhanced trapping of molybdenum by sulfurized marine organic matter of marine origin in Mesozoic limestones and shales. Chem. Geol. 2004, 213, 385–401. [Google Scholar] [CrossRef]
  33. Van der Weijden, C.H. Pitfalls of normalization of marine geochemical data using a common divisor. Mar. Geol. 2002, 184, 167–187. [Google Scholar] [CrossRef]
  34. Calvert, S.E.; Pedersen, T.F. Geochemistry of Recent oxic and anoxic marine sediments: Implications for the geological record. Mar. Geol. 1993, 113, 67–88. [Google Scholar] [CrossRef]
  35. Taylor, S.R.; McLennan, S.M. The Continental Crust: Its Composition and Evolution; Blackwell Scientific Pub.: Palo Alto, CA, USA, 1985. [Google Scholar]
  36. Algeo, T.J.; Lyons, T.W. Mo-total organic carbon covariation in modern anoxic marine environments; implications for analysis of paleoredox and paleohydrographic conditions. Paleoceanography 2006, 21. [Google Scholar] [CrossRef]
  37. Fedo, C.M.; Young, G.M.; Nesbitt, H.W.; Hanchar, J.M. Potassic and sodic metasomatism in the Southern Province of the Canadian Shield: Evidence from the Paleoproterozoic Serpent Formation, Huronian Supergroup, Canada. Precambrian Res. 1997, 84, 17–36. [Google Scholar] [CrossRef]
  38. Fedo, C.M.; Wayne Nesbitt, H.; Young, G.M. Unraveling the effects of potassium metasomatism in sedimentary rocks and paleosols, with implications for paleoweathering conditions and provenance. Geology 1995, 23, 921–924. [Google Scholar] [CrossRef]
  39. Murray, R.W.; Leinen, M. Scavenged excess aluminum and its relationship to bulk titanium in biogenic sediment from the central equatorial Pacific Ocean. Geochim. Cosmochim. Acta 1996, 60, 3869–3878. [Google Scholar] [CrossRef]
  40. Pi, D.; Liu, C.; Shields-Zhou, G.A.; Jiang, S. Trace and rare earth element geochemistry of black shale and kerogen in the early Cambrian Niutitang Formation in Guizhou province, South China: Constraints for redox environments and origin of metal enrichments. Precambrian Res. 2013, 225, 218–229. [Google Scholar] [CrossRef]
  41. Hatch, J.R.; Leventhal, J.S. Relationship between inferred redox potential of the depositional environment and geochemistry of the Upper Pennsylvanian (Missourian) Stark Shale Member of the Dennis Limestone, Wabaunsee County, Kansas, U.S.A. Chem. Geol. 1992, 99, 65–82. [Google Scholar] [CrossRef]
  42. Jones, B.; Manning, D.A.C. Comparison of geochemical indices used for the interpretation of palaeoredox conditions in ancient mudstones. Chem. Geol. 1994, 111, 111–129. [Google Scholar] [CrossRef]
  43. Wignall, P.B.; Twitchett, R.J. Oceanic Anoxia and the End Permian Mass Extinction. Science 1996, 272, 1155–1158. [Google Scholar] [CrossRef]
  44. Lewan, M.D.; Maynard, J.B. Factors controlling enrichment of vanadium and nickel in the bitumen of organic sedimentary rocks. Geochim. Cosmochim. Acta 1982, 46, 2547–2560. [Google Scholar] [CrossRef]
  45. Liao, C.; Chen, L.; Gu, Z.; Liu, B.; Yang, L.; Tan, X.; Xiong, M.; Cao, J. Characteristics, genetic types and mechanisms of marine organic-rich shale reservoirs: A case study of the Wufeng-Longmaxi Formations in Changning area, southern Sichuan Basin. J. Palaeogeogr. (Chin. Ed.) 2025, 27, 714–730. [Google Scholar]
  46. Peng, L.; Liu, X.P.; Lin, C.; Liu, J.Y.; Yang, X.F.; Wang, H.; Li, H.P. Late Ordovician palaeogeomorphology and its sedimentary facies characteristics in central Tarim uplift. Oil Geophys. Prospect. 2009, 44, 767–772. [Google Scholar]
  47. Algeo, T.J.; Tribovillard, N. Environmental analysis of paleoceanographic systems based on molybdenum–uranium covariation. Chem. Geol. 2009, 268, 211–225. [Google Scholar] [CrossRef]
  48. Tribovillard, N.; Algeo, T.J.; Baudin, F.; Riboulleau, A. Analysis of marine environmental conditions based onmolybdenum–uranium covariation—Applications to Mesozoic paleoceanography. Chem. Geol. 2012, 324–325, 46–58. [Google Scholar] [CrossRef]
  49. Wang, H.; Shi, Z.; Sun, S.; Zhao, Q.; Zhou, T.; Cheng, F.; Bai, W. Microfacies types and distribution of epicontinental shale: A case study of the Wufeng-Longmaxi shale in southern Sichuan Basin, China. Pet. Explor. Dev. 2023, 50, 57–71. [Google Scholar] [CrossRef]
  50. Cai, Q.; Hu, M.; Kane, O.; Li, M.; Zhang, B.; Hu, Z.; Deng, Q.; Xing, N. Cyclic variations in paleoenvironment and organic matter accumulation of the Upper Ordovician-Lower Silurian black shale in the Middle Yangtze Region, South China: Implications for tectonic setting, paleoclimate, and sea-level change. Mar. Pet. Geol. 2022, 136, 105477. [Google Scholar] [CrossRef]
  51. Nesbitt, H.W.; Young, G.M. Early Proterozoic climates and plate motions inferred from major element chemistry of lutites. Nature 1982, 299, 715–717. [Google Scholar] [CrossRef]
  52. Guan, Q.Z.; Dong, D.Z.; Zhang, H.L.; Sun, S.S.; Zhang, S.R.; Guo, W. Types of biogenic quartz and its coupling storage mechanism in organic-rich shales: A case study of the Upper Ordovician Wufeng Formation to Lower Silurian Longmaxi Formation in the Sichuan Basin, SW China. Pet. Explor. Dev. 2021, 48, 813–823. [Google Scholar] [CrossRef]
  53. Lu, L.; Qin, J.; Shen, B.; Tenger; Liu, W.; Zhang, Q. The origin of biogenic silica in siliceous shale from Wufeng-Longmaxi Formation in the Middle and Upper Yangtze region and its relationship with shale gas enrichment. Earth Sci. Front. 2018, 25, 226–236. [Google Scholar]
  54. Lein, A.Y.; Kravchishina, M.D. Barium Geochemical Cycle in the Ocean. Lithol. Miner. Resour. 2021, 56, 293–308. [Google Scholar] [CrossRef]
  55. Zhao, M.; Mills, B.J.W.; Poulton, S.W.; Wan, B.; Xiao, K.; Guo, L.; Guo, Z. Drivers of the global phosphorus cycle over geological time. Nat. Rev. Earth Environ. 2024, 5, 873–889. [Google Scholar] [CrossRef]
  56. Pszonka, J.; Žecová, K.; Wendorff, M. Oligocene turbidite fans of the Dukla Basin: New age data from the calcareous nannofossils and paleoenvironmental conditions (Cergowa beds, Polish-Slovakian borderland). Geol. Carpath. 2019, 70, 311–324. [Google Scholar] [CrossRef]
  57. Ding, X.; He, W.; Liu, H.; Guo, X.; Zha, M.; Jiang, Z. Organic matter accumulation in lacustrine shale of the Permian Jimsar Sag, Junggar Basin, NW China. Pet. Sci. 2023, 20, 1327–1346. [Google Scholar] [CrossRef]
  58. Hirajima, T.; Aiba, Y.; Farahat, M.; Okibe, N.; Sasaki, K.; Tsuruta, T.; Doi, K. Effect of microorganisms on flocculation of quartz. Int. J. Miner. Process. 2012, 102–103, 107–111. [Google Scholar] [CrossRef]
  59. Warren, J. Dolomite: Occurrence, evolution and economically important associations. Earth-Sci. Rev. 2000, 52, 1–81. [Google Scholar] [CrossRef]
  60. Bau, S.; Witschger, O.; Gensdarmes, F.; Thomas, D. Determining the count median diameter of nanoaerosols by simultaneously measuring their number and lung-deposited surface area concentrations. J. Nanoparticle Res. 2013, 15, 2104. [Google Scholar] [CrossRef]
  61. Shen, J.; Algeo, T.J.; Zhou, L.; Feng, Q.; Yu, J.; Ellwood, B. Volcanic perturbations of the marine environment in South China preceding the latest Permian mass extinction and their biotic effects. Geobiology 2012, 10, 82–103. [Google Scholar] [CrossRef]
  62. Shen, J.; Algeo, T.J.; Hu, Q.; Xu, G.; Zhou, L.; Feng, Q. Volcanism in South China during the Late Permian and its relationship to marine ecosystem and environmental changes. Glob. Planet Change 2013, 105, 121–134. [Google Scholar] [CrossRef]
  63. Liang, C.; Ji, S.; Cao, Y.; Liu, K.; Wu, J.; Hao, F. Characteristics, origins, and significance of pyrites in deep-water shales. Sci. China Earth Sci. 2024, 67, 313–342. [Google Scholar] [CrossRef]
  64. Sageman, B.B.; Murphy, A.E.; Werne, J.P.; Ver Straeten, C.A.; Hollander, D.J.; Lyons, T.W. A tale of shales: The relative roles of production, decomposition, and dilution in the accumulation of organic-rich strata, Middle–Upper Devonian, Appalachian basin. Chem. Geol. 2003, 195, 229–273. [Google Scholar] [CrossRef]
  65. Tyson, R.V. The “Productivity Versus Preservation” Controversy: Cause, Flaws, and Resolution. In The Deposition of Organic-Carbon-Rich Sediments: Models, Mechanisms, and Consequences; Harris, N.B., Ed.; SEPM Society for Sedimentary Geology: Tulsa, OK, USA, 2005; Volume 82. [Google Scholar]
  66. Curtis, M.E.; Cardott, B.J.; Sondergeld, C.H.; Rai, C.S. Development of organic porosity in the Woodford Shale with increasing thermal maturity. Int. J. Coal Geol. 2012, 103, 26–31. [Google Scholar] [CrossRef]
  67. Loucks, R.G.; Reed, R.M.; Ruppel, S.C.; Jarvie, D.M. Morphology, Genesis, and Distribution of Nanometer-Scale Pores in Siliceous Mudstones of the Mississippian Barnett Shale. J. Sediment. Res. 2009, 79, 848–861. [Google Scholar] [CrossRef]
  68. Li, Y.; Liu, H.; Zhang, L.; Lv, Z.; Li, Q.; Huang, Y. Lower limits of evaluation parameters for the lower Paleozoic Longmaxi shale gas in southern Sichuan Province. Sci. China Earth Sci. 2013, 43, 1088–1095. [Google Scholar] [CrossRef]
  69. Boyer, C.; Kieschnick, J.; Suarez-Rivera, R.; Lewis, R.E.; Waters, G. Producing gas from its source. Oilfield Rev. 2006, 18, 36–49. [Google Scholar]
  70. Zou, C.; Dong, D.; Yang, Y.; Wang, Y.; Huang, J.; Wang, S.; Fu, C. Conditions of shale gas accumulation and exploration practices in China. Nat. Gas Ind. 2011, 31, 26–39+125. [Google Scholar]
  71. Ross, D.J.K.; Marc Bustin, R. The importance of shale composition and pore structure upon gas storage potential of shale gas reservoirs. Mar. Pet. Geol. 2009, 26, 916–927. [Google Scholar] [CrossRef]
  72. Zhang, Q.; Liu, H.; Bai, W.; Lin, W. Shale gas content and its main controlling factors in Longmaxi shales in southeastern Chongqing. Nat. Gas Ind. 2013, 33, 35–39. [Google Scholar]
  73. Wang, Y.; Zhang, H.; Zhu, Y.; Chen, S.; Cao, Q.; Huang, M.; Yang, J.; Zhang, Y. Sedimentary environment and major controlling factors of organic matter-rich shale from the Wufeng-Longmaxi formation in eastern Sichuan Basin, China. Front. Earth Sci. 2024, 18, 649–670. [Google Scholar] [CrossRef]
  74. Chen, L.; Wang, G.; Yang, Y.; Jing, C.; Chen, M.; Tan, X. Geochemical Characteristics of Bentonite and Its Influence on Shale Reservoir Quality in Wufeng–Longmaxi Formation, South Sichuan Basin, China. Energy Fuel 2019, 33, 12366–12373. [Google Scholar] [CrossRef]
  75. Wu, L.; Lu, Y.; Jiang, S.; Liu, X.; He, G. Effects of volcanic activities in Ordovician Wufeng–Silurian Longmaxi period on organic-rich shale in the Upper Yangtze area, South China. Pet. Explor. Dev. 2018, 45, 862–872. [Google Scholar] [CrossRef]
  76. Liu, Y.; Wu, B.; Gong, Q.; Cao, H. Geochemical characteristics of the lower Silurian Longmaxi Formation on the Yangtze Platform, South China: Implications for depositional environment and accumulation of organic matters. J. Asian Earth Sci. 2019, 184, 104003. [Google Scholar] [CrossRef]
  77. Hu, R.; Tan, J.; Dick, J.; Wang, Y.; Li, G.; Liu, C. Depositional conditions of siliceous microfossil-rich shale during the Ordovician–Silurian transition of south China: Implication for organic matter enrichment. Mar. Pet. Geol. 2023, 154, 106307. [Google Scholar] [CrossRef]
  78. Wang, Y.; Li, X.; Dong, D.; Zhang, C.; Wang, S. Main factors controlling the sedimentation of high-quality shale in Wufeng-Longmaxi Fm, Upper Yangtze region. Nat. Gas Ind. 2017, 37, 9–20. [Google Scholar] [CrossRef]
Figure 1. (a) The Upper Yangtze platform’s position during the Rhuddanian-Aeronian period, Ref. [26]; (b) Map of China, the yellow part indicates the Upper Yangtze region; (c) Zoomed version of the map (rectangular section in Part a) showing the location of wells in the upper Yangtze region; (d) Comprehensive Stratigraphic Column of the Upper Ordovician–Lower Silurian Series in Well N11. Analysis of the gamma-ray log shows that the GR log exhibits its peak values during the LM1 interval, followed by a secondary peak in the LM3 interval. Subsequently, the GR readings gradually declined and remained relatively stable. SNL: Shiniulan formation, WF: Wufeng formation, BT: Baota formation, Hir.: Hirnantian.
Minerals 15 00677 g001
Figure 2. Integrated stratigraphic column of the Wufeng-Longmaxi Formations in Well N11, Changning Area, illustrating sedimentary environment evolution. The column combines lithology, gamma-ray (GR) log, and key geochemical proxies: Redox Environment (V/Cr, U/Th, V/(V + Ni)), Terrigenous Detrital Influx (Al, Ti, Zr), Paleoclimate (CIA), PaleoWater-Depth (Na2O, K2O, Na2O/K2O), and Paleoproductivity (P/Al, Babio, Sibio).
Minerals 15 00677 g002
Figure 3. Correlation Diagram of Al, Zr, and Ti Elemental Contents in Wufeng-Longmaxi Formation Shales, Changning Area. (a). Correlation diagram of Al content vs. Ti content in the Wufeng-Longmaxi shale of the Changning area; (b). Correlation diagram of Al content vs. Zr content in the Wufeng-Longmaxi shale of the Changning area; (c). Correlation diagram of Ti content vs. Zr content in the Wufeng-Longmaxi shale of the Changning area.
Minerals 15 00677 g003
Figure 4. Interwell Profile of Terrigenous Input Elemental Content Characteristics in the Wufeng-Longmaxi Formations from Wells Y2-N11-N15, Changning Area.
Minerals 15 00677 g004
Figure 5. Mo vs. TOC Relationship Diagram (a) and UEF-MoEF Covariation Model Diagram (b) of the Wufeng-Longmaxi Formations in Changning Area. (a) Mo/TOC ratios: Black Sea = 4.5, Framvaren Fjord = 9, Cariaco Basin = 25, Saanich Inlet = 45 (data from [36]); (b) Solid line indicates modern seawater Mo/U molar ratio (SW = 7.9), dashed lines represent 0.1 × SW, 0.3 × SW and 3 × SW ratios, with blue field denoting UEF-MoEF covariation patterns in normal open marine conditions and orange field showing trends influenced by metal particulate carriers (figure modified from [47,48]).
Minerals 15 00677 g005
Figure 6. A-CN-K Diagram of the Wufeng-Longmaxi Formation in the Changning Area. A represents Al2O3, CN denotes CaO* (corrected for non-silicate calcium) plus Na2O, and K corresponds to K2O. Ref. [38].
Minerals 15 00677 g006
Figure 7. Interwell Profile of Paleowater Depth Variation Characteristics in the Wufeng-Longmaxi Formations from Wells Y2-N11-N15, Changning Area.
Minerals 15 00677 g007
Figure 8. Interwell Profile of Paleoproductivity Indicator Characteristics in the Wufeng-Longmaxi Formations from Wells Y2-N11-N15, Changning Area.
Minerals 15 00677 g008
Figure 9. Pore System Typology in Shale Reservoirs of the Wufeng-Longmaxi Formations, Changning Area. (a). Elongated organic pores, Well N11, 2342.58 m, LM2; (b). Spongy organic pores, Well N11, 2327.76 m, LM4-LM5; (c). Circular and elliptical organic pores, Well N11, 2334.27 m, LM3; (d). Aligned organic pores, Well N11, 2334.27 m, LM3; (e). Framboidal pyrite intercrystalline organic pores, Well N15, 2510.51 m, LM2; (f). Microfractures infilled with pyrite and organic matter, Well N11, 2342.58 m, LM2; (g). Clay mineral interlayer pores, Well N11, 2347.39 m, LM1; (h). Clay mineral interlayer pores, Well N11, 2347.39 m, LM1; (i). Framboidal pyrite intercrystalline pores, Well N15, 2504.57 m, LM4-LM5; (j). Rhombic calcite intragranular dissolution pores, Well N15, 2510.51 m, LM2; (k). Calcite intragranular dissolution pores with grain-edge fractures, Well N15, 2510.51 m, LM2; (l). Dolomite intragranular dissolution pores, dissolution seams, and grain-edge fractures, Well N15, 2482.51 m, LM4-LM5; (m). Pyrite intragranular dissolution pores, Well N15, 2510.51 m, LM2; (n). Quartz intragranular dissolution pores with grain-edge fractures, Well Y2, 3515.75 m, LM1; (o). Mineral framework pores with feldspar intragranular dissolution seams, Well N11, 2334.27 m, LM3.
Minerals 15 00677 g009
Figure 10. Relationship Diagram of Pore Type Development Frequency and Sedimentary Environments in the Wufeng-Longmaxi Shales, Changning Area.
Minerals 15 00677 g010
Figure 11. Composite Stratigraphic Column of Depositional Environments and Reservoir Characteristics in the Wufeng-Longmaxi Formation, Changning Area.
Minerals 15 00677 g011
Figure 12. Correlations between TOC and V/Cr (left) and U/Th (right) in the Wufeng−Longmaxi Formations Shale, Changning Area.
Minerals 15 00677 g012
Figure 13. Correlations Between TOC and P/Al (Left) vs. Mobio (Right) in the Wufeng−Longmaxi Formation Shales, Changning Area.
Minerals 15 00677 g013
Figure 14. Correlation Plots of TOC with Ti (Left) and Al (Right) in the Wufeng−Longmaxi Shale, Changning Area.
Minerals 15 00677 g014
Figure 15. Box Plots of Porosity (Left) and Permeability (Right) in Different Strata of the Wufeng−Longmaxi Formation, Changning Area.
Minerals 15 00677 g015
Figure 16. Variations in Gas Content Across Stratigraphic Units of the Wufeng−Longmaxi Formation: A Histogram Analysis from the Changning Area.
Minerals 15 00677 g016
Figure 17. Evolutionary Model of Shale Depositional Environments for the Wufeng-Longmaxi Formations in the Changning Area.
Minerals 15 00677 g017
Table 1. One-way ANOVA results for stratigraphic differences in geochemical proxies.
ProxyF-Valuep-ValueEta-Squared (η²)
Redox
Enviroment
V/Cr9.62<0.0010.38
V/(V+Ni)5.18<0.0010.24
U/Th6.99<0.0010.31
Terrigenous
Detrital
Al (%)3.570.0060.21
Ti (%)3.210.0120.18
Zr (ppm)3.190.0110.18
PaleoclimateCIA5.62<0.0010.26
Paleo-Water-DepthNa2O/K2O8.48<0.0010.35
PaleoproductivityBabio6.48<0.0010.30
Sibio7.94<0.0010.41
P/Al3.870.0040.20
Mobio6.19<0.0010.28
Table 2. Summary Table of Major Redox Proxies for the Wufeng-Longmaxi Formation in the Changning Area.
SectionV/CrV/(V + Ni)U/Th
RangeMeanRangeMeanRangeMean
LM61.45~3.171.790.68~0.770.730.22~0.730.32
LM4–LM51.14~4.142.300.62~0.830.710.24~1.040.55
LM31.25~4.792.540.64~0.870.690.25~1.350.72
LM22.72~5.154.130.66~0.70.680.93~1.791.41
LM12.94~13.736.550.59~0.810.700.63~9.463.49
Wufeng1.41~9.004.010.54~0.790.660.2~2.260.97
Table 3. Statistical Table of Terrigenous Input Element Contents in Wufeng-Longmaxi Formation Shales, Changning Area.
SectionAl(%)Ti(%)Zr(ppm)
RangeMeanRangeMeanRangeMean
LM65.28~9.857.540.24~0.430.3692.60~328.00187.82
LM4-LM55.10~9.887.090.24~0.400.3268.40~305.00170.03
LM35.16~13.547.340.26~0.380.32101.00~292.00153.58
LM23.03~5.954.250.15~0.290.2156.30~128.0085.97
LM12.48~4.913.700.11~0.270.1952.60~122.0077.88
Wufeng1.24~9.935.360.07~0.720.2750.50~373.00141.17
Table 4. Chemical Weathering Indices of the Wufeng-Longmaxi Formation Shales in the Changning Area.
SectionChemical Index of Alteration (CIA)Paleoclimate Environment
Minimum ValueMean ValueMaximum Value
LM669.3771.7874.45Warm-humid environment
LM4-LM570.7872.7073.65
LM368.8971.9176.04
LM270.2471.0872.88
LM168.3169.7570.84
Wufeng64.670.7275.32
Table 5. Statistical Table of Na2O/K2O Ratios in Shales from the Wufeng and Longmaxi Formations, Changning Area.
SectionWell N11 Well N15Well Y2Changning Area
RangeMeanRangeMeanRangeMeanRangeMean
LM60.16~0.200.180.23~0.240.230.15~0.150.150.15~0.240.18
LM4–LM50.16~0.290.220.15~0.210.180.17~0.340.210.15~0.340.20
LM30.22~0.240.230.19~0.220.210.16~0.380.270.16~0.380.22
LM20.23~0.380.300.23~0.270.250.20~0.230.220.20~0.380.26
LM10.29~0.350.320.26~0.260.260.30~0.300.300.26~0.350.29
Wufeng0.15~0.390.250.15~0.210.180.09~0.620.370.09~0.430.24
Table 6. Statistical Table of Primary Paleoproductivity Proxies for the Wufeng-Longmaxi Shale in the Changning Area.
SectionBabio (ppm)Sibio (%)P/Al (×1000)Mobio (ppm)
RangeMeanRangeMeanRangeMeanRangeMean
LM690.0~2197.010480.0~12.70.74.1~11.15.92.6~30.17.2
LM4–LM561.0~7065.012950.0~13.31.54.6~12.46.38.6~41.420.9
LM3299.0~6894.013570.0~8.22.73.0~12.27.74.3~57.325.5
LM2286.0~2890.013289.9~23.015.47.1~13.29.226.2~70.352.7
LM1310.0~1971.011896.0~27.614.98.1~20.114.011.1~161.482.9
Wufeng252.0~4308.012632.5~23.57.43.8~26.214.611.9~77.735.8
Table 7. Depositional Environment-Mineral Composition Relationships of the Wufeng-Longmaxi Formation in the Changning Area.
SectionSedimentary EnvironmentMineralogical Composition Characteristics
Redox ConditionsTerrigenous Clastic InputBasinal Restricted EnvironmentPaleo-Marine ProductivityQuartz (%)Feldspa (%)Clay Minerals (%)Carbonate Minerals (%)Pyrite (%)
LM6Dysoxic-OxicAbundantSemi-restrictedSeverely suppressed42.339.6527.0519.121.87
LM3-LM5DysoxicModerateModerately depressed47.666.8926.3416.003.10
LM1-LM2AnoxicNegligibleExceptionally high61.453.9211.1820.423.03
WufengDysoxic-AnoxicLowHighly restrictedEnhanced34.055.9818.7739.321.89
Table 8. Univariate Linear Regression Results of Controls on TOC (Redox, Productivity, Terrigenous Input).
ProxyRegression Coefficient (β)F-Valuep-ValueCoefficient of Etermination (R²)
Redox (U/Th)0.74416.92<0.0010.186
Productivity (Mobio)0.03342.61<0.0010.368
Terrigenous (Al)−0.0589.480.0020.114
Disclaimer/Publisher’s Note: The statements, opinions and data contained in all publications are solely those of the individual author(s) and contributor(s) and not of MDPI and/or the editor(s). MDPI and/or the editor(s) disclaim responsibility for any injury to people or property resulting from any ideas, methods, instructions or products referred to in the content.

