Article

Enrichment Regularity of Indium in the Dulong Mineral Processing Plant, Yunnan Province, China

1
School of Land Resource Engineering, Kunming University of Science and Technology, Kunming 650093, China
2
National Engineering and Technology Research Center for Development & Utilization of Phosphate Resources, Kunming 650500, China
3
Yunnan Hualian Zinc and Indium Co., Ltd., Wenshan 663701, China
*
Author to whom correspondence should be addressed.
Minerals 2025, 15(7), 672; https://doi.org/10.3390/min15070672
Submission received: 9 April 2025 / Revised: 18 June 2025 / Accepted: 19 June 2025 / Published: 23 June 2025
(This article belongs to the Section Mineral Processing and Extractive Metallurgy)

Abstract

The Dulong deposit in Wenshan, southeastern Yunnan Province, is rich in zinc, tin, and copper resources, accompanied by rare metals such as indium and silver. It is a particularly important indium production base, with reserves of approximately 7000 tons, ranking first globally. Enrichment and recovery of indium-bearing minerals are mainly achieved through mineral processing technology. However, the recovery rate of indium in the Dulong concentrator remains relatively low, and there is an insufficient understanding of its occurrence state and distribution characteristics, resulting in marked indium resource wastage. Here, we conducted a systematic process mineralogy study on indium-bearing polymetallic ore in the Dulong concentrator. The average grade of indium in the ore is 43.87 g/t, mainly occurring in marmatite (63.63%), supplemented by that in silicate minerals (23.31%), chalcopyrite (7.84%), and pyrrhotite (4.22%). The indium has a relatively dispersed distribution, which is inconducive to enrichment and recovery. The substitution mechanism of indium in marmatite was investigated using laser ablation inductively coupled plasma mass spectrometry. This revealed a positive correlation between indium and copper, allowing us to revise the substitution relationship to: Zn x S + Cu + + In 3 + Zn x 2 CuInS + 2 Zn 2 + or Zn x 1 FeS + Cu + + In 3 + Zn x 2 CuInS + Zn 2 + + Fe 2 + . Electron probe microanalysis revealed the presence of roquesite (CuInS2), an independent indium mineral not previously reported from this deposit. Our detailed investigation of the Dulong concentrator mineral processing technology showed that the recovery rate of indium from marmatite is currently poor, at only 48.01%. To improve the comprehensive utilization rate of indium resources, it will be necessary to further increase the recovery rate from marmatite and explore the flotation recovery of indium from chalcopyrite and pyrrhotite.

1. Introduction

Indium has good ductility and plasticity, a low melting point, high boiling point, low resistance, and good corrosion resistance [1,2]. It is extensively used in electronics, semiconductor, and aerospace industries, thereby playing a critical role in national security and economic development [3,4]. The rapid expansion of information technology and new energy industries has driven substantial growth in global indium consumption [5]. Consequently, the price of indium metal (≥99.9% purity) has risen from 200 to 400 US$/kg, and it is expected that the global supply of primary indium will reach 4000–7700 t/year by 2050 [6]. Faced with escalating demand, nations are increasingly prioritizing indium resource production and recycling strategies.
The average content of indium in Earth’s crust is 0.056 ppm [7], with a relatively dispersed distribution; no rich ore bodies have been identified to date. Such a rare and scattered status quo poses a great challenge to the beneficiation and recovery of indium resources. To date, a total of 19 indium-bearing mineral species have been identified globally, of which five have been reported from China; the most notable representatives are roquesite (CuInS2), indite (FeInS4), sakuraiite ((Cu, Zn, Fe)3(In, Sn)S4), and dzhalindite [In (OH)3] [8]. Indium occurs most commonly as a trace element in sphalerite (indium content of 0.0001%–0.1%), associated with Cu, Fe, and Sn sulfides [9,10]. Indium is primarily obtained through two routes. (1) Extraction from ores via flotation enrichment of indium-containing minerals such as sphalerite and chalcopyrite; for example, enrichment can be achieved by using xanthate or ethonium as the collector and X-1 as the activator [11]. (2) Recovery from secondary sources such as discarded liquid crystal display panels and indium tin oxide industrial waste [3,12].
Indium-rich countries include China, Peru, the United States, Canada, and Russia, which collectively account for 80.6% of global indium reserves. Notably, China holds the largest indium reserves (72.7% of the global total) and has served as the primary producer and consumer of indium, contributing 46% of global primary indium production between 2000 and 2018 [13,14]. Indium resources in China are mainly concentrated in Yunnan, Guangxi, Inner Mongolia, and Hunan (Table 1). Indium reserves in the Dulong deposit amount to approximately 7000 tons, making it the most important indium production base in China. The mineral genesis, enrichment characteristics, and substitution mechanism of indium in this region have been research hotspots for some time. Previous studies have shown that the Dulong deposit extends approximately north–south, with an approximate area of 10 km2 (Figure 1). From north to south, it comprises the Tongjie, Manjiazhai, Lazizhai, Jinshipo, and other minor ore segments. The deposits are cassiterite sulfide ores with relatively high mineralization temperatures; indium has a very high correlation with copper, tin, iron, and cadmium [15,16,17]. All ore bodies are hosted by Cambrian marble and quartz mica schist, and are controlled by N–S-trending faults. The Laojunshan granite, predominantly comprising two-mica monzogranite, is mainly exposed in the northern part of the ore field.
Table 1. Types, distribution, and reserves of typical large-scale indium-bearing ores in China.
MineVein TypeCarrier MineralsGrade/ppmReserves/tReferences
Inner Mongolia, dajingtin-polymetallic veinscopper and zinc sulfides and sulfosalts0.5–296768[18,19]
Inner Mongolia, Meng’entaolegaiquartz-sulfide veinssphalerite9–295>500[20]
Guangxi dachangVolcanic polymetallic massive sulfidesMarmatite0.2–673>5000[21]
Yunnan dulongSn-Zn polymetallic oreMarmatite and chalcopyrite0.74–45727000[8]
Yunnan gejiuZn-enriched sulfide oresSphalerite and chalcopyrite198.3–1570>4000[15]
Hunan qibaoshanquartz-sulfide ores (a Sn-Poor Skarn Deposit)sphalerite-pyrite ores28.9–203585[22]
Hunan yejiweiskarn-type Cu–Sn oressphalerite, chalcopyrite, and stannite2.3–214>806[23]
Fujian zhongjiapolymetallic sulfide-magnetite oresphalerite, Galena and Magnetite22–1346569[24]
Figure 1. (a) Geological map of the Dulong polymetallic deposit. (b) Geological cross-section along exploration line 125 (quoted from [25]).
Minerals 15 00672 g001
However, most previous studies have been concentrated in professional fields such as geology and mineralogy [26,27,28]. There are very few studies in the field of mineral processing related to the enrichment and recovery of indium resources; this has resulted in insufficient understanding of the textural characteristics and substitution mechanism of indium in various minerals and its enrichment characteristics during the beneficiation process, leading to low recovery rates and high losses of indium resources. Therefore, in this study, we clarified the embedding fineness, distribution patterns, and intergrowth of indium with the components of carrier minerals for indium-bearing polymetallic minerals of the Duolong concentrator. This was achieved using process mineralogy combined with laser ablation inductively coupled plasma mass spectrometry (LA–ICP–MS), plus high-resolution imagery and mineral phase identification via automatic software analysis. This provides a scientific basis for optimizing the beneficiation process of indium resources in complex minerals and fills a research gap related to indium carrier minerals in the field of mineral processing.

2. Materials and Methods

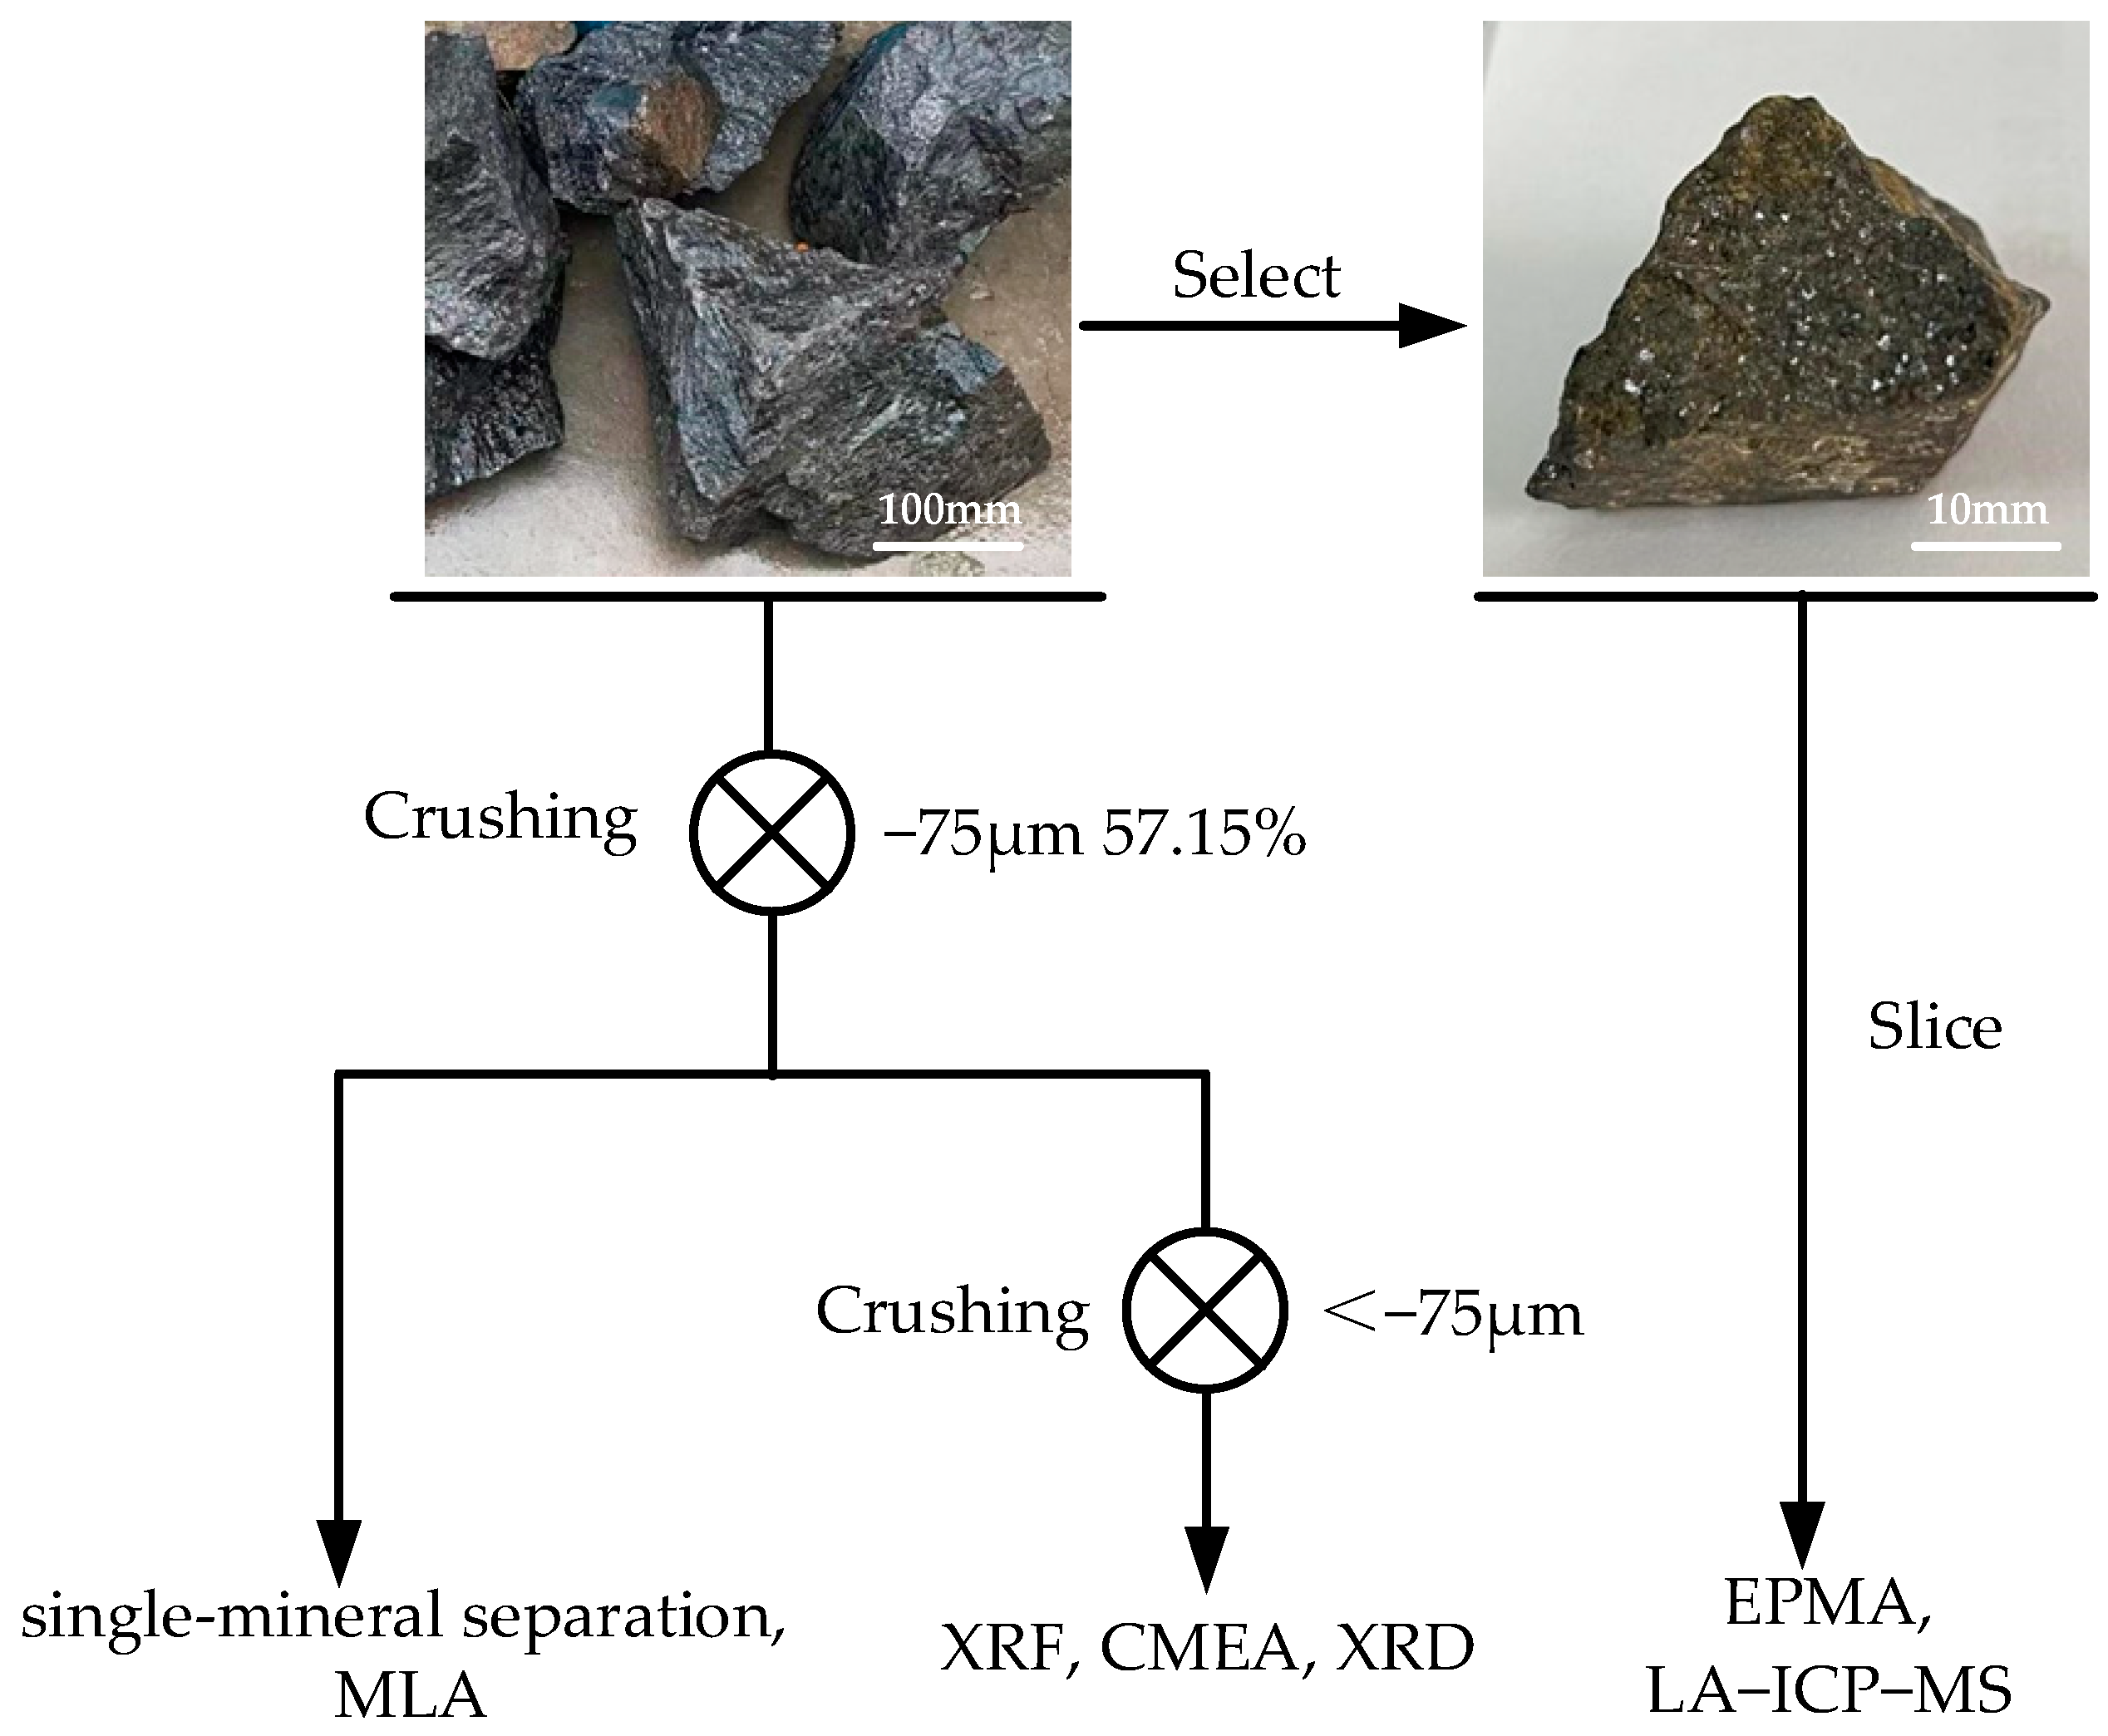
2.1. Sample Handling and Experimental Procedures

Ore samples were collected from the Manjiazhai ore segment of the Dulong deposit. Because the mine adopts a production method of mixed mining and mixed selection, the obtained ore samples were mixed raw ores mined from this ore segment. To ensure the representativity of the samples, 50 kg of ore samples was randomly selected from the stockpiling plant of the mine and crushed to −75 μm accounting for 57.15%, and then thoroughly mixed and sample compositing until the material became homogeneous. A 500 g portion of sample was split out and ground to −75 μm for X-ray fluorescence (XRF), chemical multi-elemental analysis (CMEA), and X-ray diffraction (XRD) analysis. A 2 kg portion of sample was used for single-mineral separation analysis, and 100 g of sample was used for mineral liberation analysis (MLA) and electron probe microanalysis (EPMA), the latter after being inlaid with resin. The sample preparation process is shown in Figure 2.
The preparation of single minerals, including marmatite, chalcopyrite, magnetite, pyrrhotite, arsenopyrite, and pyrite, was conducted through hand-picking, selective dissolution to remove impurities, and chemical analysis to ensure purity.
In the field of mineral processing technology, the three core indicators used to assess the processing efficiency and economic benefits of ores are grade, yield, and recovery. Hence, we carried out a statistical analysis of these mineral processing indicators for the Dulong mineral processing plant over a period of six months. Based on process mineralogy, the distribution pattern of indium in various mineral processing products can be clearly delineated.

2.2. Analytical Methods

2.2.1. Chemical Multi-Element Analysis

Chemical analyses of the bulk sample and all size fractions were performed via XRF and inductively coupled plasma optical emission spectroscopy (ICP–OES), with XRF performed using the fused glass slice method (AxiosMAX; Panalytical, Almelo, The Netherlands). Major and trace element concentrations were determined via ICP–OES using a Thermo Scientific iCAP 7000 Series instrument from Massachusetts, USA. Prior to analysis, 0.1 g of finely ground sample material was accurately weighed and subjected to acid digestion using a mixture of HNO3, HF, and HClO4 in a closed Teflon vessel. The digested solution was then diluted with ultrapure water to a fixed volume.

2.2.2. Mineral Characterization

Mineral liberation analysis was performed via scanning electron microscopy combined with energy-dispersive X-ray spectroscopy (SEM–EDS; Quanta 650 and MLA650 instruments from Oregon, Hillsboro, OR, USA), X-ray microanalysis (EDAX Apollo X from Mahwah, NJ, USA), and automated process mineralogy testing software (JKTech Pty Ltd, Indooroopilly, QLD, Australia). Backscattered electron (BSE) imaging, standard X-ray spectroscopy, XRD, surface scanning X-ray spectroscopy, and mineralogical composition analysis were used in combination with image analysis techniques for data computation and processing to obtain mineralogical parameters including composition, elemental valence and state of occurrence, dissociation, and embedding of the ore, and images of typical mineral particles [29]. Working conditions of MLA were an accelerating voltage of 25 kV, beam current of 40 μA, and beam diameter of 6.5 µm.

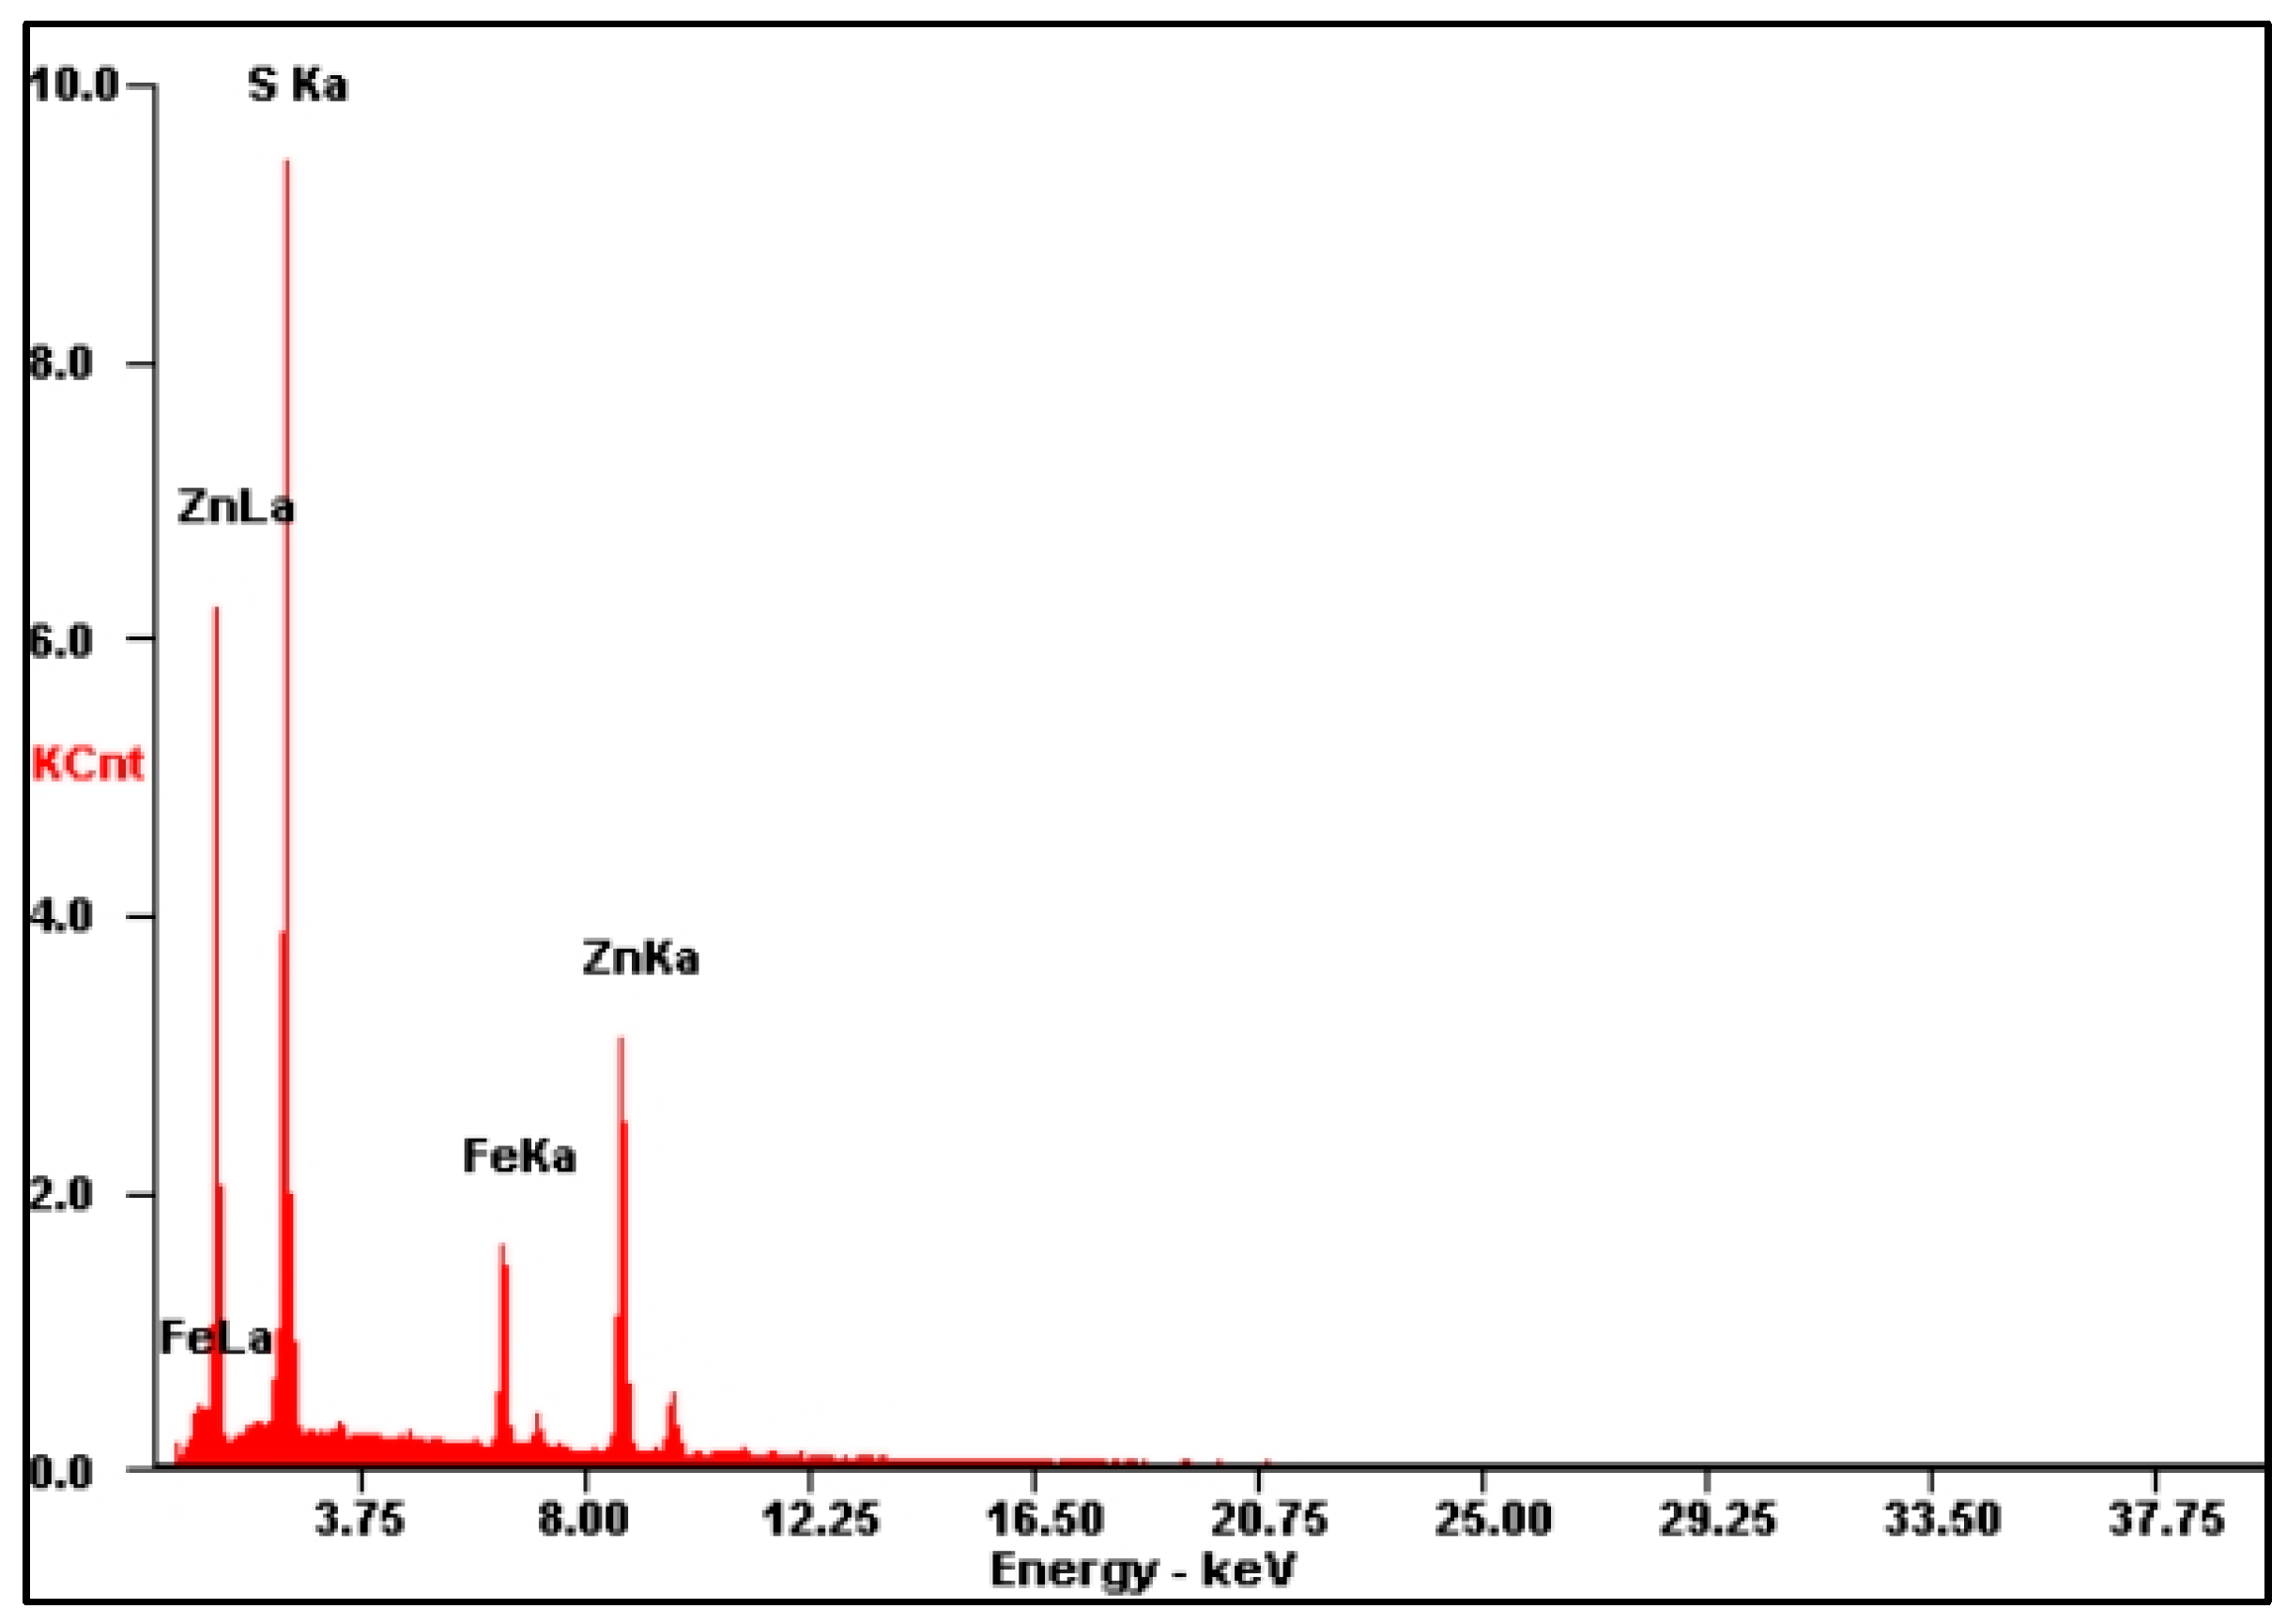
2.2.3. Electron Probe Microanalysis

High resolution X-ray elemental intensity mapping was conducted at the laboratory of Guangzhou Tuoyan Analytical Technology Co., Ltd., Guangzhou, China, using a JEOL JXA-iSP100 electron probe microanalyzer equipped with five wavelength-dispersive spectrometers. The operating conditions for X-ray mapping were an accelerating voltage of 15 kV, beam current of 100 nA, step size of 1 μm, and dwell time of 30 ms. A total of five EPMA mapping analyses were carried out for marmatite.

2.2.4. Laser Ablation Inductively Coupled Plasma Mass Spectrometry

Trace elements within marmatite were determined using an NWR 193 nm ArF Excimer laser ablation system coupled to an iCAP RQ (ICP–MS) at the Guangzhou Tuoyan Analytical Technology Co., Ltd., China. The ICP–MS was tuned using NIST 610 standard glass sample to yield low oxide production rates. The carrier gas was fed into the cup at a rate of 0.7 L/min, and the aerosol was subsequently mixed with 0.89 L/min Ar gas. The laser fluence was 3.5 J/cm2, with a repetition rate of 6 Hz, spot size of 30 μm, and analysis time of 45 s, followed by a 40 s background measurement. Trace element compositions were calibrated against various reference materials (NIST 610 and MASS-1) without using an internal standard [30]. Sulfide pellet standards SRM 612 and BCR-2Ga were used as unknown samples to evaluate data quality [31]. Raw data were reduced using the 3D trace element data reduction scheme [32] within the IOLITE V4 software package. In IOLITE, user-defined time intervals were established for the baseline correction procedure to calculate session-wide baseline-corrected values for each element. A total of 27 LA–ICP–MS spot analyses and five mapping analyses were carried out for marmatite.

3. Results and Discussion

3.1. Elemental and Mineralogical Analysis

3.1.1. Ore Major Element Composition

Semi-quantitative elemental analysis of the ore was carried out via XRF, with the results shown in Table 2. The main elements comprising the ore were Fe, Si, Ca, Mg, Al, Zn, and S, with small amounts of K, F, As, Mn, Cu, Sn, and Ti.
Chemical multi-element analysis of the ore was based on the semi-quantitative XRF results (Table 3). The indium content of the ore was 43.87 g/t, and the other main components were SiO2 (28.20%), Fe (17.97%), CaO (11.10%), Al2O3 (7.49%), MgO (7.26%), S (5.01%), Zn (2.83%), and K2O (1.36%), with small amounts of As, F, Mn, Cu, and Sn. According to Chinese national standard GB/T 25283-2010, the Zn and Sn contents in the ore met the minimum industrial grade for Zn and Sn deposits, and the Cu and In contents met the evaluation standard for associated components in the ore.

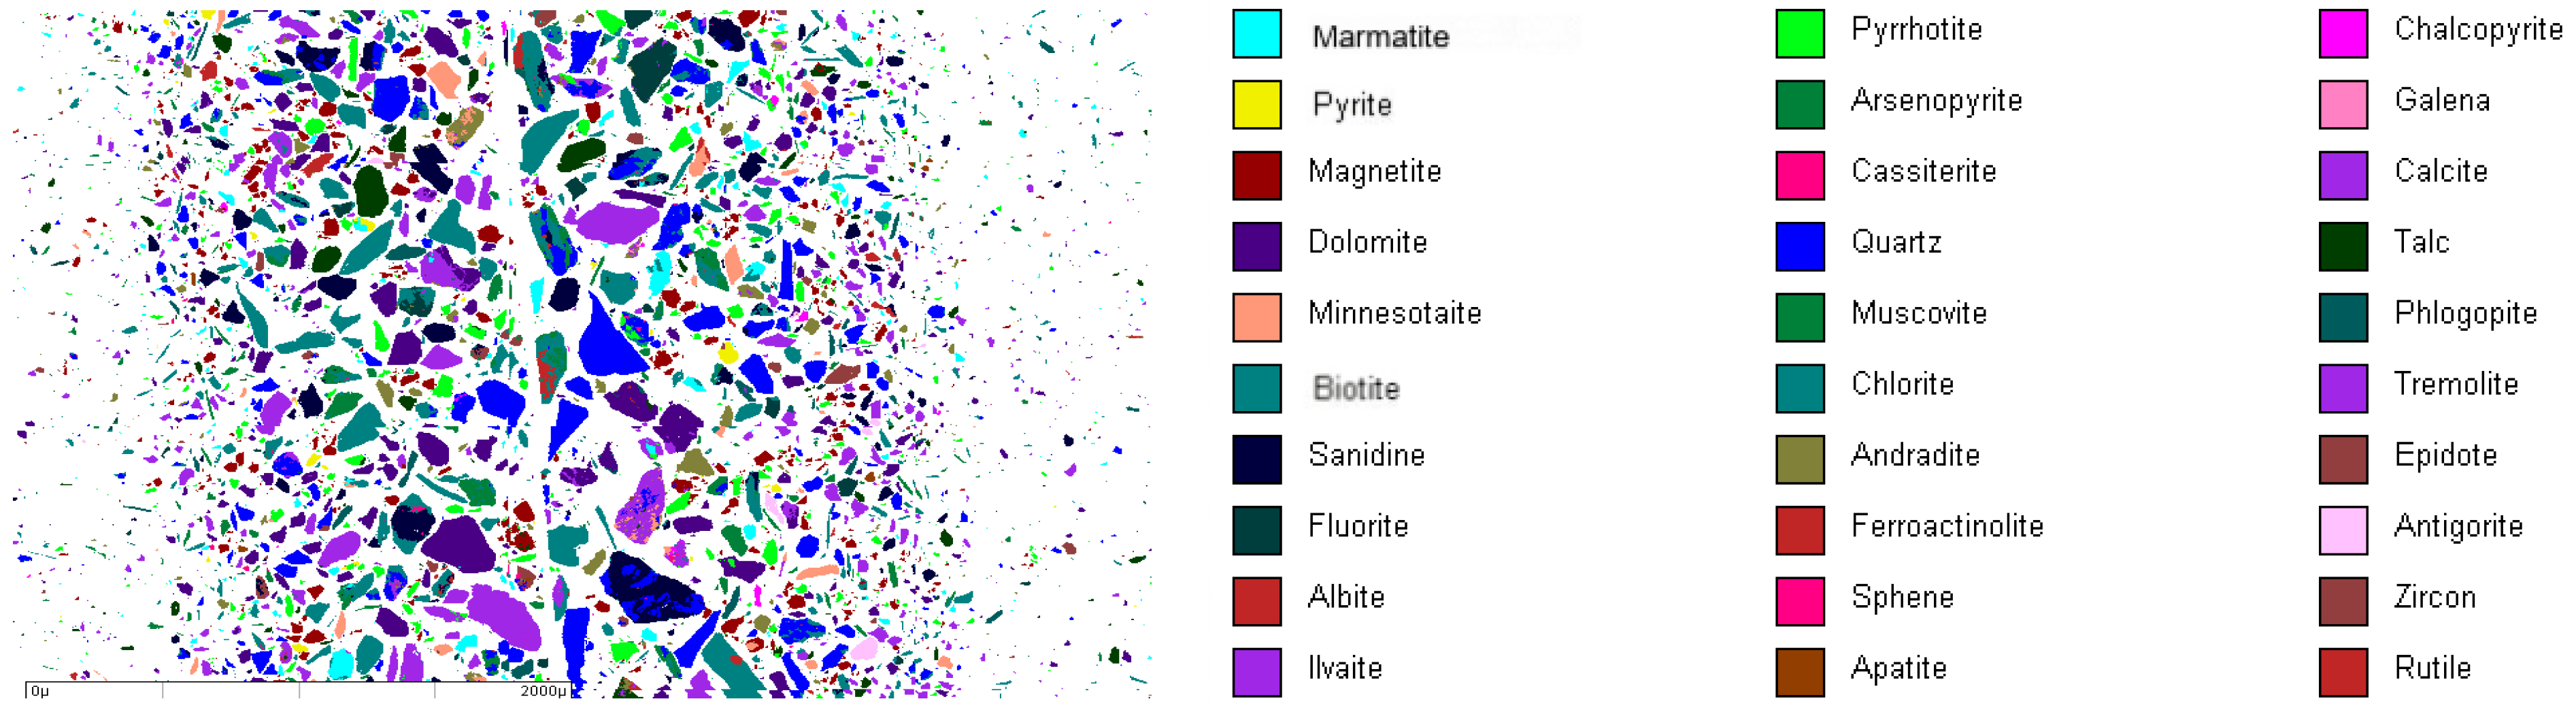
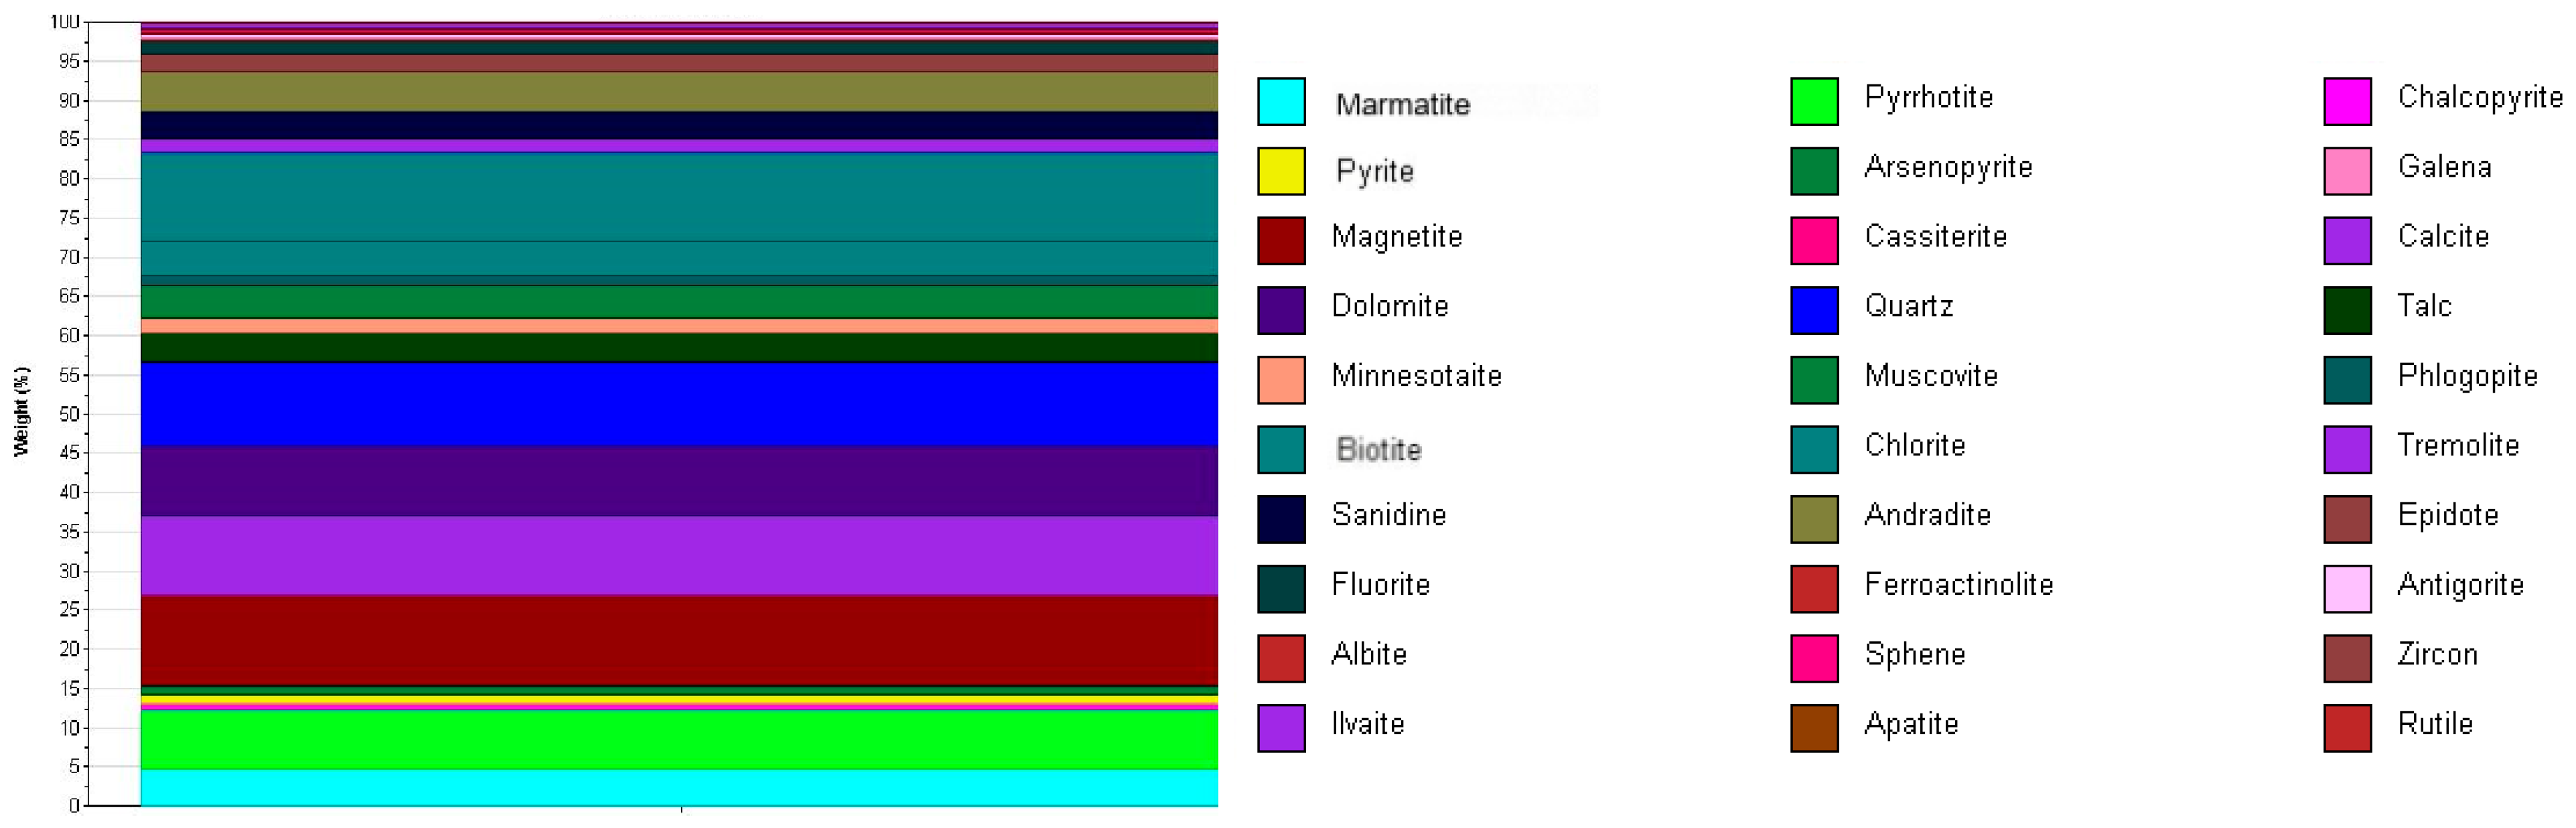
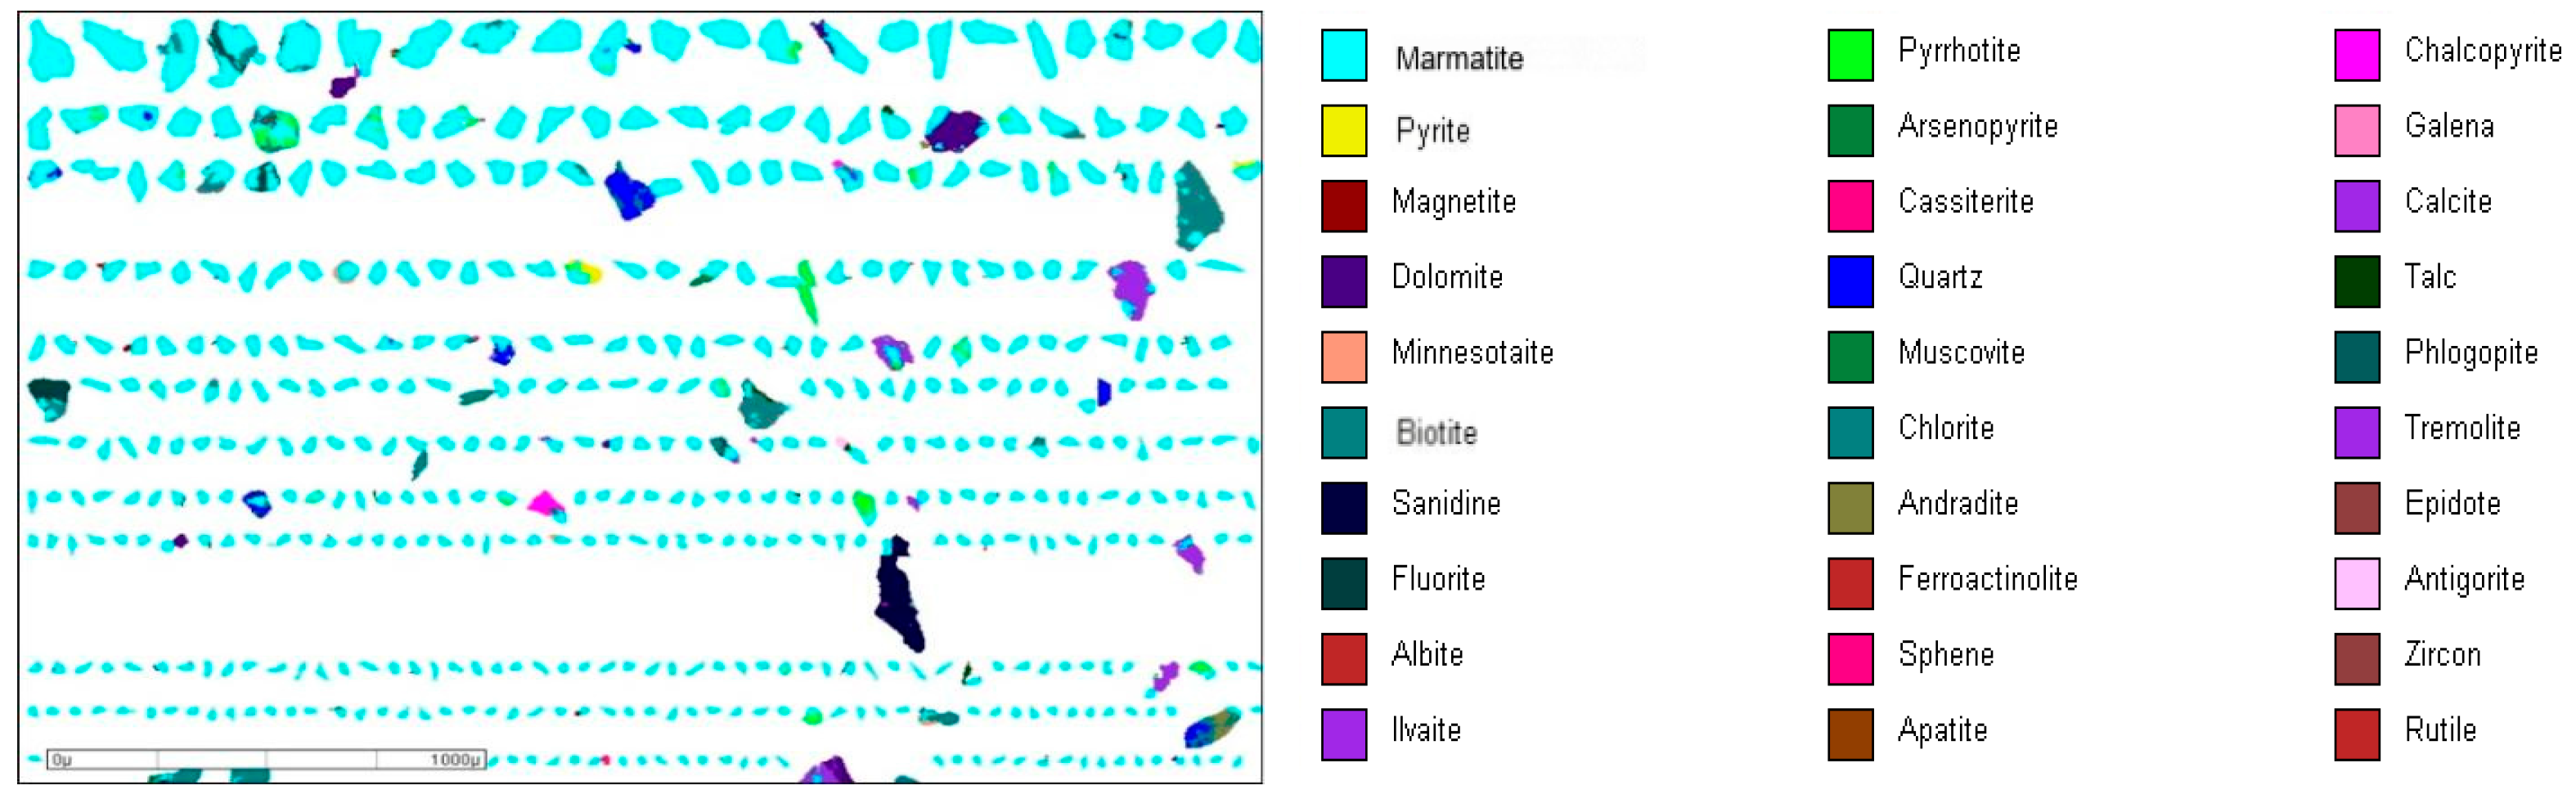
3.1.2. Ore Mineral Composition

Mineral particles were analyzed via MLA to determine the mineralogical composition of the ore, with the results shown in Table 4 and Figure 3 and Figure 4.
The ore consisted of 30 different minerals, with the principal metallic minerals being magnetite (11.01%), pyrrhotite (6.12%), and marmatite (5.14%). The ore also contained trace amounts of chalcopyrite (0.66%), pyrite (1.02%), and arsenopyrite (0.98%). The oxide minerals were predominantly calcite (11.02%), dolomite (9.07%), quartz (11.12%), chlorite (11.47%), talc (5.26%), and mica (10.37%).

3.1.3. Grain Size Distribution of Major Minerals

The grain size distributions of the main minerals in the ore were measured via MLA, using the raw ore sample as the source material. The results are shown in Table 5 and Table 6. The cumulative distribution in the raw ore was as follows: +300 μm particles, 1.33%; +150 μm particles, 17.08%; +75 μm particles, 42.85%; +38 μm particles, 68.23%; +19 μm particles, 86.72%; and +9.6 μm particles, 95.78%. The main metallic minerals were dominantly fine-grained, except for chalcopyrite (+75 μm cumulative distribution of 22.66%); the other metallic minerals were in the range of 16%–20%. The main oxide minerals were dominantly coarse-grained, except for calcite (+75 μm cumulative distribution of 47.08%); the other oxide minerals were in the range of 31%–41%. On this basis, it would be difficult to separate chalcopyrite, marmatite, pyrite, and other metallic minerals because their fine-grained nature is inconducive to flotation separation.

3.2. Content and Distribution of Indium in Carrier Minerals

The main indium-bearing single minerals are shown in Figure 5; these included marmatite, chalcopyrite, magnetite, pyrrhotite, arsenopyrite, pyrite, silicate minerals, carbonate minerals, quartz, and other gangue minerals [33]. Indium was enriched in marmatite (543 g/t) and chalcopyrite (521 g/t), with lower levels in pyrrhotite (86.33 g/t), arsenopyrite and pyrite (22.35 g/t), and silicate minerals (24.45g/t) (Table 7). Magnetite, carbonate minerals, quartz, and other gangue minerals did not contain indium.
The distribution of indium across the respective host minerals is shown in Table 8. Indium mainly occurred in marmatite (63.62%) supplemented by that in silicate minerals (23.31%), chalcopyrite (7.84%), pyrrhotite (4.22%), and arsenopyrite and pyrite (1.02%). The formula for distribution is
distribution = γ · β 100 · α × 100 %
where γ is the mineral content (%), β is the In grade of the mineral (g/t), and α is the In grade of the raw mineral.

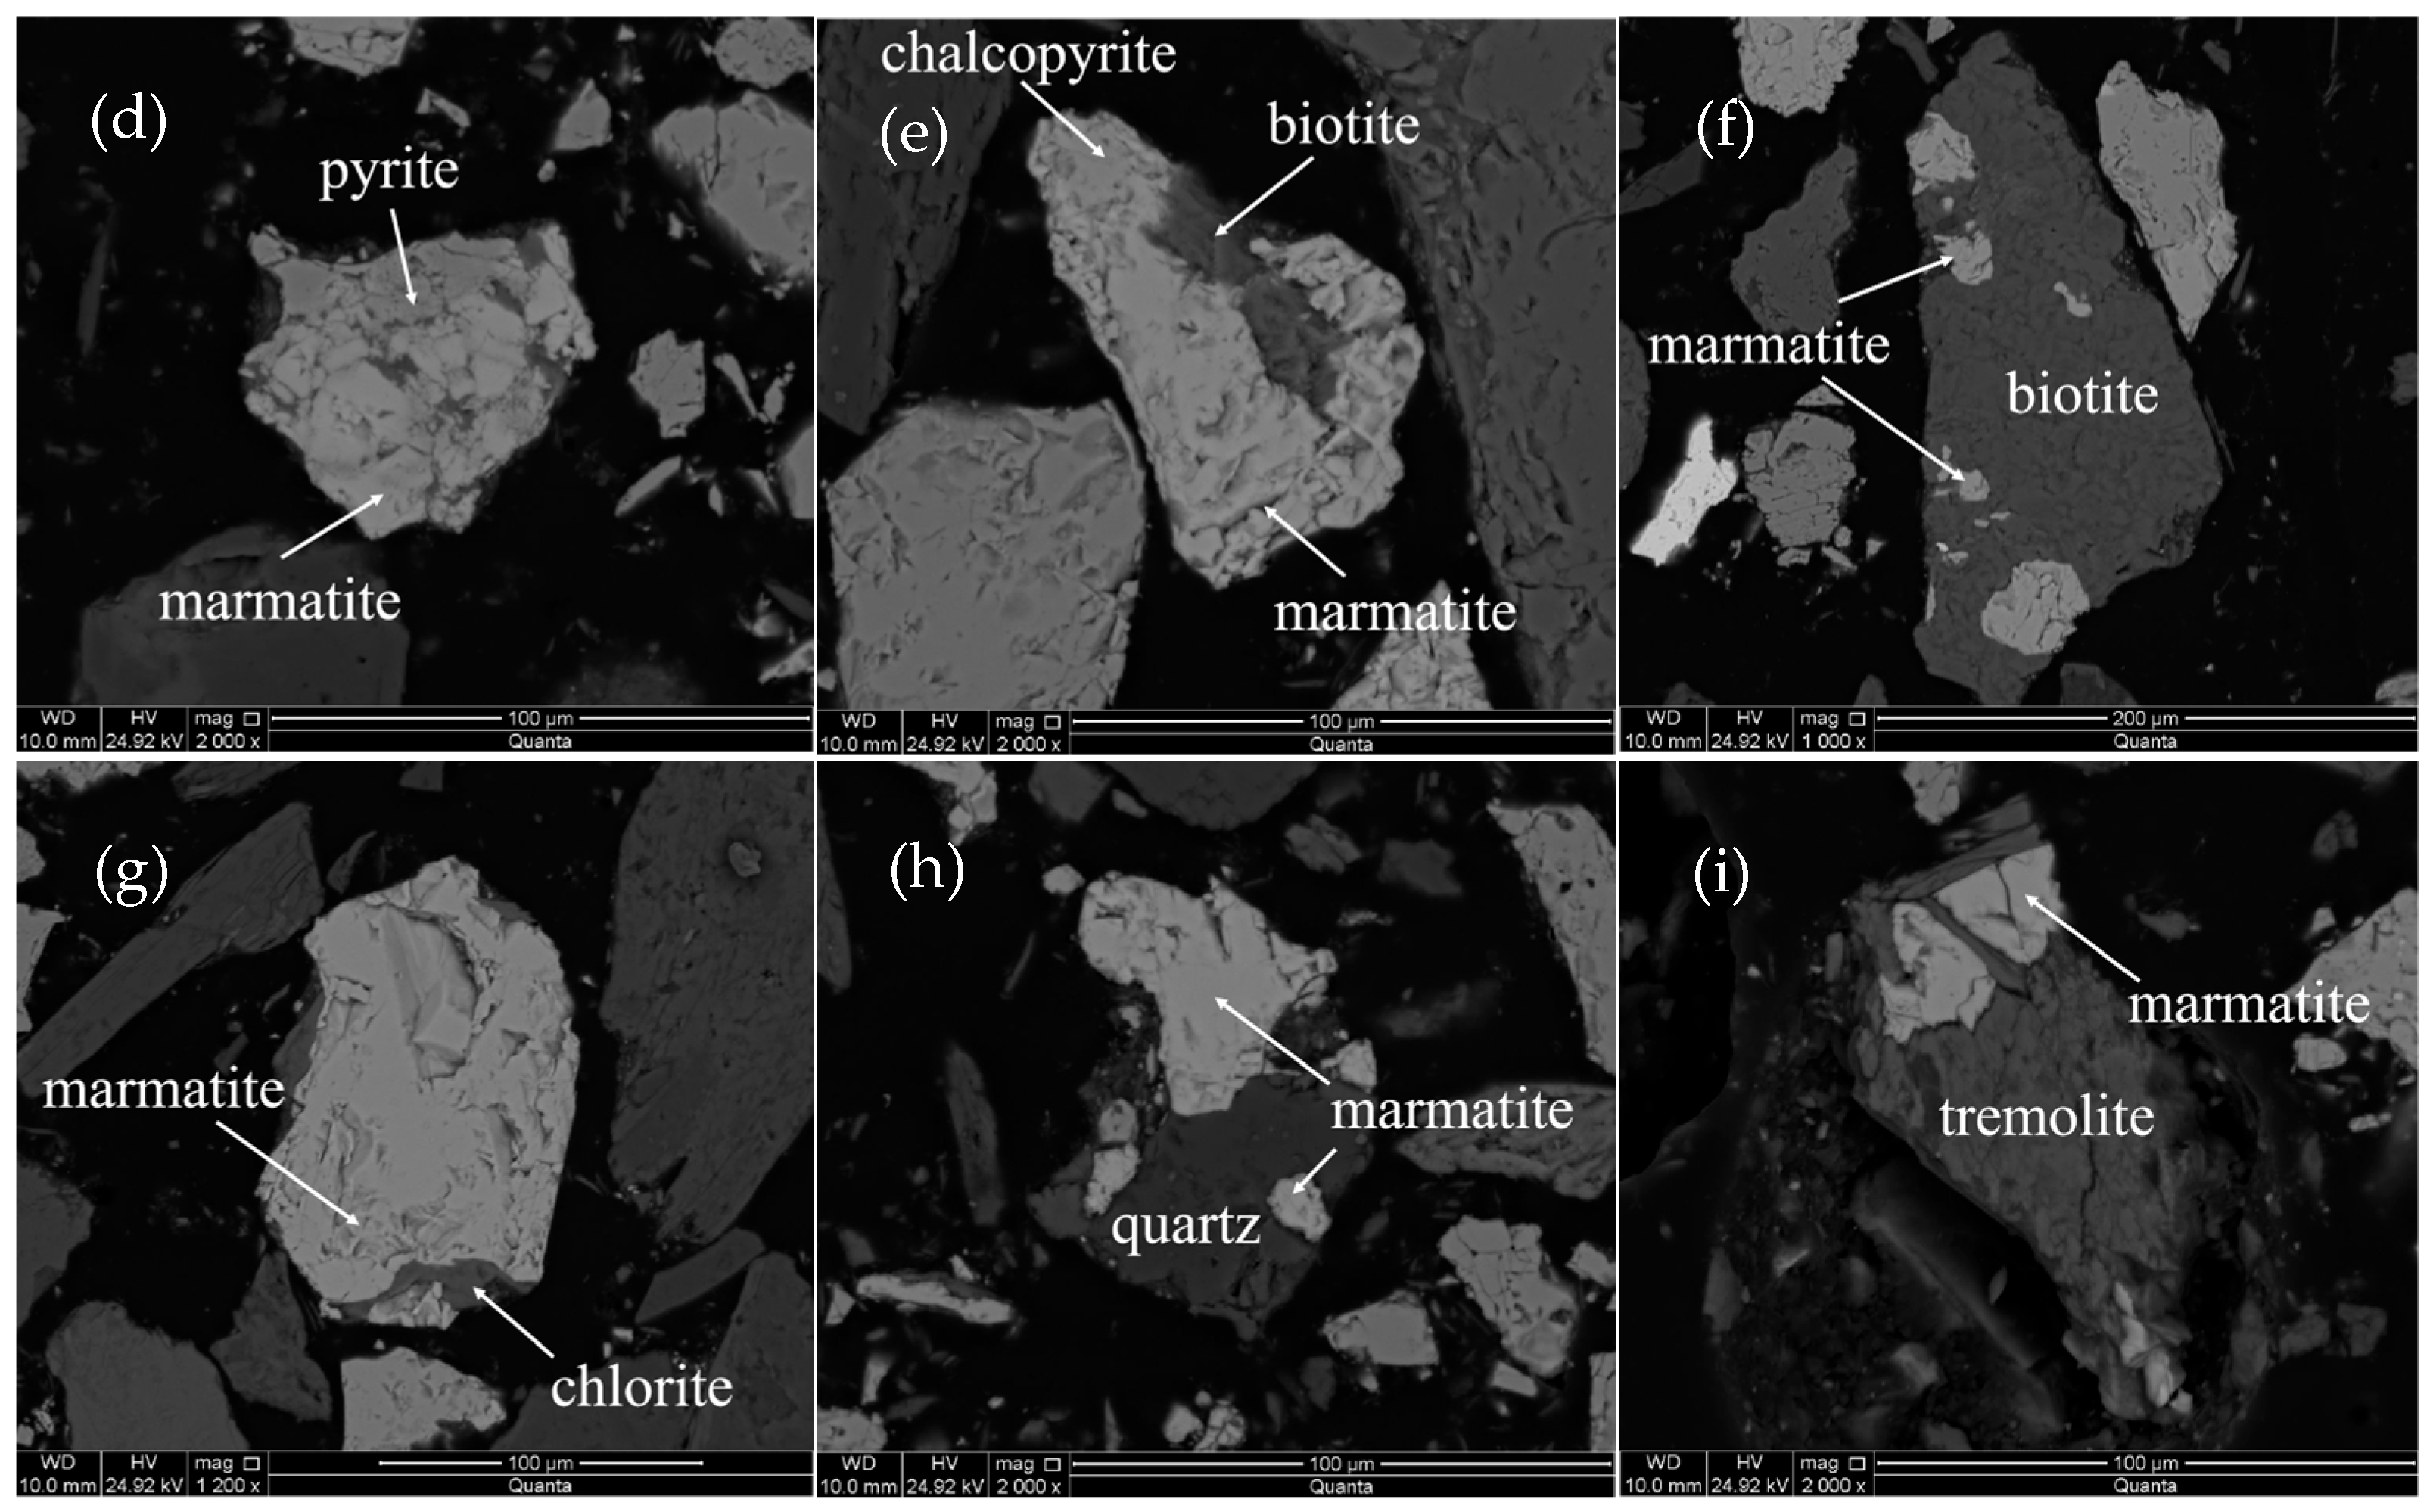
3.3. Textural Characteristics and Substitution Mechanism of Indium-Bearing Marmatite

3.3.1. Textural Characteristics of Indium-Bearing Marmatite

Marmatite was found to be the main carrier mineral of indium; hence, we conducted a systematic investigation into the occurrence state and enrichment mechanism of indium within marmatite. Our EDS analysis (Figure 6 and Table 9) showed that the marmatite contained 55.1% Zn, 10.8% Fe, and 34.1% S, on average. Combined with MLA (Figure 7) and SEM–BSE (Figure 8) data, the textural characteristics of marmatite can be summarized as follows: some marmatite occurs as single dissociated particles (Figure 8a); some marmatite has a close intergrowth relationship with metallic minerals such as pyrrhotite, chalcopyrite, pyrite, and magnetite, with the intergrowth mainly consisting of inlaid distribution and adjacent intergrowth (Figure 8c–e); some marmatite exhibits intergrowth with oxide minerals (calcite, dolomite, quartz, chlorite, and biotite), with the intergrowth characterized by wrapping in an oxide mineral or being inlaid with other minerals (Figure 8b,f–i); and the grain size distribution of marmatite has a wide range, primarily distributed between 0.005 and 0.15 mm (Figure 7).

3.3.2. Substitution Mechanism of Indium in Marmatite

To further clarify the substitution mechanism of indium in marmatite from the Dulong deposit, a 300 × 300 μm area of the surface of a marmatite grain was subjected to EPMA, with a focus on analyzing the correlation between indium and copper, iron, zinc and sulfur. We found a positive correlation between indium and copper (Figure 9b,c), consistent with the findings of an existing study [34]. However, three elongated bright zones (Figure 9a) exhibited marked enrichment in copper, indium, and sulfur, with negligible iron and zinc content (Figure 9b–f); these are interpreted as roquesite (CuInS2). This constitutes the first documented observation of an independent indium mineral species within the Dulong mine.
Laser ablation inductively coupled plasma mass spectrometry is a high-efficiency analytical technique capable of simultaneous in situ measurement of precious metals and critical trace elements in mineral phases, while achieving low detection limits [27,35,36]. Here, we used LA–ICP–MS to obtain higher-precision data in relation to indium-bearing marmatite (Figure 10). These data revealed that Cu and In contents in the marmatite ranged from 100 to 700 ppm, exhibiting a strong positive correlation (correlation coefficient = 0.9869) with a slope of 1.04 (Figure 10b). This is consistent with the coupled substitution mechanism 2 Zn2+ ∂ Cu+ + In3+ [26,35,37,38]. Additionally, Fe and In exhibited a moderate positive correlation (Figure 10d; correlation coefficient = 0.7691), suggesting that the presence of Fe facilitates In substitution, whereas S did not correlate with In (Figure 10c). Further elemental mapping visually corroborated the positive correlation between Cu and In (Figure 11 and Figure 12). According to the relevant literature [17], X-ray photoelectron spectroscopy analysis indicates that the valence states of Zn, S, Fe, and In in indium-rich sphalerite of the Dulong deposit are Zn2+, S2−, Fe2+, and In3+, respectively. This, in conjunction with the findings of our study, means that the substitution formula for indium in marmatite can be revised to
Z n x S + C u + + I n 3 + Z n x 2 C u I n S + 2 Z n 2 +
or
Z n x 1 F e S + C u + + I n 3 + Z n x 2 C u I n S + Z n 2 + + F e 2 +

3.4. Enrichment Regularity of Indium in the Dulong Mineral Processing Plant

In the Dulong mineral processing plant, indium, as an important by-product of zinc concentrate, has considerable economic value [11,39]. However, because the ore is a complex polymetallic deposit, the recovery rate of indium in the beneficiation process is low, and the recovery methods are single. Above, we have clarified the enrichment characteristics and substitution mechanisms of indium, but important indicators, such as the yield, grade, and recovery rate of the beneficiation products, remain unclear. Hence, the beneficiation process of the Dulong beneficiation plant must be investigated.
We statistically analyzed the beneficiation indicators of five concentrates products, one middlings products, and one tailings product (Figure 13). The main beneficiation product minerals are listed in Table 10, and the distributions of indium and other major elements in the beneficiation products are presented in Table 11. The zinc concentrate had the highest indium recovery rate (48.01%), and this was the only recoverable indium in production. Further enhancement of the recovery rate of the zinc concentrate could concurrently increase the recovery rate of indium. The recovery rate of indium in the tailings was as high as 40.83%; this portion of indium had the lowest grade at 25.35 g/t, and flotation recovery was particularly challenging, with almost no economic value [40]. The copper and iron–sulfur concentrates had relatively high indium grades and recovery rates (total indium distribution of the two concentrates was 9.87%), consistent with the results shown in Table 8. Considering the difficulty of flotation, these indium-bearing sulfide minerals are easier to concentrate and possess higher recovery potential. The efficient utilization of multiple carrier minerals will be crucial in enhancing the overall utilization rate of indium resources during beneficiation and smelting processes.

4. Conclusions

The Dulong ore comprises over 30 minerals, within which the average grade of indium is 43.87 g/t. In addition to its enrichment in marmatite through isomorphic substitution, indium occurs within the independent indium mineral roquesite (CuInS2). The distribution rate of indium in carrier minerals is ordered as follows: marmatite > silicate minerals > chalcopyrite > pyrrhotite > arsenopyrite and pyrite.
We studied the substitution mechanism of indium in its main carrier mineral, marmatite, and found that the substitution of indium correlated positively with copper. This allowed us to determine a revised substitution formula: Z n x S + C u + + I n 3 + Z n x 2 C u I n S + 2 Z n 2 + or Z n x 1 F e S + C u + + I n 3 + Z n x 2 C u I n S + Z n 2 + + F e 2 + .
Our investigation of process mineralogy and the beneficiation process at Dulong revealed that zinc concentrate is the most important carrier ore of indium, and flotation research in relation to this ore should be further strengthened. Meanwhile, copper and iron–sulfur concentrates contain high-grade indium, with a combined share of 9.87%, and thus have great recovery potential. These should be regarded as future foci for improving the recovery rate of indium resources.

Author Contributions

Conceptualization, X.X. and X.T.; methodology, X.T. and P.F.; software, Q.S. and R.X.; validation, R.X. and B.H.; formal analysis, P.F. and H.F.; investigation, X.X. and Z.L.; resources, X.T. and X.X.; data curation, R.X. and Z.L.; writing—original draft preparation, P.F.; writing—review and editing, P.F., X.T. and Q.S.; visualization, Q.S.; supervision, X.X.; project administration, B.H. and H.F.; funding acquisition, X.T. All authors have read and agreed to the published version of the manuscript.

Funding

This research was funded by National Natural Science Foundation of China (Nos. 52174252 and 5236040243), Deep Earth National Science and Technology Major Project (Nos. 2024ZD1004006) and Major Science and Technology Projects in Yunnan Province (202302AB080010). The funding agency had no role in the study design; collection, analysis, and interpretation of data; writing of the report; or the decision to submit the manuscript for publication.

Data Availability Statement

The original contributions presented in this study are included in the article. Further inquiries can be directed to the corresponding author.

Conflicts of Interest

Bin Han, Haitao Fu, and Zhiming Lu are employees of Yunnan Hualian Zinc and Indium Co., Ltd. The authors declare that they have no known competing financial interests or personal relationships that could have appeared to influence the work reported in this paper.

References

  1. Lin, J.; Li, X.; Luo, F.; Liu, W.; Tang, X.; Wang, M.; Li, Y. Security evaluation of China’s indium industrial chain: Perspective on substance flow throughout the whole life cycle. Sustain. Prod. Consum. 2024, 47, 557–569. [Google Scholar] [CrossRef]
  2. Yan, Y.; Liu, Y.; Fang, L.; Zhao, H.; Li, D.; Lu, Z.; Zhou, S. Influence of post-grown treatments on CuInS2 thin films prepared by sulphurization of Cu-In films. Rare Met. 2008, 27, 490–495. [Google Scholar] [CrossRef]
  3. Zhang, K.; Wu, Y.; Wang, W.; Li, B.; Zhang, Y.; Zuo, T. Recycling indium from waste LCDs: A review. Resour. Conserv. Recycl. 2015, 104, 276–290. [Google Scholar] [CrossRef]
  4. Lin, J.; Li, X.; Chen, W.; Wang, M. Mapping the upstream journey of China’s indium: A trade-linked substance flow analysis. J. Clean. Prod. 2022, 380, 135051. [Google Scholar] [CrossRef]
  5. Zhao, P.; Zajacz, Z.; Grondahl, C.; Tsay, A.; Mao, J.; Cheng, Q.; Yuan, S. Indium partitioning between silicate melts and magmatic fluids: Implications for indium ore genesis and the tracing of magma degassing. Geochim. Cosmochim. Acta 2024, 374, 146–155. [Google Scholar] [CrossRef]
  6. Song, H.; Wang, C.; Sun, K.; Geng, H.; Zuo, L. Material efficiency strategies across the industrial chain to secure indium availability for global carbon neutrality. Resour. Policy 2023, 85, 103895. [Google Scholar] [CrossRef]
  7. Rudnick, R.L.; Gao, S. Treatise on Geochemistry, 2nd ed.; Holland, H.D., Turekian, K.K., Eds.; Elsevier: Oxford, UK, 2014; pp. 1–51. [Google Scholar]
  8. Zheng, Y.; Guo, C.; Wang, D.; Zhao, T.; Wang, Y. Temporal and spatial distribution, genetic type, and metallogenic mechanism of indium (gallium, germanium, cadmium) associated deposits in China: Overview and expectation. Acta Geol. Sin. 2023, 97, 3569–3603. [Google Scholar]
  9. Murakami, H.; Ishihara, S. Trace elements of Indium-bearing sphalerite from tin-polymetallic deposits in Bolivia, China and Japan: A femto-second LA-ICPMS study. Ore Geol. Rev. 2013, 53, 223–243. [Google Scholar] [CrossRef]
  10. Ivashchenko, V. Geology, geochemistry and mineralogy of indium resources at Pitkäranta Mining District, Ladoga Karelia, Russia. J. Geochem. Explor. 2022, 240, 107046. [Google Scholar] [CrossRef]
  11. Tong, X.; Song, S.; He, J.; Lopez-Valdivieso, A. Flotation of indium-beard marmatite from multi-metallic ore. Rare Met. 2008, 27, 107–111. [Google Scholar] [CrossRef]
  12. Xu, L.; Chen, G.; Zhang, X.; Yang, Y.; Leng, C.; Yang, C.; Tian, Y.; Zhao, Z. Waste ITO target recycling for efficient indium recovery through a closed-loop process. J. Environ. Chem. Eng. 2024, 12, 112136. [Google Scholar] [CrossRef]
  13. Lin, S.; Mao, J.; Chen, W.; Shi, L. Indium in mainland China: Insights into use, trade, and efficiency from the substance flow analysis. Resour. Conserv. Recycl. 2019, 149, 312–321. [Google Scholar] [CrossRef]
  14. Zhou, Y.; Rechberger, H.; Li, J.; Li, Q.; Wang, G.; Chen, S. Dynamic analysis of indium flows and stocks in China: 2000–2018. Resour. Conserv. Recycl. 2021, 167, 105394. [Google Scholar] [CrossRef]
  15. Li, Y.; Tao, Y.; Zhu, F.; Liao, M.; Xiong, F.; Deng, X. Distribution and existing state of indium in the Gejiu Tin polymetallic deposit, Yunnan Province, SW China. Chin. J. Geochem. 2015, 34, 469–483. [Google Scholar] [CrossRef]
  16. Benites, D.; Torró, L.; Vallance, J.; Laurent, O.; Valverde, P.E.; Kouzmanov, K.; Chelle-Michou, C.; Fontboté, L. Distribution of indium, germanium, gallium and other minor and trace elements in polymetallic ores from a porphyry system: The Morococha district, Peru. Ore Geol. Rev. 2021, 136, 104236. [Google Scholar] [CrossRef]
  17. Gao, L.S.; Wen, H.J.; Zhu, C.W.; Nie, X.; Chen, A.B.; Yang, G.S. Study on the occurrence state of indium in sphalerite of Dulong Sn-Zn-In polymetallic deposit, Southwest China. Acta Geochim. 2023, 42, 572–582. [Google Scholar] [CrossRef]
  18. Ishihara, S.; Qin, K.Z.; Wang, Y.W. Resource evaluation of indium in the Dajing tin-polymetallic deposits, Inner Mongolia, China. Resour. Geol. 2008, 58, 72–79. [Google Scholar] [CrossRef]
  19. Ye, Z.; Xu, J.; Zhao, J.F.; Chen, S.Y.; Chen, J.W.; Liu, W.Y. Mineralogy of indium mineralization in the Dajing Sn-Cu polymetallic deposit in Inner Mongolia. Ore Geol. Rev. 2023, 159, 105564. [Google Scholar] [CrossRef]
  20. Zhang, Q.; Zhu, X.Q.; He, Y.H.; Jiang, J.J.; Wang, D.P. Indium enrichment in the Meng’entaolegai Ag-Pb-Zn deposit, Inner Mongolia, China. Resour. Geol. 2006, 56, 337–346. [Google Scholar] [CrossRef]
  21. Cheng, Y.S. Occurrence characteristics and enrichment regularity of indium in pyrite: A case study of Dachang tin ore-field. Trans. Nonferrous Met. Soc. China 2016, 26, 2197–2208. [Google Scholar] [CrossRef]
  22. Liu, J.P. Indium Mineralization in a Sn-Poor Skarn Deposit: A Case Study of the Qibaoshan Deposit, South China. Minerals 2017, 7, 76. [Google Scholar] [CrossRef]
  23. Liu, J.P.; Rong, Y.A.; Gu, X.P.; Shao, Y.J.; Lai, J.Q.; Chen, W.K. Indium Mineralization in the Yejiwei Sn-Polymetallic Deposit of the Shizhuyuan Orefield, Southern Hunan, China. Resour. Geol. 2018, 68, 22–36. [Google Scholar] [CrossRef]
  24. Mao, G.; Zhu, Y. The occurrence and comprehensive recovery assessment of In and Cd in the Zhongjia iron deposit, Fujian. Contrib. Geol. Miner. Resour. Res. 2013, 28, 58–64. [Google Scholar]
  25. Xu, B.; Jiang, S.-Y.; Wang, R.; Ma, L.; Zhao, K.-d.; Yan, X. Late Cretaceous granites from the giant Dulong Sn-polymetallic ore district in Yunnan Province, South China: Geochronology, geochemistry, mineral chemistry and Nd–Hf isotopic compositions. Lithos 2015, 218–219, 54–72. [Google Scholar] [CrossRef]
  26. Xing, B.; Mao, J.; Xiao, X.; Liu, H.; Jia, F.; Wang, S.; Huang, W.; Li, H. Genetic discrimination of the Dingjiashan Pb-Zn deposit, SE China, based on sphalerite chemistry. Ore Geol. Rev. 2021, 135, 104212. [Google Scholar] [CrossRef]
  27. Fan, M.-S.; Ni, P.; Pan, J.-Y.; Wang, G.-G.; Ding, J.-Y.; Chu, S.-W.; Li, W.-S.; Huang, W.-Q.; Zhu, R.-Z.; Chi, Z. Rare disperse elements in epithermal deposit: Insights from LA–ICP–MS study of sphalerite at Dalingkou, South China. J. Geochem. Explor. 2023, 244, 107124. [Google Scholar] [CrossRef]
  28. Xu, J.; Cook, N.J.; Ciobanu, C.L.; Li, X.F.; Kontonikas-Charos, A.; Gilbert, S.; Lv, Y.H. Indium distribution in sphalerite from sulfide-oxide-silicate skarn assemblages: A case study of the Dulong Zn-Sn-In deposit, Southwest China. Miner. Depos. 2021, 56, 307–324. [Google Scholar] [CrossRef]
  29. Celep, O.; Yazici, E.Y.; Altinkaya, P.; Deveci, H. Characterization of a refractory arsenical silver ore by mineral liberation analysis (MLA) and diagnostic leaching. Hydrometallurgy 2019, 189, 105106. [Google Scholar] [CrossRef]
  30. Liu, Y.; Hu, Z.; Gao, S.; Günther, D.; Xu, J.; Gao, C.; Chen, H. In situ analysis of major and trace elements of anhydrous minerals by LA-ICP-MS without applying an internal standard. Chem. Geol. 2008, 257, 34–43. [Google Scholar] [CrossRef]
  31. Wilson, S.A.; Ridley, W.I.; Koenig, A.E. Development of sulfide calibration standards for the laser ablation inductively-coupled plasma mass spectrometry technique. J. Anal. At. Spectrom. 2002, 17, 406–409. [Google Scholar] [CrossRef]
  32. Paton, C.; Hellstrom, J.; Paul, B.; Woodhead, J.; Hergt, J. Iolite: Freeware for the visualisation and processing of mass spectrometric data. J. Anal. At. Spectrom. 2011, 26, 2508–2518. [Google Scholar] [CrossRef]
  33. Zhao, T.; Chen, C.; He, X.; Meng, L.; Xu, J.; Liu, W. A synthesis of the geology, spatial–temporal distribution and enrichment mechanism of granite-related indium deposits in China. Ore Geol. Rev. 2022, 146, 104932. [Google Scholar] [CrossRef]
  34. Chen, C.; Meng, L.; Xu, J.; Zhan, Q.; Zhao, T. Texture and geochemistry of sphalerite from the Chitudian Pb-Zn-Ag deposit, southern margin of the North China Craton: Implications for the enrichments of Cd, Ga, and In. Ore Geol. Rev. 2023, 156, 105392. [Google Scholar] [CrossRef]
  35. Cook, N.J.; Ciobanu, C.L.; Pring, A.; Skinner, W.; Shimizu, M.; Danyushevsky, L.; Saini-Eidukat, B.; Melcher, F. Trace and minor elements in sphalerite: A LA-ICPMS study. Geochim. Cosmochim. Acta 2009, 73, 4761–4791. [Google Scholar] [CrossRef]
  36. Kelvin, M.; Whiteman, E.; Petrus, J.; Leybourne, M.; Nkuna, V. Application of LA-ICP-MS to process mineralogy: Gallium and germanium recovery at Kipushi copper-zinc deposit. Miner. Eng. 2022, 176, 107322. [Google Scholar] [CrossRef]
  37. Ivashchenko, V.I. Indium Distribution in Sphalerites from Pitkaranta Mining District (South Karelia, Russia). Geol. Ore Depos. 2022, 64, 562–574. [Google Scholar] [CrossRef]
  38. Bauer, M.E.; Seifert, T.; Burisch, M.; Krause, J.; Richter, N.; Gutzmer, J. Indium-bearing sulfides from the Hammerlein skarn deposit, Erzgebirge, Germany: Evidence for late-stage diffusion of indium into sphalerite. Miner. Depos. 2019, 54, 175–192. [Google Scholar] [CrossRef]
  39. Cook, N.J.; Ciobanu, C.L.; Williams, T. The mineralogy and mineral chemistry of indium in sulphide deposits and implications for mineral processing. Hydrometallurgy 2011, 108, 226–228. [Google Scholar] [CrossRef]
  40. Irrgang, N.; Monneron-Enaud, B.; Möckel, R.; Schlömann, M.; Höck, M. Economic feasibility of the co-production of indium from zinc sulphide using bioleaching extraction in Germany. Hydrometallurgy 2021, 200, 105566. [Google Scholar] [CrossRef]
Figure 2. Sample preparation process.
Minerals 15 00672 g002
Figure 3. Representative map of data obtained from ore mineral liberation analysis (selected mines).
Minerals 15 00672 g003
Figure 4. Mineral composition and abundance within the ore.
Minerals 15 00672 g004
Figure 5. Microscope images of the main ore minerals: (a) magnetite, (b) marmatite, (c) chalcopyrite, (d) pyrrhotite, (e) silicate minerals (mainly chlorite, mica, and small amounts of talc, tremolite, and potassium feldspar), (f) carbonate minerals (mainly calcite and dolomite).
Minerals 15 00672 g005
Figure 6. Energy-dispersive X-ray spectroscopy analysis of marmatite.
Minerals 15 00672 g006
Figure 7. Mineral liberation analysis highlighting marmatite.
Minerals 15 00672 g007
Figure 8. Backscattered electron images of different types of marmatite occurrence within the ore. (a) marmatite; (b) dolomite and marmatite; (c) pyrite, biotite and marmatite; (d) pyrite and marmatite; (e) chalcopyrite, biotite and marmatite; (f) marmatite and biotite; (g) marmatite and chlorite; (h) marmatite and quartz; (i) marmatite and tremolite.
Minerals 15 00672 g008aMinerals 15 00672 g008b
Figure 9. (af) Electron probe microanalysis of indium-bearing marmatite in Dulong ore.
Minerals 15 00672 g009
Figure 10. Trace element contents in marmatite. (a) Backscattered electron image of indium-bearing marmatite showing analysis points. Relationships between In and (b) Cu, (c) S, and (d) Fe in marmatite.
Minerals 15 00672 g010
Figure 11. Image showing mapped marmatite area (see Figure 12).
Minerals 15 00672 g011
Figure 12. Micrograph and elemental maps of marmatite from the red boxed area in Figure 11.
Minerals 15 00672 g012
Figure 13. Enrichment of indium in the beneficiation process and distribution of indium in beneficiation products.
Minerals 15 00672 g013
Table 2. X-ray fluorescence spectroscopy results.
ElementFeSiCaMgAlZnSKFAsMn
Content/%11.0010.007.005.004.002.002.000.800.800.300.30
ElementCuSnTiPRbClBiSrZrGaY
Content/%0.200.100.100.030.020.0080.0050.0050.0050.0020.002
Table 3. Results of chemical multi-element analysis.
CompoundIn *SiO2Fe2O3CaOAl2O3MgOZnSCuSSnO2K2OMnO
Content/%43.8728.2017.9711.107.497.264.040.230.221.360.39
* In is given in g/t.
Table 4. Mineral composition and abundance.
Serial NumberMineralMolecular FormulaContent/%Serial NumberMineralMolecular FormulaContent/%
1Marmatite(Zn, Fe) S5.1416BiotiteK{(Mg < 2\3, Fe > 1\3)3[AlSi3O10](OH)2}3.77
2PyrrhotiteFe1-xS6.1217Chlorite(Mg, Fe, Al)3(OH)6{(Mg, Fe, Al)3[(Si, Al)6O10(OH)2]}11.47
3ChalcopyriteCuFeS20.6618TremoliteCa2Mg5[Si4O11]2(OH)21.63
4PyriteFeS21.0219SanidineK[AlSi3O8]3.43
5ArsenopyriteFeAsS0.9820AndraditeCa3Fe2[SiO4]35.42
6GalenaPbS0.0221EpidoteCa2FeAl2[SiO4][Si2O7]O(OH)2.36
7MagnetiteFe3O411.0122FluoriteCaF21.44
8CassiteriteSnO20.2823Ferroactin-oliteCa2(MgFe)5[Si4O11]2(OH)20.53
9CalciteCa[CO3]11.0224AntigoriteMg6[Si4O10](OH)80.37
10DolomiteCaMg[CO3]29.0725AlbiteNa[AlSi3O8]0.27
11QuartzSiO211.1226SpheneCaTiSiO50.25
12talcMg3[Si4O10](OH)23.3027ZirconZr[SiO4]0.05
13MinnesotaiteFe3[Si4O10](OH)21.9628IlvaiteCaFe3(SiO4)2OH0.46
14MuscoviteK{Al2[AlSi3O10](OH)2}5.2129ApatiteCa5(PO4)3(F, Cl, OH)0.15
15HlogopiteK{(Mg > 2\3, Fe < 1/3)3[AlSi3O10](OH)2}1.3930RutileTiO20.10
Table 5. Particle size characteristics of raw ore and main metallic minerals.
Particle Size (μm)Raw OreMarmatitePyrrhotiteMagnetiteChalcopyriteArsenopyritePyrite
Content
(%)
Cumulative
(%)
Content
(%)
Cumulative
(%)
Content
(%)
Cumulative
(%)
Content
(%)
Cumulative
(%)
Content
(%)
Cumulative
(%)
Content
(%)
Cumulative
(%)
Content
(%)
Cumulative
(%)
+3001.331.33
−300 + 2125.266.58
−212 + 15010.5017.082.002.002.182.18
−150 + 10612.4129.496.256.252.174.174.827.007.067.0610.7310.734.354.35
−106 + 7513.3642.8511.5317.7814.8018.978.9515.9515.6022.667.1317.8616.3320.69
−75 + 5313.5056.3516.4734.2515.8634.8316.8432.7922.2844.949.8627.7213.4734.16
−53 + 3811.8868.2315.3149.5714.9249.7516.6849.476.9651.9012.5440.2619.8754.03
−38 + 2710.5478.7716.1865.7514.5064.2617.0166.4815.3767.2617.3657.6215.1469.17
−27 + 197.9686.7212.6178.3612.7176.9712.7079.189.1476.4016.4174.0311.4680.63
−19 + 13.55.3992.118.7987.159.3986.369.1488.328.4884.8810.7684.798.8789.50
−13.5 + 9.63.6795.785.3692.516.5592.916.0394.346.5991.466.5091.294.1993.68
−9.6 + 6.82.4298.204.0996.614.0696.973.5497.884.6596.114.9396.233.5497.22
−6.8 + 4.81.4499.642.5999.192.3399.311.6599.532.9399.042.9999.212.0599.28
−4.8 + 3.40.3499.970.7399.930.6199.910.4199.940.8699.900.6999.900.6399.91
−3.40.03100.000.07100.00.09100.00.06100.00.10100.00.10100.00.09100.0
Table 6. Particle size characteristics of main oxide minerals.
Particle Size (μm)QuartzMuscoviteChloriteCalcite GarnetDolomiteCalcite
Cont-Ent
(%)
Cumulative
(%)
Cont-Ent
(%)
Cumulative
(%)
Cont-Ent
(%)
Cumulative
(%)
Cont-Ent
(%)
Cumulative
(%)
Cont-Ent
(%)
Cumulative
(%)
Cont-Ent
(%)
Cumulative
(%)
+3005.705.70
−300 + 21211.9417.641.351.354.494.491.741.746.746.74
−212 + 15013.8531.495.765.7611.9113.2610.2314.728.9510.6912.5519.29
−150 + 10613.0944.5812.7118.4610.7424.0013.9828.7011.3722.0614.7234.02
−106 + 7511.8556.4212.7931.2615.0239.0113.1641.8713.3235.3813.0647.08
−75 + 5314.9571.3712.6943.9512.7151.7210.7852.6419.1854.5712.9059.98
−53 + 389.8181.1811.2655.2111.1762.8912.6765.3214.5069.0611.8671.84
−38 + 277.3488.5212.4667.6710.7573.6511.5376.8512.1281.189.7381.56
−27 + 194.7693.2811.2878.959.1782.817.7384.588.5689.746.6688.22
−19 + 13.53.2696.548.1487.096.4589.265.5890.164.6294.374.6692.88
−13.5 + 9.61.7898.336.1293.214.7093.964.2594.412.7097.073.2996.18
−9.6 + 6.81.0299.343.7696.973.2797.233.1597.561.6898.752.2298.40
−6.8 + 4.80.5399.872.3399.302.1499.381.8299.380.9999.741.2899.68
−4.8 + 3.40.1299.990.6099.900.5599.930.5499.920.2499.980.3099.98
−3.40.01100.000.10100.000.07100.000.08100.000.02100.000.02100.00
Table 7. Indium content in single minerals.
MineralMarmatiteChalcopyritePyrrhotiteArsenopyrite and Pyrite
Content of In (g/t)543.00521.0086.3322.35
MineralSilicate MineralsCarbonate MineralsQuartz and Other VeinstoneMagnetite
Content of In (g/t)24.450.000.000.00
Table 8. Distribution of indium in different minerals.
MineralContent/%In Grade
of Carrier Minerals (g/t)
Distribution of In
in Carrier Minerals/%
Marmatite5.14543.0063.62
Chalcopyrite0.66521.007.84
Magnetite11.010.000.00
Pyrrhotite6.1286.334.22
Arsenopyrite, pyrite2.0022.351.02
Silicate minerals41.8224.4523.30
Quartz11.120.000.00
Carbonates20.090.000.00
Other2.700.000.00
Raw mineral100.0043.87100.00
Table 9. Energy-dispersive X-ray spectroscopy analysis of marmatite.
NumberS/%Fe/%Zn/%NumberS/%Fe/%Zn/%
134.312.653.11233.812.154.1
231.810.957.31334.111.154.8
333.910.755.41433.812.453.9
433.811.954.21534.210.954.9
534.79.555.81634.410.355.3
634.29.056.81734.29.656.2
733.36.560.21834.57.857.6
835.813.450.81932.911.156.1
934.011.754.32034.713.751.7
1036.211.452.52133.810.156.1
1133.911.155.0average value34.110.855.1
Table 10. Main minerals in different mineral processing products.
ProductMain Mineral
Zinc ConcentrateMarmatite
Copper ConcentrateChalcopyrite
Iron Sulfur ConcentratePyrrhotite
Tin ConcentrateCassiterite
Iron ConcentrateMagnetite
Tin Middlingcassiterite
TailingsCarbonates, Magnetite Silicate minerals, Quartz
Table 11. Distribution of indium and other major elements in beneficiation products.
IndicatorElementProducts
Zinc ConcentrateCopper ConcentrateTin ConcentrateTin MiddlingIron Sulfur ConcentrateIron ConcentrateTailingsRaw Ore
Grade/%Zn46.736.970.080.110.220.050.182.58
Cu0.7316.580.020.030.050.010.020.18
Sn0.070.1438.222.600.170.160.120.23
Fe13.9320.4712.9316.9960.2566.2211.6217.26
S33.0124.683.935.159.622.332.074.61
In483.10319.4253.6547.6128.3134.9225.3551.11
Ag60.17771.083.254.878.593.473.5712.59
As0.300.210.170.380.060.010.290.27
MgO1.045.761.555.342.111.247.156.33
Recovery/%Zn92.741.990.010.010.840.025.91100.00
Cu20.7867.560.030.062.620.0411.39100.00
Sn1.670.4743.803.727.200.7443.99100.00
Fe4.120.870.200.3233.593.9855.78100.00
S36.623.940.220.3720.080.5237.24100.00
In48.014.570.280.305.300.7140.83100.00
Ag24.4445.140.070.136.570.2923.49100.00
As5.610.580.160.462.050.0388.35100.00
MgO0.840.670.060.283.210.2093.69100.00
Yield/%-5.110.740.260.339.621.0482.90100.00
Grade unit: “%” for Zn, Cu, Sn, Fe, S, Ag, As and MgO, “ppm” for In.
Disclaimer/Publisher’s Note: The statements, opinions and data contained in all publications are solely those of the individual author(s) and contributor(s) and not of MDPI and/or the editor(s). MDPI and/or the editor(s) disclaim responsibility for any injury to people or property resulting from any ideas, methods, instructions or products referred to in the content.

