
Effect of Dual-Site Co-Cultivation on Spectral Characteristics and Trace Element Enrichment in Akoya Pearls


Abstract
1. Introduction
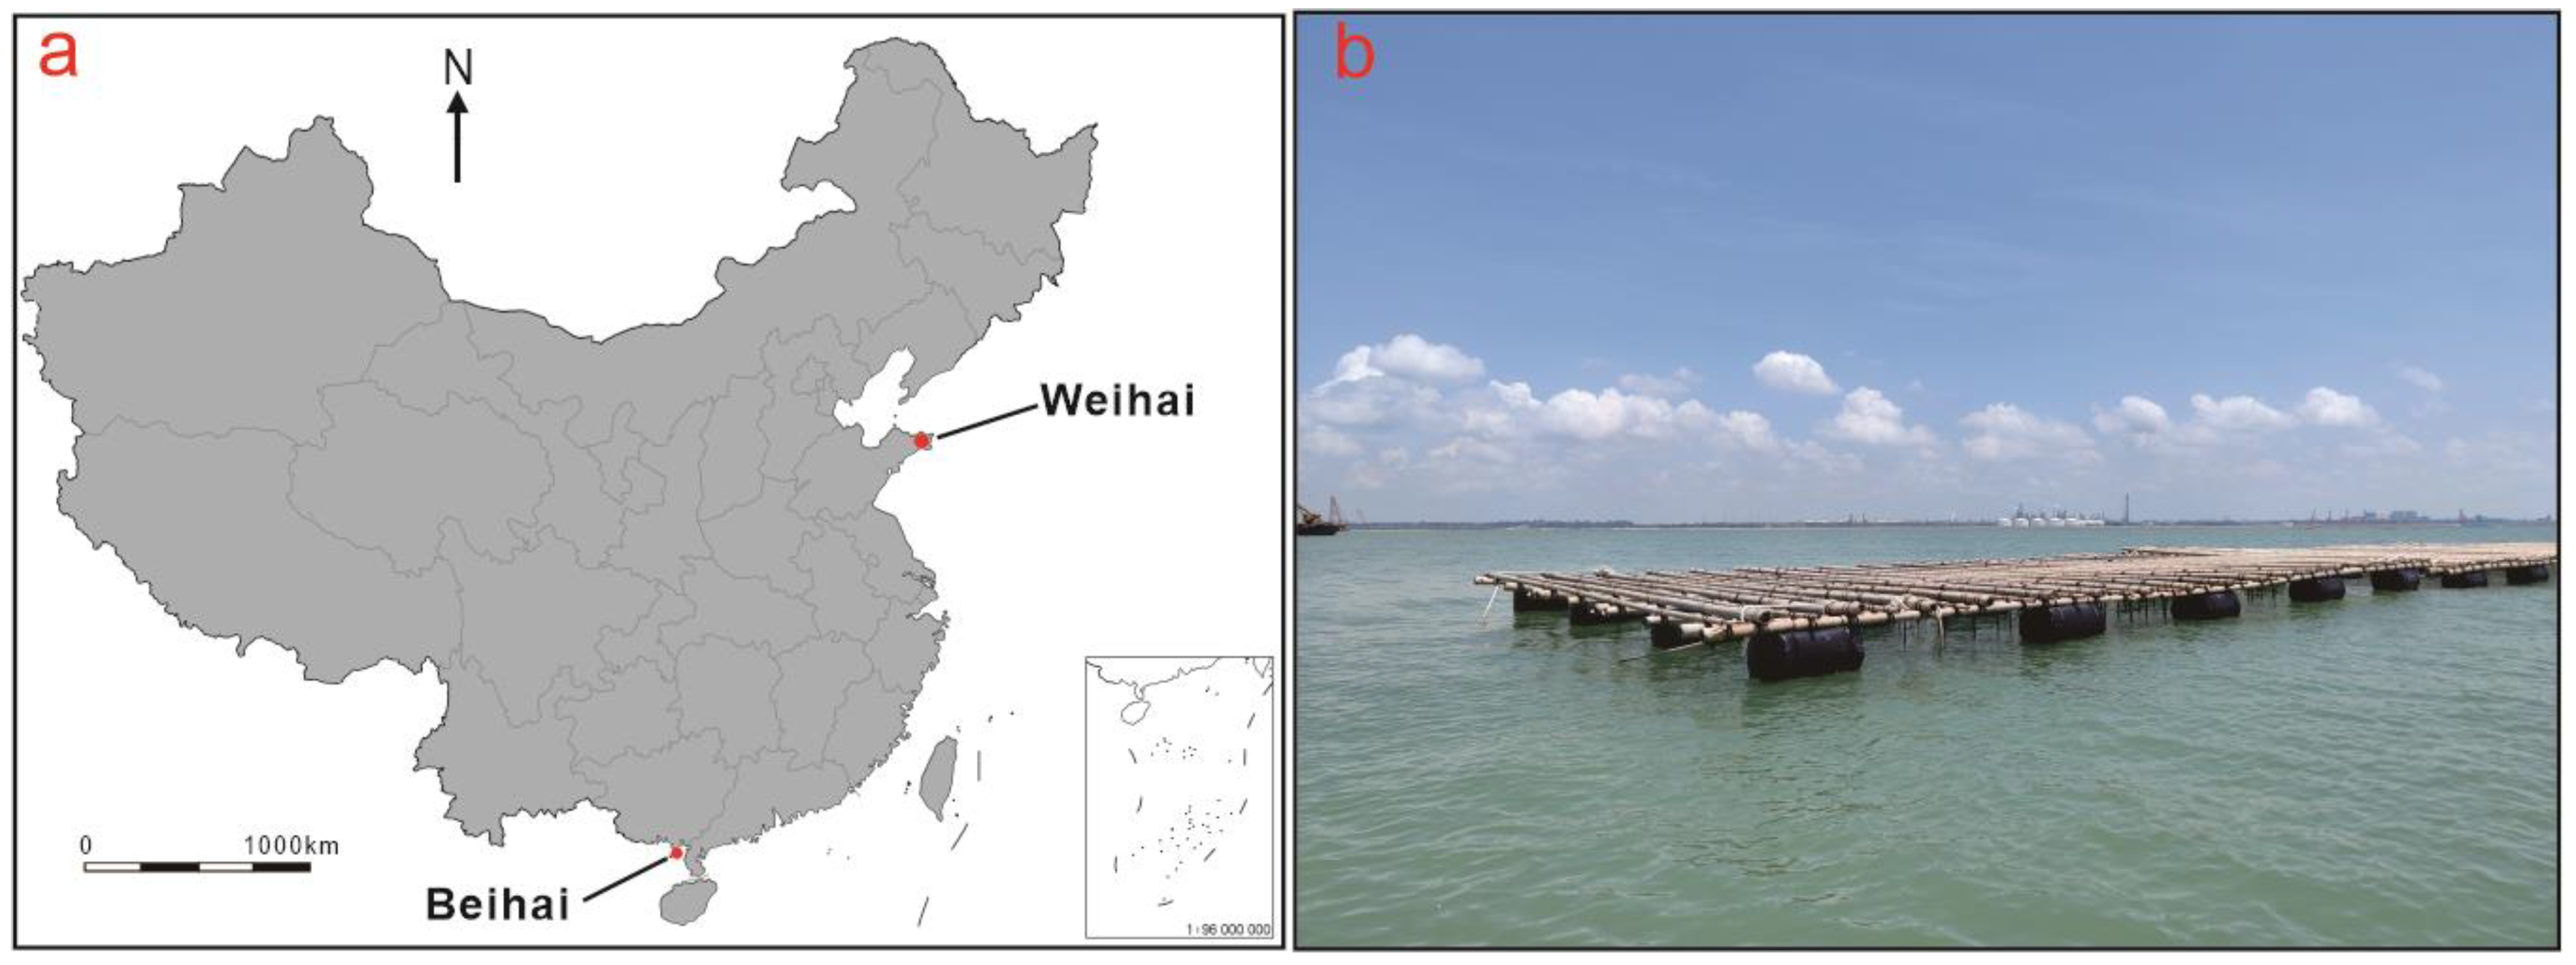
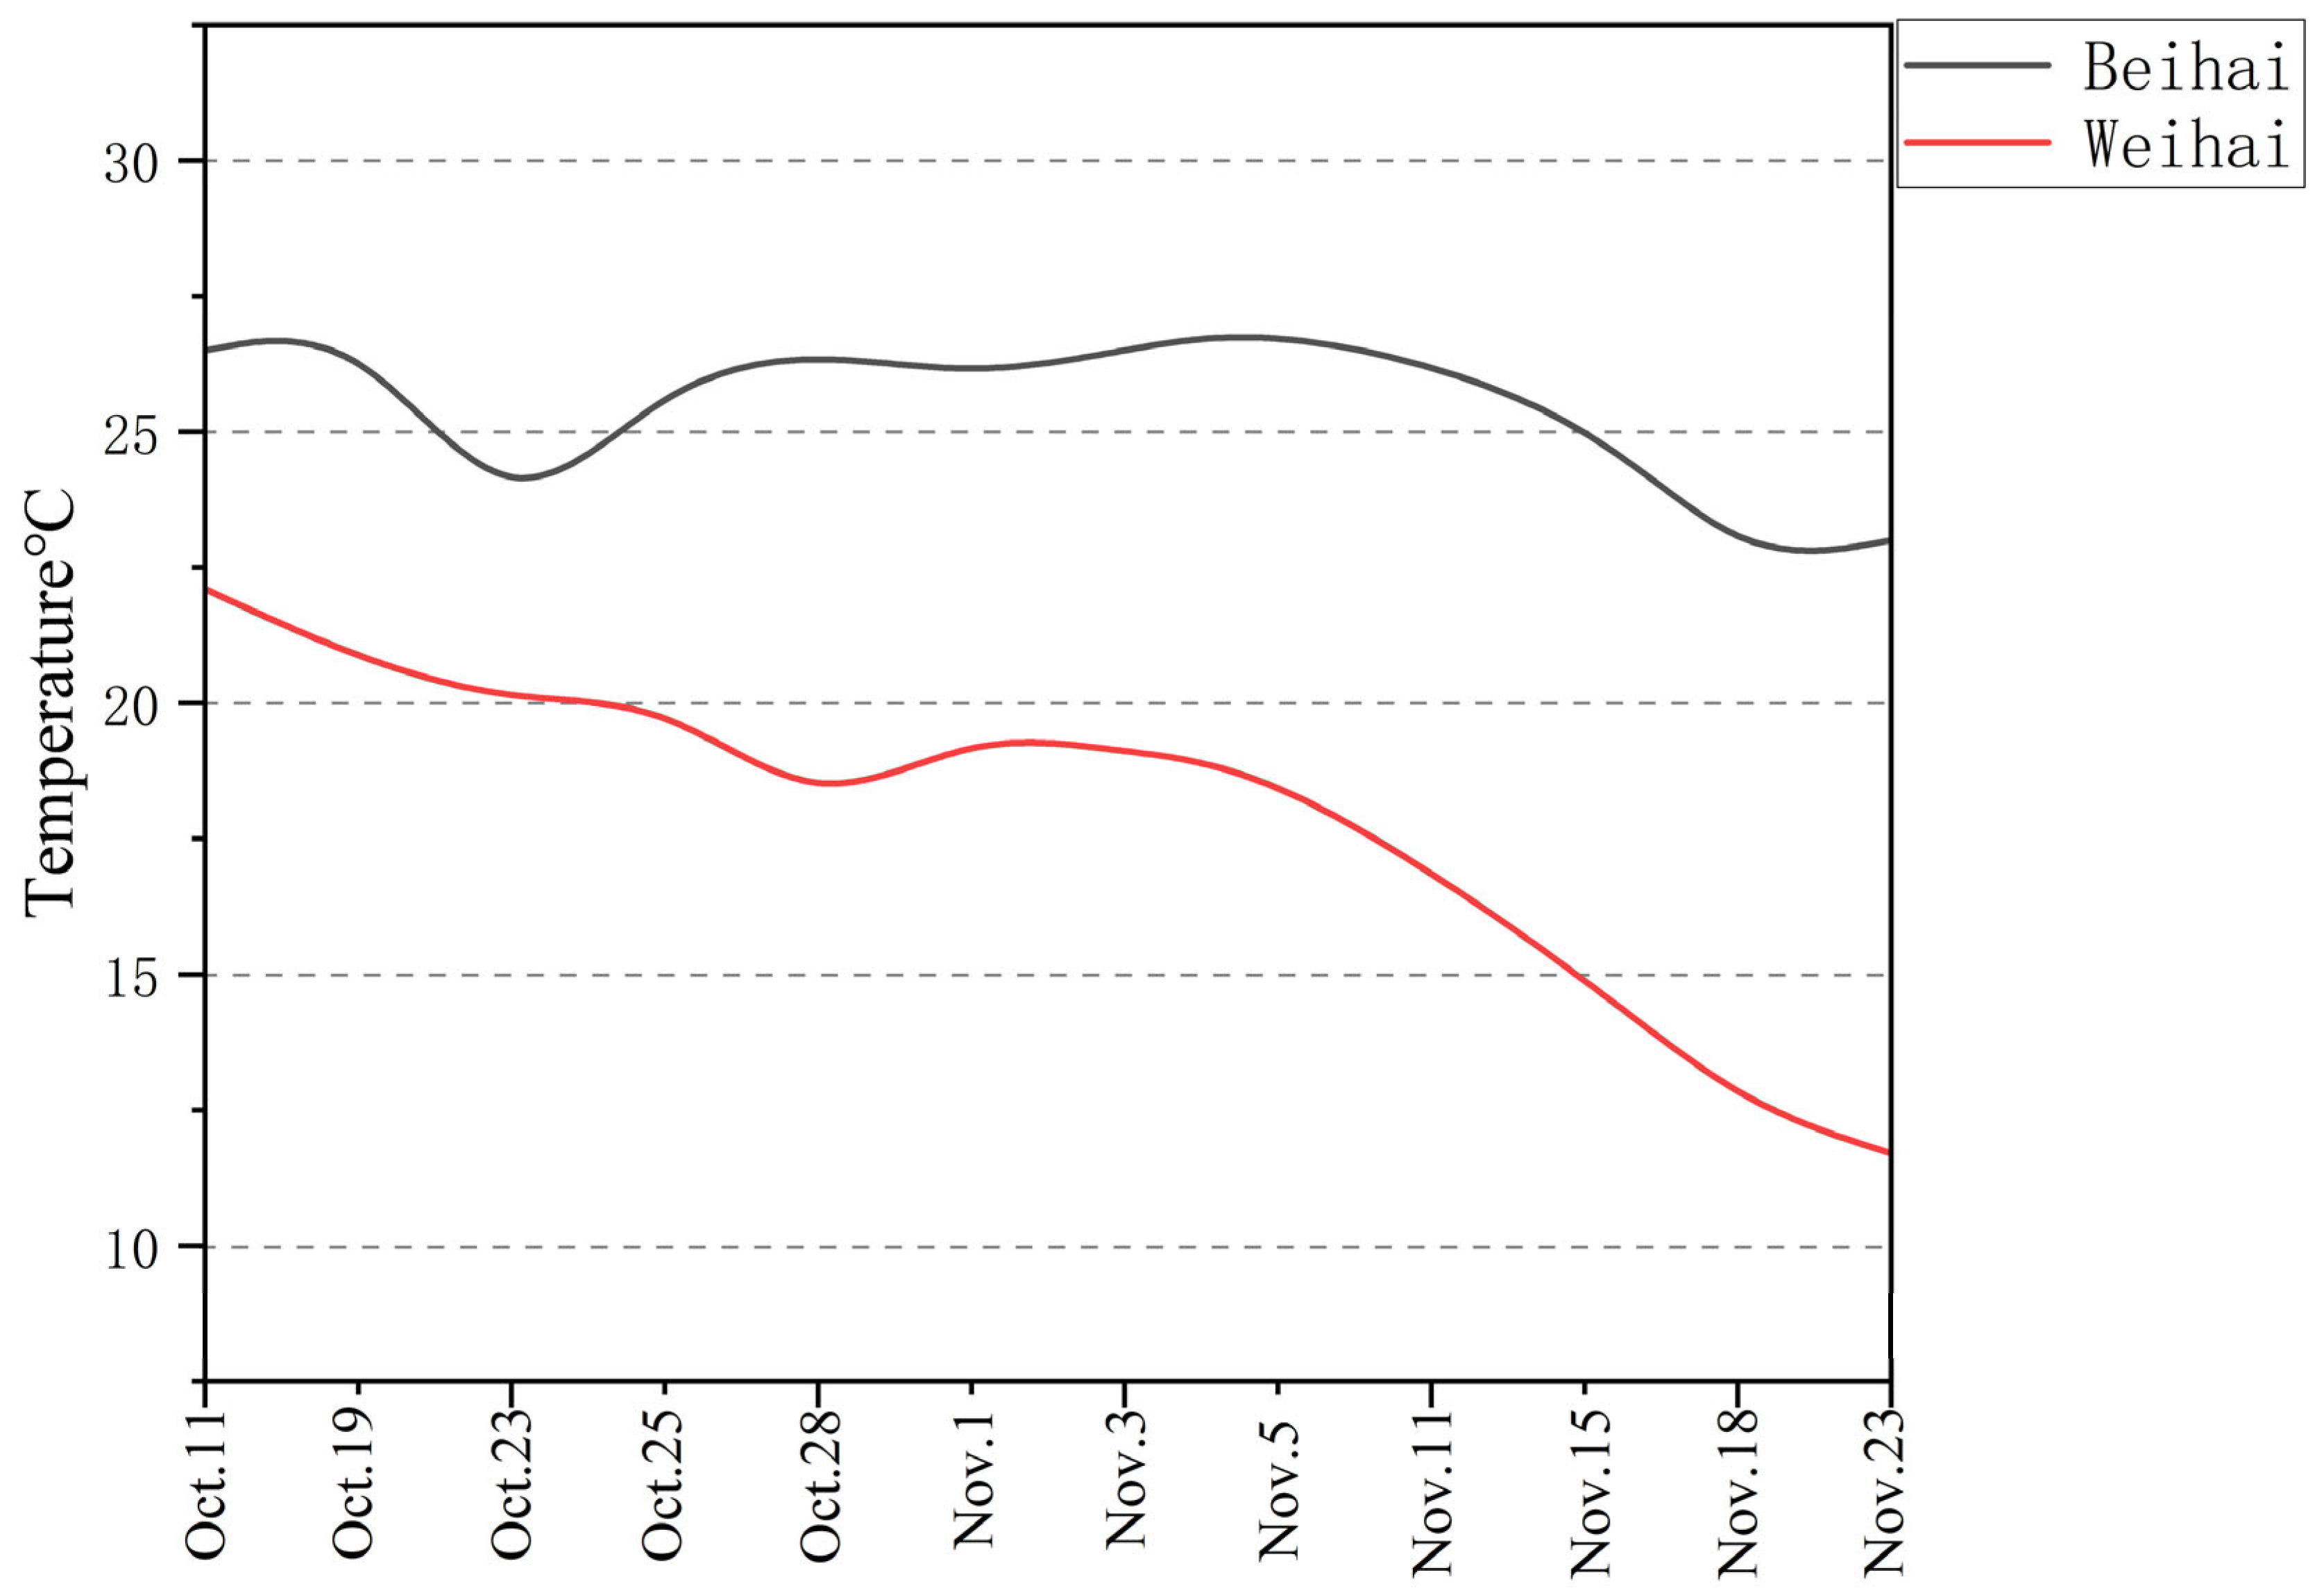
2. Production Locations
Farming Environment
3. Materials and Methods
3.1. Materials
3.2. Methods
3.2.1. Fourier Transform Infrared (FTIR) Spectroscopy
3.2.2. Ultraviolet-Visible (UV-Vis) Spectroscopy
3.2.3. Raman Spectroscopy
3.2.4. X-Ray Fluorescence (XRF) Spectroscopy
3.2.5. LA-ICP-MS Spectroscopy
4. Results and Discussion
4.1. Spectroscopy
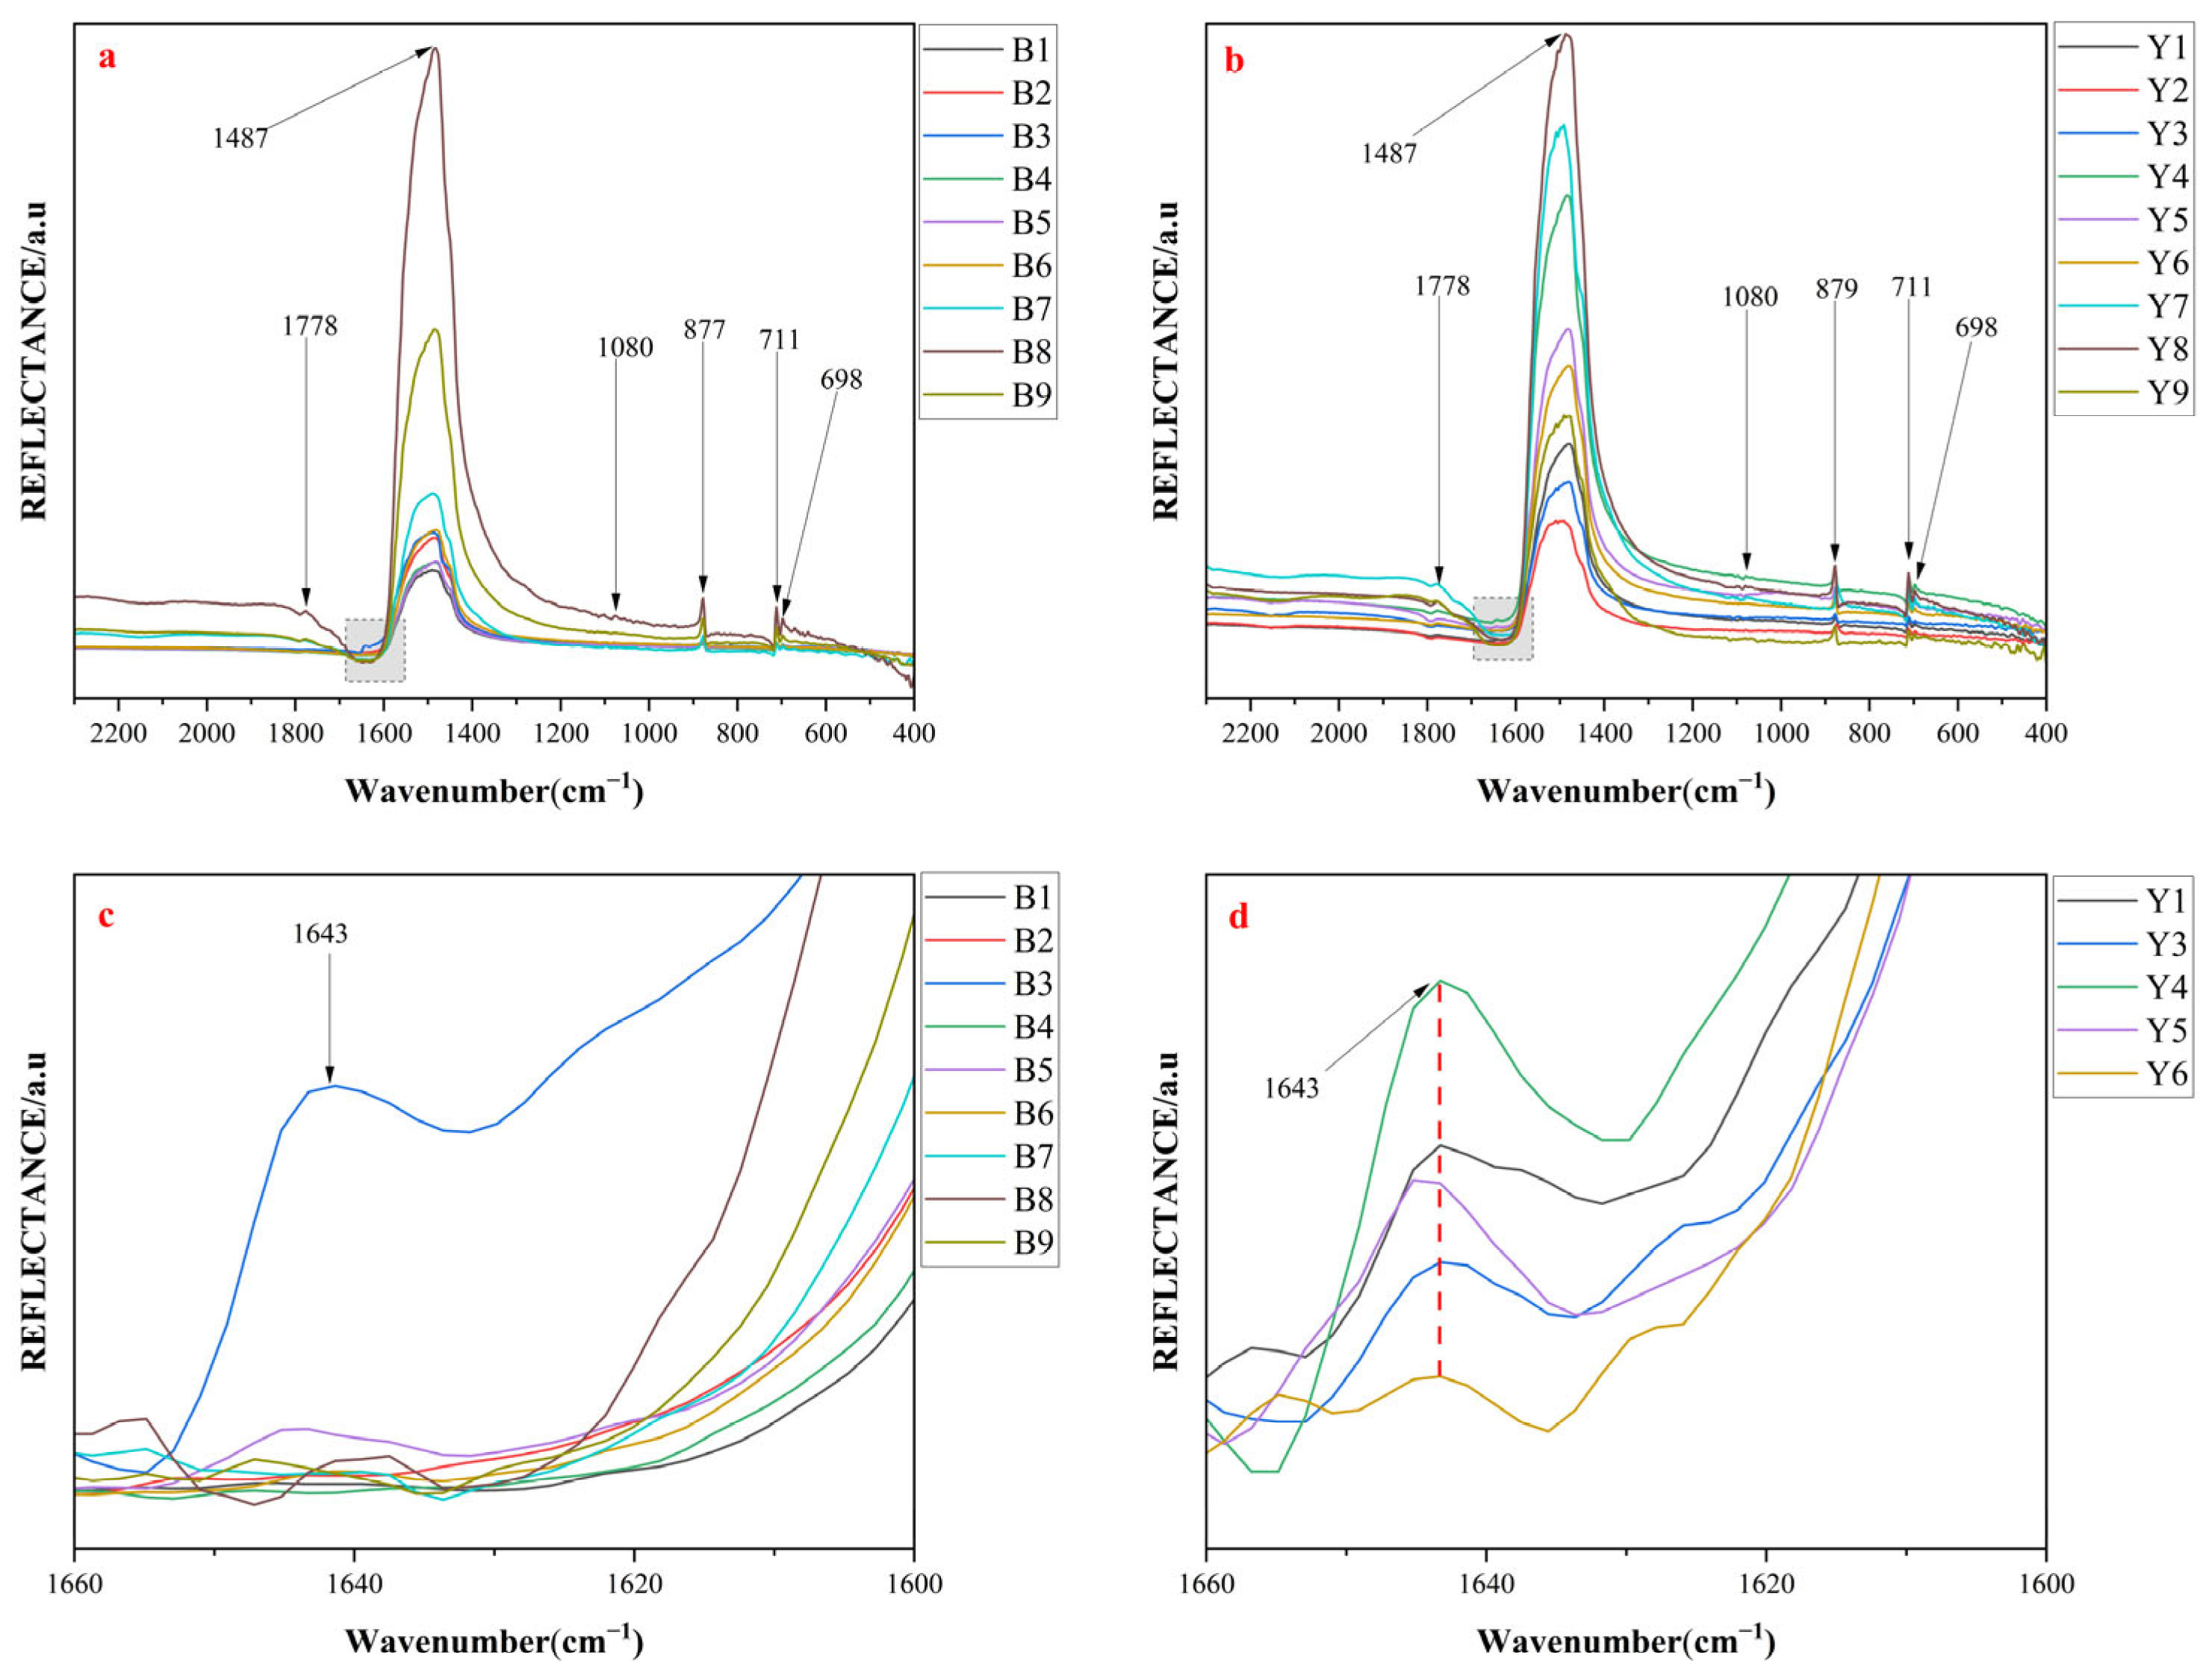
4.1.1. Infrared Spectra
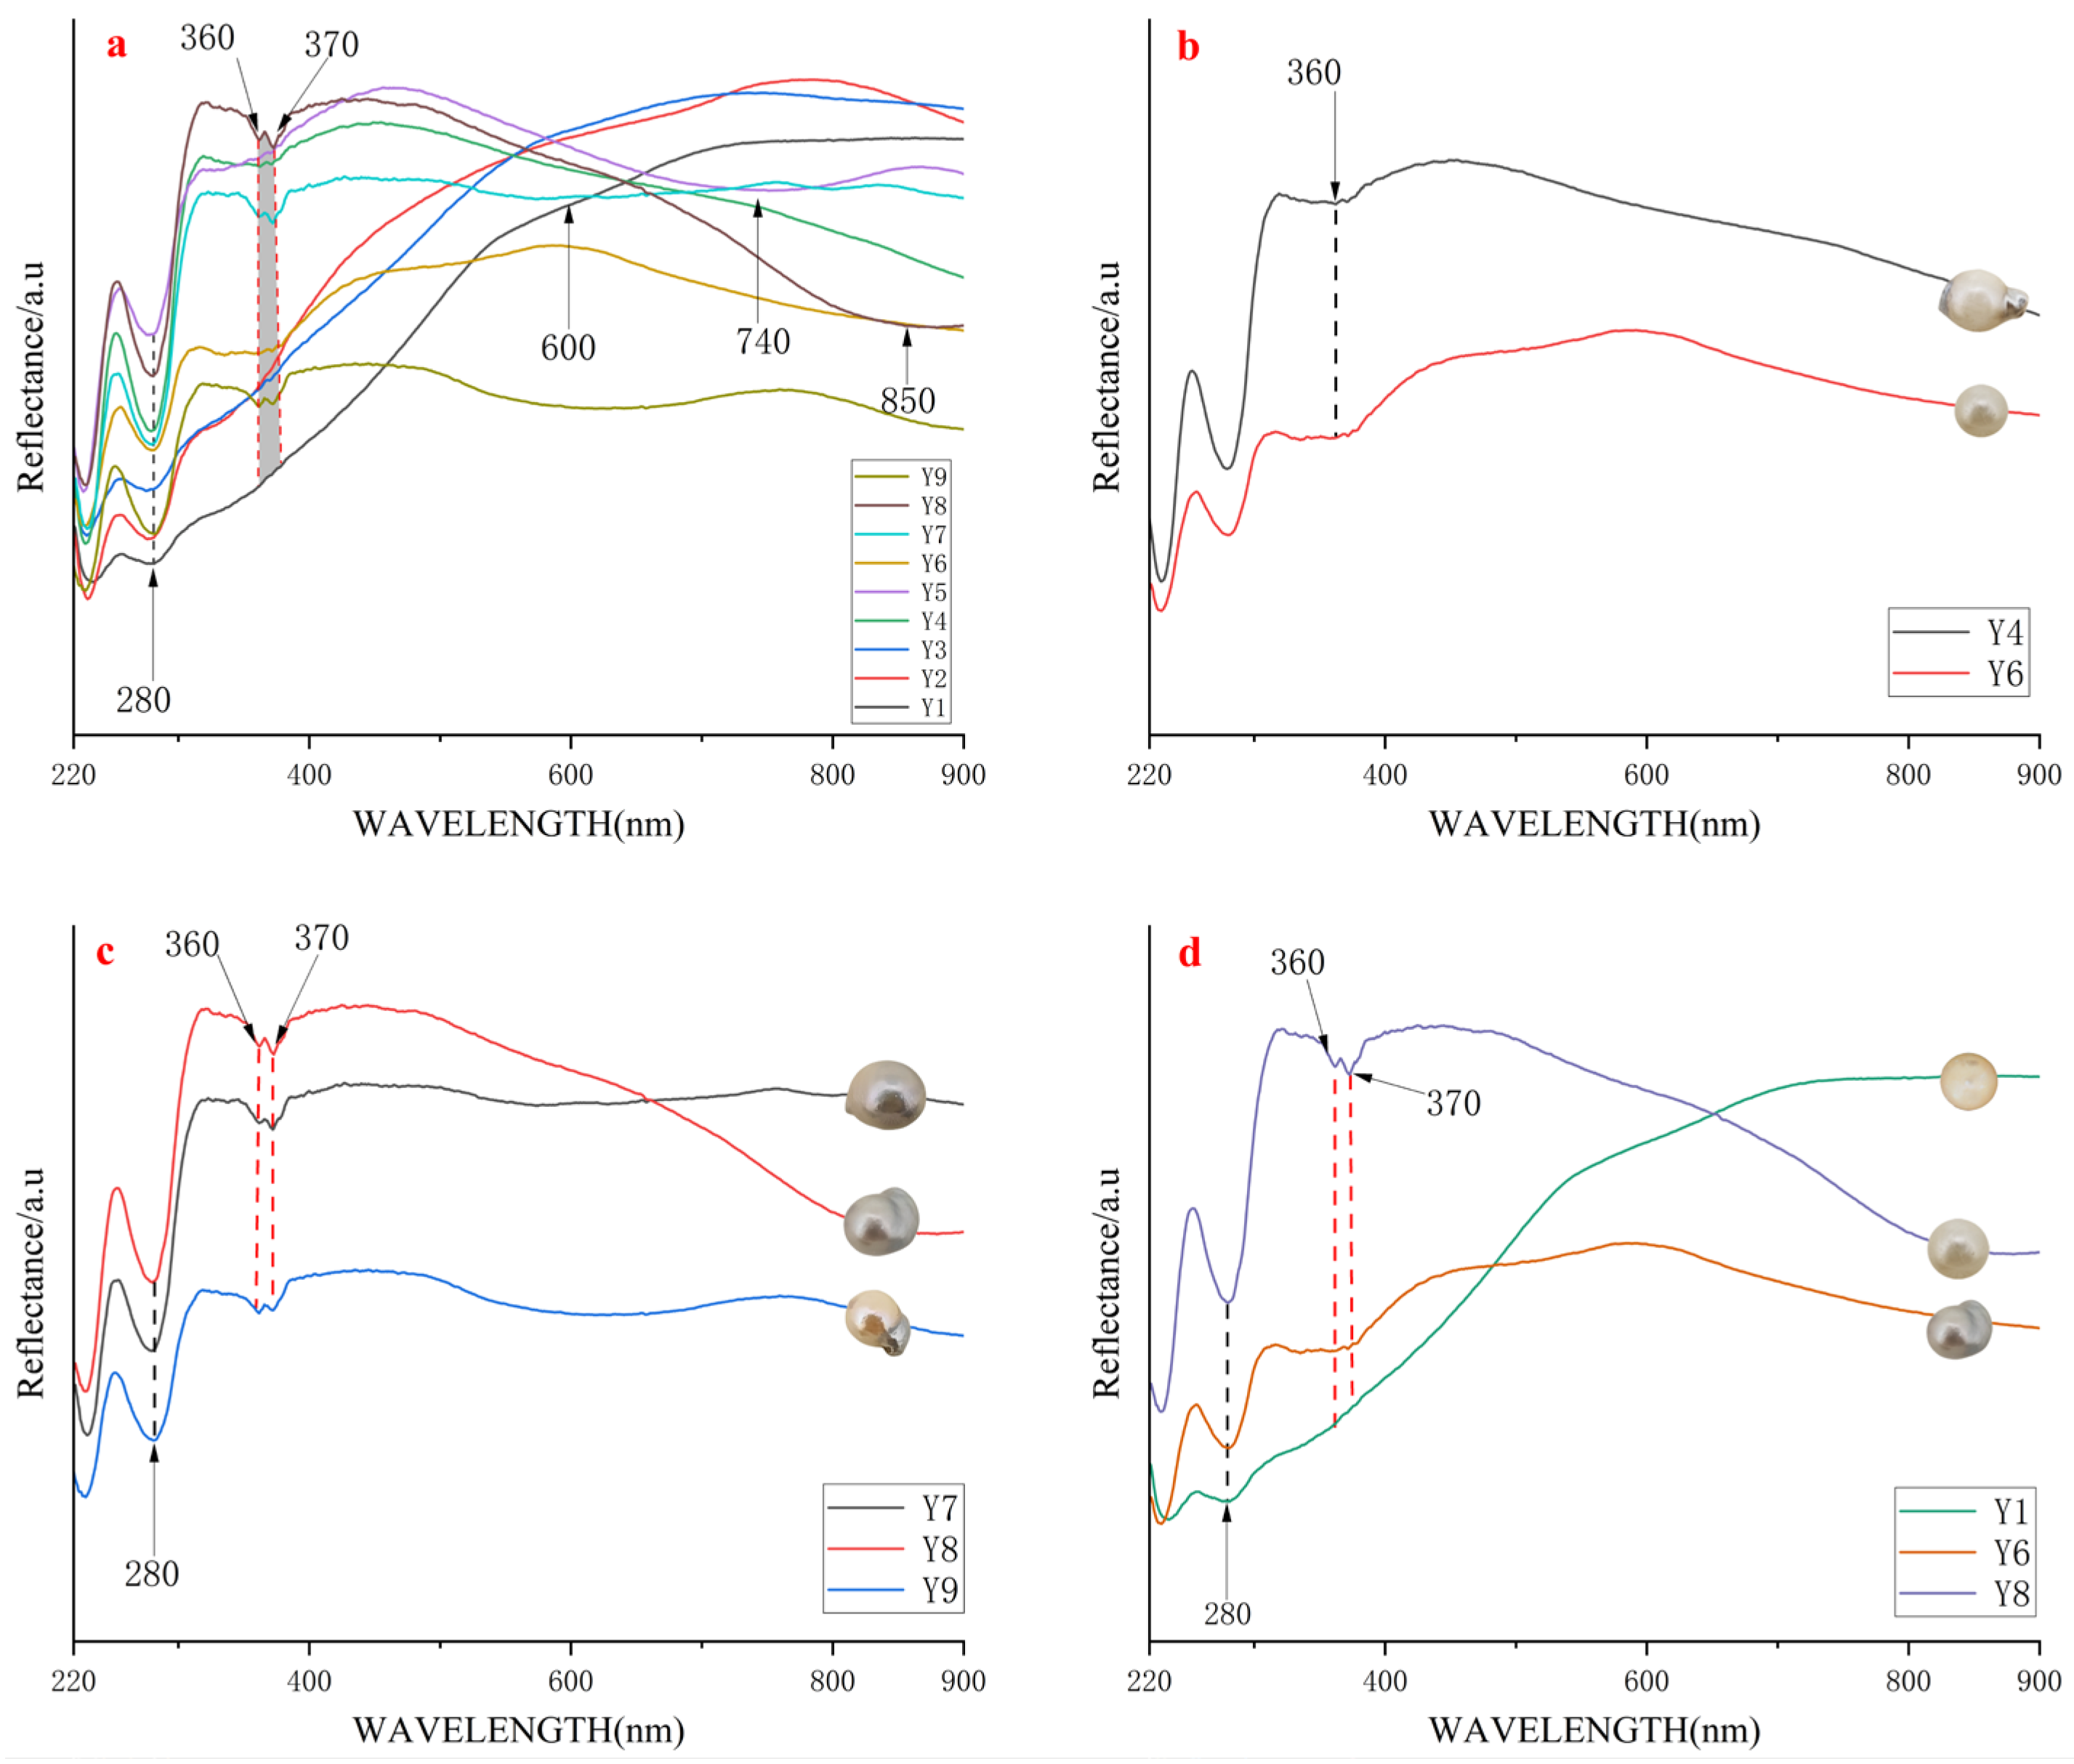
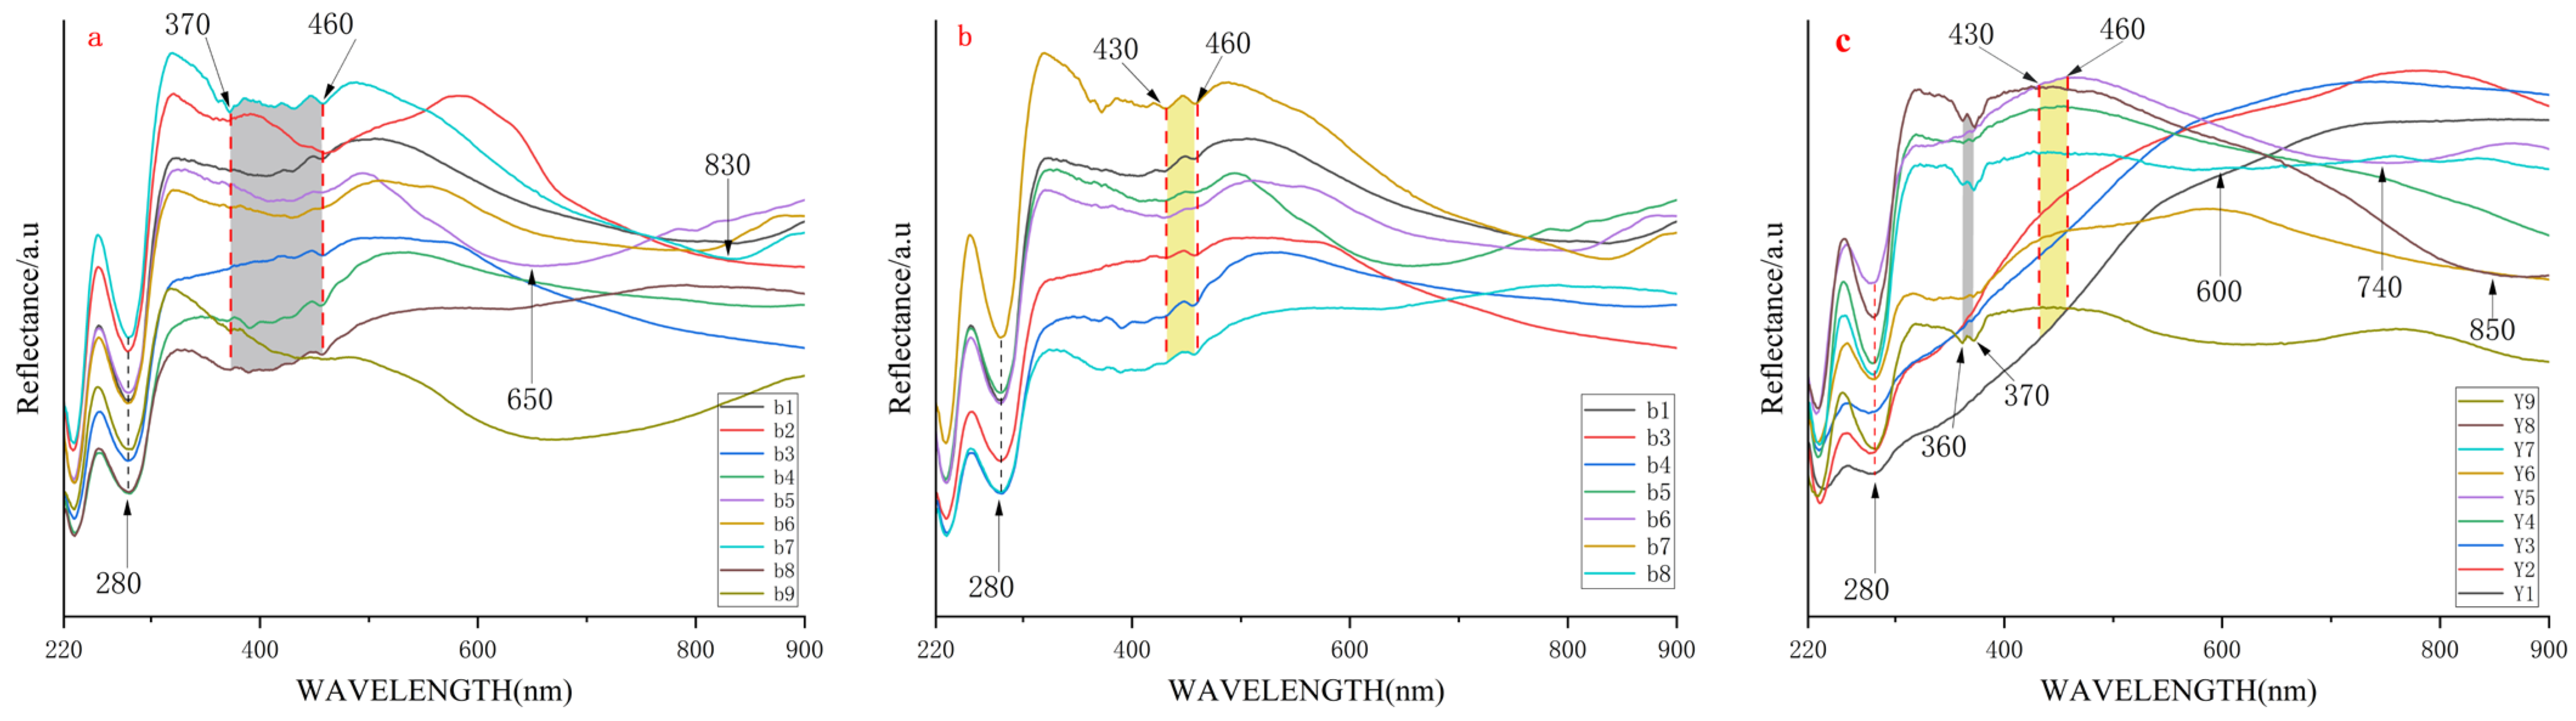
4.1.2. Ultraviolet-Visible Reflectance Spectrum
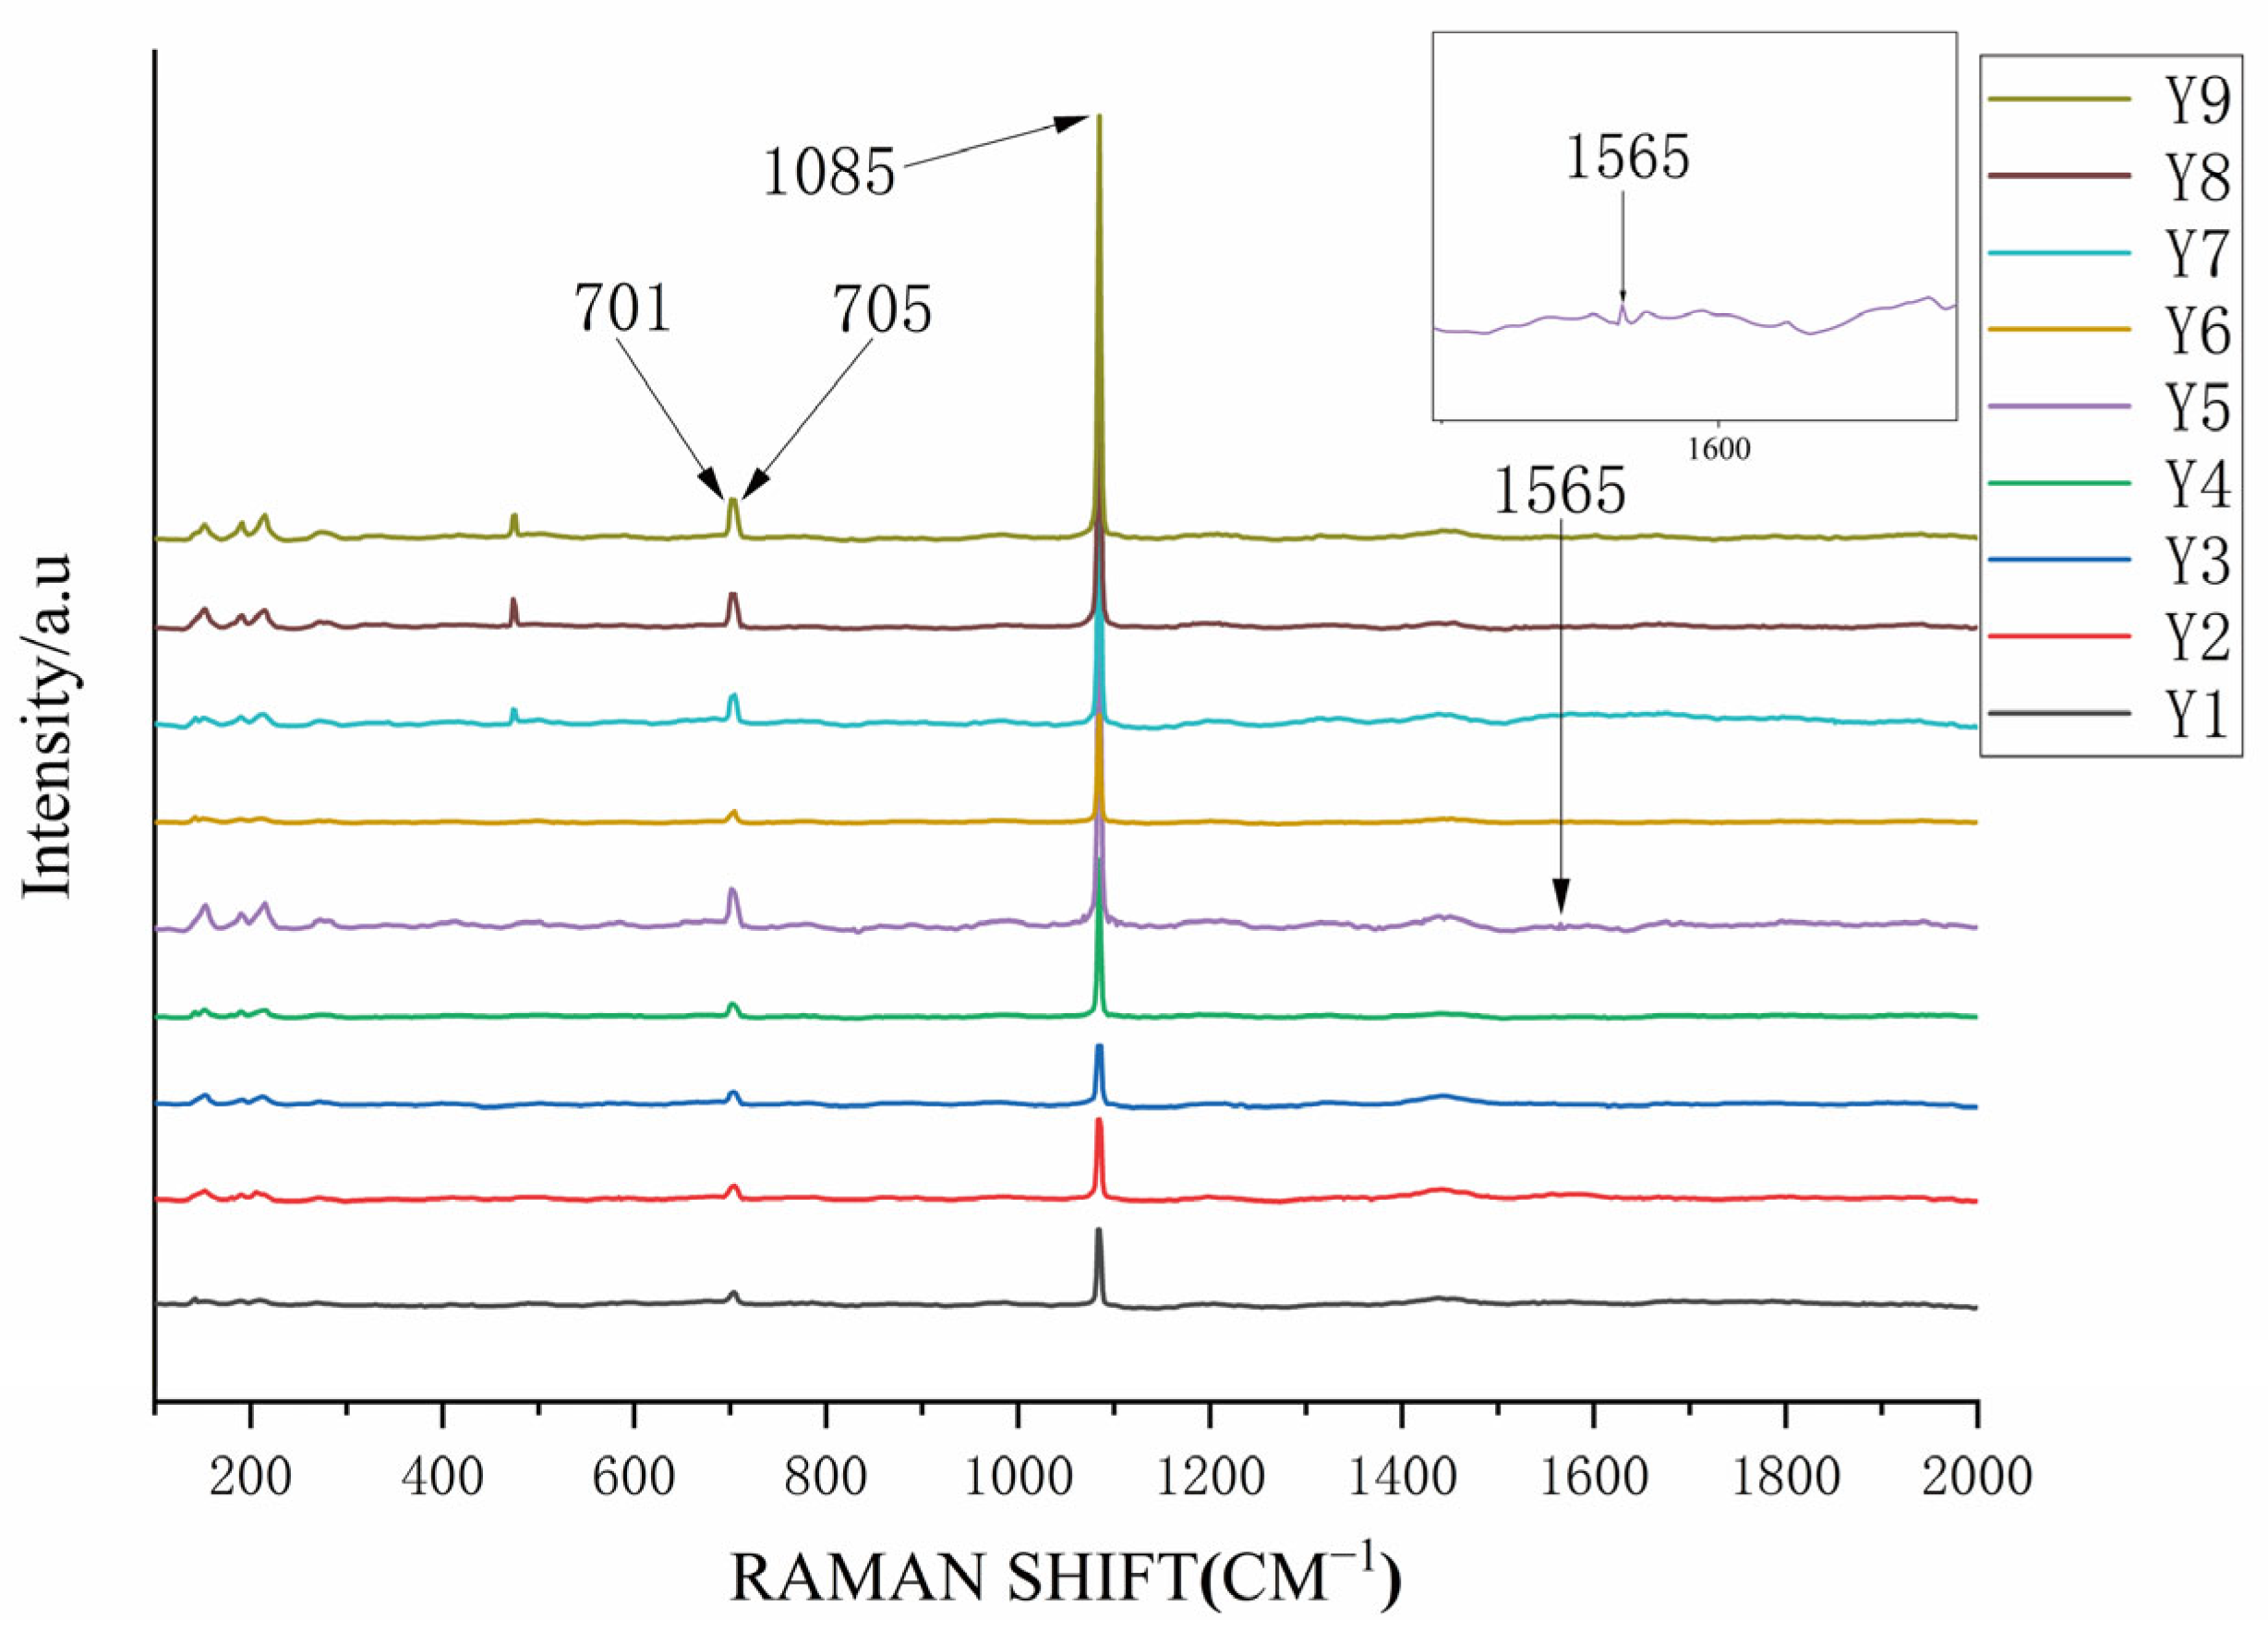
4.1.3. Raman Spectra Analysis
4.2. Trace Element Analysis
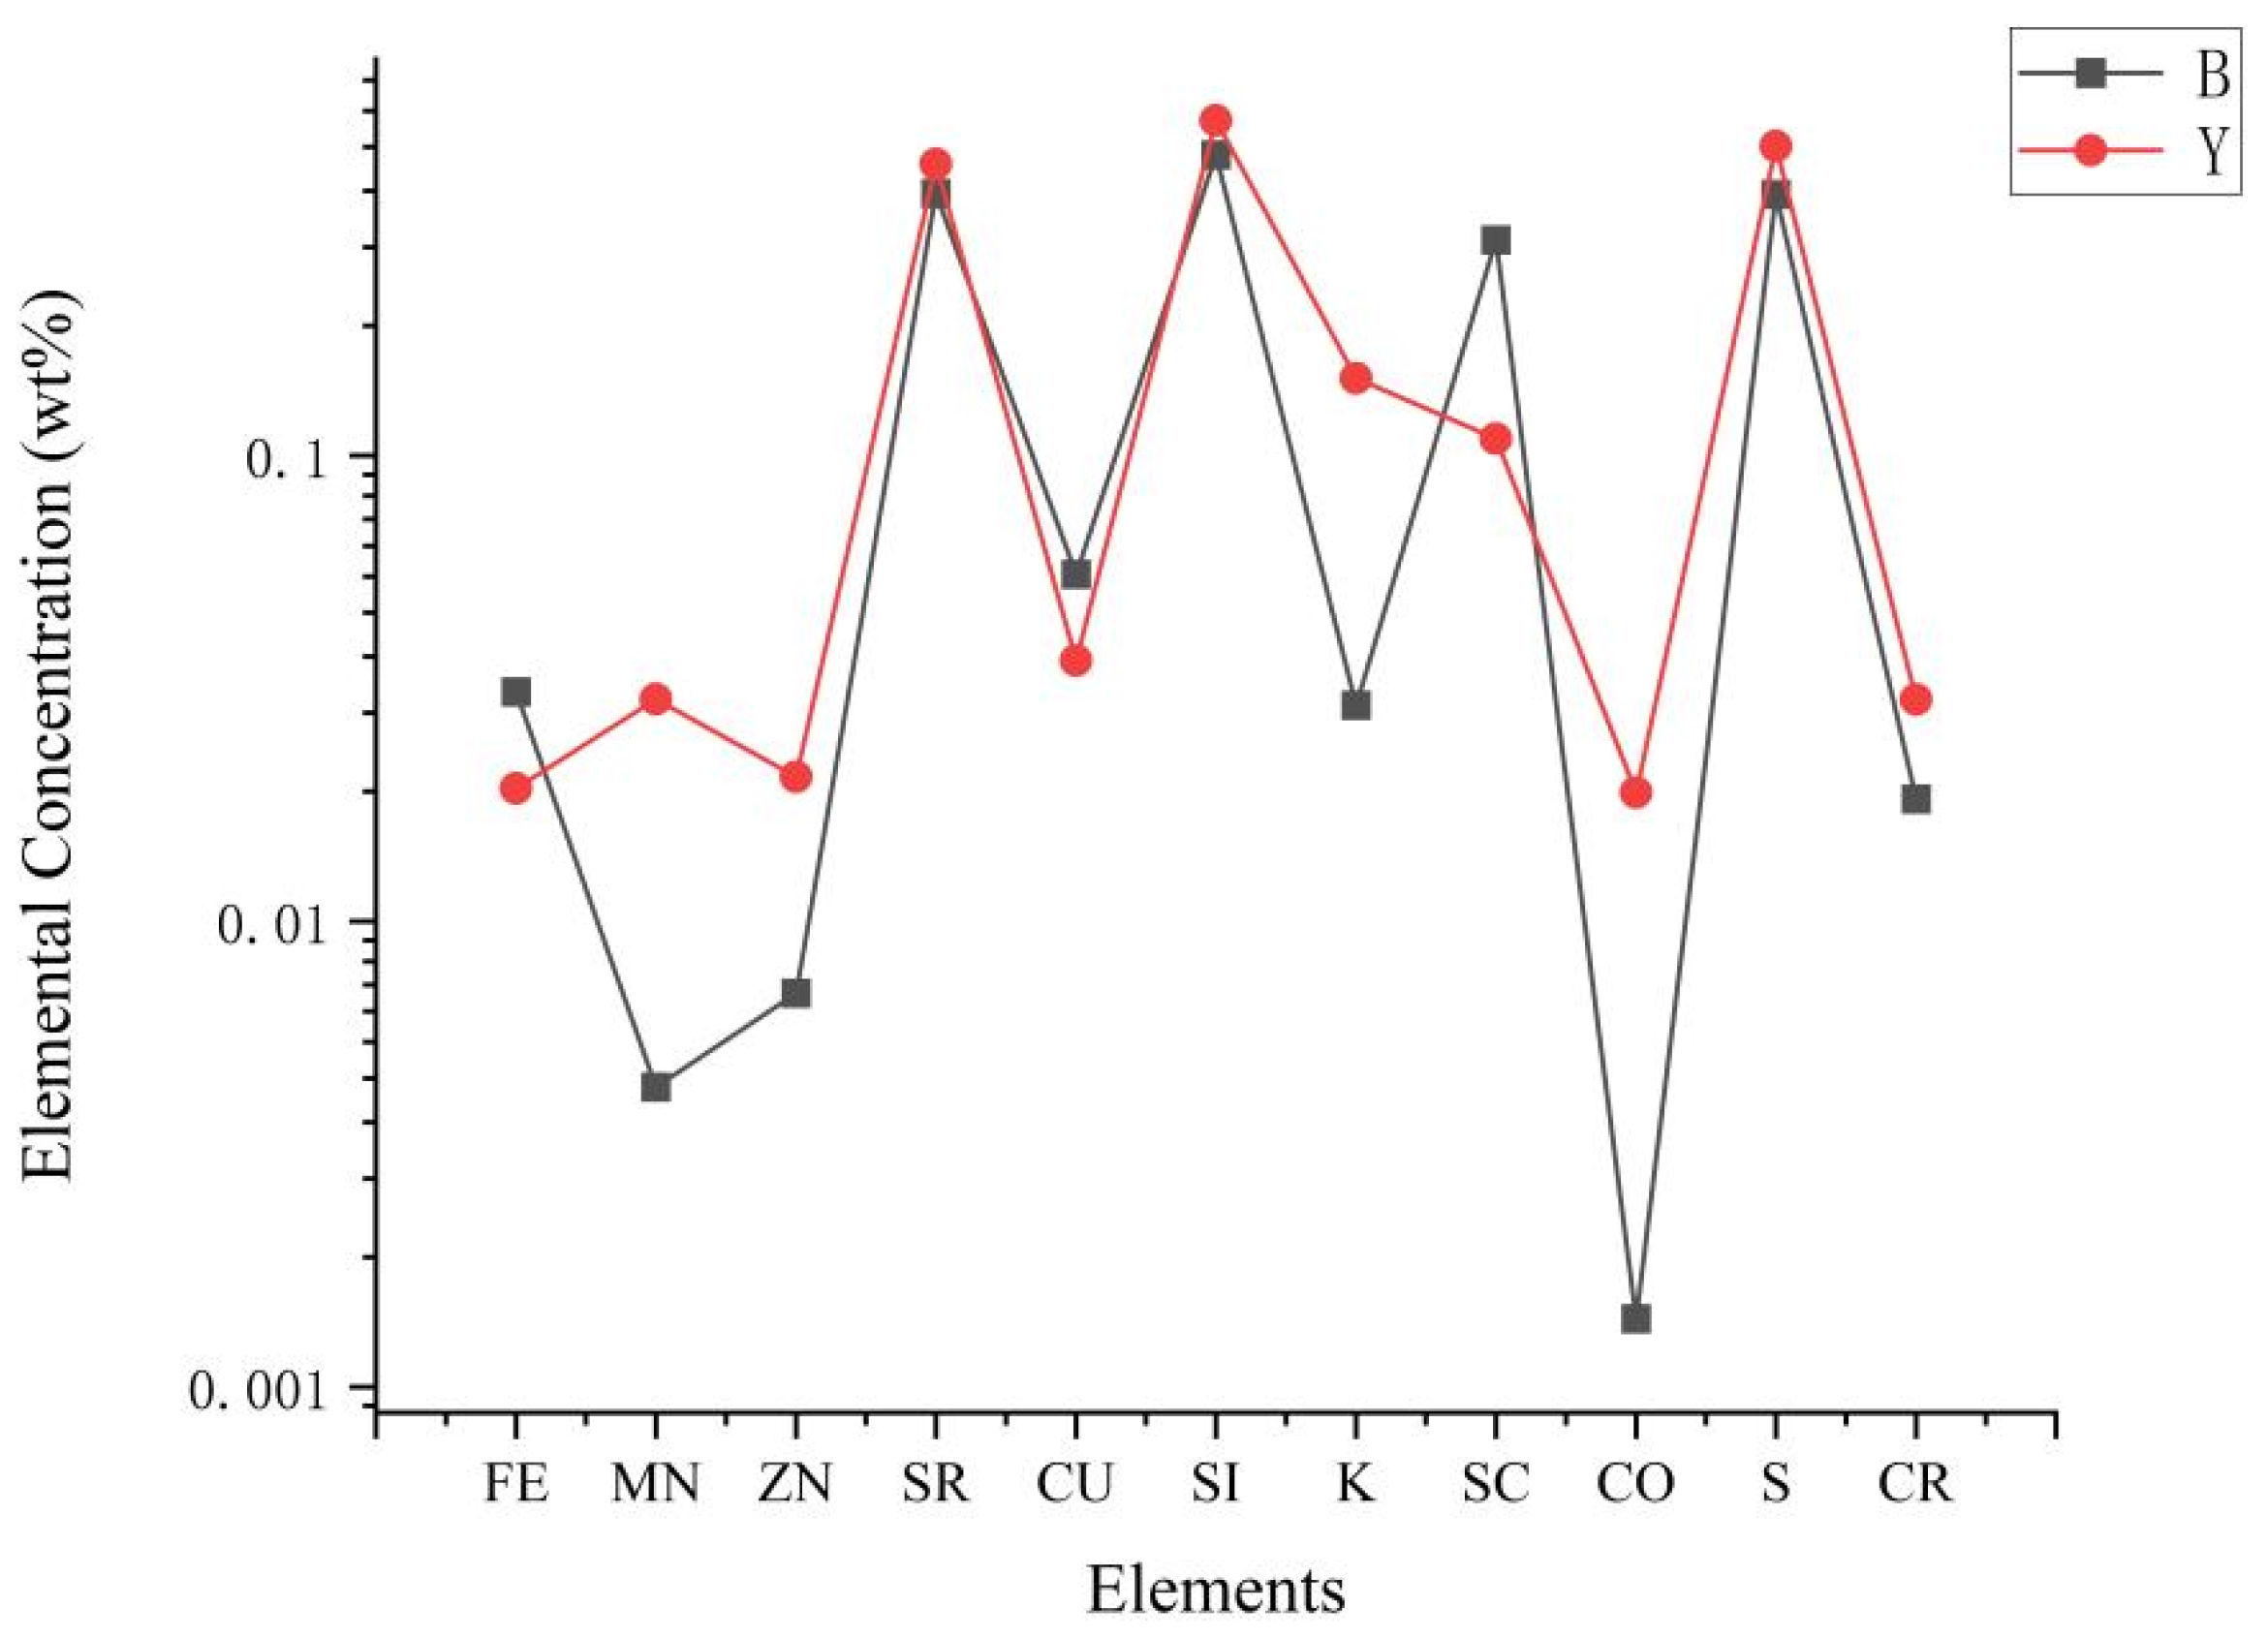
4.2.1. X-Ray Fluorescence (XRF)
4.2.2. LA-ICP-MS
5. Conclusions
Author Contributions
Funding
Data Availability Statement
Acknowledgments
Conflicts of Interest
References
- Homkrajae, A. Remarkably large akoya bead cultured pearls. Gems Gemol. 2024, 60. [Google Scholar]
- Dobrian, J. Pearl Paradise takes akoyas from Chinese seas to market. Natl. Jewel. 2007, 101, 66. [Google Scholar]
- Liu, F.; Xu, H. History, current situation, and development strategies of southern pearls in Guangxi. Sci. Fish Farming 2014, 36, 1–3. (In Chinese) [Google Scholar]
- Guangxi Zhuang Autonomous Region Government. Historical Culture of Beihai Southern Pearls. 2019. Available online: http://www.gxzf.gov.cn/xwfbhzt/2019bhnzjjgjzzzxwfbh/bjzl_27614/t972187.shtml (accessed on 28 August 2024).
- Shirai, S. The Story of Pearls; Japan Publications Inc.: Tokyo, Japan, 1970; 132p. [Google Scholar]
- Song, Z.H.; Yu, X.H.; Zhang, X.H. Analysis of factors affecting the quality of cultured pearls. J. Gems Gemol. 2001, 3, 18–21. (In Chinese) [Google Scholar]
- Gunawan, M.; Atsumi, T.; Sunardi Komaru, A. Nacre growth and thickness of Akoya pearls from Japanese and hybrid Pinctada fucata in response to the aquaculture temperature condition in Ago Bay, Japan. Aquaculture 2017, 477, 35–42. [Google Scholar]
- Miyazaki, T.; Nozawa, N.; Kobayashi, T. Clinical trial results on the use of a recombinant feline interferon-ω to protect Japanese pearl oysters Pinctada fucata martensii from Akoya-virus infection. Dis. Aquat. Org. 2000, 43, 15–26. [Google Scholar] [CrossRef]
- Miyazaki, T.; Goto, K.; Kobayashi, T.; Kageyama, T.; Miyata, M. Mass mortalities associated with a virus disease in Japanese pearl oysters Pinctada fucata martensii. Dis. Aquat. Org. 1999, 37, 1–12. [Google Scholar] [CrossRef]
- Wada, K.T. The Japanese experience: Pearl oyster mortalities and constraints. In Pearl Oyster Health Management; Bondad-Reantaso, M., McGladdery, S., Berthe, F., Eds.; Food and Agriculture Organization of the United Nations: Rome, Italy, 2007; pp. 95–102. [Google Scholar]
- Food and Agriculture Organization (FAO). Pearl Oyster Farming and Pearl Culture. 1991. Available online: http://www.fao.org (accessed on 15 February 2016).
- Hashimoto, N.; Matsuyama, T.; Iwahashi, Y.; Nagai, K. Effects of water temperature and infection history on the severity of summer atrophy in juvenile Akoya pearl oyster Pinctada fucata martensii. Fish. Sci. 2025, 91, 301–310. [Google Scholar] [CrossRef]
- Jafari, F.; Naeemi, A.S.; Sohani, M.M.; Noorinezhad, M. Effect of elevated temperature, sea water acidification, and phenanthrene on the expression of genes involved in the shell and pearl formation of economic pearl oyster (Pinctada radiata). Mar. Pollut. Bull. 2023, 196, 115603. [Google Scholar] [CrossRef]
- Choi, Y.J.; Hwang, J.; Baeck, G.W.; Kim, M.C.; Park, H.J.; Choi, B.D.; Kang, S.J.; Park, C.I. Haemocytes responses of the pearl oyster, Pinctada fucata, at different temperatures. Korean J. Fish. Pathol. 2008, 21, 241–246. [Google Scholar]
- Yang, J.; Fu, Z.; Yu, G.; Ma, Z.; Wang, X. Combined effects of temperature and salinity on antioxidants in the immune system of the pearl oyster Pinctada fucata. Fishes 2022, 7, 260. [Google Scholar] [CrossRef]
- Latchere, O.; Mehn, V.; Gaertner-Mazouni, N.; Le Moullac, G.; Fievet, J.; Belliard, C.; Cabral, P.; Saulnier, D. Influence of water temperature and food on the last stages of cultured pearl mineralization from the black-lip pearl oyster Pinctada margaritifera. PLoS ONE 2018, 13, e0193861. [Google Scholar] [CrossRef] [PubMed]
- Saruwatari, K. “Sango pearl” from Japan. Gems Gemol. 2017, 53, 251–254. [Google Scholar]
- Sturman, N.; Lawanwong, K.; Kitdee, N.; Chodhry, D. Vietnam: Shell nuclei, pearl hatcheries, and pearl farming. Gems Gemol. 2020, 56, 402–415. [Google Scholar] [CrossRef]
- Zhao, X.J.; Li, L.P.; Chen, Z.M.; Li, S.Q. Spectroscopic and compositional characteristics of white “freshwater Akoya pearls” and Akoya pearls. J. Gems Gemol. 2023, 25, 32–41. (In Chinese) [Google Scholar]
- Sakakura, I.; Tsuchida, H.; Sasaki, Y.; Hayashii, H. Elemental analysis of cultured pearls by PIXE. Int. J. PIXE 2017, 27, 93–99. [Google Scholar] [CrossRef]
- Aoki, H. Development of practical techniques for production of high quality Akoya pearls. Nippon. Suisan Gakkaishi 2015, 81, 788–791. [Google Scholar] [CrossRef]
- Chen, C.Y.; Zhu, Y.; Wu, J.; Zhou, W.; Chen, Y.; Yan, X.; Yan, J. Gemmological and spectral characteristics of natural and treated yellow Akoya pearls. J. Gems Gemmol. 2024, 26, 49–58. [Google Scholar]
- Kripa, V.; Mohamed, K.S.; Appukuttan, K.K.; Velayudhan, T.S. Production of Akoya pearls from the southwest coast of India. Aquaculture 2007, 262, 347–354. [Google Scholar] [CrossRef]
- Nair, M.R.; Velayudhan, T.S.; Appukuttan, K.K. An overview of pearl farming in India. J. Shellfish. Res. 2004, 23, 305. [Google Scholar]
- Fukushima, E.; Iwai, K.; Miura, C.; Celino, F.T.; Urasaki, S.; Miura, T. A xenograft mantle transplantation technique for producing a novel pearl in an Akoya oyster host. Mar. Biotechnol. 2014, 16, 10–16. [Google Scholar] [CrossRef] [PubMed]
- Fiske, D.; Shepherd, J. Chinese Akoya cultured pearls. Gems Gemol. 2007, 43, 171–172. [Google Scholar]
- Zhou, C.; Tsai, T.H.; Sturman, N.; Nilpetploy, N.; Manustrong, A.; Lawanwong, K. Optical whitening and brightening of pearls: A fluorescence spectroscopy study. Gems Gemol. 2020, 56, 258–265. [Google Scholar] [CrossRef]
- Beihai Municipal Bureau of Ecology and Environment. Beihai City Marine Environment Quality Bulletin. Available online: http://www.beihai.gov.cn (accessed on 23 March 2025).
- Weihai Municipal People’s Government. 2023 Weihai Marine Ecological Environment Status Bulletin. 2024. Available online: https://www.weihai.gov.cn (accessed on 23 March 2025).
- Yang, L.; Liu, Y.-M.; Xu, B.-J.; Wang, C.-Q.; Wu, T.; Xing, Q.-G.; Pei, K.; Wei, C.-M.; Zeng, S.-W.; Pan, Y. Intermediate culture and grow-out experiments of Dosinia japonica in Beihai, Fangchenggang, and Qinzhou sea areas. South China Fish. Sci. 2023, 19, 38–50. (In Chinese) [Google Scholar]
- Yang, L.-L.; Li, Y.-N.; Ruan, Z.; Heng, X.; Mu, F. Community characteristics and influencing factors of small benthic fauna on sandy beaches of Penglai and Weihai. J. Ocean. Limnol. Bull. 2023, 45, 116–122. [Google Scholar]
- Peje, B.S. Effect of Different Salinities on Filtration Rate, Growth and Survival of Pearl Oyster, Pinctada fucata (Gould, 1850) Juvenile. Ph.D. Thesis, Junagadh Agricultural University, Junagadh, India, 2012. [Google Scholar]
- Sun, J.; Chen, M.; Fu, Z.; Yang, J.; Zhou, S.; Yu, G.; Zhou, W.; Ma, Z. A Comparative Study on Low and High Salinity Tolerance of Two Strains of Pinctada fucata. Front. Mar. Sci. 2021, 8, 688053. [Google Scholar] [CrossRef]
- Zhao, L.H.; Sun, D.Y.; Hu, M.Y.; Zhan, X.C.; Zeng, L.S. Quantitative analysis using laser ablation inductively coupled plasma mass spectrometry with small spot size and line-scan technique. Chin. J. Anal. Chem. 2018, 46, 931–937. (In Chinese) [Google Scholar]
- Balmain, J.; Hannoyer, B.; Lopez, E. Fourier transform infrared spectroscopy (FTIR) and X-ray diffraction analyses of mineral and organic matrix during heating of mother of pearl (nacre) from the shell of the mollusc Pinctada maxima. J. Biomed. Mater. Res. Part. B Appl. Biomater. 1999, 48, 749–754. [Google Scholar] [CrossRef]
- Zhang, X.; Hu, C.; Yan, Y.; Yang, H.F.; Li, J.F.; Bai, H.; Xi, G.C.; Liao, J. Identification of pearl powder using microscopic infrared reflectance spectroscopy. Guang Pu Xue Yu Guang Pu Fen Xi 2014, 34, 2424–2428. [Google Scholar]
- Andersen, F.A.; Brečević, L. Infrared spectra of amorphous and crystalline calcium carbonate. Acta Chem. Scand. 1991, 45, 1018–1024. [Google Scholar] [CrossRef]
- Ma, Y.F.; Gao, Y.H.; Feng, Q.L. Characterization of organic matrix extracted from freshwater pearls. Mater. Sci. Eng. C Biomim. Mater. Sens. Syst. 2011, 31, 1338–1342. [Google Scholar] [CrossRef]
- Marxen, J.C.; Hammer, M.; Gehrke, T.; Becker, W. Carbohydrates of the Organic Shell Matrix and the Shell-Forming Tissue of the Snail Biomphalaria glabrata (Say). Biol. Bull. 1998, 194, 231–240. [Google Scholar] [CrossRef] [PubMed]
- Carteret, C.; De La Pierre, M.; Dossot, M.; Pascale, F.; Erba, A.; Dovesi, R. The vibrational spectrum of CaCO₃ aragonite: A combined experimental and quantum-mechanical investigation. J. Chem. Phys. 2013, 138, 014201. [Google Scholar] [CrossRef]
- Agbaje, O.B.A.; Le, T.-T.H.; Häger, T.; Jacob, D.E. Akoya cultured pearl farming in eastern Australia. Gems Gemol. 2017, 53, 423–437. [Google Scholar]
- Yan, J.; Zhang, J.; Tao, J.; Hu, D.; Peng, Q.; Sheng, J. Origin of the common UV absorption feature in cultured pearls and shells. J. Mater. Sci. 2017, 52, 8362–8369. [Google Scholar] [CrossRef]
- Mamangkey, N.G.F.; Agatonovic, S.; Southgate, P.C. Assessing pearl quality using reflectance UV-Vis spectroscopy: Does the same donor produce consistent pearl quality? Mar. Drugs 2010, 8, 2517–2525. [Google Scholar] [CrossRef] [PubMed]
- Jin, S.; Renfro, N.D.; Palke, A.C.; Ardon, T.; Homkrajae, A. Application of UV-VIS-NIR Spectroscopy to Gemology. Gems Gemol. 2024, 60, 456–473. [Google Scholar] [CrossRef]
- Yan, X.; Liu, X.; Zhou, W.; Zhou, D.; Liu, P.; Chen, T.; Yan, J. The gemological characteristics of yellow seawater bead-cultured pearls farmed in Beihai City, southern China. Micron 2024, 176, 103558. [Google Scholar] [CrossRef]
- Urmos, J.; Sharma, S.K.; Mackenzie, F.T. Characterization of some biogenic carbonates with Raman spectroscopy. Am. Mineral. 1991, 76, 641–646. [Google Scholar]
- Nemecek, D.; Stepanek, J.; Thomas, G.J. Raman spectroscopy of proteins and nucleoproteins. Curr. Protoc. Protein Sci. 2013, 71, 17.8.1–17.8.52. [Google Scholar] [CrossRef]
- Karampelas, S. Spectral characteristics of natural-color saltwater cultured pearls from Pinctada maxima. Gems Gemol. 2012, 48, 193–197. [Google Scholar] [CrossRef]
- Daher, C. Raman and Infrared Spectroscopies Analysis of Natural Organic Media of Cultural Heritage Interests: Methodological Approach and Applications. Ph.D. Thesis, Université Pierre et Marie Curie—Paris VI, Paris, France, 2012. [Google Scholar]
- Parker, F.S. Biochemical applications of infrared and Raman spectroscopy. Appl. Spectrosc. 1975, 29, 129–147. [Google Scholar] [CrossRef]
- Karampelas, S.; Fritsch, E.; Mevellec, J.Y.; Gauthier, J.P.; Sklavounos, S.; Soldatos, T. Determination by Raman scattering of the nature of pigments in cultured freshwater pearls from the mollusk Hyriopsis cumingi. J. Raman Spectrosc. 2008, 38, 217–230. [Google Scholar] [CrossRef]
- Soldati, A.L.; Jacob, D.E.; Wehrmeister, U.; Häger, T.; Hofmeister, W. Micro-Raman spectroscopy of pigments contained in different calcium carbonate polymorphs from freshwater cultured pearls. J. Raman Spectrosc. 2008, 39, 525–536. [Google Scholar] [CrossRef]
- Karampelas, S.; Fritsch, E.; Makhlooq, F.; Mohamed, F.; Al-Alawi, A. Raman spectroscopy of natural and cultured pearls and pearl-producing mollusc shells. J. Raman Spectrosc. 2019, 51, 1813–1821. [Google Scholar] [CrossRef]
- Ho, J.W.Y. Large natural quahog pearl. Gems Gemol. 2015, 51, 63–64. [Google Scholar]
- Gütmannsbauer, W.; Hänni, H.A. Structural and chemical investigations on shell and pearls of nacre-forming salt- and freshwater bivalve mollusks. J. Gemmol. 1994, 24, 241–252. [Google Scholar] [CrossRef]
- Karampelas, S.; Kiefert, L. Gemstones and minerals. In Analytical Archaeometry: Selected Topics, 1st ed.; Edwards, H.G.M., Vandenabeele, P., Eds.; Royal Society of Chemistry: London, UK, 2012; pp. 291–317. ISBN 978-1-84973-162-1. [Google Scholar]
- Zhou, C.; Hodgins, G.; Lange, T.; Saruwatari, K.; Sturman, N.; Kiefert, L.; Schollenbruch, K. Saltwater pearls from the pre- to early Columbian era: A gemological and radiocarbon dating study. Gems Gemol. 2017, 53, 286–295. [Google Scholar] [CrossRef]
- Yang, L.; Ouyang, X.X.; Li, S.D. Variation in Mg, Fe, Zn, and Mn contents in Chinese seawater pearls and their effects on pearl microstructure. Acta Mineral. Sinica 2014, 416–420. (In Chinese) [Google Scholar]


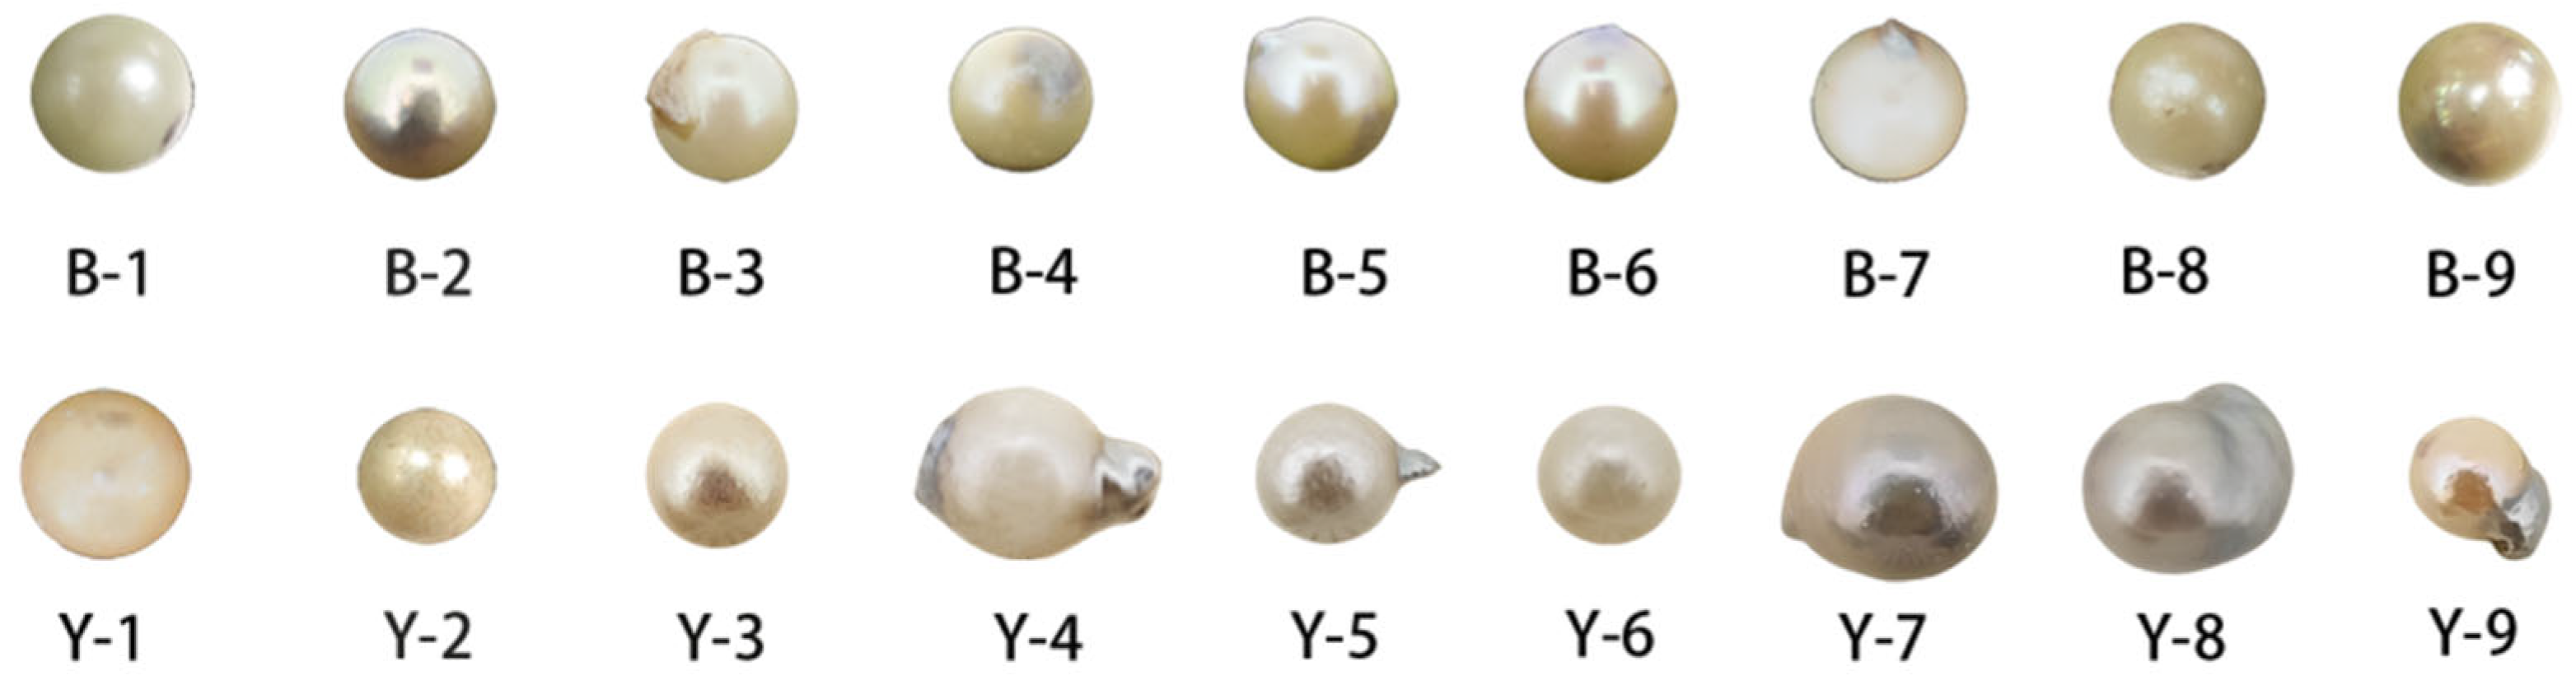
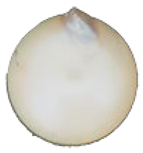
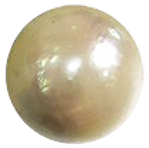
| Pearl Samples from Beihai, Guangxi | ||||||
|---|---|---|---|---|---|---|
| Photo | Sample ID | Diameter (mm) | Weight (ct) | Body Color | Luster | Surface Characteristics |
 | B1 | 5.93 | 1.7 | White | Good | Slight nacre overgrowth, smooth surface. |
 | B2 | 5.99 | 1.4 | White | Good | Presence of mixed-color overlay, smooth surface. |
 | B3 | 5.77 | 1.35 | Yellow | Good | Slight nacre overgrowth, smooth surface. |
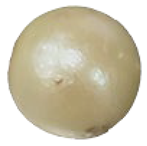 | B4 | 5.71 | 1.4 | White | Good | Presence of mixed-color overlay, smooth surface. |
 | B5 | 5.99 | 1.6 | Yellow | Good | Presence of mixed-color overlay, slight nacre overgrowth, smooth surface. |
 | B6 | 6 | 1.55 | Yellow | Good | Presence of mixed-color overlay, smooth surface. |
 | B7 | 5.82 | 1.65 | White | Good | Slight nacre overgrowth, smooth surface. |
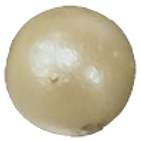 | B8 | 5.55 | 1.3 | Yellow | Good | Presence of mixed-color overlay, smooth surface. |
 | B9 | 6.1 | 1.62 | Yellow | Good | Presence of mixed-color overlay, smooth surface. |
 | Y1 | 5.41 | 1.25 | White | poor | White spots present, mixed-color overlay, smooth surface. |
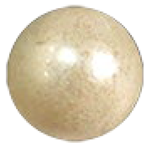 | Y2 | 5.33 | 1.2 | White | poor | Presence of mixed-color overlay, smooth surface. |
 | Y3 | 5.15 | 0.9 | White | Medium | Presence of mixed-color overlay. |
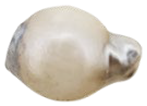 | Y4 | 7.09 | 2.75 | White | Good | Presence of mixed-color overlay, slight nacre overgrowth, smooth surface. |
 | Y5 | 5.30 | 1.15 | White | Medium | White spots present, presence of mixed-color overlay, slight nacre overgrowth. |
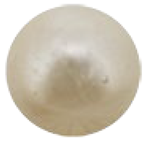 | Y6 | 5.32 | 1.1 | White | Medium | A few white spots present. |
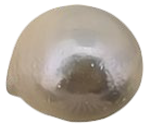 | Y7 | 6.57 | 1.84 | Gray | Good | Presence of mixed-color overlay, smooth surface. |
 | Y8 | 6.25 | 1.7 | Gray | Good | Slight nacre overgrowth, smooth surface. |
 | Y9 | 4.63 | 1.1 | Yellow | Good | Slight nacre overgrowth, smooth surface. |
| Sample | Peak 1 | Peak 2 | Peak 3 | Peak 4 | Peak 5 | Peak 6 |
|---|---|---|---|---|---|---|
| GourpB | 696 | 711 | 877 | 1080 | 1485 | 1776 |
| GourpY | 698 | 711 | 879 | 1080 | 1487 | 1776 |
| B | Y | |||||
|---|---|---|---|---|---|---|
| Element | Maximum | Minimum | Average | Maximum | Minimum | Average |
| Li7 | bdl | bdl | bdl | 3.389 | bdl | 0.977 |
| Be9 | 0.208 | bdl | 0.065 | 0.231 | bdl | 0.046 |
| B11 | 8.603 | 4.716 | 7.055 | 11.957 | 5.203 | 8.787 |
| Na23 | 6480.006 | 5523.272 | 6129.25 | 5477.346 | 4847.872 | 5097.639 |
| Mg24 | 281.892 | 119.848 | 174.64 | 461.67 | 228.371 | 317.826 |
| Al27 | 1.311 | bdl | 0.327 | 4.491 | bdl | 1.292 |
| Si29 | 1687.972 | 1192.162 | 1422.759 | 1422.293 | 1185.47 | 1276.714 |
| P31 | 106.731 | 56.076 | 75.066 | 133.551 | 69.409 | 101.49 |
| K39 | 103.149 | 54.164 | 78.986 | 413.189 | 62.713 | 218.568 |
| Sc45 | 0.234 | bdl | 0.108 | 0.234 | bdl | 0.06 |
| Ti49 | 0.441 | bdl | 0.074 | 2.878 | 0.387 | 1.843 |
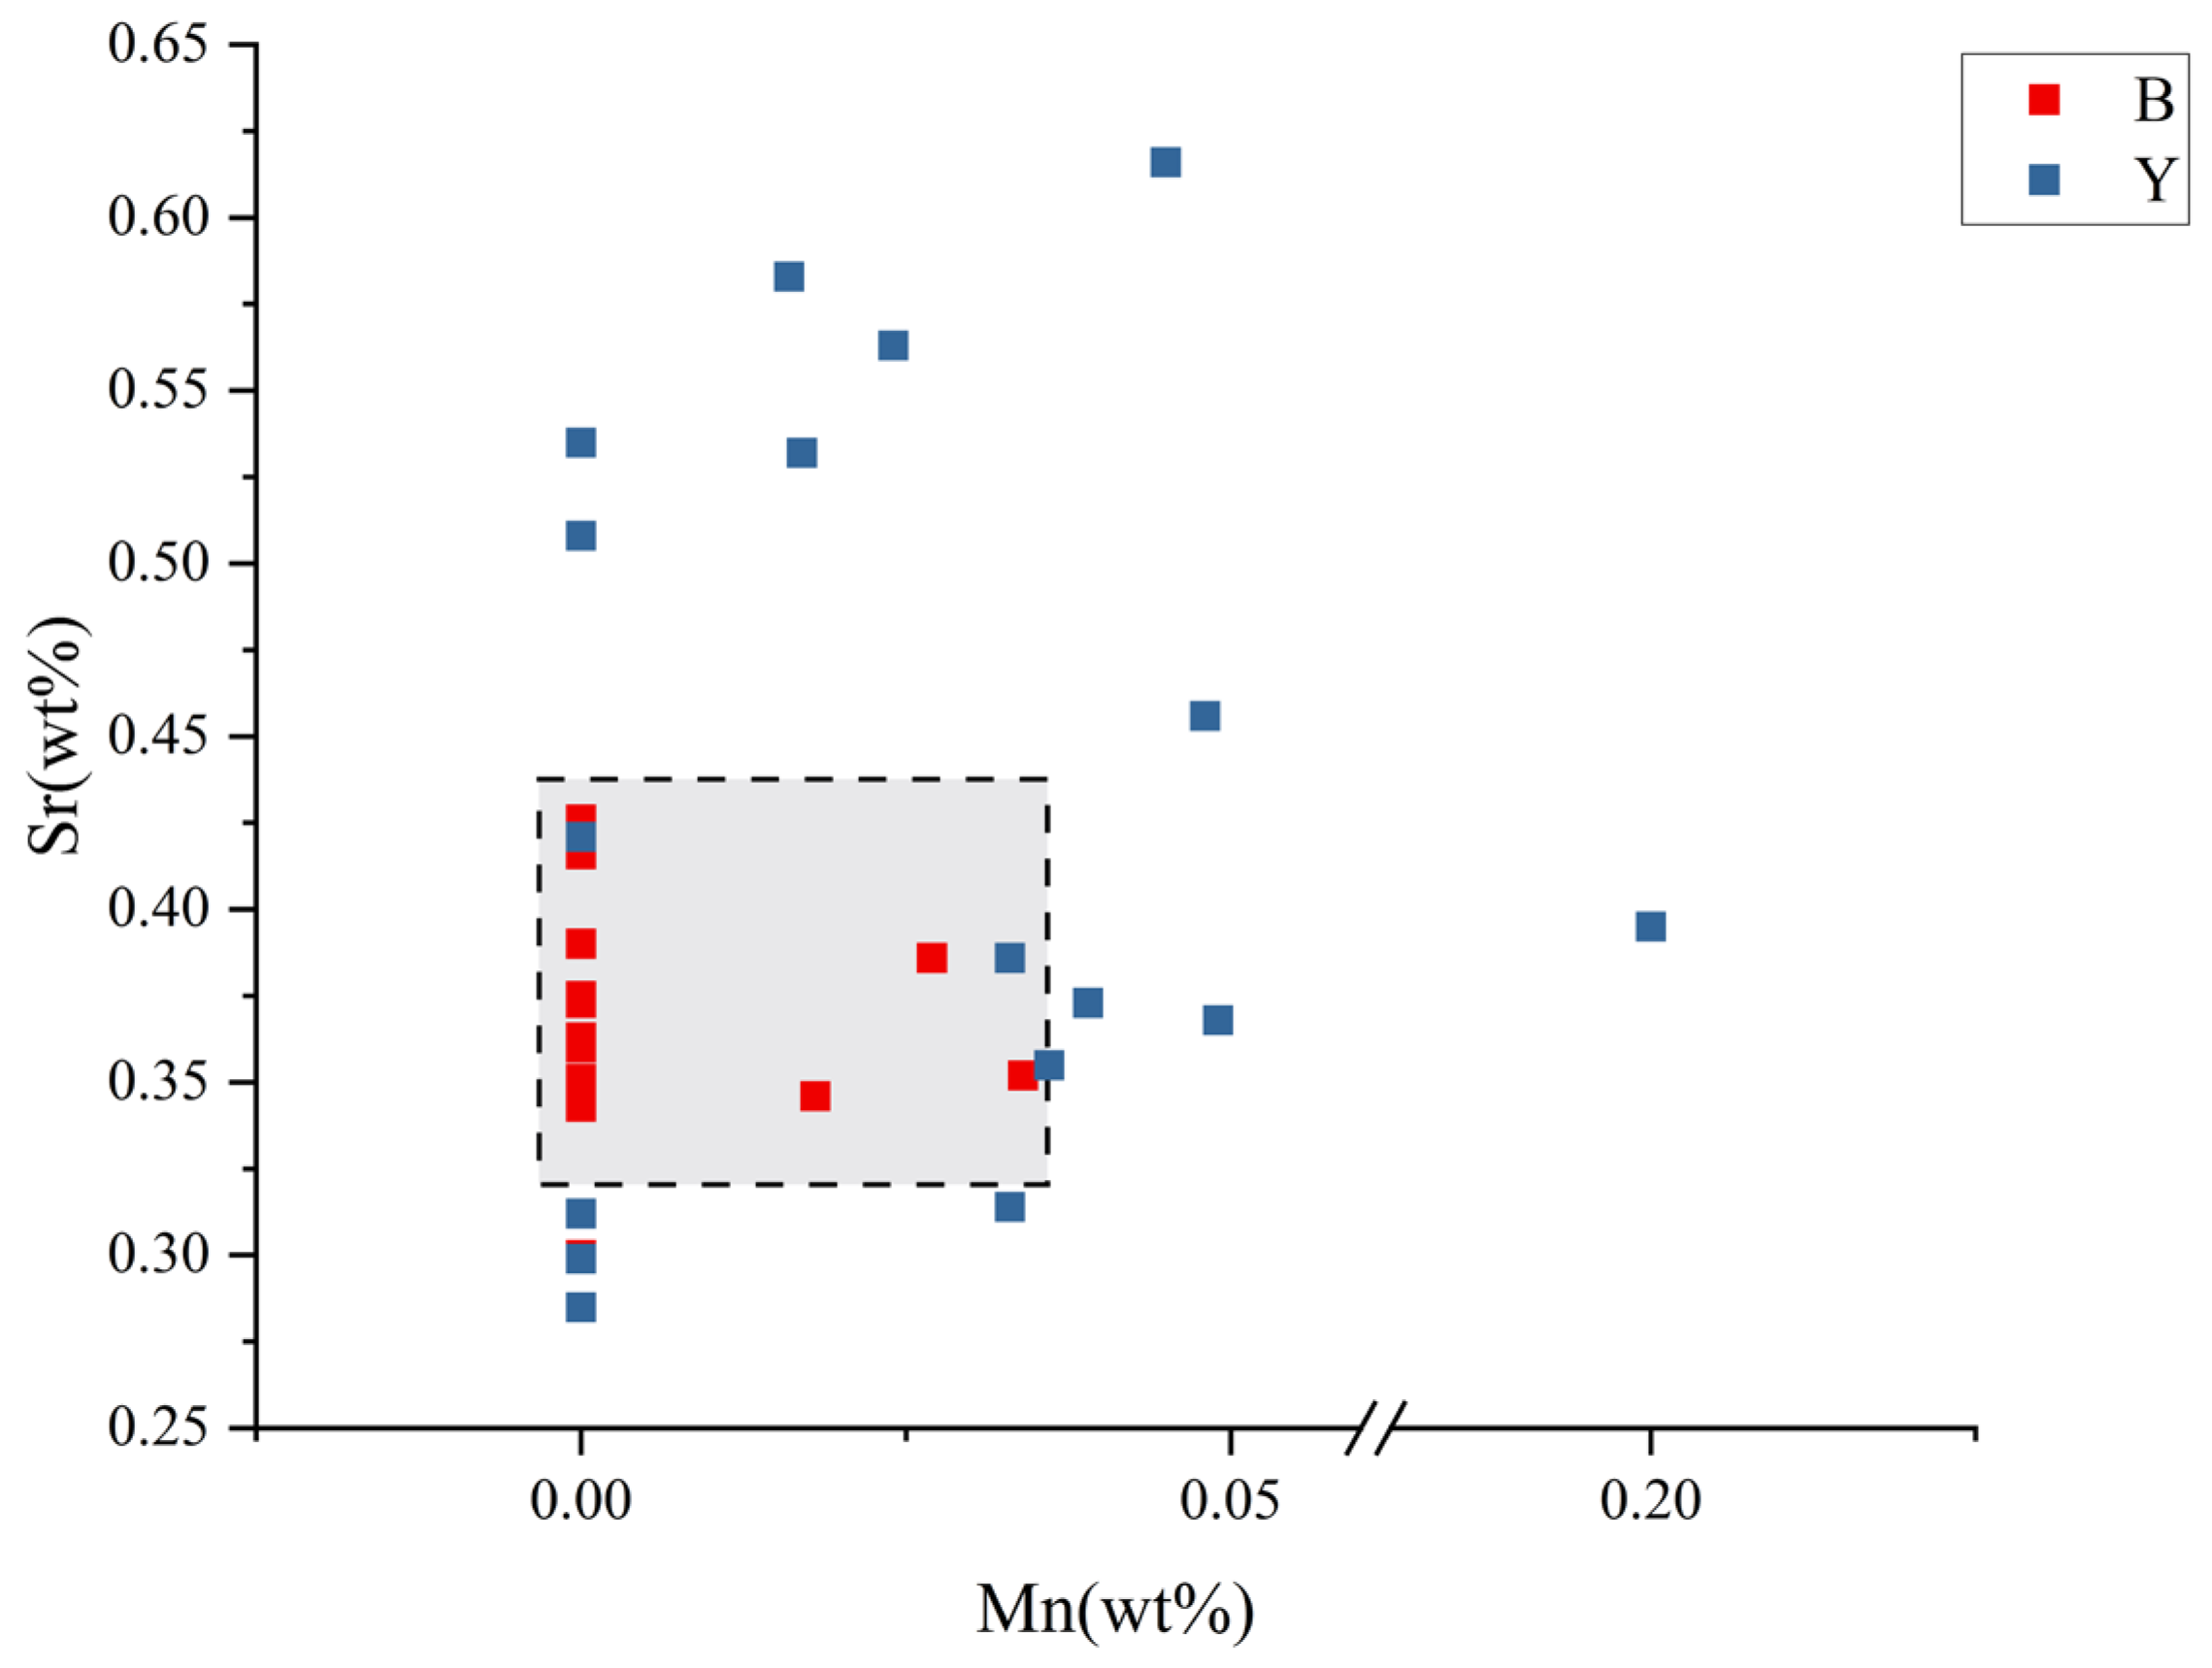
| Mn55 | 15.682 | 4.19 | 8.908 | 28.899 | 1.838 | 8.427 |
| Fe57 | 9.276 | bdl | 7.247 | 16.529 | bdl | 7.197 |
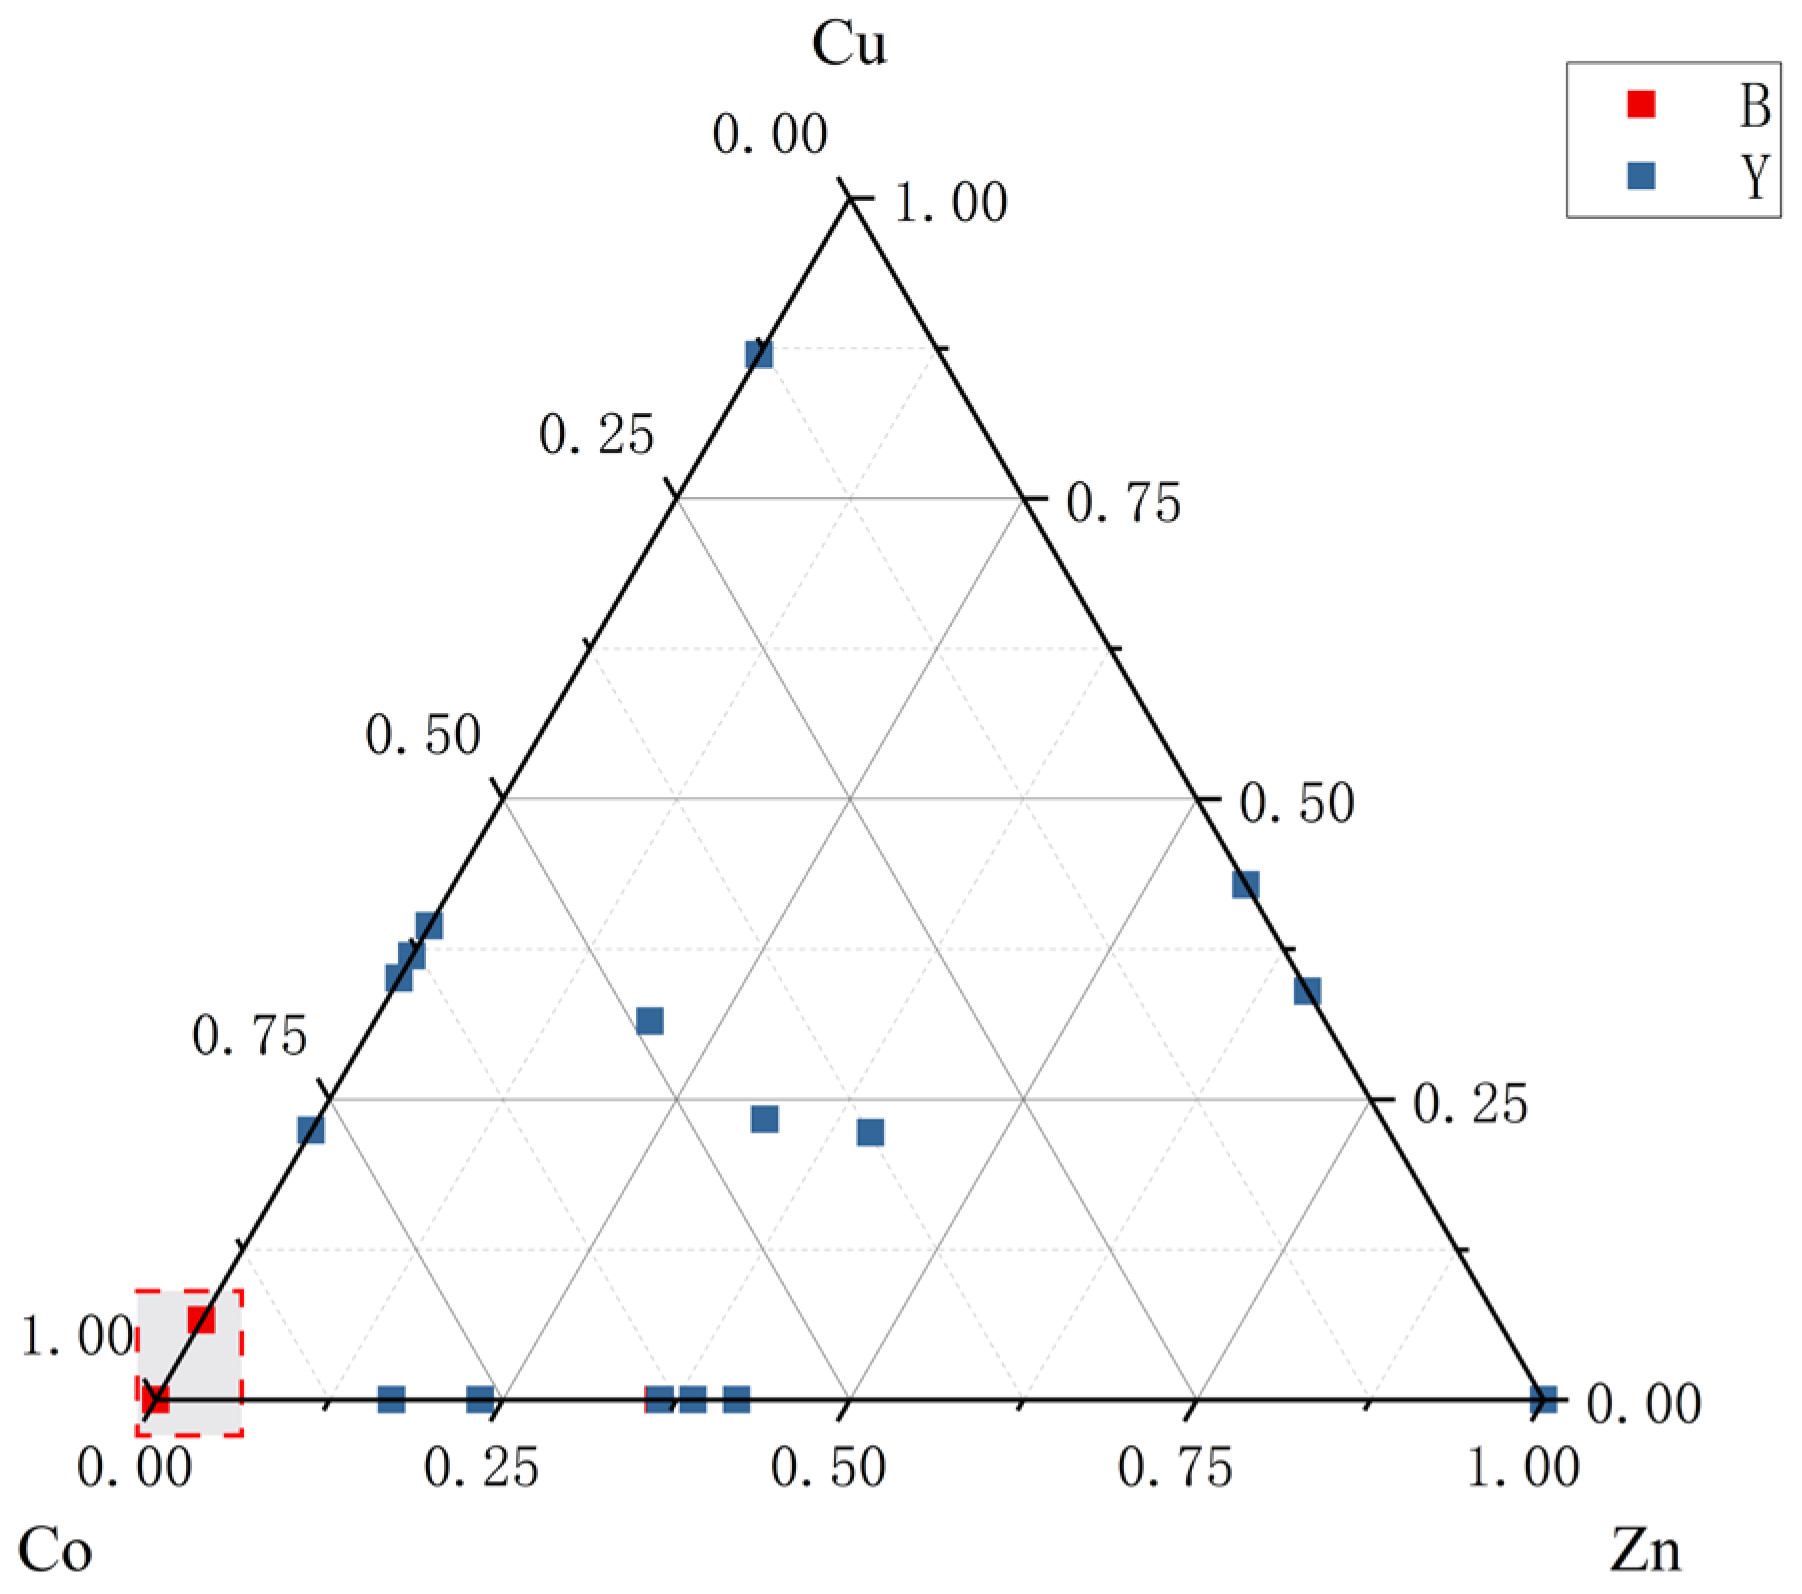
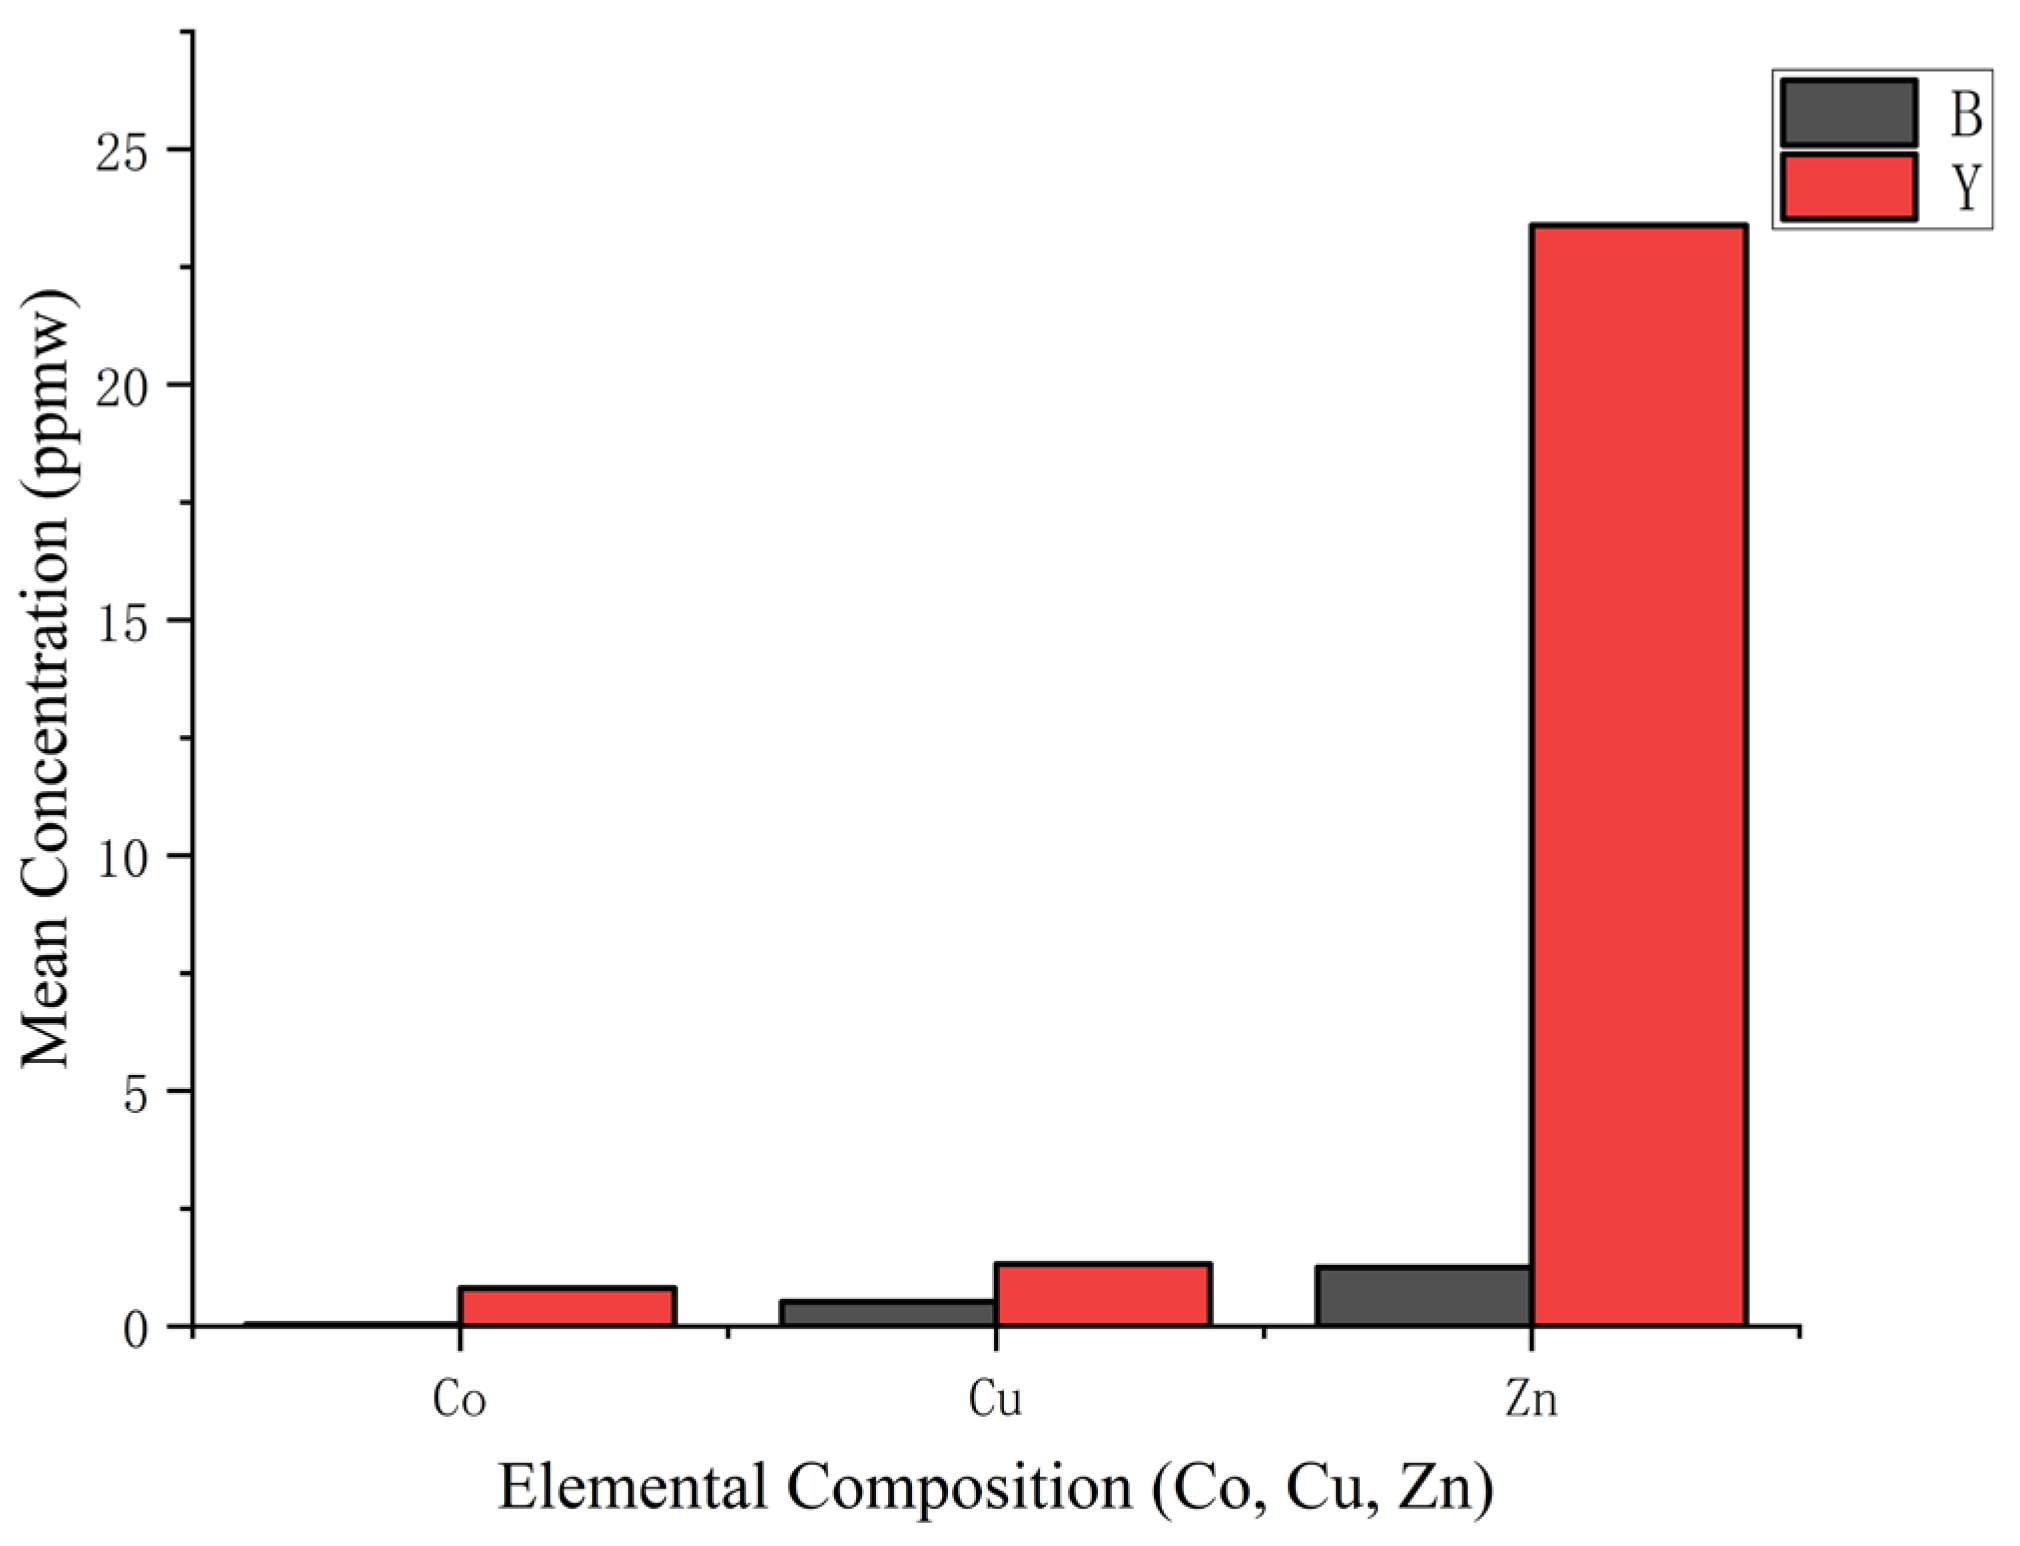
| Co59 | 0.166 | bdl | 0.039 | 3.265 | 0.191 | 0.811 |
| Ni60 | 2.247 | bdl | 0.992 | 2.402 | bdl | 0.775 |
| Cu65 | 1.201 | 0.114 | 0.523 | 2.088 | 0.737 | 1.323 |
| Zn66 | 2.99 | 0.126 | 1.252 | 45.237 | 3.524 | 23.387 |
| Ga69 | 0.119 | bdl | 0.02 | 0.076 | bdl | 0.023 |
| Sr88 | 1232.423 | 984.678 | 1063.707 | 1586.39 | 1116.681 | 1440.549 |
| Ba137 | 2.25 | 1.223 | 1.742 | 4.415 | 1.546 | 3.21 |
Disclaimer/Publisher’s Note: The statements, opinions and data contained in all publications are solely those of the individual author(s) and contributor(s) and not of MDPI and/or the editor(s). MDPI and/or the editor(s) disclaim responsibility for any injury to people or property resulting from any ideas, methods, instructions or products referred to in the content. |
© 2025 by the authors. Licensee MDPI, Basel, Switzerland. This article is an open access article distributed under the terms and conditions of the Creative Commons Attribution (CC BY) license (https://creativecommons.org/licenses/by/4.0/).
Share and Cite
Zhou, P.; Li, G.; Schmitz, F. Effect of Dual-Site Co-Cultivation on Spectral Characteristics and Trace Element Enrichment in Akoya Pearls. Minerals 2025, 15, 654. https://doi.org/10.3390/min15060654
Zhou P, Li G, Schmitz F. Effect of Dual-Site Co-Cultivation on Spectral Characteristics and Trace Element Enrichment in Akoya Pearls. Minerals. 2025; 15(6):654. https://doi.org/10.3390/min15060654
Chicago/Turabian StyleZhou, Peiqi, Geng Li, and Fabian Schmitz. 2025. "Effect of Dual-Site Co-Cultivation on Spectral Characteristics and Trace Element Enrichment in Akoya Pearls" Minerals 15, no. 6: 654. https://doi.org/10.3390/min15060654
APA StyleZhou, P., Li, G., & Schmitz, F. (2025). Effect of Dual-Site Co-Cultivation on Spectral Characteristics and Trace Element Enrichment in Akoya Pearls. Minerals, 15(6), 654. https://doi.org/10.3390/min15060654