Article

The Cavitation Characteristics of Micro–Nanobubbles and Their Effects on the Flotation Recovery of Fine-Grained Ilmenite

1
Institute of Multipurpose Utilization of Mineral Resources, Chinese Academy of Geological Sciences (CAGS), Chengdu 610041, China
2
Technology Innovation Center for Comprehensive Utilization of Strategic Mineral Resources, Ministry of Natural Resources, Chengdu 610041, China
*
Author to whom correspondence should be addressed.
Minerals 2025, 15(6), 628; https://doi.org/10.3390/min15060628
Submission received: 14 May 2025 / Revised: 4 June 2025 / Accepted: 6 June 2025 / Published: 10 June 2025
(This article belongs to the Special Issue Advances on Fine Particles and Bubbles Flotation, 2nd Edition)

Abstract

The co-occurring relationships between ilmenite and gangue minerals in ilmenite deposits, as well as fine mineral embedding particle sizes, are complex. During the beneficiation process, grinding ilmenite finely is necessary to achieve sufficient individual mineral dissociation and the efficient recovery of ilmenite. During this process, a large number of fine-grained minerals can easily be generated, which adversely affects flotation separation. Micro–nanobubbles have been proven to effectively enhance the flotation separation efficiency of fine-grained minerals, as their cavitation characteristics are closely related to the flotation performance of the minerals. In order to fully understand the cavitation characteristics of micro–nanobubbles and their impact on the flotation recovery of fine-grained ilmenite, a series of experiments were conducted using methods such as the bubble cavitation property test, micro-flotation experiments, zeta potential analysis, the contact angle test, adsorption capacity detection, and PBM monitoring. The results indicate that during the process of slurry cavitation, appropriate concentrations of 2-octanol, cycle treatment times, and external inflation volume are conducive to the formation of micro–nanobubbles. Compared with deionized water without cavitation, cavitated micro–nanobubble water is more beneficial for the flotation separation of fine particulate ilmenite, titanaugite, and olivine. The presence of micro–nanobubbles can effectively promote the adsorption of combined collectors on mineral surfaces, significantly enhancing the hydrophobicity of the minerals, with an even stronger promoting effect observed under the treatment of 2-octanol. Micro–nanobubbles can adsorb a portion of the collectors originally attached to the mineral surfaces, thereby decreasing the absolute value of the surface potential of the minerals, which is beneficial for mineral aggregation. The introduction of micro–nanobubbles promotes the aggregation of fine ilmenite iron ore particles into flocculent bodies. 2-Octanol can reduce the size of the micro–nanobubbles generated during the cavitation process of the mineral slurry and, to a certain extent, weaken the phenomenon of bubble coalescence, so they demonstrate a greater advantage in facilitating the aggregation phenomenon.

1. Introduction

Titanium, as a rare element, is widely used in many fields such as aerospace, medical equipment, and the chemical industry. Ilmenite is a common raw material for titanium extraction [1]. Vanadium–titanium magnetite is one of the primary sources for the beneficiation of ilmenite. With the reduction in easily accessible shallow resources, most vanadium–titanium magnetite mines are entering middle and deep mining. The properties of the ore have undergone significant changes, gradually transforming from gabbro-type ilmenite to olivine-type ilmenite [2,3]. The content of olivine in the ore has significantly increased, and the ore grade continues to decrease. The co-occurring relationships between ilmenite and gangue minerals in ilmenite deposits, as well as fine mineral embedding particle sizes, are complex [4]. During the beneficiation process, grinding ilmenite finely is necessary to achieve sufficient individual mineral dissociation and the efficient recovery of ilmenite. During this process, a large number of fine-grained ilmenite particles are generated [5,6]. The particle size has a significant impact on the collision probability between minerals and bubbles during the flotation process. As the particle size decreases, the momentum of mineral particles decreases, resulting in a significant reduction in the collision between mineral particles and bubbles [7,8]. In addition, an increase in the specific surface area of mineral particles can lead to an increase in chemical consumption [9,10]. The enhanced adsorption capacity of fine-grained minerals reduces the surface property differences between minerals [11,12,13] and the mineralization effect of fine-grained ilmenite deteriorates, making separation and recovery difficult [14], resulting in the loss of a large amount of titanium resources in the form of fine-grained particles.
Flotation is the process of extracting target mineral particles from a suspension of water, and the successful capture of hydrophobic particles via bubbles is the key to achieving efficient separation [15]. The collision, adhesion, and separation of particle bubbles determine whether hydrophobic particles can float, which is closely related to the flotation performance [16,17]. In recent years, the application of micro–nanobubbles (MNBs) in mineral processing has received widespread attention, and microbubble flotation has been widely used in the research of the enhanced flotation of micro-fine minerals such as oxidized minerals [18,19,20], sulfide minerals [21,22,23], coal fines [24,25,26,27], etc. The research conducted by Muyuan Zeng et al. [28]. indicates that the formation of INMBs not only facilitates the agglomeration of fine particle apatite but also enhances the aggregation effect of NaOl, thereby improving the adhesion between fine particles and flotation bubbles. The probability of collision between fine-grained mineral particles and bubbles is low, making capture by bubbles difficult, resulting in a lower flotation rate of mineral particles [29,30]. The term micro–nanobubbles typically refers to ultrafine bubbles with a diameter of less than 100 microns, which consequently have a higher probability of collision with mineral particles [31,32]. In addition to their smaller size compared with regular bubbles, micro–nanobubbles also possess larger specific surface areas, surface energies, and selectivity [33,34]. Micro–nanobubbles that adhere to the surface of particles can enhance the hydrophobicity of the particle surfaces while also serving as secondary collectors for the minerals. This facilitates the rapid attachment of fine mineral particles to larger bubbles, thereby reducing the likelihood of separation between the fine minerals and bubbles, which in turn increases flotation efficiency [35,36,37]. Moreover, microbubbles can significantly reduce fluid resistance, thereby diminishing the separation forces and enhancing particle–bubble adhesion [38,39]. For these reasons, microbubble flotation technology can markedly improve the flotation performance of fine-grained minerals and is suitable for enhancing the flotation recovery of fine ilmenite, holding great promise for applications in the mineral processing field.
Micro–nanobubbles play an important role in enhancing fine particle flotation. Given that the properties of micro–nanobubbles are closely related to mineral flotation performance, comprehensively exploring the cavitation characteristics of micro–nanobubbles and deeply understanding their role in fine particle flotation are necessary. At present, most research into microbubble flotation is only focused on their application in flotation. Research into the stability and other characteristics of micro–nanobubbles under different cavitation conditions, as well as the enhancement of the flotation recovery of fine-grained ilmenite using micro–nanobubbles and the mechanisms involved, remains insufficient.
Based on a summary of the research results on microbubble flotation and taking fine-grained titanium magnetite as the research subject, through techniques such as the bubble cavitation property test, micro-flotation experiments, the zeta potential analysis, the contact angle test, adsorption capacity detection, and PBM monitoring, this study investigates the cavitation characteristics of micro–nanobubbles and their effects on the flotation recovery of fine-grained ilmenite.

2. Materials and Methods

2.1. Materials and Reagents
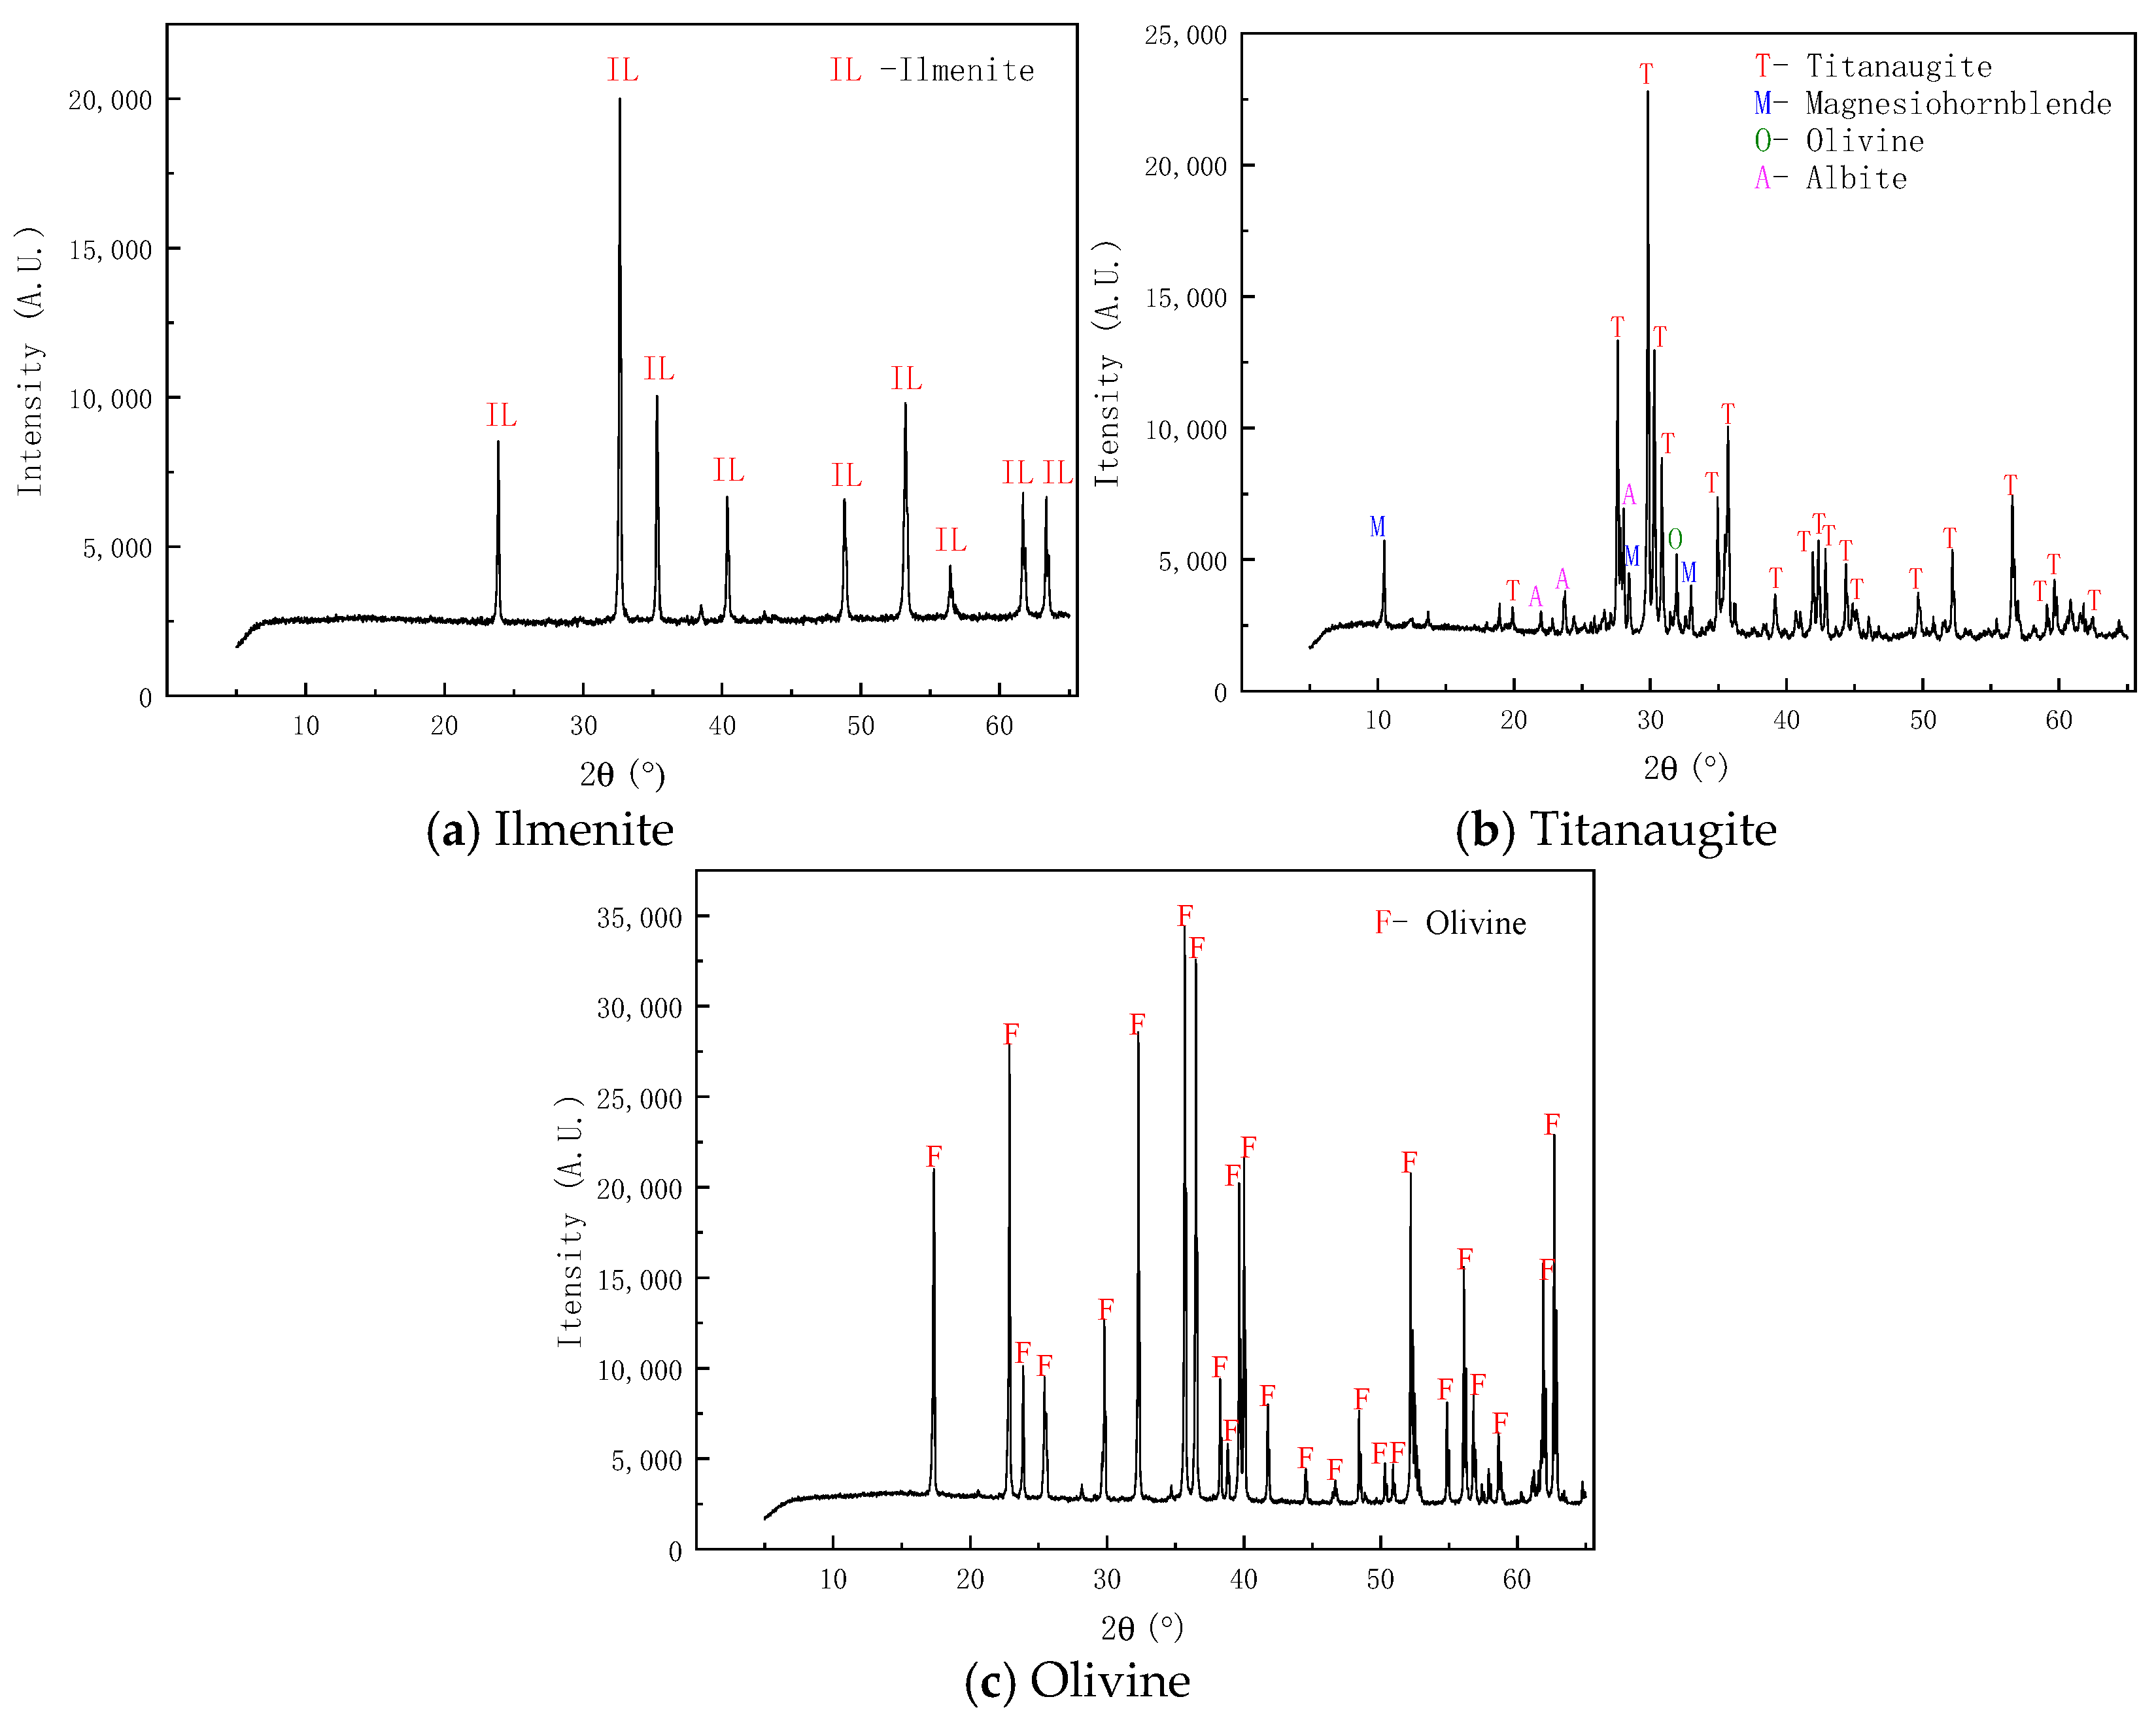
The ilmenite (FeTiO3) sample for this test was taken from olivine-type vanadium titanomagnetite in the Hongge mining area, which appeared as black gray blocks. The titanaugite samples (Ca (Mg, Fe2+, Fe3+, Al, Ti) [(Si, Al)2O6]]) were taken from gabbro-style vanadium titanomagnetite at the Midi Mineral Processing Plant and were black and massive. The samples of olivine ((Mg, Fe)2 [SiO4]) were taken from coarse-grained peridotite in a certain area of Sichuan, which were green granular. Ilmenite, titanopyroxene, and olivine were crushed and manually sorted repeatedly, and each mineral was repeatedly purified via magnetic separation and gravity separation. Each sample was ground separately using a three-head agate grinder and washed with deionized water to remove surface impurities. A −19 μm experimental sieve was used for wet sieving in deionized water to obtain a pure mineral sample with a full particle size of −19 μm. The obtained sample was sonicated and cleaned three times in deionized water and then dried in a low-temperature (30 °C) vacuum environment. Each mineral sample was stored separately in a clean ground bottle for later use. The XRD analysis results of the pure mineral samples are shown in Figure 1. The theoretical TiO2 content in ilmenite is 52.7%, indicating a purity of 96.09% for the ilmenite sample. Additionally, the theoretical (Fe+Mg)O content in olivine is 57.2%, indicating a purity of 93.96% for the olivine sample.
In this study, 2-octanol (C8H18O) was used as the foaming agent for micro–nanobubbles, sodium oleate (C17H33COONa) and sodium dodecyl sulfate (C12H25SO4Na) were used as the collectors, and sodium silicate (Na2SiO3) was used as the inhibitor. Hydrochloric acid (HCl) and sodium hydroxide (NaOH) were used as pH regulators. All the chemicals used in the experiment were purchased from Shanghai Aladdin Biochemical Technology Co., Ltd. in China. All the reagents used in the experiment were of analytical grade. Deionized water (resistivity = 18.2 MΩ·cm) was used for all tests. (Dandong, Liaoning, China)

2.2. XRD Detection

The UltimaIV X-ray diffraction analysis system produced by the Rigaku Corporation (Tokyo, Japan) was used for XRD detection phase identification. This instrument is primarily used to determine the chemical composition of mineral samples and to assess their purity levels. The particle size of the ore sample was ground to 5 μm for later use; 3–5 g of the ore sample to be tested was weighed and placed in the groove of the test slide during measurement; quartz slides were used for sample preparation and compression, which were evenly distributed and compacted; the test slides were placed in the test position in the DX-2700 X-ray diffraction analyzer; the protective door was closed; and the test was started. The test angle range was 5°–85°, the measurement step was 0.05°, and the single sampling time was 1.0 s. After the diffraction pattern was obtained, the detection data were analyzed using the Jade 6.0 software.

2.3. Bubble Cavitation Property Tests

The micro–nanobubbles were produced using a nanobubble generator developed by Xia Zhichun Environmental Protection Technology Co., Ltd. (Kunming, Yunnan Province, China) through the hydraulic cavitation method. The device utilizes the jet method to produce micro–nanobubble water, with a high-pressure water pump connected to the inlet of a Venturi tube. The outlet of the Venturi tube is connected to the bottom inlet of a storage tank, while the sidewall outlet of the storage tank is connected back to the inlet of the water pump, forming a closed circulation loop. Inject an adequate amount of deionized water (5L, solution of 2-octanol needs to be prepared in advance) into the storage tank, and activate the temperature control system to set the water temperature at approximately 25 °C. Start the high-pressure water pump and initially set the pressure at 0.3 MPa, allowing pure water to circulate in the pipeline for 5 min to expel the air from the pipes. Subsequently, close all gas valves and gradually increase the water pump pressure to the target operating pressure (0.8 MPa), allowing the system to operate stably for 10 min without gas injection. After the system stabilizes, maintain the water pump to operate continuously at the target pressure of 0.8 MPa. When pure water flows through the throat of a Venturi tube, the strong shear forces and low-pressure zone generated by the high speed (approximately 28 m/s) will dissolve and release nanobubbles. After running for approximately 20 min, collect samples at the sampling valve at the bottom of the tank: first discard about 500 mL of the initial liquid that flows out, and then collect the mid-section of the water flow using a pre-cooled glass bottle as a sample of nanobubble water. The external inflatable equipment is connected to a pressure-reducing valve and a precision gas flow meter via an air compressor, with a gas injection point located approximately 10 cm upstream of the throat of the Venturi tube through piping, utilizing a gradient inflation method. It should be noted that during the cavitation of the secondary alcohol solution, a significant amount of foam layer is generated due to the jet flows. At this time, it is necessary to reduce the solution capacity in the tank to avoid excessive pressure within the cavity.
The size distribution of the bubbles was verified and measured using a Horiba SZ-100 dynamic light scattering (DLS) instrument (Tokyo, Japan), with a scattering angle of 90° and a container temperature of 25 °C. Before feeding the water into the DLS instrument, it was circulated through a two-phase vortex pump for 20 min to determine the size of the bubbles. After sampling from the pump storage tank, a nanobubble size test was performed for 60 min. The generation and detection of bubbles were carried out using deionized water without any reagents to avoid possible interference from nanoparticles. In addition, DLS measurements were repeated on untreated deionized water to eliminate any possible presence of nanoparticles in the water.
Deionized water (DW) is prepared using the heating reflux method, where deionized water and 2 to 3 pieces of boiling stones are added to a round-bottom flask. The outlet of the serpentine condenser is connected to a drying tube to prevent backflow of air. Heat to a gentle boil over medium heat at 92 to 95 degrees Celsius and adjust the temperature to maintain a steady boil. After obtaining 2 L of degassed water from condensation, stop heating and introduce nitrogen gas (at a flow rate of 0.5 L/min) to cover the liquid surface, preventing the re-dissolution of air. Naturally cool to below 60 °C, then transfer to a sealed container with pre-purged nitrogen, and preserve with a water seal. The water degassing process employs a vacuum degassing method for further preparation. First, the inner part of the degassing tank is cleaned with hot water at 90 to 95 °C, followed by steam sterilization for 10 min and an inspection of the integrity of the sealing ring. Start the transfer pump and inject 5 L of deionized water into the degassing tank until the float valve automatically closes (about 70% of the liquid level). Start the vacuum pump and employ the gradient vacuum method for gas removal: Level 1: draw down to −0.08 MPa; maintain for 5 min to discharge large air bubbles; Level 2: continue to draw down to −0.095 MPa; maintain for 10 min to remove dissolved gases; and Level 3: reach ultimate vacuum of −0.098 MPa; hold for 8 min to ensure the removal of residual gases. Shut down the vacuum pump and slowly open the intake valve to restore atmospheric pressure. Start the screw pump and inject the degassed water into the sealed container pre-filled with nitrogen gas, and then immediately seal it for preservation.

2.4. Micro-Flotation Tests

According to the experimental requirements, 2 g of ore sample with a particle size of −19 μm was weighed and placed in a clean flotation tank. Deionized water was added according to the requirements of the slurry mass concentration in the experiment. The stirring spindle was turned on to stir the slurry for 2 min to fully disperse the mineral particles. HCl or NaOH was added to adjust the pH to the desired value. A sodium silicate solution was added as an inhibitor, and the stirring time was fixed at 5 min. Then, a solution of NaOL and SLS combined collector (molar ratio of 4:1) was added. After mixing for 3 min, the air was aerated to conduct manual foam scraping. The foam scraping time was fixed at 3 min. The obtained foam product was placed in a weighed clean watch glass and dried in a vacuum drying oven at low temperature, and then the foam product was sent for inspection after being weighed. The TiO2 grade of the foam product was obtained. The TiO2 recovery rate of the concentrate product was calculated according to the yield and TiO2 level. The flotation test was repeated three times, and the average value was taken as the final recovery rate. The artificial mixed ore flotation test used a mixture of fine-grained ilmenite, ilmenite, and olivine with a mass ratio of 1:1:1 (the grade of TiO2 is approximately 17.30%) as the ore sample.

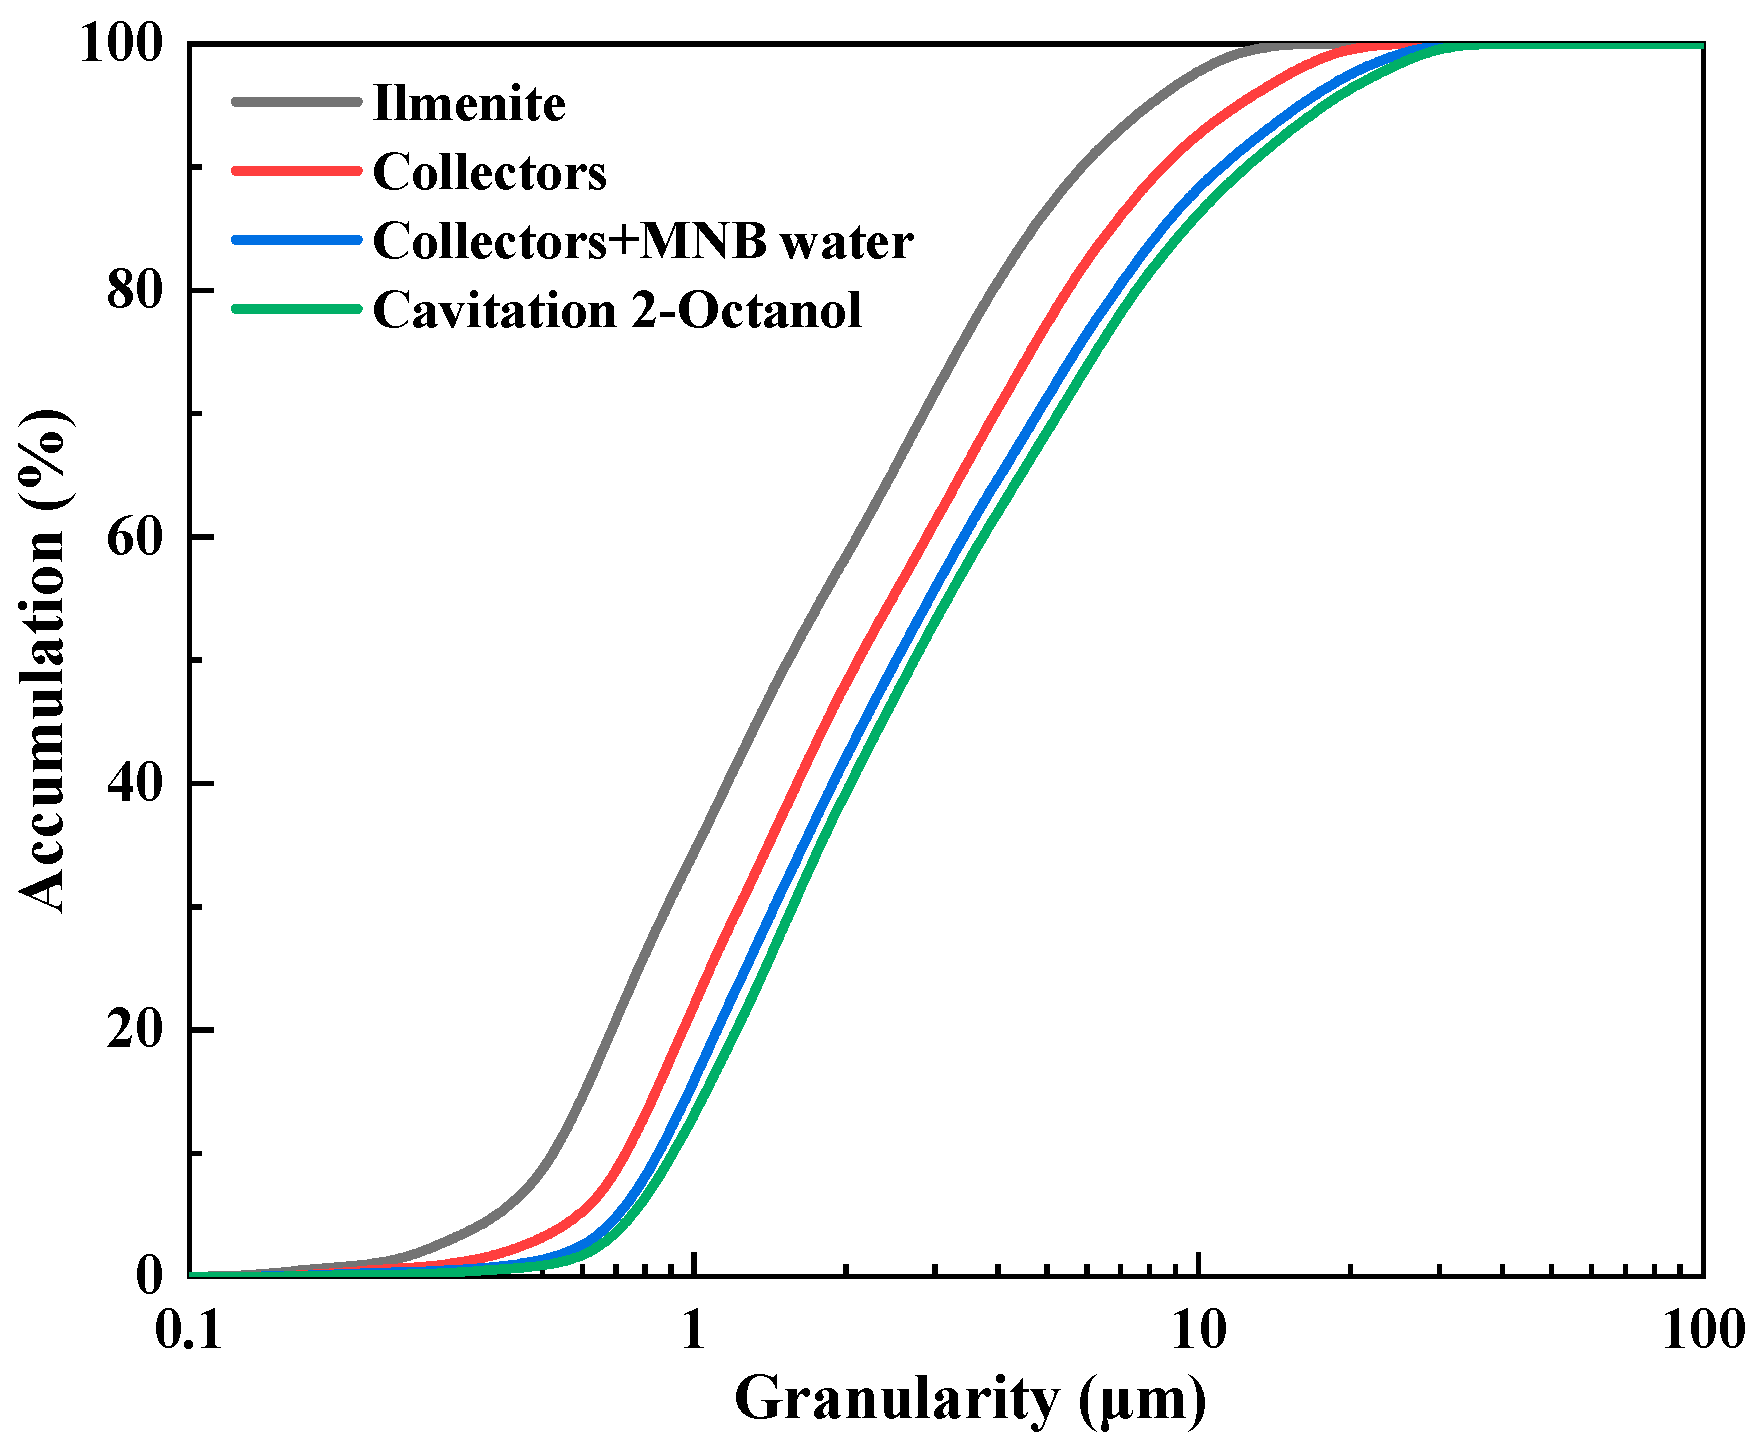
2.5. Particle Size Testing

The particle size test was measured by the LS-609 analyzer produced by Omec Instruments (Zhuhai, Guangdong Province, China). The size characteristics of the mineral aggregates were analyzed, and the size variation in the mineral particle aggregates in the micro–nanobubble system was characterized via laser diffraction. The test process was as follows: Firstly, the chemical solution containing micro–nanobubbles was prepared via hydraulic cavitation. Then, 380 mL of the solution was mixed with 20 g of fine-grained ilmenite to prepare a slurry system with a solids content of 5%. The slurry was placed on a magnetic stirrer and dispersed evenly at a constant speed. After the stirring was completed, a flexible catheter was used to slowly draw the appropriate amount of slurry into the injection system of the particle size analyzer. The shading rate of the suspension was then monitored in real time, the injection was stopped when the detection value reached a test window of 8%–12%, and the automatic measurement program was initiated. The test was repeated three times for each group of tests, and the arithmetic mean was taken as the final data. In order to maintain the integrity of the aggregate structure, all transfer operations were kept slow and steady during the test. Treatments that may destroy aggregates, such as ultrasonic dispersion, were strictly avoided.

2.6. Zeta Potential Analysis

The zeta potential is determined using the NanoBrook 90Plus ZetaPALS analyzer (New York City, NY, USA). To determine the surface zeta potential of the minerals, pure ilmenite, titanaugite, and olivine were ground using a three-head agate grinder to −19 μm, an electronic balance was used to accurately weigh 20 mg of the ore sample, and the 20 mg sample was placed in a clean 50 mL beaker. Deionized water was then added to prepare a slurry with a mass fraction of 0.04%, and the mixture was stirred evenly to fully disperse the slurry (rotational speed is 1500 rpm). A NaOL and SLS combined collector with a concentration of 2 × 10⁻⁴ mol/L was added, and a magnetic stirrer was used to continuously stir the mixture for 10 min so the mineral and agent could fully interact. After the solution settled for 20 min, the upper layer of the slurry was taken and injected into the electrophoresis cell of the potential tester. The slurry pH was adjusted with HCl or NaOH, and the surface electrokinetic potential of the minerals treated with and without chemicals was measured under different pH conditions. Each pH condition was measured twice, with three points measured each time. The average value was taken as the final result.

2.7. Adsorption Capacity Test

First, we washed the test samples to reduce the pollution of organic carbon. We then selected 10 g of test sample to be added to 100 mL of ethanol, followed by agitation, and then it was filtered through a 5 μm filter membrane. After filtration, the samples were vacuum-dried at 120 °C. The drying duration was 30 min. This process was repeated three times. The dried samples were sealed and stored for subsequent testing.
The specific surface area of the sample was measured using the V-Sorb 2800TP automated physisorption instrument produced by Gold APP Instruments Corporation (Beijing, China). The samples used for the specific surface area measurement were ground to a size of −19 μm. The adsorption capacity of the agent was measured using Elementar Vario TOC total organic carbon (TOC) analyzer produced by Elementar Company (Frankfurt, Germany). Then, 1 g of the mineral sample was mixed with 100 mL of deionized water and stirred well. The pH value of the slurry was adjusted to the required level before the necessary amount of reagent solution was added. The slurry was then stirred and allowed to precipitate, and the supernatant was collected and centrifuged in a high-speed centrifuge at 6400 rpm to remove fine particles. After centrifugation, the liquid was filtered through a membrane of 0.45 μm to prepare the test samples. The amount adsorbed on the surface of the mineral sample was determined by subtracting the amount of reagent in the supernatant from the total amount of reagent in the supernatant. The formula for calculating the adsorption density is shown in Equation (1):
Γ = ν ( c 0 c ) m A
where Γ is the adsorption density of the agent (mg/m2), c0 and c represent the total and supernatant concentrations (mg/L), v is the slurry volume (L), m is the weight of the mineral sample (g), and A is the specific surface area of the mineral powder (m2/g).

2.8. Contact Angle Measurement

Two ore samples with complete crystalline morphologies were selected, and precision cutting equipment was used to prepare two flat surfaces on each ore piece. The cut surfaces were then processed with polishing sandpaper until a mirror-like finish was obtained. The processed ore samples were placed in a glass container filled with deionized water for ultrasonic cleaning. After cleaning, the samples were allowed to air-dry for future use. Prior to testing, the ore samples were immersed in a chemical reagent solution at a predetermined concentration for 120 min. After soaking, a multi-stage deionized water rinsing process was employed to remove any residual reagents from the surface, followed by additional air drying. Finally, the SL200C interface analyzer (KINO Scientific Instrument Inc., Boston, MA, USA) was used to simultaneously measure the contact angles and surface tension parameters of the ilmenite, titanaugite, and olivine samples.

2.9. Precision Bubble Monitoring System Observation Experiment

In this study, different slurry conditions were used to pretreat the ilmenite slurry system. After the pretreatment was completed, the transparent observation window was immersed in the slurry suspension system after proper stirring, and the interaction state between the mineral particles and the bubbles and the agglomeration behavior of the ilmenite particles were observed in real time.
A high-resolution camera system mounted on the viewing window enabled the capture of dynamic images of the mineral–bubble complex. In order to ensure the representativeness of the image data, microscopic images were acquired from four different azimuths, and at least three sets of valid data were obtained from each angle.

3. Results and Discussion

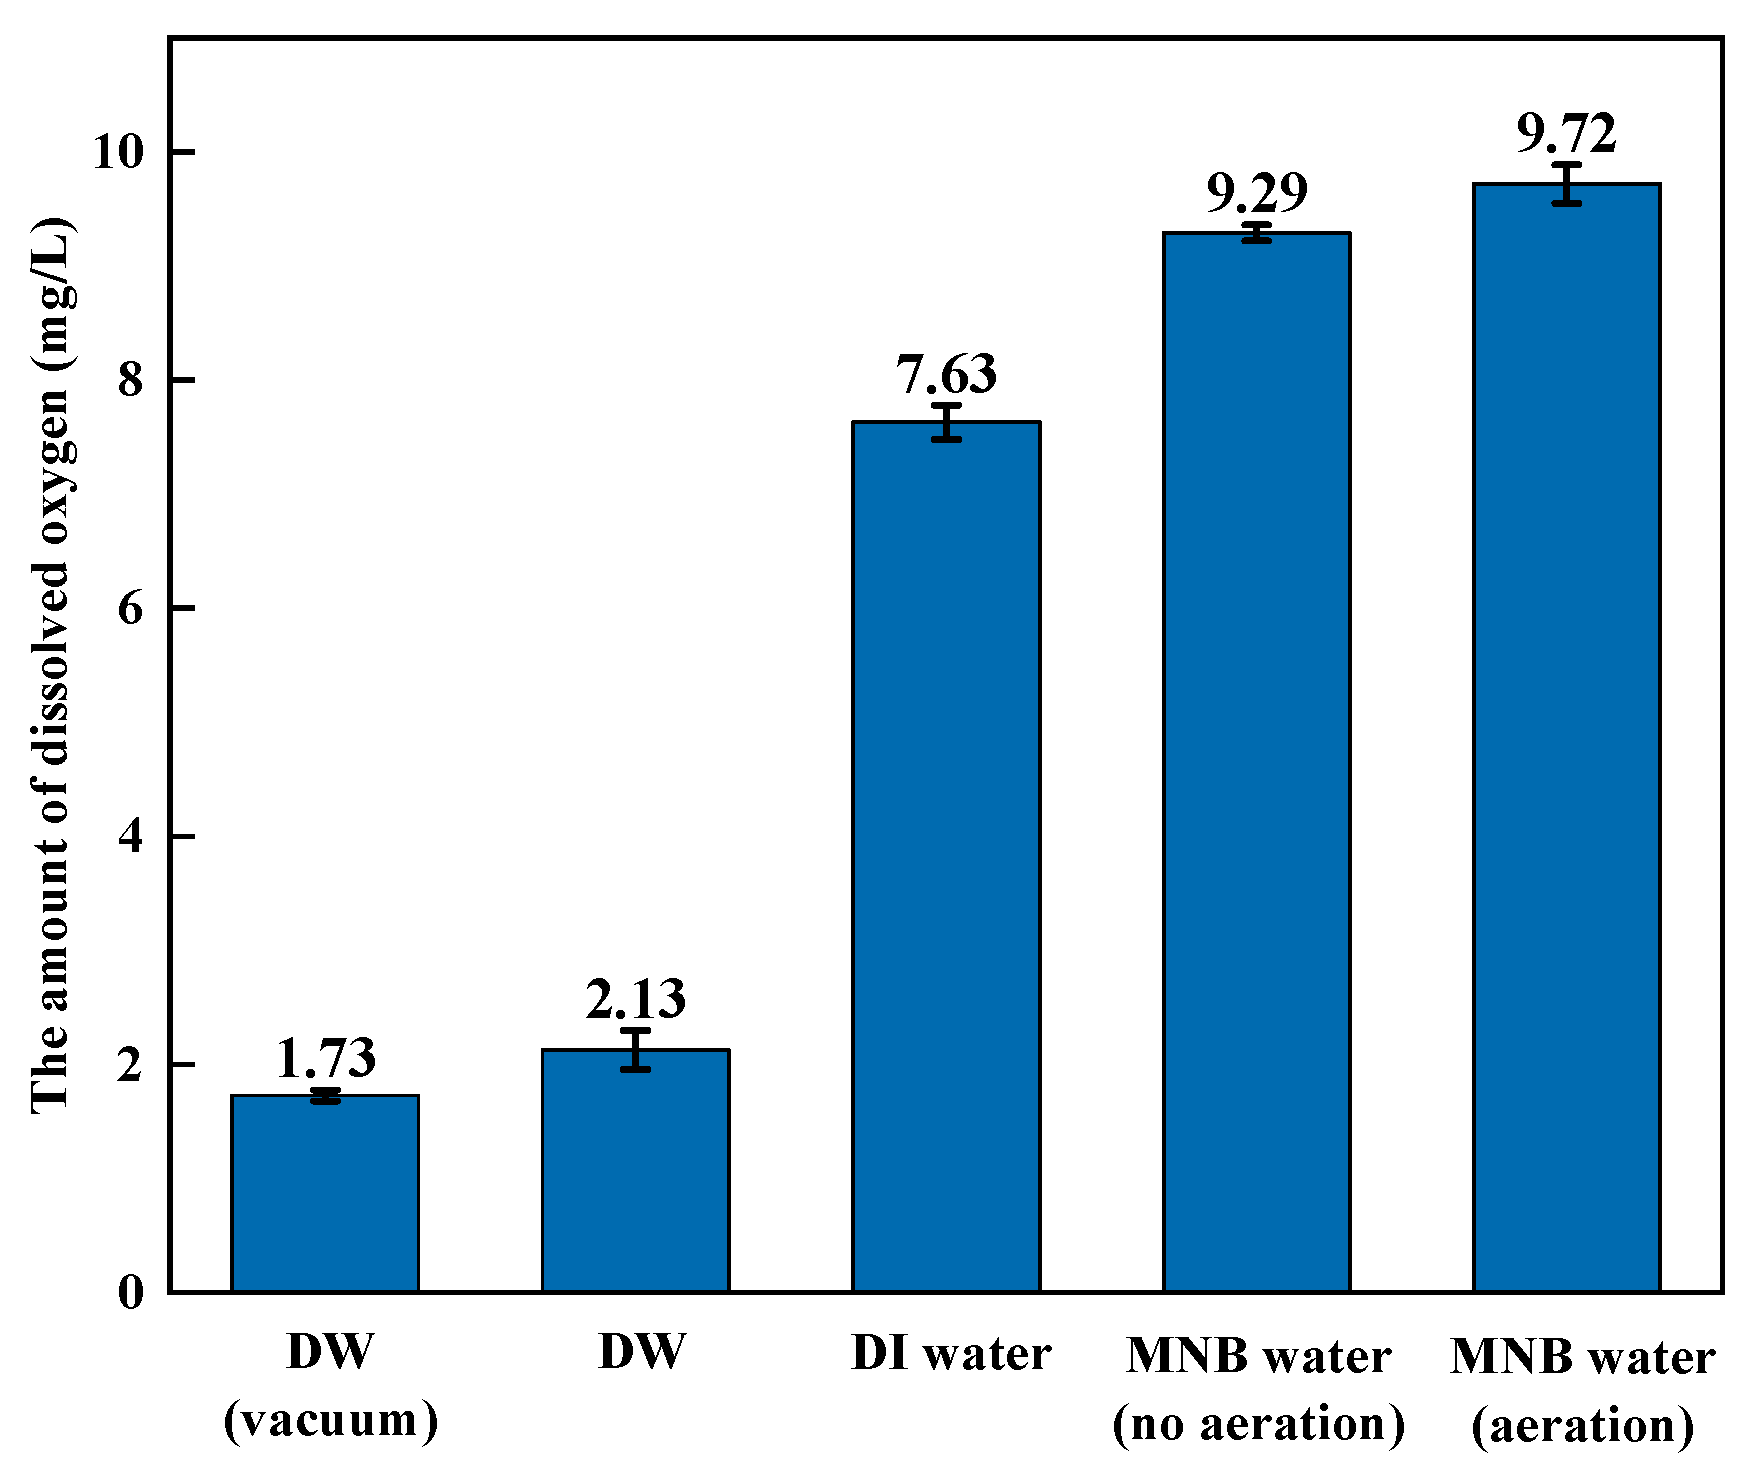
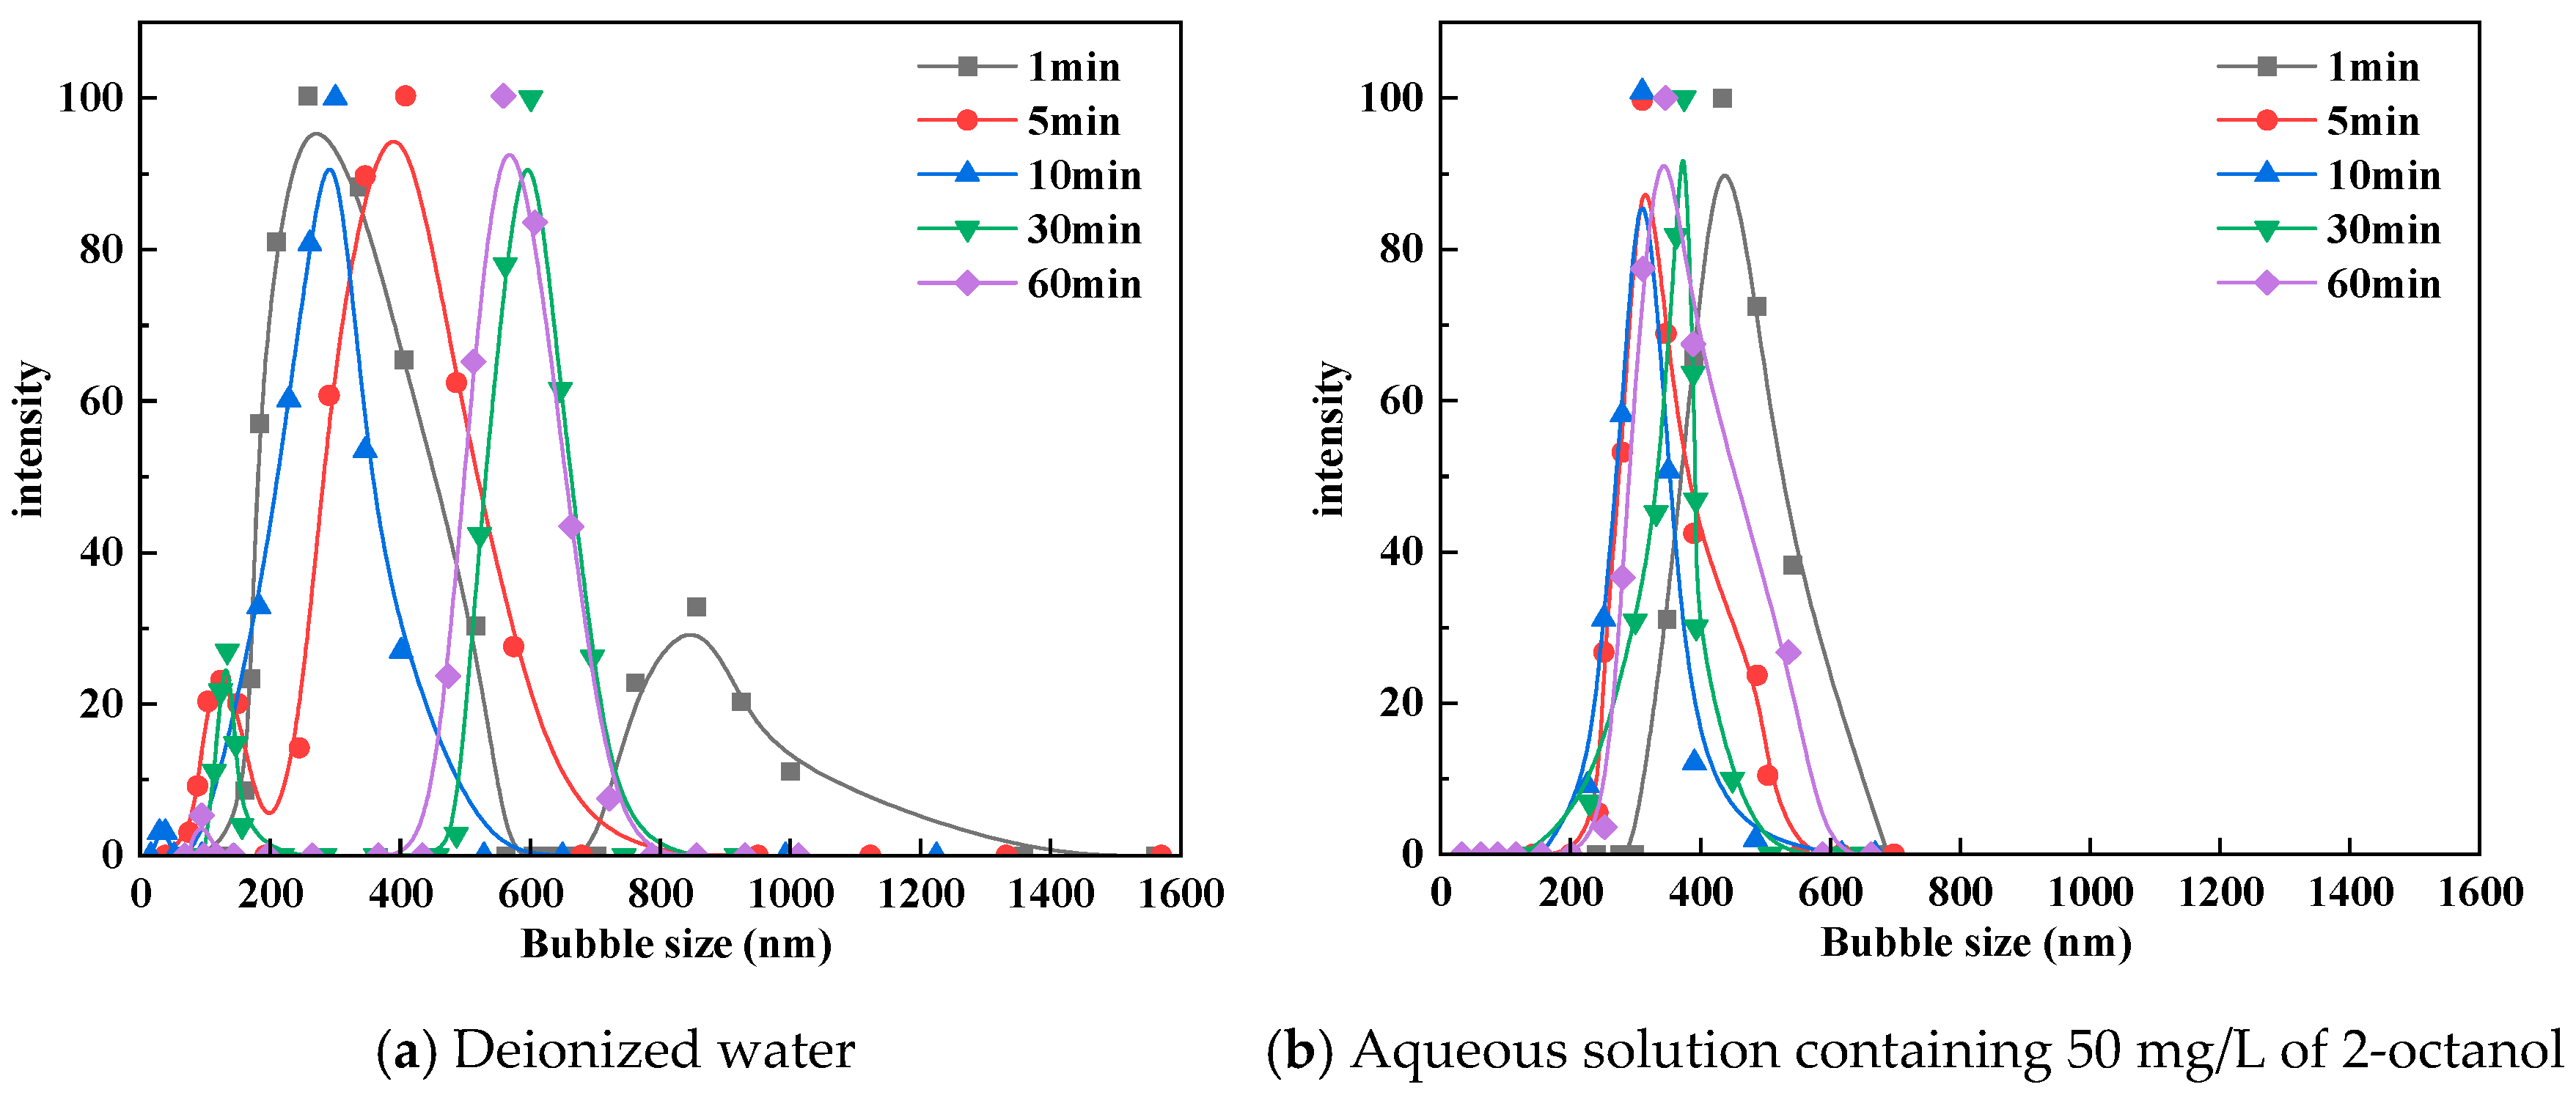
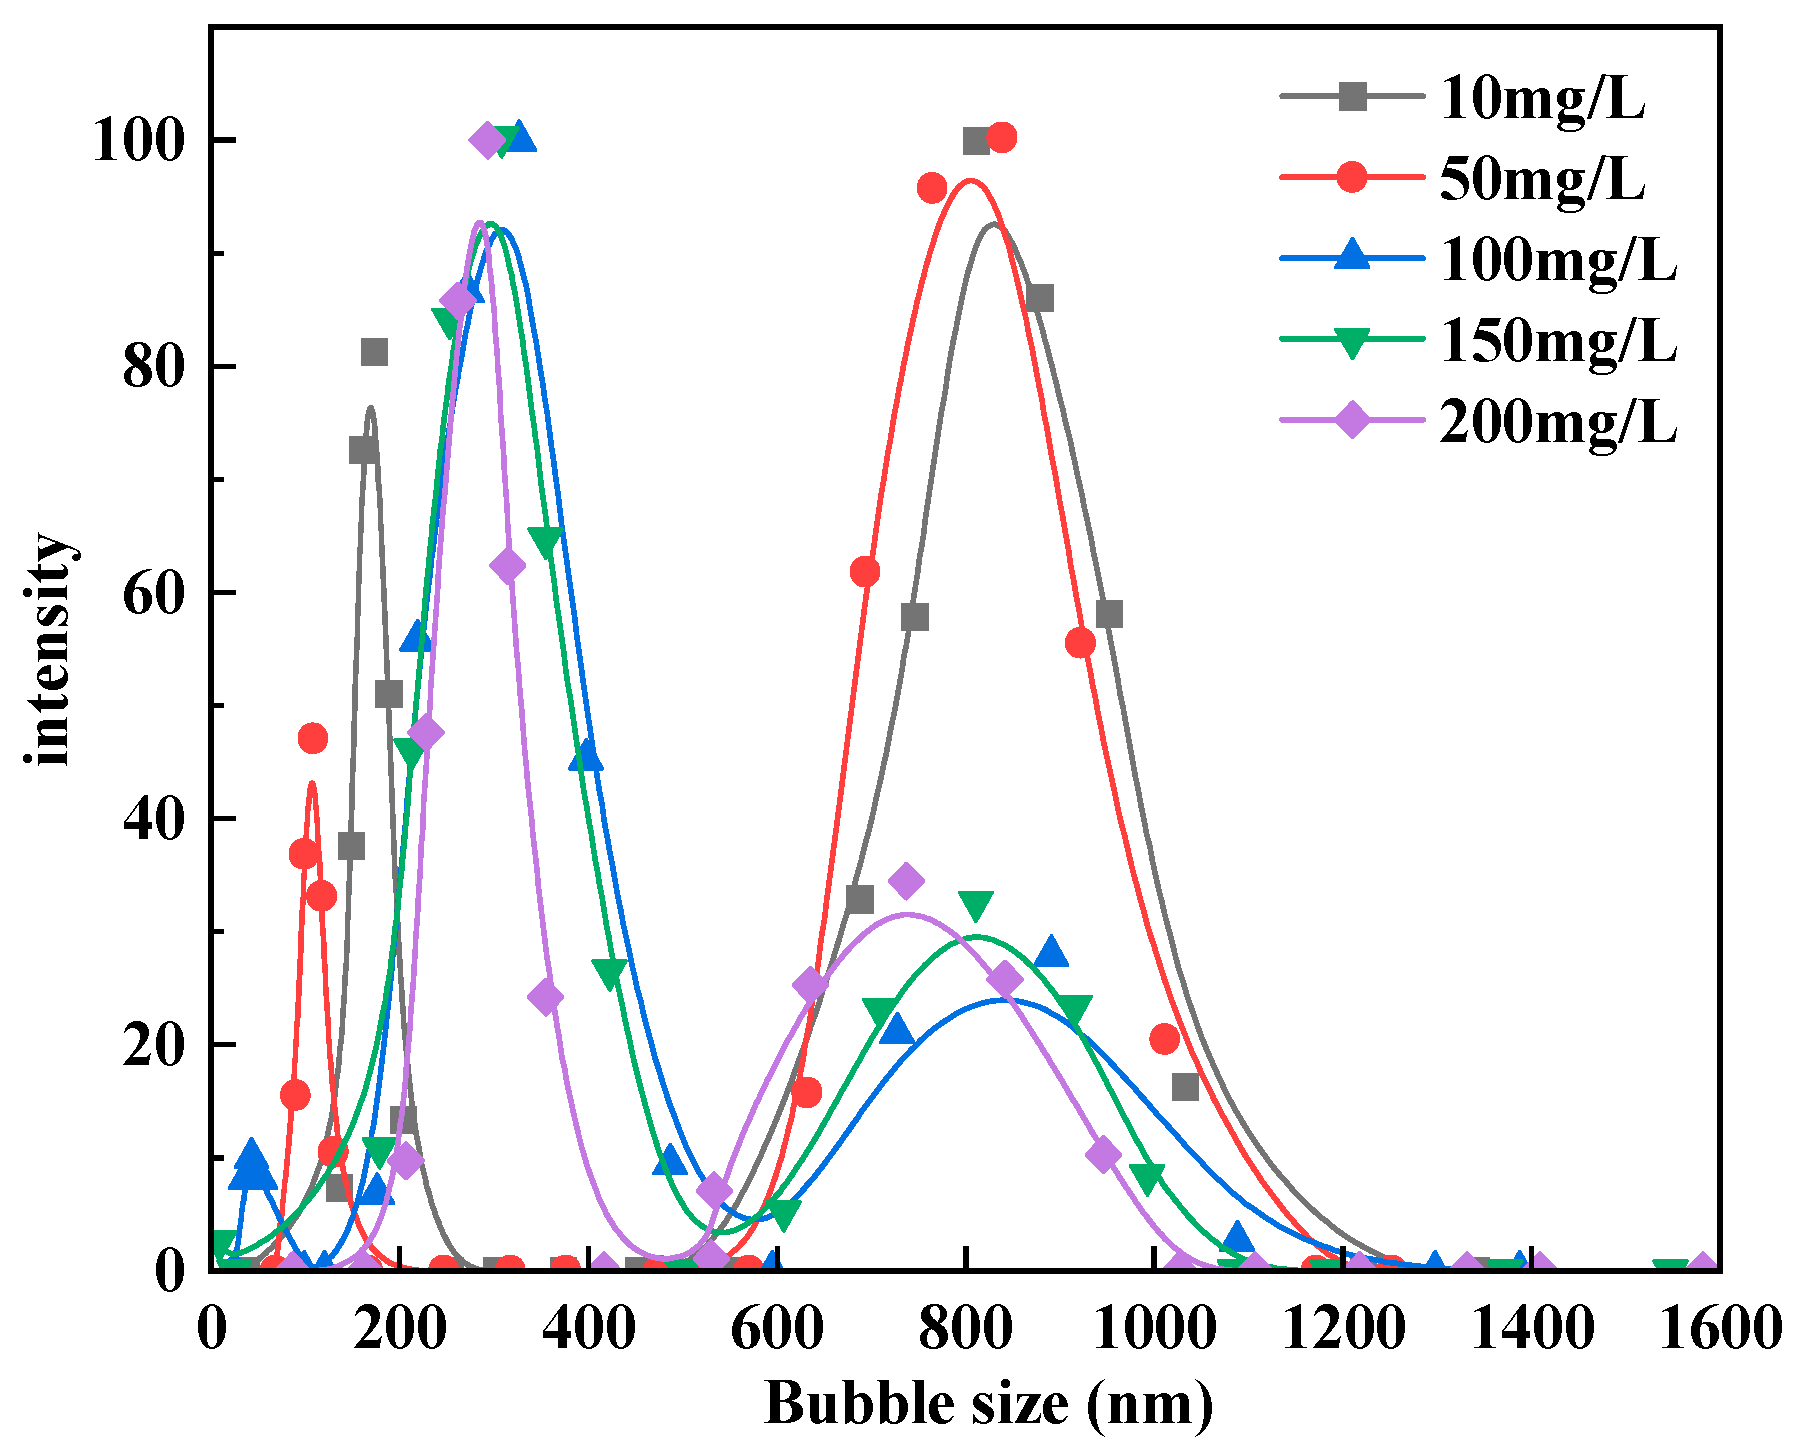
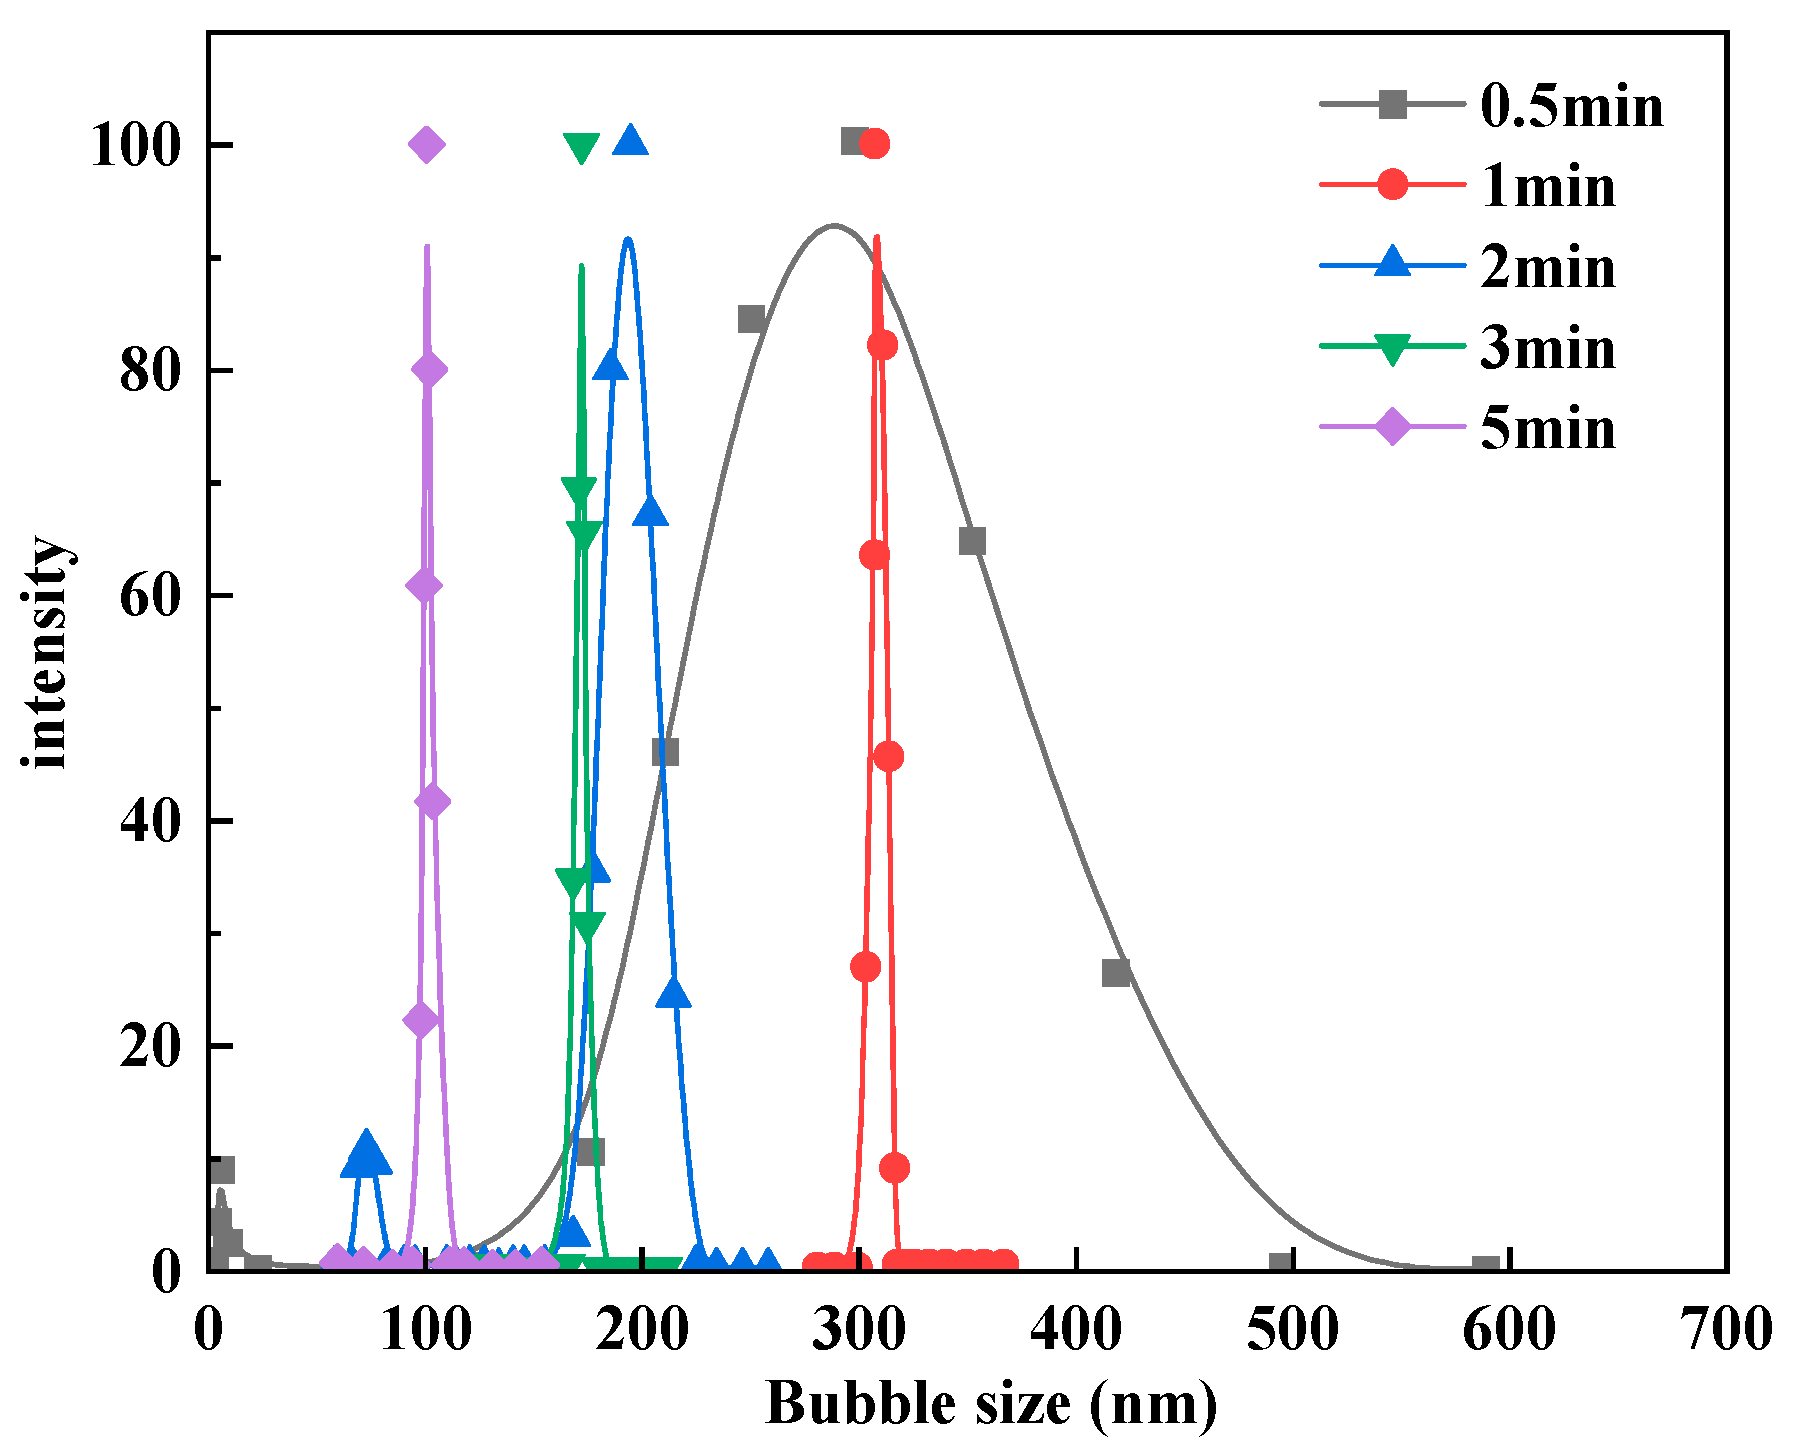
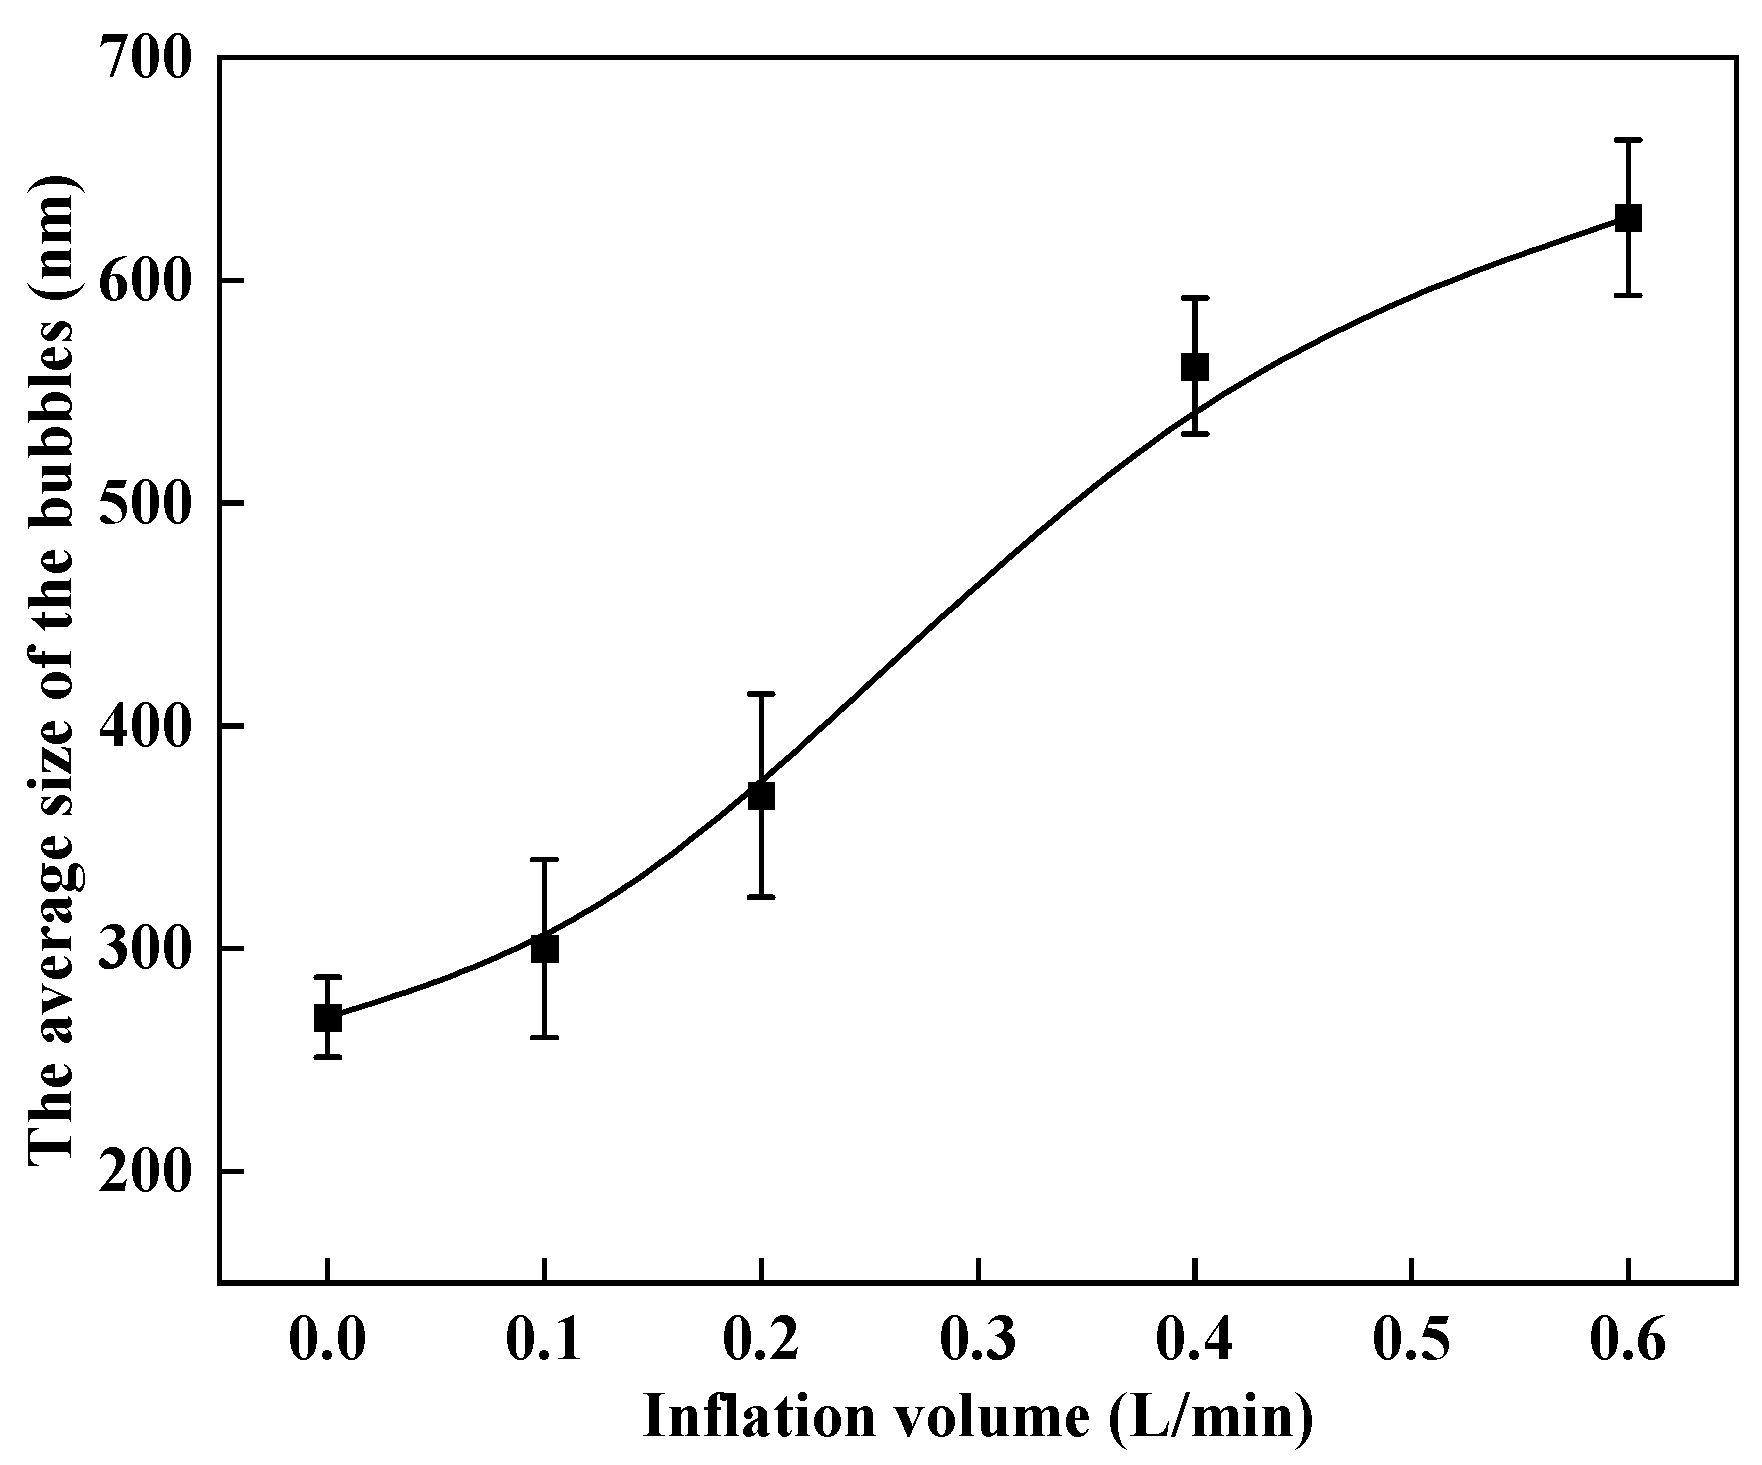
3.1. Bubble Cavitation Property Test Results

The amount of dissolved gas in water, to some extent, determines the ability to generate bubbles. Our experiment investigated the degree of bubble formation in different waters by testing dissolved oxygen in water. The probe of the dissolved oxygen meter was inserted into freshly prepared deionized water (DI water), degassed water (DW), vacuum-treated degassed water, nonaerated micro–nanobubble water (MNB water), and aerated micro–nanobubble water. Then, seven sets of oxygen content values were measured for the first 15 s of the five water samples, the average value was taken, and the experiment was repeated three times. The experimental results are shown in Figure 2.
As shown in Figure 2, the ranking for the measured dissolved oxygen content in descending order was micro–nanobubble water, deionized water, and degassed water. Among them, untreated deionized water has a dissolved oxygen content of 7.63 mg/L. The degassing method of a heating treatment can remove more than 70% of dissolved oxygen in water, which amounts to 2.13 mg/L. Continuing the vacuum treatment after heating can significantly reduce dissolved oxygen in water, with a dissolution rate of 1.73 mg/L. Micro–nanobubble water prepared with a bubble generator, under the condition of no external inflation, has an 18% increase in dissolved oxygen compared with that of deionized water, reaching 9.29 mg/L. After additional inflation, the dissolved oxygen in the water continued to increase, but the effect was not significant, only increasing by 0.63 mg/L. Research has shown that the more dissolved gas in water, the more micro–nanobubbles form and the more likely they are to exist stably. Degassing and depressurization help to remove fine gas nuclei in the aqueous phase, while bubble generator treatment and external inflation can promote an increase in fine gas nuclei, which is conducive to the formation of micro- and nanobubbles.
The stability of micro–nanobubbles is an important indicator affecting the efficiency of flotation operations. Based on the measured changes in micro–nanobubbles with standing time, the stability differences in micro–nanobubbles generated in pure water and aqueous solutions containing 50 mg/L of 2-octanol were analyzed, as shown in Figure 3.
As can be seen in Figure 3, the bubbles prepared using the bubble generator are at the nanoscale, and as the settling time is prolonged, the bubble size shows a trend of first decreasing and then increasing. The average size is the smallest when the settling time is 10 min. In addition, after the bubble generator stops circulating, large bubbles in the water will rupture in a relatively short period of time, some of which can even reach the millisecond level. Thus, mainly small-sized bubbles accumulate after the bubble water is left standing. In addition, the addition of 2-octanol results in a smaller average size of the generated micro–nanobubbles compared with those in pure water, and the average size variation is smaller, indicating the strong stability of micro–nanobubbles in 2-octanol solutions.
Figure 4a shows the size distribution of micro- and nanobubbles in pure water. The size distribution of micro- and nanobubbles is wider when left standing for 1 min. With a longer standing time, due to the rupture of larger bubbles in water, the size distribution of micro- and nanobubbles shifts to the left. After standing for 30 min, due to the merging or rupture of smaller bubbles in the water, the size distribution of bubbles shifts to the right. Figure 4b shows the size distribution of micro–nanobubbles in a solution containing 50 mg/L of 2-octanol. The bubble size shows a pattern of first decreasing and then increasing with a prolongation of standing time. However, compared with the size distribution in pure water, the addition of 2-octanol results in a smaller change in bubble size. On the other hand, after standing for 1 h, DLS can still detect nanoscale bubbles, and the bubble size in the presence of 2-octanol in water is smaller than that in pure water, indicating once again that micro–nanobubbles have strong stability in 2-octanol solutions. Research indicates that the presence of 2-octanol may extend the time of merging between bubbles, improve the stability of bubble liquid films, and make bubbles less prone to rupture.
Bubble generators have been widely confirmed to be able to produce micro–nanobubbles. The results of cavitation nucleation tests based on dissolved oxygen testing also indicate that the content of dissolved gas nuclei in micro–nanobubble water is higher than that in ordinary water. Bubble size has an extremely important impact on the flotation process, making it essential to conduct in-depth and systematic studies on micro–nanobubble size. The effects of various conditional variables on the size distribution of micro–nanobubbles were studied.
As one of the most commonly used foaming agents in mineral processing, the effect of different concentrations of 2-octanol on the size of micro–nanobubbles was studied. The test results are shown in Figure 5 and Figure 6.
As shown in the figure, the average bubble size generated by the bubble generator at different concentrations of 2-octanol is mainly concentrated at 300–400 nm, and as the concentration of 2-octanol increases, the size distribution curve of bubbles shifts to the left and their corresponding average size gradually decreases. The addition of 2-octanol can reduce the surface tension at the gas–liquid interface, thereby inhibiting bubble coalescence and enhancing the stability of the gas–liquid film. Simultaneously, the surfactant adsorbs onto the bubble surface, stabilizing the cavities and preventing their collapse and coalescence, which reduces the intensity of bubble rupture, which is beneficial for the reduction in bubble size [40].
The cycle processing time directly affects the shear degree of bubbles. This experiment studied the effect of cycle processing time on the size of micro–nanobubbles by controlling the pump operation time. The size distribution and average size are shown in Figure 7 and Figure 8, respectively.
As can be seen from the results in Figure 7 and Figure 8, the cycle processing time significantly affects the size of micro- and nanobubbles. With the increase in cycle processing time, the average size of micro- and nanobubbles decreases, and the size distribution curve shifts to the left. After adding 50 mg/L of 2-octanol, the generated bubbles are all at the nanoscale, and the size of the bubbles is smaller and narrower. At the beginning of the cycle, due to the intense liquid flow, the size of micro- and nanobubbles generated in the solution is larger. As the cycle processing time becomes prolonged, the liquid flow gradually stabilizes, and the larger bubbles continuously shear into smaller bubbles. At this time, the size of micro- and nanobubbles in the solution becomes smaller and smaller. This further proves that the addition of 2-octanol is conducive to the stability of micro–nanobubbles, and smaller bubbles are generated.
The influence of gas nucleus quantity on the average size and size distribution of micro–nanobubbles was studied by adjusting the inflation rate. The detection results are shown in Figure 9 and Figure 10, respectively.
As shown in Figure 9 and Figure 10, the average size of the bubbles is the smallest when not inflated, and as the inflation volume increases, the average size of the bubbles gradually increases. When not inflated, bubbles are more easily sheared into small bubbles in the bubble generator. As the inflation volume increases, more gas nuclei dissolve in water, and the number of micro–nanobubbles formed via gas nucleus precipitation increases, leading to a more significant probability of bubble collision and merging. Overall, the addition of inflation has expanded the range of bubble sizes, and the overall range shows a gradually increasing trend.
In summary, the size of micro–nanobubbles is influenced by the concentration of 2-octanol, the cycle processing time of the bubble generator, and the amount of external inflation. The introduction of 2-octanol can make micro–nanobubbles in water smaller and more stable, and bubble size decreases with an increase in the 2-octanol concentration. The average particle size of the generated micro–nanobubbles was 200–350 nm. An appropriate cycle processing time is conducive to the formation of micro–nanobubbles; as the cycle processing time increases, the bubble size shows a trend of first decreasing and then stabilizing. An additional amount of inflation can also provide a large amount of gas nuclei to the solution, which is conducive to the formation of micro–nanobubbles, but the bubble size significantly increases.

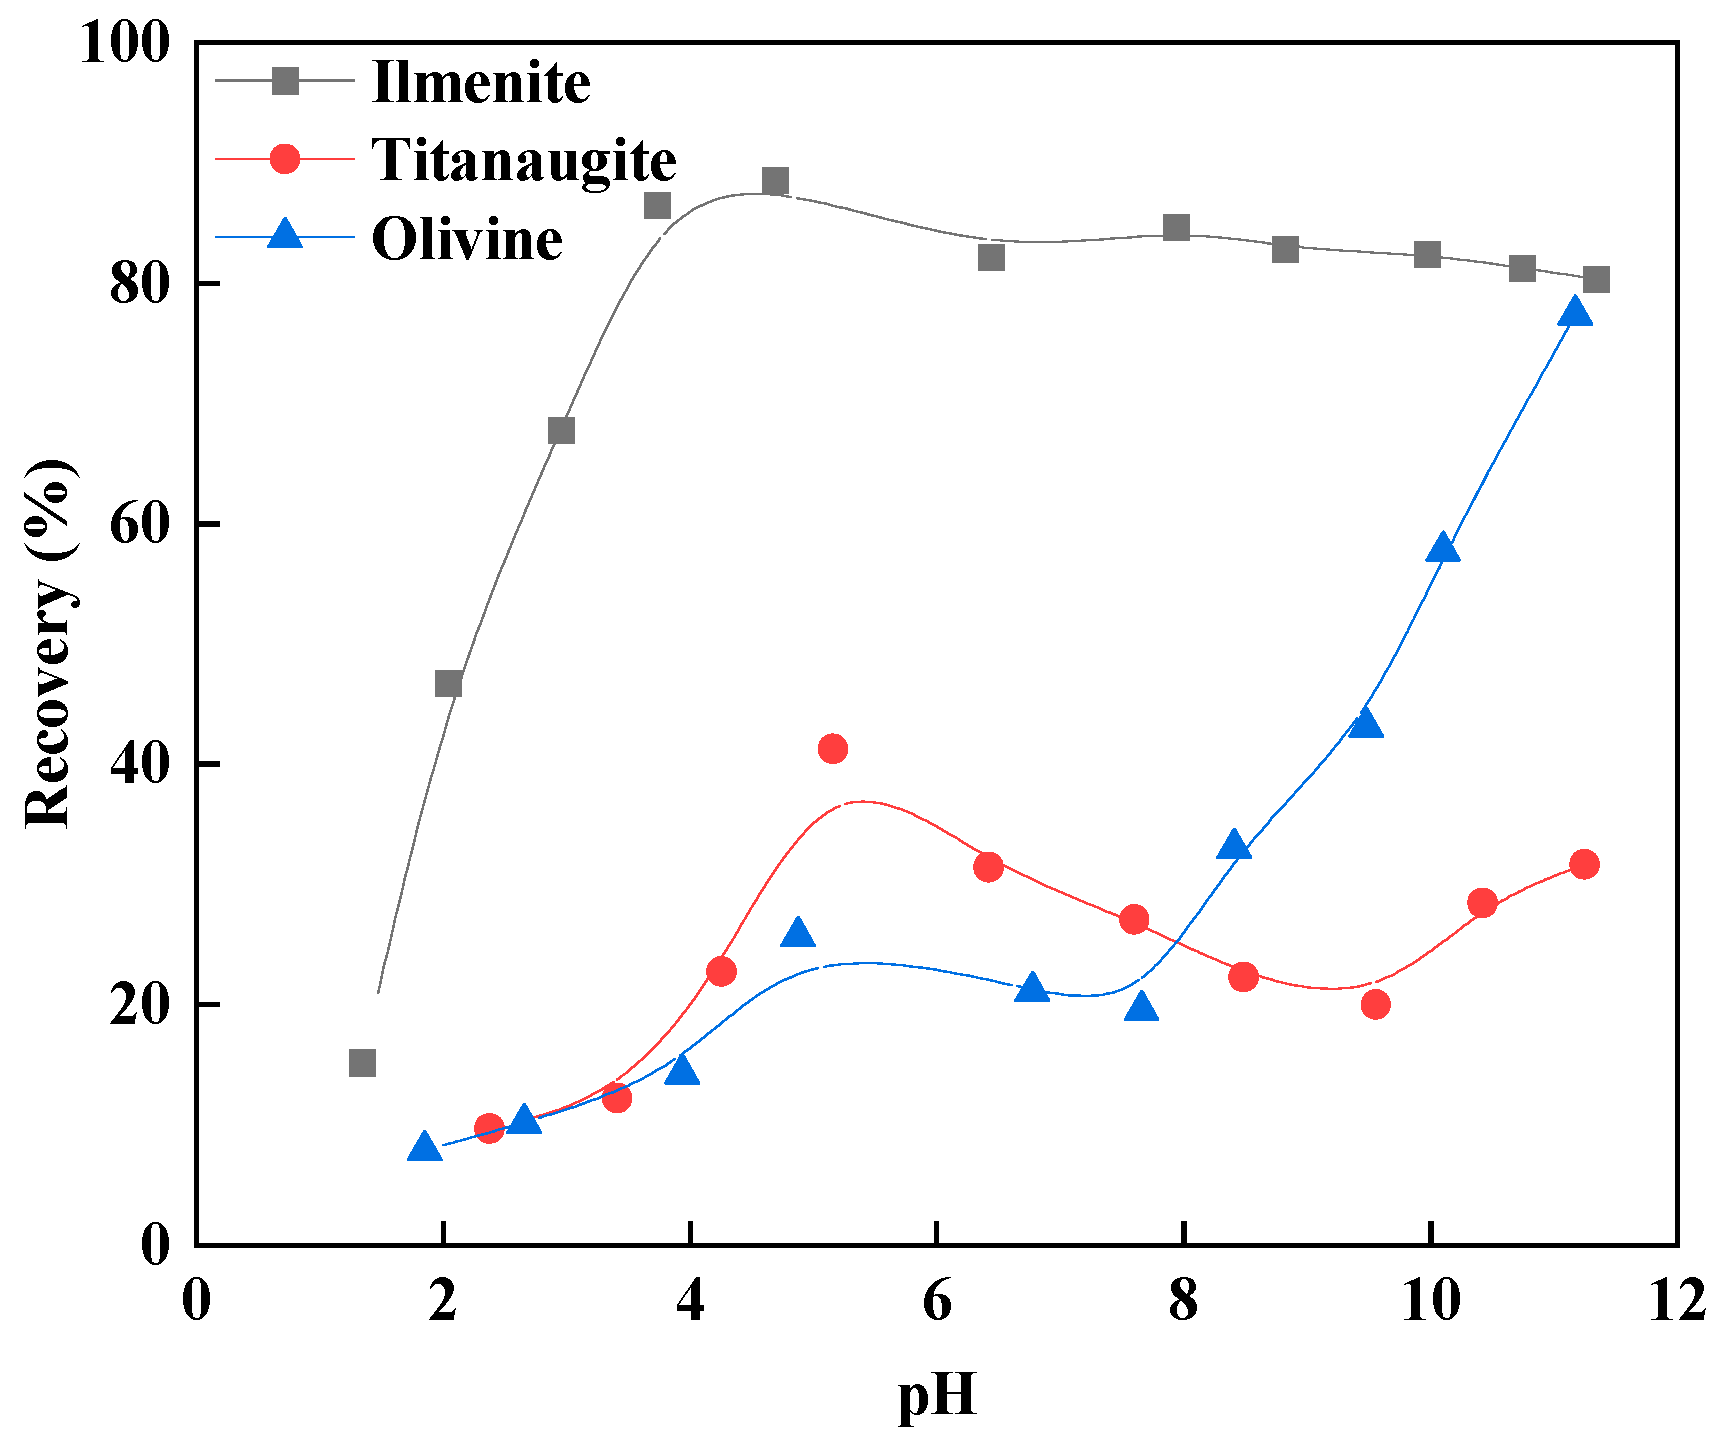
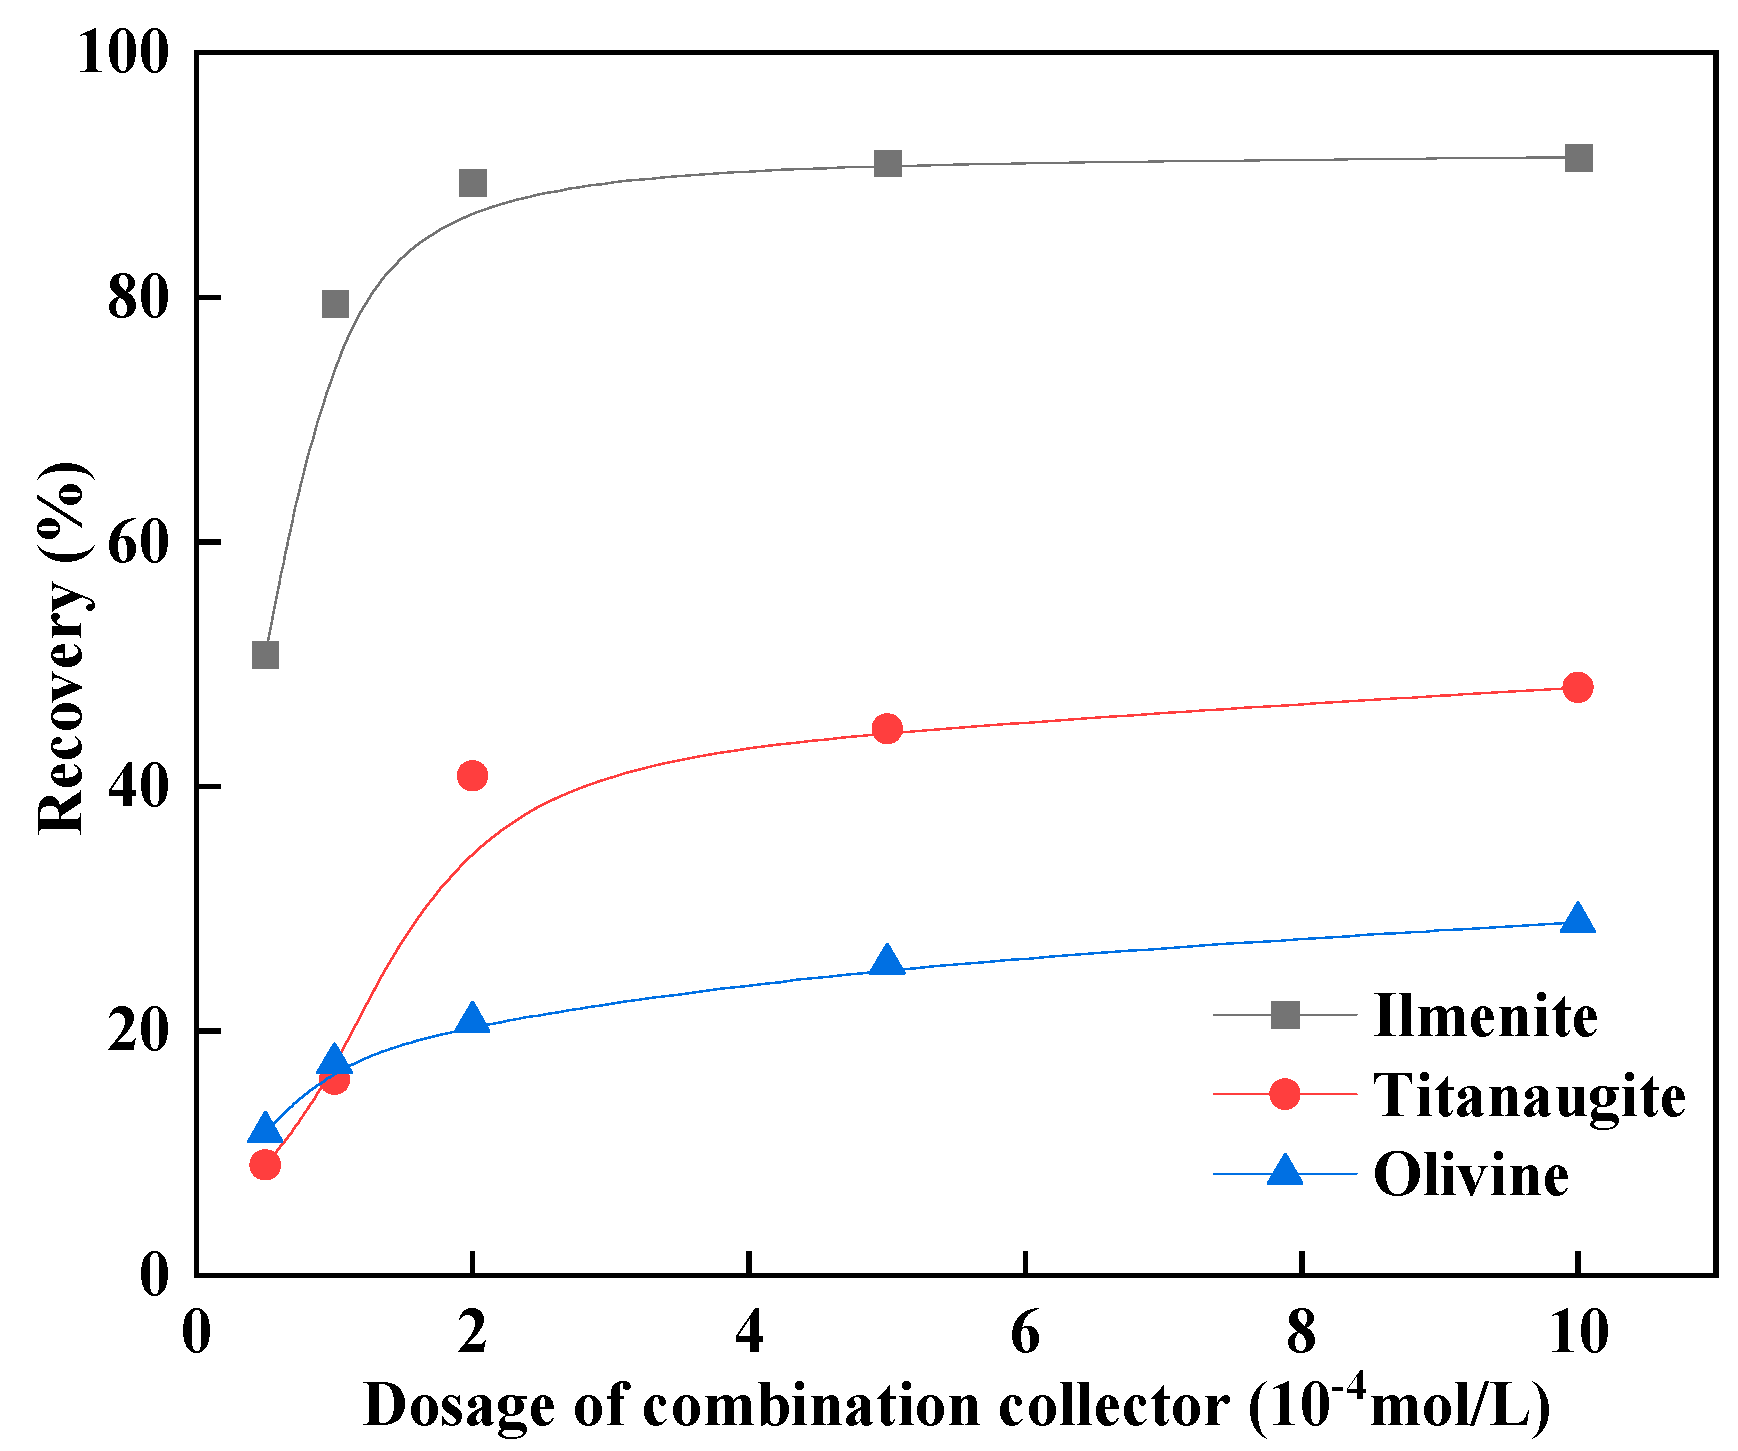
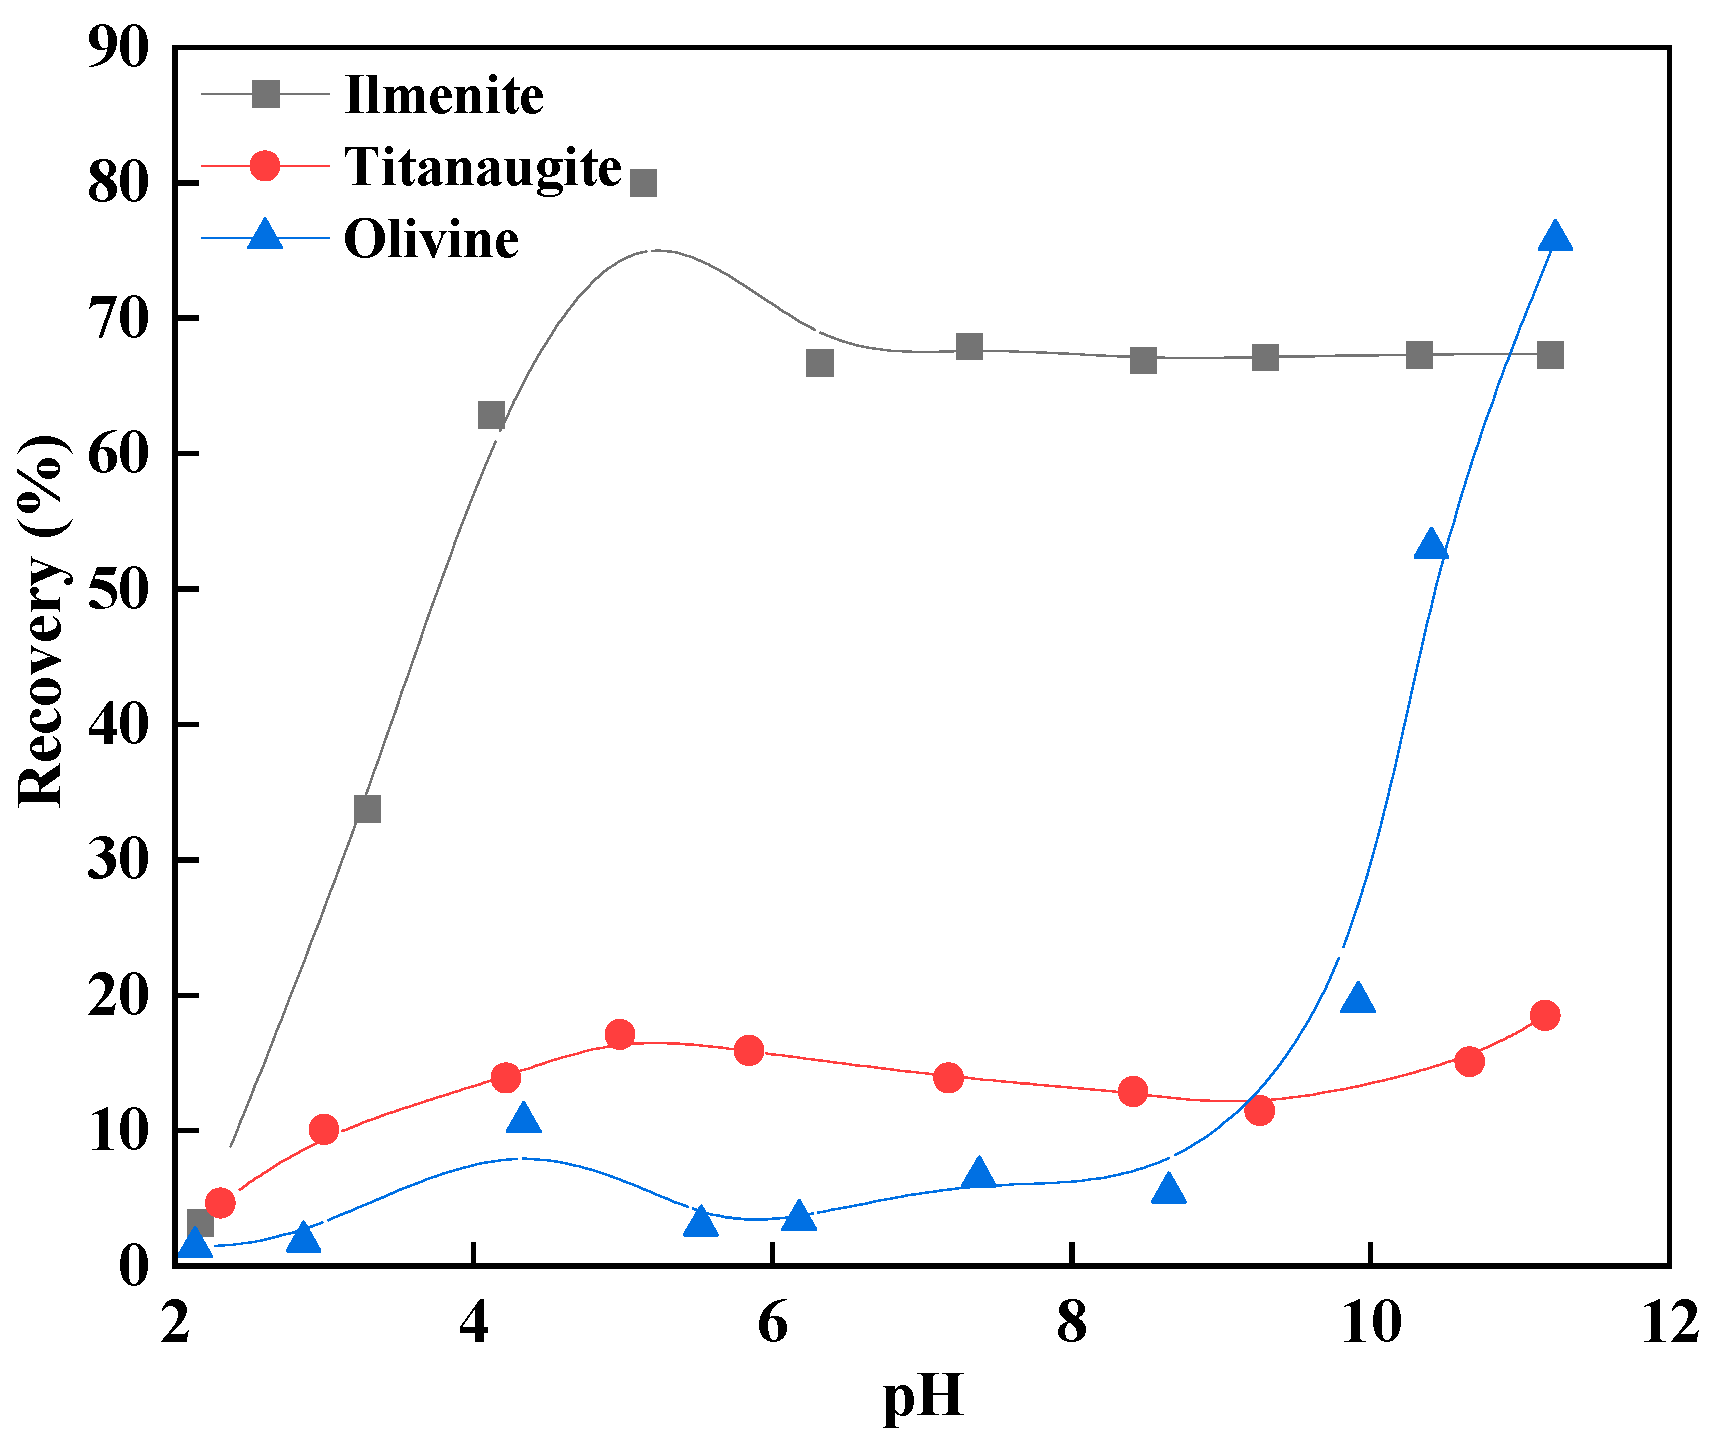
3.2. Micro-Flotation Test Results

To evaluate the effect of micro–nanobubbles on the flotation separation of fine-grained ilmenite, titanaugite, and olivine, micro-flotation experiments were conducted. Using a combined collector of NaOL and SLS in a mole ratio of 4:1, with a fixed total dosage of 2 × 10⁻⁴ mol/L, the effects of the combined collector on the floatability of ilmenite, titanaugite, and olivine under different pH conditions are illustrated in Figure 11. From the analysis of the figure, it can be concluded that when pH < 4.0, the floatability of ilmenite is significantly enhanced; when pH = 6.0–10.0, the floatabilities of rutile and olivine are significantly improved, indicating that the combination of NaOL and SLS collectors exhibits a certain synergistic effect on all three minerals. When the pH is between 5.0 and 6.0, the flotation abilities of ilmenite and titanaugite are relatively high, which is consistent with the results of other papers [41]. Therefore, this pH range was selected to study the effect of the combined collector dosage on the flotation abilities of ilmenite, titanaugite, and olivine.
The effect of NaOL and SLS (molar ratio of 4:1) combined collector dosage on the floatability of ilmenite, titanaugite, and olivine is shown in Figure 12 when the pH is between 5.0 and 6.0. As seen from the graph analysis, when the amount of collector is less than 2 × 10⁻⁴ mol/L, the floatability of ilmenite and titanaugite significantly improves with an increase in collector amount. Further increasing the amount leads to stable floatability. The floatability of olivine slowly increases with an increase in the amount of combined collector. Under the anionic collector system, the flotation recovery rate of olivine in alkaline solutions is relatively high, which is attributed to the formation of magnesium and calcium oleate compounds, whereas this effect is weaker under acidic conditions [4]. The pH conditions selected for the experiment were between 5 and 6; thus, as the dosage of the collector increased, the recovery rate of olivine rose more slowly than that of ilmenite and titanaugite. When the amount of collector is 2 × 10⁻⁴ mol/L, the flotation separation effect of ilmenite is the best.
The effect of sodium silicate on the floatability of fine-grained ilmenite, titanaugite, and olivine in different pH environments is shown in Figure 13 (flotation conditions: sodium silicate dosage = 10 mg/L). As can be seen from the graph analysis, the addition of sodium silicate has a relatively small inhibitory effect on ilmenite, and its recovery rate is basically stable at around 70%; when pH > 4.0, sodium silicate has a significant inhibitory effect on titanaugite; and when pH = 4.0–8.0, the inhibitory effect of sodium silicate on olivine is significant.
The effect of sodium silicate dosage on the floatability of fine-grained ilmenite, titanaugite, and olivine when pH = 5.0–6.0 is shown in Figure 14. The increase in the amount of sodium silicate does not have a significant inhibitory effect on ilmenite but has a significant inhibitory effect on titanaugite and olivine, indicating that sodium silicate has a good selective inhibitory effect. When the amount of sodium silicate is 20 mg/L, the flotation separation effect of ilmenite is optimal.
Freshly made micro–nanobubble water was added to the flotation slurry to investigate the separation effect of fine-grained ilmenite, titanaugite, and olivine mixed ore. Table 1 shows the results of the artificial mixed ore flotation test under the action of micro–nanobubbles (flotation conditions: collector dosage = 2 × 10⁻⁴ mol/L, sodium silicate dosage = 20 mg/L). The experimental micro–nanobubble water was prepared under the following conditions: the concentration of 2-octanol was 50 mg/L; inflation of 0.1 L/min; and the cycle processing time of the bubble generator was 2 min. The water should not be left to stand still; it should be prepared and used on site. The micro–nanobubble water used in subsequent tests was prepared under these conditions.
The results of the artificial mixed ore flotation test showed that using a combination of NaOL and SLS collectors, a titanium concentrate with a yield of 34.05%, a TiO2 grade of 31.07%, and a recovery rate of 61.53% was obtained. Under the same conditions, when adding micro–nanobubble water for flotation, a titanium concentrate with a yield of 36.74%, a TiO2 grade of 32.52%, and a recovery rate of 68.59% can be obtained. Introducing a certain amount of micro–nanobubble water can effectively improve the grade and recovery rate of concentrate products. Micro–nanobubbles are beneficial for the flotation separation of fine-grained ilmenite, titanaugite, and olivine.

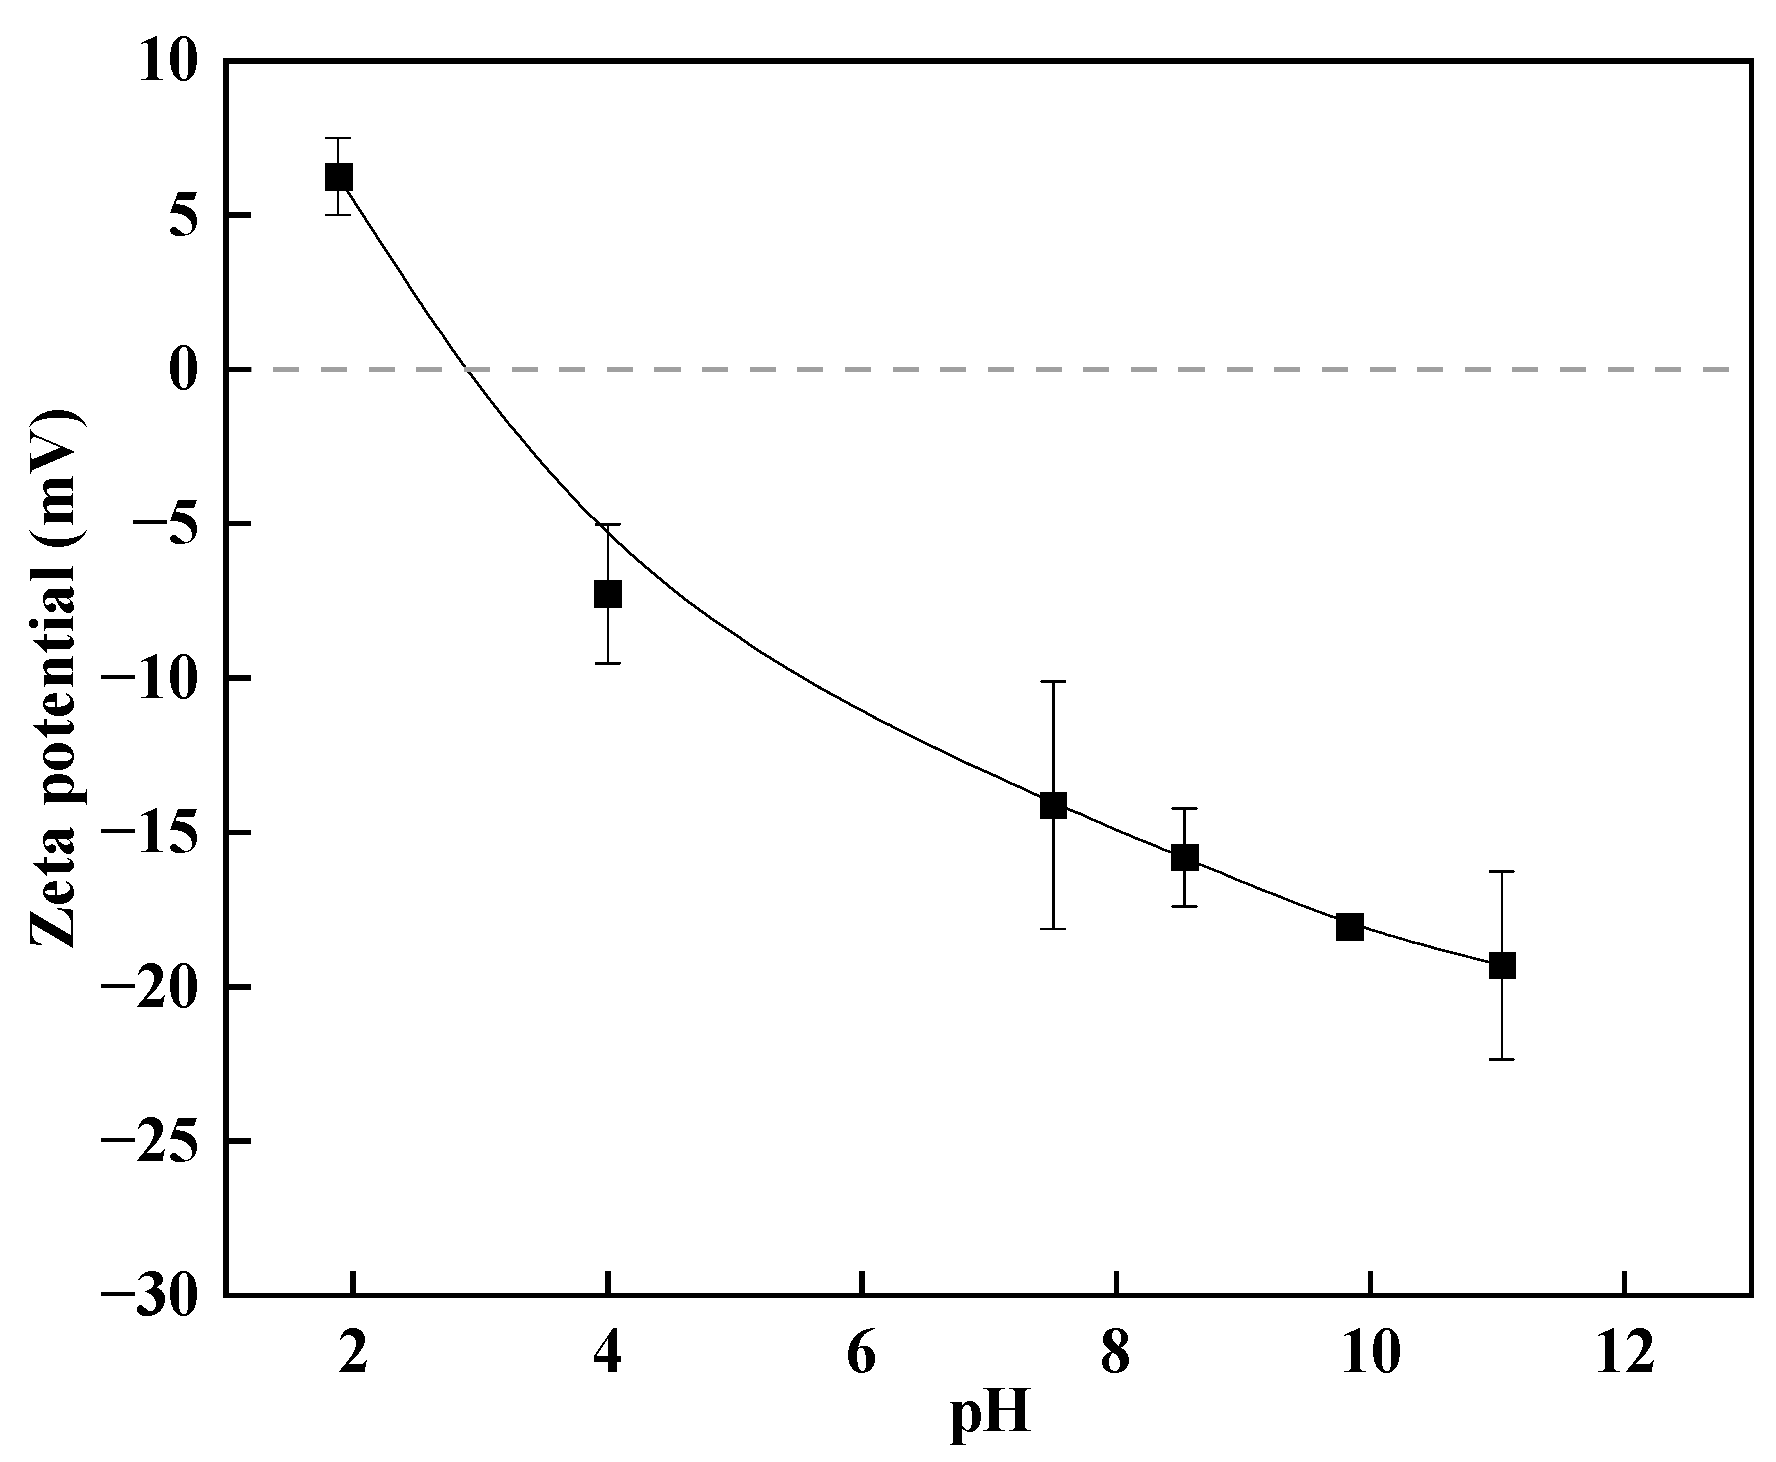
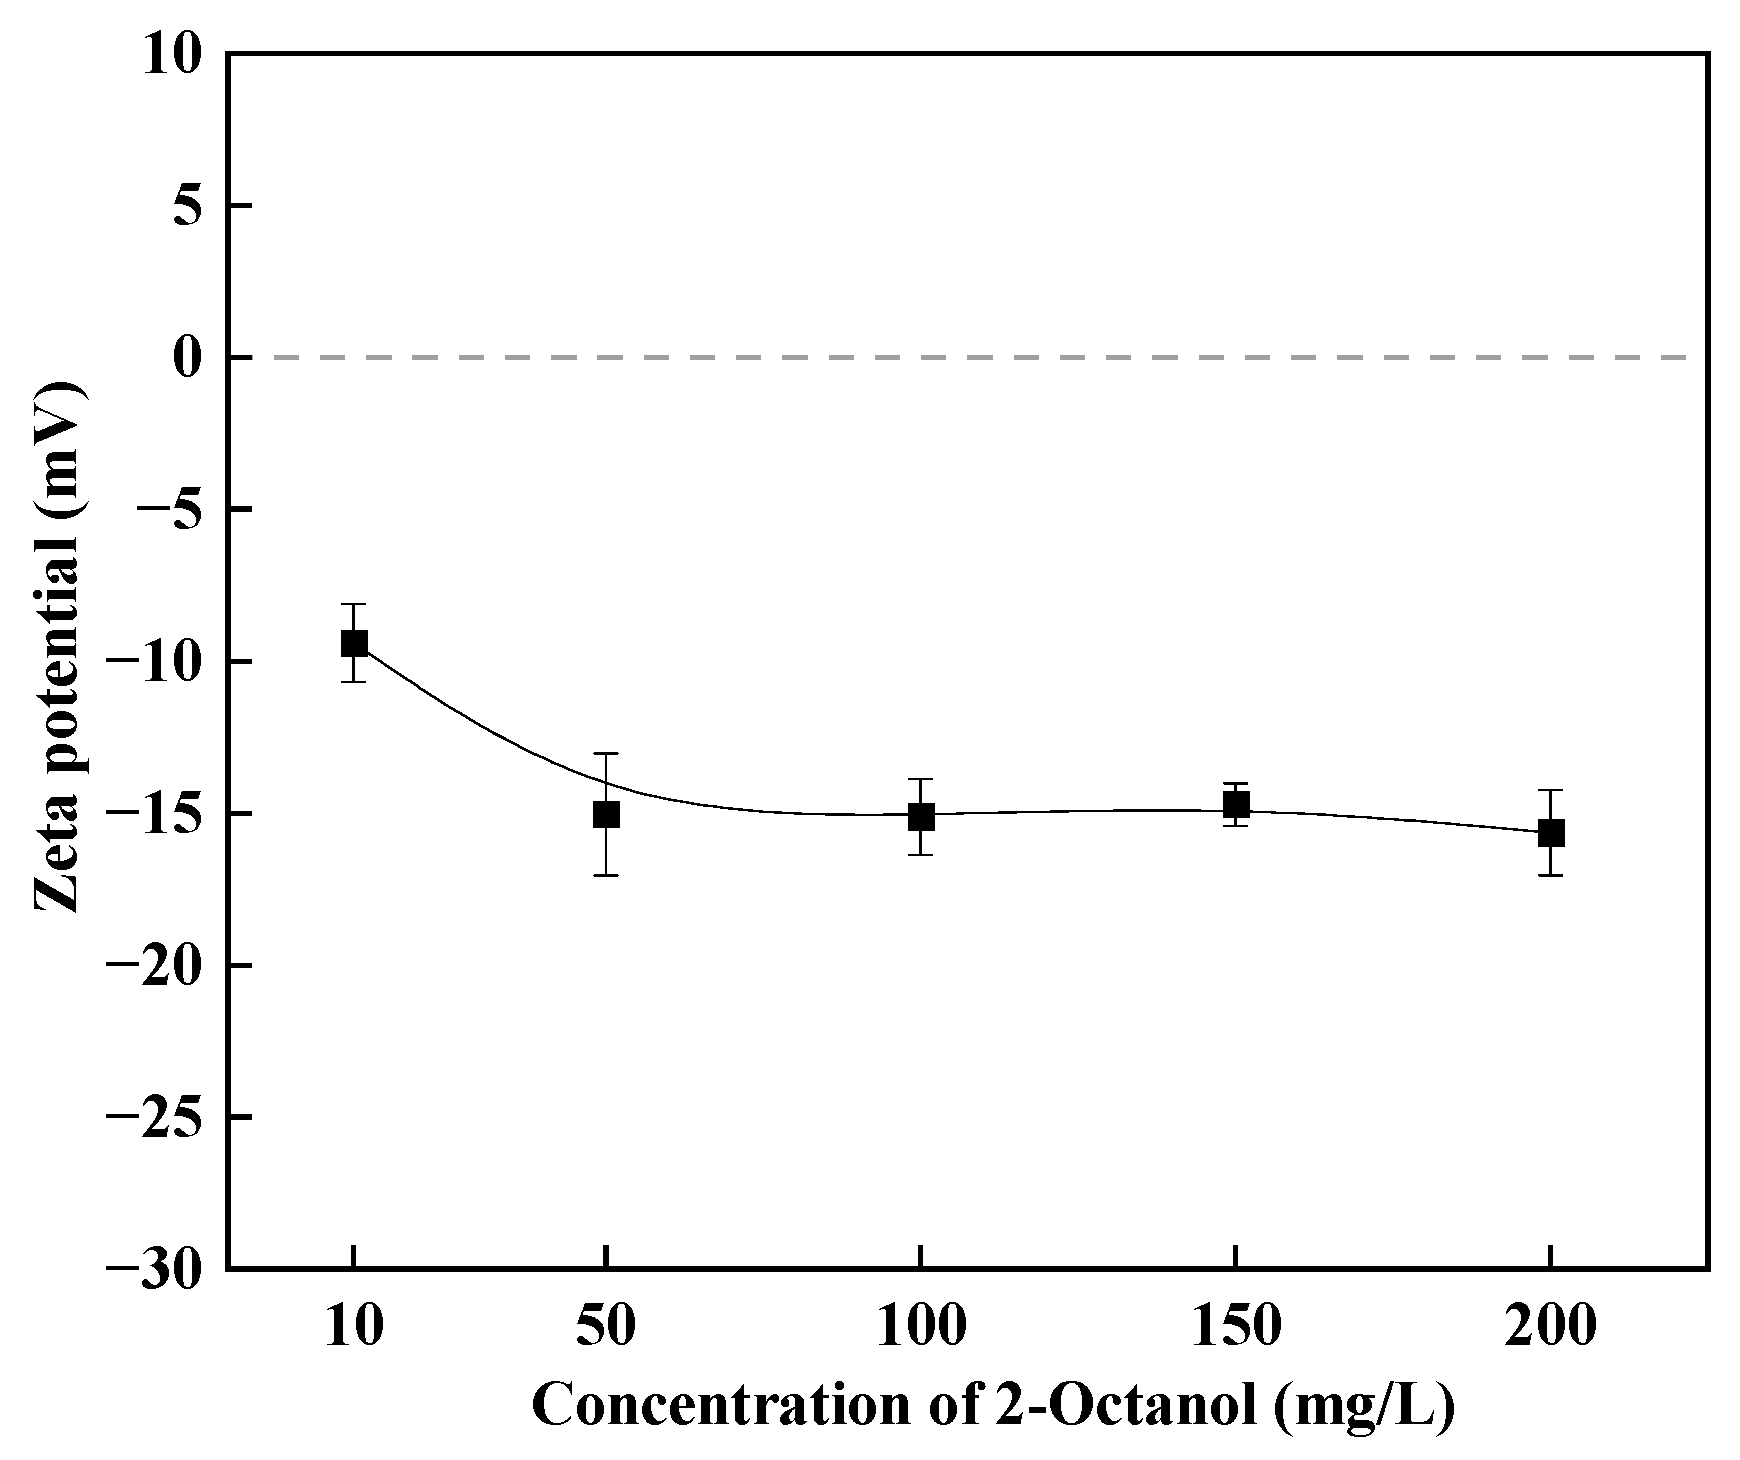
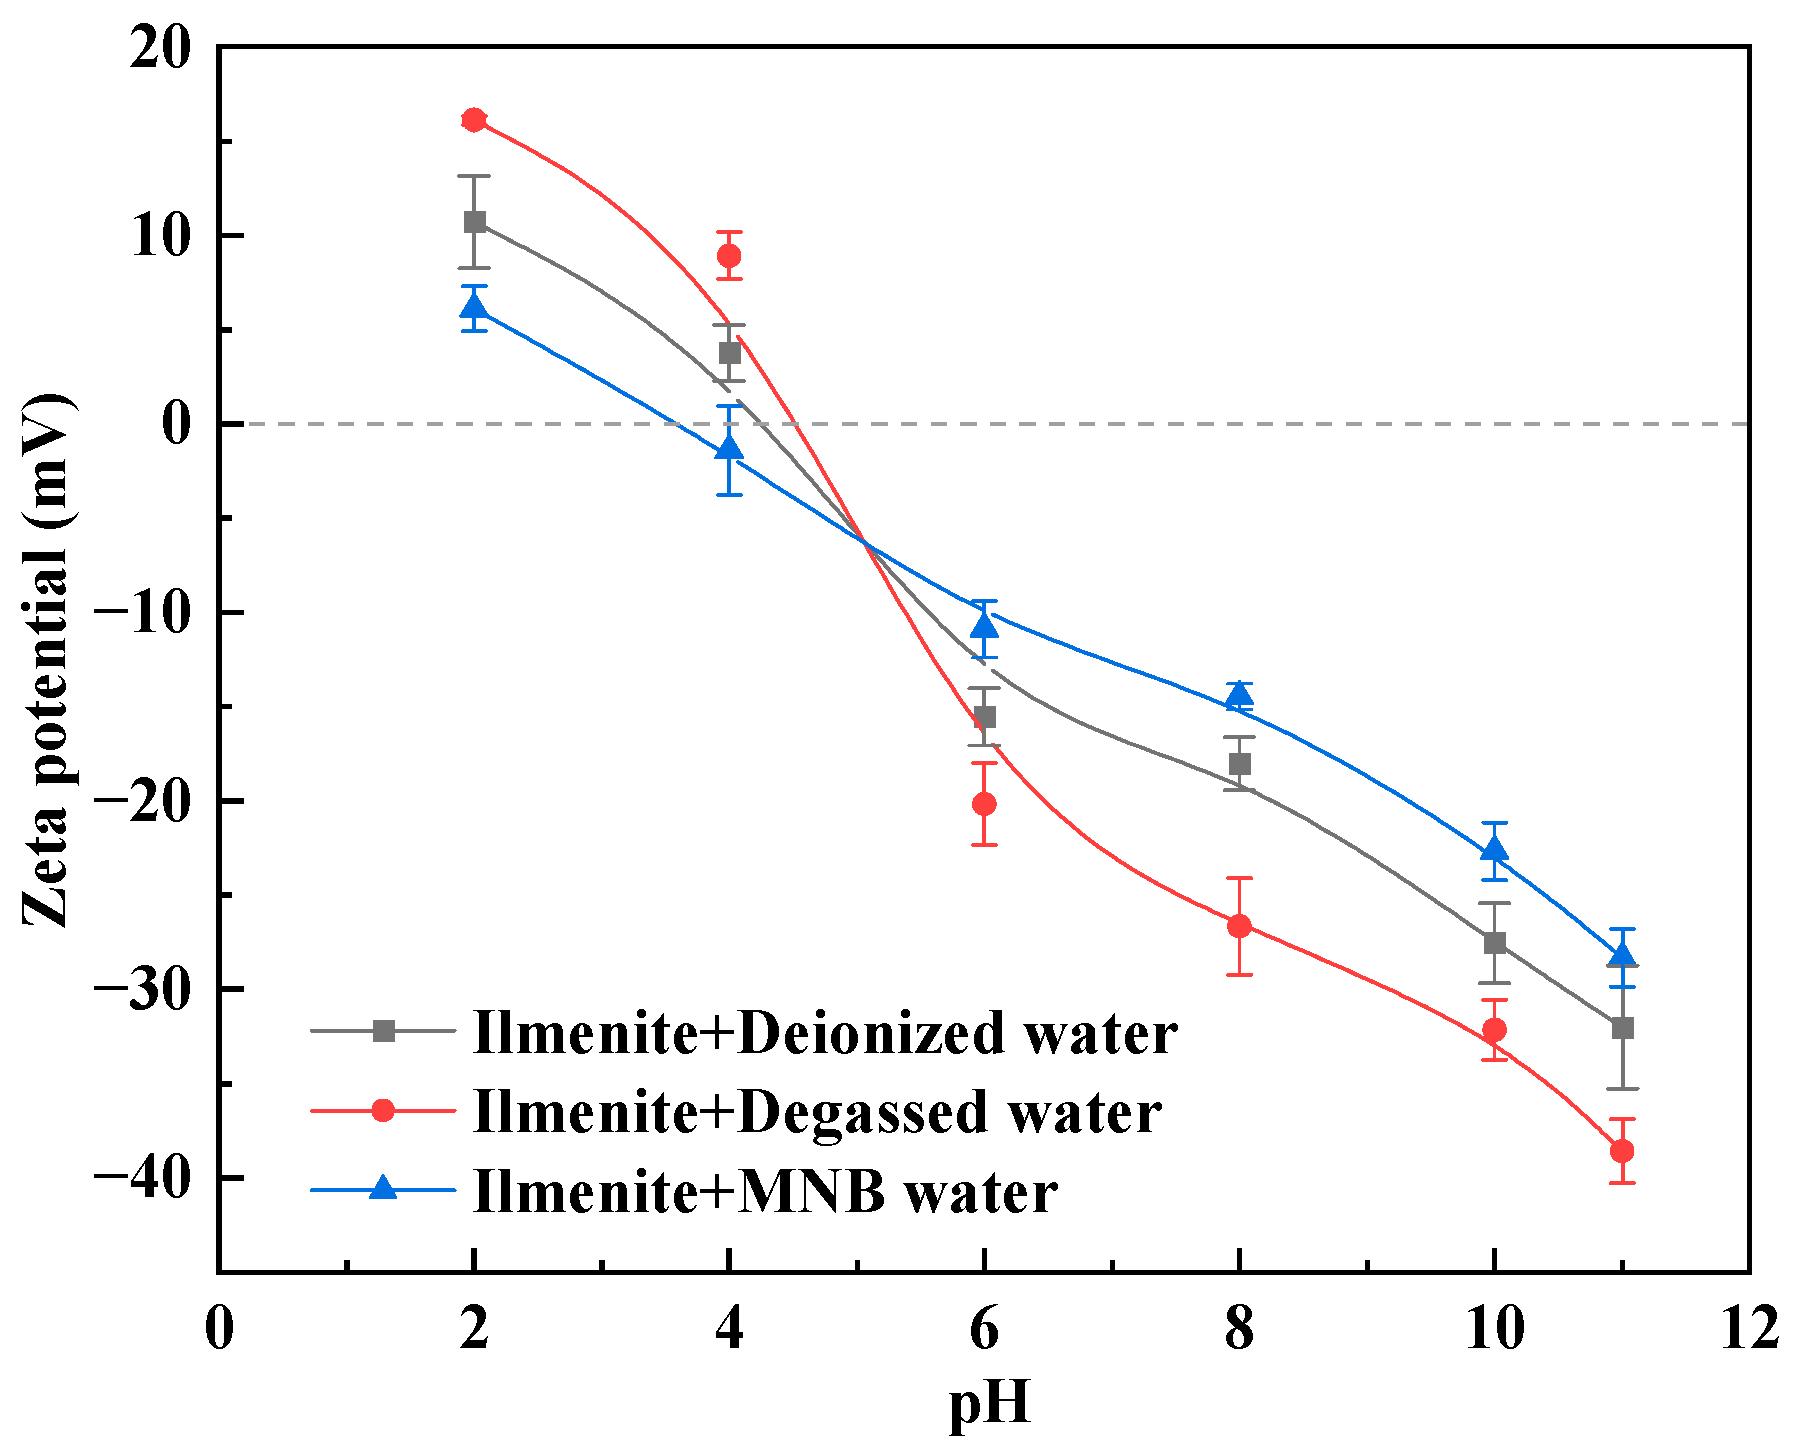
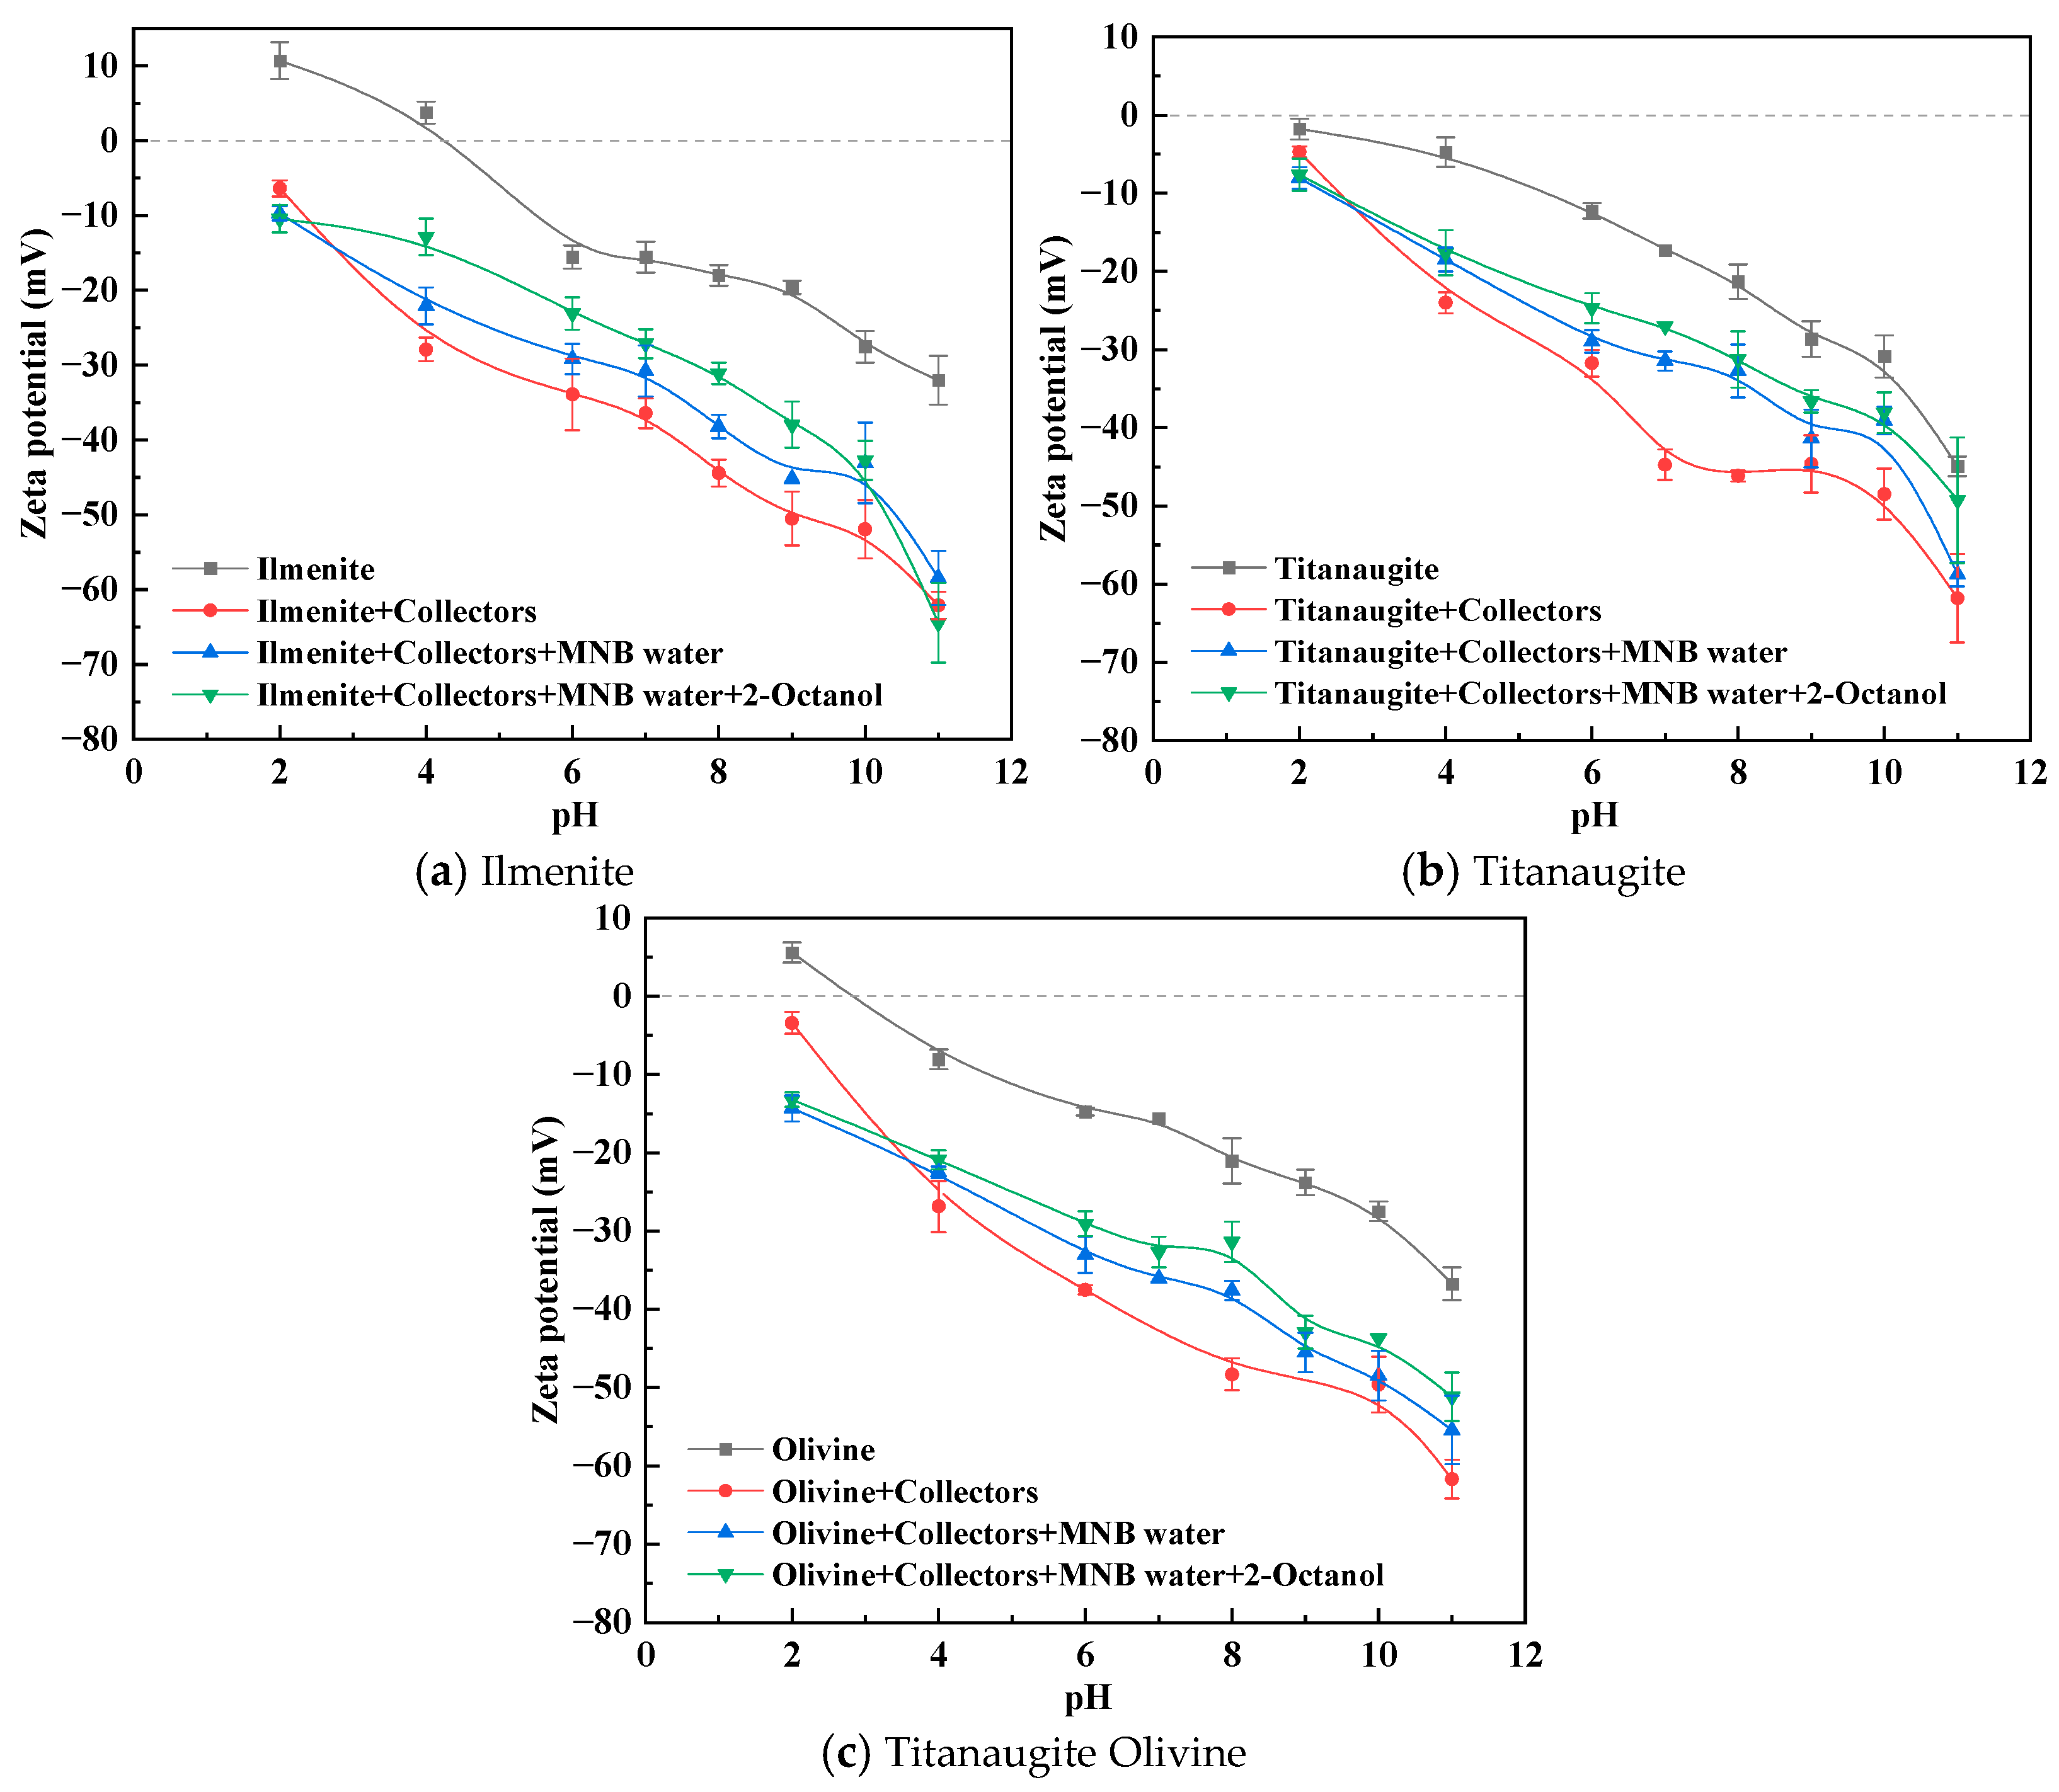
3.3. Zeta Potential Analysis

Figure 15 shows the effect of different pH values on the zeta potential of micro–nanobubbles in pure water. The zeta potential of micro–nanobubbles decreases with increasing pH. Under acidic conditions, H+ in the liquid dominates and is adsorbed on the surface of the bubble, causing the surface potential of the bubble to be positively charged and reach the isoelectric point at a pH of around 3.0. As the pH increases, the concentration of OH in the liquid gradually increases, and the surface potential of the micro–nanobubbles shifts negatively. Under neutral conditions, the surface charge of the bubble is clearly negative. Research has shown that due to the ionization of water molecules into H+ and OH, OH is more easily adsorbed on the surface of the bubble and arranged inside the electric layer of the bubble, resulting in a negative charge on the surface of the bubble. As the pH continues to increase, the electrostatic repulsion between bubbles increases as the ions in the liquid are dominated by OH. During the flotation process of ilmenite, the pH is often acidic. At this time, the absolute value of the zeta potential of the bubbles is larger, the repulsive force between the bubbles is greater, and the aggregation ability is weaker, which is conducive to the stable existence of micro- and nanobubbles.
Figure 16 shows the effect of different concentrations of 2-octanol on the zeta potential of micro–nanobubbles. As shown in the figure, with an increase in the concentration of 2-octanol, the surface potential of micro–nanobubbles shows a trend of first rapidly decreasing and then tending to plateau. This occurs because when 2-octanol dissolved in water adheres to the surface of micro–nanobubbles, an organic film forms on the surface of the bubbles, causing ion shielding and resulting in a decrease in the zeta potential. When the dissolved 2-octanol adheres to the surface of the bubble and reaches saturation, the increase in 2-octanol concentration makes further reductions in the surface potential of micro–nanobubbles difficult.
In order to illustrate the strengthening effect of micro–nanobubbles in the flotation separation of fine ilmenite, an experimental study was conducted on the impact of micro–nanobubbles on the zeta potential of ilmenite particles in water. The experimental results are shown in Figure 17.
Figure 17 shows the change in the surface potential of fine-grained ilmenite particles as a function of pH. With the increase in pH, the zeta potential of ilmenite particles is continuously negatively shifted. The isoelectric point of ilmenite in three types of water is between 4 and 5. The electrostatic bilayer plays a vital role in the interaction between particles and bubbles, as well as between particles. The smaller the absolute value of the surface potential of mineral particles, the easier they are to aggregate and the easier they are to disperse, and vice versa. The absolute value of the zeta potential of ilmenite is the smallest in micro–nanobubbles in sparkling water and the largest in degassed water. The presence of micro–nanobubbles can reduce the absolute value of the zeta potential of hydrophobic ilmenite, resulting in less electrostatic repulsion of the corresponding ilmenite particles, which is more conducive to the aggregation of mineral particles and enhances the flotation effect of fine-grained ilmenite.
Figure 18 shows the zeta potential of ilmenite, titanaugite, and olivine particles as a function of pH under different conditions. The results show that with an increase in pH, the surface dynamic potentials of the three minerals continue to shift negatively. With the addition of the collector, the potential of the three minerals shifted significantly negatively, indicating that the collector had strong adsorption on the mineral surface. It is worth noting that the introduction of micro–nanobubbles reduces the degree of negative displacement of mineral potential. Since the only change during cavitation is the generation of micro–nanobubbles, the change in the zeta potential of the mineral can be attributed to the attachment of micro–nanobubbles to the surface of the mineral. Some of the collectors are adsorbed on the surface of the air film, resulting in a decrease in the amount of chemicals adsorbed on the surface of the mineral. Similar findings were reported by Snoswell et al. [42] and Ralston et al. [43]. A smaller (absolute) zeta potential value indicates less repulsion between the particles, which enhances the aggregation of the particles.

3.4. Adsorption Capacity Detection

Figure 19 illustrates the standard total organic carbon curve for the combined collector. Figure 20 illustrates the effect of micro–nanobubbles on the adsorption behavior of collectors on ilmenite, titanaugite, and olivine surfaces. The experimental results show that the micro–nanobubbles can significantly enhance the adsorption capacity of these anion combination collectors on the mineral surface. This strengthening effect is mainly due to the fact that the preferential adsorption of collector molecules on the surface of micro–nanobubbles accelerates the diffusion rate of the agent toward the mineral surface. The ultra-high specific surface area and hydrophobic characteristics of micro–nanobubbles provide abundant active sites for agent adsorption.

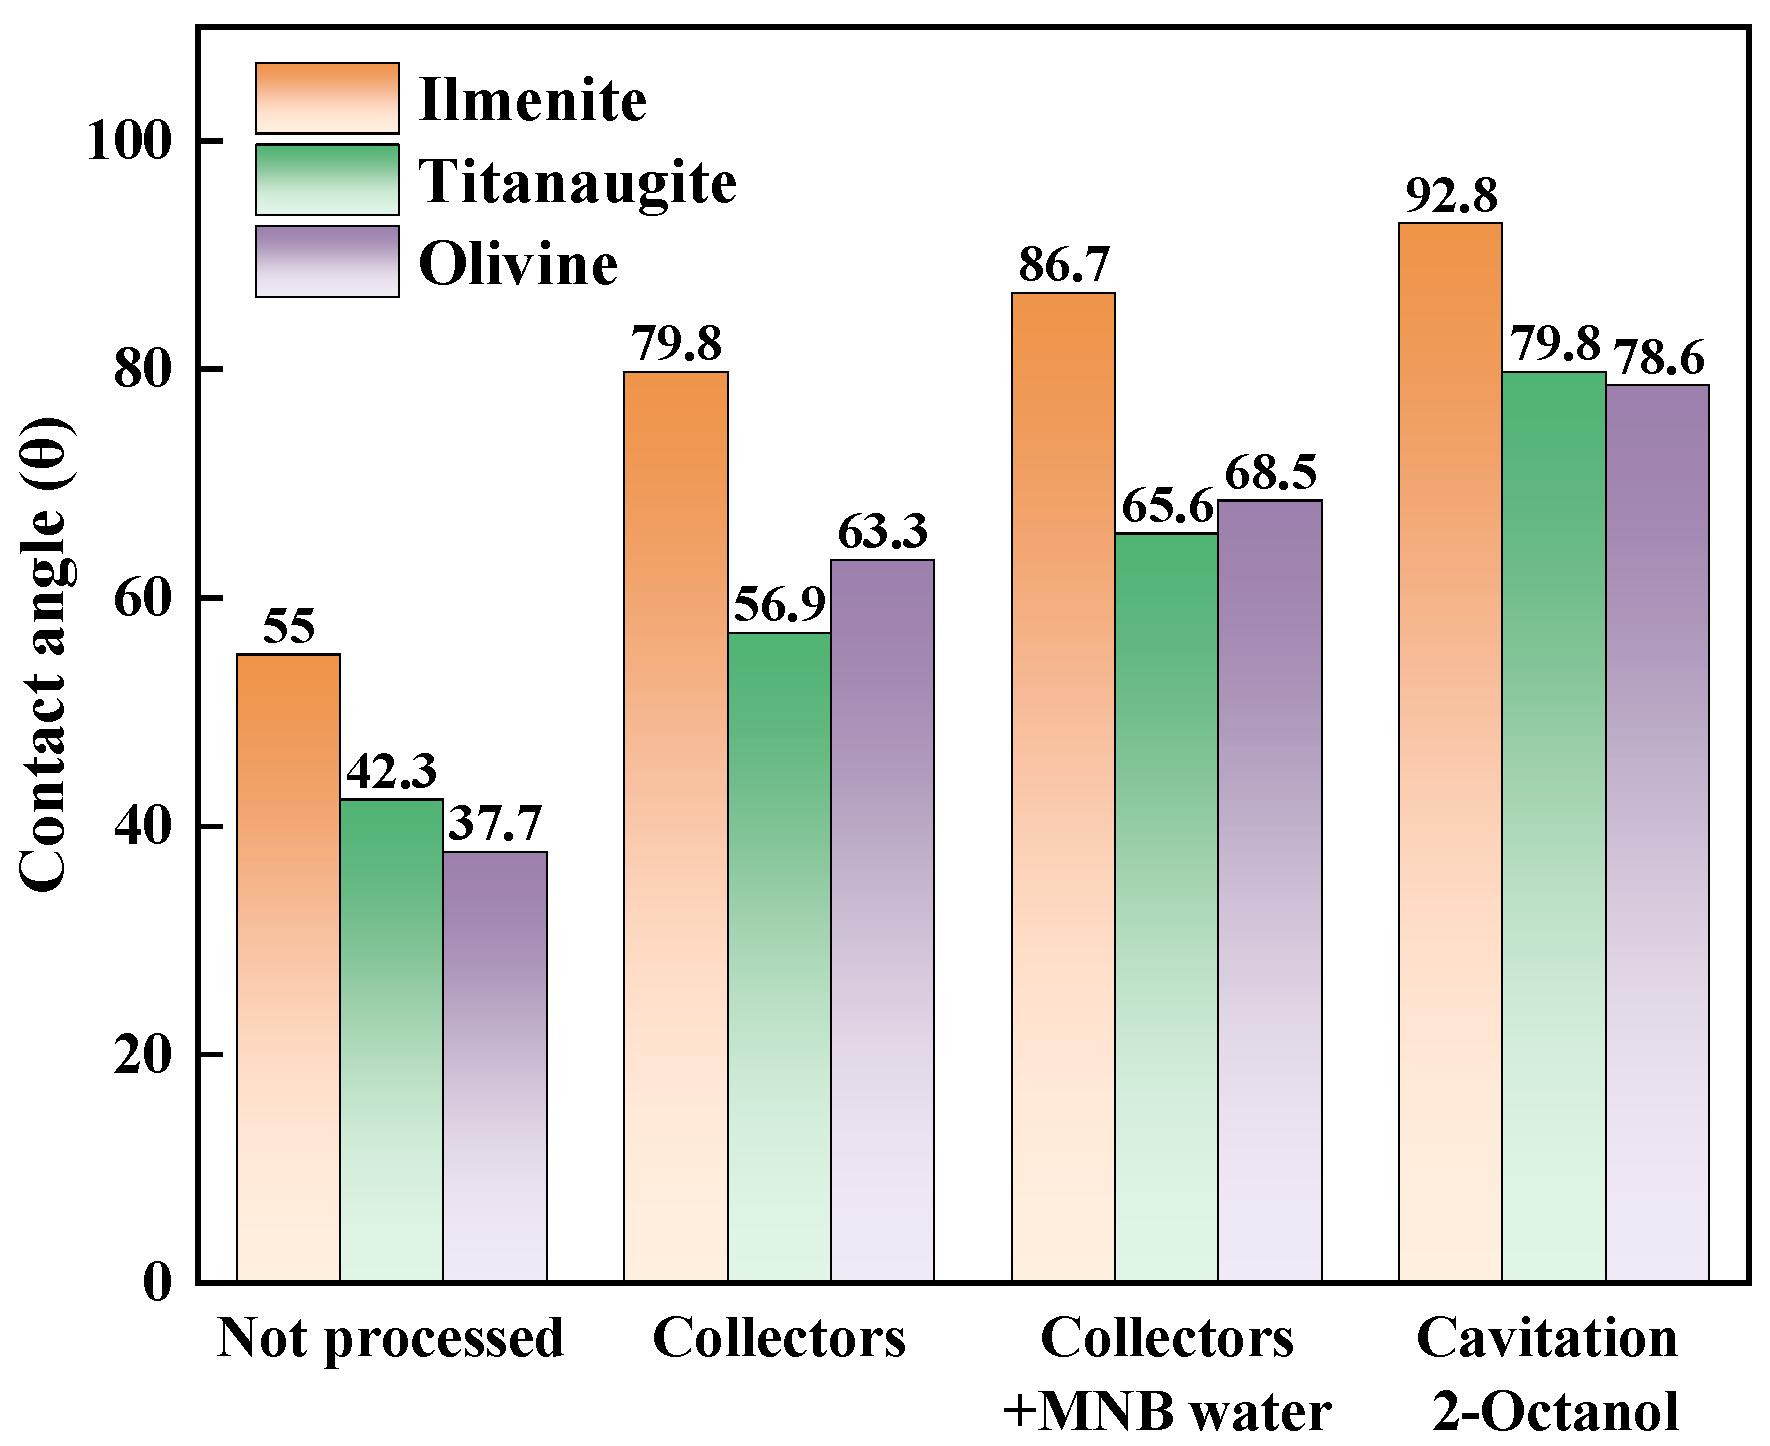
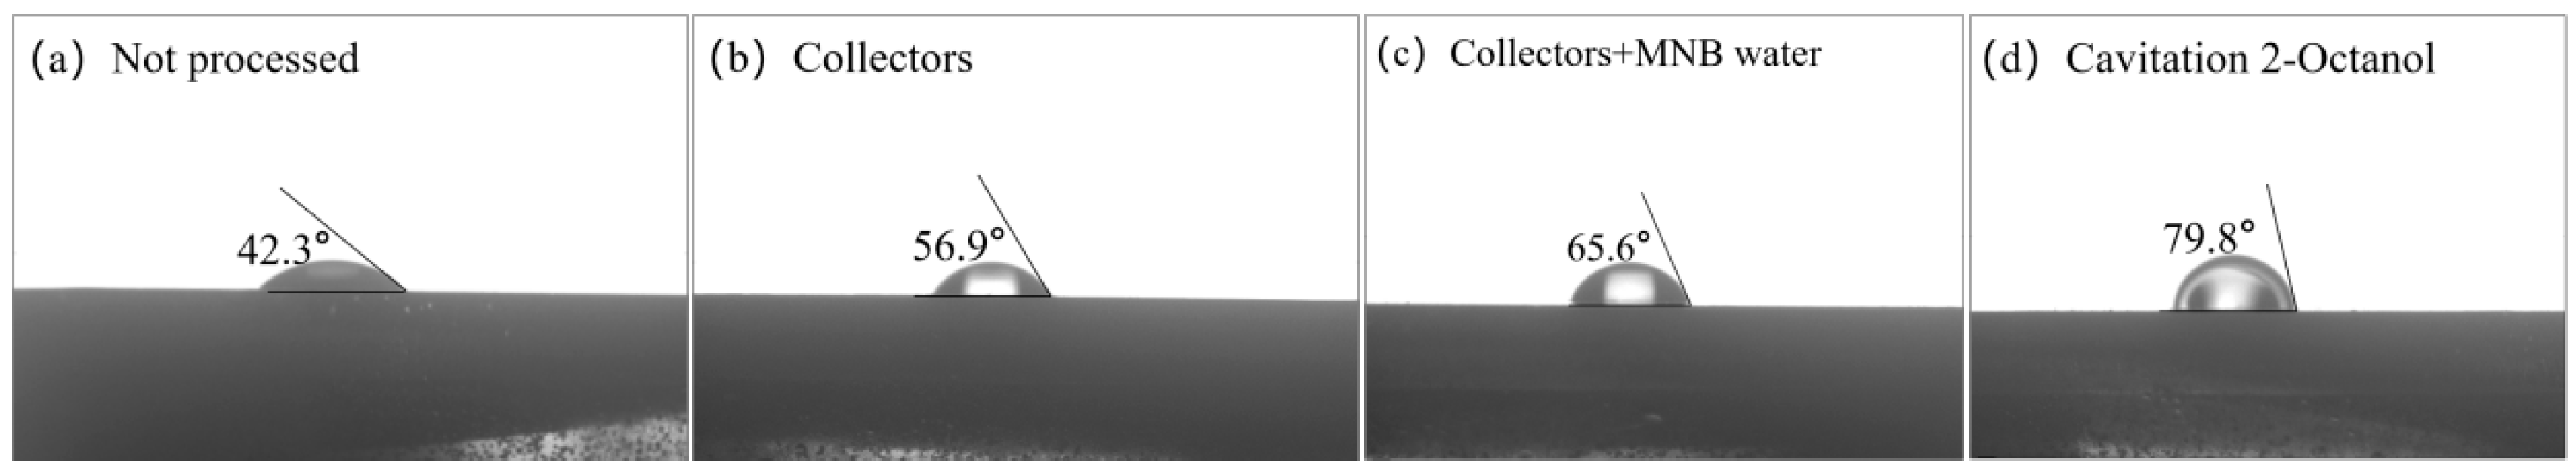
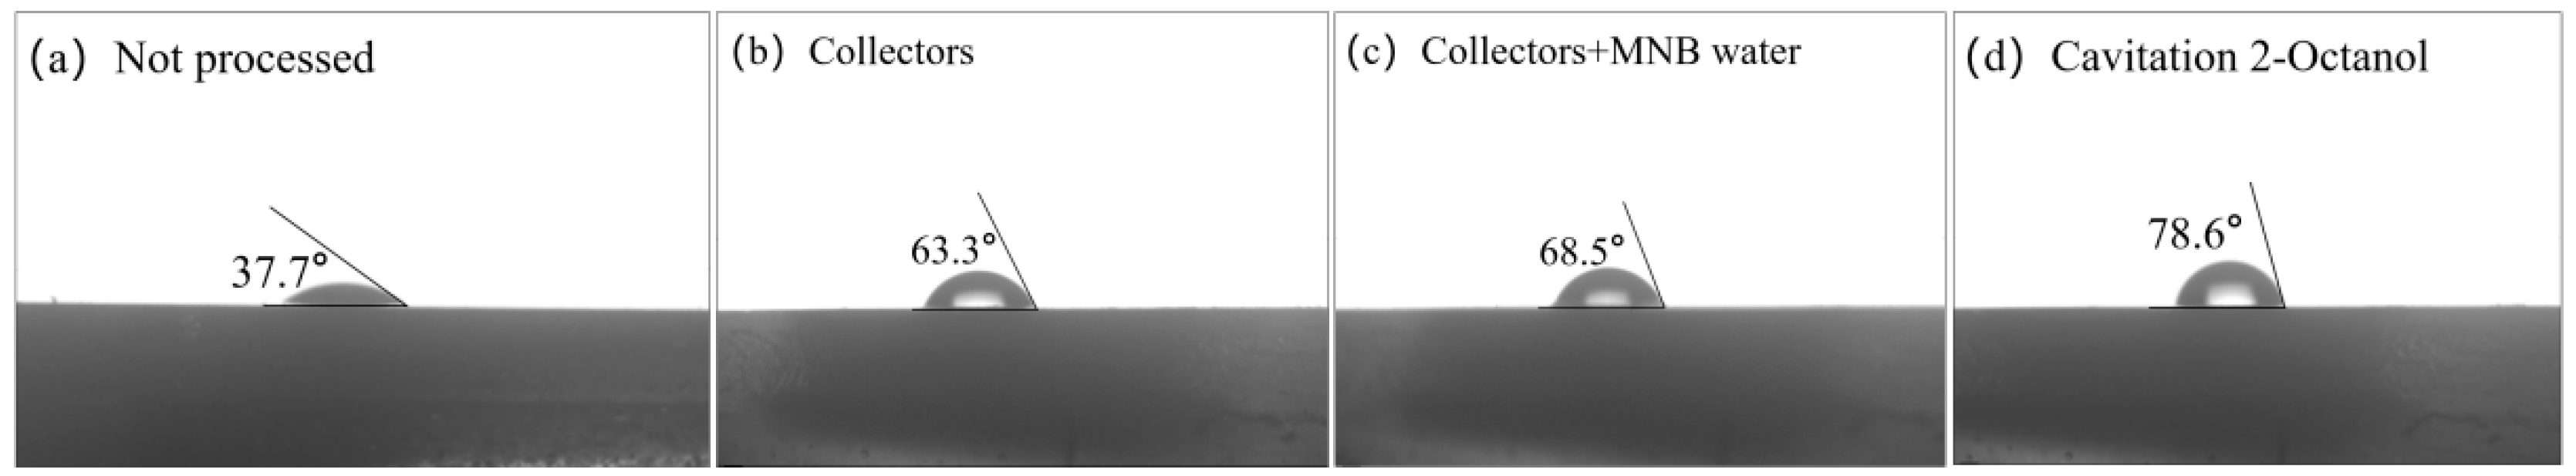
3.5. Contact Angle Measurement

In order to further investigate the effect of micro–nanobubbles on the hydrophobicity of ilmenite particles, the adhesion behavior of bubbles on the surface of ilmenite was observed using a stereo fluorescence microscope. Micro–nanobubble water droplets were added onto a highly hydrophobic ilmenite with a width of 5 mm and placed under a stereomicroscope. A large number of micrometer-sized bubbles were observed to adhere to the surface of ilmenite particles, as shown in Figure 21.
Figure 22 shows the variation in macroscopic contact angles of ilmenite, titanaugite, and olivine under different treatments. When collectors are not present, the contact angles of the three mineral surfaces are small and there is relatively weak hydrophobicity, which corresponds with the results of several studies [44]. In the presence of the collector solution, the surface wettability of the three minerals changed significantly, and the contact angle increased significantly, which confirmed that the effective adsorption of anionic combined collector molecules on the surface of the minerals significantly improved their surface hydrophobicity. It is worth noting that when the molecules are adsorbed on the three minerals through micro–nanobubbles, the contact angle is larger than that of the direct introduction of sodium oleate; that is, the micro–nanobubbles improve the hydrophobicity of ilmenite. This shows that when no small bubbles are present, the water droplets that contact the ilmenite surface only produce a small contact angle. After the introduction of micro–nanobubbles, the connection between the water droplets and the solid is achieved via the combination of the bubbles and the solid. At this time, the contact angle becomes larger. The adhesion energy between the bubble and the hydrophobic surface is higher than the cohesive strength of the bubble itself. At the same time, the adsorption of micro–nanobubbles leads to the participation of more agents in the hydrophobicity of mineral surfaces, and the effect is better under cavitation 2-octanol treatment.

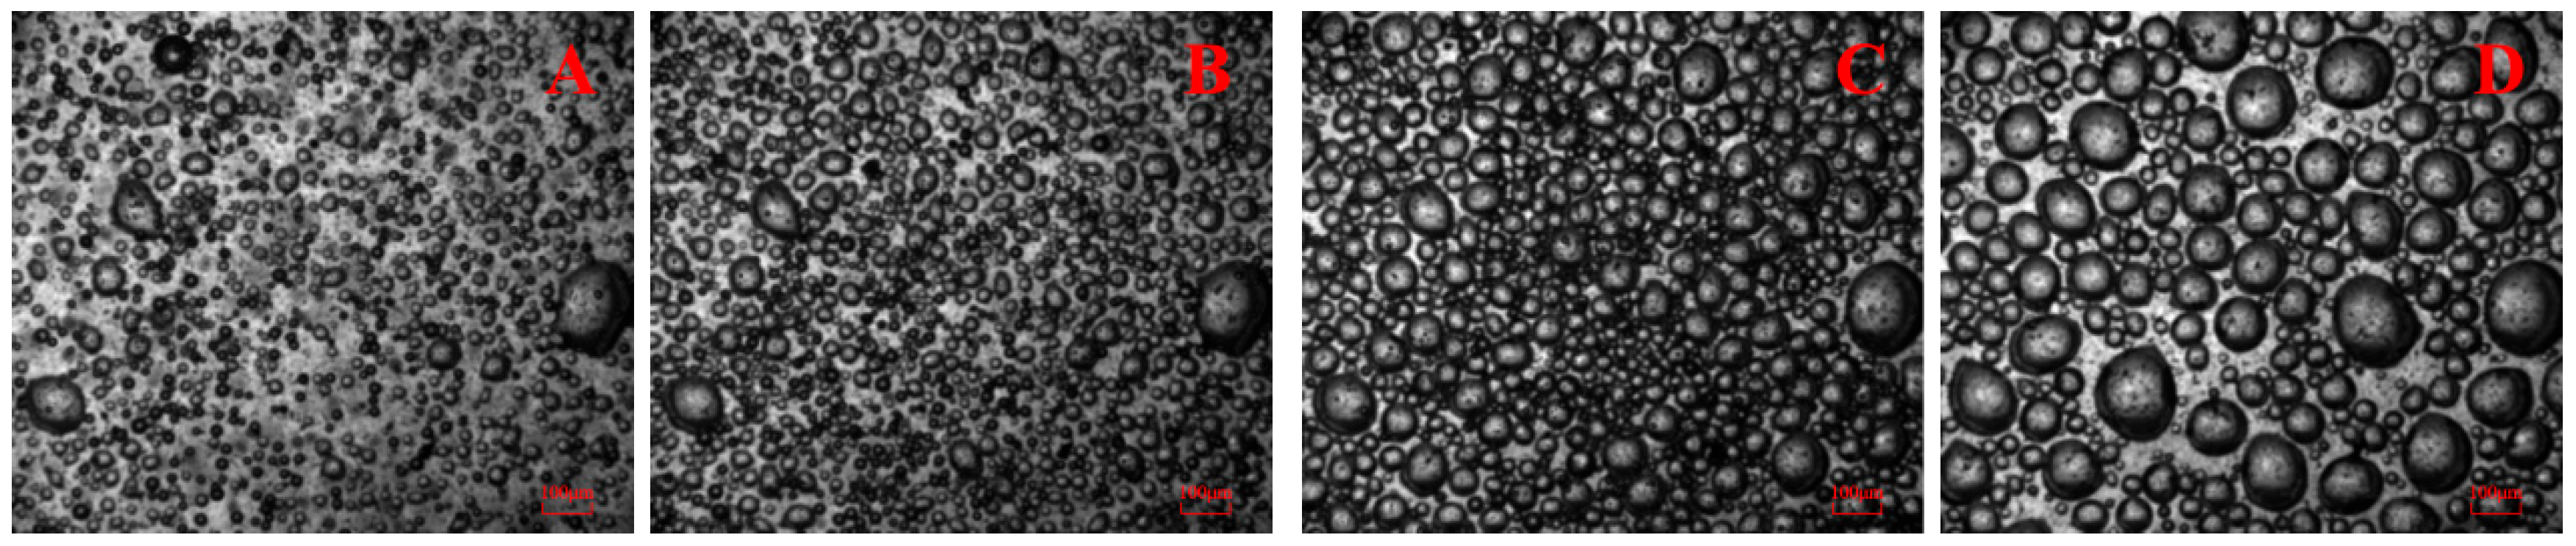
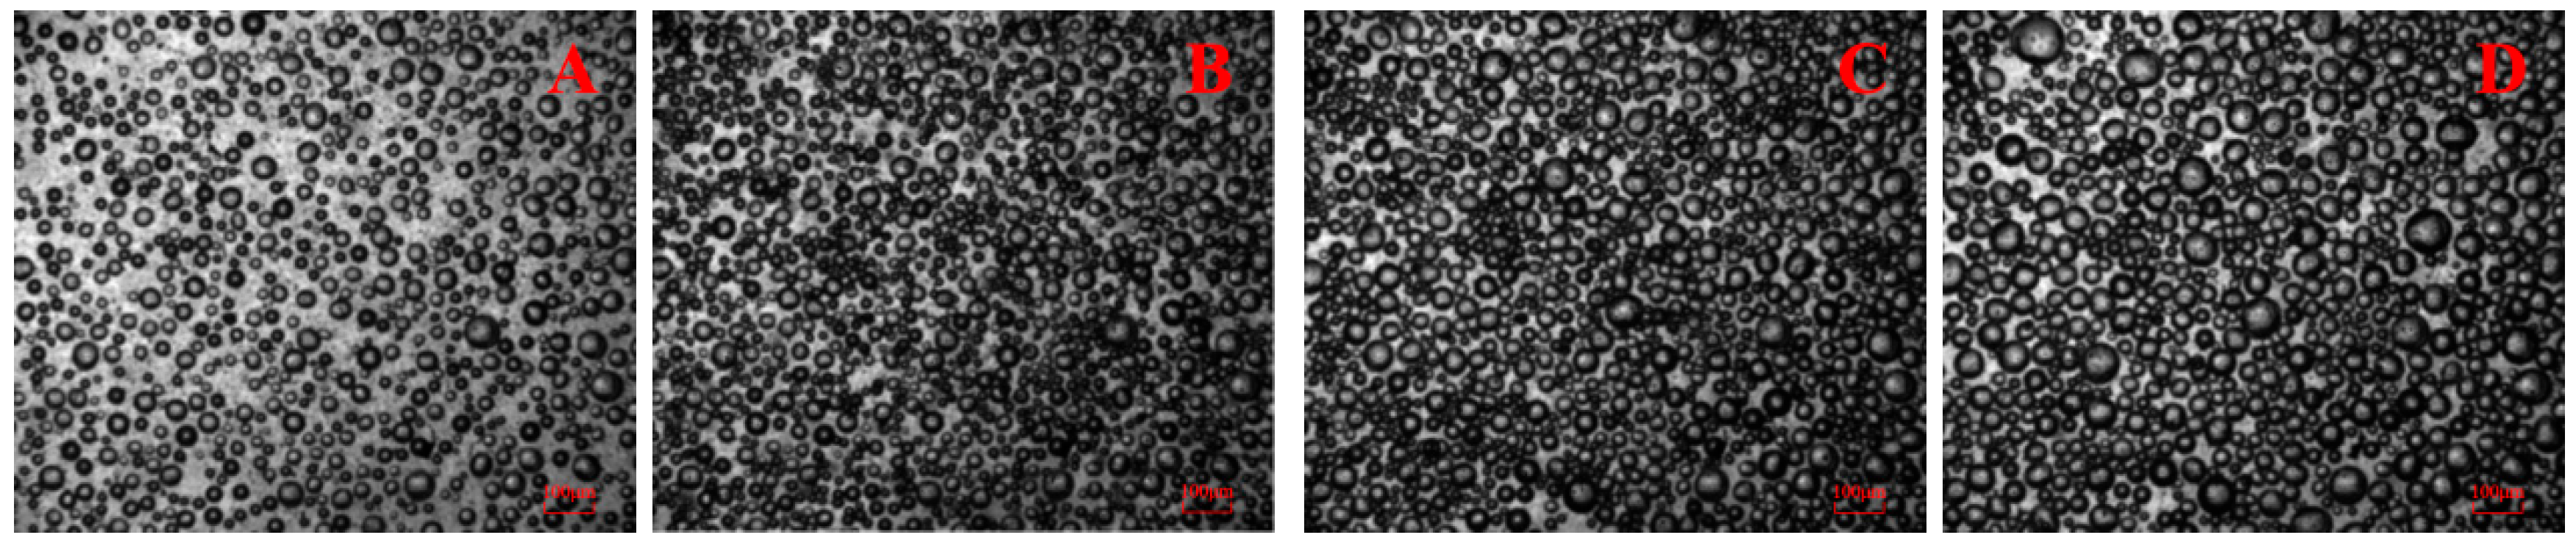
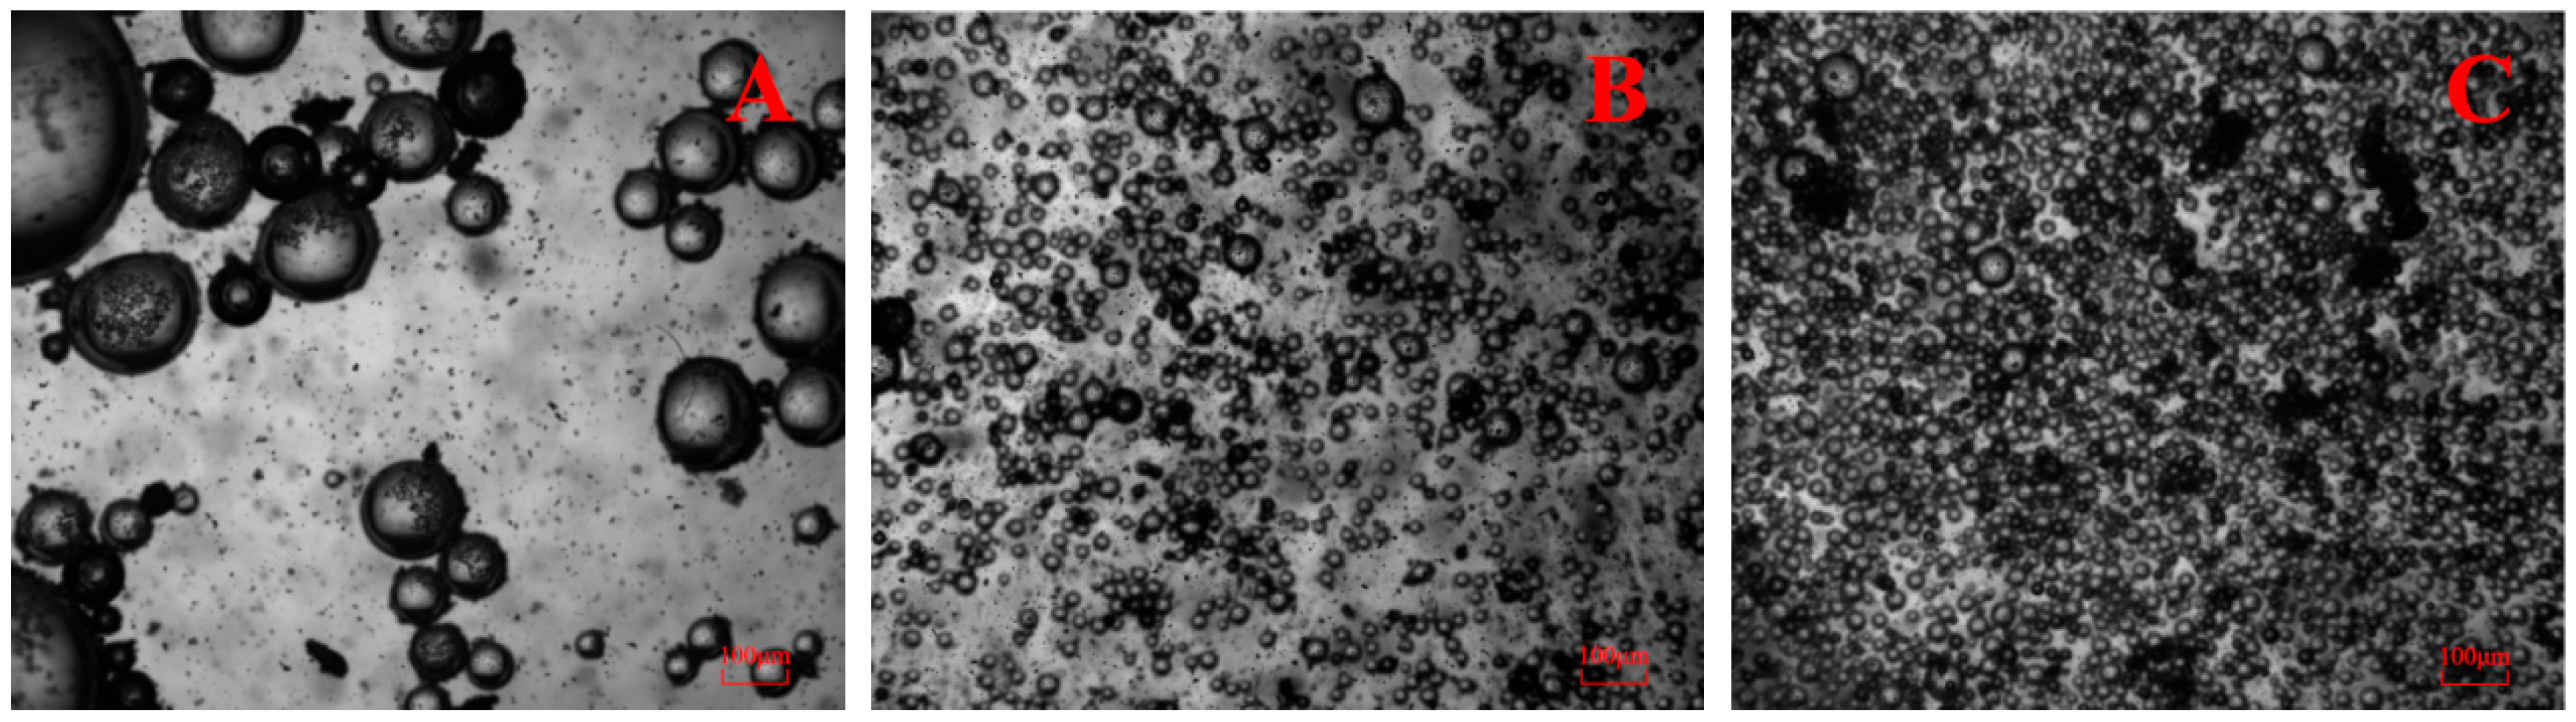
3.6. Microbubble Monitoring System Observations

Figure 23, Figure 24 and Figure 25 provide detailed images of the experiments, Figure 26 shows the effect of different treatments on the particle size distribution of ilmenite particle aggregates. The experimental data showed that after the introduction of the collector, the volume accumulation distribution curve of the particle system shifted to the right significantly. This change confirms that the combined collector can effectively promote the hydrophobic agglomeration behavior of fine-grained ilmenite, with its mechanism primarily arising from the intermolecular association effects generated by the hydrophobic long chains of the combined collector. The phenomenon of aggregation of fine particles becomes more pronounced with the further introduction of micro–nanobubbles, particularly micro–nanobubbles generated from the cavitation-treated 2-octanol solution, where its promoting effect is especially notable. This is due to the higher stability and quantity of micro–nanobubbles in the slurry, which can adhere more effectively to the ilmenite surface, thereby promoting agglomeration between particles.
In this study, we used the optical imaging function of PBM to directly image a slurry suspension, and the visualization results obtained provided important characterization information for the agglomeration behavior of fine particles. We point out that although the lower limit of bubble detection in the PBM system is 1 μm, which affects the acquisition of some visualization information, it can still effectively reflect the significant influence of micro–nanobubbles on the agglomeration of fine particles.
As can be seen from Figure 27 and Figure 28, the size of the bubbles in the micro–nanobubble water is smaller, and the number of micro–nanobubbles is larger, but with an increase in observation time, the adjacent micro–nanobubbles merged, and the bubble size gradually increased. The bubble size in the micro–nanobubble water in the 2-octanol environment became significantly smaller, and with an increase in observation time, bubbles still merged, but the bubble size after merging was significantly smaller, and the number of bubbles decreased. As can be seen from Figure 29, the agglomeration of fine ilmenite particles observed with different treatments under the same concentration of the collector is quite different. As seen in Figure 29A, the bubbles in the slurry are large and the number of bubbles is very small only in the environment with deionized water, and although the adhesion of ilmenite on the surface of the bubbles can be observed by adding a collector, still a large number of ilmenite particles remain in the suspension, and agglomeration is not obvious. Figure 29B shows that bubble size decreases significantly, the number of micro–nanobubbles increases, and ilmenite particles agglomerate, indicating that micro–nanobubbles play a “bridging” role in promoting collision and adhesion between fine-grained particles. Figure 29C shows that a further increase in the number of bubbles in the cavitated 2-octanol solution, and mineral particle agglomeration becomes more pronounced. This indicates that the addition of 2-octanol during cavitation can enhance the stability of micro–nanobubbles, making them less prone to merging and rupture, and is beneficial for improving the agglomeration effect of fine titanium iron ore particles. The underlying mechanism of the agglomeration of ilmenite particles is the heterogeneous nucleation of nanobubbles on hydrophobic surfaces. Qiao B showed that the work of adhesion between hydrophobic particles and water is always lower than the work of cohesion of water, which means that the molecular bonding on the interface of hydrophobic particles and water is more easily broken, consequently forming nanobubble nuclei. When particles collide, surface micro–nanobubbles on the contact surface forms bridging capillary forces and induces particle agglomeration [45].

4. Conclusions

The results of the micro-flotation experiments indicate that compared with deionized water without cavitation, cavitated micro–nanobubble water is beneficial for the flotation separation of fine particulate ilmenite, titanaugite, and olivine. The presence of micro–nanobubbles can effectively promote the adsorption of combined collectors on mineral surfaces, significantly enhancing the hydrophobicity of the minerals, with an even stronger promoting effect observed under the treatment of 2-octanol. Combined collectors can significantly reduce the surface potential of minerals, while micro–nanobubbles can adsorb a portion of the collectors originally attached to the mineral surfaces, thereby decreasing the absolute value of the surface potential of the minerals, which is beneficial for mineral aggregation. The results of the PBM monitoring indicate that the introduction of 2-octanol can reduce the size of micro–nanobubbles generated during the cavitation of mineral slurry and, to a certain extent, weaken bubble coalescence. The introduction of micro–nanobubbles promotes the aggregation of fine ilmenite iron ore particles in flocculent bodies. Due to the higher stability of micro–nanobubbles in an environment with 2-octanol, they demonstrate greater advantages in facilitating aggregation.
Overall, this study shows that during slurry cavitation, appropriate concentrations of 2-octanol, cycle treatment times, and external inflation volumes are conducive to the formation of micro–nanobubbles, and the introduction of 2-octanol can make the micro–nanobubbles during slurry cavitation smaller and more stable.

Author Contributions

Writing—original draft, W.Y., B.Z., Y.Y., J.D. and W.L. All authors have read and agreed to the published version of the manuscript.

Funding

Xinjiang Autonomous Region, China (2023A03003-4), Deep Earth Probe and Mineral Resources Exploration—National Science and Technology Major Project (2024ZD1003406), and National Key R&D Program for Young Scientists-Strategic Mineral Resource Development and Utilization (2021YFC2900800).

Data Availability Statement

The original contributions presented in this study are included in the article. Further inquiries can be directed to the corresponding author.

Acknowledgments

The authors acknowledge the support of Significant Technological Project in Xinjiang Autonomous Region, China (2023A03003-4), Deep Earth Probe and Mineral Resources Exploration—National Science and Technology Major Project (2024ZD1003406), and National Key R&D Program for Young Scientists-Strategic Mineral Resource Development and Utilization (2021YFC2900800). The authors also acknowledge the reviewers of the journal, who have provided us with many insightful suggestions for revisions.

Conflicts of Interest

The authors declare no conflict of interest.

References

  1. Zhai, J.; Chen, P.; Sun, W.; Chen, W.; Wan, S. A review of mineral processing of ilmenite by flotation. Miner. Eng. 2020, 157, 106558. [Google Scholar] [CrossRef]
  2. Wang, H.; Zhang, X.; Qu, R.; Zhang, L.; Li, W. Recent technology developments in beneficiation and enrichment of ilmenite: A review. Miner. Eng. 2024, 219, 109084. [Google Scholar] [CrossRef]
  3. Du, Y.; Meng, Q.; Han, C.; Yuan, Z.; Zhang, P. Impact of acid surface pretreatment on the aggregation and flotation behavior of micro-fine ilmenite and its functional mechanism. Adv. Powder Technol. 2025, 36, 104836. [Google Scholar] [CrossRef]
  4. Zhu, Y.-G.; Zhang, G.-F.; Feng, Q.-M.; Yan, D.-C.; Wang, W.-Q. Effect of surface dissolution on flotation separation of fine ilmenite from titanaugite. Trans. Nonferrous Met. Soc. China 2011, 21, 1149–1154. [Google Scholar] [CrossRef]
  5. Yuan, Z.; Du, Y.; Meng, Q.; Yu, L. Influence of sodium silicate on the selective dispersion and flotation separation of ilmenite against fine titanaugite in hydrophobic systems. Appl. Surf. Sci. 2025, 680, 161348. [Google Scholar] [CrossRef]
  6. Miao, Y.; Wen, S.; Feng, Q.; Bai, S. Co-adsorption mechanism of NaOL/OHA mixed collectors and its contribution to surface hydrophobicity of micro-fine ilmenite: An experimental and molecular dynamics simulation study. J. Mol. Liq. 2024, 411, 125689. [Google Scholar] [CrossRef]
  7. Dai, Z.; Fornasiero, D.; Ralston, J. Particle-bubble collision models-A review. Adv. Colloid Interface Sci. 2000, 85, 231–256. [Google Scholar] [CrossRef]
  8. Anfruns, J.F.; Kitchener, J.A. Rate of capture of small particles in flotation. Trans. Inst. Min. Metall. Sect. C Miner. Process. Extr. Metall. 1977, 86, 9–15. [Google Scholar]
  9. Fornasiero, D.; Filippov, L. Innovations in the flotation of fineand coarse particles. J. Phys. Conf. Ser. 2017, 879, 012002. [Google Scholar] [CrossRef]
  10. Subrahmanyam, T.V.; Forssberg, K.S.E. Fine particles processing: Shear-flocculation and carrier flotation-a review. Int. J. Miner. Process. 1990, 30, 265–286. [Google Scholar] [CrossRef]
  11. Sivamohan, R. The problem of recovering very fine particles in mineral processing: A review. Int. J. Miner. Process. 1990, 28, 247–288. [Google Scholar] [CrossRef]
  12. Derjaguin, B.V.; Dukhin, S.S. Theory of flotation of small and medium-size particles. Bull.—Inst. Min. Metall. 1961, 651, 21–246. [Google Scholar] [CrossRef]
  13. Nguyen, A.V.; George, P.; Jameson, G.J. Demonstration of a minimum in the recovery of nanoparticles by flotation: Theory and experiment. Chem. Eng. Sci. 2006, 61, 2494–2509. [Google Scholar] [CrossRef]
  14. Du, Y.; Meng, Q.; Yuan, Z.; Han, C.; Li, L.; Lu, J.; Liu, T. Impact of acid surface pretreatment on the hydrophobic agglomeration of micro-fine ilmenite and titanaugite in flotation. Adv. Powder Technol. 2024, 218, 109050. [Google Scholar] [CrossRef]
  15. Sutherland, K.L. Physical chemistry of flotation XⅠ. Kinetics of the flotation process. J. Phys. Colloid Chem. 1948, 52, 394–425. [Google Scholar] [CrossRef] [PubMed]
  16. Dobby, G.S.; Finch, J.A. Particle size dependence in flotation derived from a fundamental model of the capture process. Int. J. Miner. Process. 1987, 21, 241–260. [Google Scholar] [CrossRef]
  17. Scheludko, A.; Toshev, B.V.; Bojadjiev, D.T. Attachment of particles to a liquid surface (capillary theory of fotation). J. Chem. Soc. Faraday Trans. 1 Phys. Chem. Condens. Phases 1976, 72, 2815–2828. [Google Scholar]
  18. Long, Q.; Wang, H.; Jiang, F.; Tan, W.; Chen, J.; Zhong, S.; Guo, X.; Wang, Q.; Xu, Z. Enhancing flotation separation of fine copper oxide from silica by microbubble assisted hydrophobic aggregation. Miner. Eng. 2022, 189, 107863. [Google Scholar] [CrossRef]
  19. Rubio, J.; Azevedo, A.; Rodrigues, R.; Olivares, G.R. Amine-coated nanobubbles-assisted flotation of fine and coarse quartz. Miner. Eng. 2024, 218, 108983. [Google Scholar] [CrossRef]
  20. Rulyov, N.N.; Sadovskiy, D.Y.; Rulyova, N.A.; Filippov, L.O. Column flotation of fine glass beads enhanced by their prior heteroaggregation with microbubbles. Colloids Surf. A Physicochem. Eng. Asp. 2021, 617, 126398. [Google Scholar] [CrossRef]
  21. Rahman, A.; Darban, A.K.; Mahmoud, A.; Fan, M. Nano-microbubble flotation of fine and ultrafine chalcopyrite particles. Int. J. Min. Sci. Technol. 2014, 24, 559–566. [Google Scholar]
  22. Gaudin, A.M.; Schuhmann, R., Jr.; Schlechten, A.W. Flotation kinetics II. The effect of size on the behaviour of galena particles. J. Phys. Chem. 1942, 46, 902–910. [Google Scholar] [CrossRef]
  23. Wang, X.; Yuan, S.; Liu, J.; Zhu, Y.; Han, Y. Nanobubble-enhanced flotation of ultrafine molybdenite and the associated mechanism. J. Mol. Liq. 2022, 346, 118312. [Google Scholar] [CrossRef]
  24. Ye, Y.; Miller, J.D. Bubble/particle contact time in the analysis of coal fotation. Coal Prep. 1988, 5, 147–166. [Google Scholar] [CrossRef]
  25. Bu, X.; Xie, G.; Peng, Y. Interaction of fine, medium, and coarse particles in coal fines flotation. Energy Sources Part A Recovery Util. Environ. Eff. 2017, 39, 1–7. [Google Scholar] [CrossRef]
  26. Peng, Y.; Liang, L.; Tan, J.; Sha, J.; Xie, G. Effect of flotation reagent adsorption by different ultra-fine coal particles on coal flotation. Int. J. Miner. Process. 2015, 142, 17–21. [Google Scholar] [CrossRef]
  27. Ma, F.; Tao, D.; Tao, Y. Effects of nanobubbles incolumn flotation of Chinese sub-bituminous coal. Int. J. Coal Prep. Util. 2022, 42, 1126. [Google Scholar] [CrossRef]
  28. Zeng, M.; Li, K.; Huang, L.; Bao, S.; Liu, C.; Yang, S. Interaction mechanism of interfacial nano-micro bubbles with collectors and its effects on the fine apatite flotation. Appl. Surf. Sci. 2025, 682, 161736. [Google Scholar] [CrossRef]
  29. Brabcová, Z.; Karapantsios, T.; Kostoglou, M.; Basařová, P.; Matis, K. Bubble–particle collision interaction in flotation systems. Colloids Surf A Physicochem. Eng. Asp. 2015, 473, 95–103. [Google Scholar] [CrossRef]
  30. Deryagin, B.V.; Dukhin, S.S.; Rulev, N.N. Kinetic Theory of the flotation of small particles. Russ. Chem. Rev. 1982, 51, 51–67. [Google Scholar] [CrossRef]
  31. Tsave, P.K.; Kostoglou, M.; Karapantsios, T.D.; Lazaridis, N.K. A hybrid device for enhancing flotation of fine particlesby combining micro-bubbles with conventional bubbles. Minerals 2021, 11, 561. [Google Scholar] [CrossRef]
  32. Yoon, R.H.; Luttrell, G.H. The effect of bubble size on fine particle flotation. Miner. Process. Extr. Metall. Rev. 1989, 5, 101–122. [Google Scholar] [CrossRef]
  33. Zinjenab, Z.T.; Azimi, E.; Shadman, M.; Hosseini, M.R. Maximization of ultrafine poly-mineral ore sequential flotation recovery through synergistic effect of conventional and nano-size bubble combination. J. Mol. Liq. 2024, 401, 124698. [Google Scholar] [CrossRef]
  34. Rahman, R.M.; Ata, S.; Jameson, G.J. The effect of flotation variables on the recovery of different particle size fractions in the froth and the pulp. Int. J. Miner. Process. 2012, 106–109, 70–77. [Google Scholar] [CrossRef]
  35. Dai, Z.; Fornasiero, D.; Ralston, J. Particle-bubble attachment in mineral fotation. J. Colloid Interface Sci. 1999, 217, 70–76. [Google Scholar] [CrossRef]
  36. Waters, K.E.; Hadler, K.; Cilliers, J.J. The flotation of fine particles using charged microbubbles. Miner. Eng. 2008, 21, 918–923. [Google Scholar] [CrossRef]
  37. Reay, D.; Ratclif, G.A. Removal of fine particles from water by dispersed air flotation. Effects of bubble size and particle size on collection efficiency. Can. J. Chem. Eng. 1973, 51, 178–185. [Google Scholar] [CrossRef]
  38. Schubert, H. On the optimization of hydrodynamics in fine particle flotation. Miner. Eng. 2008, 21, 930–936. [Google Scholar] [CrossRef]
  39. Yoon, R.H. The role of hydrodynamic and surface forces in bubble-particle interaction. Int. J. Miner. Process. 2000, 58, 129–143. [Google Scholar] [CrossRef]
  40. Bai, J.; Yi, J.; Chen, W.; Kang, L.; Zhang, Z. Effect of frothers on the interaction between air bubbles and coal particles. Colloids Surf. A Physicochem. Eng. Asp. 2025, 715, 136612. [Google Scholar] [CrossRef]
  41. Liu, W.; Zhang, J.; Wang, W.; Deng, J.; Chen, B.; Yan, W.; Xiong, S.; Huang, Y.; Liu, J. Flotation behaviors of ilmenite, titanaugite, and forsterite using sodium oleate as the collector. Miner. Eng. 2015, 72, 1–9. [Google Scholar] [CrossRef]
  42. Snoswell, D.R.E.; Duan, J.; Fornasiero, D.; Ralston, J. Colloid stability and the influence of dissolved gas. J. Phys. Chem. B 2003, 107, 2986–2994. [Google Scholar] [CrossRef]
  43. Ralston, J.; Fornasiero, D.; Mishchuk, N. The hydrophobic force in flotation-a critique. Colloids Surf. A Physicochem. Eng. Asp. 2001, 192, 39–51. [Google Scholar] [CrossRef]
  44. Du, Y.; Meng, Q.; Yuan, Z.; Li, L.; Lu, J.; Wang, N. Effect of the adding order of sulfuric acid on the flotation behaviors of ilmenite and titanaugite and its functional mechanism. Miner. Eng. 2023, 199, 108116. [Google Scholar] [CrossRef]
  45. Qiao, B.; Wu, Z.; Huang, H.; Ran, J.; Ma, G.; Shao, H.; Tao, D. An investigation of nanobubble treatment on fine particle flotation and associated mechanisms. Green Smart Min. Eng. 2025, 2, 32–41. [Google Scholar] [CrossRef]
Figure 1. XRD patterns of the pure mineral samples.
Minerals 15 00628 g001
Figure 2. Dissolved oxygen content in different water systems.
Minerals 15 00628 g002
Figure 3. The variation in the average sizes of micro–nanobubbles with standing time.
Minerals 15 00628 g003
Figure 4. The size distribution of micro–nanobubbles in different solutions and its variation with standing time.
Minerals 15 00628 g004
Figure 5. Size distribution of micro–nanobubbles under different concentrations of 2-octanol.
Minerals 15 00628 g005
Figure 6. The effect of the concentration of 2-octanol on the average size of micro–nanobubbles.
Minerals 15 00628 g006
Figure 7. The variation in bubble size distribution of micro–nanobubbles in a 50 mg/L of 2-octanol solution with cycle treatment time.
Minerals 15 00628 g007
Figure 8. The variation in the average size of micro–nanobubbles with cycle processing time.
Minerals 15 00628 g008
Figure 9. The variation in the size distribution of micro–nanobubbles with external inflation volume.
Minerals 15 00628 g009
Figure 10. The variation in the average size of micro–nanobubbles with external inflation volume.
Minerals 15 00628 g010
Figure 11. The variation in flotation recovery rates of fine-grained ilmenite, titanaugite, and olivine with pH value under the action of combined collectors.
Minerals 15 00628 g011
Figure 12. The variation in the flotation recovery rates of fine-grained ilmenite, titanaugite, and olivine with the dosage of combined collectors.
Minerals 15 00628 g012
Figure 13. The variation in flotation recovery rates of fine-grained ilmenite, titanaugite, and olivine under the action of sodium silicate with pH value.
Minerals 15 00628 g013
Figure 14. The variation in flotation recovery rates of fine-grained ilmenite, titanaugite, and olivine with sodium silicate dosage.
Minerals 15 00628 g014
Figure 15. The variation in zeta potential of micro–nanobubbles with pH value.
Minerals 15 00628 g015
Figure 16. The variation in the zeta potential of micro–nanobubbles with the concentration of 2-octanol.
Minerals 15 00628 g016
Figure 17. The zeta potential of ilmenite in deionized water, degassed water, and micro–nanobubble water varies with pH.
Minerals 15 00628 g017
Figure 18. Changes in the zeta potential of fine-grained ilmenite, titanaugite, and olivine with pH under different treatment conditions.
Minerals 15 00628 g018
Figure 19. Standard total organic carbon profile for the combined collector.
Minerals 15 00628 g019
Figure 20. Adsorption capacity of combined collectors on ilmenite surfaces under different treatment conditions.
Minerals 15 00628 g020
Figure 21. Adhesion behavior of micro–nanobubbles on ilmenite surfaces.
Minerals 15 00628 g021
Figure 22. Contact angles of ilmenite, titanaugite, and olivine under different treatments.
Minerals 15 00628 g022
Figure 23. Contact angle of ilmenite under different treatments.
Minerals 15 00628 g023
Figure 24. Contact angles of titanaugite under different treatments.
Minerals 15 00628 g024
Figure 25. Contact angles of olivine under different treatments.
Minerals 15 00628 g025
Figure 26. Effect of micro–nanobubbles on the size distribution of fine-grained ilmenite under different treatments (collector concentration: 1.2 × 10⁻⁴ mol/L).
Minerals 15 00628 g026
Figure 27. Micro–nanobubble PBM dynamic monitoring image (A) 0 s after the observation begins (B) 2 s after the observation begins (C) 4 s after the observation begins (D) 6 s after the observation begins.
Minerals 15 00628 g027
Figure 28. Micro–nanobubble PBM dynamic monitoring image in a 2-octanol environment (A) 0 s after the observation begins (B) 2 s after the observation begins (C) 4 s after the observation begins (D) 6 s after the observation begins.
Minerals 15 00628 g028
Figure 29. PBM monitoring images of fine ilmenite particles under different treatment conditions. (A) Deionized water. (B) Micro–nanobubbles. (C) Cavitated 2-octanol solution (collector concentration: 1.2 × 10⁻⁴ mol/L).
Minerals 15 00628 g029
Table 1. The experimental results of artificial mixed ore flotation under the action of micro–nanobubbles.
Flotation ConditionsProductYield
(%)
TiO2 Grade
(%)
TiO2 Recovery
(%)
Deionized waterConcentrate34.0531.0761.53
Tailing65.9510.0338.47
Feed100.0017.19100.00
Micro–nanobubble waterConcentrate36.7432.5268.59
Tailing63.268.6531.41
Feed100.0017.42100.00
Disclaimer/Publisher’s Note: The statements, opinions and data contained in all publications are solely those of the individual author(s) and contributor(s) and not of MDPI and/or the editor(s). MDPI and/or the editor(s) disclaim responsibility for any injury to people or property resulting from any ideas, methods, instructions or products referred to in the content.

