

Kinetic Study on the Carbothermic Reduction from Hematite to Magnetite in Mineral Tailings

Abstract

1. Introduction

| Ref. | Reductant | Reduction Step | T (°C) | Ea (kJ/mol) | Reduction Mechanism/ Kinetic Model |
|---|---|---|---|---|---|
| [8] | Graphite | Fe2O3→Fe | 950–1350 | 37.8–237 | Above 1200 °C: heat transport Below 1200 °C: Boudouard reaction, 1st-order reaction |
| [9] | Amorphous Carbon | Fe2O3→Fe | 850–1087 | 301 | Boudouard reaction |
| [13] | Charcoal or coke | Fe2O3→Fe | 800–1000 | 199.6–278.6 | Boudouard reaction/mass transport in the product layer (Ginstling–Brounshtein) |
| [14] | Charcoal or coke | Fe2O3→Fe | 800–1100 | 129.0–352.2 | With charcoal: Boudouard reaction/1st-order reaction With coke: Boudouard reaction/transport in the product layer (Ginstling–Brounshtein) |
| Ref. | Reductant | Reduction Step | T (°C) | Ea (kJ/mol) | Kinetic Model |
|---|---|---|---|---|---|
| [10] | H2 | Fe2O3→Fe3O4; Fe2O3→Fe | 0–700 | 96; 59–69 | 1st step: unreacted core with kinetic control by chemical reaction 2nd step: random nucleation |
| [11] | CO | Fe2O3→FeO; FeO→Fe; Fe→Fe3C | 800–900 | 9.97; 14.13; 14.65 | Chemical reaction |
| [12] | H2/CO | Fe2O3→Fe | 800–950 | 19.8–42.1 | 1st step: chemical reaction at the oxide/iron interface 2nd step: mixed control 3rd step: transport in the product layer (Ginstling–Brounshtein) |
2. Materials and Methods
3. Results and Discussion
4. Conclusions
Author Contributions
Funding
Data Availability Statement
Acknowledgments
Conflicts of Interest
Abbreviations
| a.r. | As received |
| CBMM | Companhia Brasileira de Metalurgia e Mineração |
| Ea | Activation energy |
| GOF | Goodness of fit |
| ICSD | Inorganic Crystal Structure Database |
| k | Kinetic constant |
| SEM | Scanning electron microscopy |
| XRD | X-ray diffraction |
| XRF | X-ray fluorescence |
References
- Gialanella, S.; Girardi, F.; Ischia, G.; Lonardelli, I.; Mattarelli, M.; Montagna, M. On the goethite to hematite phase transformation. J. Therm. Anal. Calorim. 2010, 102, 867–873. [Google Scholar] [CrossRef]
- Uwadiale, G.G.O.O. Magnetizing Reduction of Iron Ores. Miner. Process. Extr. Metall. Rev. 1992, 11, 1–19. [Google Scholar] [CrossRef]
- Biswas, A.K. Principles of Blast Furnace Ironmaking, 1st ed.; Cootha Publishing House: Brisbane, Australia, 1981; pp. 72–76. [Google Scholar]
- Rosenqvist, T. Principles of Extractive Metallurgy, 1st ed.; McGraw-Hill: New York, NY, USA, 1983; pp. 121, 236–270. [Google Scholar]
- Faris, N.; Tardio, J.; Ram, R.; Bhargava, S.; Pownceby, M.I. Investigation into coal-based magnetizing roasting of an iron-rich rare earth ore and the associated mineralogical transformations. Miner. Eng. 2017, 114, 37–49. [Google Scholar] [CrossRef]
- Zhao, B.; Gao, P.; Tang, Z.; Zhang, W. The Efficient Improvement of Original Magnetite in Iron Ore Reduction Reaction in Magnetization Roasting Process and Mechanism Analysis by In Situ and Continuous Image Capture. Minerals 2021, 11, 645. [Google Scholar] [CrossRef]
- Rosenblum, S.; Brownfield, I.K. Magnetic susceptibilities of minerals. In Publications of the U.S. Geological Survey; USGS: Reston, VA, USA, 2000. [Google Scholar] [CrossRef]
- Dos Santos, D.M.; De Carvalho, P.I., Jr.; Mourão, M.B. Cinética da Redução de Pelotas Auto-Redutoras em Elevadas Temperaturas; XXX Seminário de Redução de Minério de Ferro: Belo Horizonte, Brazil, 1999. (In Portuguese) [Google Scholar]
- Rao, Y.K. The Kinetics of Reduction of Hematite by Carbon. Metall. Trans. 1971, 2, 1439–1447. [Google Scholar] [CrossRef]
- Tiernan, M.J.; Barnes, P.A.; Parkes, G.M.B. The Investigation of Kinetic Parameters Using Rate Perturbation and Linear Heating Thermoanalytical Techniques. J. Phys. Chem. B 2001, 105, 220–228. [Google Scholar] [CrossRef]
- Mondal, K.; Lorethova, H.; Hippo, E.; Wiltowski, T.; Lalvani, S.B. Reduction of iron oxide in carbon monoxide atmosphere–reaction controlled kinetics. Fuel Process. Technol. 2004, 86, 33–47. [Google Scholar] [CrossRef]
- Moon, I.; Rhee, C.; Min, D. Reduction of hematite compacts by H2-CO gas mixtures. Steel Res. Process Metall. 1998, 69, 302–306. [Google Scholar] [CrossRef]
- Boari, V.H. Study of Carbothermic Reduction of Iron Oxides Contained in Monazite Concentrate. Avaliação da Redução Carbotérmica dos Óxidos de Ferro Contidos no Concentrado de Monazita. Master’s Thesis, Polytechnic School of the University of Sao Paulo, Sao Paulo, Brazil, 2021. (In Portuguese). [Google Scholar] [CrossRef]
- Daza Prada, I.M. Kinetics Evaluation of the Carbothermic Reduction of Iron Oxides Contained in Monazite Concentrate. Avaliação da Cinética da Redução Carbotérmica dos Óxidos de Ferro Contidos em Concentrado Monazítico. Master’s Dissertation, Polytechnic School of the University of Sao Paulo, Sao Paulo, Brazil, 2022. (In Portuguese). [Google Scholar] [CrossRef]
- Antoniassi, J.L. X-ray Diffraction with Rietveld Method Applied to Bauxites of Porto Trombetas, PA. A Difração de Raios X com o Método de Rietveld Aplicada a Bauxitas de Porto Trombetas, PA. Master’s Dissertation, Polytechnic School of the University of Sao Paulo, Sao Paulo, Brazil, 2010. (In Portuguese). [Google Scholar] [CrossRef]
- Instituto de Geociências da Universidade de São Paulo. Available online: https://didatico.igc.usp.br/minerais/oxidos-hidroxidos/ (accessed on 4 January 2024).
- Mourão, M.B. Analysis of the Iron Ore Reduction Process by Carbon in the Form of Self-Reducing Pellets. Análise do Processo de Redução de Minério de Ferro por Carbono na Forma de Pelotas Auto-Redutoras. Ph.D. Thesis, Polytechnic School of the University of Sao Paulo, Sao Paulo, Brazil, 1988. (In Portuguese). [Google Scholar] [CrossRef]
- Basu, P. Chapter 5—Gasification Theory and Modeling of Gasifiers Biomass Gasification and Pyrolysis. In Biomass Gasification Design Handbook; Academic Press: Cambridge, MA, USA, 2010; pp. 117–165. [Google Scholar] [CrossRef]


| Kinetic Model | Rate-Limiting Step | |
|---|---|---|
| 1st-order reaction | ||
| Shrinking core | Chemical reaction | |
| Mass transport in the product layer (Ginstling–Brounshtein) | ||
| Mass transport in the gas layer |
| Phase | Chemical Formula | a.r. (%) | Calcined (%) |
|---|---|---|---|
| Goethite | FeO(OH) | 57.5 | - |
| Monazite | (Ce, La, Nd)(PO4) | 6.7 | 7.0 |
| Barite | Ba(SO4) | 3.9 | 4.7 |
| Hematite | Fe2O3 | 14.6 | 69.9 |
| Gorceixite | BaAl3(PO4)(PO3(OH))(OH)6 | 7.0 | 7.4 |
| Quartz | SiO2 | 4.4 | 4.6 |
| Pyrochlore | (Ba, Sr)Nb2O6(OH) | 2.8 | 3.0 |
| Anatase | TiO2 | 3.1 | 3.3 |
| Material | Fe | REE | Ba | Mn | P | Si | Ti | Nb |
|---|---|---|---|---|---|---|---|---|
| a.r. | 58.4 | 9.4 | 8.6 | 4.5 | 2.4 | 2.3 | 2.3 | 2.0 |
| calcined | 65.4 | 6.8 | 6.0 | 3.4 | 3.6 | 2.4 | 2.0 | 1.8 |
| Material | Sr | S | Al | Th | Ca | Zr | Co | LOI |
| a.r. | - | 0.6 | 0.4 | 0.4 | 0.3 | - | - | 10.9 |
| calcined | 0.7 | 0.8 | 1.1 | 0.3 | 0.2 | 0.2 | 0.1 | 2.8 |
| Point/Area | O | Al | Fe | Ce | Ti | Nb | Ag | Ca | Ba | P | La | Pr | Nd | Mn |
|---|---|---|---|---|---|---|---|---|---|---|---|---|---|---|
| 1 | 52.7 | 0.7 | 4.1 | 2.2 | 3.5 | 30.8 | 1.4 | 0.9 | 3.7 | - | - | - | - | - |
| 2 | 60.4 | 2.6 | 13.9 | 3.1 | 1.3 | - | - | - | - | 11.7 | 1.4 | 0.5 | 1.0 | - |
| 3 | 5.8 | 0.2 | 86.7 | - | 2.2 | - | - | - | - | - | - | - | - | 5.2 |
| Phase | Calcined | 700 °C | 800 °C | 900 °C |
|---|---|---|---|---|
| Hematite | 69.9 | 74.3 | 70.3 | 4.2 |
| Monazite | 7.0 | 7.8 | 4.4 | 8.7 |
| Barite | 4.7 | 6.4 | 5.6 | -- |
| Quartz | 4.6 | 5.0 | 5.5 | 4.3 |
| Anatase | 3.3 | 3.4 | 3.6 | 3.8 |
| Pyrochlore | 3.0 | 3.0 | 3.2 | -- |
| Magnetite | -- | -- | 7.5 | 79.0 |
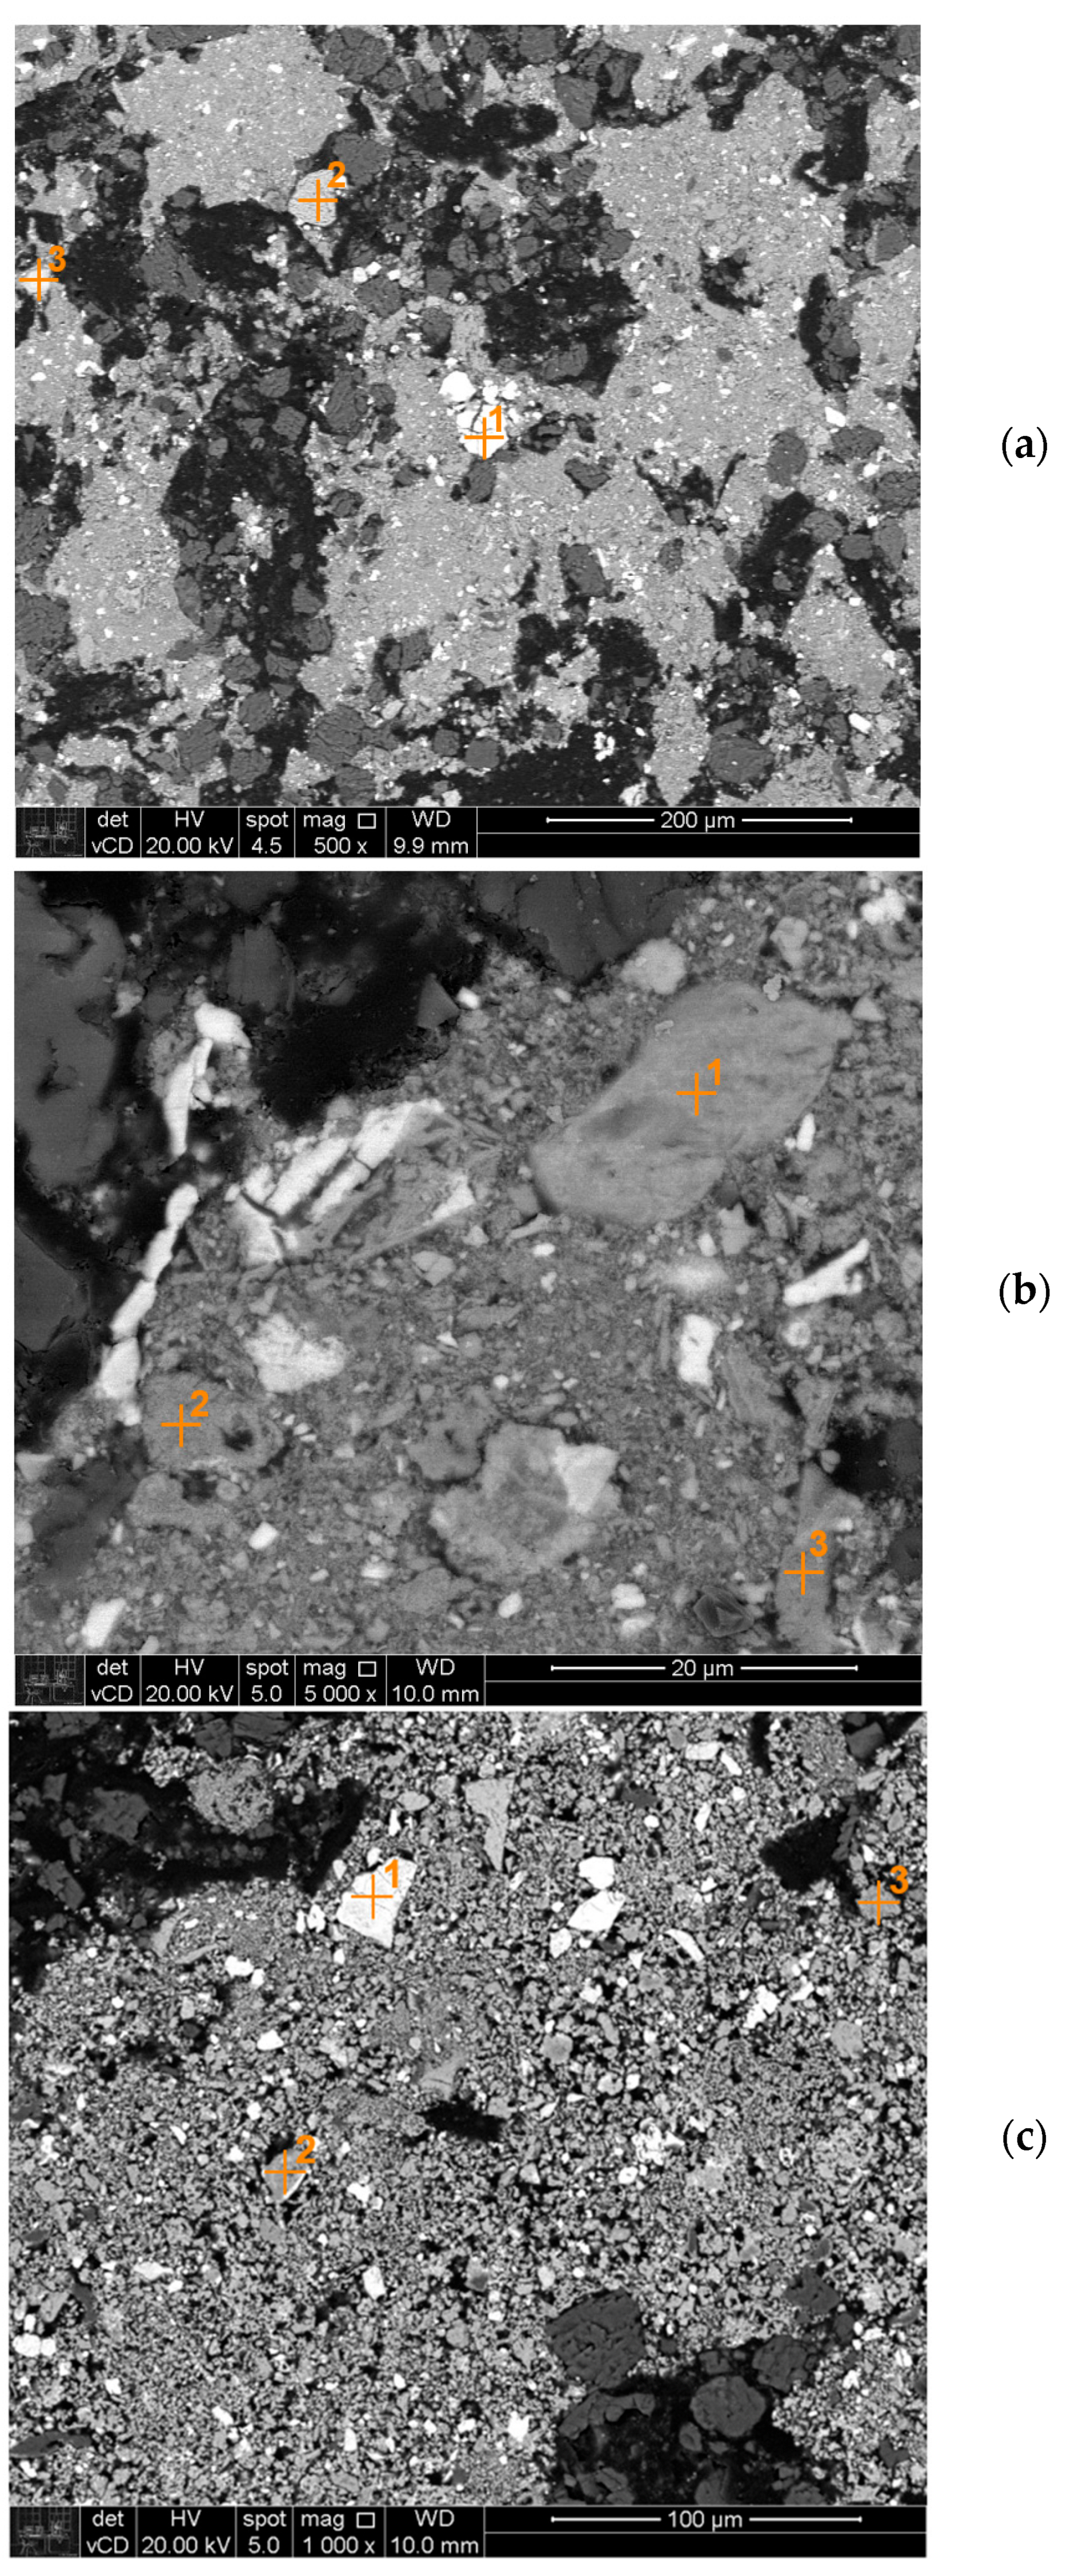
| Fig. | T(°C) | Point | O | Fe | Nb | Ti | Si | P | Ba | Ce | La | Sm | Th |
|---|---|---|---|---|---|---|---|---|---|---|---|---|---|
| 1 | 57.7 | 1.9 | 27.6 | 5.3 | - | 3.4 | - | - | 1.0 | ||||
| Figure 10a | 700 | 2 | 56.4 | 43.6 | - | - | - | - | - | - | - | ||
| 3 | 53.4 | 2.5 | - | - | 23.1 | 9.3 | 8.3 | 0.9 | - | ||||
| 1 | 52.6 | 14.7 | 5.7 | 25.8 | 1.1 | - | - | - | |||||
| Figure 10b | 800 | 2 | 45.4 | 49.2 | - | - | 1.4 | - | - | - | |||
| 3 | 45.6 | 45.3 | - | - | 1.3 | 2.7 | 0.8 | 0.4 | |||||
| 1 | 63.8 | 2.1 | 21.7 | 3.3 | - | - | - | 1.7 | |||||
| Figure 10c | 900 | 2 | 49.2 | 22.9 | 1.2 | - | 14.3 | 1.4 | 0.8 | 0.1 | |||
| 3 | 48.3 | 45.2 | - | - | 1.3 | - | 0.4 | - |
| T(°C) | Kinetic Model | Average R2 |
|---|---|---|
| 700 | Chemical reaction | 0.93 |
| 1st-order reaction | 0.94 | |
| Mass transport in the product layer | 0.94 | |
| Mass transport in the gas layer | 0.93 | |
| 800 | Chemical reaction | 0.99 |
| 1st-order reaction | 0.98 | |
| Mass transport in the product layer | 0.99 | |
| Mass transport in the gas layer | 0.99 | |
| 900 | Chemical reaction | 0.93 |
| 1st-order reaction | 0.84 | |
| Mass transport in the product layer | 0.94 | |
| Mass transport in the gas layer | 1.00 |
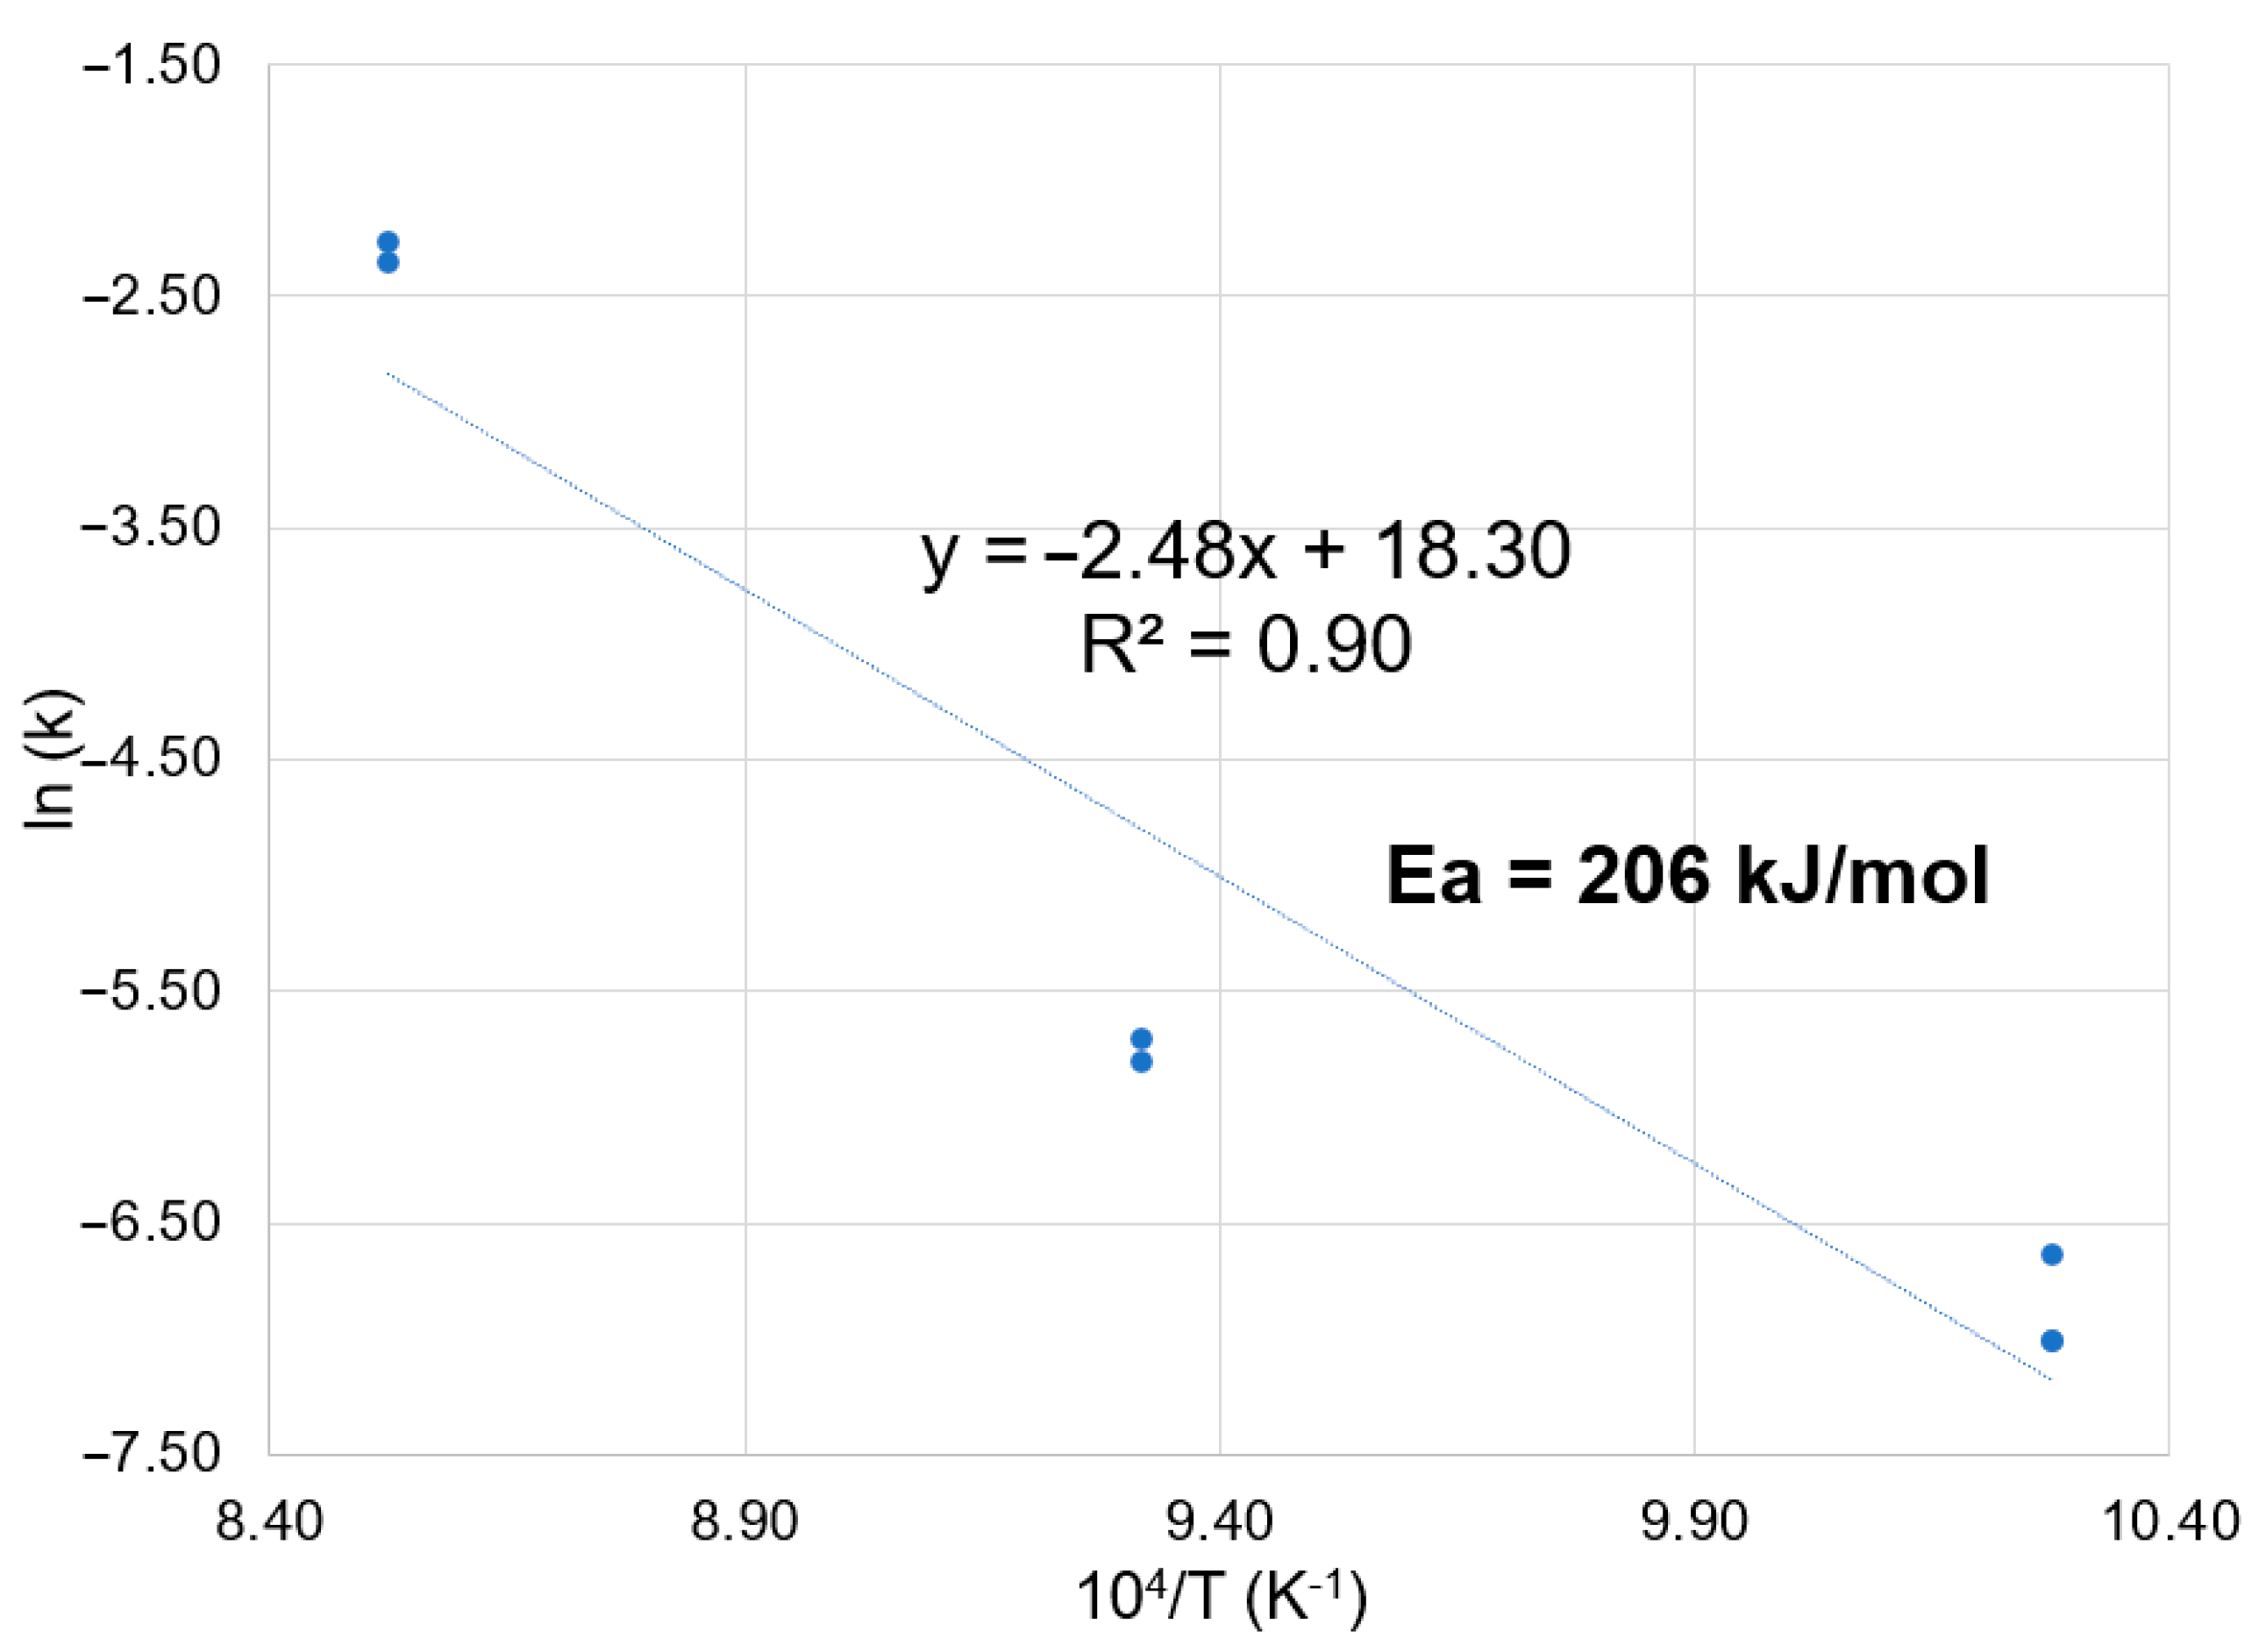
| Trial n° | T(°C) | Maximum Loss of Mass After 1 h (%) | k (min−1) |
|---|---|---|---|
| 1 | 700 | 4.5 | 9.0 × 10⁻⁴ |
| 2 | 700 | 4.7 | 9.0 × 10⁻⁴ |
| 3 | 700 | 4.9 | 13.0 × 10⁻⁴ |
| 4 | 800 | 5.3 | 3.0 × 10⁻³ |
| 5 | 800 | 5.3 | 3.3 × 10⁻³ |
| 6 | 900 | 9.6 | 10.3 × 10⁻² |
| 7 | 900 | 9.5 | 9.5 × 10⁻² |
Disclaimer/Publisher’s Note: The statements, opinions and data contained in all publications are solely those of the individual author(s) and contributor(s) and not of MDPI and/or the editor(s). MDPI and/or the editor(s) disclaim responsibility for any injury to people or property resulting from any ideas, methods, instructions or products referred to in the content. |
© 2025 by the authors. Licensee MDPI, Basel, Switzerland. This article is an open access article distributed under the terms and conditions of the Creative Commons Attribution (CC BY) license (https://creativecommons.org/licenses/by/4.0/).
Share and Cite
Garcia Alvarez, V.; Beneduce, F. Kinetic Study on the Carbothermic Reduction from Hematite to Magnetite in Mineral Tailings. Minerals 2025, 15, 561. https://doi.org/10.3390/min15060561
Garcia Alvarez V, Beneduce F. Kinetic Study on the Carbothermic Reduction from Hematite to Magnetite in Mineral Tailings. Minerals. 2025; 15(6):561. https://doi.org/10.3390/min15060561
Chicago/Turabian StyleGarcia Alvarez, Vitória, and Flávio Beneduce. 2025. "Kinetic Study on the Carbothermic Reduction from Hematite to Magnetite in Mineral Tailings" Minerals 15, no. 6: 561. https://doi.org/10.3390/min15060561
APA StyleGarcia Alvarez, V., & Beneduce, F. (2025). Kinetic Study on the Carbothermic Reduction from Hematite to Magnetite in Mineral Tailings. Minerals, 15(6), 561. https://doi.org/10.3390/min15060561