
Effect of Gas Oversaturation Degree on Flotation Separation Performance of Electrode Materials from Spent Lithium-Ion Batteries


Abstract
1. Introduction
2. Experimental
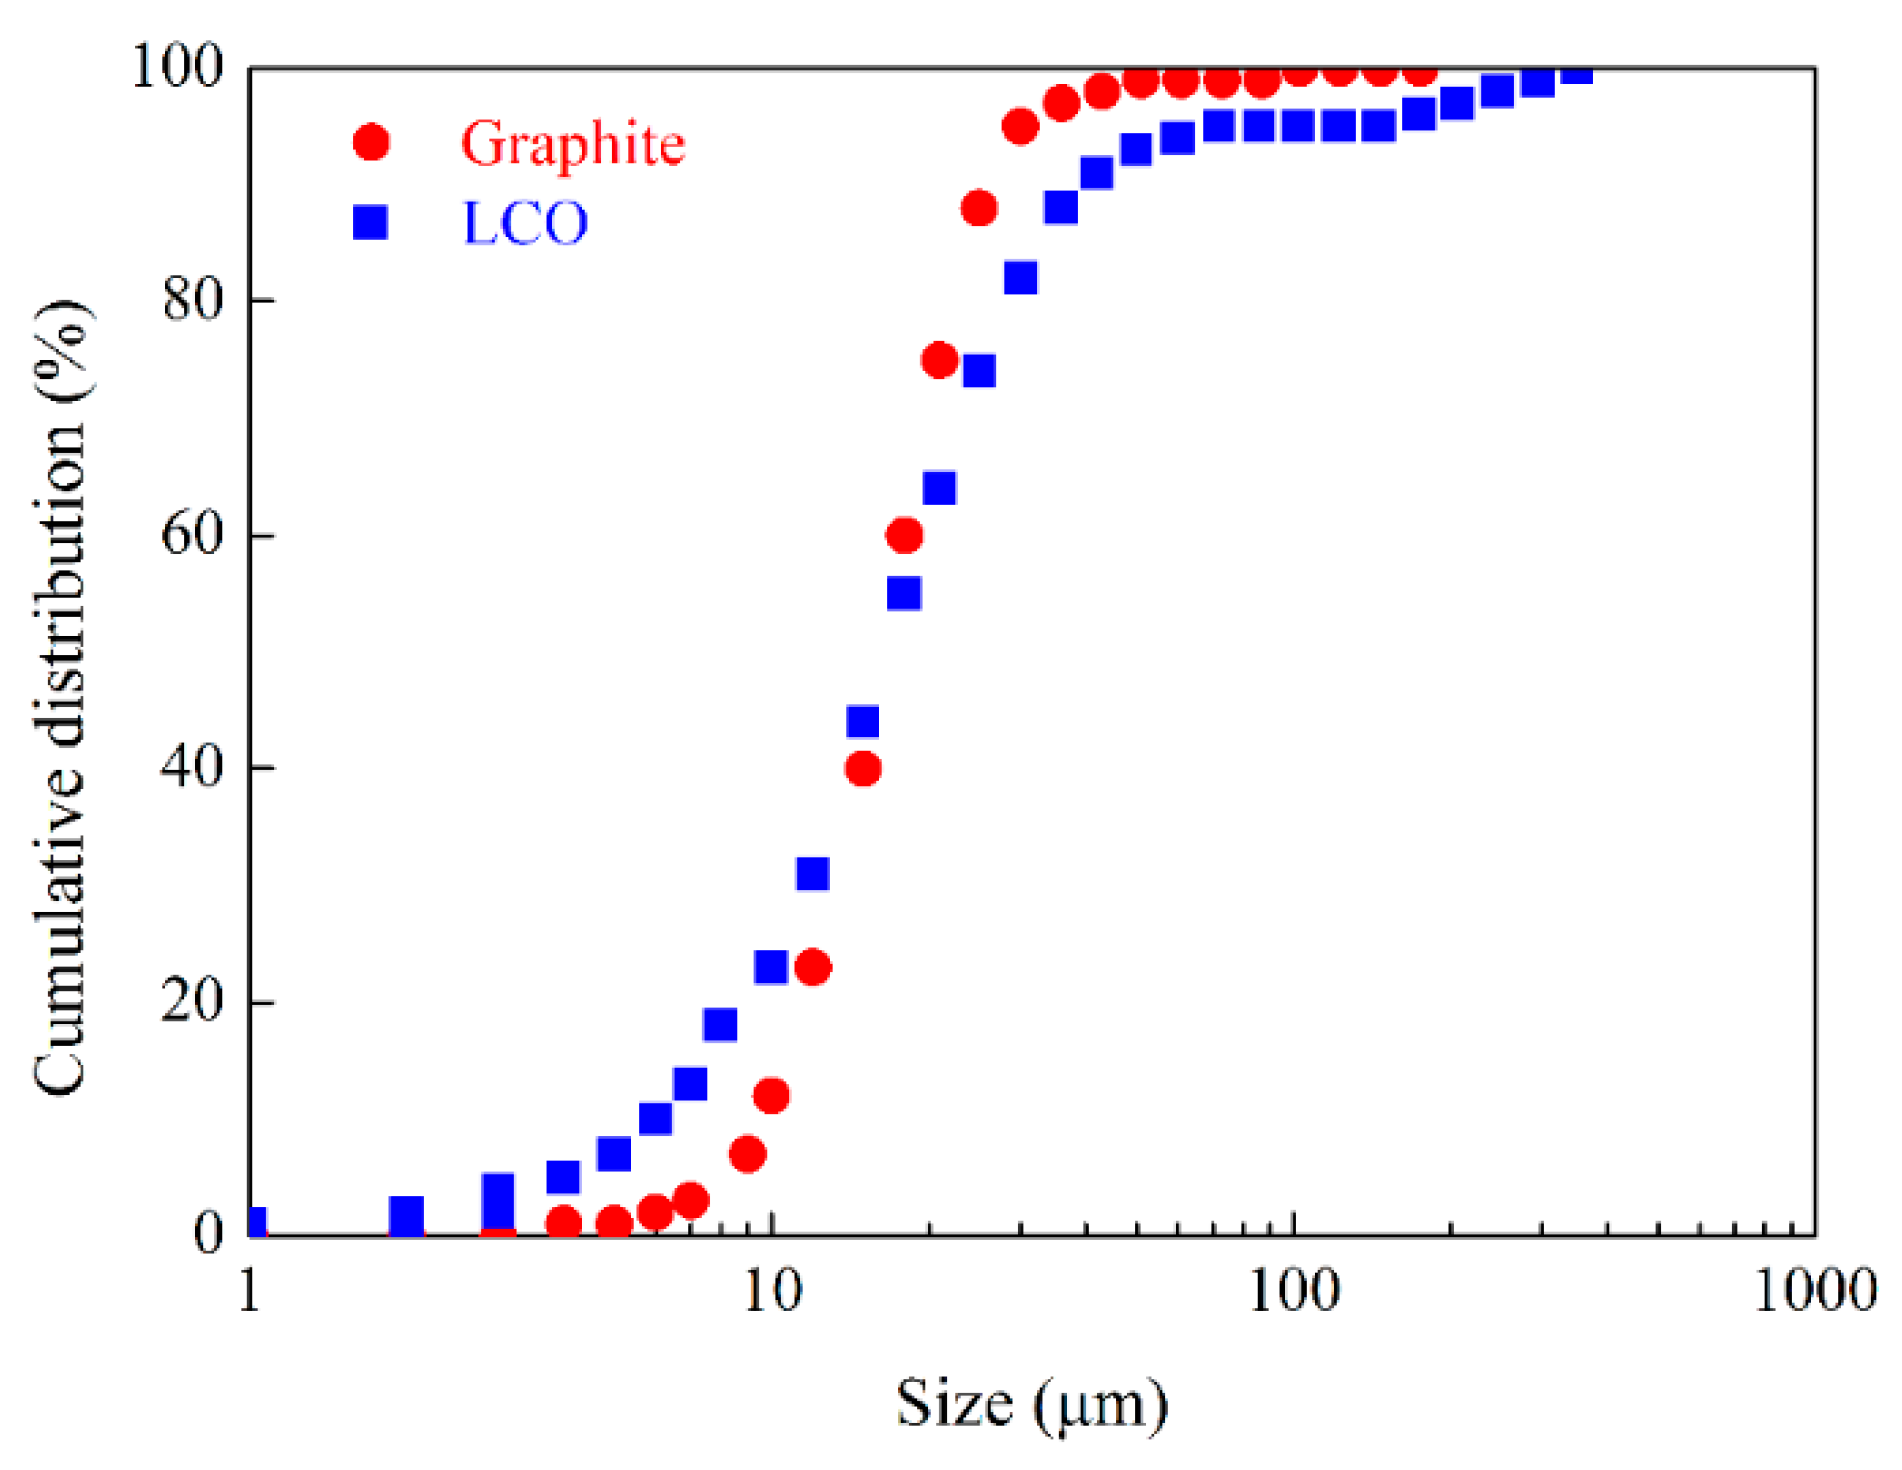
2.1. Materials
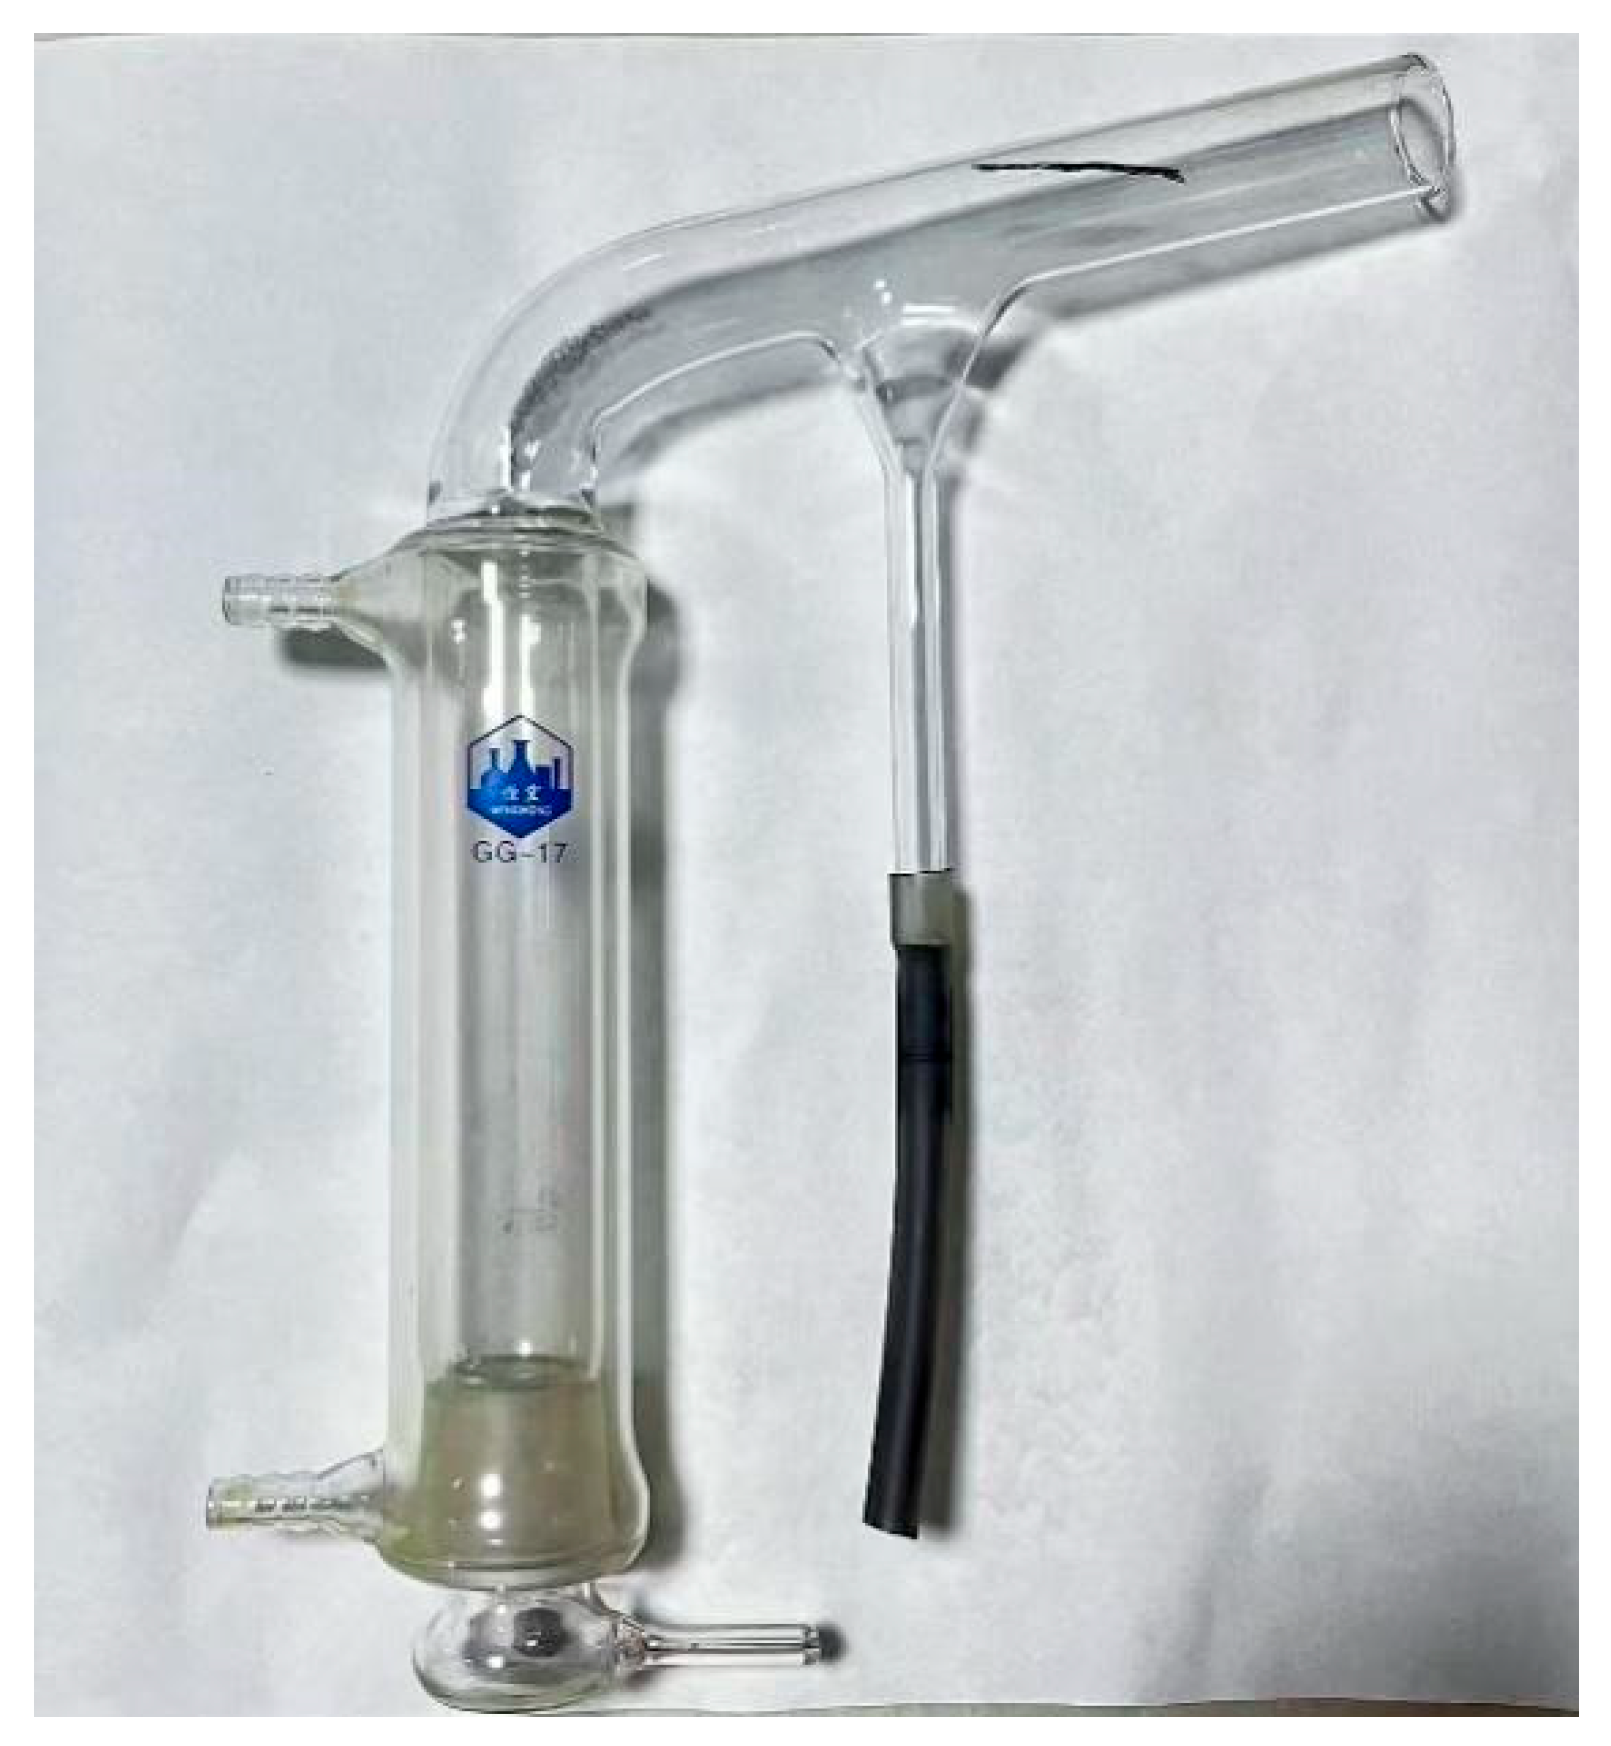
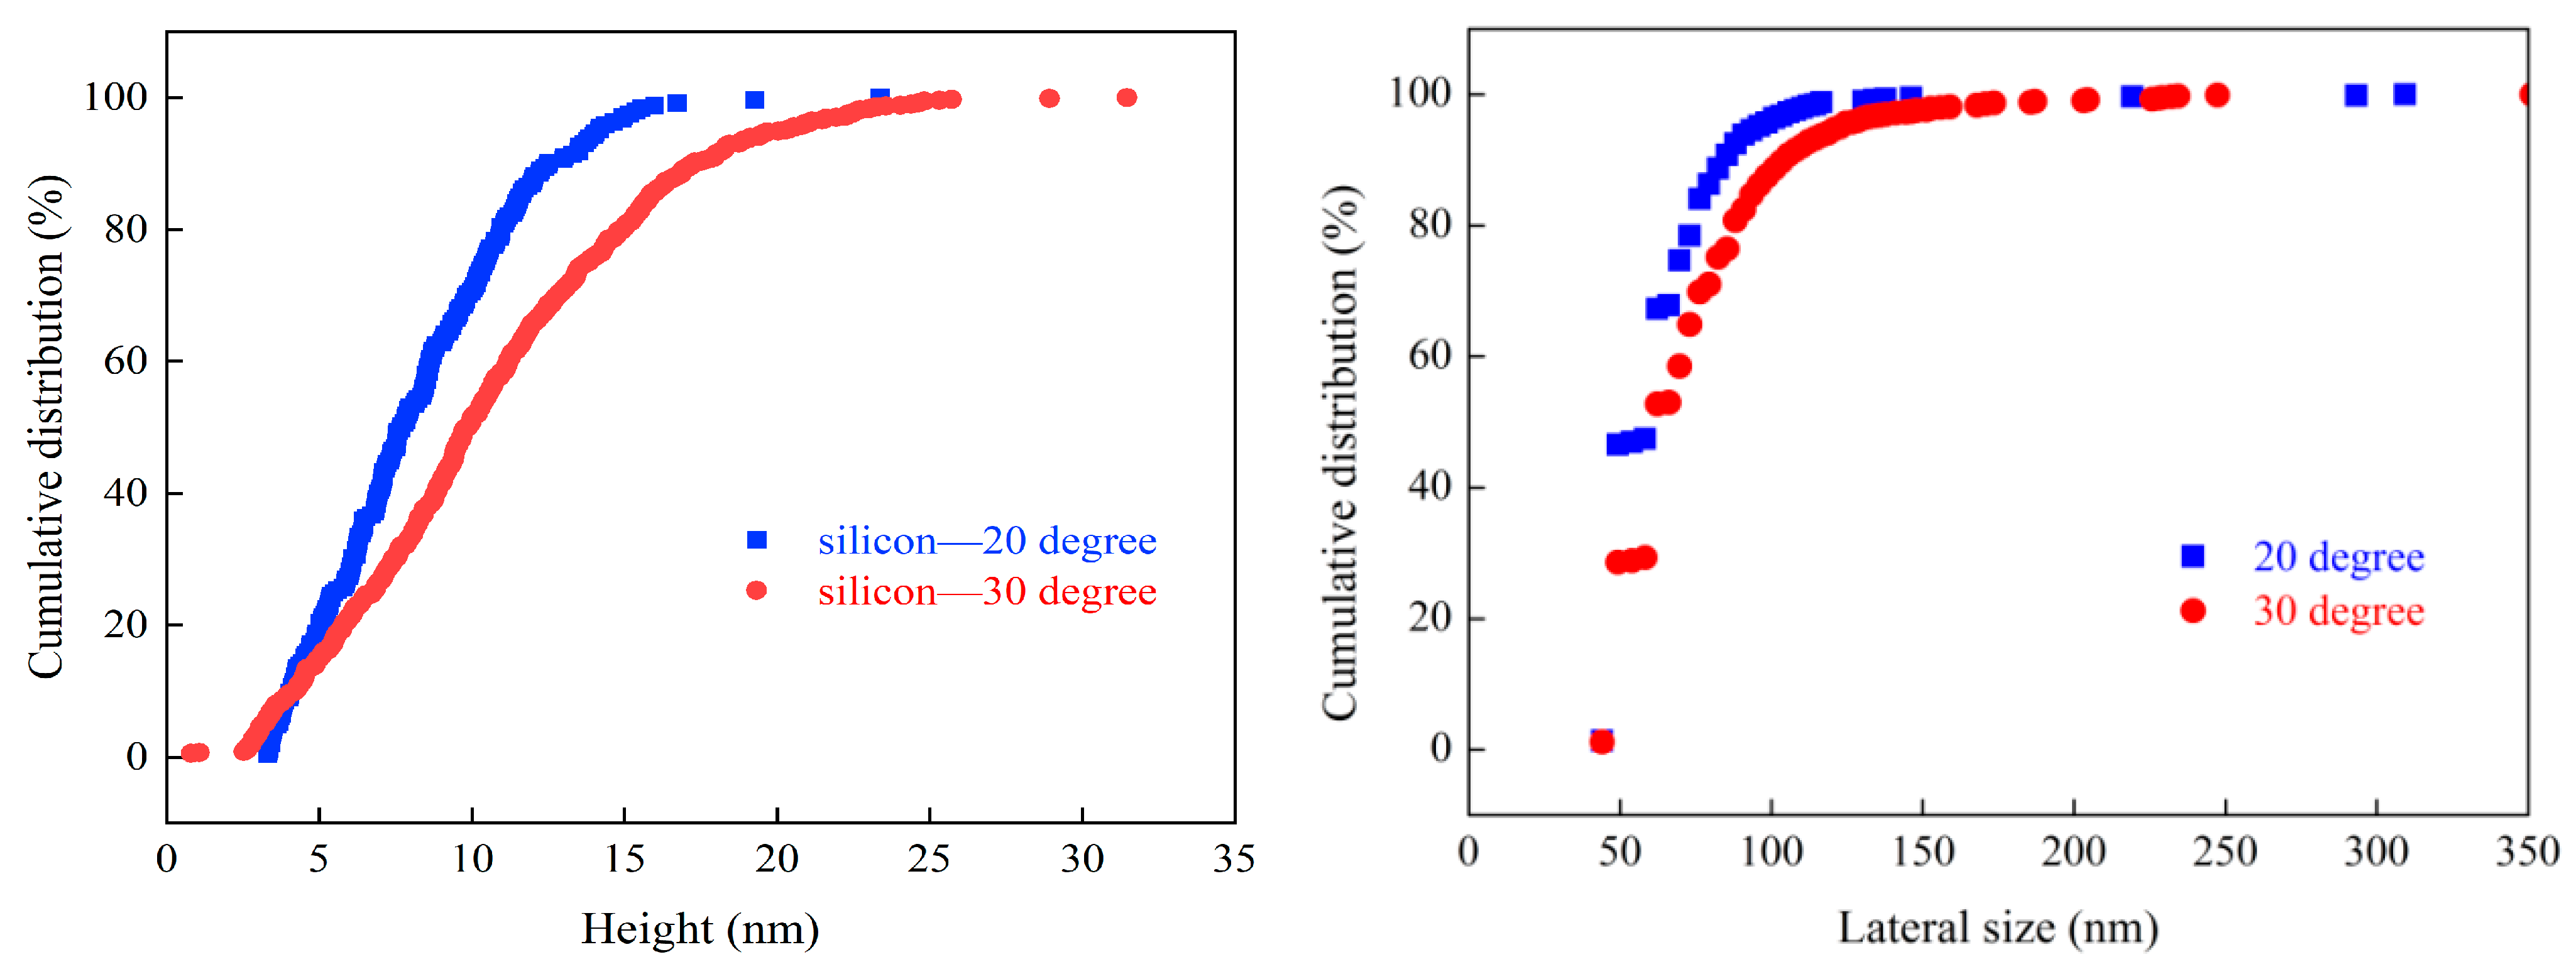
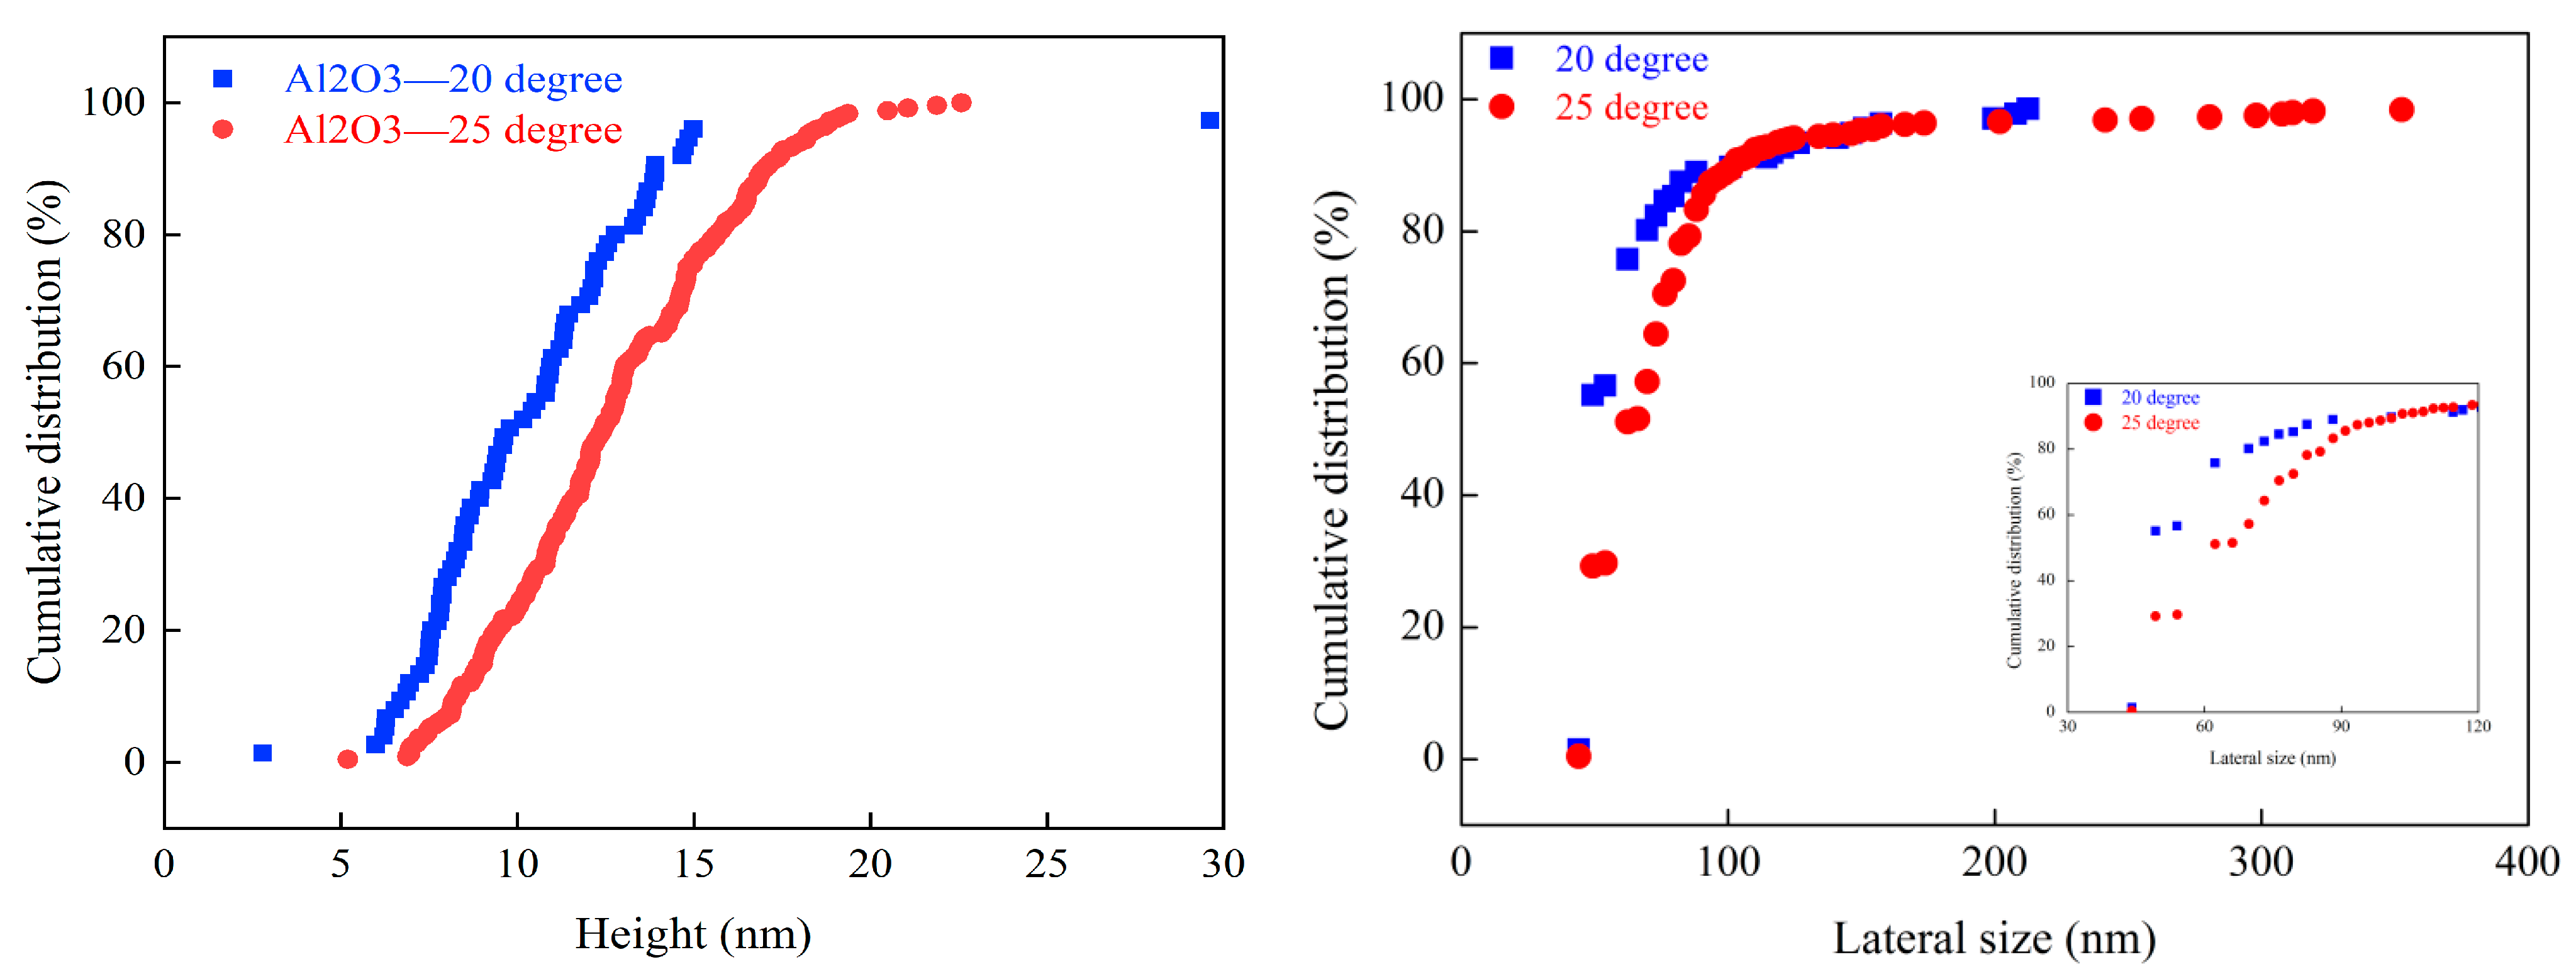
2.2. The Production and Characterization of Nanobubbles
2.3. Morphological Observation of Graphite Aggregates
2.4. Formation and Measurement of Graphite Agglomerations with Focused Beam Reflectance Measurement (FBRM)
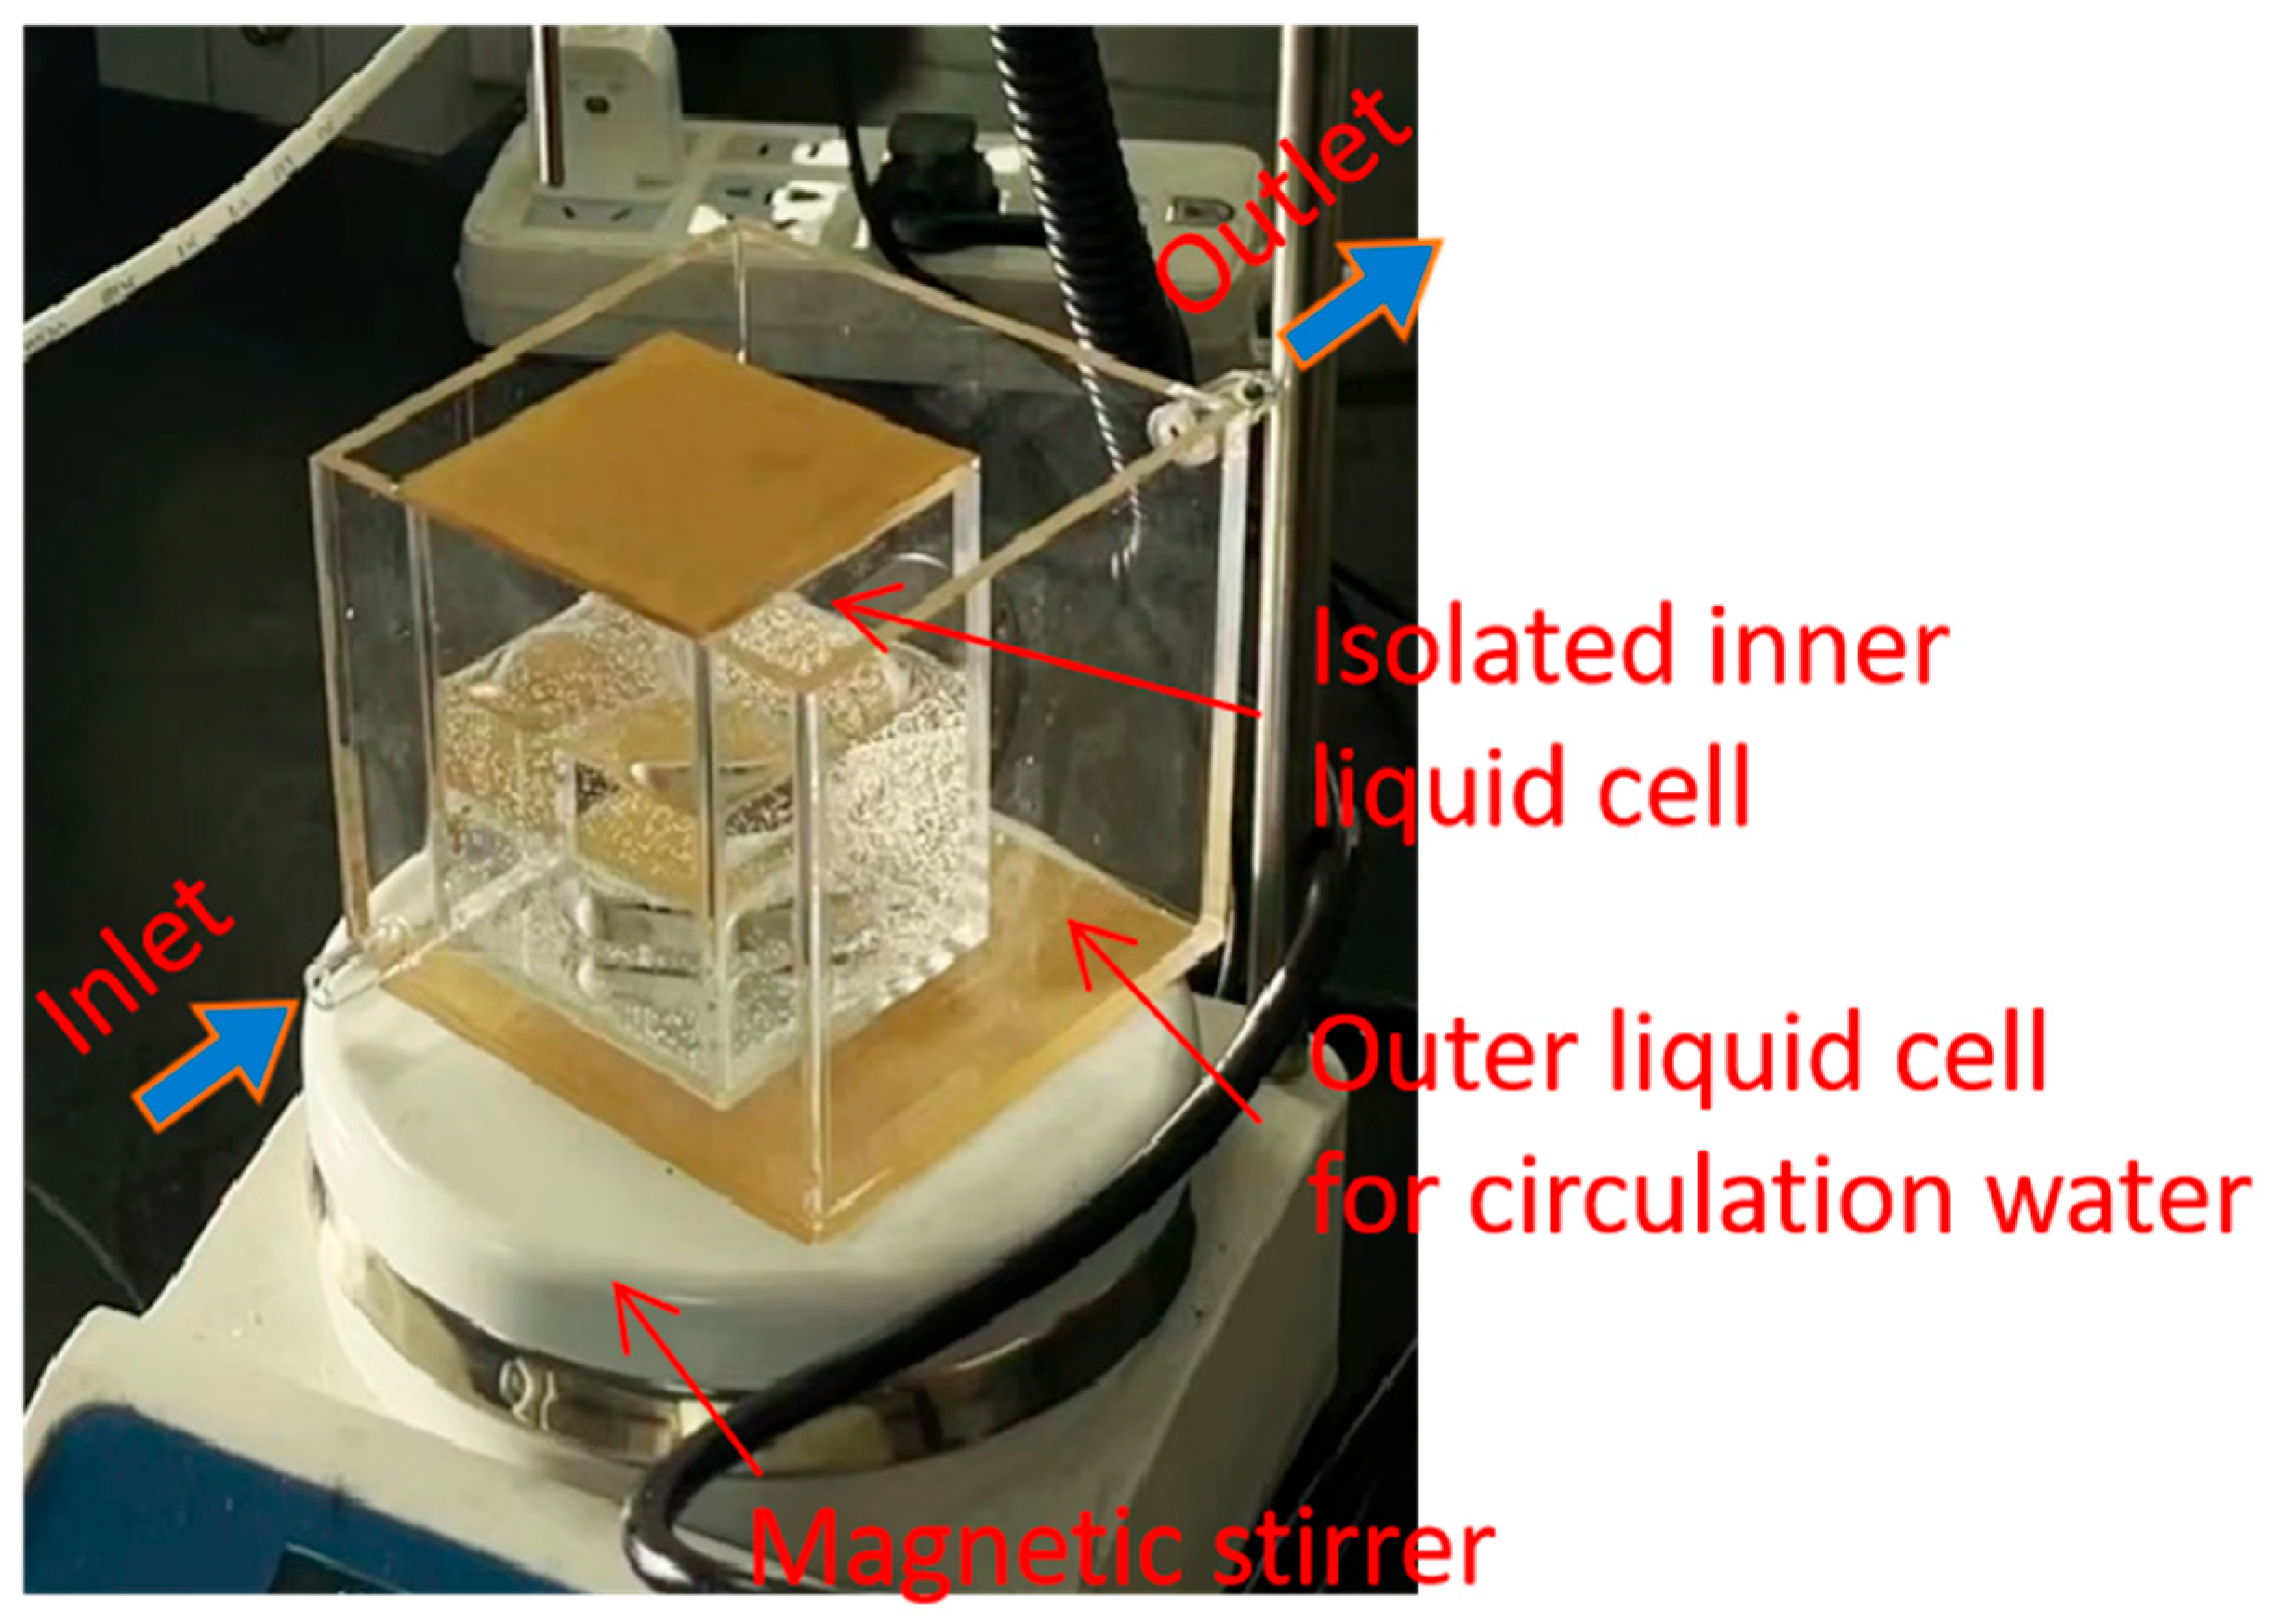
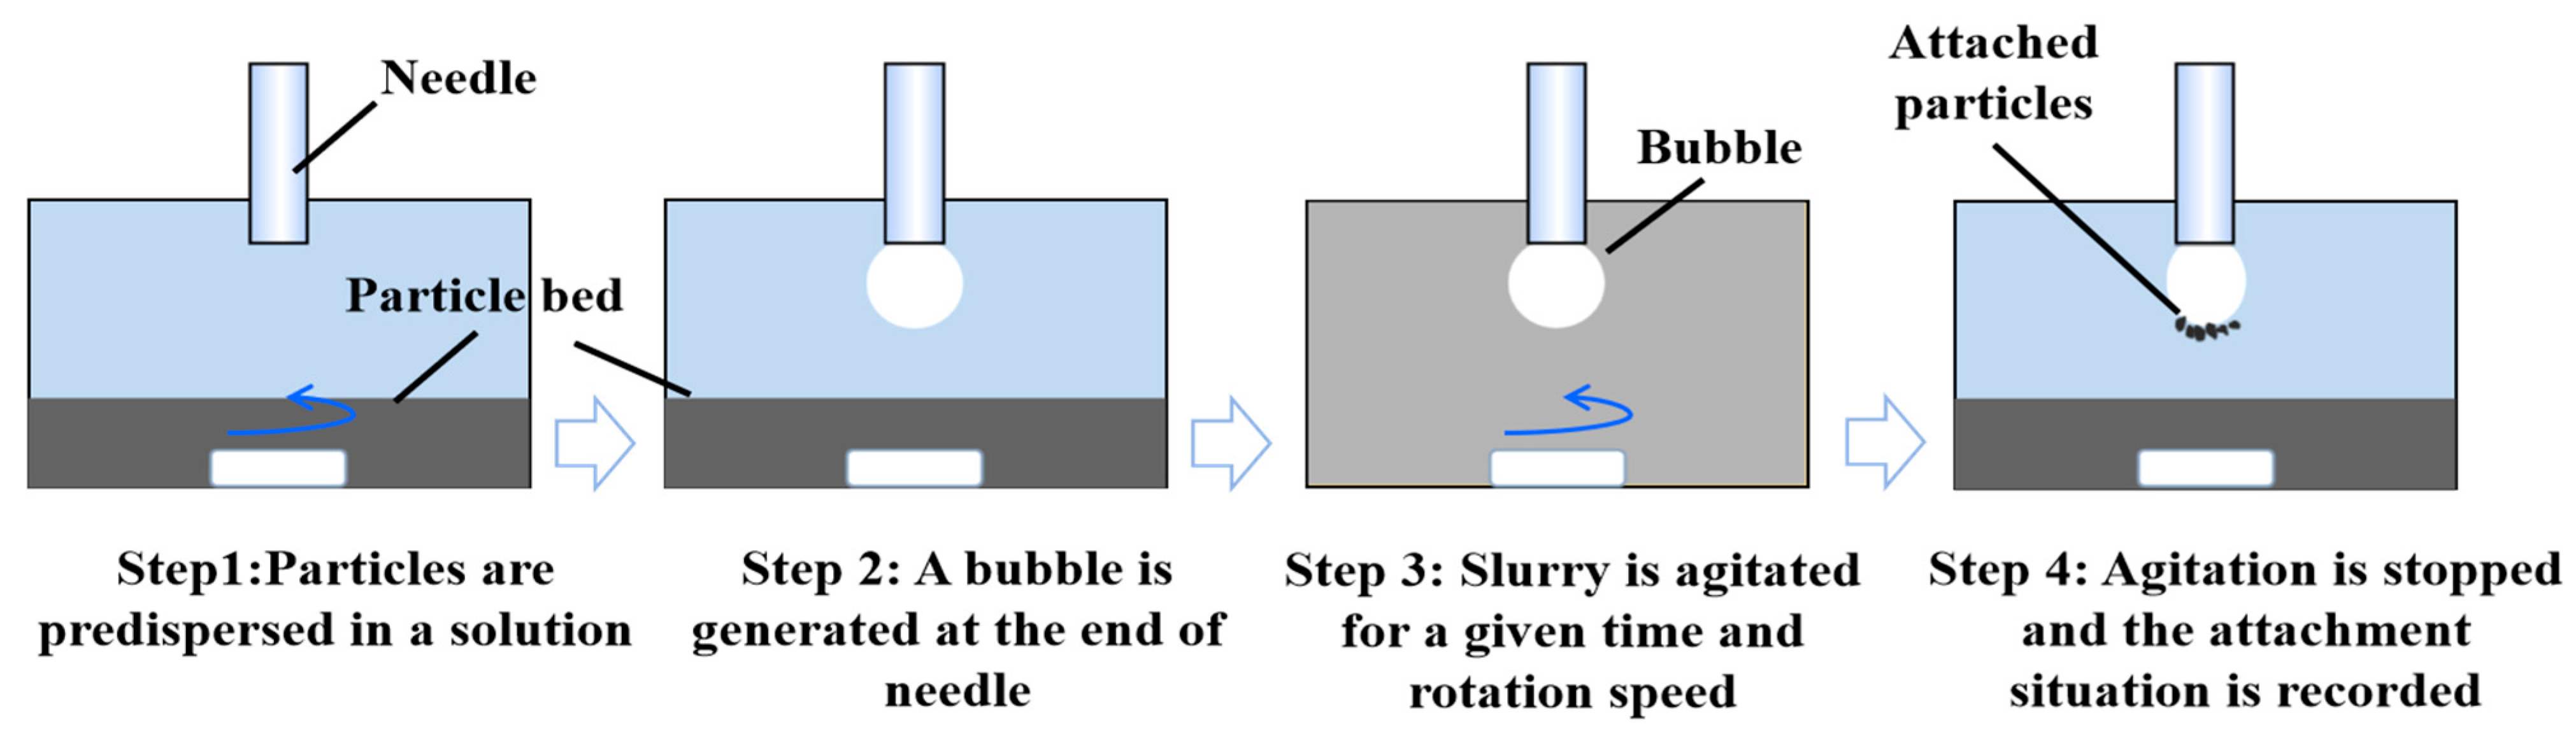
2.5. Particle–Bubble Collision and Adhesion Experiment
2.6. Interaction Force Measurement
2.7. Flotation Test
3. Results and Discussion
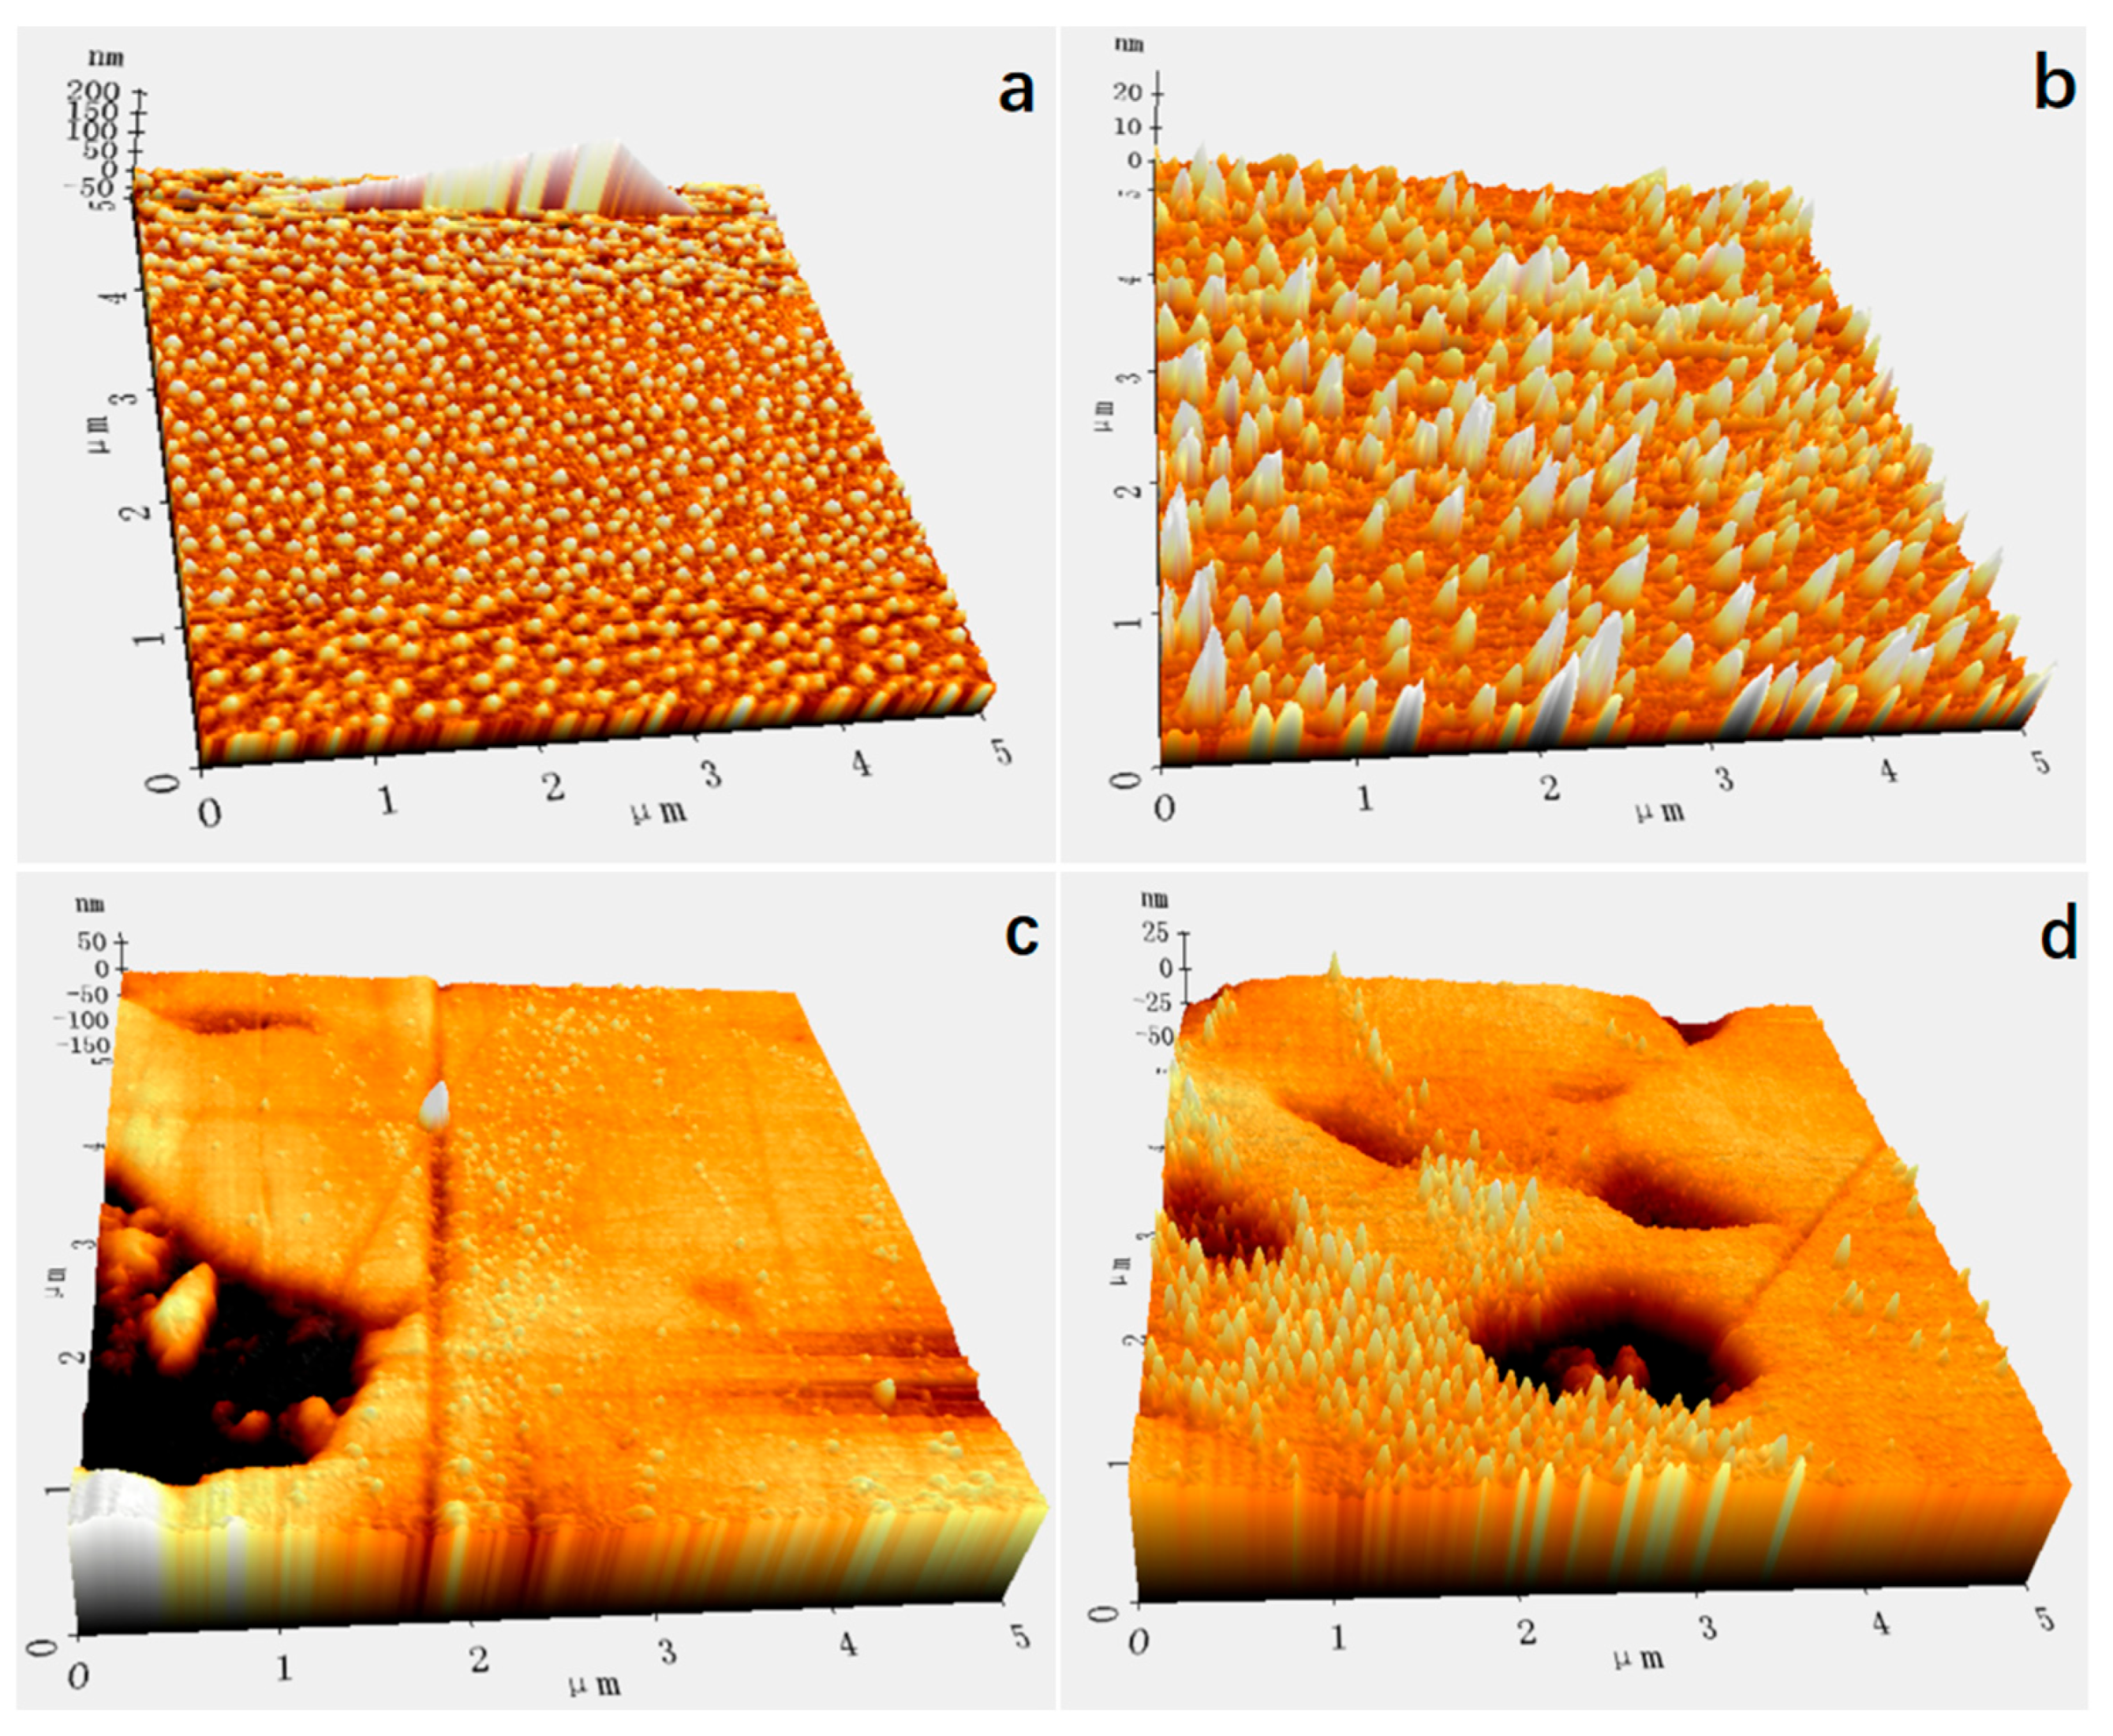
3.1. Imaging
3.2. The Effect of Gas Supersaturation on the Morphology of Graphite Aggregates
3.3. Effect of Gas Oversaturation Degree on Size Distribution of Graphite Agglomerations
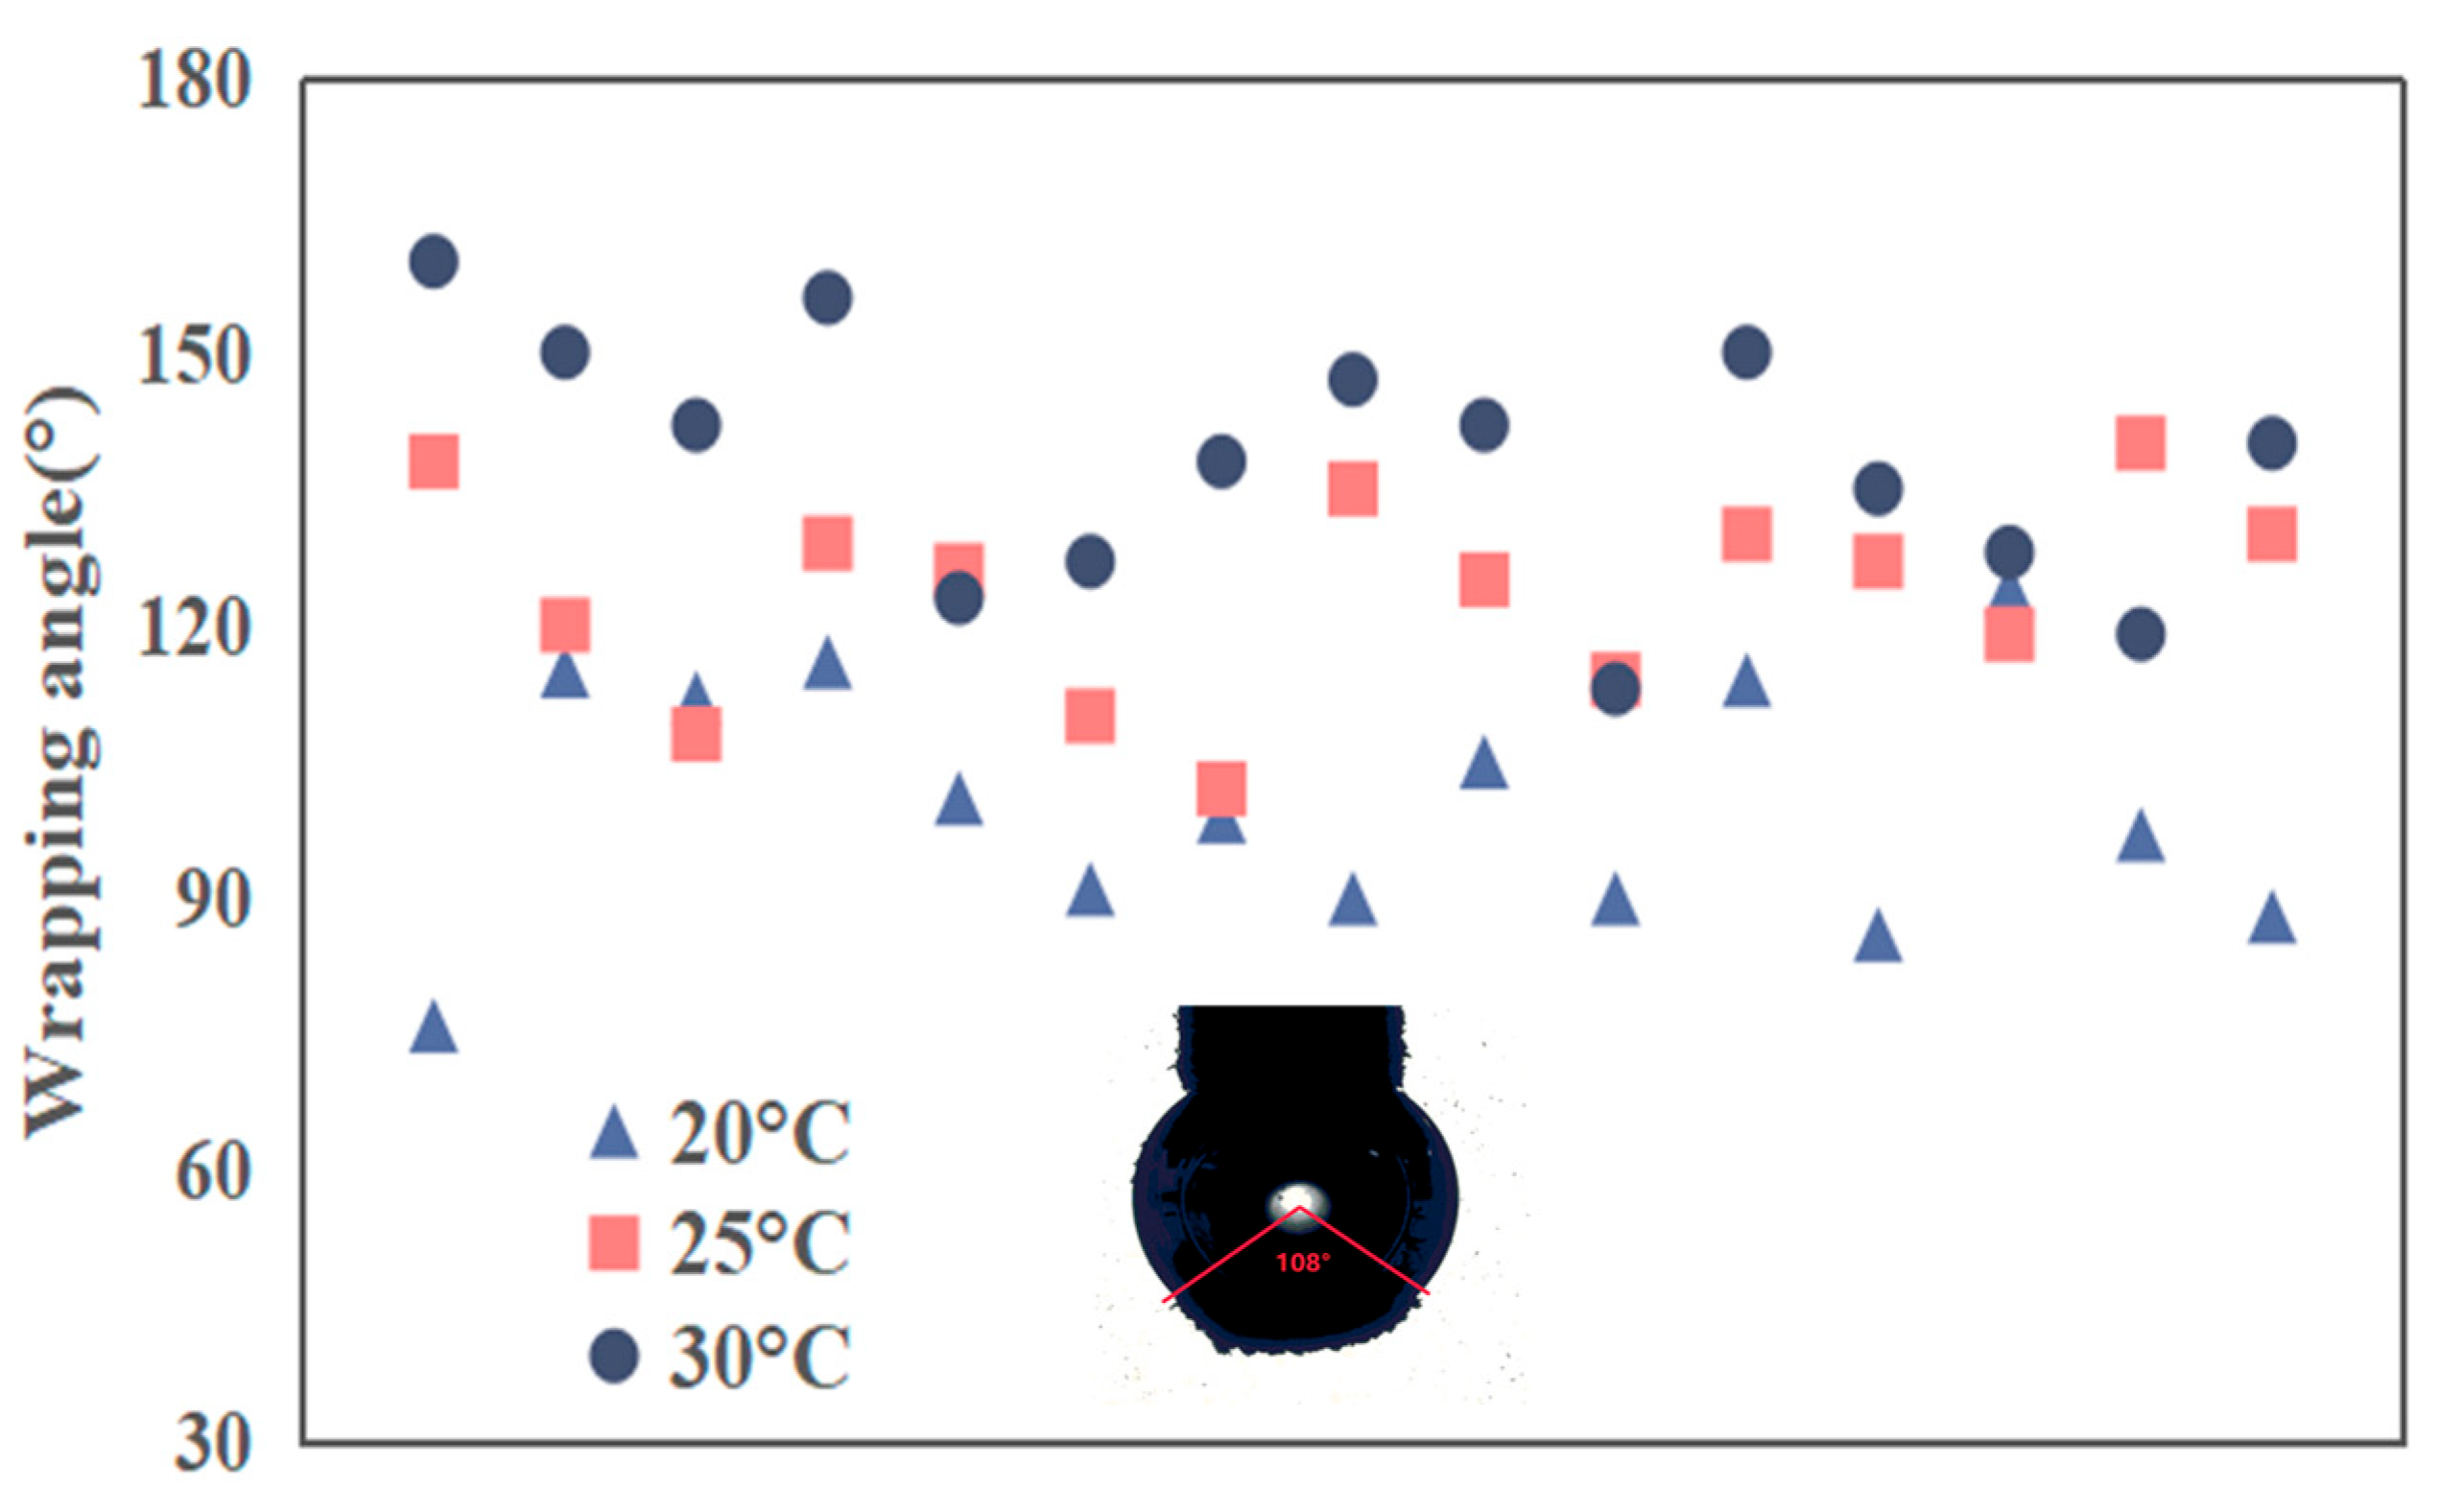
3.4. Effect of Nanobubbles on Collision and Adhesion Performance Between Graphite (Agglomerations) and a Captive Bubble
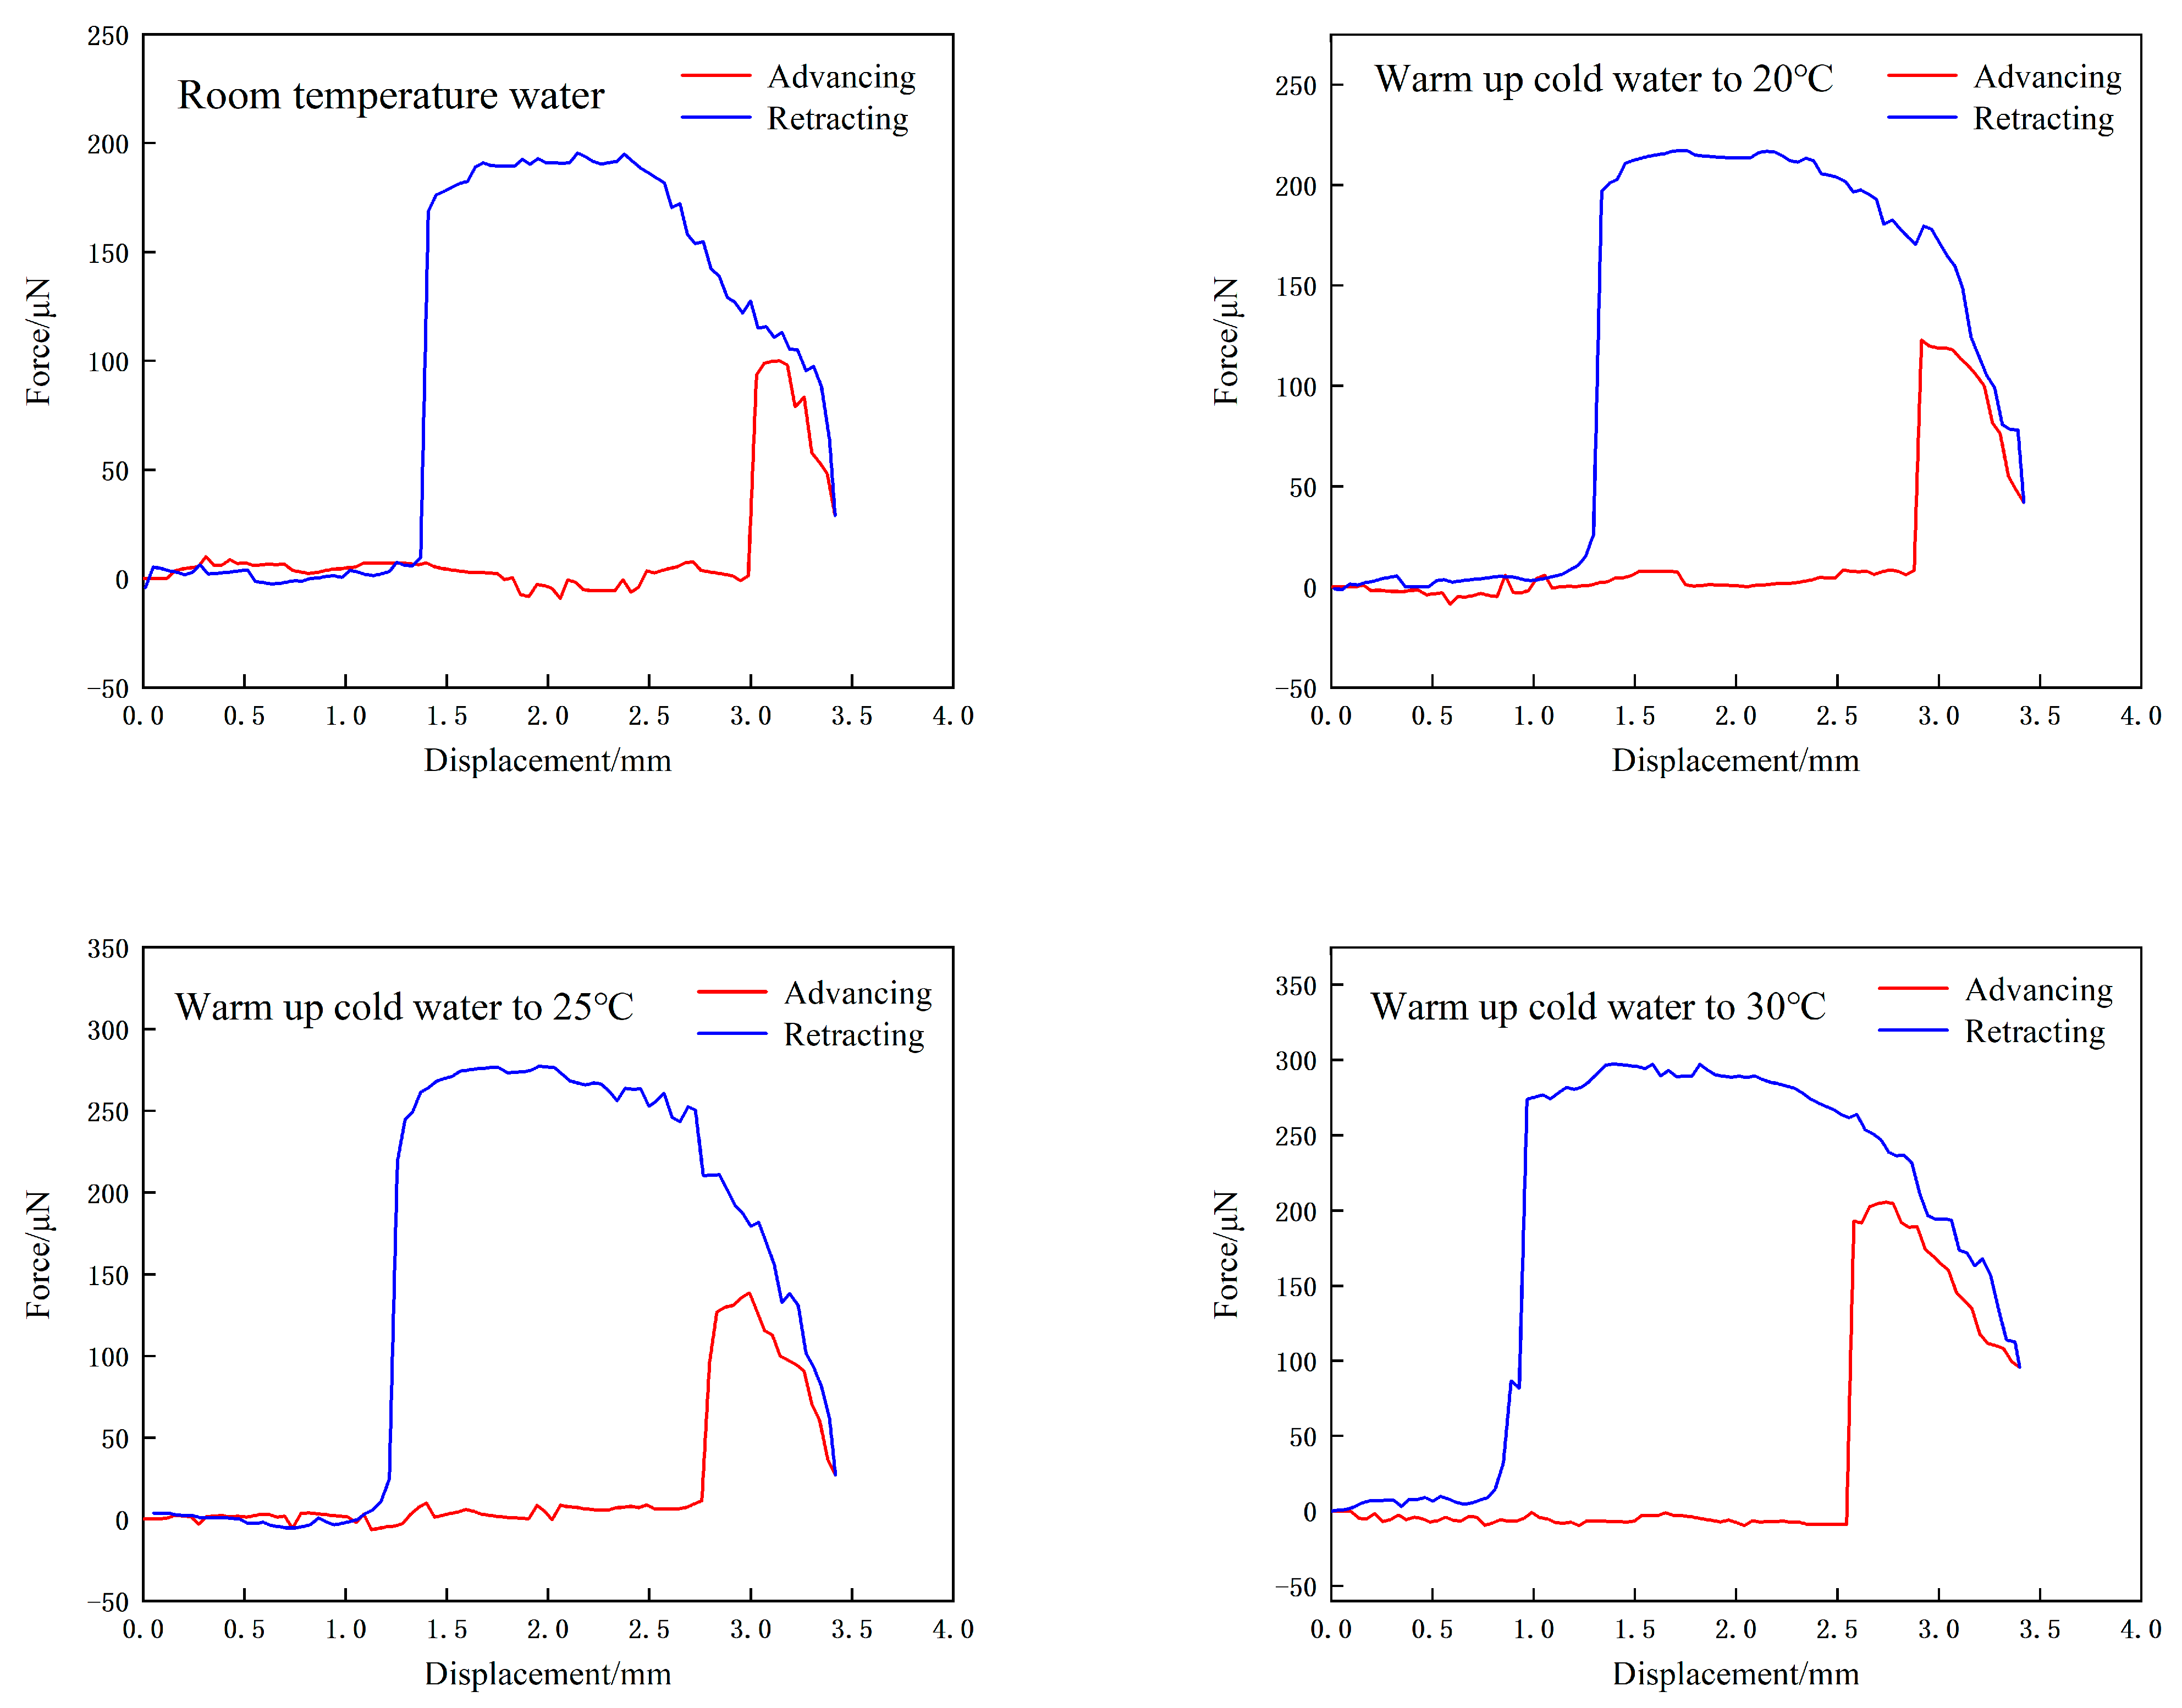
3.5. Effect of Nanobubbles on Interaction Force Between a Bubble and Substrate
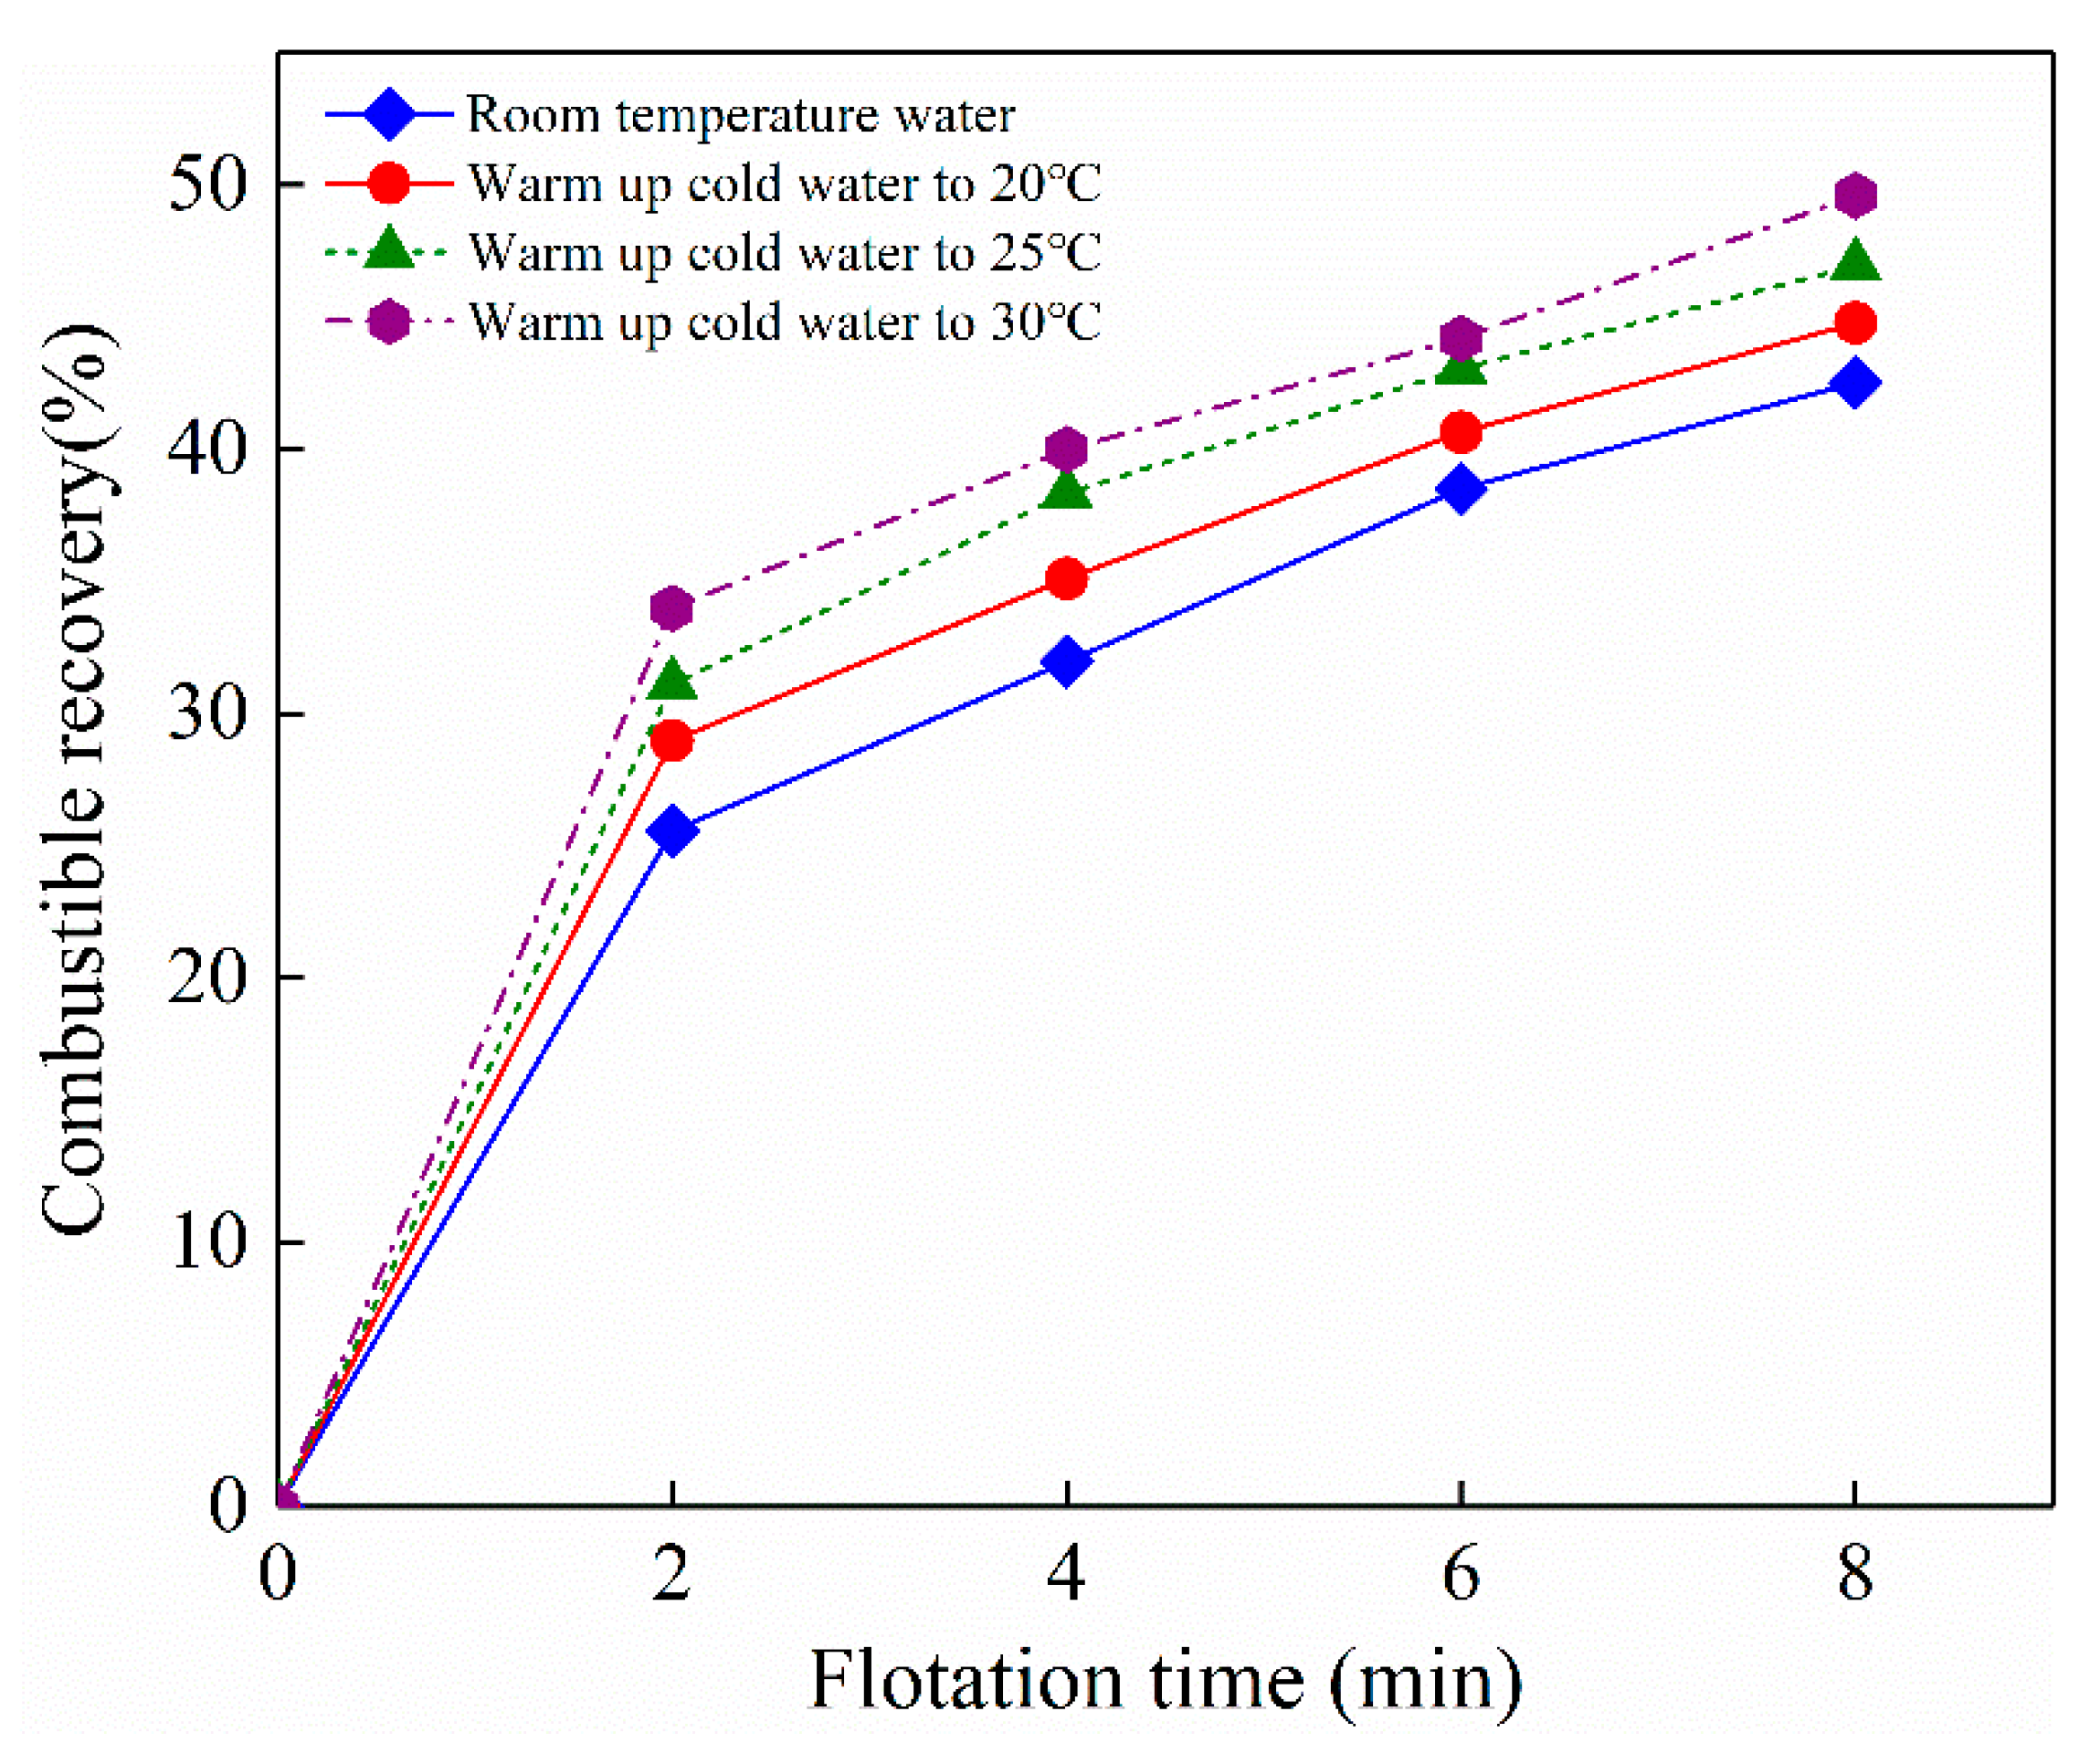
3.6. Effect of Nanobubbles on Flotation Performance of Electrode Materials
4. Conclusions
Author Contributions
Funding
Data Availability Statement
Conflicts of Interest
References
- Bertuol, D.A.; Toniasso, C.; Jiménez, B.M.; Meili, L.; Dotto, G.L.; Tanabe, E.H.; Aguiar, M.L. Application of spouted bed elutriation in the recycling of lithium-ion batteries. J. Power Sources 2015, 275, 627–632. [Google Scholar] [CrossRef]
- Al-Thyabat, S.; Nakamura, T.; Shibata, E.; Iizuka, A. Adaptation of minerals processing operations for lithium-ion (LiBs) and nickel metal hydride (NiMH) batteries recycling: Critical review. Miner. Eng. 2013, 45, 4–17. [Google Scholar] [CrossRef]
- Nguyen, A.; Schulze, H.J. Colloidal Science of Flotation; Taylor & Francis: London, UK, 2003. [Google Scholar]
- Yoon, R.-H. The role of hydrodynamic and surface forces in bubble–particle interaction. Int. J. Miner. Process. 2000, 58, 129–143. [Google Scholar] [CrossRef]
- Salces, A.M.; Bremerstein, I.; Rudolph, M.; Vanderbruggen, A. Joint recovery of graphite and lithium metal oxides from spent lithium-ion batteries using froth flotation and investigation on process water re-use. Miner. Eng. 2022, 184. [Google Scholar] [CrossRef]
- Li, H.; He, Y.; Zhang, T.; Huang, Y.-J.; Zhu, X.-N. Floatability of Co-enriched crushed products of spent lithium-ion batteries. Chin. J. Nonferrous Met. 2014, 24, 2530–2538. [Google Scholar]
- Zhang, T.; He, Y.; Ge, L.; Fu, R.; Zhang, X.; Huang, Y. Characteristics of wet and dry crushing methods in the recycling process of spent lithium-ion batteries. J. Power Sources 2013, 240, 766–771. [Google Scholar] [CrossRef]
- Zhang, G.; He, Y.; Feng, Y.; Wang, H.; Zhang, T.; Xie, W.; Zhu, X. Enhancement in liberation of electrode materials derived from spent lithium-ion battery by pyrolysis. J. Clean. Prod. 2018, 199, 62–68. [Google Scholar] [CrossRef]
- Li, J.; Su, P.; Li, J.; Liu, Y.; Wang, J.; Khoshdast, H.; He, Y.; Nazari, S. Effect of pyrolysis pretreatment combined with micro-nanobubbles on the eco-friendly recycling of spent lithium-ion batteries. J. Power Sources 2024, 611. [Google Scholar] [CrossRef]
- He, Y.; Zhang, T.; Wang, F.; Zhang, G.; Zhang, W.; Wang, J. Recovery of LiCoO2 and graphite from spent lithium-ion batteries by Fenton reagent-assisted flotation. J. Clean. Prod. 2017, 143, 319–325. [Google Scholar] [CrossRef]
- Yu, J.; He, Y.; Ge, Z.; Li, H.; Xie, W.; Wang, S. A promising physical method for recovery of LiCoO2 and graphite from spent lithium-ion batteries: Grinding flotation. Sep. Purif. Technol. 2018, 190, 45–52. [Google Scholar] [CrossRef]
- Liu, J.; Wang, H.; Hu, T.; Bai, X.; Wang, S.; Xie, W.; Hao, J.; He, Y. Recovery of LiCoO2 and graphite from spent lithium-ion batteries by cryogenic grinding and froth flotation. Miner. Eng. 2020, 148. [Google Scholar] [CrossRef]
- Efendi, R.; Gohari, S.; Chelgani, S.C. Surface properties of LiBs’ electrode active materials as key factors for the flotation recycling–A comprehensive review. Surf. Interfaces 2025, 56, 10565. [Google Scholar] [CrossRef]
- Nazari, S.; Vakylabad, A.B.; Asgari, K.; Li, J.; Khoshdast, H.; He, Y.; Hassanzadeh, A. Bubbles to batteries: A review of froth flotation for sustainably recycling spent lithium-ion batteries. J. Energy Storage 2024, 84, 110702. [Google Scholar] [CrossRef]
- Alheshibri, M.; Qian, J.; Jehannin, M.; Craig, V.S.J. A History of Nanobubbles. Langmuir 2016, 32, 11086–11100. [Google Scholar] [CrossRef]
- Lohse, D.; Zhang, X. Surface nanobubbles and nanodroplets. Rev. Mod. Phys. 2015, 87, 981–1035. [Google Scholar] [CrossRef]
- Parker, J.L.; Claesson, P.M.; Attard, P. Bubbles, cavities, and the long-ranged attraction between hydrophobic surfaces. J. Phys. Chem. 1994, 98, 8468–8480. [Google Scholar] [CrossRef]
- Lou, S.; Ouyang, Z.; Zhang, Y.; Li, X.; Hu, J.; Li, M.; Yang, F. Nanobubbles on solid surface imaged by atomic force microscopy. J. Vac. Sci. Technol. B Microelectron. Nanometer Struct. 2000, 18, 2573–2575. [Google Scholar] [CrossRef]
- Zhang, X.; Lhuissier, H.; Sun, C.; Lohse, D. Surface Nanobubbles Nucleate Microdroplets. Phys. Rev. Lett. 2014, 112, 144503. [Google Scholar] [CrossRef]
- Knüpfer, P.; Ditscherlein, L.; Peuker, U.A. Nanobubble enhanced agglomeration of hydrophobic powders. Colloids Surfaces A Physicochem. Eng. Asp. 2017, 530, 117–123. [Google Scholar] [CrossRef]
- Yang, S.; Dammer, S.M.; Bremond, N.; Zandvliet, H.J.W.; Kooij, E.S.; Lohse, D. Characterization of Nanobubbles on Hydrophobic Surfaces in Water. Langmuir 2007, 23, 7072–7077. [Google Scholar] [CrossRef]
- Ditscherlein, L.; Fritzsche, J.; Peuker, U.A. Study of nanobubbles on hydrophilic and hydrophobic alumina surfaces. Colloids Surf. A 2016, 497, 242–250. [Google Scholar] [CrossRef]
- Owens, C.L.; Schach, E.; Rudolph, M.; Nash, G.R. Surface nanobubbles on the carbonate mineral dolomite. RSC Adv. 2018, 8, 35448–35452. [Google Scholar] [CrossRef]
- Fang, Z.; Wang, L.; Wang, X.; Zhou, L.; Wang, S.; Zou, Z.; Tai, R.; Zhang, L.; Hu, J. Formation and Stability of Surface/Bulk Nanobubbles Produced by Decompression at Lower Gas Concentration. J. Phys. Chem. C 2018, 122, 22418–22423. [Google Scholar] [CrossRef]
- Zhang, L.; Zhang, Y.; Zhang, X.; Li, Z.; Shen, G.; Ye, M.; Fan, C.; Fang, H.; Hu, J. Electrochemically Controlled Formation and Growth of Hydrogen Nanobubbles. Langmuir 2006, 22, 8109–8113. [Google Scholar] [CrossRef]
- Zhang, L.; Zhang, X.; Zhang, Y.; Hu, J.; Fang, H. The length scales for stable gas nanobubbles at liquid/solid surfaces. Soft Matter 2010, 6, 4515–4519. [Google Scholar] [CrossRef]
- Nirmalkar, N.; Pacek, A.W.; Barigou, M. Interpreting the interfacial and colloidal stability of bulk nanobubbles. Soft Matter 2018, 14, 9643–9656. [Google Scholar] [CrossRef] [PubMed]
- Nazari, S.; Shafaei, S.Z.; Gharabaghi, M.; Ahmadi, R.; Shahbazi, B.; Maoming, F. Effects of nanobubble and hydrodynamic parameters on coarse quartz flotation. Int. J. Min. Sci. Technol. 2019, 29, 289–295. [Google Scholar] [CrossRef]
- Liu, L.; Hu, S.; Wu, C.; Liu, K.; Weng, L.; Zhou, W. Aggregates characterizations of the ultra-fine coal particles induced by nanobubbles. Fuel 2021, 297. [Google Scholar] [CrossRef]
- Li, C.; Xu, M.; Zhang, H. Efficient separation of high-ash fine coal by the collaboration of nanobubbles and polyaluminum chloride. Fuel 2020, 260. [Google Scholar] [CrossRef]
- Li, C.; Xu, M.; Xing, Y.; Zhang, H.; Peuker, U.A. Efficient separation of fine coal assisted by surface nanobubbles. Sep. Purif. Technol. 2020, 249, 117163. [Google Scholar] [CrossRef]
- Li, C.; Li, D.; Li, X.; Xu, M.; Zhang, H. Surface nanobubbles on the hydrophobic surface and their implication to flotation. Int. J. Miner. Met. Mater. 2022, 29, 1493–1501. [Google Scholar] [CrossRef]
- Li, C.; Zhang, Y.; Zhang, H. Study on removal of ultrafine graphite by nanobubbles-assisted flotation technique from graphite slime slurry. Sep. Purif. Technol. 2023, 328. [Google Scholar] [CrossRef]
- Tang, C.; Ma, F.; Wu, T.; Zhang, D.; Wang, Y.; Zhao, T.; Fan, Z.; Liu, X. Study on surface physical and chemical mechanism of nanobubble enhanced flotation of fine graphite. J. Ind. Eng. Chem. 2023, 122, 389–396. [Google Scholar]
- Nazari, S.; Zhou, S.; Hassanzadeh, A.; Li, J.; He, Y.; Bu, X.; Kowalczuk, P.B. Influence of operating parameters on nanobubble-assisted flotation of graphite. J. Mater. Res. Technol. 2022, 20, 3891–3904. [Google Scholar] [CrossRef]
- Butt, H.-J.; Cappella, B.; Kappl, M. Force measurements with the atomic force microscope: Technique, interpretation and applications. Surf. Sci. Rep. 2005, 59, 1–152. [Google Scholar] [CrossRef]
- Liang, L.; Peng, Y.; Tan, J.; Xie, G. A review of the modern characterization techniques for flocs in mineral processing. Miner. Eng. 2015, 84, 130–144. [Google Scholar] [CrossRef]
- Li, C.; Zhang, H. Influence of nanobubbles on flotation behavior of electrode materials from spent lithium ions batteries. J. China Coal Soc. 2022, 47, 257–264. [Google Scholar]
- Shang, Z.; Yu, W.; Zhou, J.; Zhou, X.; Zeng, Z.; Tursun, R.; Liu, X.; Xu, S. Recycling of spent lithium-ion batteries in view of graphite recovery: A review. eTransportation 2024, 20, 100320. [Google Scholar] [CrossRef]
- Huang, B.; Pan, Z.; Su, X.; An, L. Recycling of lithium-ion batteries: Recent advances and perspectives. J. Power Sources 2018, 399, 274–286. [Google Scholar] [CrossRef]
- Zhang, X.H.; Li, G.; Maeda, N.; Hu, J. Removal of Induced Nanobubbles from Water/Graphite Interfaces by Partial Degassing. Langmuir 2006, 22, 9238–9243. [Google Scholar] [CrossRef]


Disclaimer/Publisher’s Note: The statements, opinions and data contained in all publications are solely those of the individual author(s) and contributor(s) and not of MDPI and/or the editor(s). MDPI and/or the editor(s) disclaim responsibility for any injury to people or property resulting from any ideas, methods, instructions or products referred to in the content. |
© 2025 by the authors. Licensee MDPI, Basel, Switzerland. This article is an open access article distributed under the terms and conditions of the Creative Commons Attribution (CC BY) license (https://creativecommons.org/licenses/by/4.0/).
Share and Cite
Li, X.; Li, C.; Zhang, Y.; Zhang, H. Effect of Gas Oversaturation Degree on Flotation Separation Performance of Electrode Materials from Spent Lithium-Ion Batteries. Minerals 2025, 15, 560. https://doi.org/10.3390/min15060560
Li X, Li C, Zhang Y, Zhang H. Effect of Gas Oversaturation Degree on Flotation Separation Performance of Electrode Materials from Spent Lithium-Ion Batteries. Minerals. 2025; 15(6):560. https://doi.org/10.3390/min15060560
Chicago/Turabian StyleLi, Xiaodong, Chenwei Li, Yating Zhang, and Haijun Zhang. 2025. "Effect of Gas Oversaturation Degree on Flotation Separation Performance of Electrode Materials from Spent Lithium-Ion Batteries" Minerals 15, no. 6: 560. https://doi.org/10.3390/min15060560
APA StyleLi, X., Li, C., Zhang, Y., & Zhang, H. (2025). Effect of Gas Oversaturation Degree on Flotation Separation Performance of Electrode Materials from Spent Lithium-Ion Batteries. Minerals, 15(6), 560. https://doi.org/10.3390/min15060560