Article

Subduction Dynamics of the Paleo-Pacific Plate: New Constraints from Quartz Diorites in the Fudong Region

by
Jijie Song
,
Yidan Zhu
and
Xiangzhong Chen
*
School of Resources and Engineering, Shandong University of Technology, Zibo 255000, China
*
Author to whom correspondence should be addressed.
Minerals 2025, 15(6), 562; https://doi.org/10.3390/min15060562
Submission received: 11 March 2025 / Revised: 20 May 2025 / Accepted: 22 May 2025 / Published: 25 May 2025
(This article belongs to the Section Mineral Geochemistry and Geochronology)

Abstract

:
The Yanbian area of Jilin Province is situated in the eastern segment of the southern margin of the Xing-Meng Orogenic Belt, representing a region that has been superimposed and reworked by the Paleo-Asian Ocean and Circum-Pacific tectonic event. To determine the emplacement age and petrogenesis of the quartz diorite in the Fudong area of Yanbian, Jilin Province, and to investigate its tectonic setting, petrographic studies, zircon U-Pb geochronology, whole-rock Sr-Nd isotopic analysis, zircon Hf isotopic analysis, and detailed geochemical investigations of this intrusion were carried out. The results indicate that the Fudong quartz diorite has: (1) A weighted mean zircon U-Pb age of 186 ± 1.7 Ma, corresponding to the Late Early Jurassic; (2) geochemically high concentrations of Sr (average: 1146 ppm) and Ba (average: 1213 ppm), and enrichment of light rare earth elements (LREE), along with notably high Th/Yb and Rb/Y ratios; (3) geochemically, the quartz diorite is enriched in large-ion lithophile elements (LILEs; e.g., Ba, K) and light rare earth elements (LREEs), while being depleted in high-field-strength elements (HFSEs; e.g., Ta, Ti). These features are consistent with magma formed in a subduction-related setting. In summary, the Fudong quartz diorite formed within an active continental margin tectonic environment associated with the subduction of the Paleo-Pacific Plate. Its primary magma likely originated from an enriched lithospheric mantle that had been metasomatized by fluids released from the subducted slab.

Graphical Abstract

1. Introduction

The Central Asian Orogenic Belt (CAOB) is one of the largest and most complex accretionary orogenic belts in the world. It preserves nearly 800 million years of tectonic evolution and played a crucial role in the formation of new crust during the Phanerozoic era [1,2,3,4,5]. This region preserves a complex, multiphase tectonic evolution and serves as a key locality for investigating the accretionary processes related to the closure of the Paleo-Asian Ocean. This complex tectonic interplay has given rise to a distinctive structural framework termed the “Three Major Tectonic Systems with Two-Phase Superimposition”, positioning the region as a globally critical research domain for investigating continental accretion mechanisms and structural overprinting processes, unraveling microcontinental block collision-amalgamation dynamics, and deciphering transitional crustal regimes between oceanic and continental domains [6,7]. Current research on the tectonic evolution of this region has primarily concentrated on the Heilongjiang Complex, particularly its high-pressure metamorphic belts, as well as the bimodal igneous rocks of the Xiaoxing’anling–Zhangguangcai Range. However, studies focusing on the calc-alkaline igneous rock belts formed by the subduction of the Paleo-Pacific Plate remain relatively limited, which has significantly hindered the current understanding of the region’s tectonic evolution. The Yanbian region, located in eastern Jilin Province, Northeast China, lies at the tectonic junction between the Central Asian Orogenic Belt (CAOB) and the North China Craton (NCC) (Figure 1). This area is rich in mineral resources, mainly gold and copper, with additional deposits of tungsten, lead-zinc, and other polymetallic ores. Petrogenetic and geochronological studies of Late Paleozoic to Early Mesozoic intermediate to felsic magmatic rocks in the Yanbian region have led researchers to propose that Early Jurassic magmatism in this area was genetically linked to the subduction of the Paleo-Pacific Plate. Due to its complex tectonic evolutionary history, the Yanbian region has become a vital natural laboratory within the Circum-Pacific tectonic domain for studying multi-stage subduction systems [8,9,10].
Given that the Yanbian area preserves a record of magmatism linked to the subduction of the Paleo-Pacific Plate, investigations of its tectonic setting are critical for reconstructing the evolutionary history of Northeast China [6,11]. There is ongoing debate regarding the initiation of Paleo-Pacific subduction, including during the Permian [11,12], the Middle to Late Triassic [13,14], and the Late Triassic to Early Jurassic [15,16,17,18]. Consequently, the igneous rocks in the Yanbian area are expected to contain valuable evolutionary information about the Paleo-Pacific tectonic domain. These rocks offer valuable insights into the mechanisms of crustal growth, deeper magmatic processes, and the broader regional tectonic evolution [19].
Figure 1. (a) Tectonic Division of the Eastern Segment of the Central Asian Orogenic Belt (modified from [13]). (b) Simplified tectonic units of the Yanbian area, illustrating the distribution of Late Paleozoic to early Mesozoic plutons. (c) Detailed geological map of Helong, Yanbian. Age data refer to this study. F1: Dunhua–Mishan fault; F2: Fuerhe–Gudonghe fault; F3: Longjing–Baijin fault (modified from [13]).
Minerals 15 00562 g001
To analyze the genesis of the area and its magma source characteristics, this study systematically analyzed petrography, zircon U-Pb geochronology, geochemistry, and zircon Hf isotopes.

2. Geological Background and Petrology

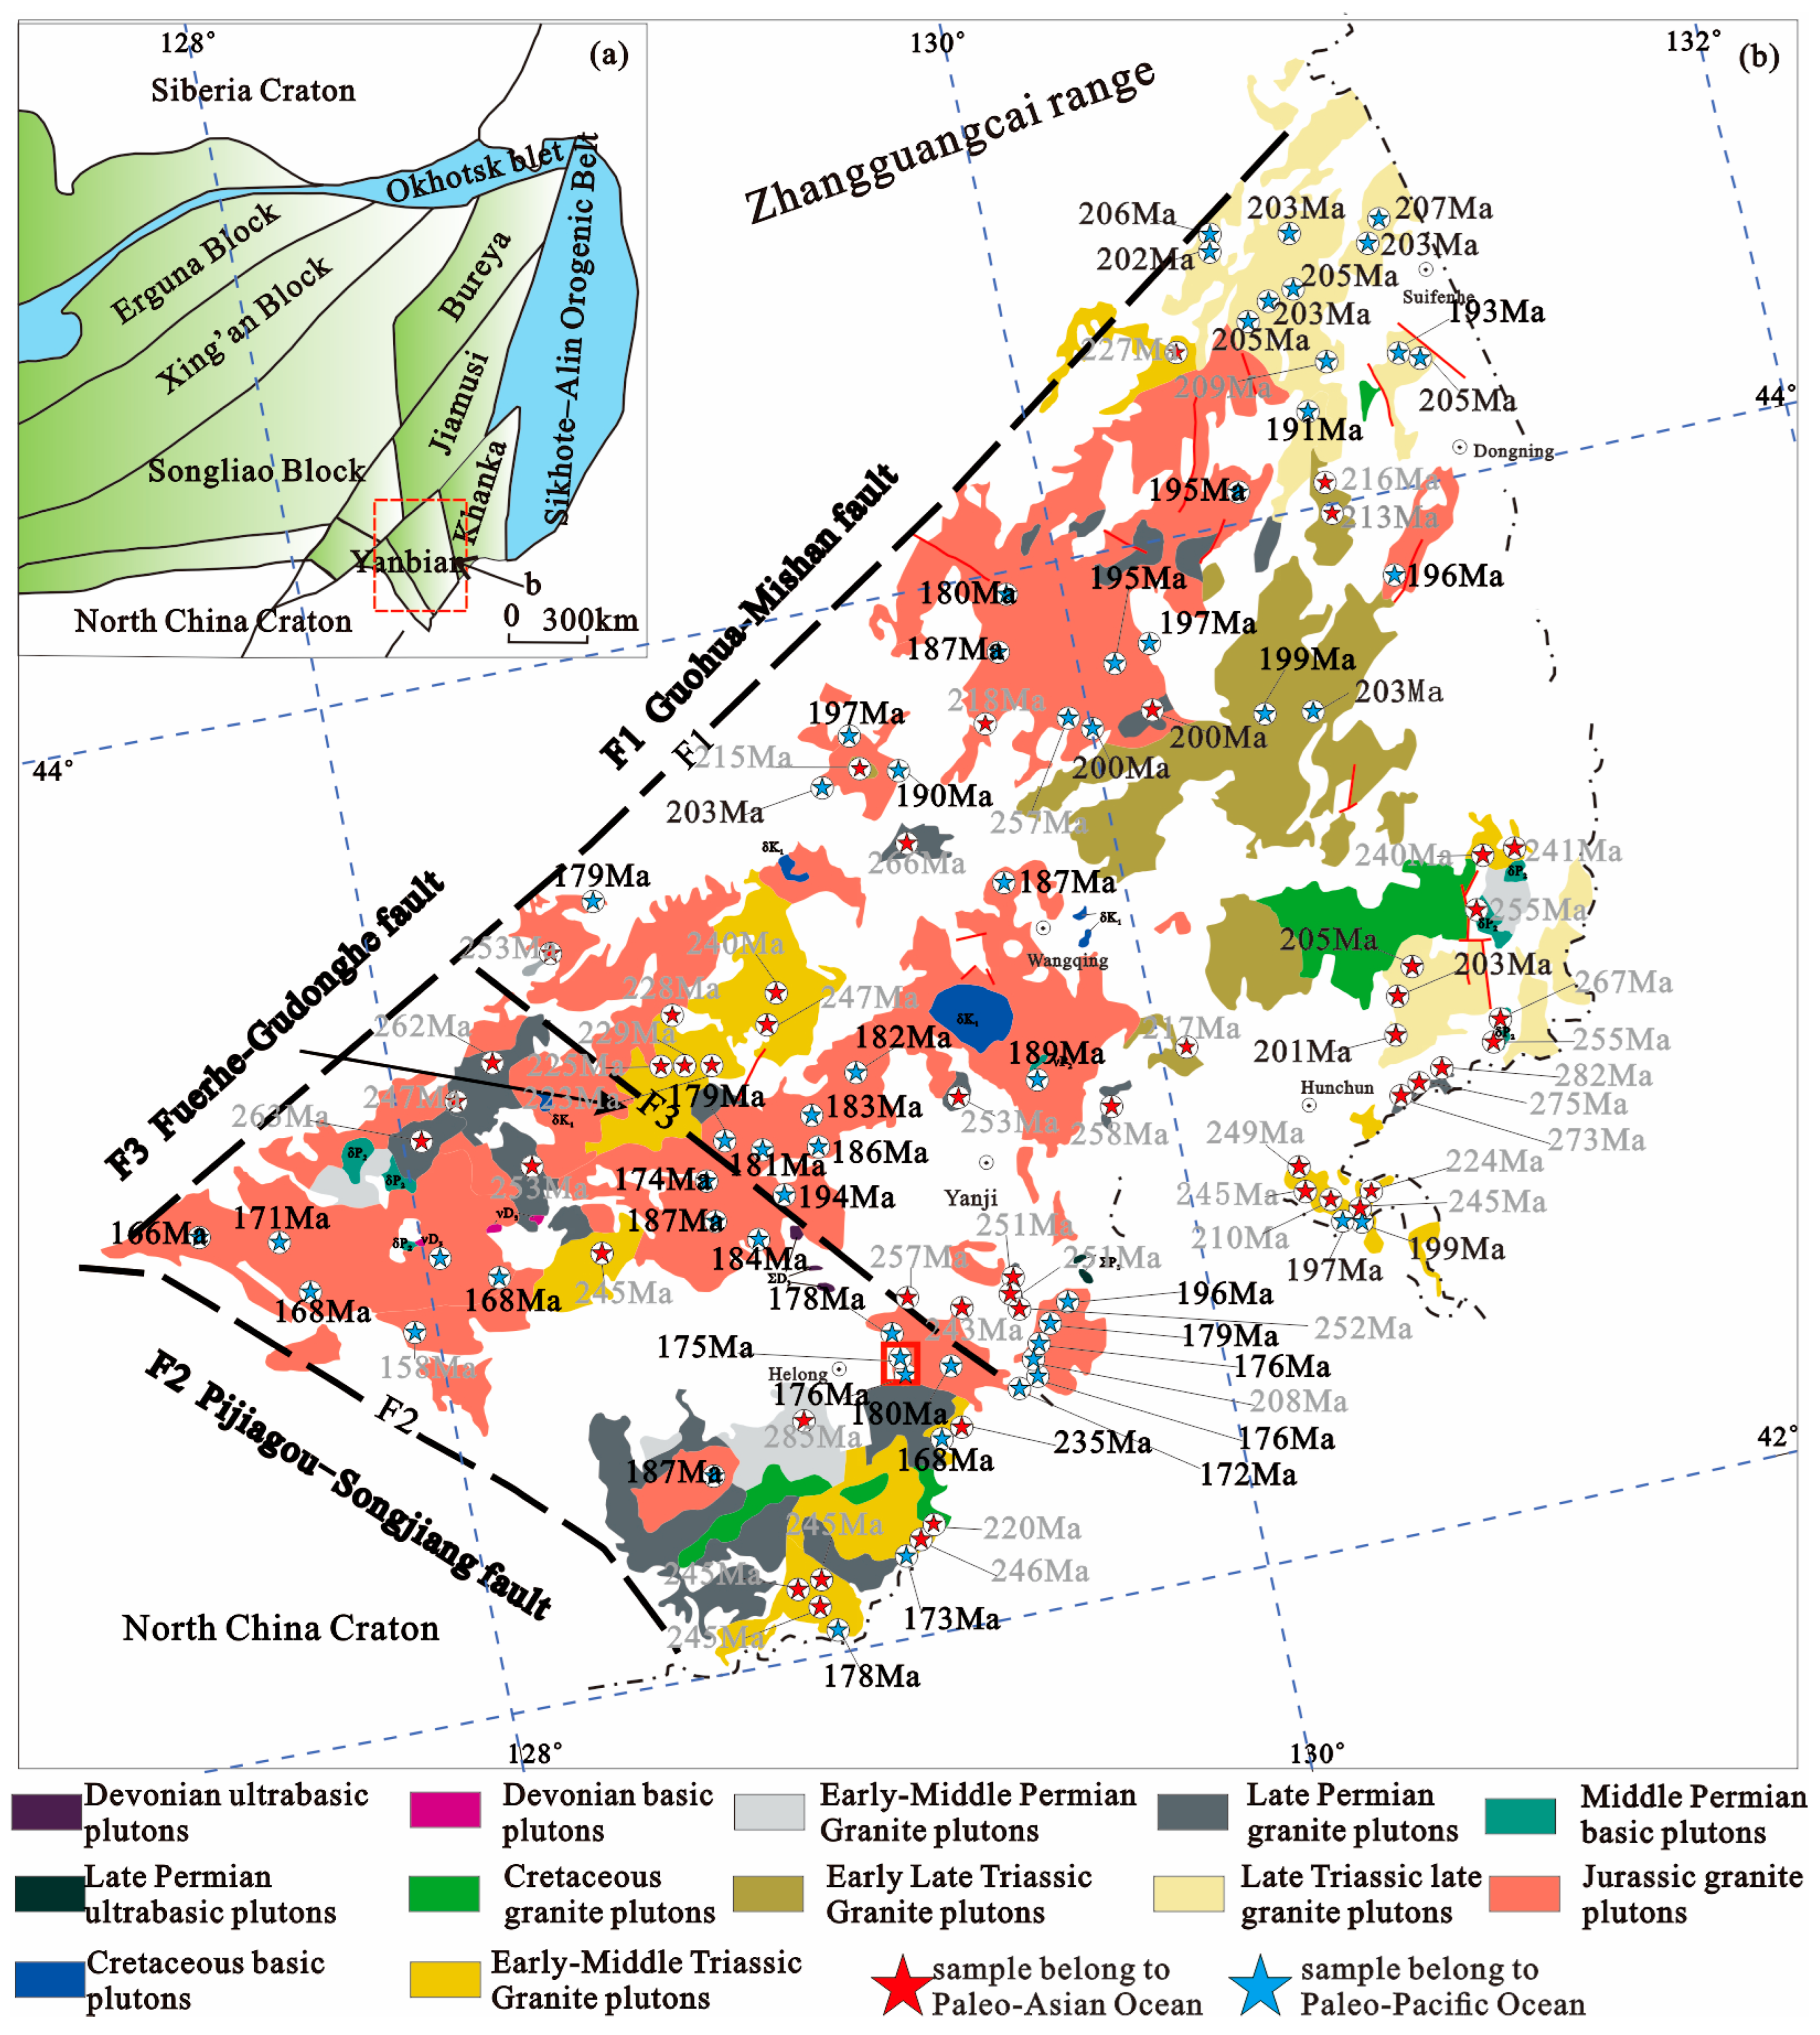
2.1. Regional Geological Setting

The Yanbian area in Jilin Province is located at the convergence zone of three tectonic units: the Jiamusi–Xingkai block, the Longgang block on the northern margin of the North China Craton, and the Zhangguangcai Range. Notably, the Dunhua–Mishan fault zone (F1, Figure 1b) is located in the western part of the Yanbian area, while the Fuerhe–Gudonghe (F2, Figure 1b) and Longjing–Baijin faults (F3, Figure 1b) are situated south of this region, extending in a northwest–southwest (NWW) direction. NW- and NNW-trending faults are extensively present throughout the study area. Archaean, Paleozoic, Mesozoic, and Quaternary strata are exposed in the study area. Previous studies have identified three primary stages of granitic magmatism in the Yanbian area: the Permian, Triassic–Early Jurassic, and Cretaceous periods [6]. In addition, minor intrusions of intermediate or mafic rocks, including the Hunchun gabbro and Diorite pluton, the Xintun Diorite pluton, the Tumen gabbro pluton, and the Shuguang Diorite pluton, are sparsely distributed throughout the Yanbian region [20,21,22].
The study area is separated into two parts by the Fuerhe–Gudonghe fault: the accretionary belt in the north and the North China Craton in the south (Figure 1). Triassic to Jurassic granitoids are widely exposed in the study area, with Early Jurassic gabbros and diorites located in the center (Figure 1c) [6].

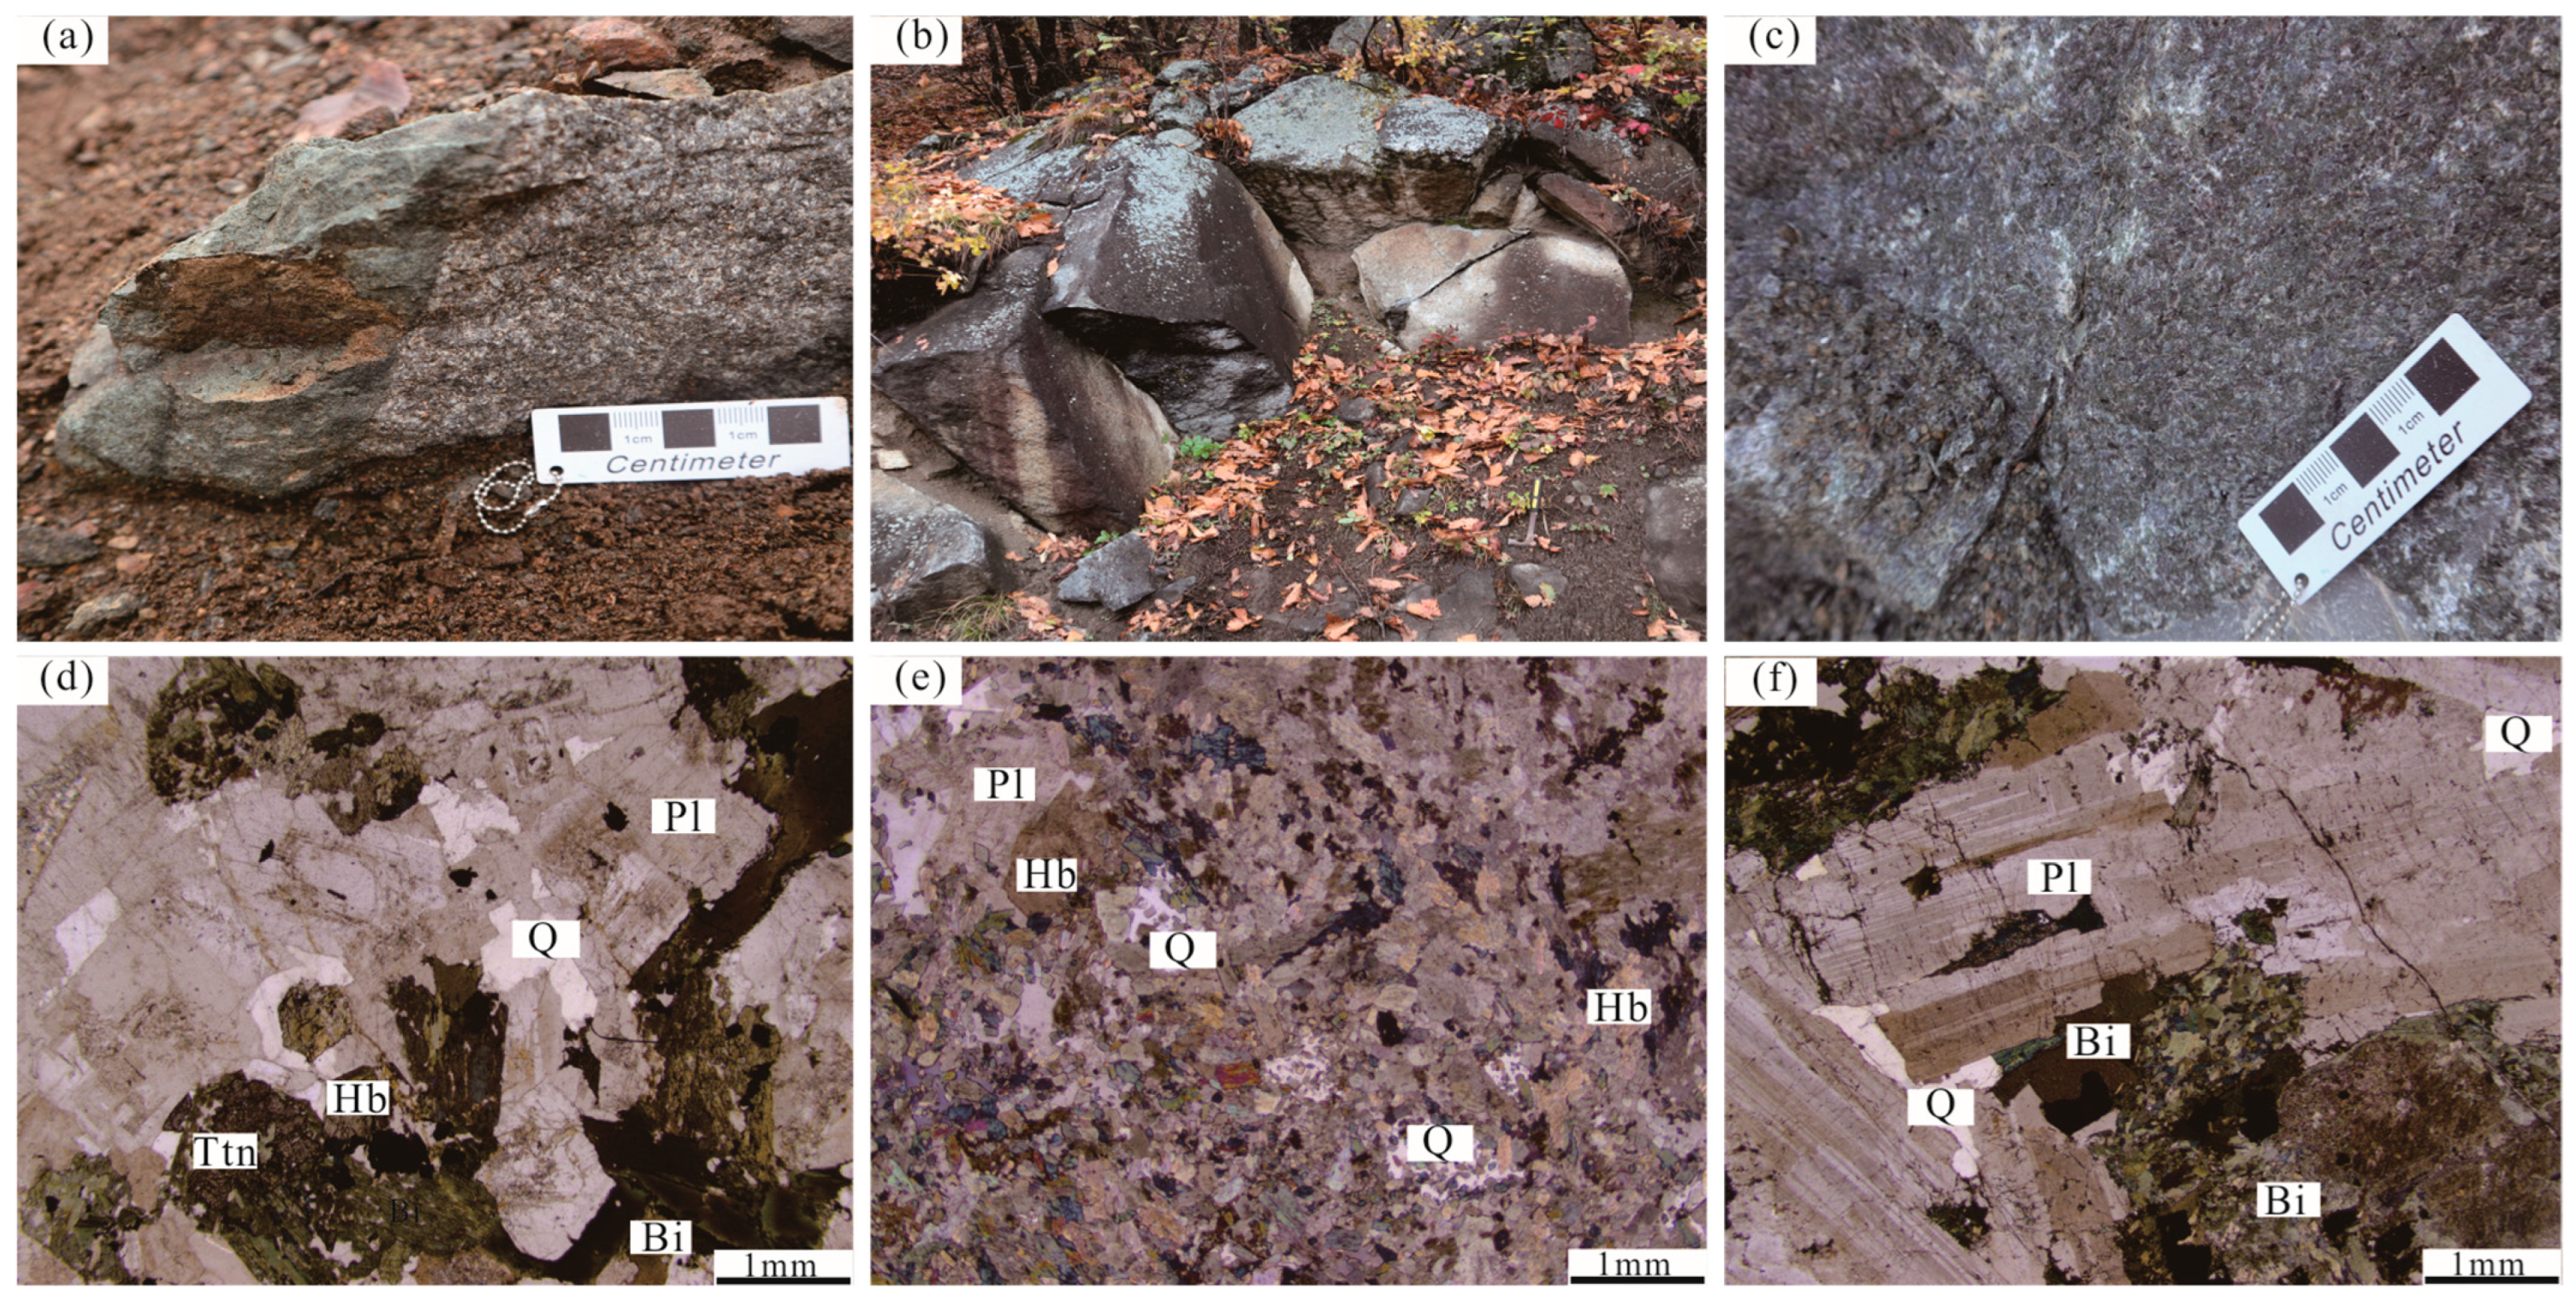
2.2. Lithological Characteristics of Fudong Quartz Diorite

The Fudong Pluton spans some 13.0 Km2 and was sampled at five sites for U-Pb dating. This pluton intrudes rocks of the Jinan Formation, is intruded by Middle Jurassic monzonitic granite, and is overlain by Cretaceous strata. The quartz diorite samples primarily consist of plagioclase and hornblende, with minor amounts of quartz and biotite. All samples exhibit a medium- to fine-grained texture. Accessory minerals present include sphene, apatite, and euhedral zircon (Figure 2d–f).

3. Analytical Methods

3.1. Zircon U-Pb Dating

Zircon separation was performed at the Hebei Provincial Regional Geological and Mineral Investigation Institute, while Cathodoluminescence (CL) imaging analysis was conducted at the Beijing Ion Probe Center utilizing the SHRIMP II instrument. Zircon U-Pb isotope analysis was conducted at the Experimental Test Center of the Tianjin Institute of Geology and Mineral Resources. The Neptune LA-MC-ICP-MS was used for analysis, manufactured by Thermo Fisher Scientific (Waltham, Massachusetts, USA), along with the UP193-FXARF excimer laser, provided by ESI Company. The GJ-1 (~640 Ma) zircon was utilized as an external standard for fractionation correction, and the NIST “SRM610” glass standard sample was employed as an external standard for element content determination [23]. The repeatability and consistency of the analytical results were assessed through repeated analyses of the GJ-1 zircon standard sample. The standard zircon GJ-1 was tested after every eight analysis points [23]. The zircon was ablated using a 193 nm laser. The laser ablation depth ranged from 20 to 40 μm, with a beam diameter of 35 μm. Subsequently, the method proposed by Anderson [24] was employed to correct the isotope ratios of the experimental data, removing the influence of common lead and ensuring data accuracy. Age calculations and diagram plotting were performed using the Isoplot 3.0 software. The results, including zircon U–Pb concordia diagrams, are displayed with 2σ uncertainties, representing a 95% confidence level [25].

3.2. Major and Trace Element Determinations

The experiments were conducted using an ARL Perform’X 4200 X-ray fluorescence spectrometer manufactured by Thermo Fisher. Standardless quantitative analysis was performed with UniQuant, enabling accurate determination of the compositional content of the samples. For quality control, 1–2 certified reference materials were analyzed per sample batch, and 1 duplicate sample was included for every 20 test samples. Major and trace elements in the samples were analyzed at the Tianjin Geological Survey Center of the China Geological Survey. Trace elements were analyzed using inductively coupled plasma mass spectrometry (ICP-MS), achieving analytical accuracy of better than 5%. Major elements were analyzed using an X-ray fluorescence spectrometer, which provided an analytical error of less than 1%. Quality monitoring was performed using reference materials such as the USGS standard reference samples BCR-2 and BHVO-2. 3
The specific work process is as follows: (1) Precisely weigh 50 mg to 100 mg of the powder sample and place it into a Teflon dissolution bomb. Then, sequentially add 1 mL of high-purity HNO3 and high-purity HF, shaking to ensure thorough mixing. (2) Place the mixed dissolution bomb into a steel sleeve and then put it into an oven set at 190 °C for drying for at least 24 h. (3) After the dissolved sample has completely cooled, open the cover and place it on an electric hot plate at 140 °C to evaporate to dryness for the first time. Then, add 1 mL of HNO3 and repeat the evaporation process until the sample reaches dryness again. (4) Add 1 mL of high-purity HNO3, 1 mL of MQ (Milli-Q) water, and 1 mL of the internal standard solution (containing four internal standards: Rh, In, Re, Bi). Then, place the dissolution bomb into the steel sleeve and heat it in the oven for more than 12 h. (5) Transfer the solution into a polyethylene plastic bottle and dilute it to 100 g with a 2% HNO3 solution for ICP-MS analysis. For data processing, use USGS standards W-2a as the standard references. The reference samples used in the data processing are the USGS standards W-2a and BHVO-2.

3.3. Whole-Rock Sr-Nd Isotopic Analyses

Sample digestion and Sr-Nd isotope separation and purification were performed at Guizhou Tongwei Testing Technology Co., Ltd., utilizing Thermo Fisher’s Neptune Plus MC-ICP-MS. The reported 87Sr/86Sr and 143Nd/144Nd ratios were calibrated to the NIST 987 standard, with values of 87Sr/86Sr = 0.710249 (2σ) and 143Nd/144Nd = 0.512438 (2σ), respectively. Quality monitoring was performed using reference materials such as the USGS standard reference samples BCR-2 and BHVO-2. The internal precision (SE) of the Sr-Nd isotope standard solution test is typically better than 5 × 10⁻⁶, with a sensitivity generally around 550 V/μg/g.
During the operation, the digestion of the samples is carried out first: (1) Place the ground sample (particle size 50–100 µm) in an oven set at 105 °C and dry for 12 h. (2) Accurately weigh 50–100 mg of the powdered sample and transfer it into a Teflon digestion bomb. (3) Add 1 mL of high-purity HNO3 followed by 1 mL of high-purity HF successively to the Teflon digestion bomb. (4) Place the Teflon digestion bomb into a steel sleeve, tighten the caps securely, and then position it in an oven set at 190 °C. Heat the digestion bomb for more than 24 h to ensure complete digestion of the sample. (5) Once the digestion bomb has cooled, carefully open the lid and transfer its contents to an appropriate container. Place the container on an electric hot plate set to 140 °C and evaporate the solution to dryness. After drying, add 1 mL of HNO3 to the residue and continue evaporating to dryness again to eliminate residual acids. (6) Dissolve the dried residue by adding 1.5 mL of 2.5 mol/L HCl, 1.0 mol/L HBr, and 2.0 mol/L HF sequentially. Allow the mixture to stand and undergo chemical separation processes as required before further analysis.

3.4. Zircon Hf Isotopic Analyses

At the Isotope Laboratory of the Tianjin Geological Survey Center of the China Geological Survey, in situ Hf isotopic analysis was conducted on sample FD9. The testing instrumentation comprised a Neptune mass spectrometer and a UP193-FX ArF excimer laser. The laser energy density was set to 10–11 J·cm⁻2, with zircon international standard 91,500 used as the external standard. Isobaric interferences (e.g., Yb and Lu on Hf) were corrected via internal standard normalization, followed by precision evaluation through 10 consecutive analyses of the same sample spot, requiring the relative standard deviation (RSD) of 176Hf/177Hf to be ≤0.002%. Accuracy was validated by analyzing certified reference materials, ensuring measured 176Hf/177Hf ratios fell within the ±2σ range of their reference values. The laser beam diameter was 50 μm. The analysis methods and procedures were referenced from the literature [26], as were the calculation methods and formulas for Hf isotopes. The chondrite (176Lu/177Hf)CHUR value used in the analysis was 0.0332, while the (176Lu/177Hf)CHUR value was 0.282772. The currently depleted mantle’s (176Lu/177Hf)DM value was 0.0384, and the (176Hf/177Hf)DM value was 0.283250. The Lu decay constant (λ) was 1.865 × 10⁻¹¹ per year. The average value of the continental crust used for calculating the crustal model age (TDM2) is 0.015 [27].

4. Analytical Results

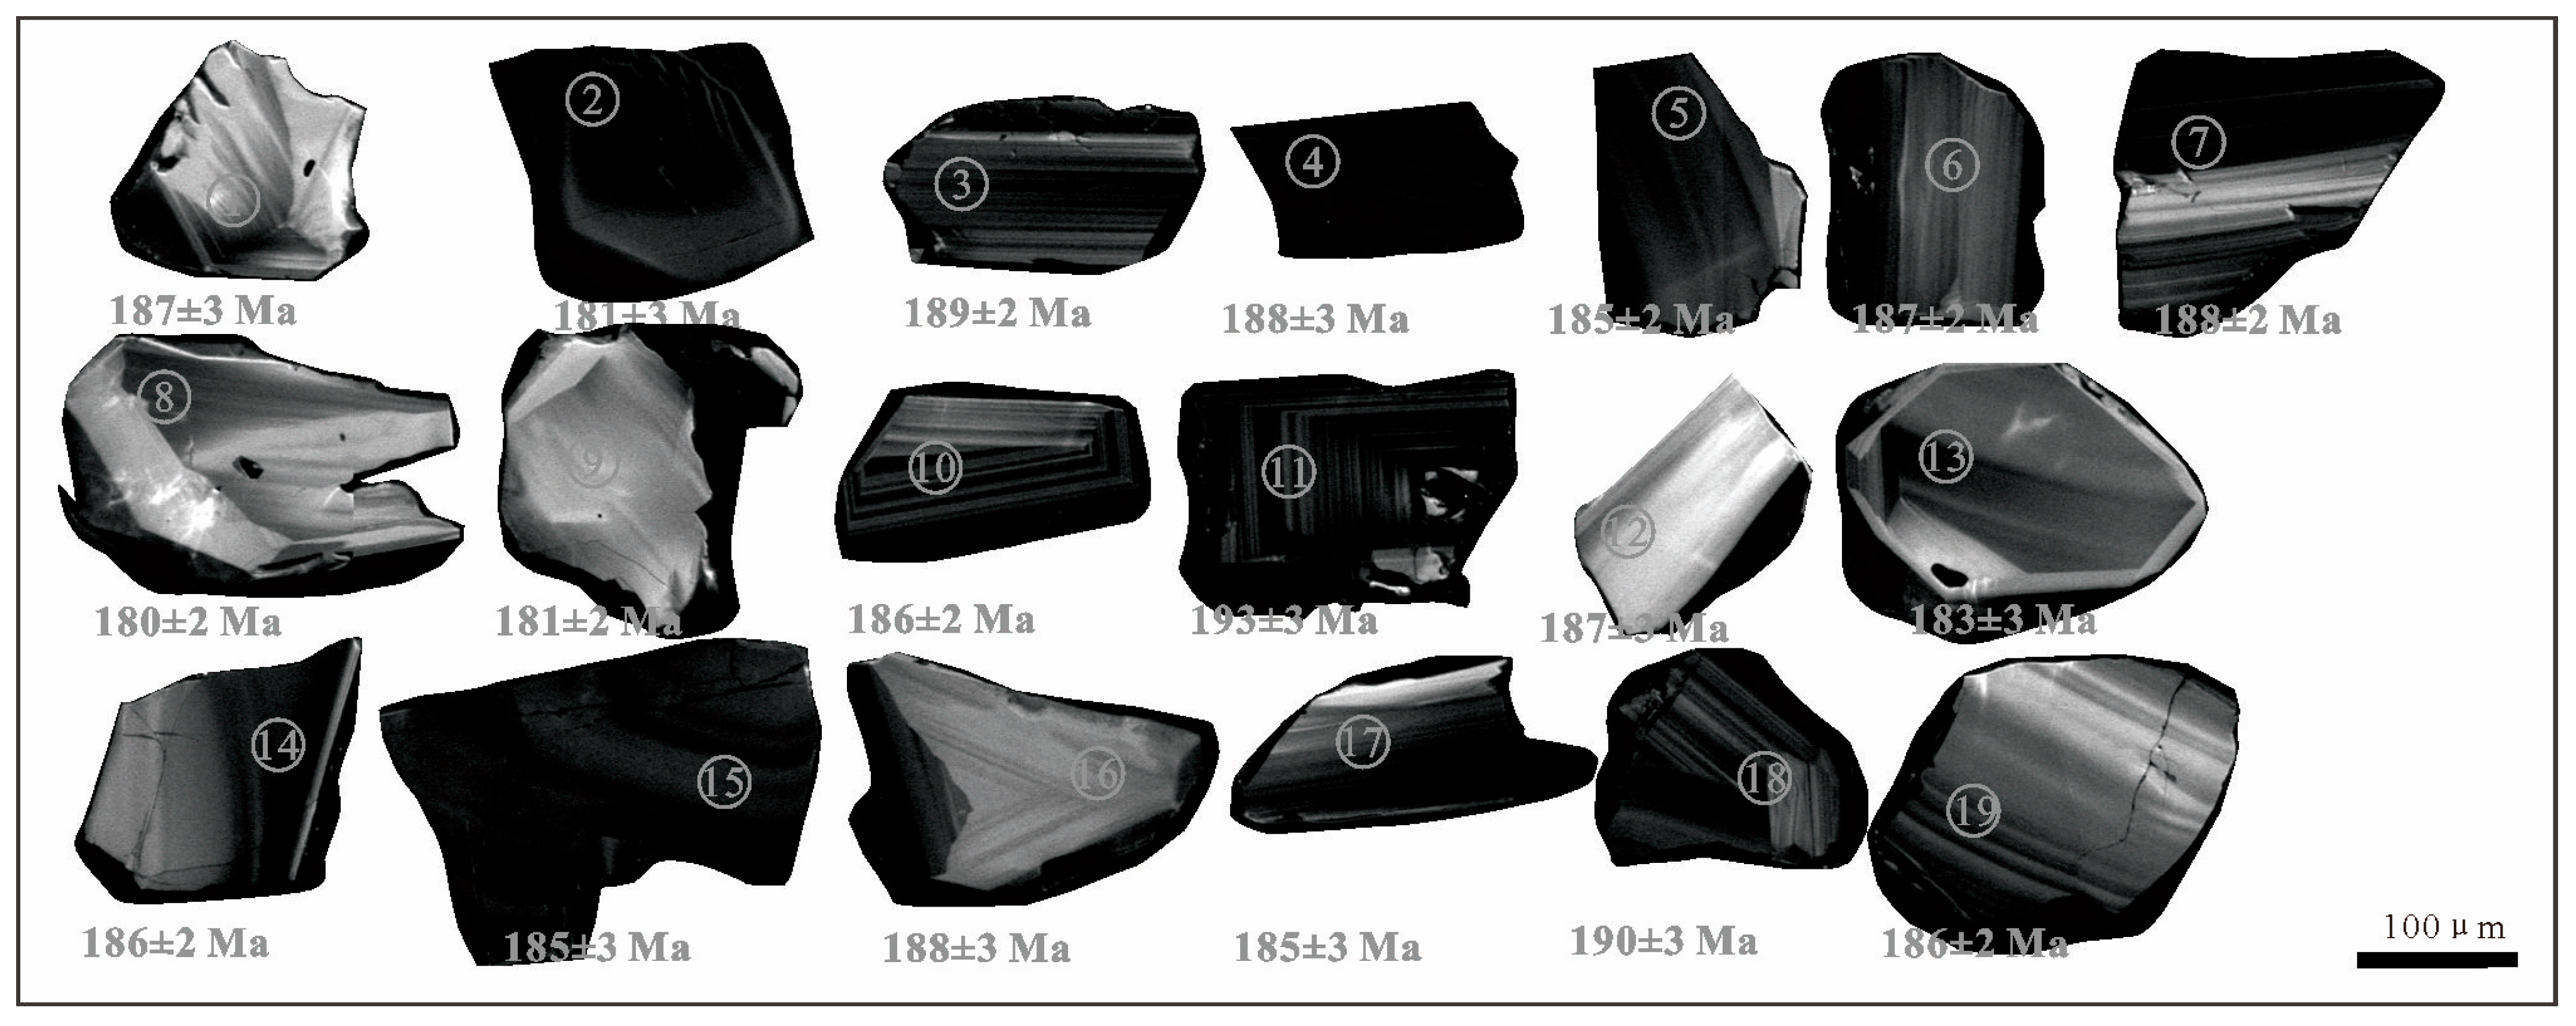
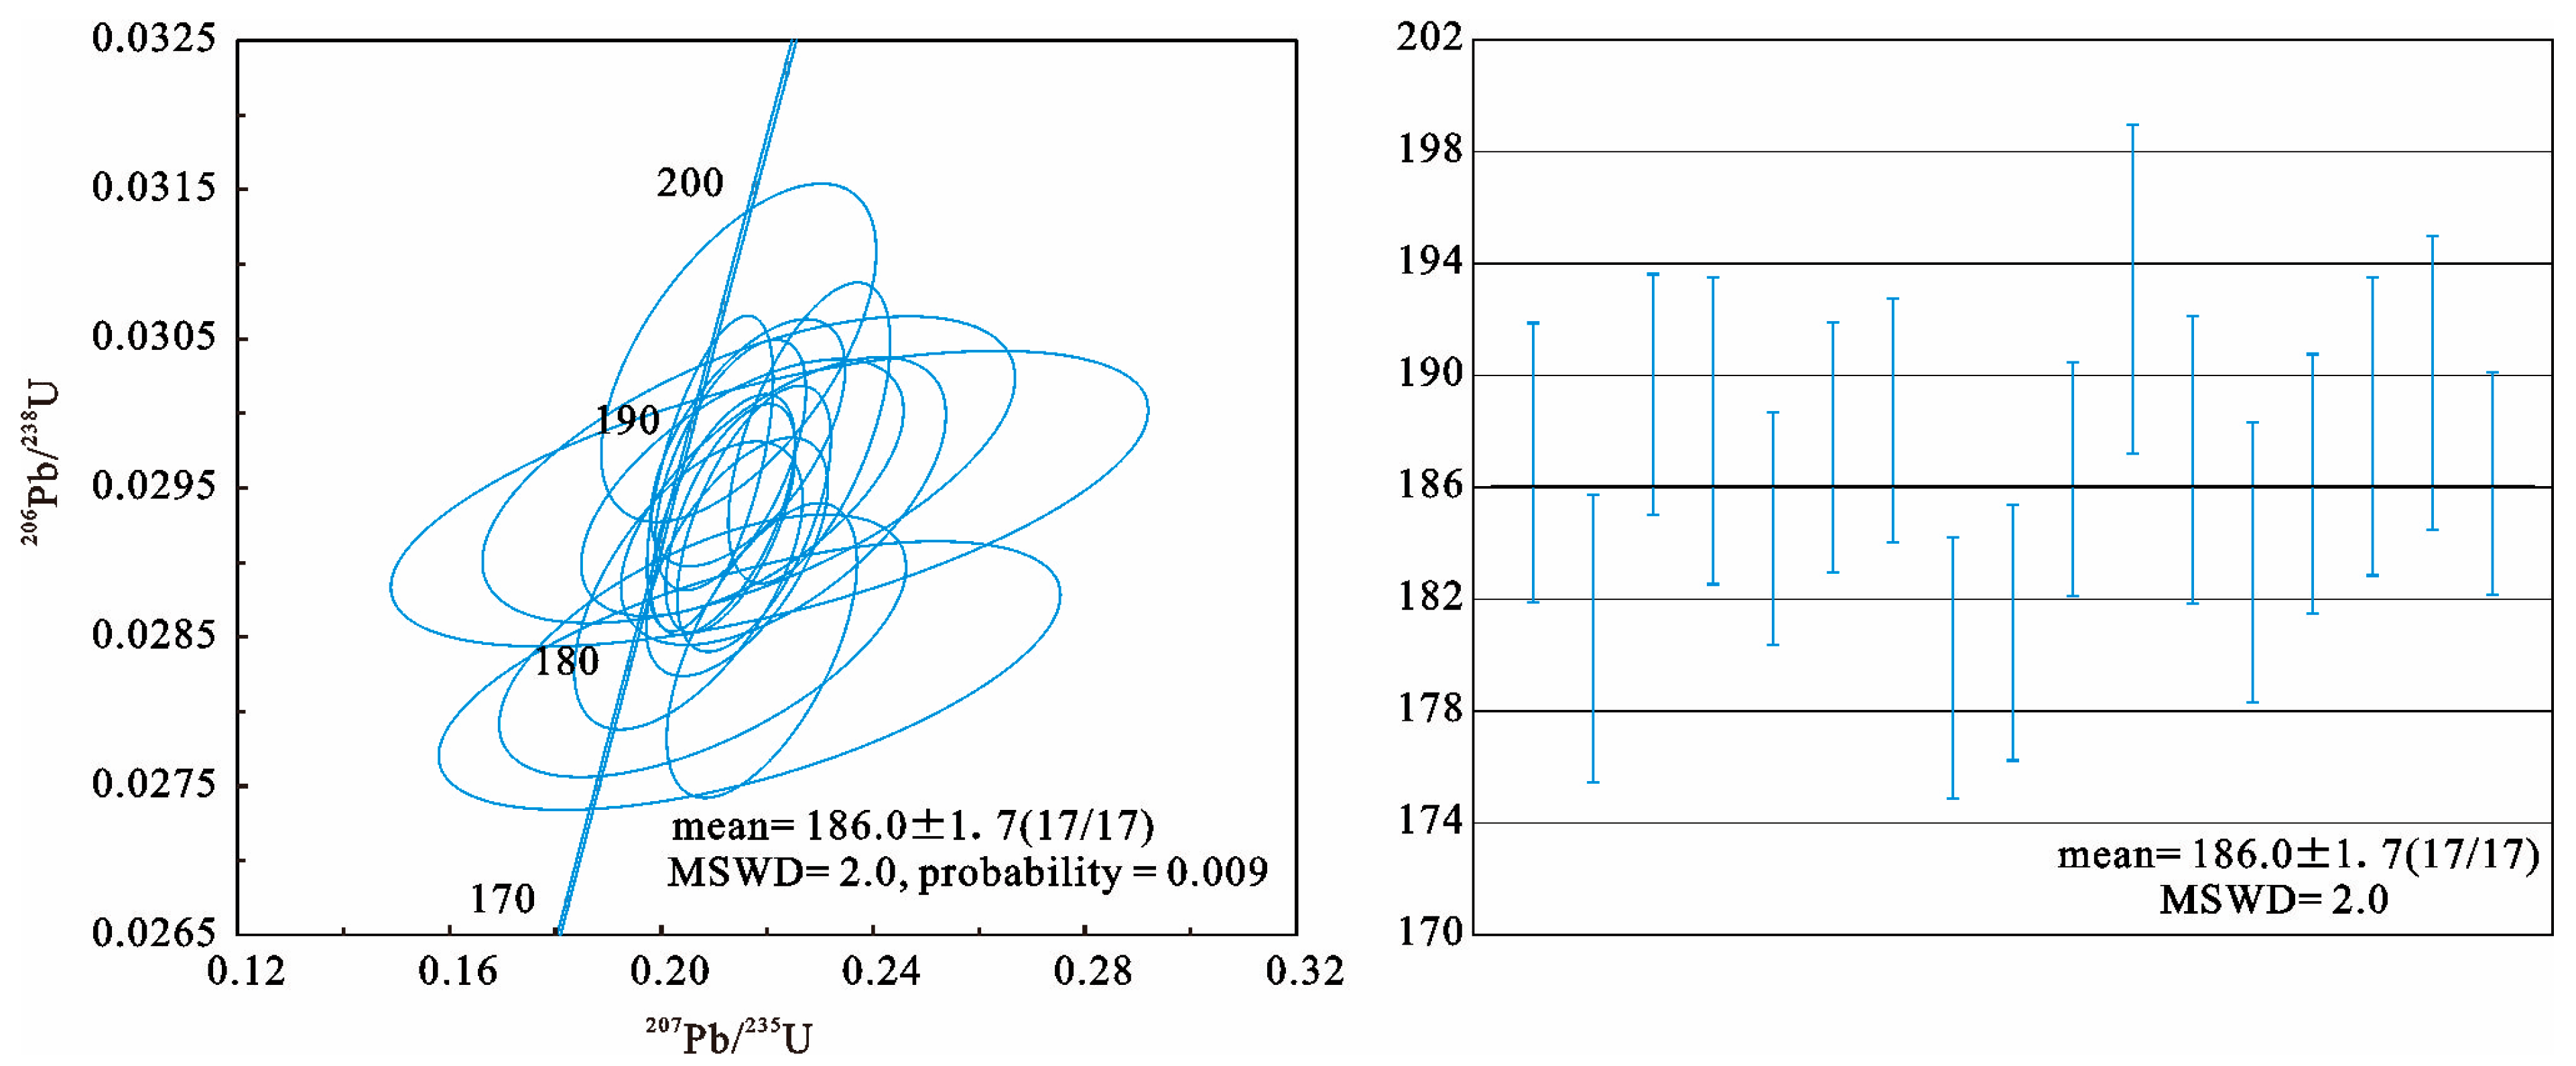
4.1. Zircon U-Pb Age

All analyzed data are presented in Table 1. Most of the zircon grains are euhedral or subhedral, and the majority display fine-scale oscillatory growth zoning in the cathodoluminescence (CL) images (Figure 3). The Th/U ratios range from 0.32 to 1.36, suggesting that the zircons have a magmatic origin [28,29]. Zircon 2⁰⁶Pb/23⁸U ages range from 180 to 193 Ma, with a weighted mean age of 186.0 ± 1.7 Ma (MSWD = 2.0, n = 19; Figure 4), indicating the crystallization age of the rock.

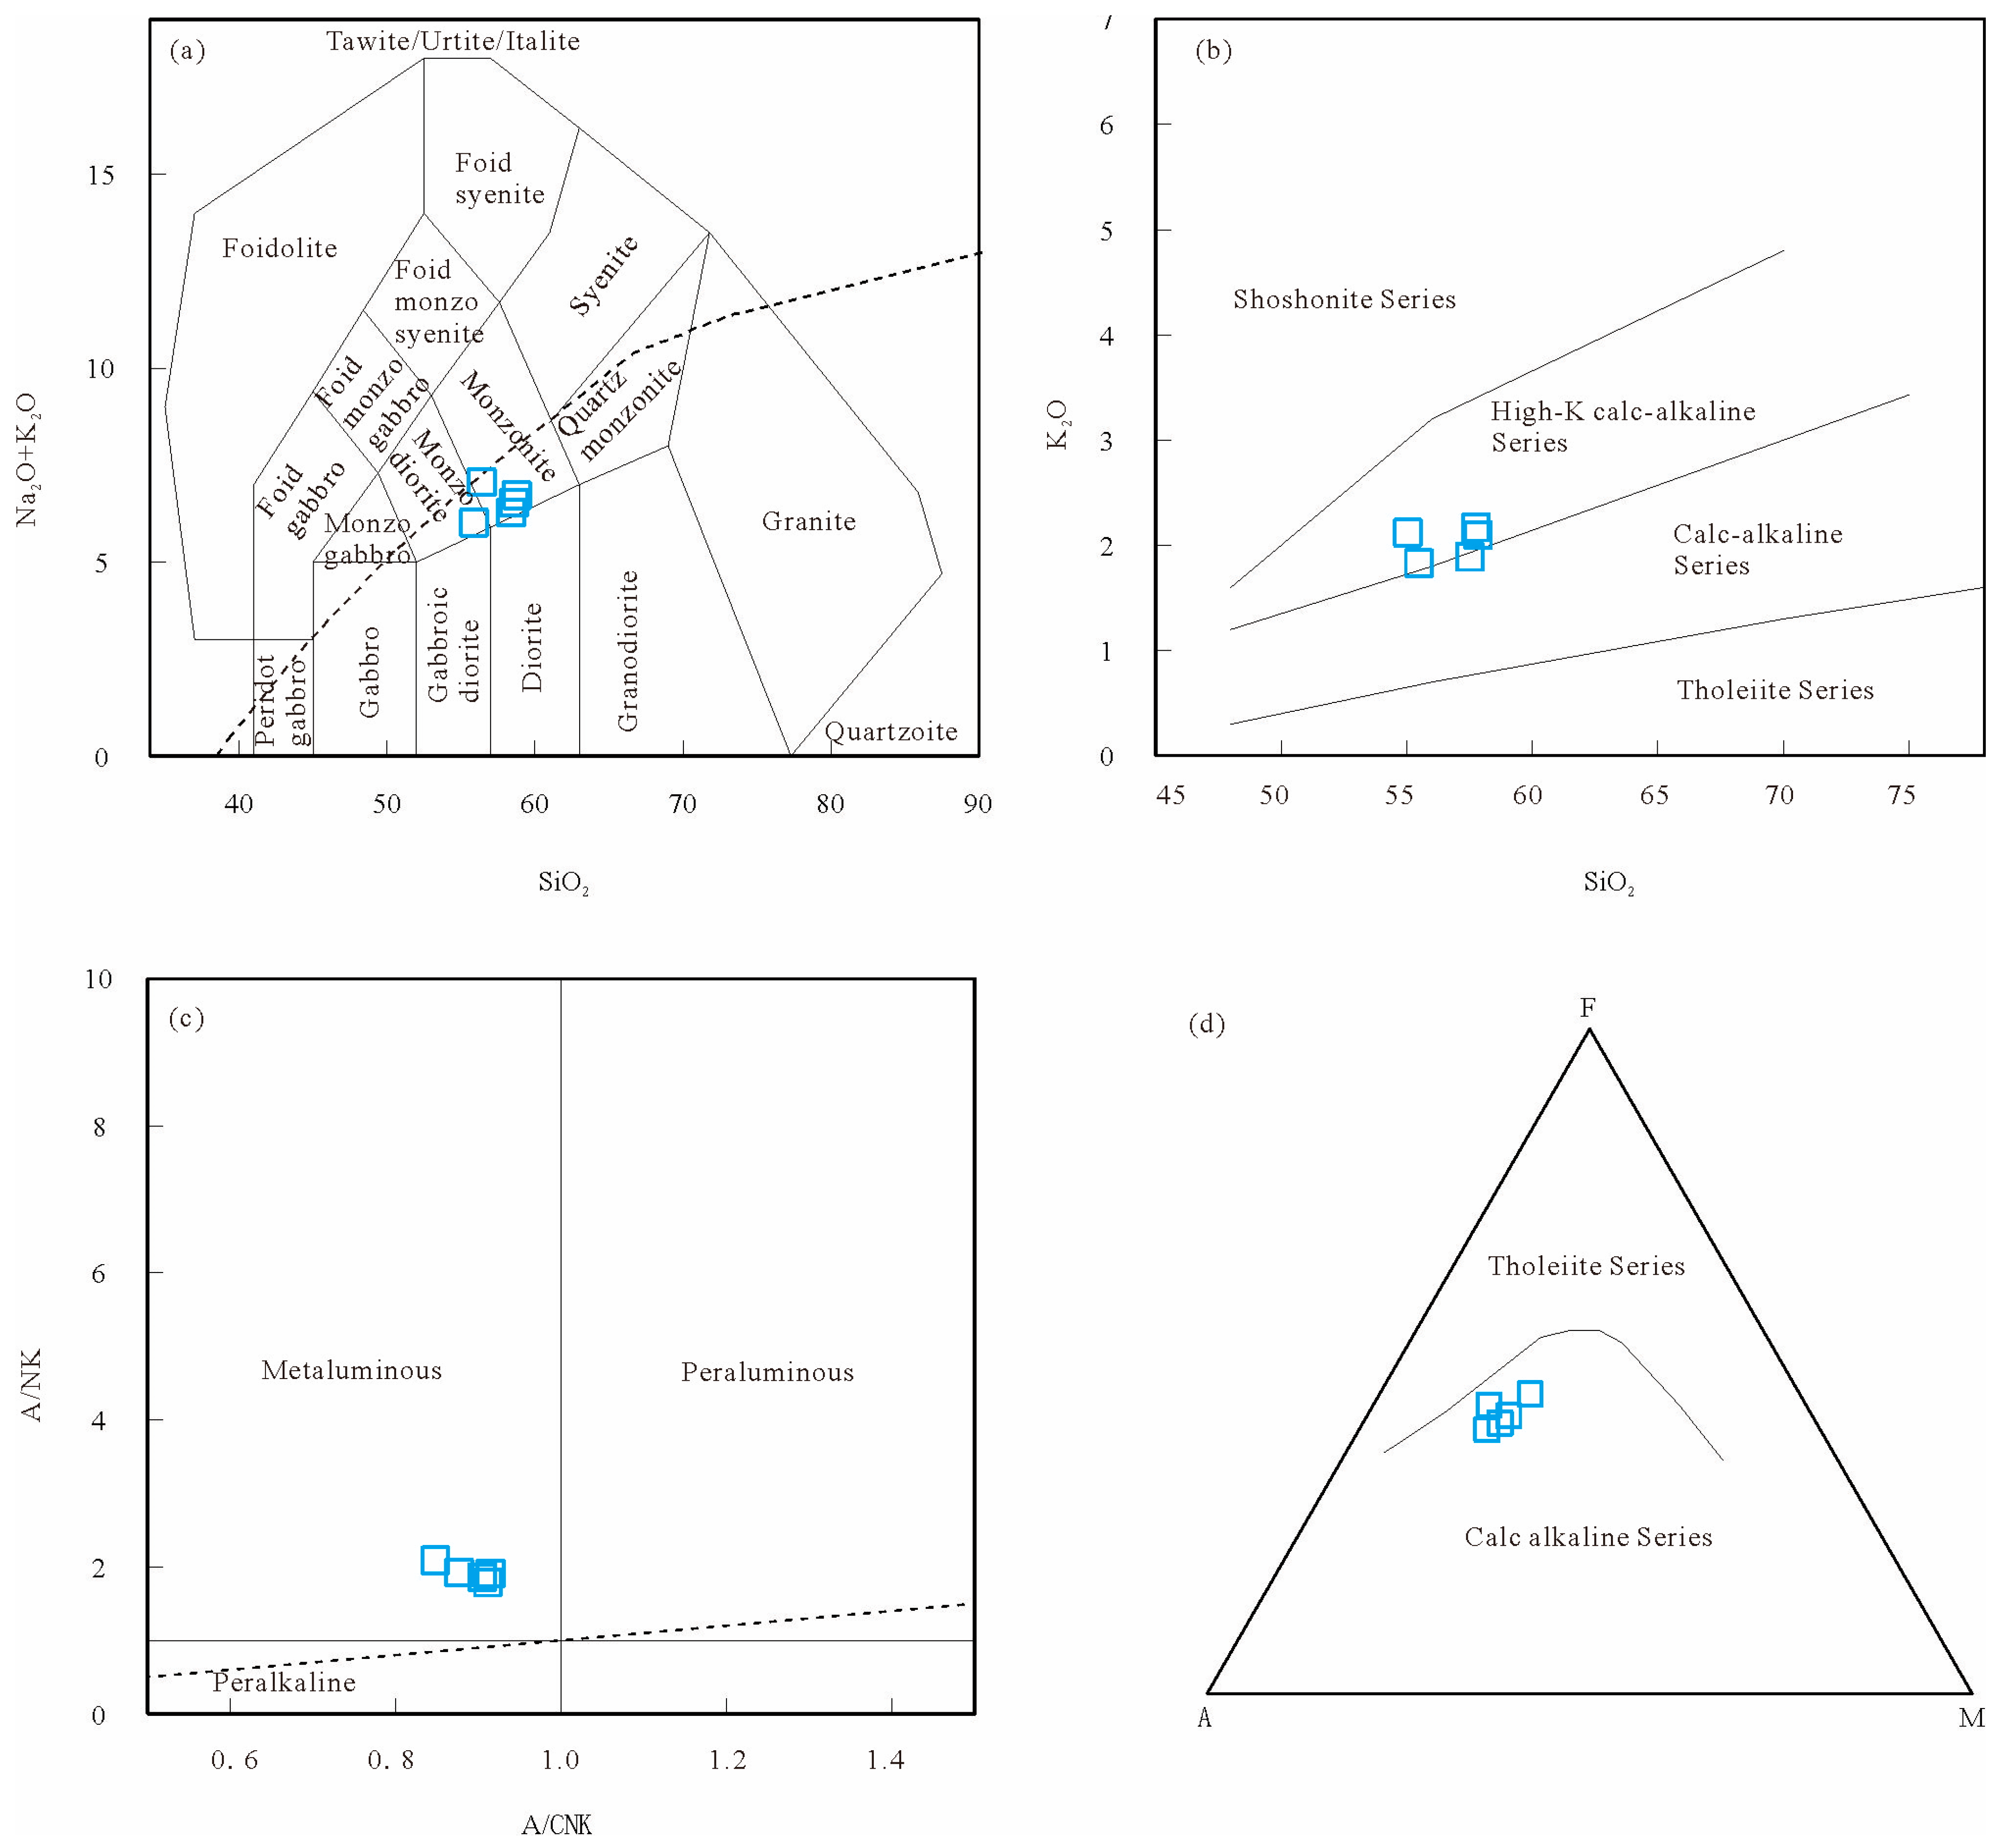
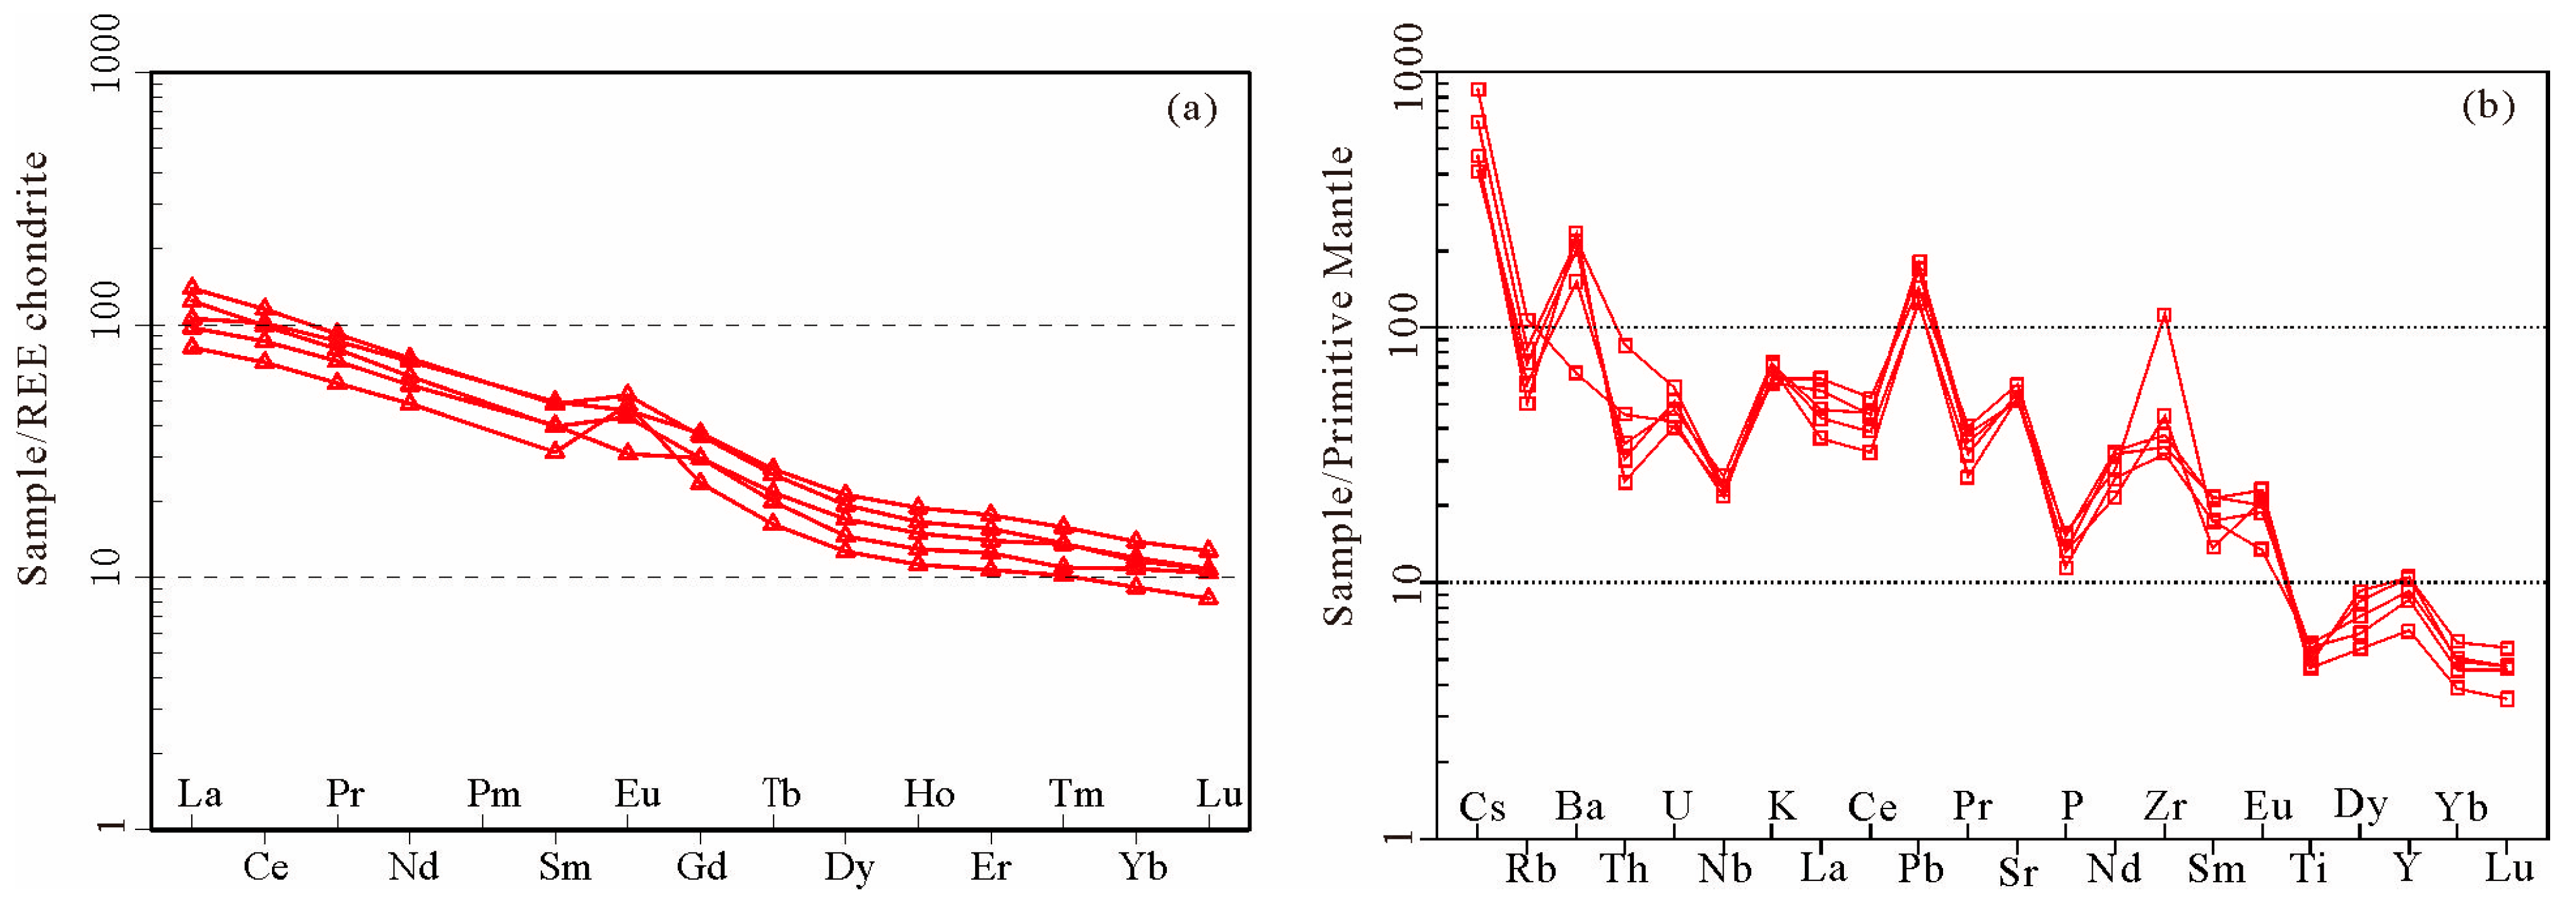
4.2. Major and Trace Elements

The compositions of the major and trace elements in the five analyzed samples are listed in Table 2.
All five quartz diorite samples collected from the Fudong pluton exhibit the following geochemical characteristics (Table 2): SiO2 = 55.04–57.84 wt%, MgO = 2.54–3.31 wt%, TiO2 = 1.00–1.25 wt%, Na2O + K2O = 5.93–6.44 wt%, Al2O3 = 17.56–18.06 wt%, CaO = 5.61–6.88 wt%, and TFeO = 6.7–8.43 wt%. According to their geochemical characteristics, the samples are classified as monzodiorite to monzonite in a TAS diagram (Figure 5a). They are also plotted within the ranges of calc-alkaline and medium- to high-K calc-alkaline series (Figure 5b,c) and have A/CNK (molar Al2O3/(CaO + K2O + Na2O)) ratios ranging from 0.85 to 0.91, indicating metaluminous characteristics (Figure 5c).
The quartz diorites have total rare-earth element (ΣREE) contents ranging from 145.01 ppm to 229.72 ppm and are enriched with light rare-earth elements (LREEs), albeit exhibiting depleted heavy rare-earth elements (HREEs). The chondrite-normalized La/Yb ((La/Yb)N) ratios range from 7.63 to 12.03, and Eu anomalies (Eu/Eu*) vary from 0.88 to 1.73, displaying minor negative to positive values (Figure 6a). In the primitive mantle-normalized trace element diagram (Figure 6b), the quartz diorites demonstrate a significant enrichment in large-ion lithophile elements (LILEs), including Ba and K. Conversely, they exhibit depleted high-field-strength elements (HFSEs), such as Ta, Ti, and Nb.

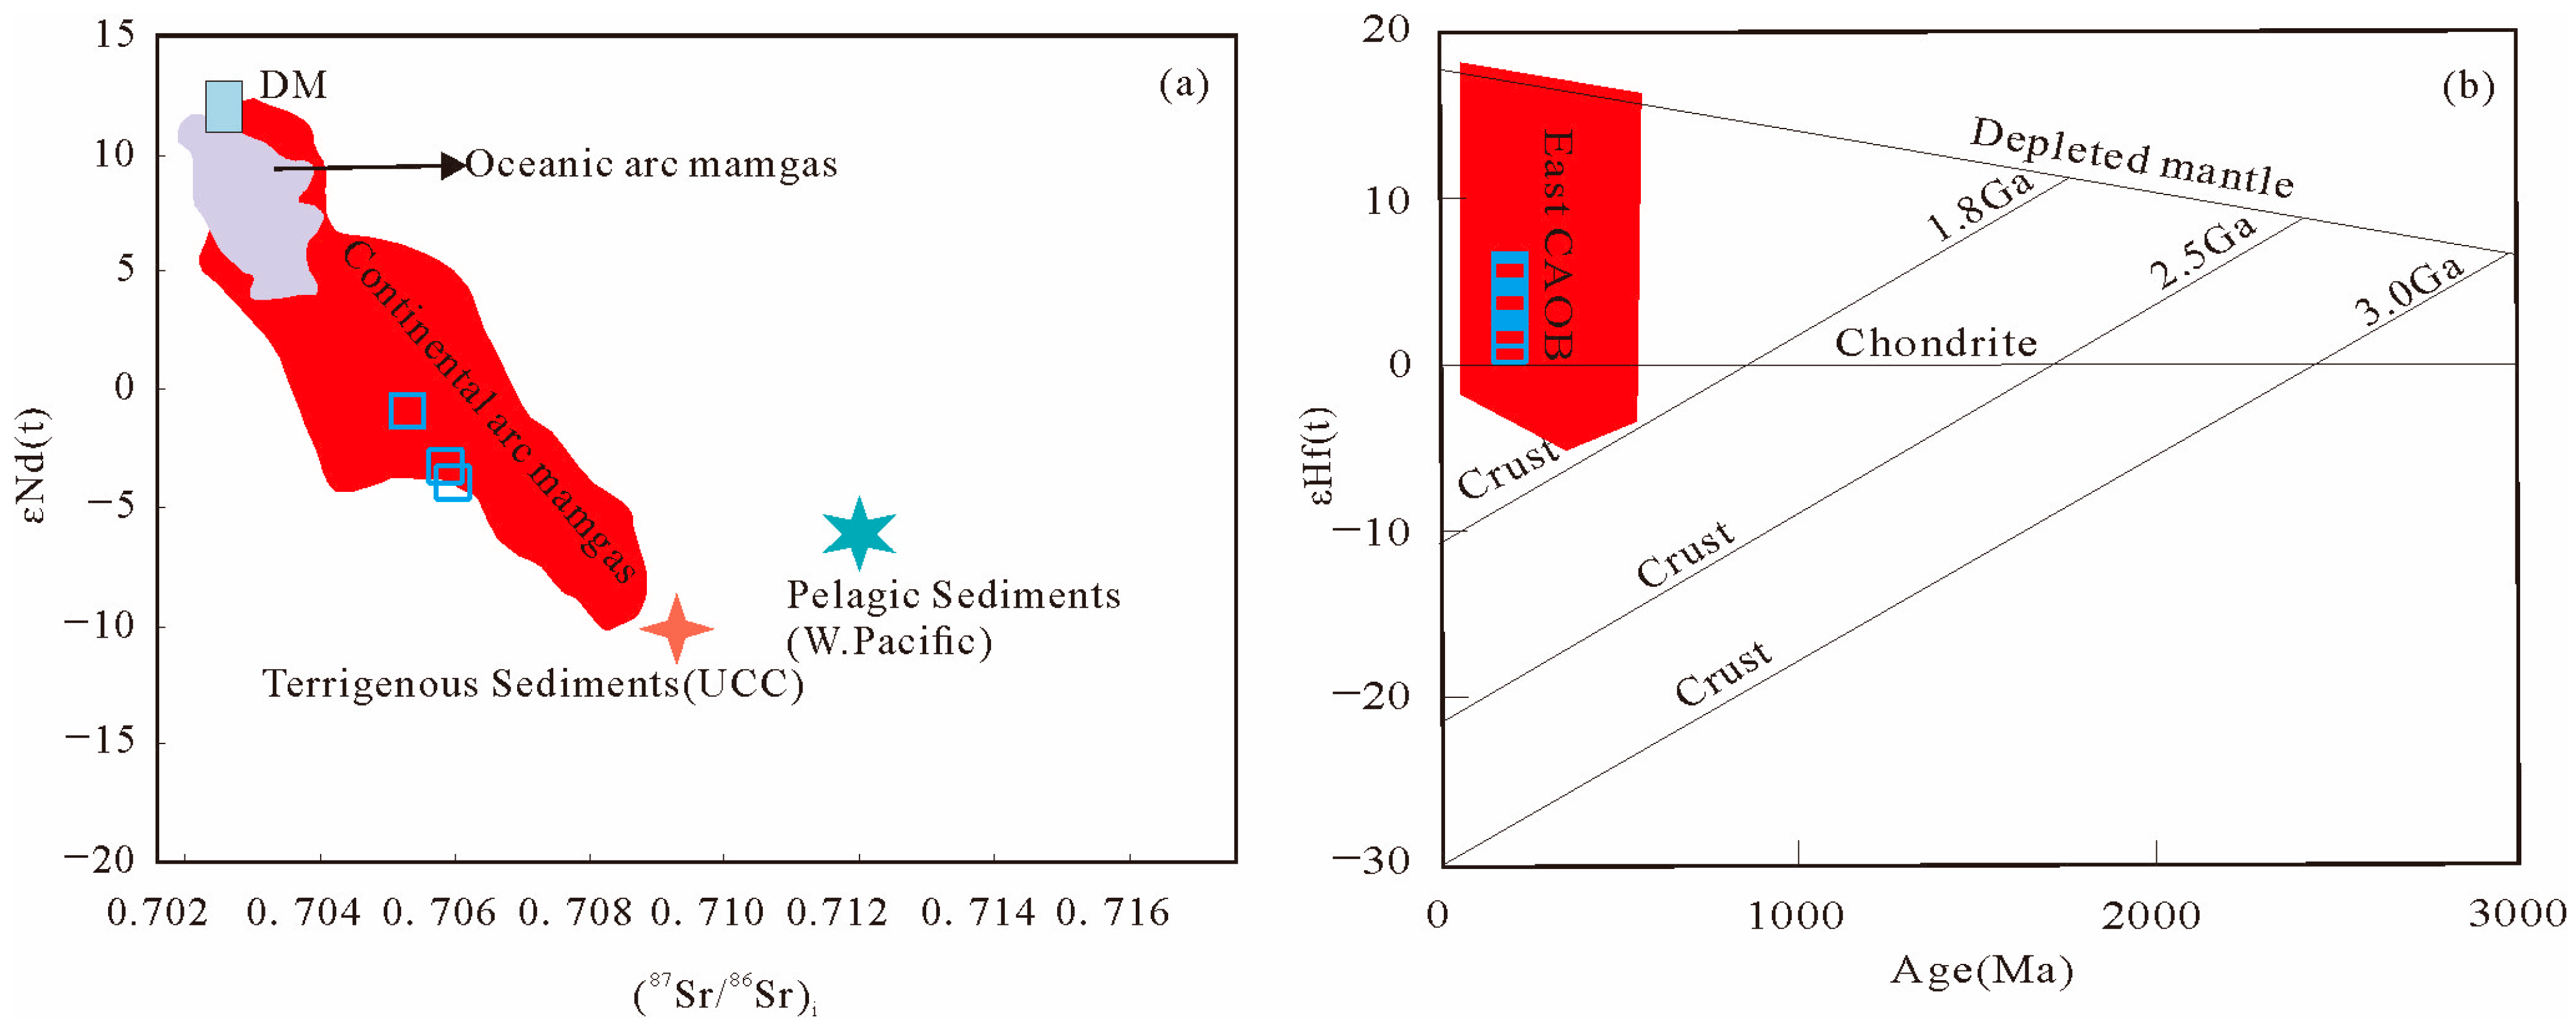
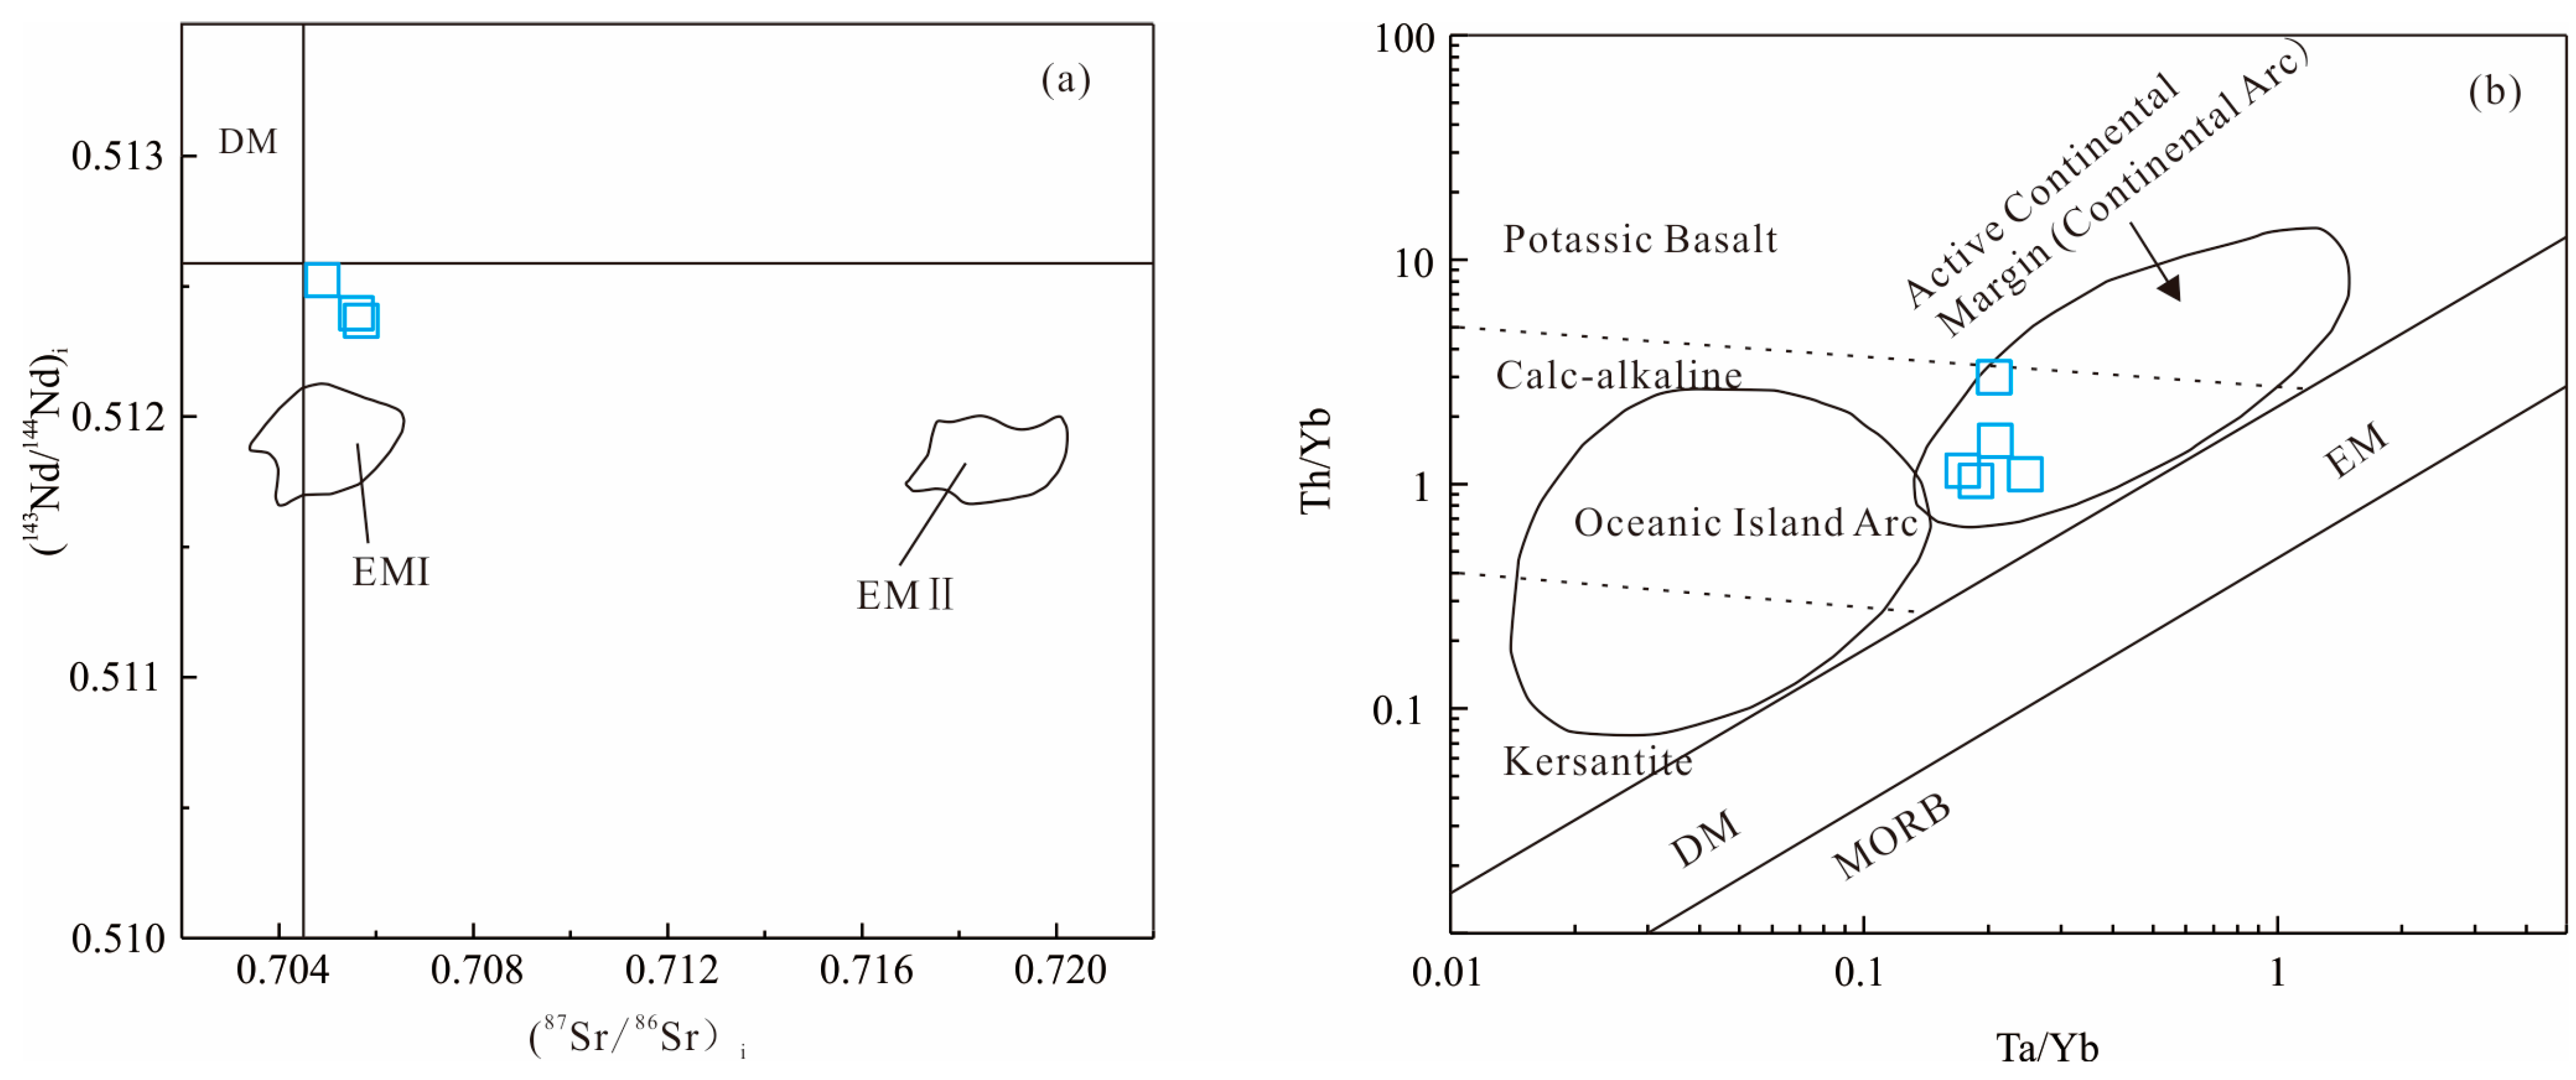
4.3. Whole-Rock Sr-Nd Isotopes

The whole-rock Sr-Nd isotopic compositions of the five samples are presented in Table 3 and illustrated in Figure 7a. All samples exhibit a narrow range of Sr-Nd isotope compositions, with initial 87Sr/86Sr ratios ranging from 0.705733 to 0.706384 and 143Nd/144Nd ratios ranging from 0.512366 to 0.512523. The initial 87Sr/86Sr ratios of the quartz diorite are higher than those of Mid-Ocean Ridge Basalt (0.70229–0.70316) and Ocean Island Basalt, as represented by Hawaiian volcanic rocks (0.70317–0.70412). The corresponding εNd(t) values of the diorite range from −0.69 to −3.69.

4.4. Zircon Hf Isotopes

The results of the Hf isotopic analyses of zircon grains from sample FD9 are presented in Table 4 and illustrated in Figure 7b. The results show that the initial 176Hf/177Hf ratios range from 0.282684 to 0.282823, and the εHf(t) values vary from 0.8 to 5.7, corresponding to TDM1 and TDM2 ages of 605–814 Ma and 867–1181 Ma, respectively.

5. Discussion

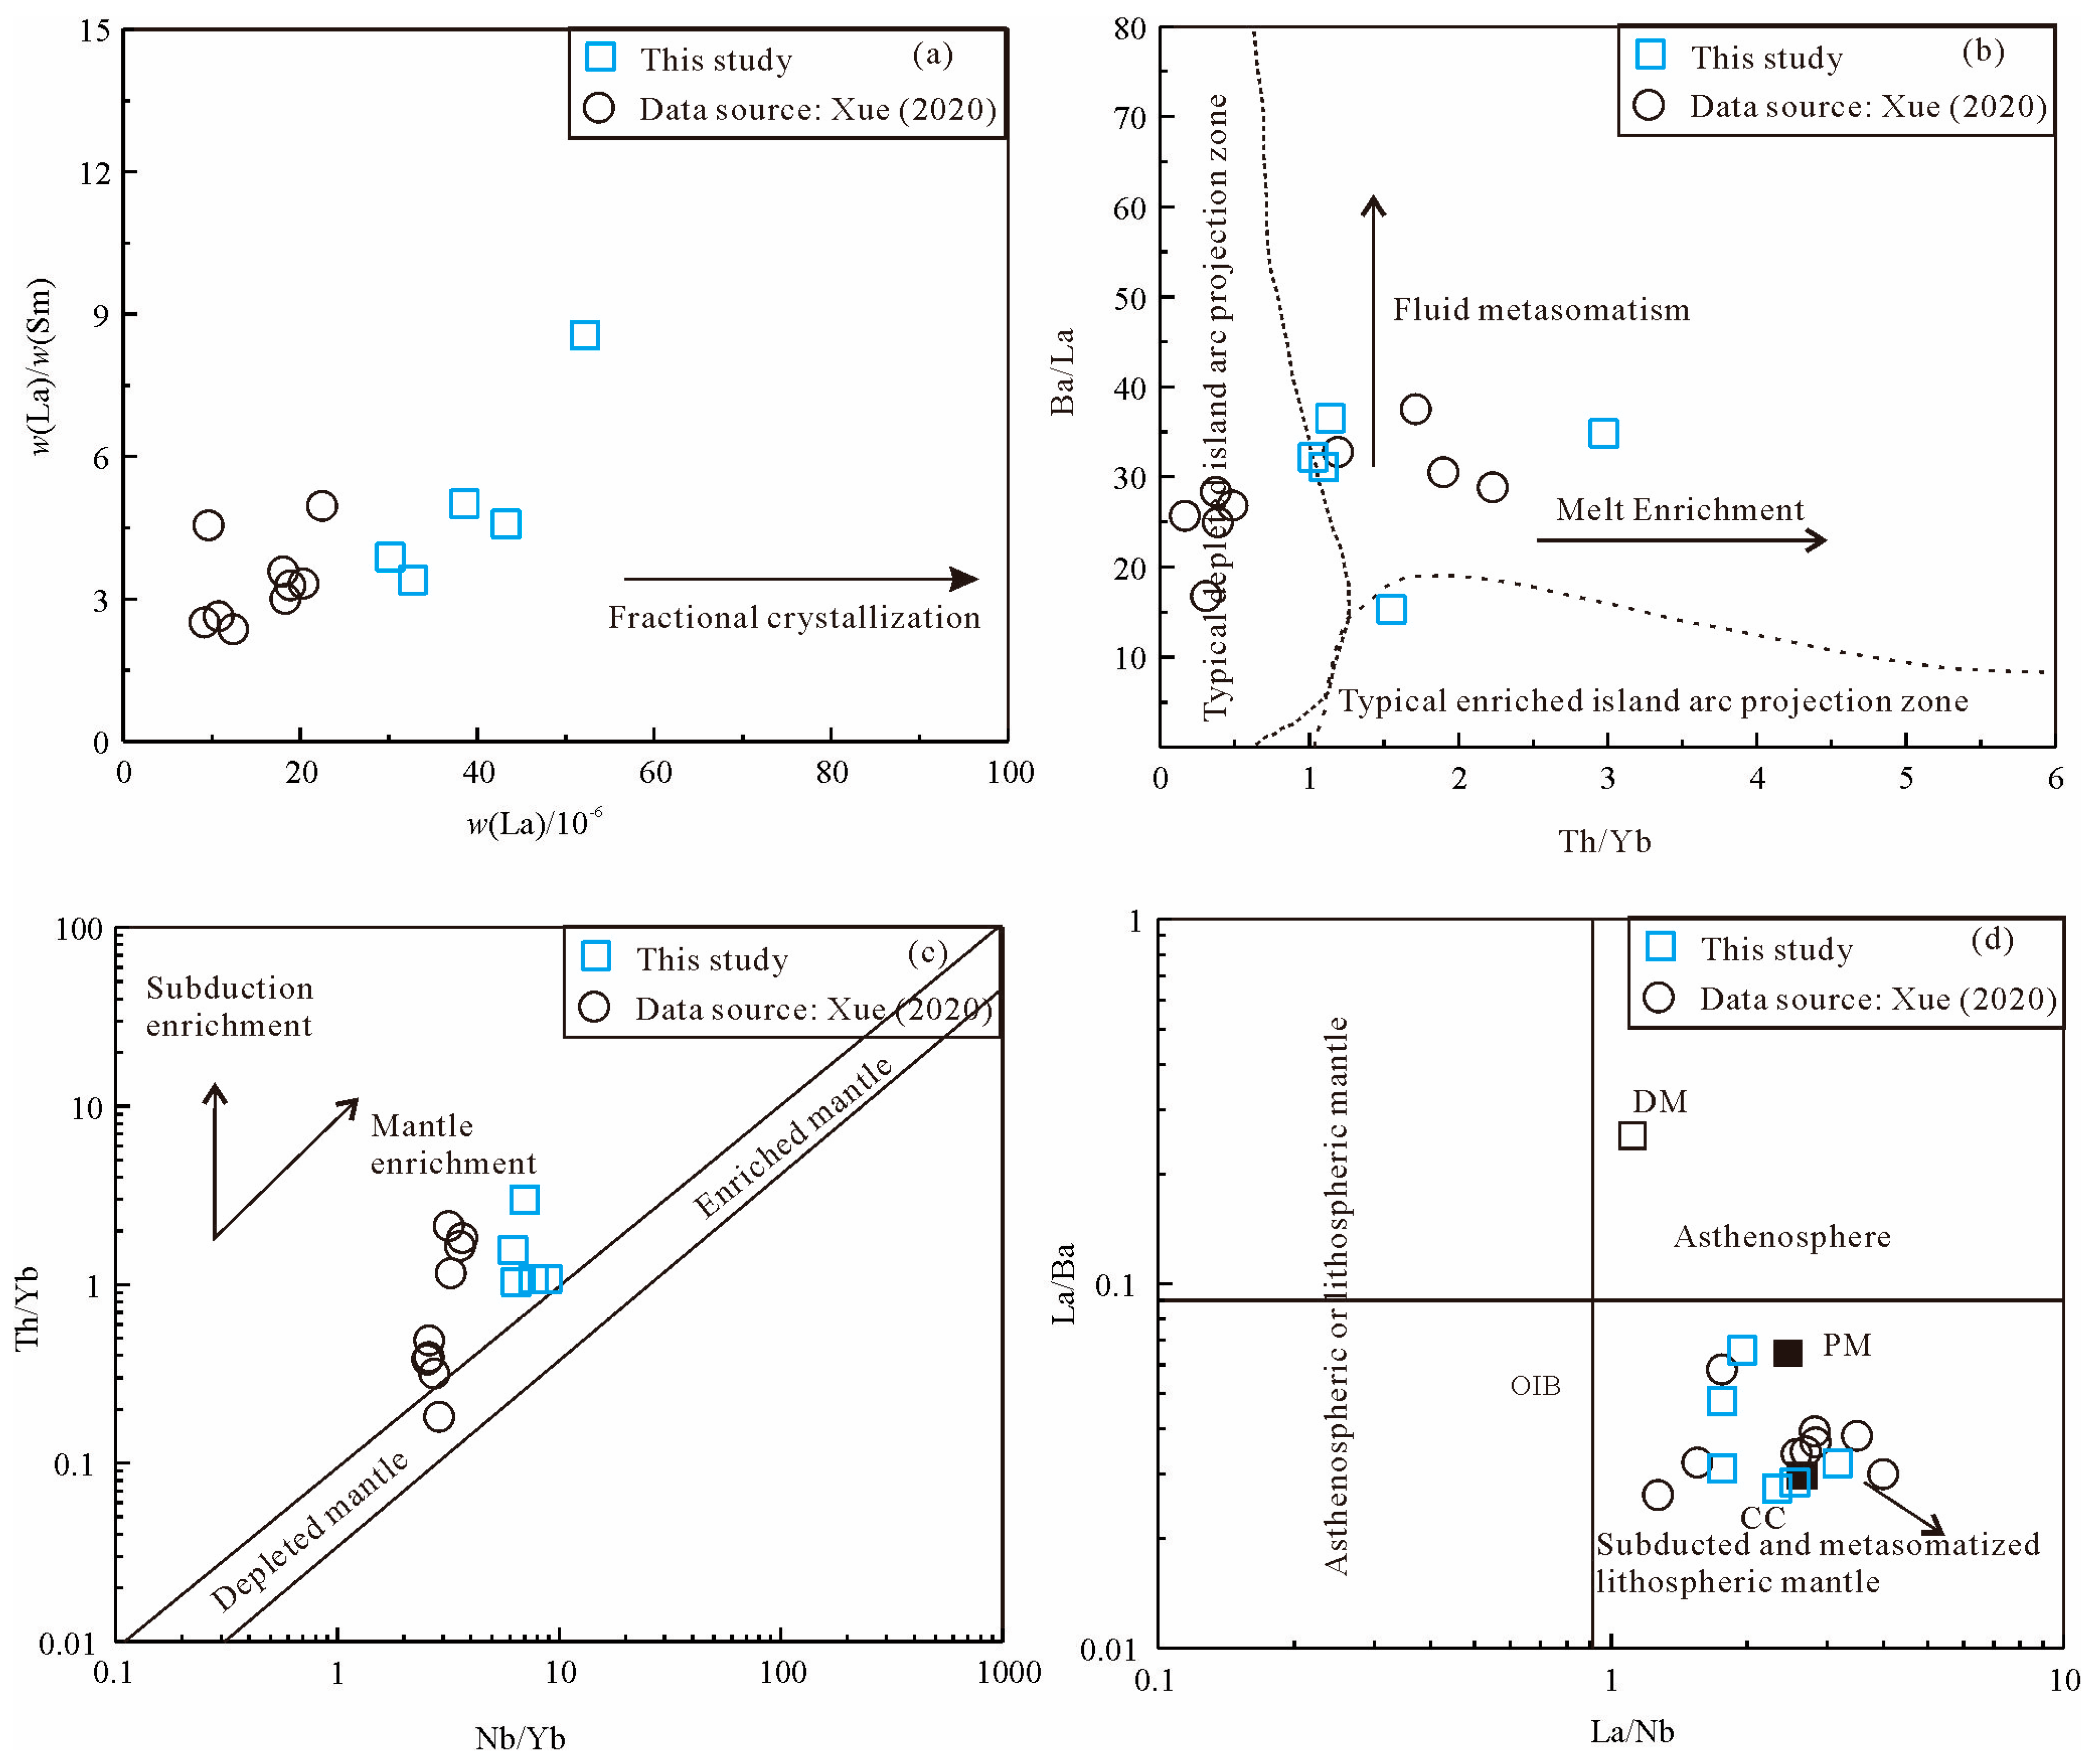
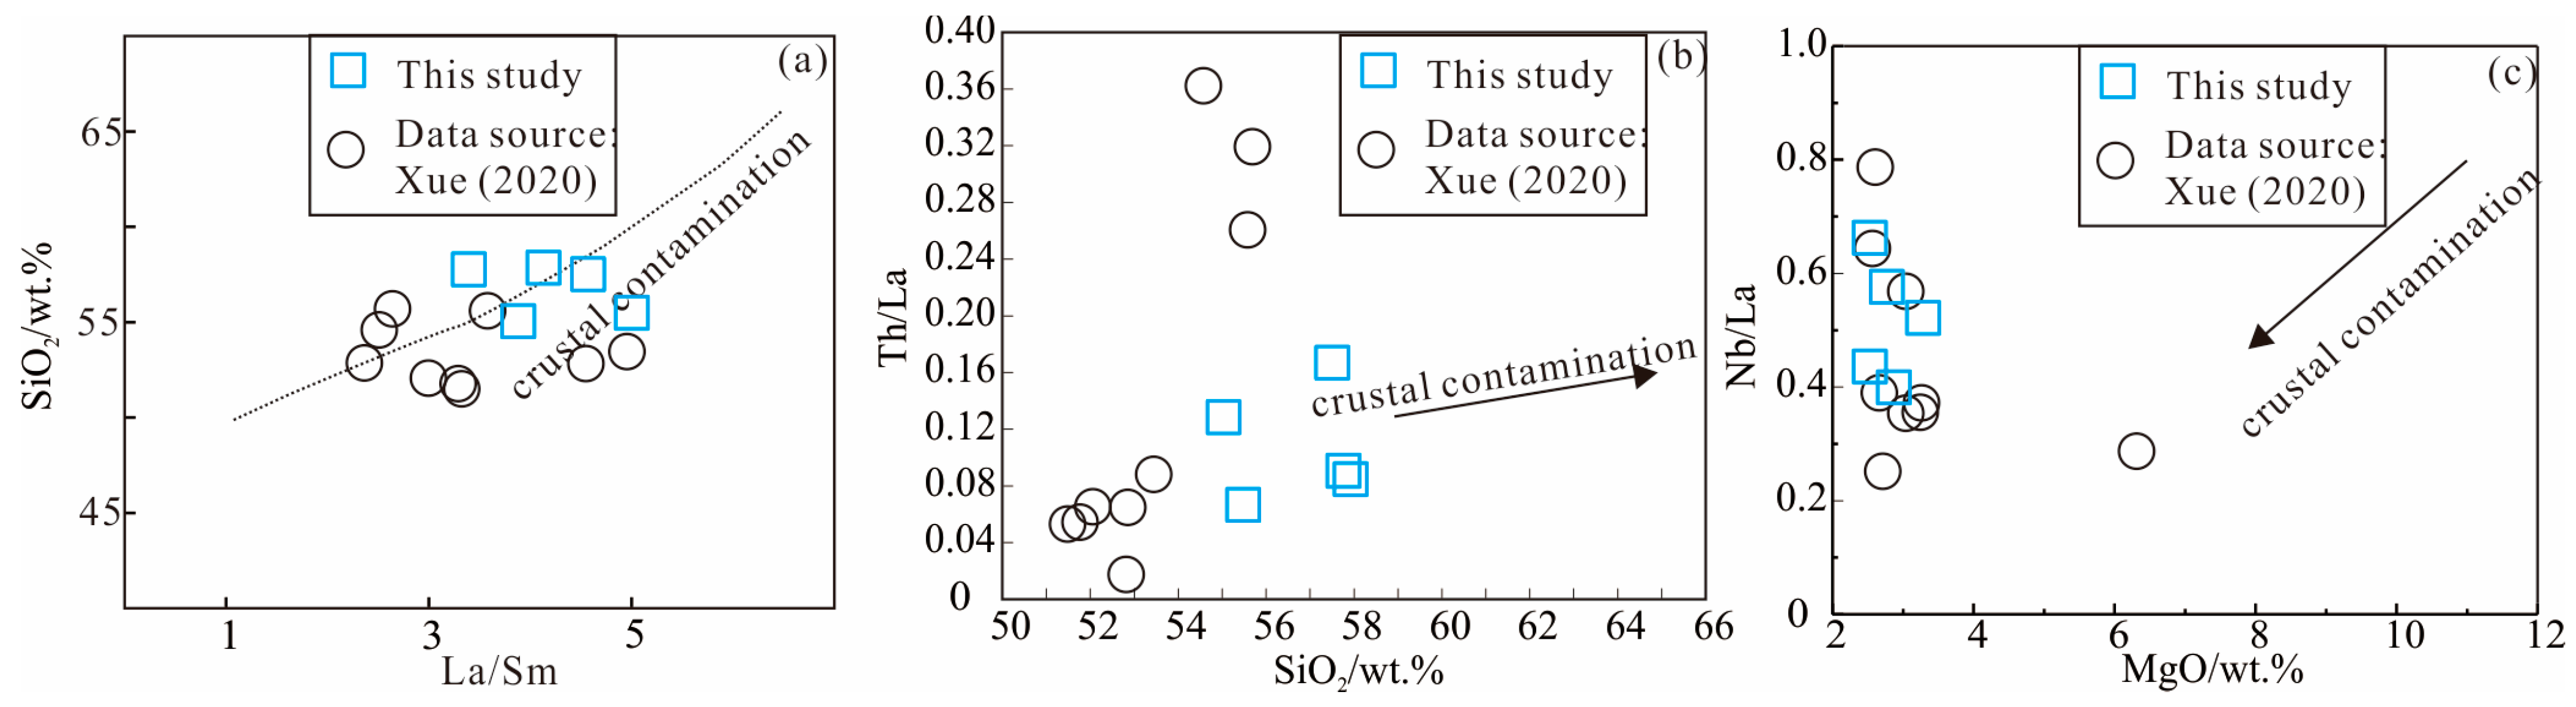
5.1. Petrogenesis and Magma Source

The major geochemical features of Fudong quartz diorite, including its SiO2, Al2O3, CaO, and MgO contents, demonstrate geochemical characteristics akin to those of intermediate to acidic magmatic rocks (Figure 5a). Generally, the petrogenesis of diorite can be attributed to three primary processes: (1) the fractional crystallization of mantle-derived magma [35,36,37]; (2) the partial melting of basaltic crust [38,39]; and (3) the partial melting of mantle wedge peridotite that has been metasomatized by subduction-related fluids or melts [32,40]. During magma evolution, fractional crystallization and partial melting often lead to divergent trends in the behavior of incompatible elements and their elemental ratios [41]. In the La versus La/Sm diagram (Figure 8a), the La contents and La/Sm ratios of the Fudong quartz diorite do not display the characteristic evolutionary trends associated with fractional crystallization. Therefore, Fudong quartz diorite is unlikely to have resulted from the fractional crystallization of mantle-derived magma.
The Mg# value of a melt exceeds 40 only when mantle materials are involved in their petrogenesis [42]. With an average Mg# value of 42.6, Fudong quartz diorite is not a product of partial melting of the basaltic lower crust. One of the key formation mechanisms for intermediate magmatic rocks is the partial melting of mantle wedge peridotite metasomatized by subducted fluids or melts [43,44]. The Th/La (0.07–0.13, average 0.11) and Th/Yb (1.03–2.98, average 1.56) ratios of the Fudong quartz diorite differ from those of magmas derived from mantle metasomatized by subduction melts (Th/La > 0.2, Th/Yb > 2) [45]. Additionally, its TiO2 content (ranging from 1% to 1.25%) is inconsistent with the TiO2 content (less than 0.5%) of melts generated by the partial melting of mantle wedge peridotite metasomatized by subducted melts [44]. Partial melting products of the mantle wedge metasomatized by subducted fluids typically exhibit high concentrations of Sr (greater than 1000 ppm), Ba (greater than 1000 ppm), and K/Rb ratios (greater than 1000 ppm) [45]. The Sr content in Fudong granite–diorite ranges from 1086 ppm to 1257 ppm (with an average of 1145.8 ppm), while the Ba content ranges from 460.7 ppm to 1624 ppm (averaging 1213.34 ppm) [38]. The K/Rb ratio varies from 623 ppm to 1317 ppm, with an average of 920.2 ppm. These geochemical elemental characteristics and ratios are similar to those of the partial melting products of the mantle wedge metasomatised by subducted fluids [43]. HREEs are not easily mobilized or enriched in fluids [45]; rather, they tend to accumulate in subducting slabs, which are carried deeper into the mantle during subduction. Therefore, the addition of fluids and melts from subducting slabs to the mantle wedge, along with significant crustal contamination, can increase the LREE/HREE ratio. Research indicates that crustal contamination leads to a negative correlation between Nb/Ta and La/Yb in mantle-derived magmas [46]. If the magma source region experiences significant crustal contamination, incompatible element ratios such as Sm/Nd and SiO2 tend to display a positive correlation [47]. The La/Sm–SiO2 covariation trend in the Fudong quartz diorite is distinct from that typically resulting from crustal contamination (Figure 9a). In Th/La-SiO2 and Nb/La-MgO diagrams, Fudong quartz diorite does not align with a trend indicating crustal contamination, further ruling out the influence of crustal contamination on the magma (Figure 9b,c) [47].
Figure 8. (a) La/Sm vs. La (modified from [41]); (b) Ba/La vs. Th/Yb (modified from [48]); (c) Th/Yb vs. Nb/Yb (modified from [49]); and (d) La/Ba vs. La/Nb (modified from [48]); diagrams for the Fudong diorite samples. CC—continental crust; DM—depleted mantle; PM—primitive mantle. Data sources: this study and [50]. Samples from cited literature originate from the Yanbian area and correspond to the same geological period. Detailed data can be found in Supplementary Table S1.
Minerals 15 00562 g008
Magma derived from slab melts typically demonstrates LREE content and REE distribution patterns [51,52]. By contrast, rocks influenced by fluids from the slab exhibit higher Th/Yb and Rb/Y ratios than mantle-derived magmas, often with Th/Yb values less than 0.3 and Rb/Y values less than 0.1. The Fudong quartz diorite exhibits average Th/Yb and Rb/Y ratios of 1.56 and 1.12, respectively, both of which are consistent with characteristics of a fluid-enriched source, as these ratios exceed the typical thresholds of Th/Yb > 0.5 and Rb/Y > 0.3. In Th/Yb-Ba/La, Nb/Yb-Th/Yb, and La/Nb-La/Ba diagrams (Figure 8b–d), the majority of samples from this study and cited literature plot within evolutionary trend fields associated with subduction processes, and exhibit enrichment patterns associated with subduction fluids.
Figure 9. (a) SiO2 vs. La/Sm (modified from [47]); (b) Th/La vs. SiO2, and (c) Nb/La vs. MgO diagrams for the Fudong diorite samples (modified from [49]). Data sources: this study and [50].
Minerals 15 00562 g009
Partial melting of an enriched lithospheric mantle usually produces magmas that are enriched in Sr(>500 ppm), Ba(>300 ppm), and LREEs. The Fudong quartz diorite is characterized by pronounced LREE enrichment, with Sr concentrations ranging from 1068 to 2257 ppm (average: 1146 ppm) and Ba concentrations ranging from 461 to 1624 ppm (average: 1213 ppm). Integrated analysis of the Sr–Nd–Hf isotopic diagram (Figure 10a), Th/Yb vs. Ta/Yb (Figure 10b), Th/Yb vs. Nb/Yb (Figure 8c), and La/Nb vs. La/Ba diagrams (Figure 8d) indicates that the magmatic source of the Fudong quartz diorite is distinct from a depleted mantle source and instead originates from an enriched mantle reservoir. In a Ta/Yb-Th/Yb diagram (Figure 10b), the Fudong granite–diorite samples fall outside the mantle source region and within the active continental margin–arc region. This confirms that they originate from the partial melting of an enriched lithospheric mantle wedge metasomatized by subduction fluids, resulting in the enrichment of elements such as Sr, Ba, and K.

5.2. Tectonic Implications of Fudong Quartz Diorite

The magma, originating from the partial melting of a metasomatized lithospheric mantle, exhibits geochemical characteristics typical of an arc-related environment (Figure 11a,b). Considering the low Na2O/K2O ratios, ranging from 1.8 to 2.8, and an average La/Nb ratio of 2.02—comparable to that of active continental margin volcanic rocks (with an average La/Nb > 2)—we can conclude that Fudong quartz diorite most likely formed in a continental arc setting rather than an island arc environment. Furthermore, in La/Yb vs. Th/Yb diagrams (Figure 11c), most of the quartz diorite samples plot within the continental arc field. Spatially, the Late Triassic to Middle Jurassic igneous rocks (207–160 Ma) are distributed along a prominent NE–SW-trending magmatic belt that parallels the eastern margin of Eurasia (Figure 12) [20]. The Early Jurassic intrusive rocks in the study area are calc-alkaline, which is characteristic of an active continental margin environment [3,6,22]. A significant number of Jurassic granites and felsic volcanic rocks are exposed in the study area, displaying compositions and characteristics consistent with an active continental margin setting, which is associated with Jurassic events related to the subduction of the Paleo-Pacific Plate [3,18,22,23,24]. Integrated analysis of the collected data and the geochemical characteristics of the Fudong quartz diorite indicates that the Yanbian region was situated in an active continental margin environment during the Middle Jurassic, resulting from the subduction of the Paleo-Pacific Plate.

6. Conclusions

Based on zircon U-Pb-Hf isotopic data, along with whole-rock elemental and Sr-Nd isotopic data, we demonstrate that Early Jurassic (186 ± 1 Ma) calc-alkaline to high-K calc-alkaline quartz diorite in the Fudong area formed from melting of an enriched lithospheric mantle, which was affected by fluid metasomatism from the subduction zone. Fudong granodiorite is enriched with LILEs and depleted in HFSEs, characteristics that are typical of an active continental margin. When combined with the traits of intrusive rocks in the study area, these geochemical signatures indicate that the Yanbian region was situated in an active continental margin environment during the Middle Jurassic, resulting from the subduction of the Paleo-Pacific Plate.

Supplementary Materials

The following supporting information can be downloaded at: https://www.mdpi.com/article/10.3390/min15060562/s1, Table S1. The results of major (wt%) and trace elements (ppm) for the Zhangxiang pluton.

Author Contributions

Conceptualization, J.S.; methodology, J.S.; software, Y.Z.; validation, Y.Z. and X.C.; formal analysis, Y.Z.; investigation, X.C.; data curation, Y.Z. and X.C.; writing—original draft preparation, J.S.; writing—review and editing, Y.Z. and X.C.; project administration, X.C.; funding acquisition, X.C. All authors have read and agreed to the published version of the manuscript.

Funding

This research was funded by the Natural Science Foundation of Jilin Province (Provincial-level General Program; administered by the Department of Science and Technology of Jilin Province; project period: January 2024-December 2026; grant number YDZJ202401533ZYTS) and the Key Popular Science Project of Jilin Province Science and Technology Association (Social Science Outreach Initiative; overseen by its Science Popularization Department; implementation period: 2024 fiscal year; grant number KPCX3).

Data Availability Statement

Data are contained within the article and Supplementary Materials.

Acknowledgments

We acknowledge He Yang for her assistance during the writing process.

Conflicts of Interest

The authors declare no conflicts of interest.

References

  1. Şengör, A.C.; Natal’in, B.A.; Sunal, G.; van der Voo, R. The tectonics of the Altaids: Crustal growth during the construction of the continental lithosphere of Central Asia between ~750 and ~130 Ma ago. Annu. Rev. Earth Planet. Sci. 2018, 46, 439–494. [Google Scholar] [CrossRef]
  2. Kröner, A.; Windley, B.F.; Badarch, G.; Tomurtogoo, O.; Hegner, E.; Jahn, B.M.; Gruschka, S.; Khain, E.V.; Demoux, A.; Wingate, M.T.D.; et al. Accretionary Growth and Crust-formation in the Central Asian Orogenic Belt and Comparison with the Arabian-Nubian Shield. In The 4-D Framework of the Continental Crust—Integrating Crustal Processes Through Time; Geological Society of America Memoir; Geological Society of America: Boulder, CO, USA, 2007; Volume 200, pp. 181–209. [Google Scholar]
  3. Xiao, W.; Sun, M.; Santosh, M. Continental Reconstruction and Metallogeny of the Circum-Junggar Areas and Termination of the Southern Central Asian Orogenic Belt. Geosci. Front. 2015, 6, 137–140. [Google Scholar] [CrossRef]
  4. Guo, F.; Huan, M.W.; Zhao, L. Nd-Hf-O Isotopic Evidence for Subduction-induced Crustal Replacement in NE China. J. Chem. Geol. 2019, 525, 125–142. [Google Scholar] [CrossRef]
  5. Shi, Y.; Shi, S.; Liu, Z.H.; Wang, L.; Liu, J.; Chen, J.S.; Yang, F.; Zhang, C.; Li, B.; Zhang, L.D. Back-arc System Formation and Extinction in the Southern Central Asian Orogenic Belt: New Constraints from the Faku Ophiolite in North Liaoning, NE China. Gondwana Res. 2022, 103, 64–83. [Google Scholar] [CrossRef]
  6. Li, J.Y. Permian geodynamic setting of Northeast China and adjacent regions: Closure of the Paleo–Asian Ocean and subduction of the Paleo–Pacific Plate. J. Asian Earth Sci. 2006, 26, 207–224. [Google Scholar] [CrossRef]
  7. Wu, F.Y.; Sun, D.Y.; Ge, W.C.; Zhang, Y.B.; Grant, M.L.; Wilde, S.A.; Jahn, B.M. Geochronology of the Phanerozoic granitoids in Northeastern China. J. Asian Earth Sci 2011, 41, 1–30. [Google Scholar] [CrossRef]
  8. Li, Y.; Xu, W.L.; Zhang, X.M.; Tang, J. Petrogenesis of Jurassic Granitic Plutons in the Yanbian Area, NE China: Implications for the Subduction History of the Paleo-Pacific Plate. J. Asian Earth Sci. 2024, 259, 105940. [Google Scholar] [CrossRef]
  9. Du, Q.X.; Li, G.S.; Han, Z.Z.; Shen, X.L. Reappraisal of Ages of Triassic Continental Sedimentary Successions in the Yanbian Area (NE China): Implications for the Triassic Angaran and Cathaysian Floral Recovery. J. Asian Earth Sci. 2021, 215, 104811. [Google Scholar] [CrossRef]
  10. Du, Q.X.; Han, Z.Z.; Shen, X.L.; Han, C.; Song, Z.G.; Gao, L.H.; Han, M.; Zhong, W.J. Geochronology and Geochemistry of Permo-Triassic Sandstones in Eastern Jilin Province (NE China): Implications for Final Closure of the Paleo-Asian Ocean. Geosci. Front. 2019, 10, 683–704. [Google Scholar] [CrossRef]
  11. Dong, Y.; Ge, W.C.; Yang, H.; Xu, W.L.; Bi, J.H.; Wang, Z.H. Geochemistry and Geochronology of the Late Permian Mafic Intrusions Along the Boundary Area of Jiamusi and Songnen-Zhangguangcai Range Massifs and Adjacent Regions, Northeastern China: Petrogenesis and Implications for the Tectonic Evolution of the Mudanjiang Ocean. Tectonophysics 2017, 694, 356–367. [Google Scholar]
  12. Long, X.; Xu, W.; Guo, P.; Sun, C.Y.; Luan, J.P. Was Permian Magmatism in the Eastern Songnen and Western Jiamusi Massifs, NE China, Related to the Subduction of the Mudanjiang Oceanic Plate? Geol. J. 2020, 55, 1781–1807. [Google Scholar] [CrossRef]
  13. Zhou, J.B.; Wilde, S.A.; Zhang, X.Z.; Zhao, J.C.; Zheng, C.Q.; Wang, Y.J.; Zhang, X.H. The onset of Pacific Margin accretion in NE China: Evidence from the Heilongjiang high-pressure metamorphic belt. Tectonophysics 2009, 478, 230–246. [Google Scholar] [CrossRef]
  14. Zhou, J.B.; Wilde, S.A.; Zhao, G.C.; Zhang, X.Z.; Zheng, C.Q.; Wang, H. New SHRIMP U-Pb zircon ages from the Heilongjiang High-Pressure Belt: Constraints on the Mesozoic evolution of NE China. Am. J. Sci. 2010, 310, 1024–1053. [Google Scholar] [CrossRef]
  15. Yu, J.J.; Wang, F.; Xu, W.L.; Gao, F.H.; Pei, F.P. Early Jurassic mafic magmatism in the Lesser Xing’an–Zhangguangcai Range, NE China, and its tectonic implications: Constraints from zircon U–Pb chronology and geochemistry. Lithos 2012, 142–143, 256–266. [Google Scholar] [CrossRef]
  16. Zhou, J.B.; Chen, Z. Assembly processes in the eastern Northern Orogenic Belt and implications for the spatiotemporal transition of major tectonic domains in Northeast Asia. Sci. China Earth Sci. 2023, 66, 2648–2652. [Google Scholar] [CrossRef]
  17. van der Meer, D.G.; Spakman, W.; van Hinsbergen, D.J.J.; Amaru, M.L.; Torsvik, T.H. Towards absolute plate motions constrained by lower-mantle slab remnants. Nat. Geosci. 2010, 3, 36–40. [Google Scholar] [CrossRef]
  18. Müller, R.D.; Sdrolias, M.; Gaina, C.; Roest, W.R. Age, spreading rates, and spreading asymmetry of the world’s ocean crust. Geochem. Geophys. Geosyst. 2008, 9, Q04006. [Google Scholar] [CrossRef]
  19. Kiminami, K.; Imaoka, T. Spatiotemporal variations of Jurassic-Cretaceous magmatism in eastern Asia (Tan-Lu Fault to SW Japan): Evidence for flat-slab subduction and slab rollback. Terra Nova 2013, 25, 414–422. [Google Scholar] [CrossRef]
  20. Ma, X.H.; Zhu, W.P.; Zhou, Z.H.; Qiao, S.L. Transformation from Paleo-Asian Ocean closure to Paleo-Pacific subduction: New constraints from granitoids in the eastern Jilin–Heilongjiang Belt, NE China. J. Asian Earth Sci. 2017, 144, 261–286. [Google Scholar] [CrossRef]
  21. Cao, H.H.; Xu, W.L.; Pei, F.P.; Zhang, X.Z. Permian tectonic evolution in southwestern Khanka Massif: Evidence from zircon U–Pb chronology, Hf isotope and geochemistry of gabbro and quartz diorite. Acta Geol. Sin. 2011, 85, 1390–1402. [Google Scholar]
  22. Guo, F.; Li, H.X.; Fan, W.M.; Li, J.Y.; Zhao, L.; Huang, M.W.; Xu, W.L. Early Jurassic subduction of the Paleo-Pacific Ocean in NE China: Petrologic and geochemical evidence from the Tumen mafic intrusive complex. Lithos 2015, 224–225, 46–60. [Google Scholar] [CrossRef]
  23. Li, J.Y.; Zhang, J.; Yang, T.N.; Li, Y.P.; Sun, G.H.; Zhu, Z.X.; Wang, L.J. Crustal tectonic division and evolution of the Southern part of the North Asian Orogenic Region and its adjacent areas. J. Jilin Univ. (Earth Sci. Ed.) 2009, 39, 584–605, (In Chinese with English abstract). [Google Scholar]
  24. Anderson, T. Correction of Common Lead in U-Pb Analyses That Do Not Report 204 Pb. ChemicalGeology 2002, 192, 59–79. [Google Scholar]
  25. Ludwig, K.R. User’s Manual for Isoplot 3.00: A Geochronological Toolkit for Microsoft Excel; Berkeley Geochronology Center: Berkeley, CA, USA, 2003. [Google Scholar]
  26. Geng, J.Z.; Li, H.K.; Zhang, J.; Zhou, H.Y.; Li, H.M. Zircon Hf Isotope Analysis by Means of LA-MC-ICP-MS. Geol. Bull. China 2011, 30, 1508–1513. [Google Scholar]
  27. Wu, F.Y.; Li, X.H.; Zheng, Y.F.; Gao, S. Lu-Hf Isotopic Systematics and their Applications in Petrology. Acta Petrol. Sin. 2007, 23, 185–220. [Google Scholar]
  28. Pupin, J.P. Zircon and granite petrology. Contrib. Mineral. Petrol. 1980, 73, 207–220. [Google Scholar] [CrossRef]
  29. Koschek, G. Origin and significance of the SEM cathodoluminescence from zircon. J. Microsc. 1993, 171, 223–232. [Google Scholar] [CrossRef]
  30. Irvine, T.H.; Baragar, W.R.A. A guide to the chemical classification of the common volcanic rocks. Can. J. Earth Sci. 1971, 8, 523–548. [Google Scholar] [CrossRef]
  31. Peccerillo, A.; Taylor, A.R. Geochemistry of Eocene calc-alkaline volcanic rocks from the Kastamonu area, Northern Turkey. Contrib. Mineral. Petrol 1976, 58, 63–81. [Google Scholar] [CrossRef]
  32. Maniar, P.D.; Piccoli, P.M. Tectonic discrimination of granitoids. Geol. Soc. Am. Bull. 1989, 101, 635–643. [Google Scholar] [CrossRef]
  33. Guo, F.; Li, H.X.; Fan, W.M.; Li, J.Y.; Zhao, L.; Huang, M.W. Variable Sediment Flux in Generation of Permian Subduction-Related Mafic Intrusions from the Yanbian Region, NE China. Lithos 2016, 261, 195–215. [Google Scholar] [CrossRef]
  34. Sun, M.D.; Xu, Y.G.; Wilde, S.A.; Chen, H.L.; Yang, S.F. The Permian Dongfanghong island-arc gabbro of the Wandashan Orogen, NE China: Implications for Paleo-Pacific subduction. Tectonophysics 2015, 659, 122–136. [Google Scholar] [CrossRef]
  35. Guo, F.; Fan, W.L.; Gao, X.F.; Li, C.W.; Miao, L.C.; Zhao, L.; Li, H.X. Sr–Nd–Pb Isotope Mapping of Mesozoic Igneous Rocks in NE China: Constraints on Tectonic Framework and Phanerozoic Crustal Growth. Lithos 2010, 120, 563–578. [Google Scholar] [CrossRef]
  36. Tatsumi, Y. Origin of high-magnesian andesites in the Setouchi volcanic belt, southwest Japan, II. Melting phase relations at high pressures. Earth Planet. Sci. Lett. 1982, 60, 305–317. [Google Scholar] [CrossRef]
  37. Grove, T.L.; Elkins-Tanton, L.T.; Parman, S.W.; Chatterjee, N.; Müntener, O.; Gaetani, G.A. Fractional crystallization and mantle-melting controls on calc-alkaline differentiation trends. Contrib. Mineral. Petrol. 2003, 145, 515–533. [Google Scholar] [CrossRef]
  38. Kelemen, P.B. Genesis of high Mg# andesites and the continental crust. Contrib. Mineral. Petrol. 1995, 120, 1–19. [Google Scholar]
  39. Jung, S.; Hoernes, S.; Mezger, K. Synorogenic melting of mafic lower crust: Constraints from geochronology, petrology and Sr, Nd, Pb and O isotope geochemistry of quartz diorites (Damara orogen, Namibia). Contrib. Mineral. Petrol. 2002, 143, 551–566. [Google Scholar] [CrossRef]
  40. Rogers, G.; Hawkesworth, C.J. A geochemical traverse across the North Chilean Andes: Evidence for crust generation from the mantle wedge. Earth Planet. Sci. Lett. 1989, 91, 271–285. [Google Scholar] [CrossRef]
  41. Allègre, C.J.; Minster, J.F. Quantitative models of trace element behavior in magmatic processes. Earth Planet. Sci. Lett. 1978, 38, 1–25. [Google Scholar] [CrossRef]
  42. Liu, H.N.; Li, X.W.; Mo, X.X.; Xu, J.F.; Liu, J.J.; Dong, G.C.; Shan, W.; Zhang, Y.; Wang, K.; Yu, H.X. Early Mesozoic crustal evolution in the NW segment of West Qinling, China: Evidence from diverse intermediate–felsic igneous rocks. Lithos 2021, 396, 106187. [Google Scholar] [CrossRef]
  43. Castro, A. Tonalite–granodiorite suites as cotectic systems: A review of experimental studies with applications to granitoid petrogenesis. Earth-Sci. Rev. 2013, 124, 68–95. [Google Scholar] [CrossRef]
  44. Castro, A. The off-crust origin of granite batholiths. Geosci. Front. 2014, 5, 63–75. [Google Scholar] [CrossRef]
  45. Pearce, J.A.; Norry, M.J. Petrogenetic implications of Ti, Zr, Y, and Nb variations in volcanic rocks. Contrib. Mineral. Petrol. 1979, 69, 33–47. [Google Scholar] [CrossRef]
  46. Münker, C. Nb/Ta fractionation in a Cambrian arc back arc system, New Zealand: Source Constraints and Application of refined ICPMS techniques. Chem. Geol. 1998, 144, 23–45. [Google Scholar] [CrossRef]
  47. Petrogenesis and paleogeographic reconstruction significance of mafic dykes in liangcheng, northern margin of the North China craton. Acta Geol. Sin. 2023, 97, 1295–1314.
  48. Woodhead, J.D.; Hergt, J.M.; Davidson, J.P.; Eggins, S.M. Hafnium isotope evidence for “conservative, element mobility during subduction zone processes. Earth Planet. Sci. Lett. 2001, 192, 331–346. [Google Scholar] [CrossRef]
  49. Pearce, J.A. Geochemical fingerprinting of oceanic basalts with applications to ophiolite classification and the search for Archean oceanic crust. Lithos 2008, 100, 14–48. [Google Scholar] [CrossRef]
  50. Xue, H.R. Features of the Mafic-ultramafic Rocks in Jilin Province and their Metallogenesis. Doctoral Dissertation, Jilin University, Changchun, China, 2020. [Google Scholar]
  51. Zindler, A.; Hart, S.R. Chemical Geodynamics. Annu. Rev. Earth Planet. Sci. 1986, 14, 493–571. [Google Scholar] [CrossRef]
  52. Plank, T. Constraints from thorium/lanthanum on sediment recycling at subduction zones and the evolution of the continents. J. Petrol. 2005, 46, 921–944. [Google Scholar] [CrossRef]
  53. Xiao, D.; Zhao, X.Y.; Liao, Q.N.; Zhao, H.; Zeng, Z. Early Palaeozoic arc-related gabbro—Diorite suite in East Junggar, southern Central Asian Orogenic Belt: Petrogenesis and tectonic implications. Int. Geol. Rev. 2020, 62, 1205–1223. [Google Scholar] [CrossRef]
  54. Liu, Y.J.; Li, W.M.; Feng, Z.Q.; Wen, Q.B.; Neubauer, F.; Liang, C.Y. A review of the Paleozoic tectonics in the eastern part of Central Asian Orogenic Belt. Gondwana Res. 2017, 43, 123–148. [Google Scholar] [CrossRef]
  55. Jahn, B.M.; Wu, F.Y.; Chen, B. Granitoids of the central Asian orogenic belt and continental growth in the Phanerozoic. Trans. R. Soc. Edinb. Earth Sci. 2000, 91, 81–93. [Google Scholar]
  56. Wood, D.A. The application of a Th-Hf-Ta diagram to problems of tectonomagmatic classification and to establishing the nature of crustal contamination of basaltic lavas of the British Tertiary volcanic province. Earth Planet. Sci. Lett. 1980, 50, 11–30. [Google Scholar] [CrossRef]
Figure 2. Representative field photographs (ac) and Plane-polarized light microscopy (df) of early Mesozoic igneous rocks studied in the Fudong area. Mineral abbreviations: Pl—plagioclase; Ttn—titanite; Q—quartz; Hb—hornblende; Bi—bismuthinite.
Minerals 15 00562 g002
Figure 3. CL image of zircons from the Fudong pluton (FD9).
Minerals 15 00562 g003
Figure 4. LA-ICP-MS zircon U-Pb concordia diagrams and weighted mean age for the Fudong pluton (FD9).
Minerals 15 00562 g004
Figure 5. (a) SiO2 versus total alkali diagram (modified from [30]); (b) SiO2 versus K2O diagrams (modified from [31]); (c) A/NK vs. A/CNK diagrams for quartz diorite of the Fudong pluton (modified from [31]); (d) AFM diagrams for quartz diorite of the Fudong pluton (modified from [32]).
Minerals 15 00562 g005
Figure 6. (a) Chondrite-normalized REE patterns (Data normalized to Sun and McDonough (1989), modified from [32]); (b) Primitive mantle-normalized trace element variation diagrams (Data normalized to Sun and McDonough (1989), modified from [30]).
Minerals 15 00562 g006
Figure 7. (a) Plots of whole-rock εNd(t) versus (87Sr/86Sr)i (modified from [33]); (b) Hf isotope evolution diagram of quartz diorite in the Fudong area (modified from [34]).
Minerals 15 00562 g007
Figure 10. (a) (143Nd/144Nd)i vs. (87Sr/86Sr)i (modified from [53]) and (b) Th/Yb vs. Ta/Yb (modified from [35]) diagrams for the Fudong diorite samples.
Minerals 15 00562 g010
Figure 11. Data for quartz diorite in the Fudong area. (a) La/Nb vs. Ba/Nb (modified from [54]); (b) triangular diagrams of the Th-Hf-Ta system (modified from [55]); CAB—calc-alkaline basalt; IAT—island arc tholeiitic; (c) La/Yb vs. Th/Yb (modified from [56]). The data sources are this paper and Reference [50]. Samples from cited literature originate from the Yanbian area and correspond to the same geological period.
Minerals 15 00562 g011
Figure 12. (a) Simplified geological map showing the location of the eastern Jilin–Heilongjiang Belt, NE China, (b) Simplified tectonic units of the Yanbian area showing the distribution of Late Paleozoic-early Mesozoic plutons (modified from [13]). F1: Guohua-Mishan fault, F2: Jiapigou-Songjiang fault, F3: Fuerhe-Gudonghe fault.
Minerals 15 00562 g012
Table 1. LA-ICP-MS zircon U-Pb results for the Fudong pluton (FD9).
SampleU
(ppm)
Th
(ppm)
206Pb/238U207Pb/235U207Pb/206Pb208Pb/232Th206Pb/238U
Age (Ma)
FD9_01155.77135.240.02940.22310.05500.00681873
FD9_02399.19251.340.02840.21900.05590.00671813
FD9_03360.71396.070.02980.21640.05270.00711892
FD9_04949.411116.030.02960.20920.05130.00741883
FD9_05362.58357.510.02900.21430.05350.00741852
FD9_06270.87185.340.02950.21530.05290.00731872
FD9_07630.65857.870.02970.21310.05210.00761882
FD9_08224.41182.460.02820.21670.05560.00791802
FD9_09161.71152.450.02840.20780.05300.00761812
FD9_10462.82490.440.02930.21170.05240.00761862
FD9_11496.28543.810.03040.21460.05120.00791933
FD9_12123.3797.590.02940.22050.05430.00841873
FD9_13284.77220.630.02880.20510.05160.00741833
FD9_14555.13719.720.02930.21750.05390.00701862
FD9_15387.51380.380.02920.30640.07620.00851853
FD9_16146.4691.260.02960.21650.05300.00691883
FD9_17266.4884.450.02910.30940.07710.00851853
FD9_18557.67325.070.02990.22800.05540.00711903
FD9_19549.46748.550.02930.21310.05280.00691862
Table 2. Major (wt%) and trace elements (ppm) of the Fudong pluton.
SampeFD1FD2-1FD2-3FD3-1FD9SampeFD1FD2-1FD2-3FD3-1FD9
SiO257.7657.5157.8455.4855.04Nb18.616.9616.4716.5315.5
TiO21.031.0911.211.25Cs3.685.053.713.236.76
Al2O317.9217.5618.0618.5817.89Ba1053152216241407460.7
Fe2O32.842.852.694.192.45La32.7643.2625.2138.5730.21
FeO3.783.963.613.515.38Ce82.293.2257.3280.0369.52
MnO0.130.140.130.10.13Pr10.5111.237.169.778.75
MgO2.792.892.542.543.31Nd43.0144.1929.1937.4734.62
CaO5.615.995.635.486.88Sm9.659.466.17.717.78
Na2O4.274.34.525.123.81Eu3.363.873.553.162.26
K2O2.171.892.11.832.12Gd9.649.416.117.667.67
P2O50.290.330.290.340.25Tb1.271.210.770.9471.03
LOI1.241.461.341.281.07Dy6.826.224.074.685.46
K2O + Na2O6.446.196.626.955.93Ho1.351.190.810.931.07
A/CNK0.910.880.90.910.85Er3.73.272.242.612.93
Li119.5174.2160133.9147.3Tm0.510.440.330.350.44
Be10.99.379.4713.1612.5Yb2.892.421.912.252.5
Sc32.0254.0220.2631.7340.67Lu0.410.3460.260.340.35
V431.8408.7371.9391.6630.9Hf6.646.607.3518.936
Cr79.269.9767.9581.5265.68Ta0.540.50.470.390.52
Co39.6540.2535.3642.9458.5Pb12.710.079.0711.988.81
Ni37.4630.9130.2744.1943.87Th2.977.222.12.573.88
Cu14684.4285.08133133U11.220.851.080.9
Zn267.2260.7274.9304.3307.2∑REE208.09229.72145.01196.49174.58
Ga43.0744.5440.4449.5646.16∑LREE181.49205.22128.52176.72153.14
As6.144.092.963.654.4∑HREE26.624.516.4919.7821.44
Rb38.0152.3531.8845.8567.97Eu/Eu *1.051.241.761.250.88
Sr10861257111810941174(La/Yb)N7.6412.038.9111.548.15
Y48.0147.5229.4538.8741.89Mg #4444433844
Zr378.1425.25021257359
Table 3. Sr-Nd isotopic results for the Fudong pluton.
SampleRock Type87Rb/86Sr87Sr/86Sr±2σISr143Nd/144Nd±2σεNd(0)εNd(t)
FD1Quartz diorite0.24970.7063840.000 0090.70570.5123660.000008−5.3−3.69
FD2-1Quartz diorite0.24040.7062790.000 0080.70560.5123960.000008−4.72−3.015
FD9Quartz diorite0.29660.7057330.000 0090.70490.5125230.000008−2.25−0.69
Table 4. Zircon Hf isotopes for the Fudong pluton.
No.Age (Ma)176Yb/177Hf176Lu/177Hf176Hf/177Hf(176Hf/177Hf)iεHf(0)εHf(t)TDM1(Ma)TDM2(Ma)fLu/Hf
FD9_11870.01640.00040.2828190.0000300.2828181.205.7605867−0.99
FD9_21810.01710.00040.2827180.0000230.282717−0.242.07461100−0.99
FD9_31890.07100.00170.2827610.0000280.282755−0.853.57101007−0.95
FD9_41880.08470.00200.2827750.0000260.282768−0.364.0694975−0.94
FD9_51850.04690.00110.2827830.0000220.282780−0.084.3666954−0.97
FD9_61870.01670.00040.2827220.0000220.282720−2.212.37411088−0.99
FD9_71880.09080.00210.2828230.0000280.2828161.345.7627871−0.94
FD9_81800.03160.00080.2827190.0000230.282716−0.242.07511101−0.98
FD9_91810.02680.00060.2827630.0000210.282761−0.773.6687997−0.98
FD9_101860.06380.00140.2826840.0000230.282680−3.60.88141181−0.96
Disclaimer/Publisher’s Note: The statements, opinions and data contained in all publications are solely those of the individual author(s) and contributor(s) and not of MDPI and/or the editor(s). MDPI and/or the editor(s) disclaim responsibility for any injury to people or property resulting from any ideas, methods, instructions or products referred to in the content.

