Article

Pore Structure Characterization of Jurassic Sandstones in the Northeastern Ordos Basin: An Integrated Experimental and Inversion Approach

1
School of Resource and Earth Science, China University of Mining and Technology, Xuzhou 221116, China
2
Inner Mongolia Huangtaolegai Coal Co., Ltd., Ordos 017000, China
*
Author to whom correspondence should be addressed.
Minerals 2025, 15(5), 547; https://doi.org/10.3390/min15050547
Submission received: 2 May 2025 / Revised: 16 May 2025 / Accepted: 18 May 2025 / Published: 20 May 2025
(This article belongs to the Section Mineral Exploration Methods and Applications)

Abstract

:
Although Mercury Intrusion Porosimetry (MIP) and Nuclear Magnetic Resonance (NMR) are widely used for pore characterization, their effectiveness is fundamentally constrained by theoretical limitations. This study investigated the pore structure characteristics of coal-bearing sandstones from the northeastern Ordos Basin using an integrated approach combining experimental measurements and model-based inversion. The experimental measurements comprised a stress-dependent acoustic velocity test (P- and S-wave velocities), X-ray diffraction (XRD) mineralogical analysis, and NMR relaxation T2 spectra characterization. For model-based inversion, we developed an improved Mori-Tanaka (M-T) theoretical framework incorporating stress-sensitive pore geometry parameters and dual-porosity (stiff/soft) microstructure representation. Systematic analysis revealed four key findings: (1) excellent agreement between model-inverted and NMR-derived total porosity, with a maximum absolute error of 1.09%; (2) strong correlation between soft porosity and the third peak of T2 relaxation spectra; (3) stiff porosity governed by brittle mineral content (quartz and calcite), while soft porosity showing significant correlation with clay mineral abundance and Poisson’s ratio; and (4) markedly lower elastic moduli (28.78%–51.85%) in Zhiluo Formation sandstone compared to Yan’an Formation equivalents, resulting from differential diagenetic alteration despite comparable depositional settings. The proposed methodology advances conventional NMR analysis by simultaneously quantifying both pore geometry parameters (e.g., aspect ratios) and the stiff-to-soft pore distribution spectra. This established framework provides a robust characterization of the pore architecture in Jurassic sandstones, yielding deeper insights into sandstone pore evolution within the Ordos Basin. These findings provide actionable insights for water hazard mitigation and geological CO2 storage practices.

1. Introduction

The Jurassic coal seams in the Ordos Basin are characterized by substantial thickness, superior coal quality, and favorable mining conditions, collectively constituting a pivotal coal production base in China [1,2]. Sandstones from the Jurassic Zhiluo and Yan’an Formations, which serve as coal seam roof strata, are critically important for mine stability, water hazard prevention, and safe mining operations. A systematic investigation of their rock physics characteristics—particularly pore structure properties—is essential for ensuring the safety of coal resource development.
Acoustic rock physics properties are demonstrated to bridge lithological parameters and seismic responses. Rigorous petrophysical investigations are shown to impose essential constraints on the interpretation of geophysical observational data. The Ordos Basin, which has experienced complex tectonic evolution and multi-phase diagenesis, contains Jurassic Zhiluo and Yan’an Formation sandstones that exhibit intricate pore architecture characteristics [3,4]. Key pore structure parameters, including soft porosity, aspect ratio, and stiff pore content, significantly influence the reliability of rock physics modeling. Their precise characterization can provide valuable constraints for lithological interpretation during seismic exploration. While previous studies of the coal-bearing strata in the Ordos Basin have primarily focused on macroscopic parameters, including porosity, permeability, and mechanical properties [5,6,7,8], microscopic parameters, including soft and stiff pore characteristics, remain understudied.
Geological storage of carbon dioxide (CO2) is a cornerstone strategy for mitigating anthropogenic emissions and achieving net-zero targets. Long-term storage in geological formations is critical for large-scale decarbonization. Current efforts focus on diverse storage reservoirs, including deep saline aquifers, depleted hydrocarbon fields and basaltic formations. Deep saline aquifers have received considerable attention as storage sites of CO2 due to their large storage capacity [9,10]. Each presents unique mineralogical and geochemical characteristics that influence CO2 trapping mechanisms. However, the heterogeneous nature of these formations, which vary in porosity, permeability, reactive mineral content, and structural stability, poses significant challenges for reliable site selection and risk assessment [11]. The study of the physical properties of Jurassic sandstone in the Ordos Basin facilitates the determination of stratigraphic parameters and provides critical insights for assessing CO2 storage capacity in the target region.
Refined characterization of pore architecture represents a cutting-edge research frontier in rock physics. Significant efforts have been devoted to developing advanced rock physics models that incorporate both soft and stiff pores, such as dual-porosity wave-induced fluid flow models, carbonate-specific dual-porosity frameworks, and pore-type impacts on Differential Effective Medium modeling [12,13,14,15,16]. For quantitative pore-type differentiation, empirical methodologies combining thin-section analysis, mercury intrusion porosimetry (MIP), nuclear magnetic resonance (NMR), and scanning electron microscopy (SEM) have been employed to statistically characterize the pore architectures [17,18,19,20]. Furthermore, researchers have examined stress-dependent seismic velocity variations and established methodologies for calculating soft and stiff porosities through stress-velocity experiments [21,22,23,24,25]. The stress-velocity experiments investigate the stress sensitivity of the tested formation rocks. The analysis of the stress effects on the rock layers contributes to clarifying the impact of the Jurassic roof sandstone lithology on coal mining safety in the target study area.
While MIP and NMR are widely used experimental methods for pore characterization, both methods exhibit inherent limitations. MIP cannot effectively characterize pressure-resistant isolated pores due to accessibility constraints at maximum intrusion pressures [26,27]. NMR provides only indirect proxies, requiring empirical conversion of T2 relaxation distributions to porosity estimates, and fails to detect fluid-isolated pores in dry samples [28]. Notably, the quantitative differentiation of stiff versus soft pores in the Ordos Basin’s coal-bearing sandstone formations remains unexplored, necessitating the methodological adaptation of existing pore characterization approaches to this specific geological setting.
This study investigates Jurassic sandstones from coal-bearing strata in the Ordos Basin through comprehensive rock physics parameter testing and pressure-dependent velocity experiments. We developed a novel methodology to quantify soft and stiff pore distributions tailored to the geological conditions of the study area. Our comparative analysis of rock physics parameters between the Zhiluo and Yan’an Formations reveals significant relationships among pore-type distributions, diagenetic history, mineralogical composition, and acoustic velocity characteristics. The research objectives are twofold: (1) to establish a robust quantitative framework for pore structure characterization, and (2) to enhance the understanding of the fundamental rock physics mechanisms governing these Jurassic sandstones.

2. Methods

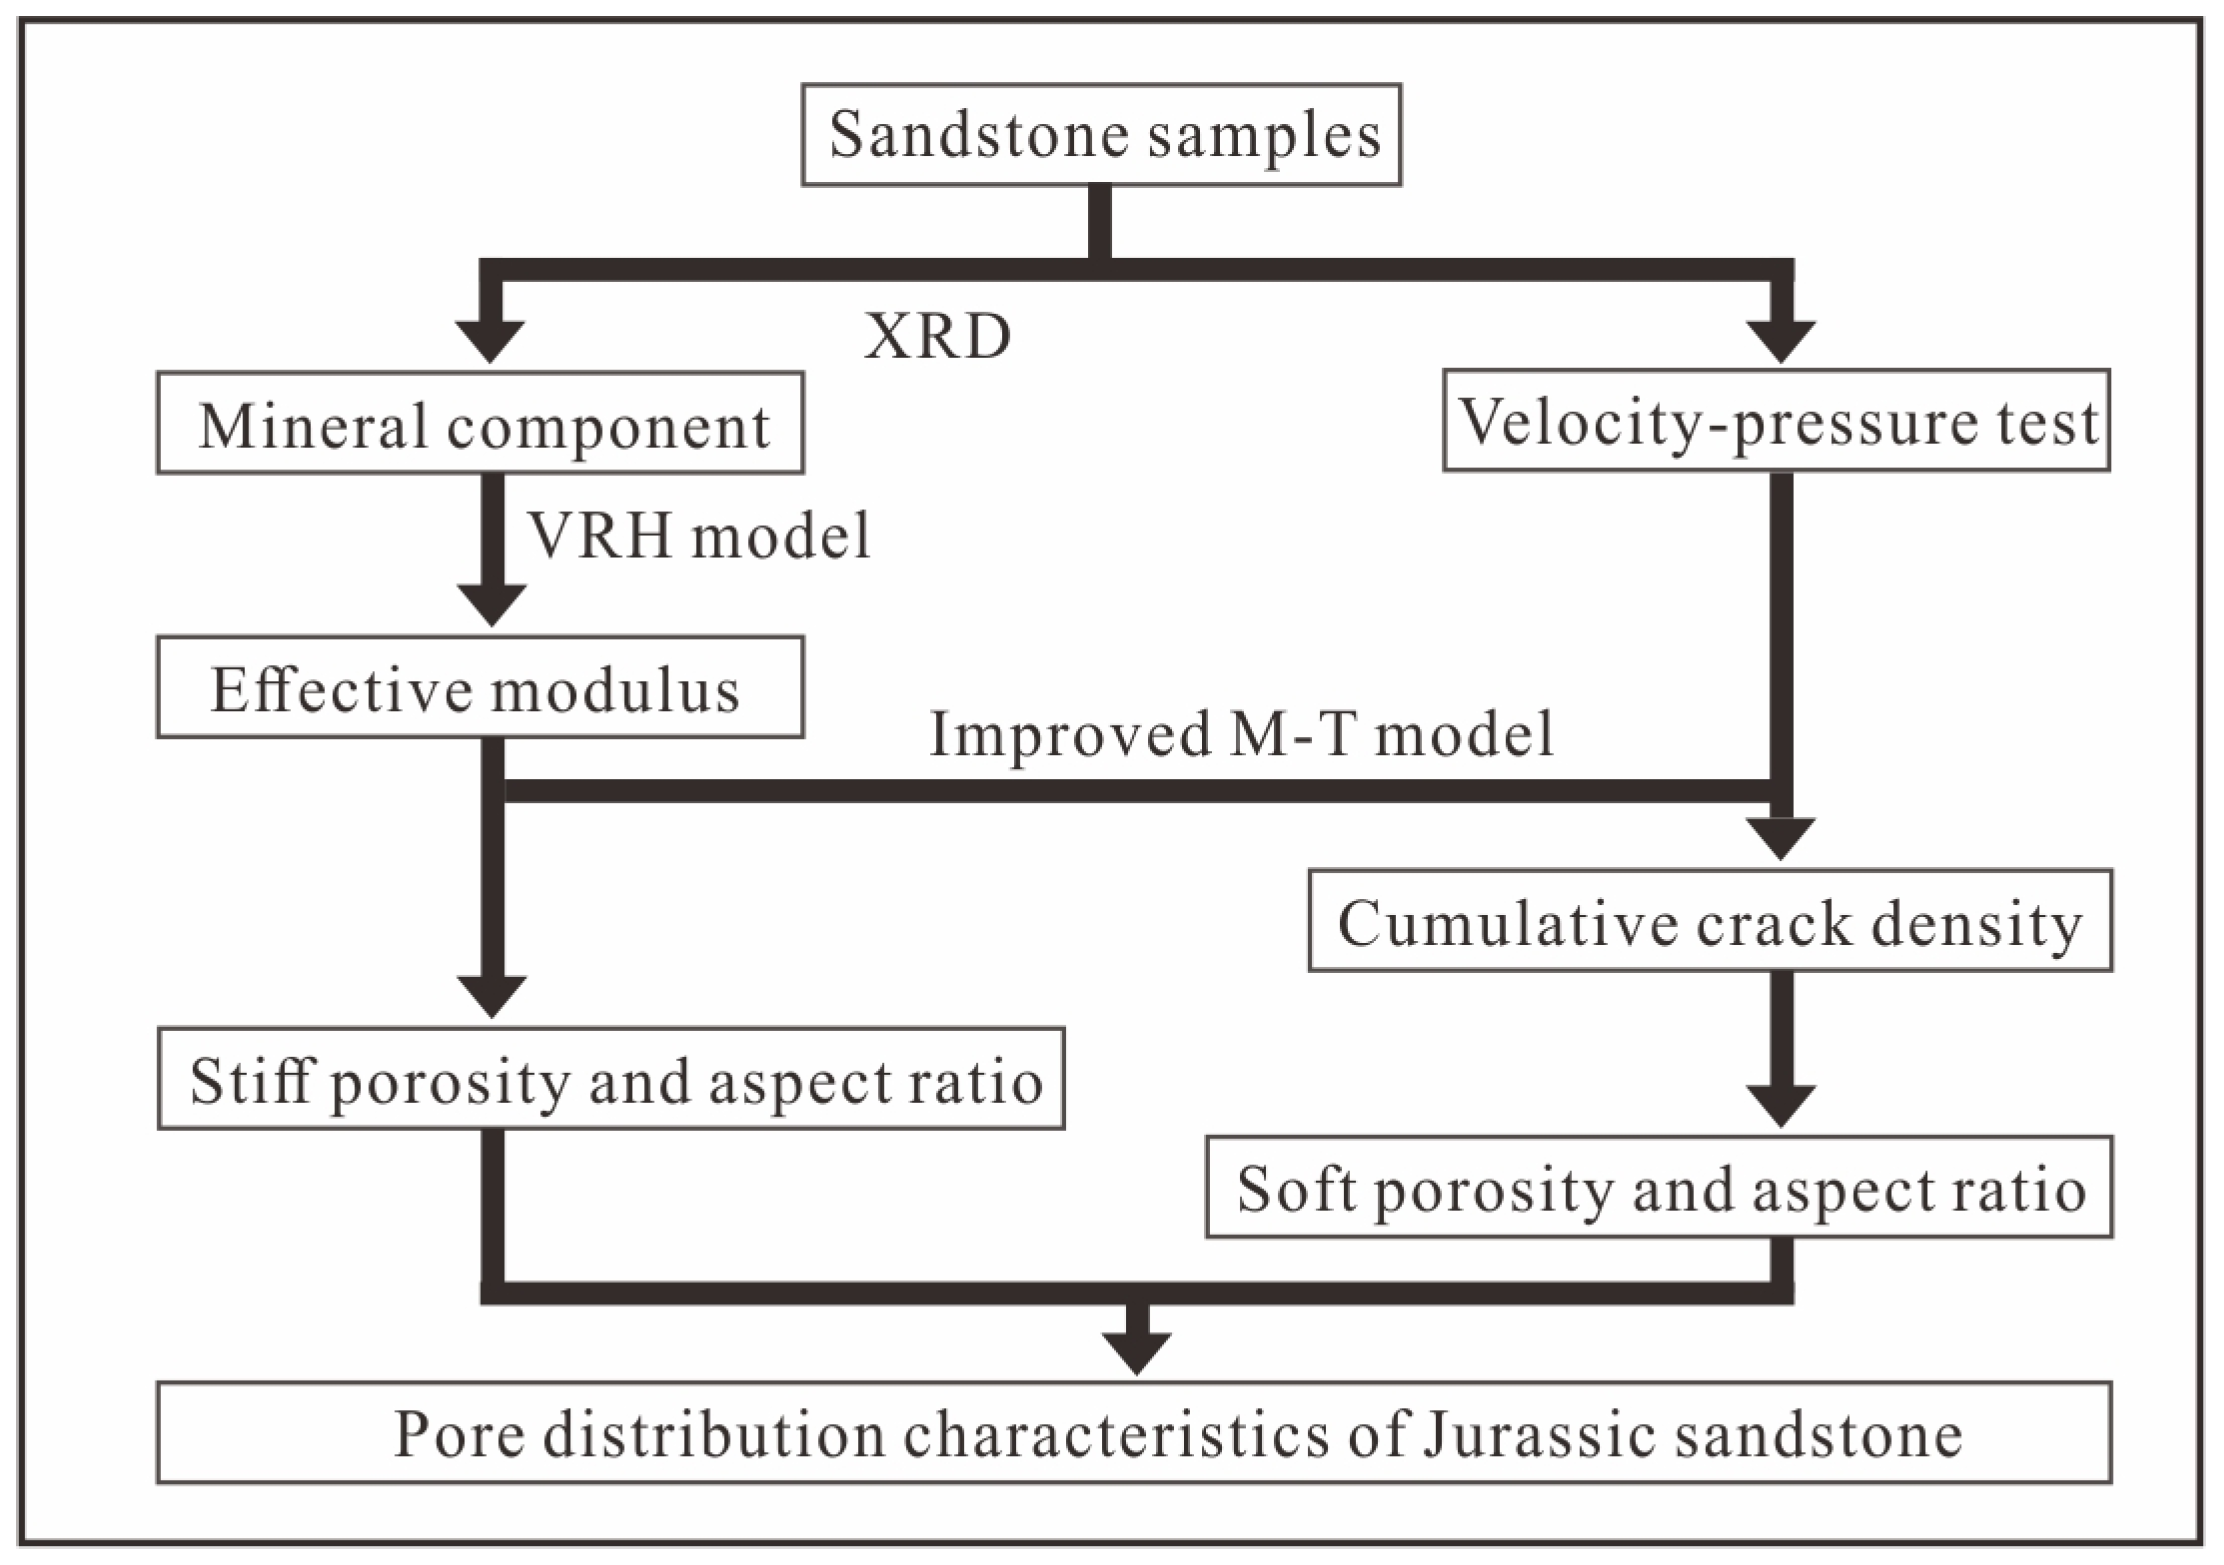
2.1. Characterization Framework for Pore Structure Distribution

Rock pores are three-dimensional void spaces within the rock matrix that remain unoccupied by solid materials. Based on their distinct mechanical response to stress, pores are fundamentally classified into two types, e.g., stiff pores and soft pores [29,30]. The pore aspect ratio (ASP) is defined as the ratio of the pore width to the pore diameter, and its value ranges from 0 to 1. Stiff pores, characterized by larger aspect ratios (ASP ≥ 0.01), include primary intergranular pores and dissolution pores. These pores exhibit relatively incompressible behavior under stress loading and maintain a near-constant geometry during rock deformation. Soft pores, defined by lower aspect ratios (ASP < 0.01), comprise the grain contact boundaries, pore periphery corners, and microcracks. Mechanically, these pores exhibit behavior that is fundamentally opposite to that of stiff pores.
Sandstone can be conceptually simplified as a combination of a rock matrix, soft pores, and stiff pores [31,32]. The stress-dependent acoustic velocities (VP and VS) of sandstone are fundamentally controlled by its effective elastic modulus, which is governed by the volumetric proportion of each component, geometric distribution of pore types, and modulus contrast between constituents [33,34]. To quantitatively characterize the pore systems in Jurassic sandstones from the northeastern Ordos Basin, this study develops a novel characterization framework (Figure 1) with the following workflow. At first, X-ray diffraction (XRD) analysis and stress-dependent acoustic velocity measurements were conducted in the laboratory to obtain samples’ mineral composition and stress-related P- and S-wave velocities. Then, the Voigt-Reuss-Hill (VRH) model was used to calculate the effective modulus of the rock background matrix. After that, an improved Mori-Tanaka (M-T) model was used to inverse the porosity and equivalent ASP of stiff pores using laboratory-measured stress-related acoustic velocities. Finally, the porosity and ASP distribution of the soft pores were also calculated using the improved M-T model.

2.2. An Improved M-T Model

After determining the volume content of each mineral in the rock, the effective elastic modulus MVRH of the rock matrix was calculated using the VRH model [35,36]:
M V = i = 1 N f i M i 1 M R = i = 1 N f i M i M 0 = M V + M R 2
where MV is the Voigt upper bond of the modulus, MR is the Reuss lower bond of the modulus, M0 is the Hill average of the modulus, fi is the volume fraction of the ith component, and Mi is the elastic modulus of the ith component.
The M-T model provides expressions for the stiff porosity and corresponding ASP parameters [22,37,38]:
K s t i f f = K 0 1 + φ s 1 φ s P 1 μ s t i f f = μ 0 1 + φ s 1 φ s Q 1
where Kstiff is the effective bulk modulus of the rock containing only stiff pores, μstiff is the effective shear modulus of the rock containing only stiff pores, K0 is the effective bulk modulus of the rock background matrix, μ0 is the effective shear modulus of the rock background matrix, φs is the stiff porosity, and P and Q are the shape factors of the rock pores.
Shape factors P and Q have simplified forms for specific shapes, using spheres, needles, disks, or coins to represent pore geometries [28].
Using Equation (2), both the stiff porosity and equivalent aspect ratio (ASP) of the stiff pores can be quantitatively obtained.
For soft pores, the porosity can be approximated by the crack density (cd), where pores have an extremely small ASP. An approximate conversion relationship exists between soft porosity (φc) and cd:
c d = 3 φ c / 4 π α
Using Equation (3), the calculation of φc is transformed into the cd calculation for soft pores. Based on stress-dependent velocity measurements from dry-rock laboratory experiments, the cd of soft pores can be determined using an improved M-T model [22,38,39]. The specific derivation process is as follows:
The shape factors P and Q of penny-shaped cracks can be expressed as follows:
P = K s t i f f + 4 3 μ i K i + 4 3 μ i + π α β s t i f f Q = 1 5 1 + 8 μ s t i f f 4 μ i + π α μ s t i f f + 2 β s t i f f + 2 K i + 2 3 μ i + μ s t i f f K i + 4 3 μ i + π α β s t i f f β s t i f f = μ s t i f f 3 K s t i f f + μ s t i f f 3 K s t i f f + 4 μ s t i f f
where μi and Ki are the moduli of the fluid in the pore respectively.
The calculation equation for the soft pore can be described as
K d = K s t i f f 1 + φ c 1 φ c P 1 μ d = μ s t i f f 1 + φ c 1 φ c Q 1
where Kd is the effective bulk modulus of the rock with both soft and stiff pores, and μd is the effective shear modulus of the rock with both soft and stiff pores.
Substituting Equations (3) and (4) into Equation (5) yields the complete expressions for the porosity and ASP of the soft pores. Meanwhile, the modulus of the fluid in the voids is much smaller than that of the rock. Therefore, the fluid modulus can be ignored in the calculation process. The simplified calculation formula is as follows:
K d = K s t i f f 1 + 4 c d K s t i f f 3 K s t i f f + 4 μ s t i f f 3 μ s t i f f 3 K s t i f f + μ s t i f f 1 μ d = μ s t i f f 1 + 4 c d 45 8 3 K s t i f f + 4 μ s t i f f 3 K s t i f f + 2 μ s t i f f + 4 3 K s t i f f + 4 μ s t i f f 3 K s t i f f + μ s t i f f 1
After further simplification, the final calculation equations for the porosity and ASP of the soft pores are obtained as follows:
K d = K s t i f f 1 + 16 1 ν s t i f f 2 c d 9 1 2 ν s t i f f 1 μ d = μ s t i f f 1 + 32 1 ν s t i f f 5 ν s t i f f c d 45 2 ν s t i f f 1 α i = 4 1 ν i 2 p π E i c d k = c d k 1 Δ p c d k Δ p
where vstiff is the Poisson’s ratio of the rock containing only stiff pores; αi is the ASP distribution at the ith test point in the stress-dependent velocity measurements; p is the effective stress at the test point; vi is the Poisson’s ratio at the ith test point; Ei is the Young’s modulus at the ith test point; cdk is the cd component corresponding to each ASP; k is the test point number; and ∆p is the pressure gradient during the test.
Once the aforementioned parameters are determined, the soft porosity distribution φck under varying effective stresses can be calculated by reformulating Equation (3) using αi and cdk as follows:
φ c k = 4 π 3 α i c d k
By substituting α0 and cdk at 0 MPa effective stress into Equation (8), we obtain the soft porosity distribution φck of the rock. Integrating φck yields the total soft porosity φc, thus providing both the soft porosity φc and ASP distribution α0 for soft pores.

2.3. Laboratory Measurement Methods

This study investigated the compositional and petrophysical properties of Jurassic sandstone samples through systematic laboratory characterization, including mineral composition, porosity, density, P-wave velocity (VP), and S-wave velocity (VS). The mineral composition of the powdered samples was first determined using a Bruker D8 ADVANCE X-ray diffractometer (Bruker, Munich, Germany) following the ASTM D934 test methods. Subsequently, cylindrical core samples were subjected to: (1) porosity measurement via low-field NMR (MiniMR-60 system, Niumag, Suzhou, China) after 24-h vacuum water saturation; (2) bulk density determination using the Archimedes water displacement method; and (3) P- and S-wave velocity measurements using the ultrasonic pulse transmission method (HKN-B system, Tuochuang, Yangzhou, China) with 1 MHz transducers.
The experimental study primarily focused on measuring the VP and VS of dry sandstone samples under varying effective stress conditions, as these measurements provide critical insights into pore structure characteristics. The test system comprised four key components: a pressure vessel, ultrasonic pulse transducers, an ultrasonic acquisition unit, and a pressure control unit (Figure 2). The testing procedure was as follows:
(1)
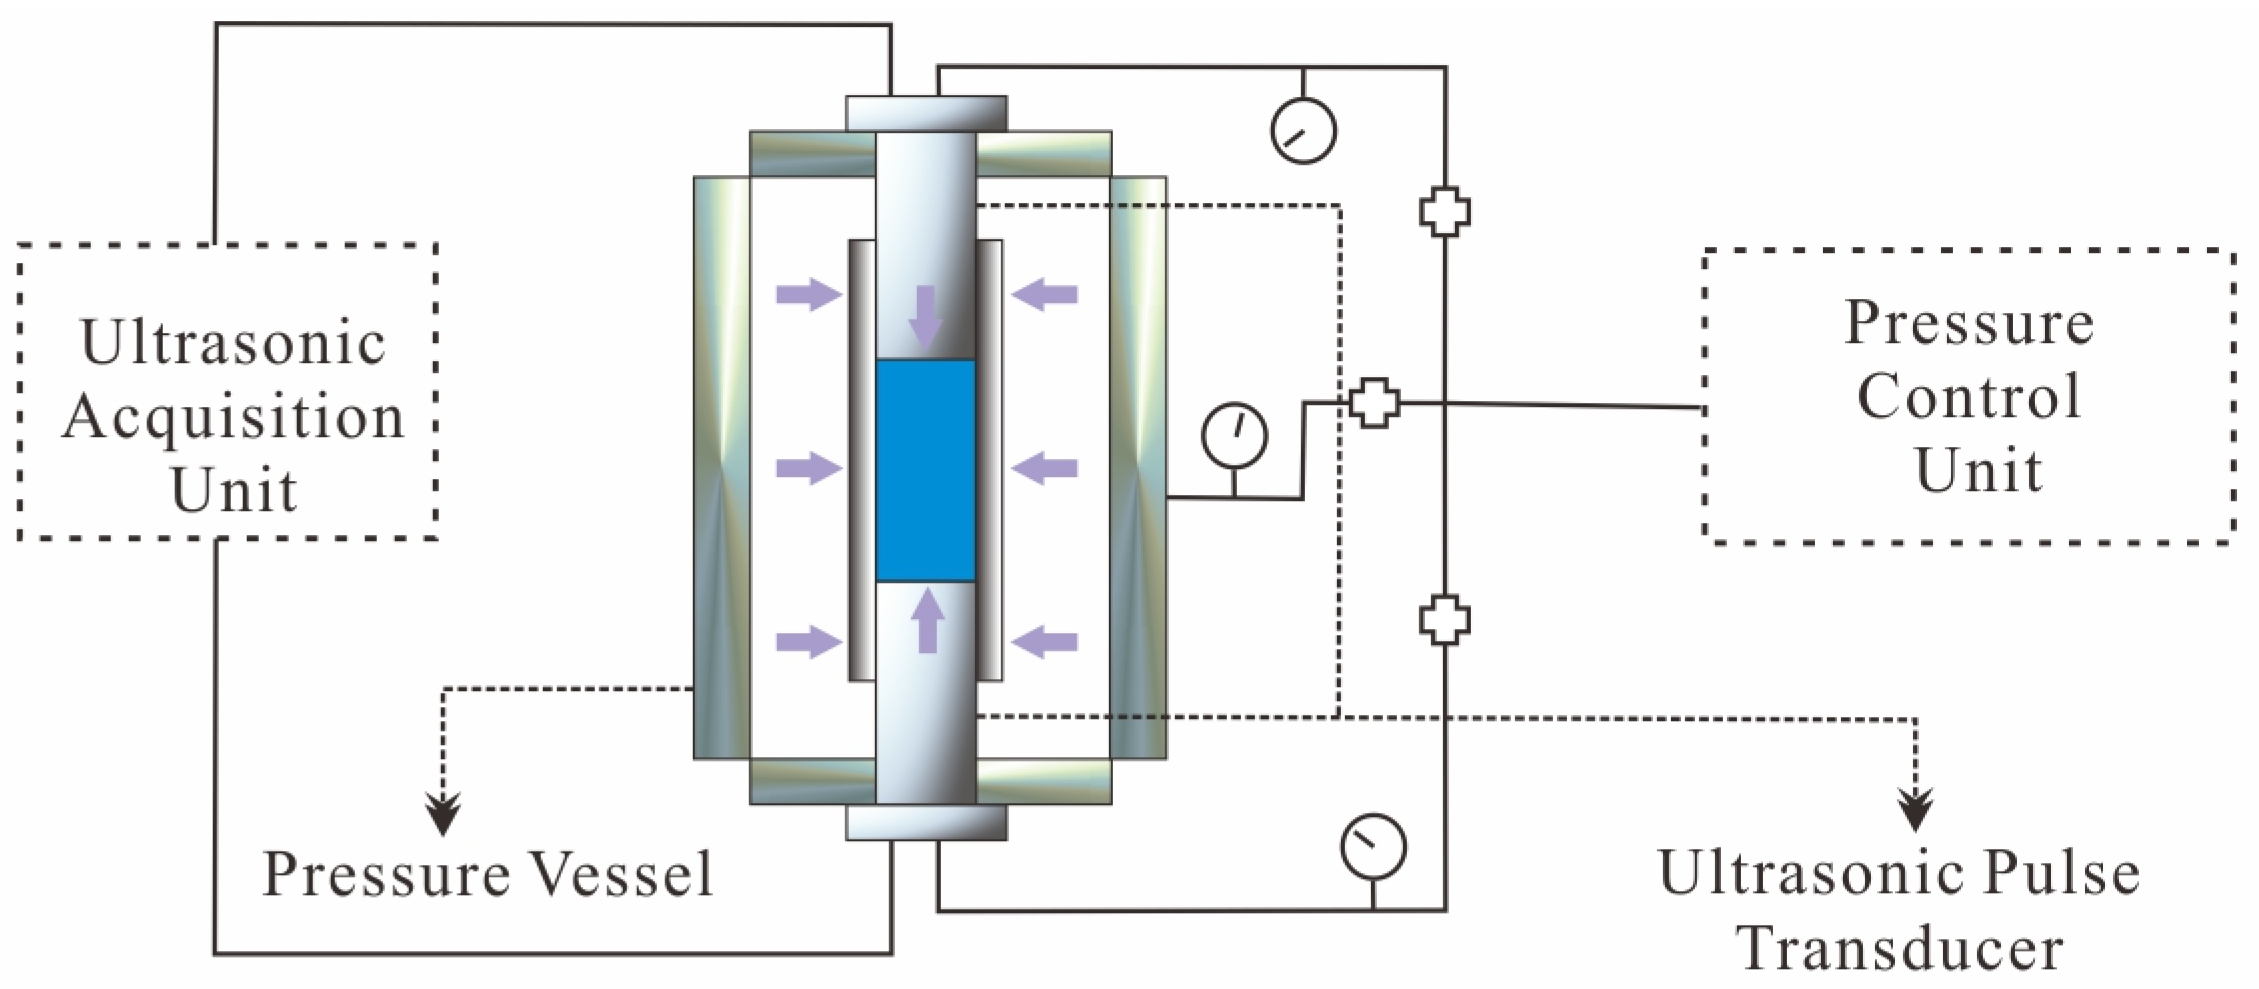
Sample preparation: The test sample was placed inside a pressure vessel filled with hydraulic oil and isolated from the sample using a rubber sleeve.
(2)
Transducer installation: Ultrasonic transducers were tightly coupled to the sample surfaces and secured within the pressure vessel using threaded fasteners.
(3)
Pressure application: The pressure control unit gradually applied isotropic confining pressure in 2 MPa increments through both the vessel and transducers until either the velocity measurements stabilized or the sample was destroyed.
(4)
Data collection: The ultrasonic pulse unit acquired acoustic wave signals at each 2 MPa pressure step.
(5)
Post-test procedure: After pressure release, the sample was removed, and the final VP and VS values were calculated by dividing the measured core length by the ultrasonic transmission time.
Figure 2. Schematic of the stress-dependent acoustic velocity measurement system.
Minerals 15 00547 g002

3. Geological Setting and Sample Preparation

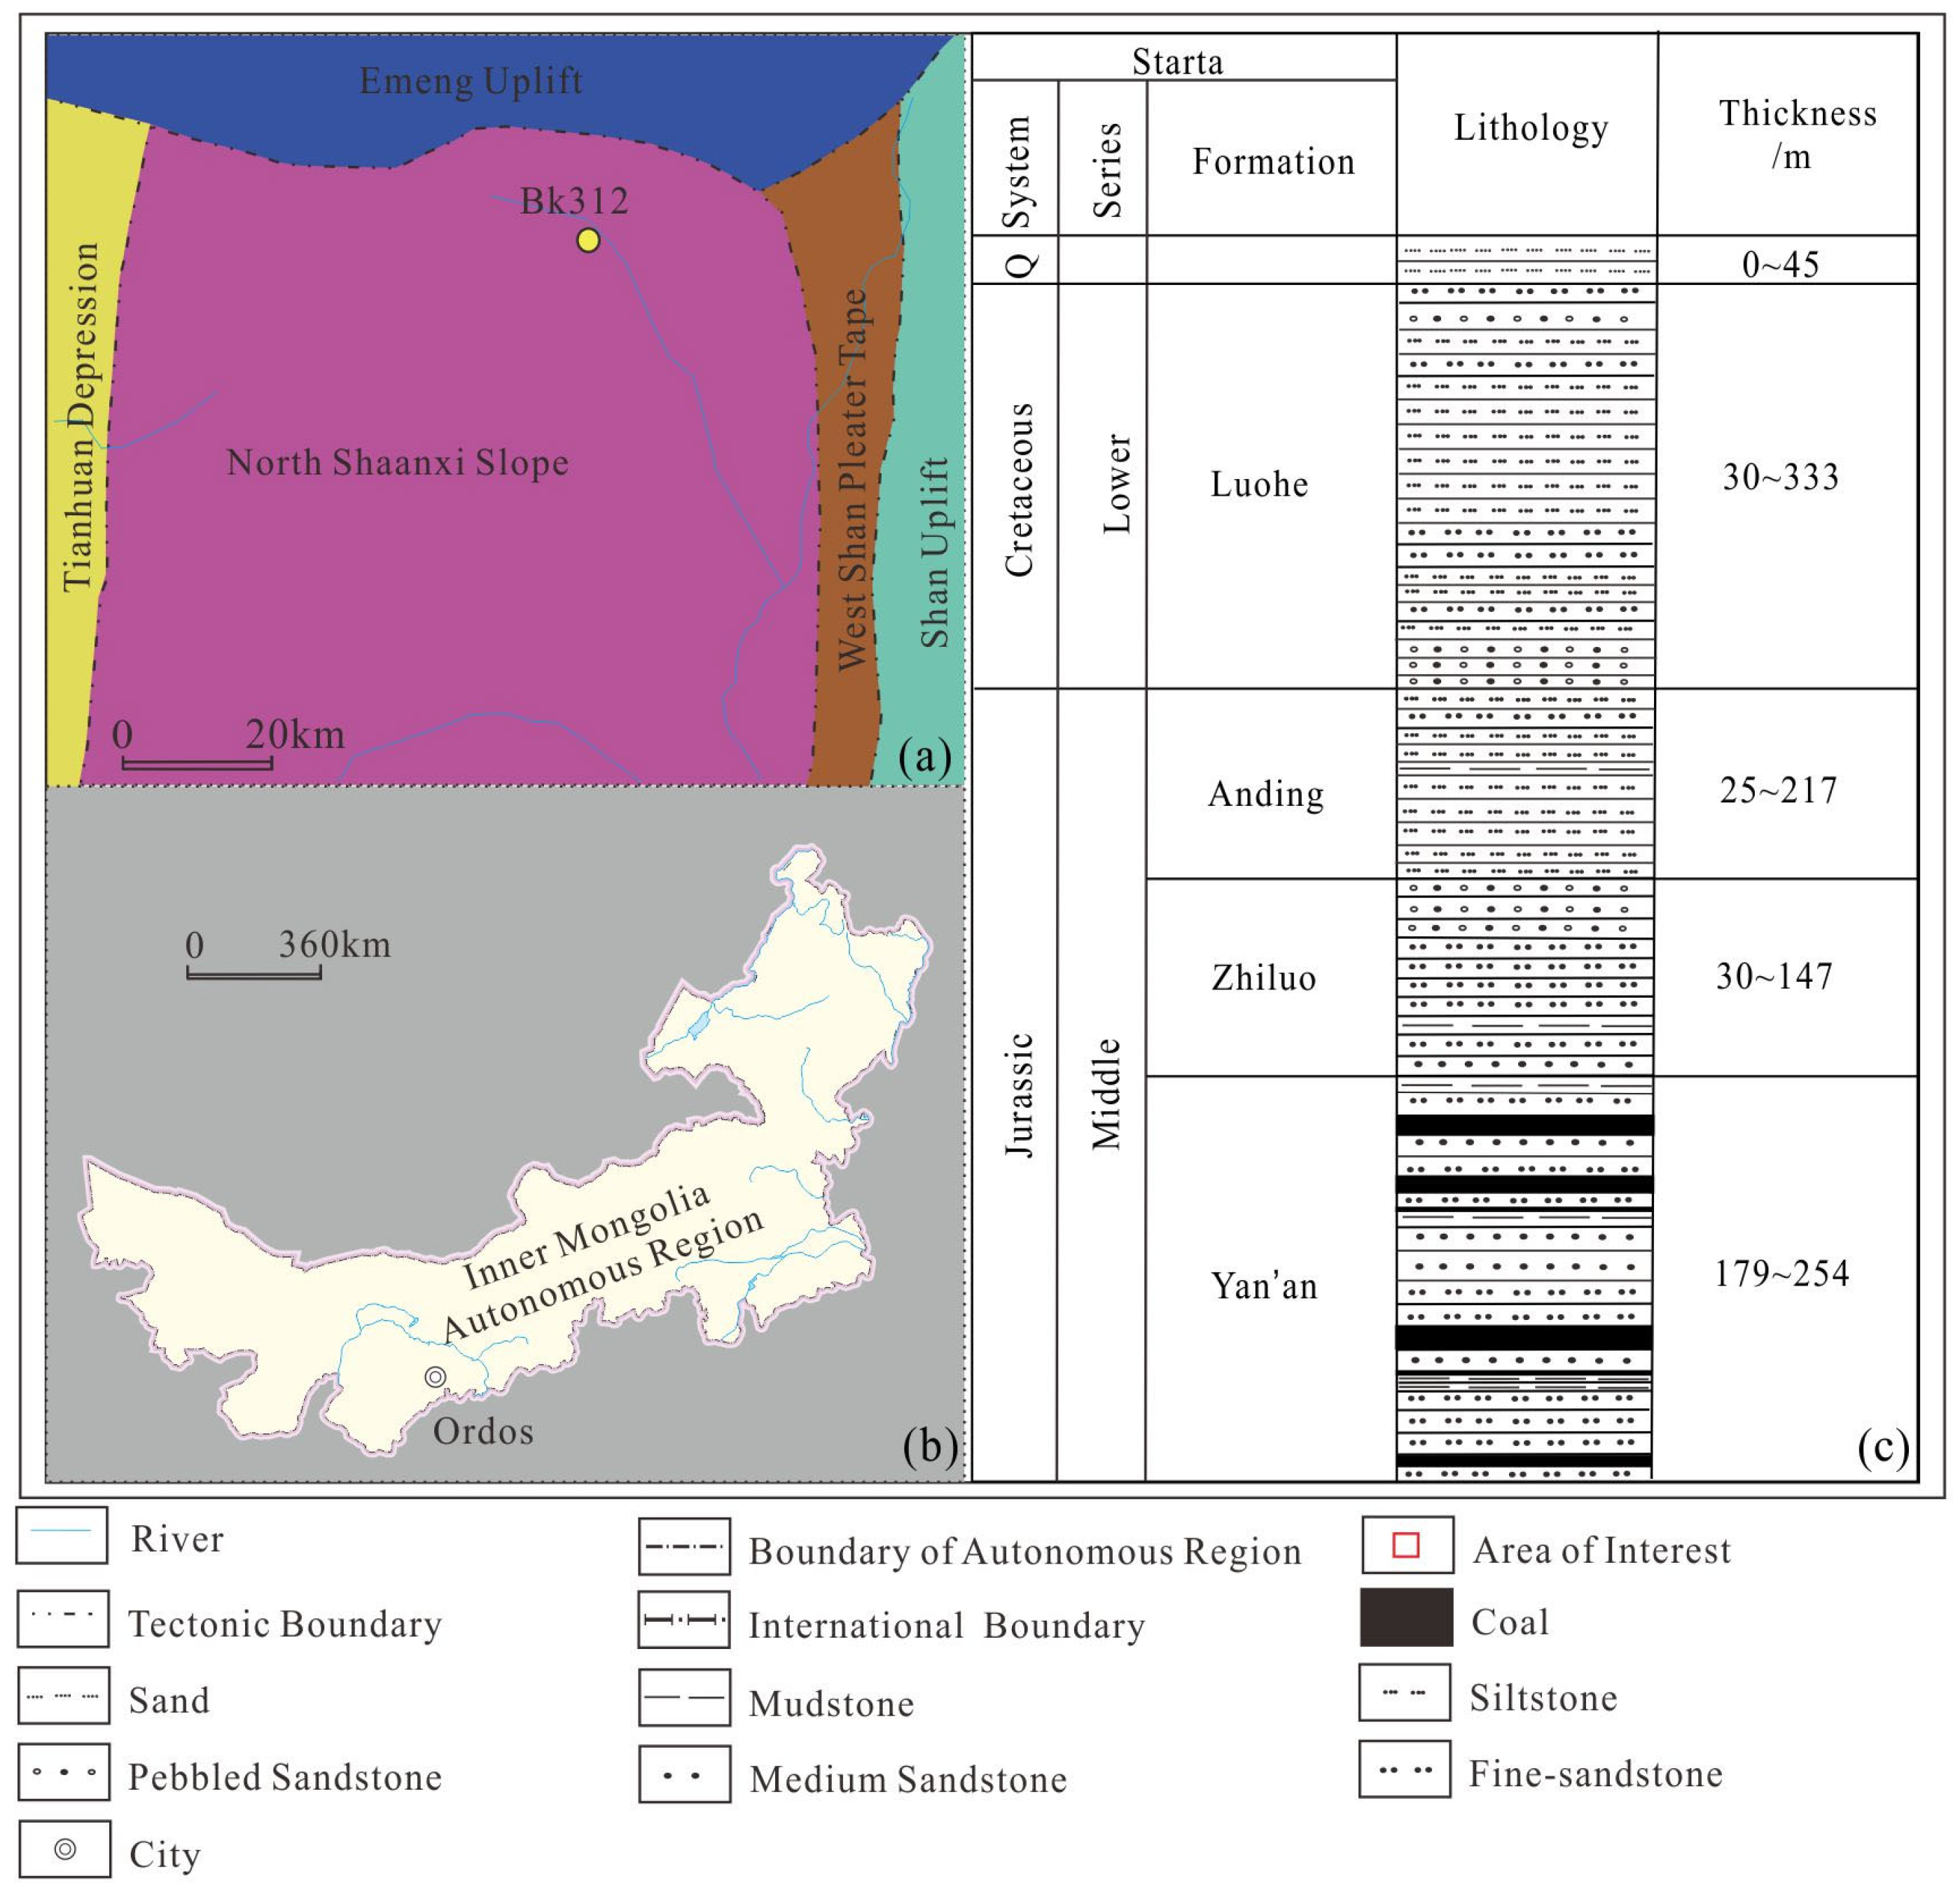
3.1. Geological Setting

This study focuses on the Shendong mining area, which is situated in the northeastern Ordos Basin (Figure 3). This region forms the northern section of the Northern Shaanxi Slope, a secondary structural unit of the Ordos Basin, and is tectonically bounded by the Emeng Uplift, Tianhuan Depression, and West Shan Pleater Tape [8]. Geologically, the area is predominantly overlain by Cenozoic unconsolidated to semi-consolidated sediments. The exposed stratigraphic sequence, from youngest to oldest, consists of Quaternary deposits, Cretaceous sedimentary rocks, Jurassic coalbeds and sandstones, and Triassic formations [40].
The Jurassic coal-bearing strata in the Shendong mining area include three main formations: the Anding, Zhiluo and Yan’an Formations. The Zhiluo Formation features alternating sandstone, siltstone, and mudstone layers, while the Yan’an Formation contains interbedded sandstone, mudstone, and coal seams (Figure 3). The Zhiluo Formation exhibits five distinct depositional facies: braided river, braided river delta, meandering river, meandering river delta, and lacustrine facies. The early depositional stage was dominated by braided rivers and braided river deltas, while the middle depositional stage was primarily characterized by meandering rivers and meandering river deltas [41]. The Yan’an Formation exhibits a relatively stable thickness and represents a complete inland great lake system. Fluvial facies, lacustrine delta facies, and lacustrine facies developed successively from the periphery to the center [42,43]. The Shendong mining area primarily consists of lacustrine delta facies. Sandstone is the most abundant rock type in this sequence, accounting for over 60% of the core sample. Most sandstones are argillaceous-cemented with minor calcareous cementation. Their compressive strength is typically below 40 MPa, which is lower than that of typical sandstones, classifying them as weakly cemented sandstones [44].

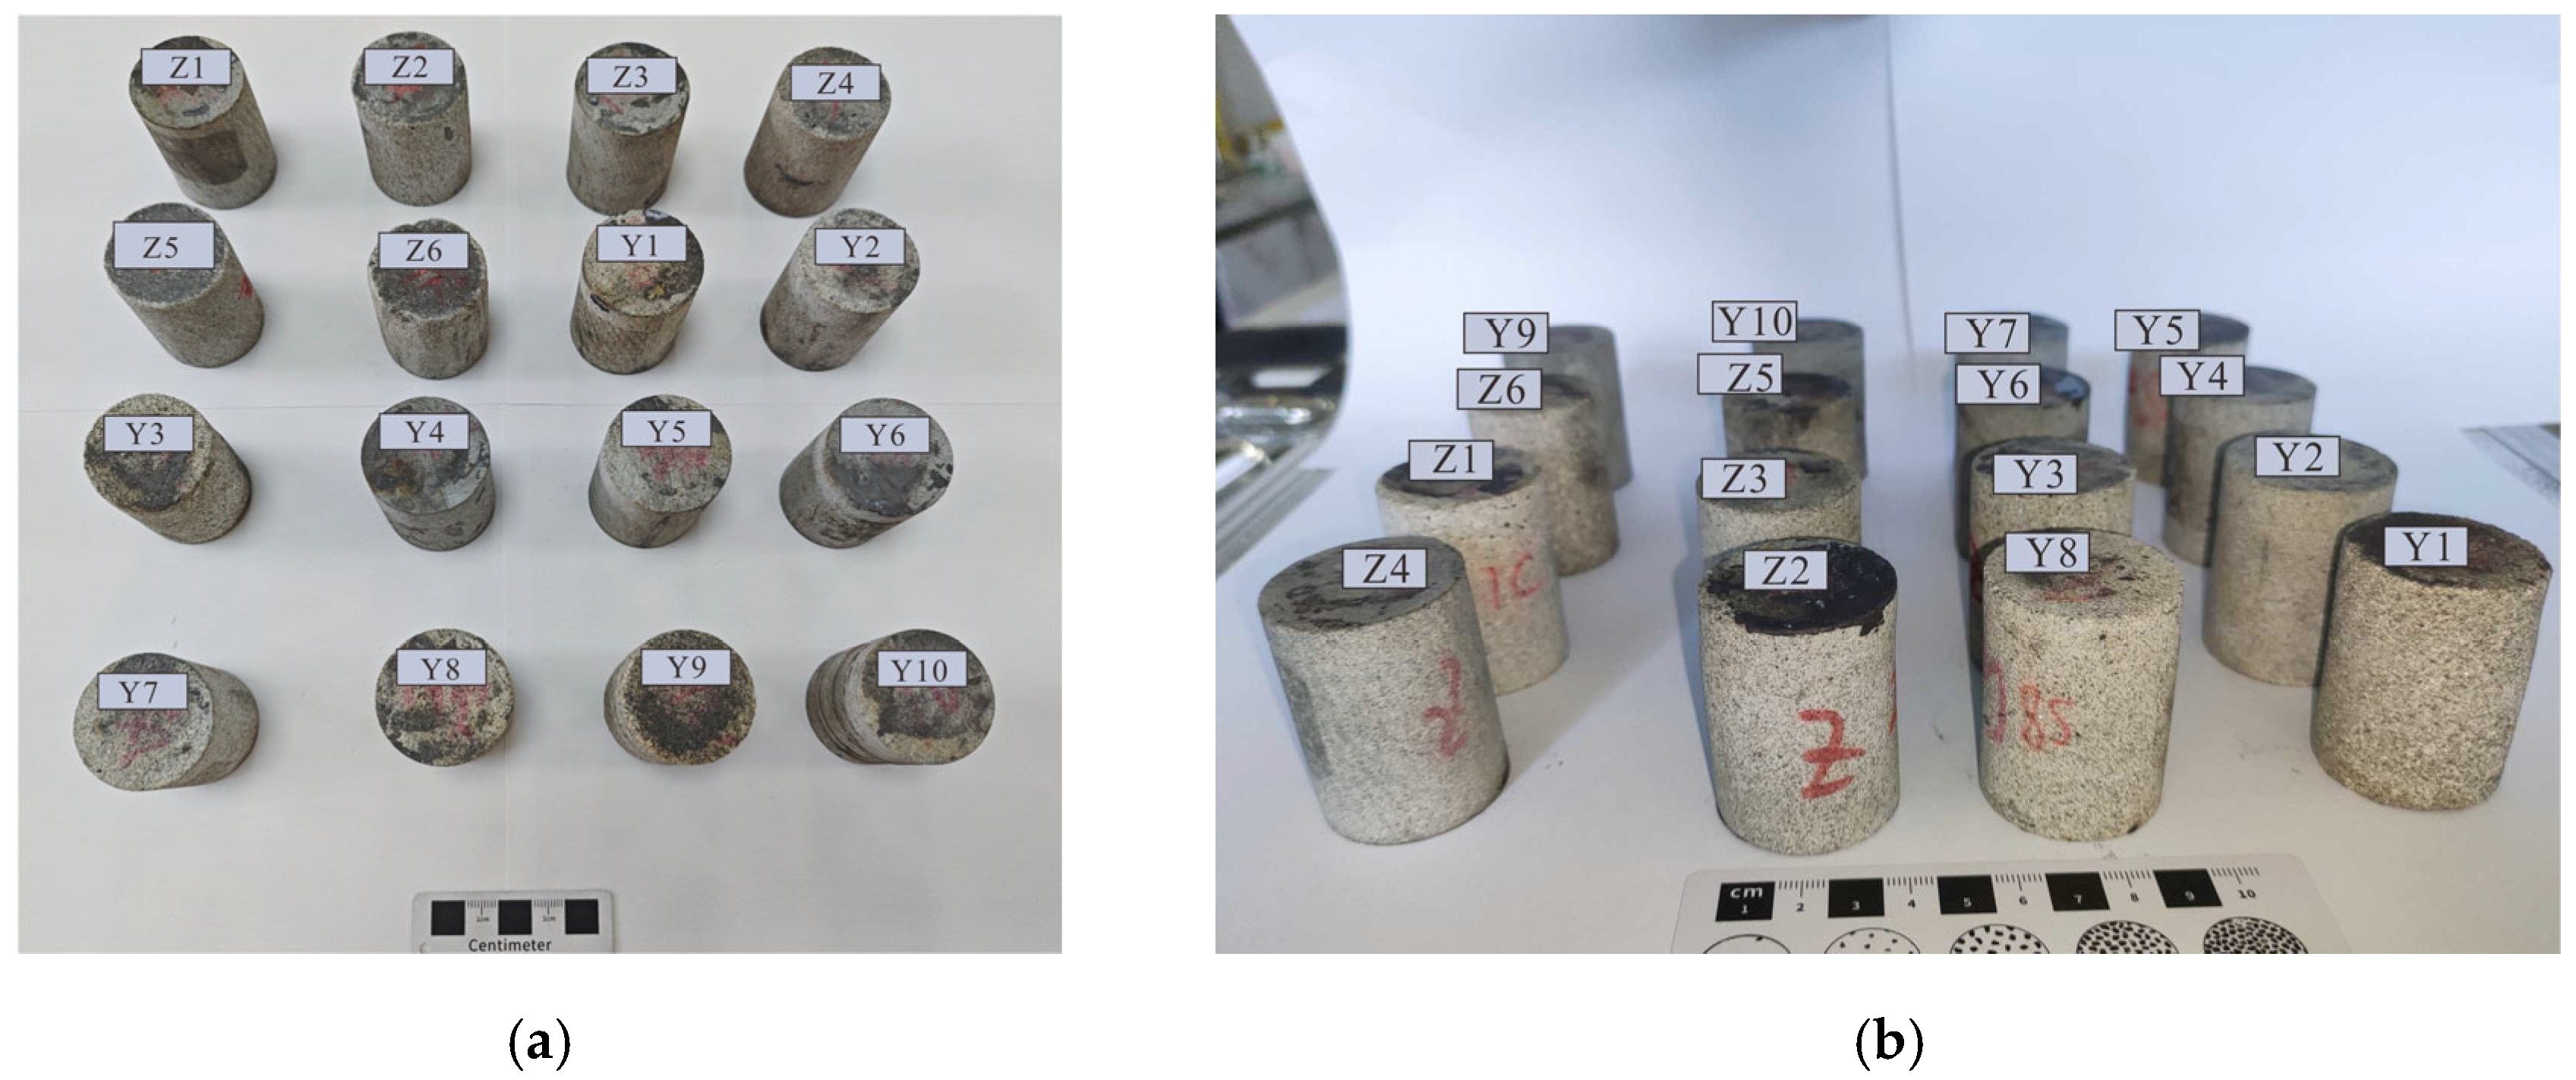
3.2. Sample Collection and Preparation

Sandstone core samples from the Zhiluo and Yan’an Formations were collected from borehole BK312 (Figure 3a). The Zhiluo Formation samples consisted of gray and gray-green medium-grained sandstones, fine-grained sandstones, and siltstones, whereas the Yan’an Formation samples consisted of gray and gray-white medium-grained sandstones and siltstones. All samples were randomly selected and exhibited no macroscopically visible anisotropic features, fractures, or weathering effects.
The extracted sandstone core samples were processed into cylindrical specimens measuring 38 mm in diameter and 50 mm in height, and oriented perpendicular to the overlying strata. A total of six sandstone samples from the Zhiluo Formation and ten from the Yan’an Formation were collected for analysis (Figure 4). After cutting and surface preparation, the sandstone samples were placed in a constant-temperature drying oven at 105 °C for 24 h until their weight stabilized. The dried sandstone samples were then subjected to further testing.
For XRD analysis, rock fragments generated during cylindrical specimen processing were ground into powder and sieved through a 325-mesh sieve to complete the preparation.

4. Results

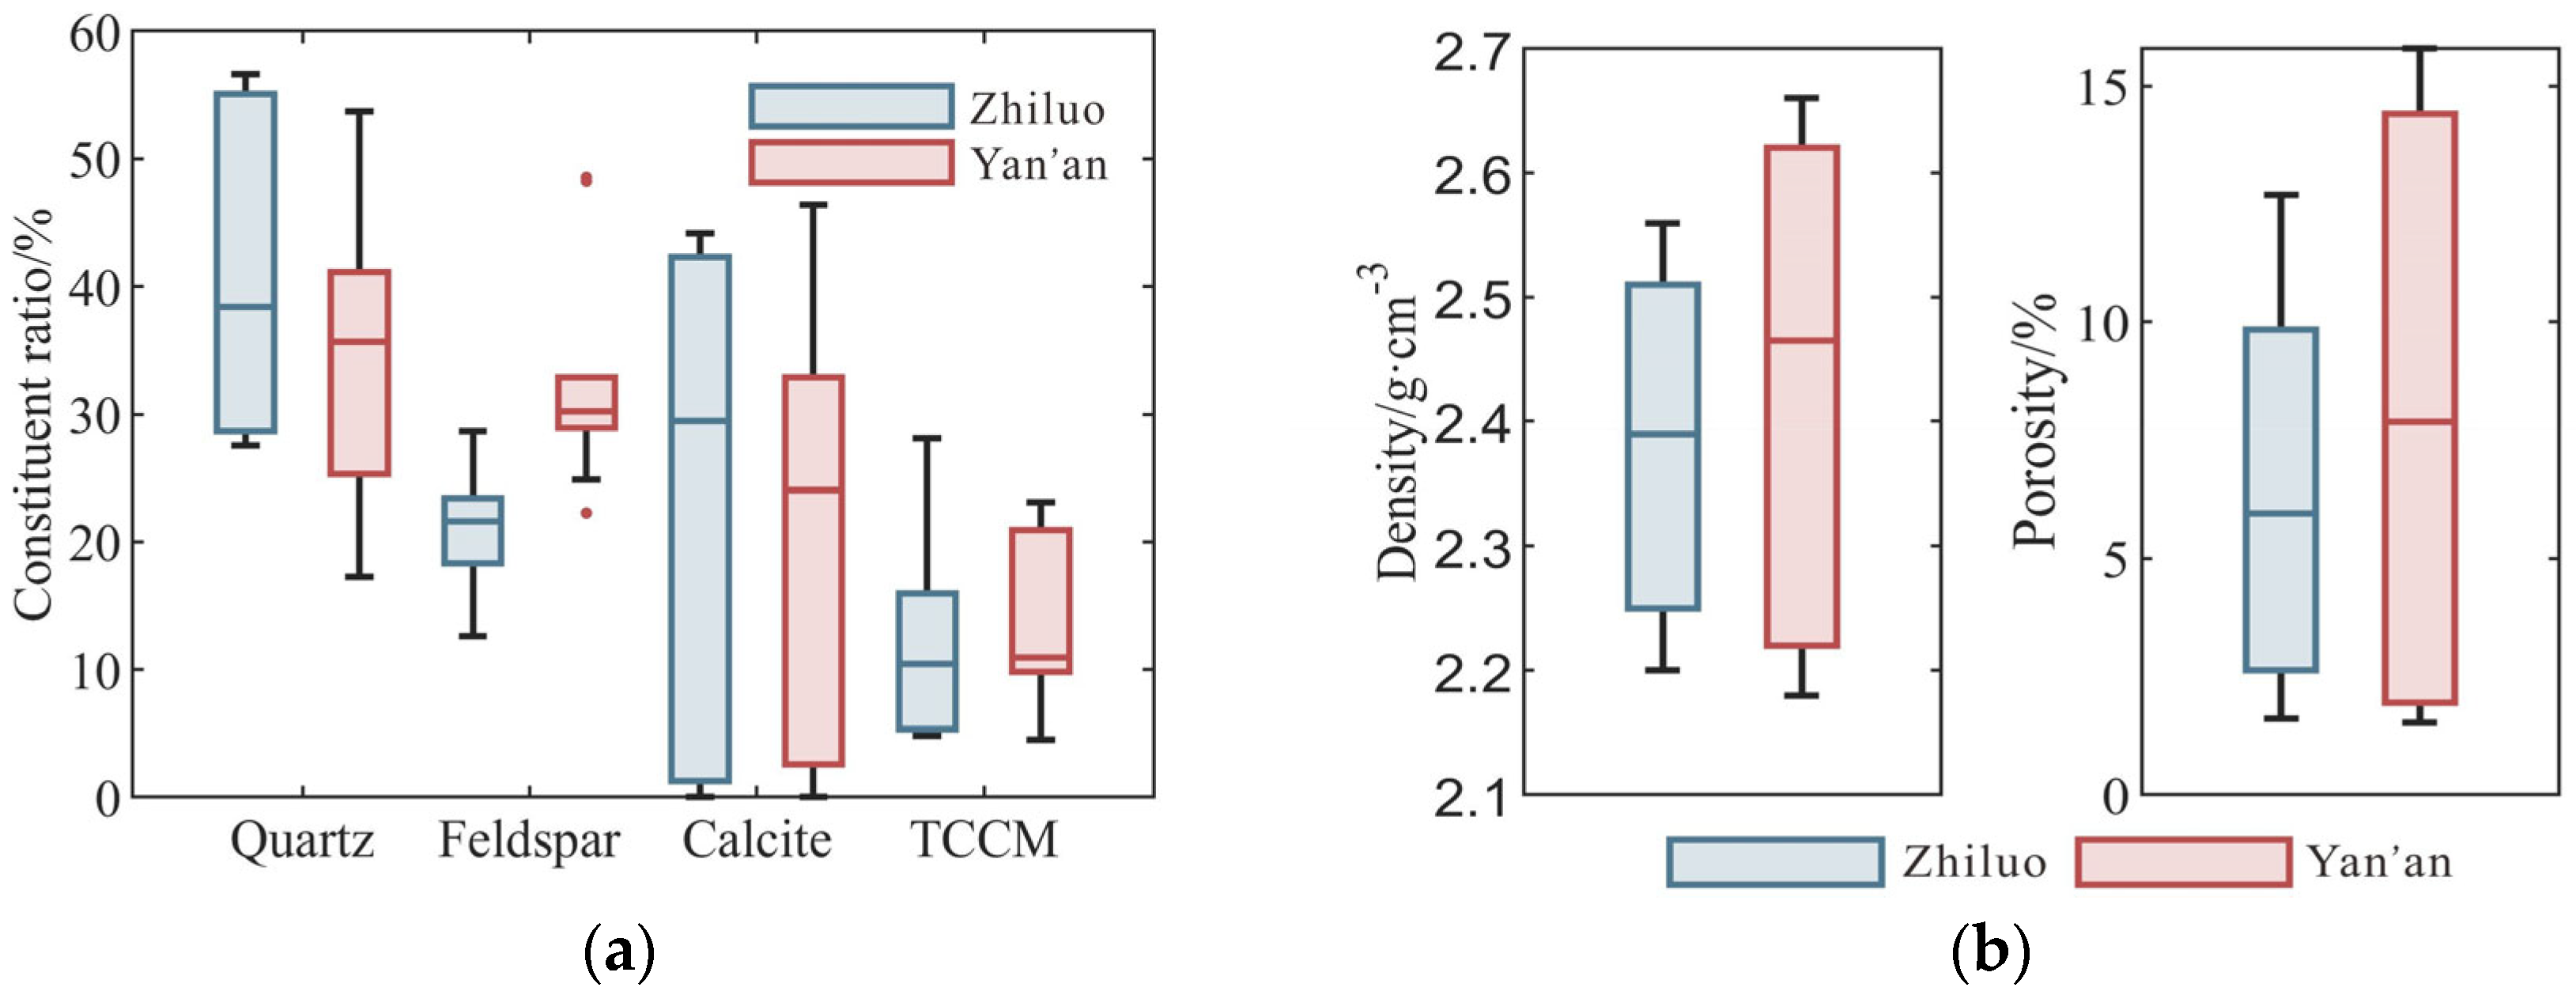
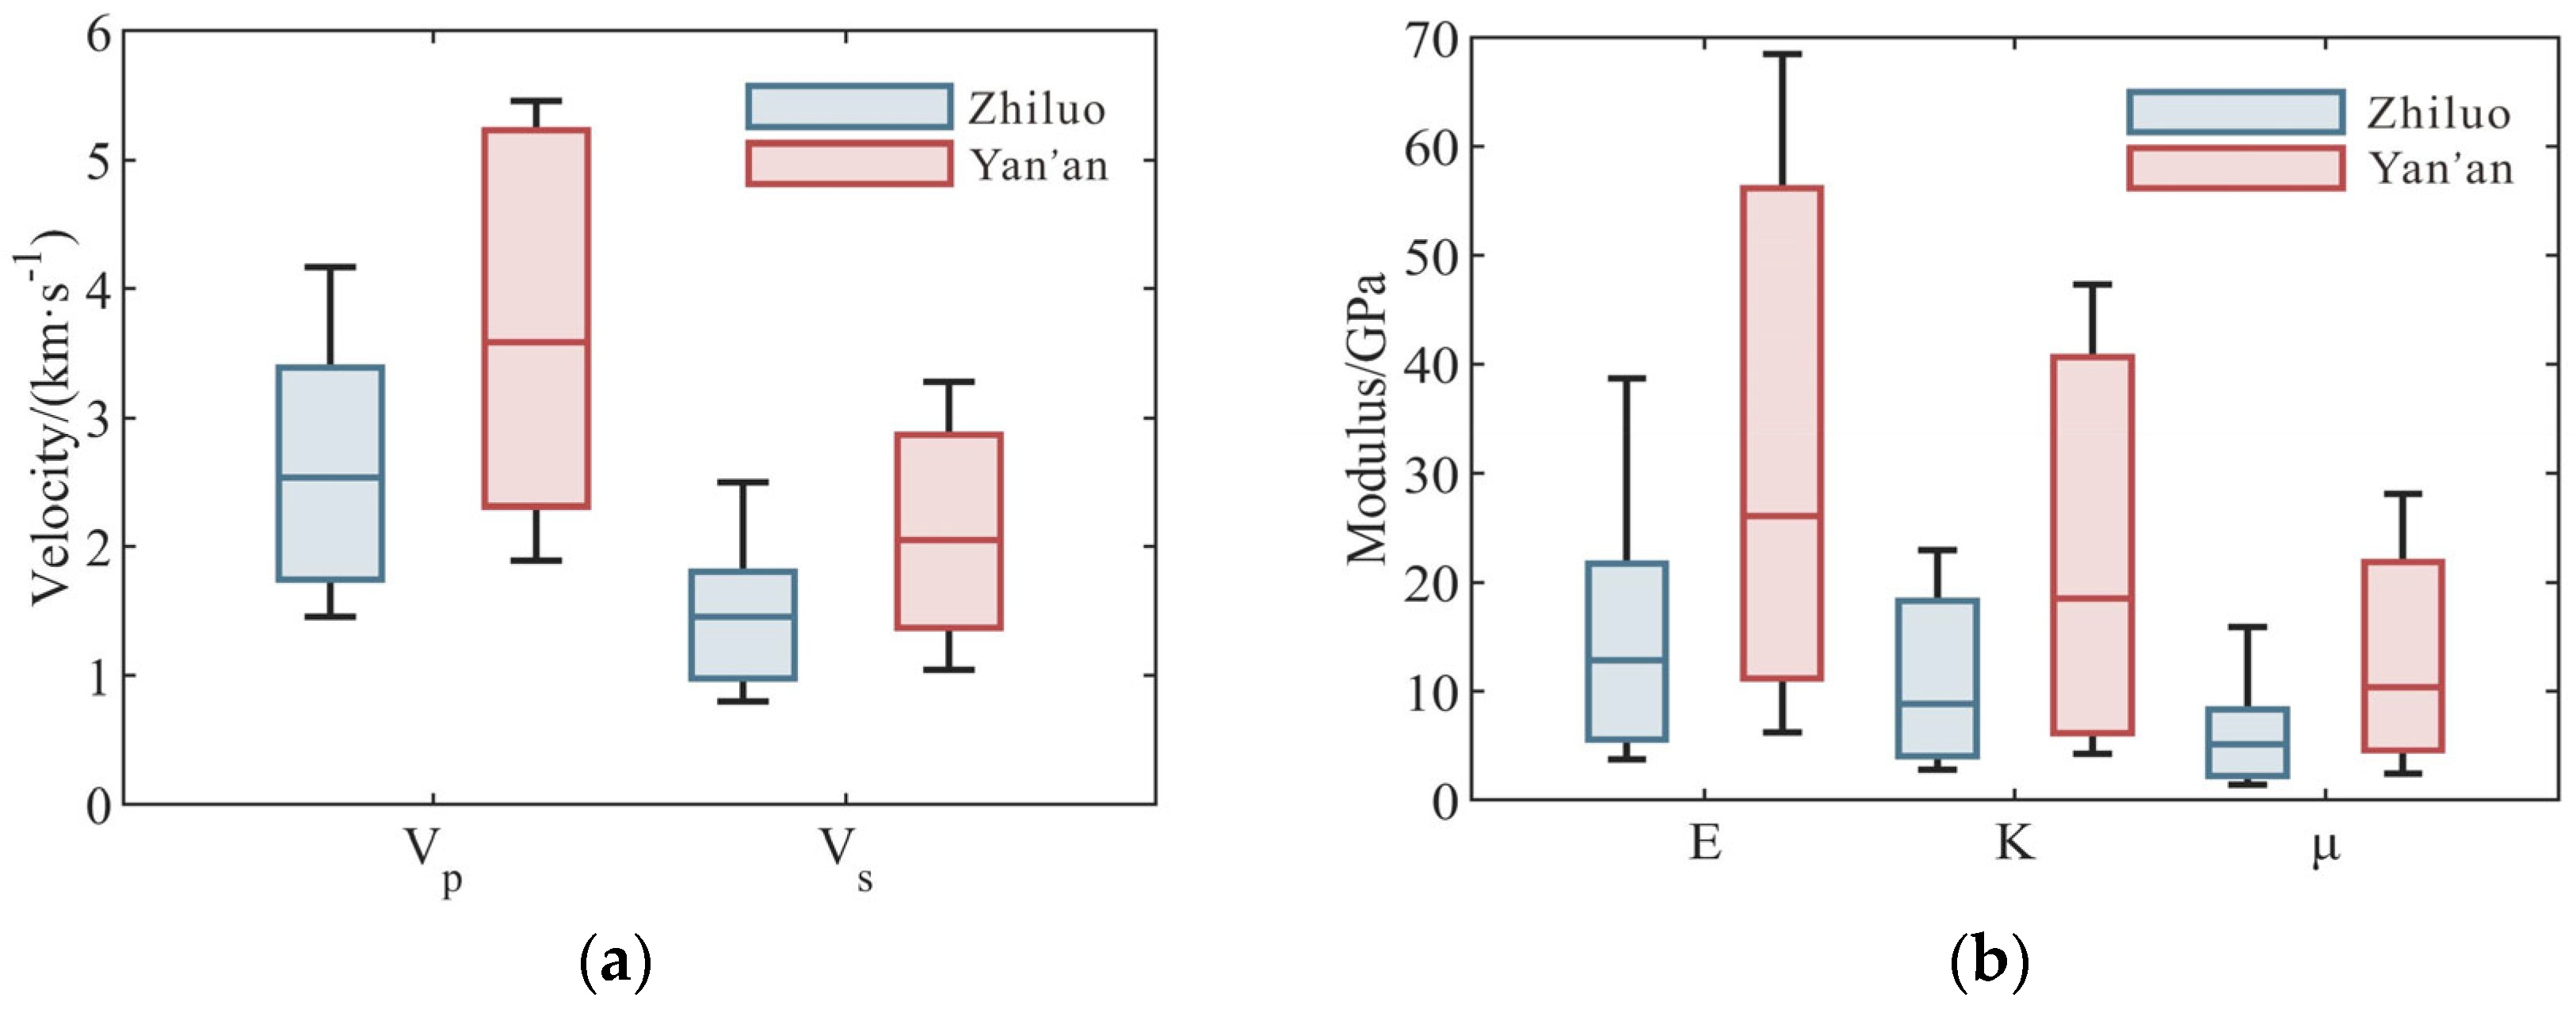
4.1. Basic Physical Properties

The material composition and physical parameters of the samples are shown in Table 1. The sandstones were predominantly feldspathic quartz sandstones composed mainly of quartz, feldspar, calcite, and clay minerals (total clay mineral content, TCCM). Kaolinite was the dominant clay mineral. The quartz content ranged from 17% to 57%, feldspar from 12% to 48%, calcite from 0% to 46%, and TCCM from 4% to 22%. Trace amounts of dolomite and pyrite were present in some of the samples. In general, the Zhiluo and Yan’an Formations exhibited similar mineralogical characteristics, reflecting their comparable depositional environments (Figure 5a).
The bulk density of the Zhiluo Formation in the Jurassic system ranged from 2.20 g/cm3 to 2.56 g/cm3, with a median of 2.39 g/cm3. The bulk density of the Yan’an Formation ranged from 2.18 g/cm3 to 2.66 g/cm3, with a median of 2.47 g/cm3. The porosity of the Zhiluo Formation ranged from 1.62% to 12.68%, with a median of 5.95%. The porosity of the Yan’an Formation ranged from 1.53% to 15.79%, with a median of 7.87%. In general, the median density and porosity of the Zhiluo Formation were slightly lower than those of the Yan’an Formation, as the latter experienced more prolonged and intense diagenesis (Figure 5b).
The VP of the Zhiluo Formation ranged from 1.46 km/s to 4.17 km/s, with a median of 2.53 km/s. The VS ranged from 0.80 km/s to 2.50 km/s, with a median of 1.46 km/s. The VP of the Yan’an Formation ranged from 1.89 km/s to 5.46 km/s, with a median of 3.58 km/s. The VS ranged from 1.05 km/s to 3.28 km/s, with a median of 2.05 km/s. The median VP and VS values of the Zhiluo Formation were 29.33% and 28.78% lower, respectively, than those of the Yan’an Formation (Figure 6a). These results are consistent with the density measurements obtained.
After measuring the elastic parameters of density, VP, and VS, we calculated the elastic moduli for the samples from the Zhiluo and Yan’an Formations using isotropic elastic theory [28]. The Zhiluo Formation exhibited Young’s modulus (E) values ranging from 3.72 GPa to 38.7 GPa, with a median of 12.86 GPa; bulk modulus (K) ranged from 2.83 GPa to 22.93 GPa (median: 8.86 GPa); and shear modulus (μ) varied between 1.45 GPa and 15.88 GPa (median: 5.12 GPa). In contrast, the Yan’an Formation showed higher values: E = 6.21 − 68.54 GPa (median: 26.05 GPa), K = 4.23 − 47.32 GPa (median: 18.51 GPa), and μ = 2.43 − 28.12 GPa (median: 10.38 GPa) (Figure 6b). The median values of the Zhiluo Formation were 50.63% lower for E, 51.85% lower for K, and 50.67% lower for μ than those of the Yan’an Formation. These differences in mechanical properties reflect the weaker cementation observed in the Zhiluo Formation.

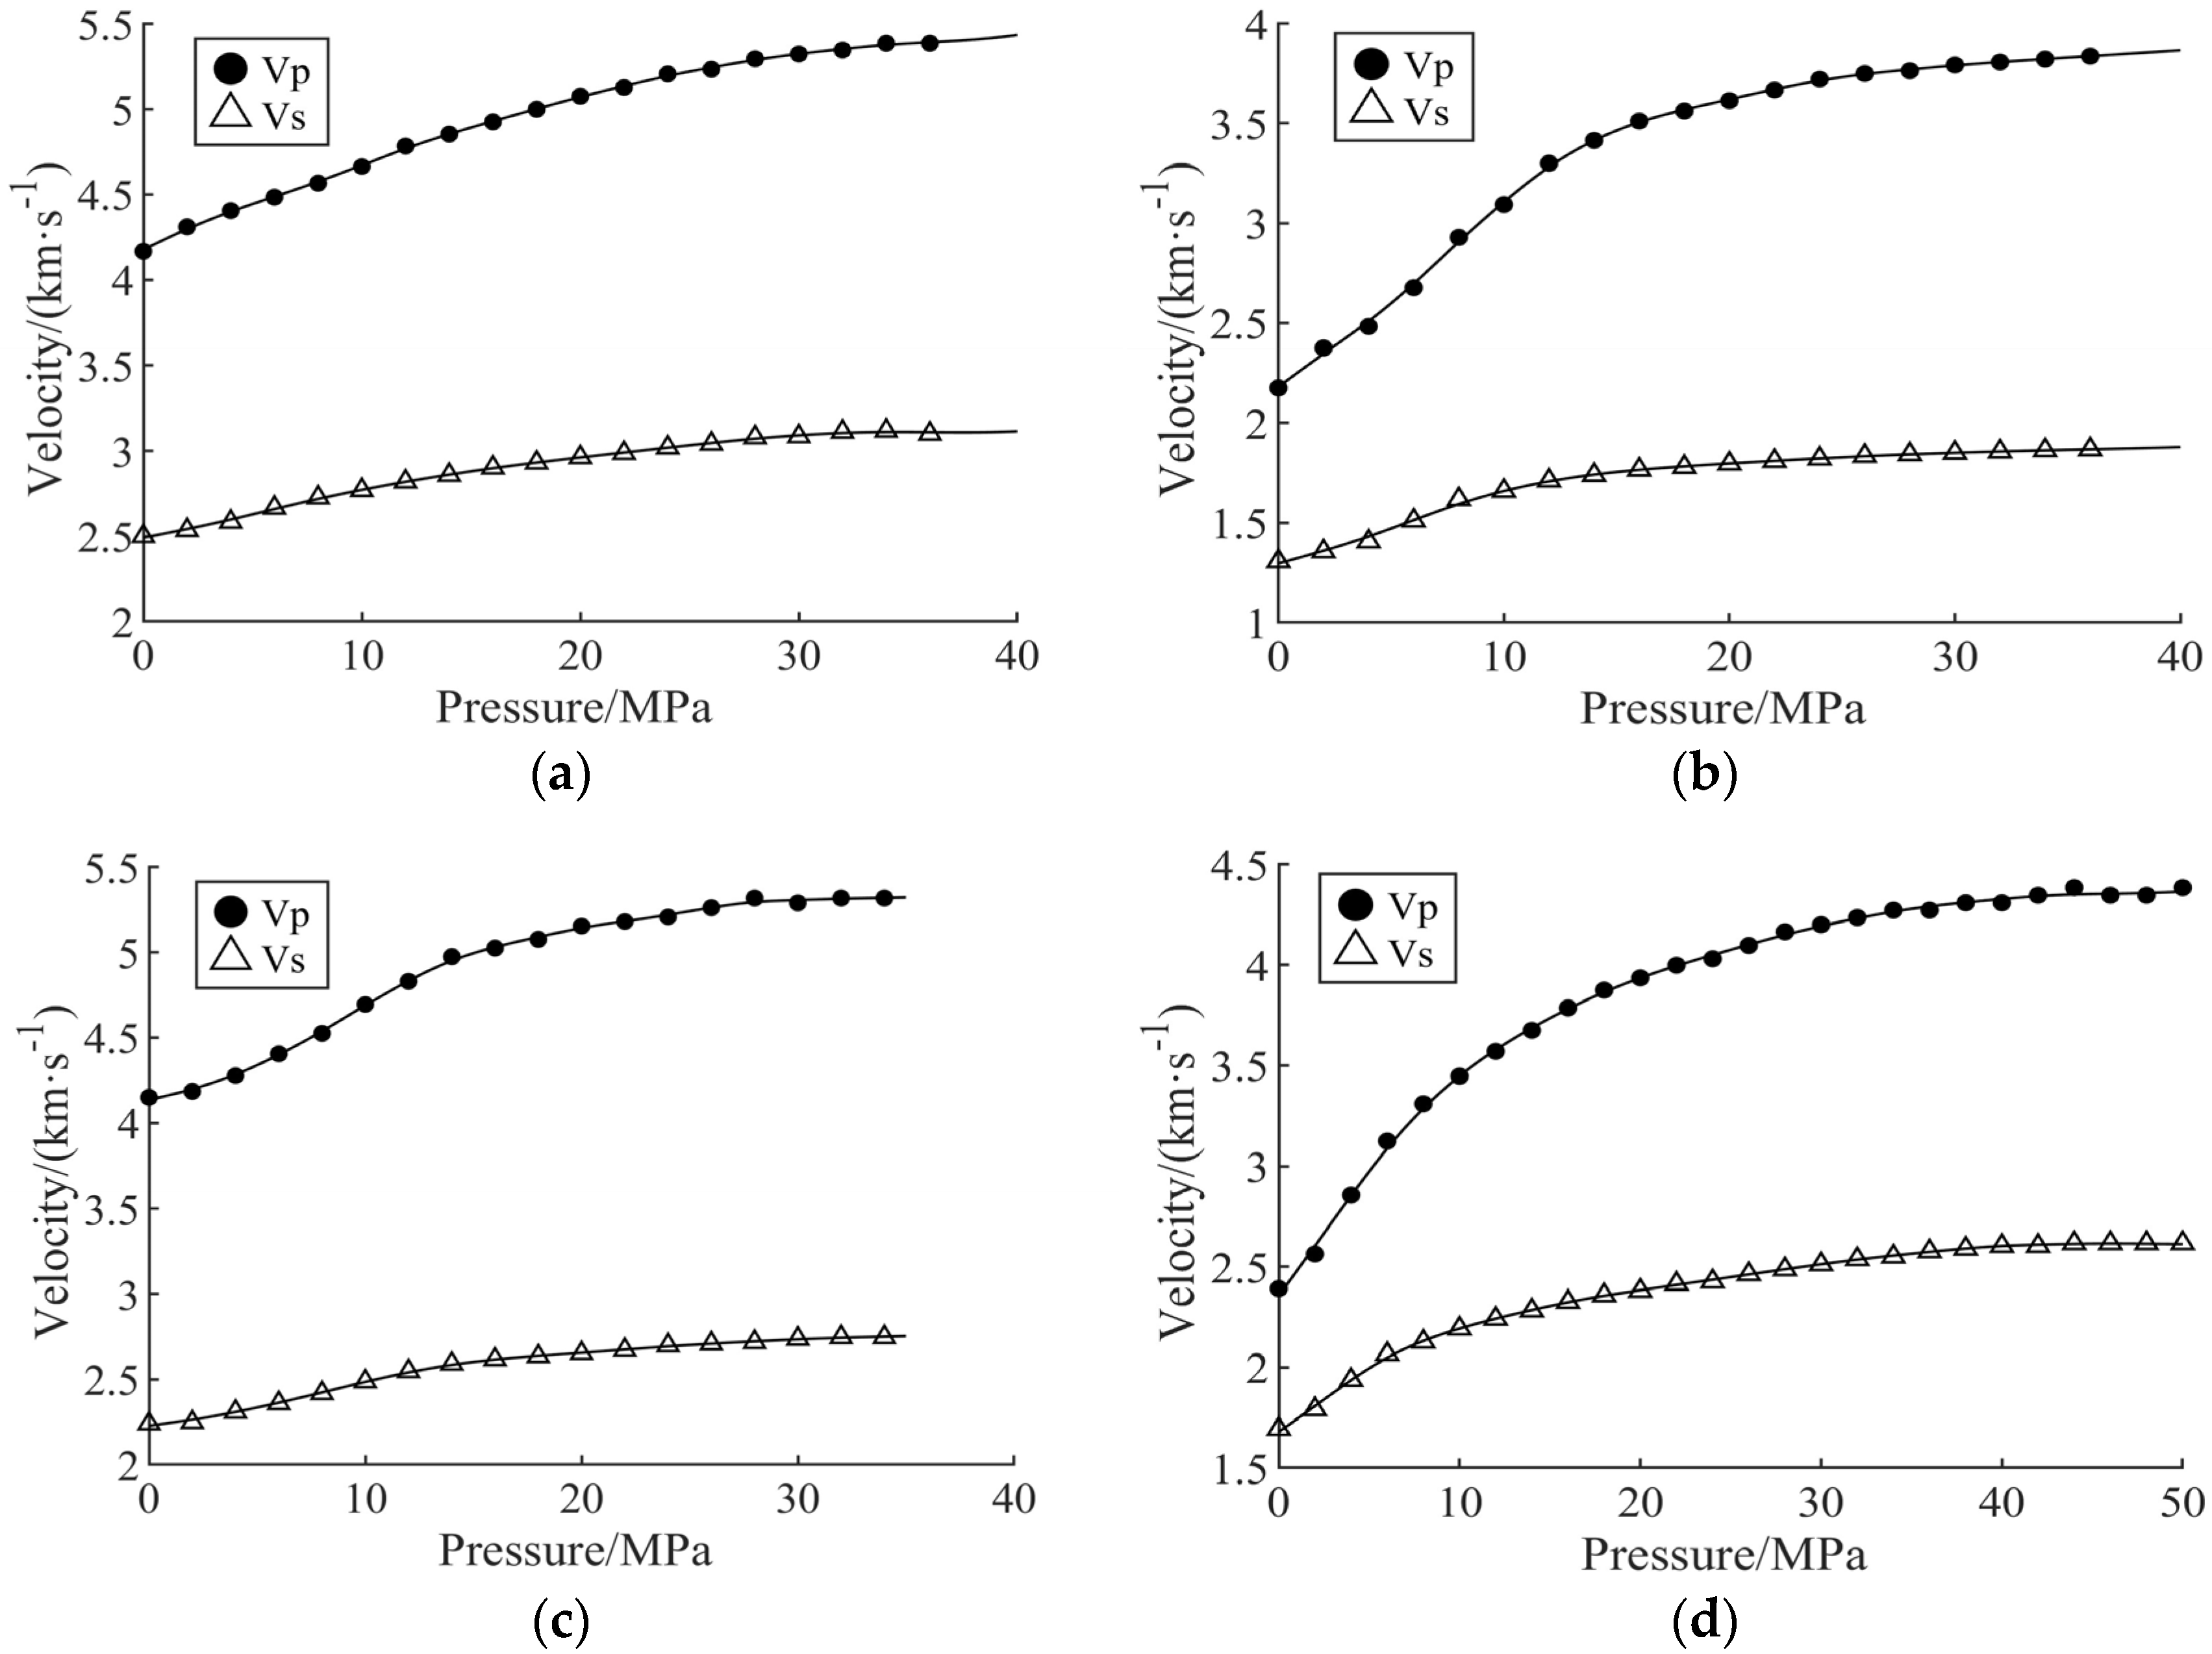
4.2. Stress-Dependent Velocity Distribution Characteristics

As outlined in the M-T theory framework (Section 2.2), the stress-dependent velocity distribution characteristics encode critical pore structure information. To characterize the pore systems of Jurassic sandstones in the northeastern Ordos Basin, we analyzed four representative cylindrical samples from the Zhiluo and Yan’an Formations using the experimental methodology detailed in Section 2.3. The Zhiluo Formation samples included Z-1 (φ = 2.63%) and Z-4 (φ = 12.68%), and the Yan’an Formation samples included Y-1 (φ = 3.37%) and Y-3 (φ = 14.39%). The confining pressure was applied incrementally from 0 MPa to 40 MPa in 2 MPa steps. The stress-dependent velocity measurements are shown in Figure 7. Both the Zhiluo and Yan’an Formation sandstones exhibited identical trends: VP and VS increased rapidly with effective stress at low pressures, then grew at a slower rate at intermediate pressures, and eventually stabilized at high pressures. Compared with low-porosity rocks, high-porosity rocks exhibited lower initial velocities and greater velocity variation ranges. These differences are consistent with rock physics theory, which attributes such velocity changes to the progressive closure of pores under increasing pressures. More extensive pore closure in high-porosity rocks leads to more significant velocity variations.
To characterize the distributions of stiff and soft pores in the sandstones, we first calculated the background matrix moduli using the VRH model. The mineral compositions of the sandstone samples were determined using the XRD method detailed in Section 2.3, and the elastic moduli of the individual minerals were referenced from the Rock Physics Handbook [36]. By substituting the volumetric proportion of the mineral components into Equation (1), we obtained the background matrix modulus MVRH for each sample. In some cases, minor adjustments were made to the matrix modulus to optimize the fit with the rock physics model. The derived bulk (K) and shear (μ) moduli were as follows: Z-1 (K = 59.16 GPa, μ = 28.69 GPa), Z-4 (K = 38.26 GPa, μ = 12.05 GPa), Y-1 (K = 51.71 GPa, μ = 22.53 GPa), and Y-3 (K = 35.10 GPa, μ = 20.77 GPa). The observed variations in the matrix moduli correlate with mineralogical differences. Samples Y-1 and Z-1 exhibited higher bulk moduli than Y-3 and Z-4, consistent with their higher calcite content revealed by the XRD analysis (Table 1). This alignment is expected, given calcite’s relatively high bulk modulus among common rock-forming minerals.
For the calculation of stiff porosity and equivalent aspect ratio (ASP) using the M-T model, we selected velocity measurements obtained under high-pressure-stabilized conditions. These conditions ensure soft pore closure, thereby enabling the computation of the elastic moduli representing only the rock matrix and stiff pores. By substituting these elastic moduli and the MVRH into Equation (2), we derived analytical solutions for the stiff porosity and equivalent ASP (Table 2).
To characterize the soft pore distributions, we first established the cumulative crack density as a function of the effective stress. This functional relationship provides the foundation for quantifying the stress-dependent soft-pore closure and its influence on the elastic properties. The dry-rock bulk (Kd) and shear (μd) moduli were calculated from the velocity measurements at each pressure increment. These moduli were then substituted into Equation (7) to determine the cumulative crack density at the corresponding pressure level. In dry rocks, the cumulative crack density of the soft pores exhibited exponential decay with increasing effective stress (Figure 8). Notably, each sample exhibited unique parameters in the exponential fitting function, demonstrating the absence of a universal stress-cumulative crack density relationship.
To determine the crack density (cdk) distribution characteristics, the cumulative crack densities were substituted into Equation (7) under varying pressure conditions. Similarly, the ASP distribution αi at each pressure increment was derived by substituting the corresponding elastic moduli into Equation (7). By substituting cdk and αi into Equation (8), the soft porosity distribution under varying effective stress conditions was obtained (Figure 9). All four samples exhibited similar trends in soft pore distribution: as the pressure increased, both the soft porosities and the ASP of soft pores decreased progressively. This analysis provided the stiff porosity, equivalent ASP of stiff pores, soft porosity distribution, and soft pore ASP distribution.

5. Discussion

5.1. Method Validations

To validate the improved M-T model, we compared the model-derived total porosity (sum of soft and stiff porosities) with the NMR-measured total porosity (Section 2.3), as summarized in Table 2. The M-T model yielded total porosities of 2.63%, 12.05%, 3.88%, and 13.3% for samples Z-1, Z-4, Y-1, and Y-3, respectively, with absolute errors of 0%, 0.63%, 0.51%, and 1.09% relative to the NMR measurements (Figure 10a). The corresponding relative errors were 0%, 4.97%, 15.13%, and 7.57%. The close agreement between the model-derived and NMR-measured values demonstrates the reliability of this method for characterizing the pore distribution in Jurassic sandstones.
A comparison of the soft porosity and soft pore ASP distributions among the sandstone samples revealed that high-porosity sandstones exhibited both a greater proportion of soft pores and a broader range of ASPs (Figure 10b). The Zhiluo and Yan’an Formation sandstones showed no systematic differences attributable to geological age (Table 2).
Under increasing effective stress, soft pores close sequentially according to their ASP values, from the smallest to the largest, resulting in a gradual stress-dependent increase in wave velocities. High-porosity rocks (Z-4 and Y-3) exhibited rapid changes in pore volume components within the low-ASP range, while low-porosity rocks (Z-1 and Y-1) maintained more uniform pore volume distributions with smaller ASP values (Figure 10b). This contrast demonstrates that (1) low-porosity rocks display near-linear velocity-pressure trends (Figure 7a), reflecting gradual closure of evenly distributed pores, and (2) high-porosity rocks experience accelerated pore closure at low pressures (0–20 MPa), resulting in distinct nonlinear velocity-pressure relationships (Figure 7b). The calculated soft pore distributions align with the established rock physics theory [39], further validating the methodological reliability.

5.2. Relationship Between Pore Characteristics and Physical Properties

Rock physics analysis of the Zhiluo and Yan’an Formation sandstone samples revealed similar mineral compositions in the two formations. However, the Zhiluo Formation sandstones exhibited slightly lower density (Figure 5) and significantly reduced elastic moduli compared with the Yan’an Formation sandstones (Figure 6). In the study area, the Zhiluo Formation consists predominantly of braided river deposits, while the Yan’an Formation is primarily composed of deltaic sediments. Despite these distinct depositional environments, their comparable mineralogy suggests a common sediment source for both formations. The Zhiluo Formation’s lower elastic moduli and density indicate less advanced diagenesis alteration and weaker cementation relative to the Yan’an Formation. This conclusion is consistent with previous findings in the literature [44].
Cross-plot analyses were performed to examine the relationships between the pore structure characteristics and fundamental physical properties. The results revealed that the stiff and soft porosities are controlled by the mineral composition. The stiff and soft porosities showed an inverse correlation with calcite but a positive correlation with quartz abundance (Figure 11a). The equivalent aspect ratio of the stiff pores showed positive correlations with the Poisson’s ratio and TCCM (Figure 11b). P-wave velocity is jointly governed by the ASP of soft pores and stiff porosity (Figure 11c). Notably, sandstones with higher VP values are systematically characterized by lower dominant soft pore ASP and reduced stiff porosities.

5.3. Relationship Between Soft Porosity and NMR T2 Relaxation Spectrum

The NMR T2 relaxation time spectrum provides dual information about the pore structure and fluid characteristics, enabling a quantitative representation of the pore size distributions in the sandstone samples. The T2 relaxation time curve exhibits a proportional relationship with pore size, allowing the classification into three distinct categories: micropores, mesopores, and macropores/microcracks.
Figure 12 shows the T2 spectra of sandstone samples Y-1 and Y-3. The high-porosity sample Y-3 exhibited a distinct trimodal distribution, where mesopores were the dominant pore type. In contrast, the low-porosity sample Y-1 showed less distinct separation between micropores and mesopores, while maintaining a trimodal distribution mainly composed of micropores and mesopores.
Using a threshold value of 351 ms, we calculated the cumulative pore volume associated with the third relaxation peak. The analysis yielded third-peak porosities of 0.02% and 0.30% for samples Y-1 and Y-3, respectively. Notably, these values show precise agreement with the M-T model-derived soft porosities presented in Table 1, demonstrating a direct correspondence between the model-derived soft porosity and NMR-measured macropore/microcrack porosity.
The M-T model-based inversion offers some advantages over conventional NMR analysis by enabling the quantitative characterization of pore geometry parameters (e.g., ASP) that are beyond the detection capability of standard NMR techniques.

5.4. Influence of Sedimentation and Diagenesis

Sandstone pores can be categorized into two genetic types: primary and secondary pores. Primary pores include primary intergranular pores, residual intergranular pores, and interstitial micropores. Secondary pores comprise dissolution-related pores (intergranular and intraparticle), extra-large pores, authigenic cementation-induced intergranular micropores, and tectonically generated microfractures. Previous studies have indicated that primary pores dominate the pore system, accounting for >60% of the total porosity, while secondary pores make relatively minor contributions. Sedimentation and diagenetic processes constitute the primary controls on sandstone pore structure characteristics in the study area, with tectonic activity showing negligible influence [3,45].
Figure 13 illustrates the sedimentary and diagenetic evolution characteristics of the Jurassic System in the Ordos Basin [46,47,48]. The Jurassic sandstones in the study area experienced four principal diagenetic processes: mechanical compaction, clay mineral cementation (predominantly kaolinite), carbonate cementation (mainly calcite), and dissolution. Microstructural analysis revealed that: (1) stiff pores, quartz, and calcite primarily formed during early diagenesis; (2) sandstone framework particles showed point or point-line contacts; and (3) pore spaces exhibited concavo-convex morphologies. These characteristics demonstrate a composite pore system comprising both stiff and soft pores, with stiff pores predominating in the early diagenetic pore network.
Quartz is the main framework mineral in sandstone, whereas calcite fills the framework during early diagenesis. Calcite pore-filling reduces the relative content of quartz and diminishes pore space, consistent with the trends observed in the cross-plots (Figure 11a). Clay cementation occurs during both the early and middle diagenetic stages, primarily manifested as kaolinite infiltration into primary or secondary pores along the migration pathways. Pores with smaller ASP are more likely to become interconnected pathways for kaolinite filling. Increased clay content leads to greater infilling of low-ASP pores, which is experimentally manifested as an increase in the equivalent ASP of the stiff pores (Figure 11b). According to Figure 11a, higher stiff porosity is correlated with elevated quartz content and reduced calcite content. Given that quartz exhibits a lower VP than calcite, this mineralogical association may partially account for the observed lower VP in highly stiff porosity rocks. Furthermore, rocks with a higher dominant soft pore ASP show diminished VP, which is likely attributable to the preferential infilling of low-ASP pores by clay cementation (Figure 11c). The trends exhibited in the cross-plots are consistent with the diagenetic evolutionary characteristics of the study area. These cross-plots reflect, to a certain extent, the interrelationships among the pore characteristics, mineral compositions, and elastic parameters.

5.5. Implications for CO2 Storage and Safe Coal Mining

The selection of CO2 storage sites requires adherence to established screening criteria, prioritizing geological formations that balance storage capacity, injectivity, trapping mechanisms, containment reliability, and cost-effectiveness. An optimal site typically features a high storage capacity, a depth exceeding 800 m, and reservoir properties such as porosity > 10% (ideally exceeding 20%) and permeability sufficient to facilitate efficient CO2 migration. Geologically favorable formations include quartz-rich sandstones and carbonate rocks with reservoir thicknesses > 50 m and strong lateral continuity, ensuring volumetric integrity. Critical mineralogical characteristics involve Ca-, Mg-, or Fe-rich framework minerals (e.g., feldspars, clays, micas, and iron oxides) that enhance chemical trapping through mineralization. Additionally, robust containment necessitates a laterally extensive seal layer (caprock) with a thickness of >100 m, minimizing leakage risks [49]. These criteria collectively address both technical feasibility and long-term storage security issues.
For the Jurassic strata in the northeastern Ordos Basin studied here, the primary mineral resource is coal. Based on the experimental test results and geological data collected from the target area, the region exhibits the following favorable responses for CO2 storage: the sandstone layers of the Zhiluo Formation have thicknesses > 50 m, exceeding 100 m in localized areas; minimal geological structures ensure strong lateral continuity between reservoirs and overlying seals; porosity > 10% in calcite-free intervals; and lithologies dominated by quartz- and feldspar-rich sandstones, with some intervals showing elevated calcium content (Figure 5). However, the Jurassic strata in this region are constrained by critical limitations, including shallow burial depths (<300 m for most thick sandstone layers), thin caprocks (aquitards), significant velocity variations in sandstones, indicating strong vertical heterogeneity and compromised storage capacity (Figure 6), and interbedded high- and low-porosity sandstones with poor interlayer connectivity. These significant limitations collectively indicate that the target area is unsuitable for CO2 storage in the long term. However, the findings provide a useful tool. Elevated soft and hard pore porosities correlate with higher quartz content and reduced calcite content (Figure 11a), serving as a tool to evaluate various formations with differing mineral compositions as potential hubs for CO2 storage.
The rock physical properties of roof sandstone are closely linked to mine water hazards, thereby impacting the safe extraction of coal resources. The findings of this study provide valuable references for preventing water hazards in Jurassic coal-bearing strata. As shown in Figure 5, Jurassic sandstones can be classified into two categories based on the porosity test results: high-porosity and low-porosity sandstones. High-porosity sandstones correspond geologically to water-bearing sandstone aquifers in the coal seam roof strata. Furthermore, Jurassic sandstones are characterized by late-stage diagenesis and weak cementation. High-porosity sandstones exhibit a lower modulus (Table 1), pronounced stress sensitivity, significant velocity variations under stress (Figure 7), and wider aspect ratio distributions (Figure 9), rendering them prone to fracturing under disturbances and forming water-conducting channels. From the perspective of the “three zones” in coal mining [50], if high-porosity sandstones lie within the caved zone or fractured zone, post-mining water-conducting pathways are likely to develop, increasing water hazard risks. If located in the bending subsidence zone (farther from the coal seam), these sandstones are less susceptible to forming hydraulic connections with the coal seam, even after disturbance.

6. Conclusions

(1)
This study conducted comprehensive laboratory measurements of rock physics and mineralogy properties for Jurassic sandstone samples from coal-bearing strata in the northeastern Ordos Basin. Systematic characterization revealed distinct distributions of the VP, VS, density, bulk modulus, shear modulus, and porosity of the Zhiluo and Yan’an Formations. The measured parameters exhibited relatively broad distributions with characteristically low values, reflecting the unique petrophysical characteristics of these coal-bearing sandstones.
(2)
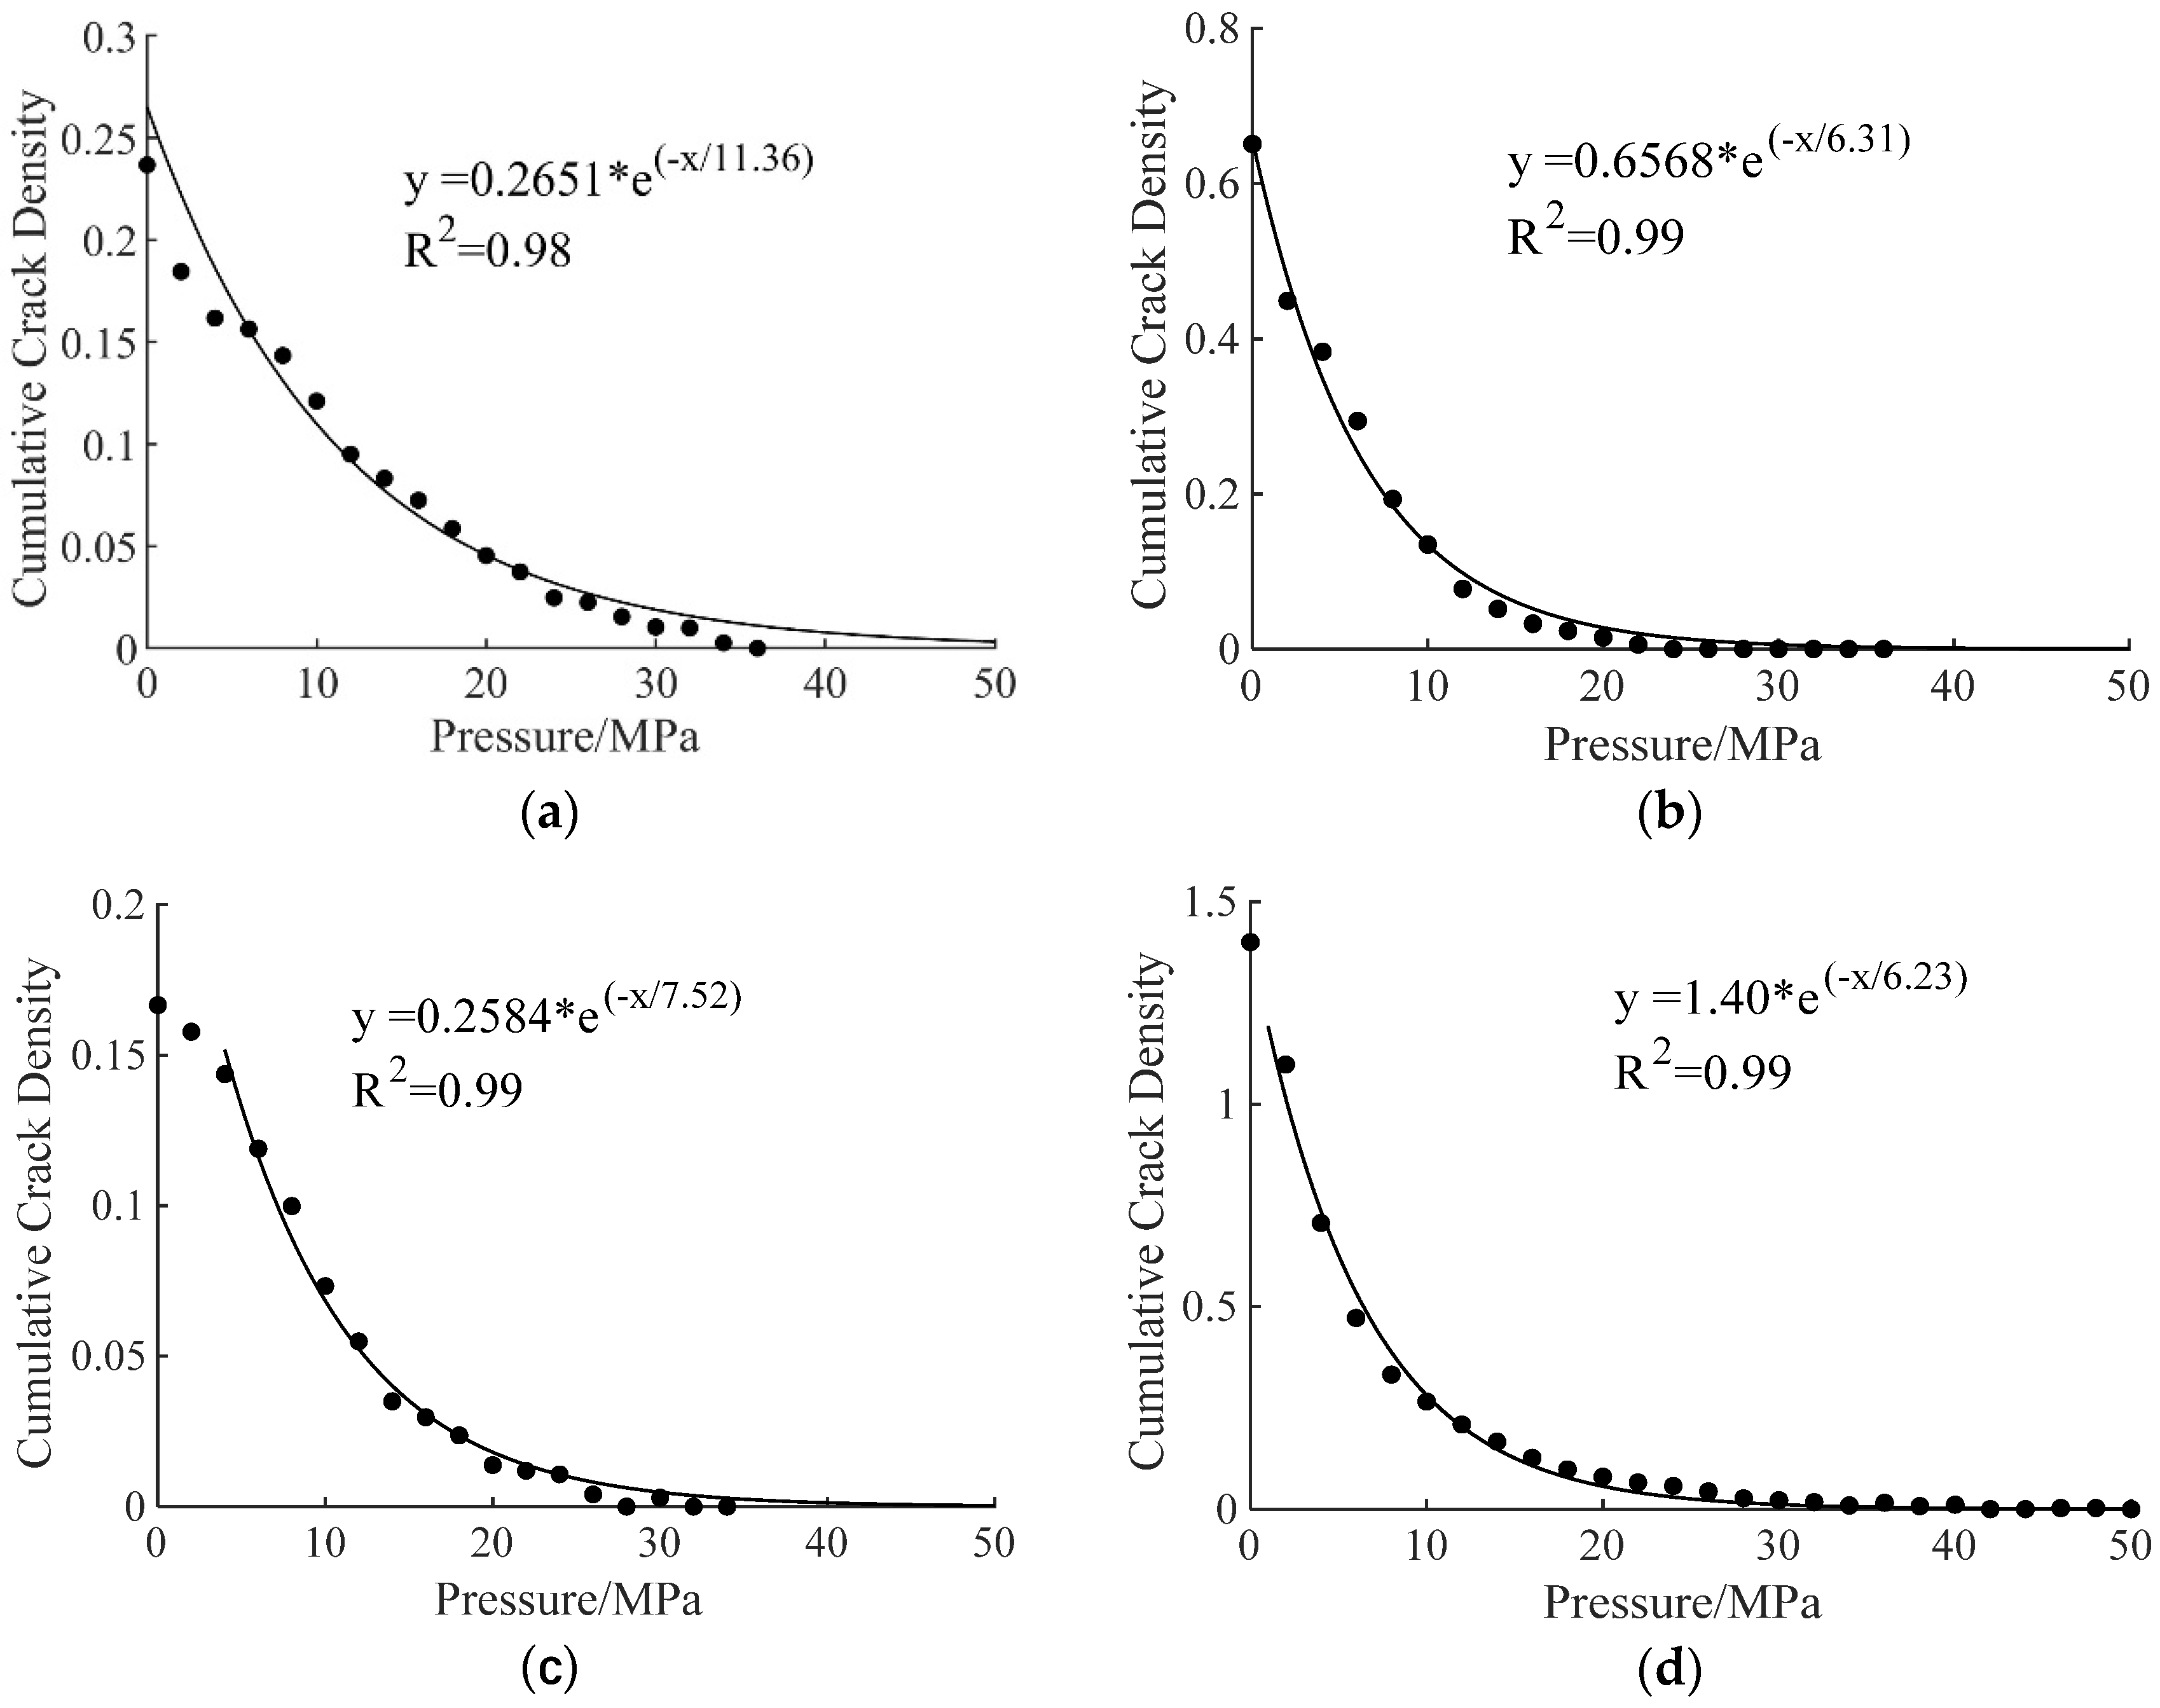
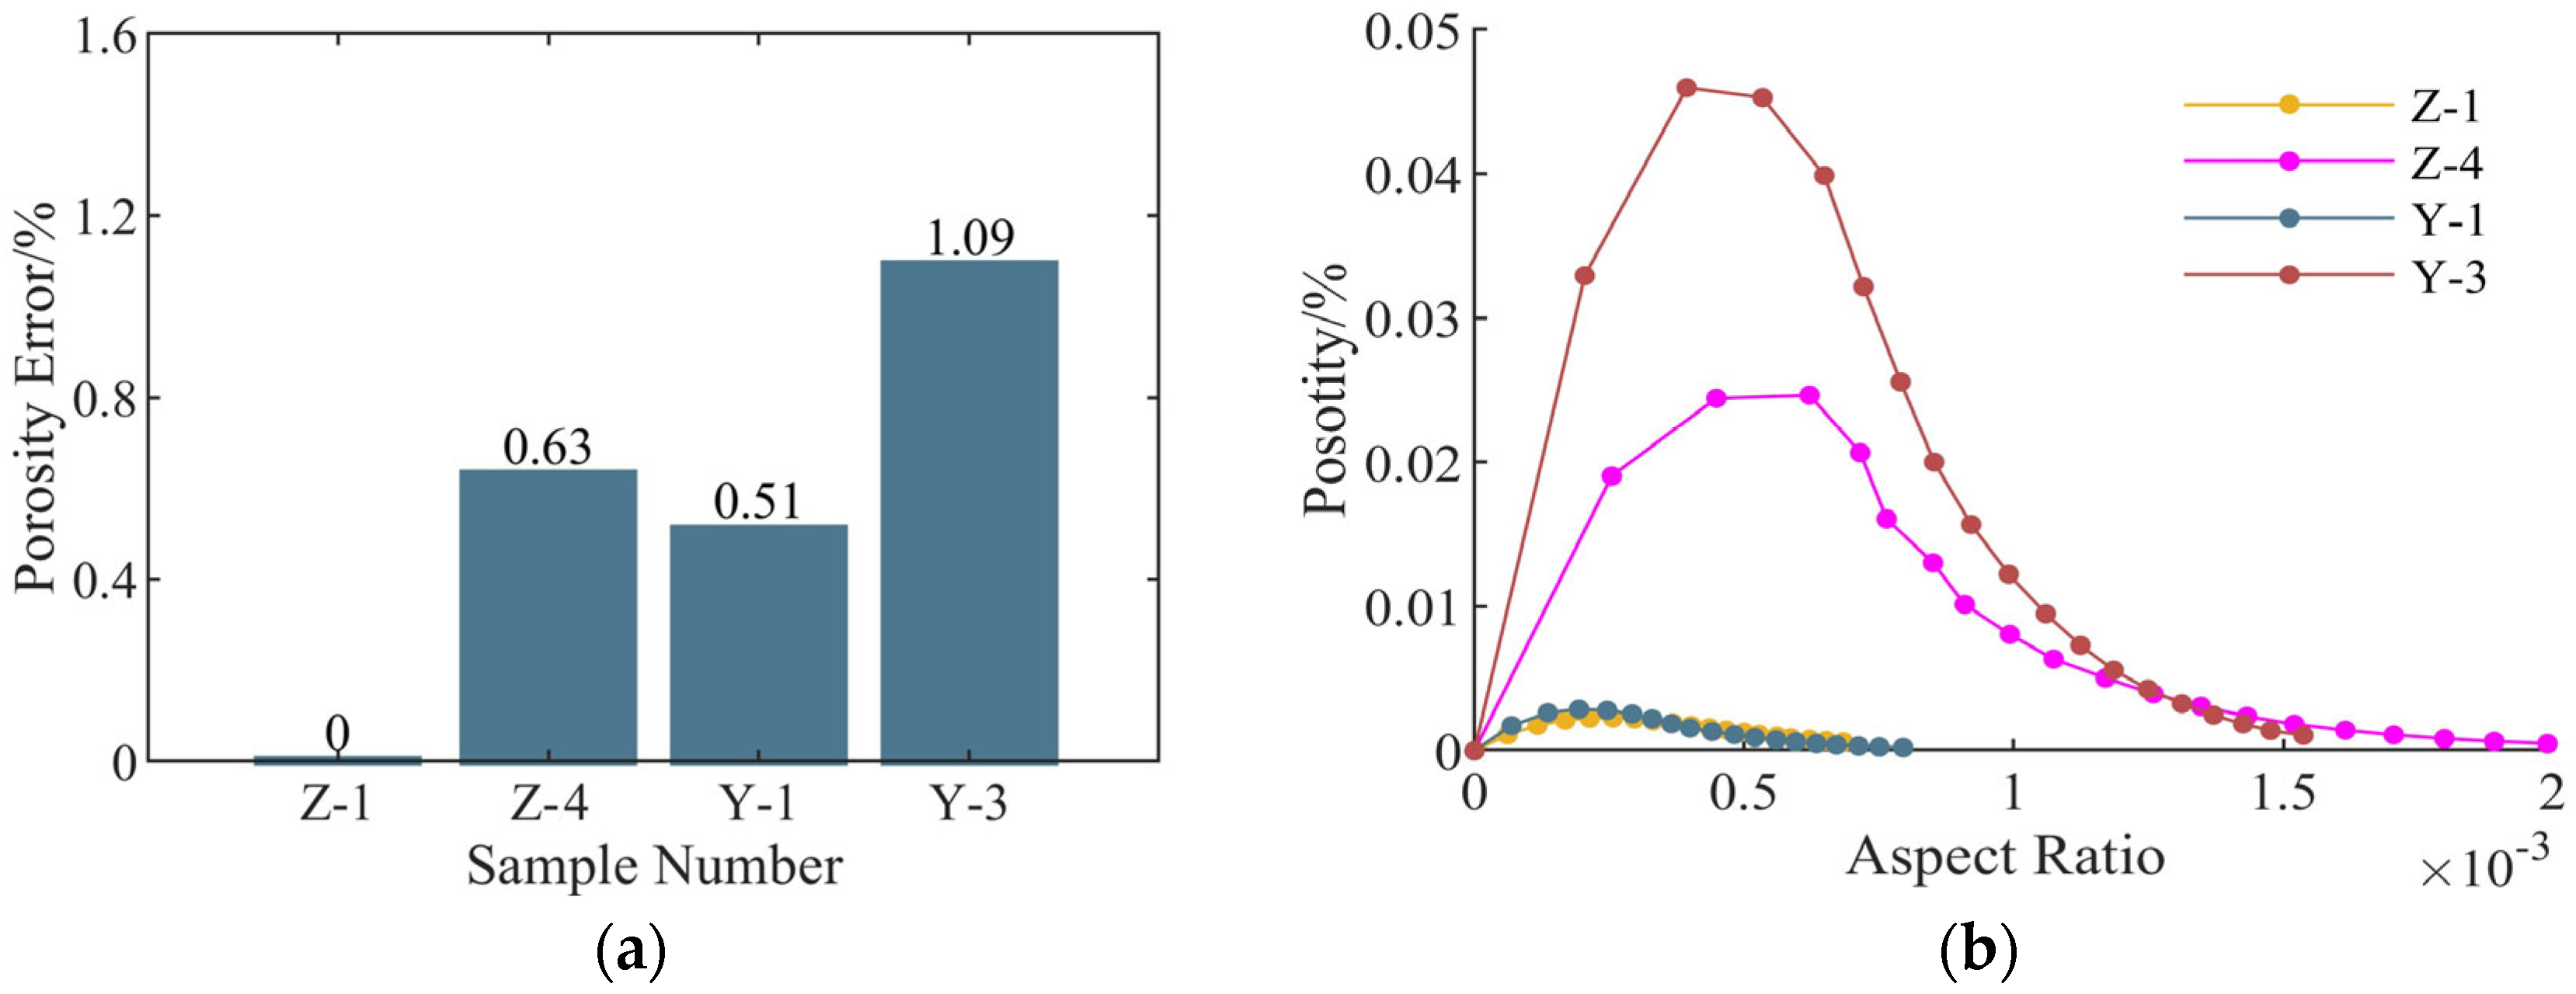
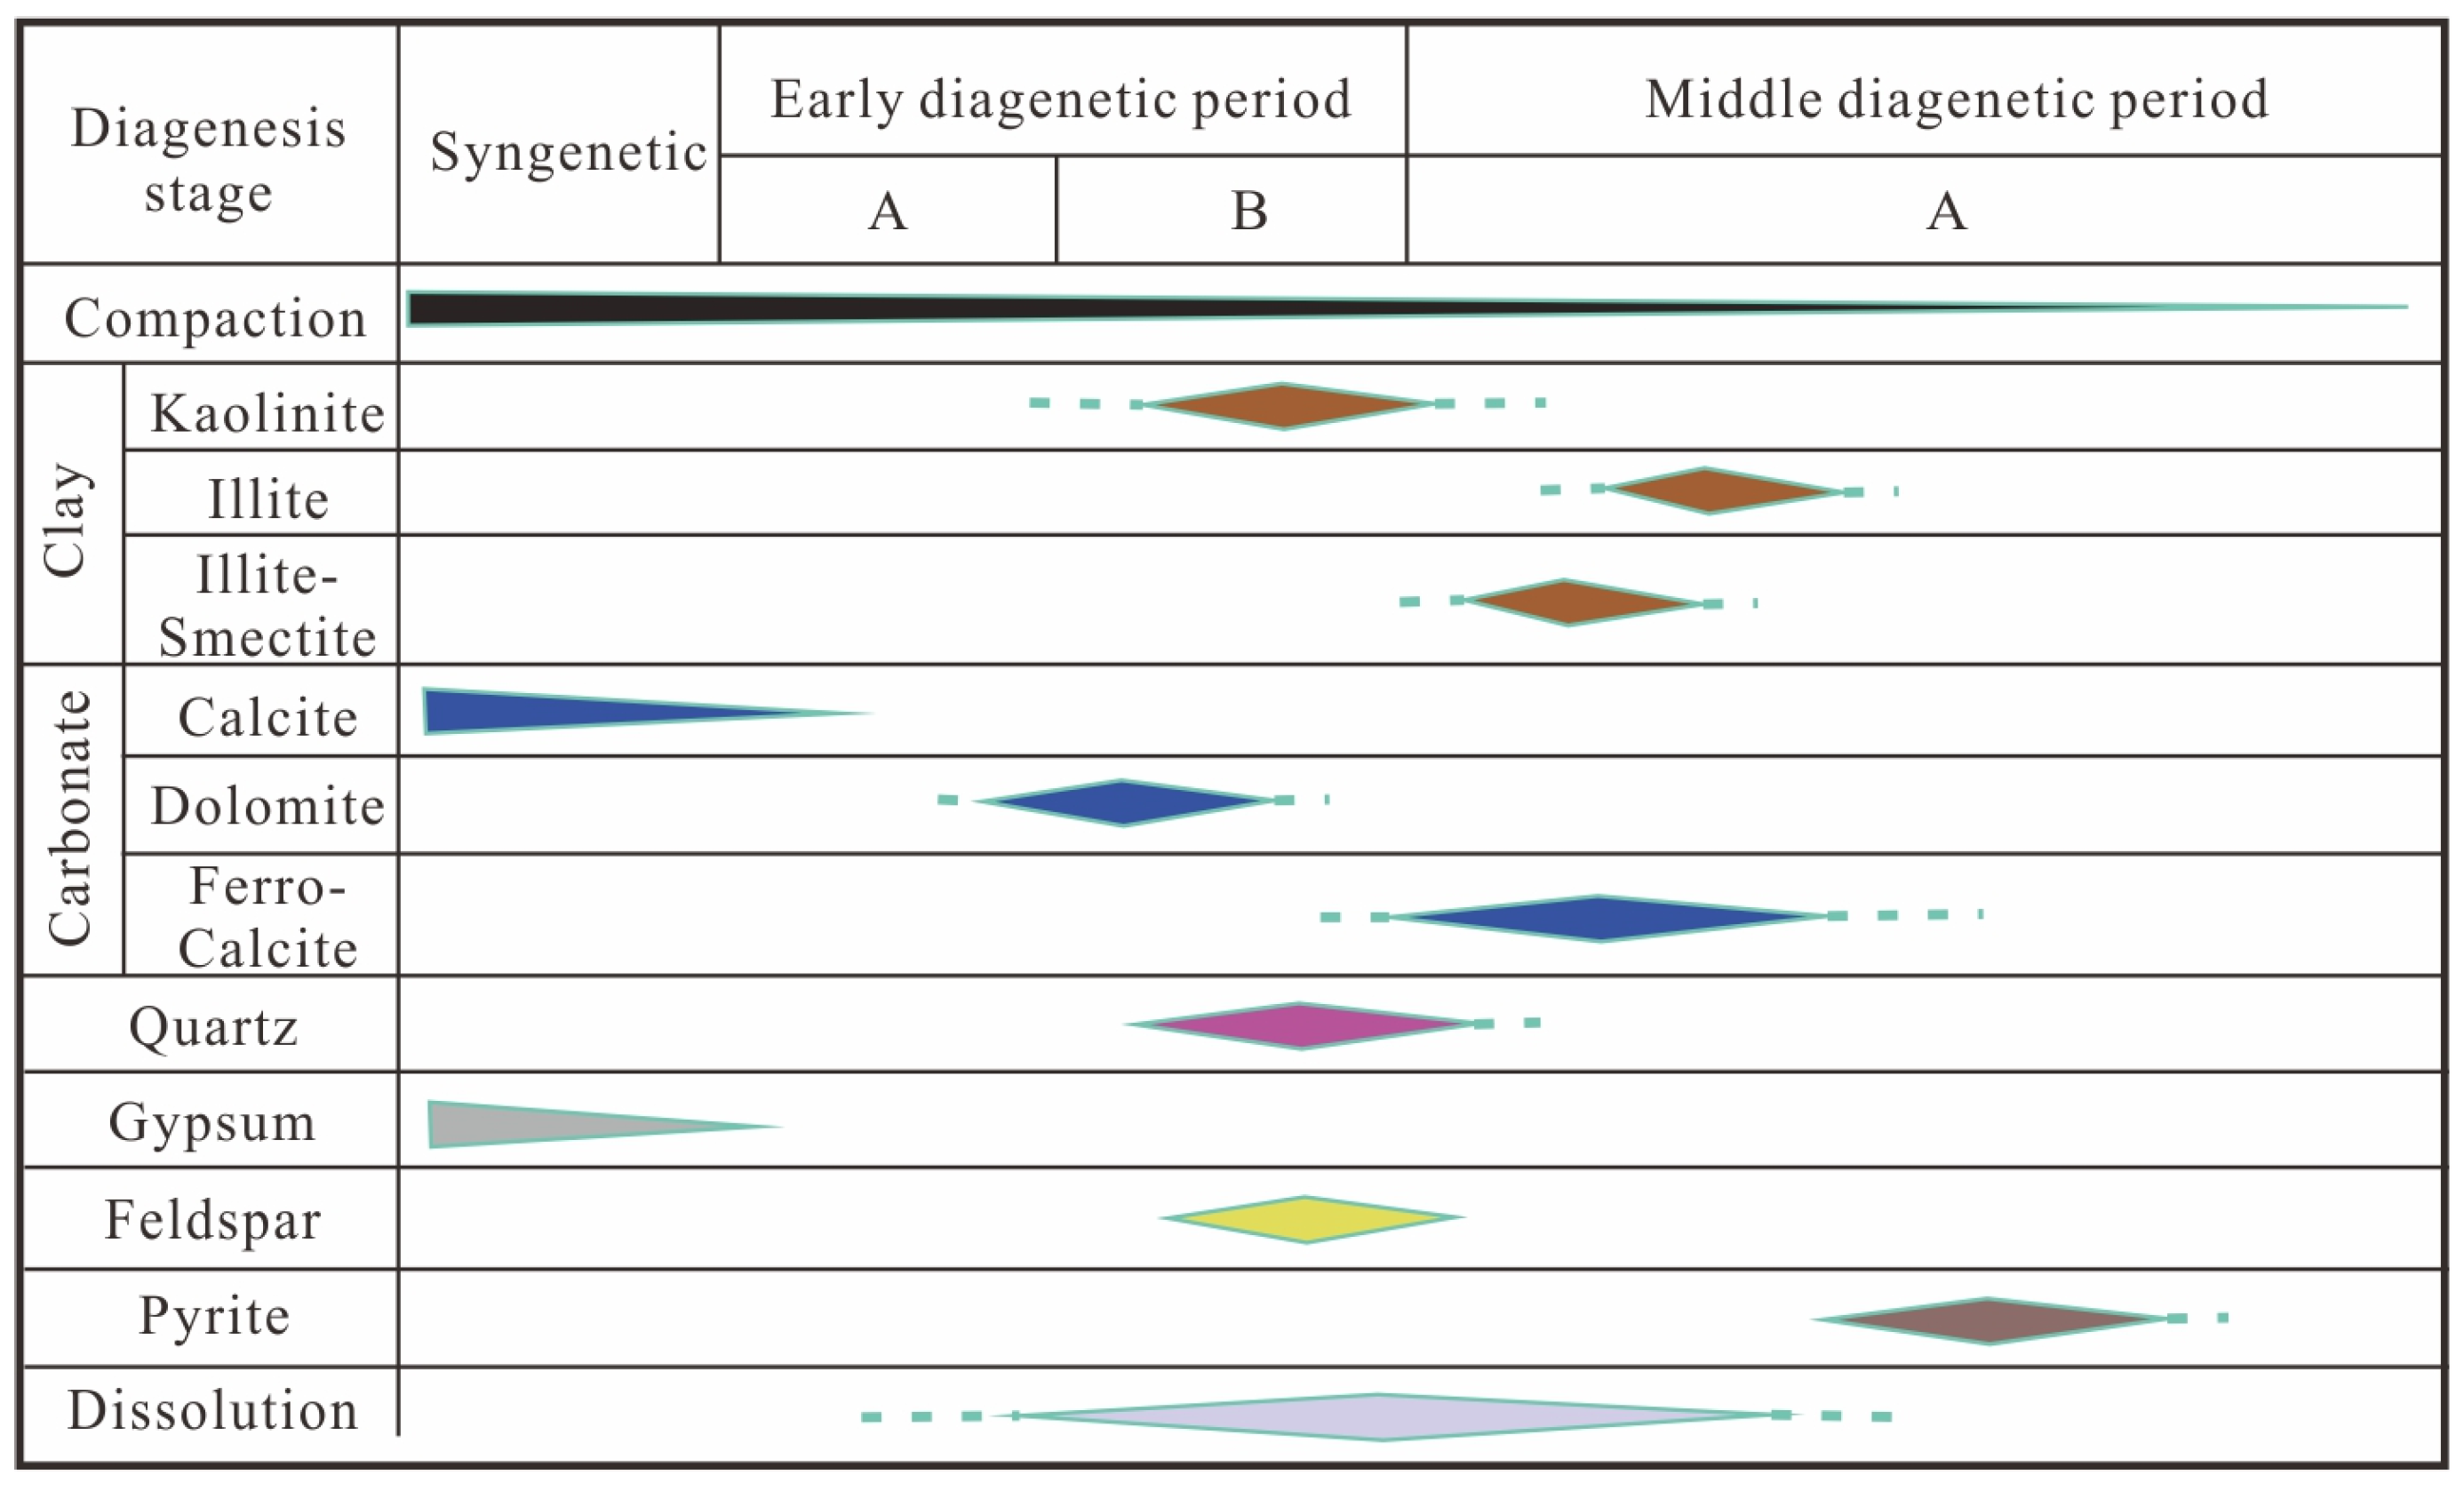
By utilizing an improved M-T model combined with stress-dependent velocity measurements, we systematically characterized pore structure distributions in sandstone samples from the Zhiluo and Yan’an Formations. The results demonstrate strong consistency with geological evolutionary trends and NMR-measured porosities. These findings validate the model’s reliability for pore structure characterization in the Ordos Basin’s Jurassic sandstones.
(3)
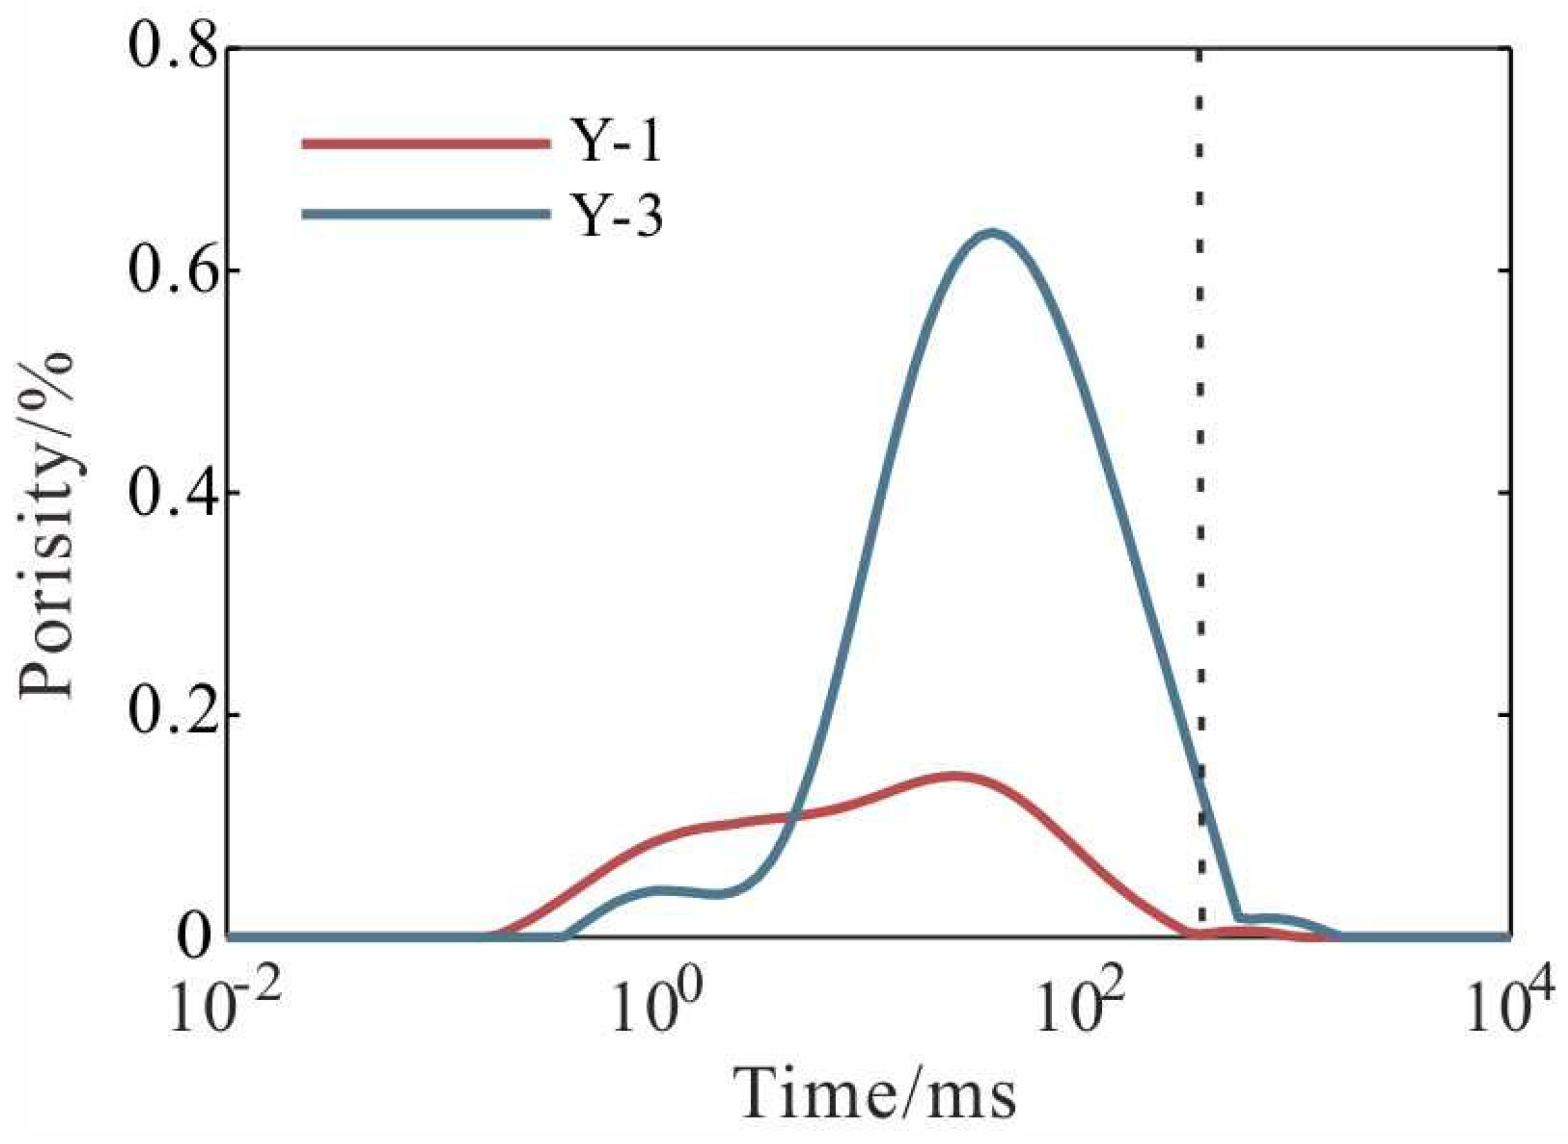
The Jurassic sandstones exhibit three key petrophysical characteristics: stiff porosity is dominantly controlled by calcite and quartz contents, while its equivalent ASP shows positive correlations with Poisson’s ratio and clay content; acoustic velocity is jointly influenced by both soft and stiff pores; the model-derived soft porosity values correspond closely with NMR-measured macropore/microcrack porosity. These results elucidate the fundamental interaction mechanisms among the mineralogical composition, pore structure, and acoustic wave propagation in Ordos Basin sandstones.
(4)
The M-T model-based inversion offers some advantages over conventional NMR analysis by enabling quantitative characterization of pore geometry parameters (e.g., aspect ratios) that are beyond the detection capability of standard NMR techniques. By applying this approach, researchers can gain deeper insights into sandstone pore evolution in the Ordos Basin, enhancing the understanding of coal-bearing sandstone properties in similar geological settings. The findings provide actionable insights for water hazard mitigation and geological CO2 storage practices.

Author Contributions

Conceptualization, T.C.; methodology, T.C., H.Y. and Y.L.; writing—review and editing, T.C. and H.Y.; visualization, H.X. and W.L. All authors have read and agreed to the published version of the manuscript.

Funding

This research was funded by the DeepEarth Probe and Mineral Resources Exploration–National Science and Technology Major Project, grant number 2024ZD1004201.

Data Availability Statement

Data are contained within the article.

Conflicts of Interest

Author Yueyue Li was employed by the company Inner Mongolia Huangtaolegai Coal Co., Ltd. The remaining authors declare that the research was conducted in the absence of any commercial or financial relationships that could be construed as a potential conflict of interest.

Abbreviations

The following abbreviations are used in this manuscript:
M-T modelMori-Tanaka model
ASPAspect ratios
NMRNuclear magnetic resonance
XRDX-ray diffraction
VpP-wave velocities
VsShear wave velocities
VRHVoigt-Reuss-Hill
cdCrack density
TCCMTotal content of clay minerals
KBulk modulus
EYoung’s modulus
μShear modulus

References

  1. Jia, A.; Chen, F.; Feng, N.; Meng, D.; Zheng, S. Model construction and implementation of Ordos Energy Super Basin, NW China. Pet. Explor. Dev. 2024, 51, 1628–1640. [Google Scholar] [CrossRef]
  2. Wang, R.; Shi, B.; Wang, T.; Lin, J.; Li, B.; Fan, S.; Liu, J. Multiscale qualitative–quantitative characterization of the pore structure in coal-bearing reservoirs of the Yan’an formation in the Longdong area, Ordos basin. Processes 2024, 12, 2787. [Google Scholar] [CrossRef]
  3. Liu, X.; Guo, X.; Hong, Z.; Xue, X.; Li, S. Pore Structure Characteristics and Main Control Factors of Sandstone in the Jurassic Zhiluo Formation in the Northern Ordos Basin. Minerals 2023, 13, 1102. [Google Scholar] [CrossRef]
  4. He, T.; Zhou, Y.; Li, Y.; Zhang, Z.; Zhang, Y.; Cui, G. The tectonic-sedimentary evolution of the Yan’an formation in the Ordos Basin and its petroleum geological significance. Appl. Sci. 2024, 14, 9278. [Google Scholar] [CrossRef]
  5. Li, P.; Li, Z.; Liu, B.; Teng, T.; Guo, J. Experimental investigation on the tensile properties of weakly cemented sandstone in China shendong mining area. Therm. Sci. 2020, 24, 3987–3994. [Google Scholar] [CrossRef]
  6. Wen, Z.; Jiang, P.; Song, Z.; Jiang, Y.; Wen, J.; Jing, S. Structural model and capacity determination of underground reservoir in goaf: A case study of Shendong mining area in China. Geomech. Geophys. Geo-Energy Geo-Resour. 2023, 9, 143. [Google Scholar] [CrossRef]
  7. Ma, J.; Li, X.; Wang, Z.; Gao, M.; Fu, C.; Bai, Z.; Hou, X.; Zhang, C. An evaluation method for water abundance of roof aquifer based on groundwater circulation characteristics: A case study of the Zhiluo Formation in Shendong mining area. Environ. Earth Sci. 2024, 83, 135. [Google Scholar] [CrossRef]
  8. Zhang, Z.; Li, G.; Wang, L. Element geochemical characteristics for the roof and floor rocks of coal seams in the Shendong mining area: Emphasis on hazardous element fluorine. Int. J. Coal Geol. 2025, 300, 104709. [Google Scholar] [CrossRef]
  9. Mim, R.T.; Negash, B.M.; Jufar, S.R.; Ali, F. Minireview on CO2 storage in deep saline aquifers: Methods, opportunities, challenges, and perspectives. Energy Fuels 2023, 37, 18467–18484. [Google Scholar] [CrossRef]
  10. Cui, Y.; Bai, J.; Liao, S.; Cao, S.; Liu, F. Suggestions on the development of environmental monitoring technology of CO2 geological storage and leakage under the background of China’s “double-carbon” strategy. Atmosphere 2023, 14, 51. [Google Scholar] [CrossRef]
  11. Qi, S.; Zheng, B.; Wang, Z.; Zhao, H.; Cui, Z.; Huang, T.; Guo, S.; Fu, L.; Dong, P. Geological evaluation for the carbon dioxide geological utilization and storage (CGUS) site: A review. Sci. China Earth Sci. 2023, 66, 1917–1936. [Google Scholar] [CrossRef]
  12. Amalokwu, K.; Falcon-Suarez, I.H. Effective medium modeling of pressure effects on the joint elastic and electrical properties of sandstones. J. Pet. Sci. Eng. 2021, 202, 108540. [Google Scholar] [CrossRef]
  13. Soleimani, A.; Tavakoli, V. Deep Dive into the factors influencing acoustic velocity in the Dalan-Kangan formations, the central Persian Gulf. Geoenergy Sci. Eng. 2024, 235, 212739. [Google Scholar] [CrossRef]
  14. Yang, J.; Zhang, F.; Wu, J. A pressure- and frequency-dependent multiscale model for describing the wave propagation characteristics of fluid-saturated porous media. Lithosphere 2024, 2024, 173. [Google Scholar] [CrossRef]
  15. Chen, F.; Zong, Z.; Yin, X. A squirt-flow model in isotropic porous rocks containing wedge-shaped cracks and its interpretation for laboratory measurements. Geophysics 2025, 90, MR141–MR153. [Google Scholar] [CrossRef]
  16. Danaei, S.; Maleki, M.; Schiozer, D.J.; Davolio, A. Carbonate rock physics model using different approaches to estimate rock frame stiffness. Geoenergy Sci. Eng. 2025, 244, 213443. [Google Scholar] [CrossRef]
  17. Wolf, F.G.; Siebert, D.N.; Carreño, M.N.P.; Lopes, A.T.; Zabot, A.M.; Surmas, R. Dual-porosity micromodels for studying multiphase fluid flow in carbonate rocks. Lab Chip 2022, 22, 4680–4692. [Google Scholar] [CrossRef]
  18. Khosravi, M.H.; Emami Niri, M.; Saberi, M.R. Effects of diagenetic processes on the velocity evolution in carbonate reservoirs. Geomech. Geophys. Geo-Energy Ge-Resour. 2023, 9, 147. [Google Scholar] [CrossRef]
  19. Zhang, K.; Saeed, A.M.; Wang, H.; Mi, Z.; Qu, J.; Jaed, M.A.; Wang, Z.; Liu, H.; Zhang, Z. Identification of pore facies for evaluating the reservoir quality: A case study of the Hartha Formation in X Oilfield, Mesopotamian Basin, Iraq. Geol. J. 2024, 59, 325–339. [Google Scholar] [CrossRef]
  20. Chen, D.; Zhu, Y.; Wang, W.; Zhang, L.; Tang, J.; Ren, J.; Wang, Y. Pore structure of tight sandstones with differing permeability: The He 8 Member of the Middle Permian Lower Shihezi Formation, Gaoqiao area, Ordos Basin. Energy Sci. Eng. 2024, 12, 117–135. [Google Scholar] [CrossRef]
  21. Pervukhina, M.; Gurevich, B.; Dewhurst, D.N.; Siggins, A.F. Applicability of velocity-stress relationships based on the dual porosity concept to isotropic porous rocks. Geophys. J. Int. 2010, 181, 1473–1479. [Google Scholar] [CrossRef]
  22. Deng, J.; Zhou, H.; Wang, H.; Zhao, J.; Wang, S. The influence of pore structure in reservoir sandstone on dispersion properties of elastic waves. Chin. J. Geophys. 2015, 58, 3389–3400. [Google Scholar] [CrossRef]
  23. Cheng, W.; Ba, J.; Carcione, J.M.; Pang, M.; Wu, C. Estimation of the Pore Microstructure of Tight-Gas Sandstone Reservoirs with Seismic Data. Front. Earth Sci. 2021, 9, 646372. [Google Scholar] [CrossRef]
  24. Cheng, W.; Ba, J.; Wang, D.; Ma, R. Study on the effects of pore-microcrack properties and clay content on elastic wave dissipation characteristics in tight rocks of shale oil stratum. Chin. J. Geophys. 2023, 66, 3463–3481. [Google Scholar] [CrossRef]
  25. Pang, M.; Ba, J.; Carcione, J.M.; Saenger, E.H. Combined acoustical-electrical modeling for tight sandstones verified by laboratory measurements. Int. J. Rock Mech. Min. Sci. 2024, 176, 105682. [Google Scholar] [CrossRef]
  26. Zhang, Y.; Xu, S.; Gao, Y.; Guo, J.; Cao, Y.; Zhang, J. Correlation of chloride diffusion coefficient and microstructure parameters in concrete: A comparative analysis using NMR, MIP, and X-CT. Front. Struct. Civ. Eng. 2020, 14, 1509–1519. [Google Scholar] [CrossRef]
  27. Xiong, X.; Wang, J.; She, A.; Lin, J. Characterization of Pore Size Distribution and Water Transport of UHPC Using Low-Field NMR and MIP. Materials 2023, 16, 2781. [Google Scholar] [CrossRef]
  28. Li, S.; Sun, J.; Gao, Y.; Liu, D.; Zhang, Z.; Ma, P. Flow Characterization in Fractured Shale Oil Matrices Using Advanced Nuclear Magnetic Resonance Techniques. Processes 2024, 12, 879. [Google Scholar] [CrossRef]
  29. Rozhko, A.Y.; Lozovyi, S.; Naumann, M.; Hansteen, F.; Ravasi, M. Stimulating relative permeability changes by low-frequency elastic waves: Theory and lab experiments. J. Pet. Sci. Eng. 2022, 215, 110393. [Google Scholar] [CrossRef]
  30. Guo, Z.; Qin, X.; Zhang, Y.; Niu, C.; Wang, D.; Ling, Y. Numerical Investigation of the Effect of Heterogeneous Pore Structures on Elastic Properties of Tight Gas Sandstones. Front. Earth Sci. 2021, 9, 641637. [Google Scholar] [CrossRef]
  31. Aguilera, R. Analysis of Naturally Fractured Reservoirs From Conventional Well Logs. J. Pet. Technol. 1976, 28, 764–772. [Google Scholar] [CrossRef]
  32. Xu, S.; Whtie, R.E. A new velocity model for clay-sand mixtures. Geophys. Prospect. 1995, 43, 91–118. [Google Scholar] [CrossRef]
  33. White, J.E. Computed seismic speeds and attenuation in rocks with partial gas saturation. Geophysics 1975, 40, 224–232. [Google Scholar] [CrossRef]
  34. Dutta, N.C.; Seriff, A.J. On White’s model of attenuation in rocks with partial gas saturation. Geophysics 1979, 44, 1806–1812. [Google Scholar] [CrossRef]
  35. Hill, R. The elastic behaviour of a crystalline aggregate. Proc. Phys. Soc. A 1952, 65, 349–354. [Google Scholar] [CrossRef]
  36. Gary, M.; Tapan, M.; Jack, D. The Rock Physics Handbook, 3rd ed.; Cambridge University Press: New York, NY, USA, 2009; pp. 122–247. [Google Scholar]
  37. Eshelby, J.D. The determination of the elastic field of an ellipsoidal inclusion, and related problems. Proc. R. Soc. Lond. 1957, 241, 376–396. [Google Scholar] [CrossRef]
  38. Mori, T.; Tanaka, K. Average stress in matrix and average elastic energy of materials with misfitting inclusions. Acta Metall. 1973, 21, 571–574. [Google Scholar] [CrossRef]
  39. David, E.C.; Zimmerman, R.W. Pore structure model for elastic wave velocities in fluid-saturated sandstones. J. Geophys. Res. Solid Earth 2012, 117, B07210. [Google Scholar] [CrossRef]
  40. Hou, Z.; Huang, L.; Zhang, S.; Han, X.; Xu, J.; Li, Y. Identification of groundwater hydrogeochemistry and the hydraulic connections of aquifers in a complex coal mine. J. Hydrol. 2024, 628, 130496. [Google Scholar] [CrossRef]
  41. Cui, L.; Peng, N.; Liu, Y.; Qiao, D.; Liu, Y. Sedimentary Filling Evolution under Paleoclimate Transition—A Case Study from the Middle Jurassic Zhiluo Formation, Ordos Basin. Minerals 2023, 13, 314. [Google Scholar] [CrossRef]
  42. Li, D.; He, Q.; Li, H.; Gao, J.; Zhao, X.; Sun, Q.; Wang, S.; Xue, T. Organic matter enrichment and palaeoenvironmental comparison of Alinian fine-grained sedimentary rocks in lake facies. Gas Sci. Eng. 2023, 116, 205055. [Google Scholar] [CrossRef]
  43. Lv, D.; Shen, Y.; van Loon, A.J.T.; Raji, M.; Zhang, Z.; Song, G.; Ren, Z.; Wang, Y.; Wang, D. Sequence stratigraphy of the Middle Jurassic Yan’an Formation (NE Ordos Basin, China), relationship with climate conditions and basin evolution, and coal maceral’s characteristics. Front. Earth Sci. 2023, 10, 1086298. [Google Scholar] [CrossRef]
  44. Wang, Z.; Chen, J.; Li, W.; Wang, Q.; Niu, Q.; Liu, S.; Hu, Y. Relationship between petrographic parameters and physical-mechanical properties of weakly cemented sandstones. Q. J. Eng. Geol. Hydrogeol. 2021, 54, qjegh2018-168. [Google Scholar] [CrossRef]
  45. Zhong, X.; Zhu, Y.; Jiao, T.; Qi, Z.; Luo, J.; Xie, Y.; Liu, L. Microscopic pore throat structures and water flooding in heterogeneous low-permeability sandstone reservoirs: A case study of the Jurassic Yan’an Formation in the Huanjiang area, Ordos Basin, Northern China. J. Asian Earth Sci. 2021, 219, 104903. [Google Scholar] [CrossRef]
  46. Luo, J.; Morad, S.; Zhang, X.; Yan, S.; Wu, F.; Li, Y.; Xue, J. Reconstruction of the diagenesis of the fluvial-lacustrine-deltaic sandstones and its influence on the reservoir quality evolution-Evidence from Jurassic and Triassic sandstones, Yanchang Oil Field, Ordos Basin. Sci. China Ser. D Earth Sci. 2002, 45, 616–634. [Google Scholar] [CrossRef]
  47. Wei, J.; Chen, S.; Gu, Y.; Zhang, H.; Yin, S.; Yuan, H. Diagenesis and reservoir classification criteria for Jurassic continental sandstone oil reservoir in the western Ordos Basin, China. Geol. J. 2021, 56, 3868–3882. [Google Scholar] [CrossRef]
  48. Yang, S.; Bao, Z.; Shen, Y.; Gao, Y.; Lin, Y.; Zhu, L.; Chen, X.; Ding, S.; Zhu, B.; Qi, Q.; et al. Diagenetic evolution and sources of main cements within palaeochannel sandstone reservoirs of the Jurassic Yan’an Formation in Jiyuan area, Ordos Basin. J. Palaeogeogr. (Chin. Ed.) 2023, 25, 906–919. [Google Scholar] [CrossRef]
  49. Raza, A.; Rezaee, R.; Gholami, R.; Bing, C.H.; Nagarajan, R.; Hamid, M.A. A screening criterion for selection of suitable CO2 storage sites. J. Nat. Gas Sci. Eng. 2016, 28, 317–327. [Google Scholar] [CrossRef]
  50. Lu, C.; Xu, J.; Li, Q.; Zhao, H.; He, Y. Research on the development law of water-conducting fracture zone in the combined mining of Jurassic and Carboniferous coal seams. Appl. Sci. 2022, 12, 11178. [Google Scholar] [CrossRef]
Figure 1. Proposed methodology for the pore structure characterization.
Minerals 15 00547 g001
Figure 3. The geological setting (a), geographical location (b), and lithologic column (c) of the study area.
Minerals 15 00547 g003
Figure 4. Cylindrical sandstone core samples from the Zhiluo and Yan’an Formations collected from Borehole BK312: (a) Plan view; (b) Side view.
Minerals 15 00547 g004
Figure 5. Box plots of mineralogical composition and physical properties: (a) Mineral composition; (b) Bulk density and porosity.
Minerals 15 00547 g005
Figure 6. Box plots of elastic parameters for the Zhiluo and Yan’an formations: (a) P and S-wave velocities; (b) Young’s modulus (E), bulk modulus (K), and shear modulus (μ).
Minerals 15 00547 g006
Figure 7. Stress-dependent velocity distribution characteristics of Jurassic sandstone samples: (a) Zhiluo Formation sample Z-1 (φ = 2.63%); (b) Zhiluo Formation sample Z-4 (φ = 12.68%); (c) Yan’an Formation sample Y-1 (φ =3.37%); (d) Yan’an Formation sample Y-3 (φ = 14.39%).
Minerals 15 00547 g007
Figure 8. Pressure-dependent cumulative crack density evolution in Jurassic sandstone samples: (a) Zhiluo Formation sample Z-1, (b) Zhiluo Formation sample Z-4, (c) Yan’an Formation sample Y-1, and (d) Yan’an Formation sample Y-3.
Minerals 15 00547 g008
Figure 9. Distributions of soft porosity and soft pore ASP in Jurassic sandstone samples: (a) Zhiluo Formation sample Z-1; (b) Zhiluo Formation sample Z-4; (c) Yan’an Formation sample Y-1; and (d) Yan’an Formation sample Y-3.
Minerals 15 00547 g009
Figure 10. Soft porosity and aspect ratios (ASP) in Jurassic sandstone samples (Zhiluo and Yan’an Formations): (a) Porosity error compared to NMR measurement; (b) Distributions of soft porosity and aspect ratios (ASP).
Minerals 15 00547 g010
Figure 11. Cross-plot of pore structure characteristics versus fundamental physical properties: (a) stiff and soft porosity vs. calcite content; (b) ASP of stiff pores vs. TCCM; (c) dominant ASP of soft pores vs. VP.
Minerals 15 00547 g011
Figure 12. NMR T2 relaxation time distributions for sandstone samples Y-1 (low porosity) and Y-3 (high porosity), showing distinct pore size characteristics.
Minerals 15 00547 g012
Figure 13. Diagenetic evolutionary sequence of Jurassic sandstones in the Ordos Basin [46,47,48].
Minerals 15 00547 g013
Table 1. The material composition and physical parameters of samples.
No.Mainly Material Composition/%Vp/(m/s)Vs/(m/s)K/GPaE/GPaμ/GPa
QuartzCalcitaFeldsparTCCM
Z-128.6440.9023.345.364166.672500.0022.9338.7015.88
Z-227.5644.1923.444.812890.171607.7212.3216.566.49
Z-332.2042.3318.336.583389.831805.0518.3021.728.34
Z-456.671.2512.6128.092175.821307.455.409.163.76
Z-544.5317.9919.8915.941455.60803.212.833.721.45
Z-655.100.0028.6614.351742.16974.664.075.562.18
Y-119.1036.6024.8423.104149.382240.1426.6332.8712.70
Y-231.3828.4229.8210.384915.672541.8740.1243.9216.67
Y-353.760.0032.8013.442313.891423.936.1211.24.68
Y-417.2532.9228.9220.915460.173276.0140.6268.5428.12
Y-525.3030.2932.8711.535229.672866.0243.6256.1721.85
Y-626.7746.4622.274.495463.392981.9447.3260.2423.39
Y-739.8919.7130.569.843013.281861.3410.3919.248.07
Y-841.120.0048.5410.081894.561123.314.236.892.80
Y-940.112.6048.238.851891.821045.054.716.212.42
Y-1041.356.6529.8222.192488.721366.479.0411.704.56
Table 2. M-T model and NMR-derived porosities and ASPs of some Jurassic sandstone samples.
No.Stiff Pore Soft PorePorosity Measured by NMR/%Porosity Error Compared to NMR Measurement/%
Porosity/%Equivalent ASPPorosity/%Dominant ASP
Z-12.600.580.030.00032.630
Z-411.950.620.100.000612.680.63
Y-13.860.650.020.00023.370.51
Y-313.000.610.300.000414.391.09
Disclaimer/Publisher’s Note: The statements, opinions and data contained in all publications are solely those of the individual author(s) and contributor(s) and not of MDPI and/or the editor(s). MDPI and/or the editor(s) disclaim responsibility for any injury to people or property resulting from any ideas, methods, instructions or products referred to in the content.

