Article

Mineralization Alteration Extraction Based on Residual Attention and Hybrid Convolution

1
Institute of Geology and Mining Engineering, Xinjiang University, Urumqi 830017, China
2
Laboratory of Continental Dynamics and Metallogenic Prognosis of Central Asian Orogenic Belt, Urumqi 830017, China
3
Zhejiang Tunnel Engineering Group Co., Ltd., Hangzhou 310000, China
4
Urumgi Geological Brigade, Bureau of Geology and Mineral Resources of Xinjiang Uygur Autonomous Region, Urumqi 830017, China
5
Aksu Geological Brigade, Bureau of Geology and Mineral Resources of Xinjiang Uygur Autonomous Region, Aksu 843000, China
*
Author to whom correspondence should be addressed.
Minerals 2025, 15(5), 510; https://doi.org/10.3390/min15050510
Submission received: 10 March 2025 / Revised: 9 May 2025 / Accepted: 11 May 2025 / Published: 13 May 2025
(This article belongs to the Section Mineral Exploration Methods and Applications)

Abstract

:
Wall rock alteration is an important geological marker in prospecting, which can indicate the existence and location of ore bodies. Extracting mineralization and alteration information through remote sensing data and obtaining the spatial distribution characteristics of altered rocks have always been an important research content of remote sensing prospecting. Satellite remote sensing data, such as Landsat 8, has become a common tool for extracting altered mineral information due to its easy access, low cost, and high efficiency. To enhance the accuracy of extracting information on mineralized alterations, this study employs remote sensing technology to propose an Alteration Information Extraction Network combining Residual Attention and Hybrid Convolution (RAHC-AIE). Taking the Beitashan area in Xinjiang, China, as an example, the application of this method is studied. Firstly, the characteristics of the Landsat 8 OLI data are analyzed. Each mineralized alteration information characteristic bands were selected, and training samples were extracted via principal component analysis for the combined bands. We used band 2, band 5, band 6, and band 7 to extract hydroxyl alteration information, and band 2, band 4, band 5, and band 6 for iron-stained alteration information. Subsequently, the RAHC-AIE model is used to train the training samples. Finally, the trained RAHC-AIE model is used to extract the alteration information. The results reveal that the RAHC-AIE model’s overall accuracy (PA) in alteration information extraction is 98.61%. The category average pixel accuracy (MPA) is 95.76%, the Kappa coefficient (Kappa) is 85.79%, the average F1 score (Mean_F1) is 92.90%, and the frequency-weighted intersection and union ratio (FWIoU) is 97.47%. These metrics indicate the model’s strong performance. To validate these results, we conducted field validation and a laboratory analysis based on alteration mapping. The extraction result is good. This study shows that the RAHC-AIE model is an effective method for alteration information extraction. This can guide ore deposit searches and provide an important reference for accurate and rapid ore searching in the Beitashan area, as well as predicting and evaluating ore deposits in similar areas.

Graphical Abstract

1. Introduction

Wall rock alteration refers to changes in material composition and structure due to chemical reactions between the surrounding rock and hydrothermal fluids during hydrothermal mineralization. Often accompanying ore bodies and being widely distributed, it serves as an important indicator in mineral discovery and provides guidance for regional geological mineral searches [1,2,3,4]. Different mineral assemblages within alteration types exhibit specific spectral characteristics [5]. Generally, the spectral characteristics of the visible-near-infrared interval are related to electron leaps in the mineral crystals, which are caused by iron ions. The reflectance spectral characteristics of the short-wave infrared interval are related to the vibration of molecules in the mineral crystals, which are usually caused by water, hydroxyl ions, carbonates, or sulfates [6,7]. According to these characteristics, many researchers have utilized multi-spectral data from Landsat, ASTER, WorldView-3, and other sources to map mineral assemblages related to mineral deposits. These have been successfully applied in lithology and hydrothermal alteration mapping with positive results [5,8,9,10,11,12]. Particularly in areas with complex geological environments and inconvenient transportation, remote sensing (RS) technology offers a convenient solution for geological exploration, becoming an essential tool in geological prospecting [13].
In the past decades, a variety of alteration information extraction methods have been formed based on the acquired remote sensing images. Traditional alteration information extraction methods, such as band ratio (BR), principal component analysis (PCA), matched filtering, and other image processing algorithms [5,8,12,14], have been developed. These traditional algorithms typically extract target features manually and build a mapping model between the feature space and the alteration information on this basis. However, this model is largely dependent on spectral information, making it susceptible to spectral variations and noise interference, and there may be misclassifications of spectrally similar minerals. These issues often reduce the accuracy of the alteration information extraction [15]. Machine learning (ML) algorithms have more advantages than traditional methods in dealing with complex data, such as the support vector machine (SVM), random forest (RF), artificial neural networks (ANNs), etc. [11,16,17,18,19]. Machine learning methods show great potential in the remote sensing data processing of mineral exploration. However, the fact that mineralization is a rare geologic event results in an insufficient number of training samples, which makes supervised ML algorithms applied to mineral exploration have certain drawbacks [20]. In addition, they only rely on shallow spectral features, ignoring the spatial relationship between pixels [21]. Therefore, despite progress, challenges remain in prediction, model parameters, and data collection uncertainty [19]. Thus, accurately extracting alteration information from remotely sensed imagery remains a complex issue in the field of mineral prospecting.
Deep learning techniques are learning algorithms with hierarchical nonlinear transformations. Different from machine learning (ML) algorithms, deep learning algorithms can automatically extract informative features from original data and learn complex functional relationships to be more robust [22]. In addition, with its powerful network structure and feature extraction capability, it has been successfully introduced into multi-spectral image (MIS) classifications [23,24,25]. Combining deep learning methods with remote sensing technology has been successfully applied to mineral exploration [26,27,28] and the extraction of hydrothermal alteration zones [29]. Convolutional neural networks (CNNs) are important algorithms in the field of deep learning. They are stacked using many convolutional computing units, which can realize automatic feature extraction and the classification of high-dimensional complex data, thereby improving the accuracy of image classification [30]. According to the dimension of the convolution kernel, CNNs can be categorized into one-dimensional convolutional neural networks (1D-CNNs), two-dimensional convolutional neural networks (2D-CNNs), and three-dimensional convolutional neural networks (3D-CNNs). For the characteristics of multispectral images, the convolutional neural network recognizes the spectral features, spatial features, and spectral-spatial features of multispectral images by these three types, respectively [31]. The 1D-CNNs are capable of extracting spectral features from remote sensing images [32]. The 2D-CNNs leverage local connections to learn the contextual information of adjacent pixels, thus extracting the spatial information of the image [33]. The 3D-CNNs can simultaneously extract spectral and spatial information, but there are problems of overfitting and increased computational complexity [34]. The convolution method using the above single-dimensional depth features has limited ability to characterize MSI [31]. In order to effectively improve the classification performance, the key problem to be solved is to improve the effectiveness and applicability of multi-dimensional feature fusion in geology.
To solve the above problems, this study applied Landsat 8 OLI satellite images and deep learning technology to identify mineralization alteration, and proposes an Alteration Information Extraction Network combining Residual Attention and Hybrid Convolution, RAHC-AIE. Taking Beitashan as the research area, the RAHC-AIE model is used to test the extraction ability of altered minerals, verify the proposed model, and explore the prospecting potential of the Beitashan area. The main contribution of this paper is to propose an altered information extraction network that combines residual attention and hybrid convolution. The network combines 1D-CNN, 2D-CNN, and 3D-CNN, and uses the residual attention mechanism. The results show that RAHC-AIE has good accuracy and good generalization performance for the extraction of hydroxyl- and iron-stained alteration information. Finally, the alteration mineral mapping was performed in the Beitashan area.
To address the persistent challenges of inaccurate alteration information extraction, limited handling of complex geological features, and the lack of effective integration with exploration practices in the existing research, this study sets three specific objectives.
Firstly, the primary aim is to develop a highly accurate and robust alteration information extraction method. By applying Landsat 8 OLI satellite images and leveraging deep learning technology, we propose an Alteration Information Extraction Network combining Residual Attention and Hybrid Convolution (RAHC-AIE). This network is designed to overcome the limitations of traditional and existing deep-learning-based methods, such as single-dimensional feature extraction and poor noise resistance.
Secondly, taking Beitashan as the research area, we intend to comprehensively test and verify the performance of the RAHC-AIE model. Through a series of experiments, we aim to evaluate its ability to extract different types of altered minerals, especially hydroxyl- and iron-stained alteration information. By comparing with baseline models, we seek to validate the superiority and reliability of our proposed model in accurately identifying and mapping alteration zones.
Finally, beyond model development and verification, we strive to explore the practical prospecting potential of the Beitashan area. This involves integrating the model results into the mineral potential models and exploration decision-making frameworks. The ultimate goal is to provide practical guidance for geological exploration, bridging the gap between remote-sensing-based analysis and on-site exploration operations.
The main contribution of this paper lies in the proposal of the RAHC-AIE network, which combines 1D-CNN, 2D-CNN, and 3D-CNN and incorporates the residual attention mechanism. The experimental results demonstrate that RAHC-AIE exhibits excellent accuracy and generalization performance in extracting hydroxyl- and iron-stained alteration information. Ultimately, we successfully conducted alteration mineral mapping in the Beitashan area, achieving our research objectives of method innovation, model verification, and practical application.

2. Regional Geological Background

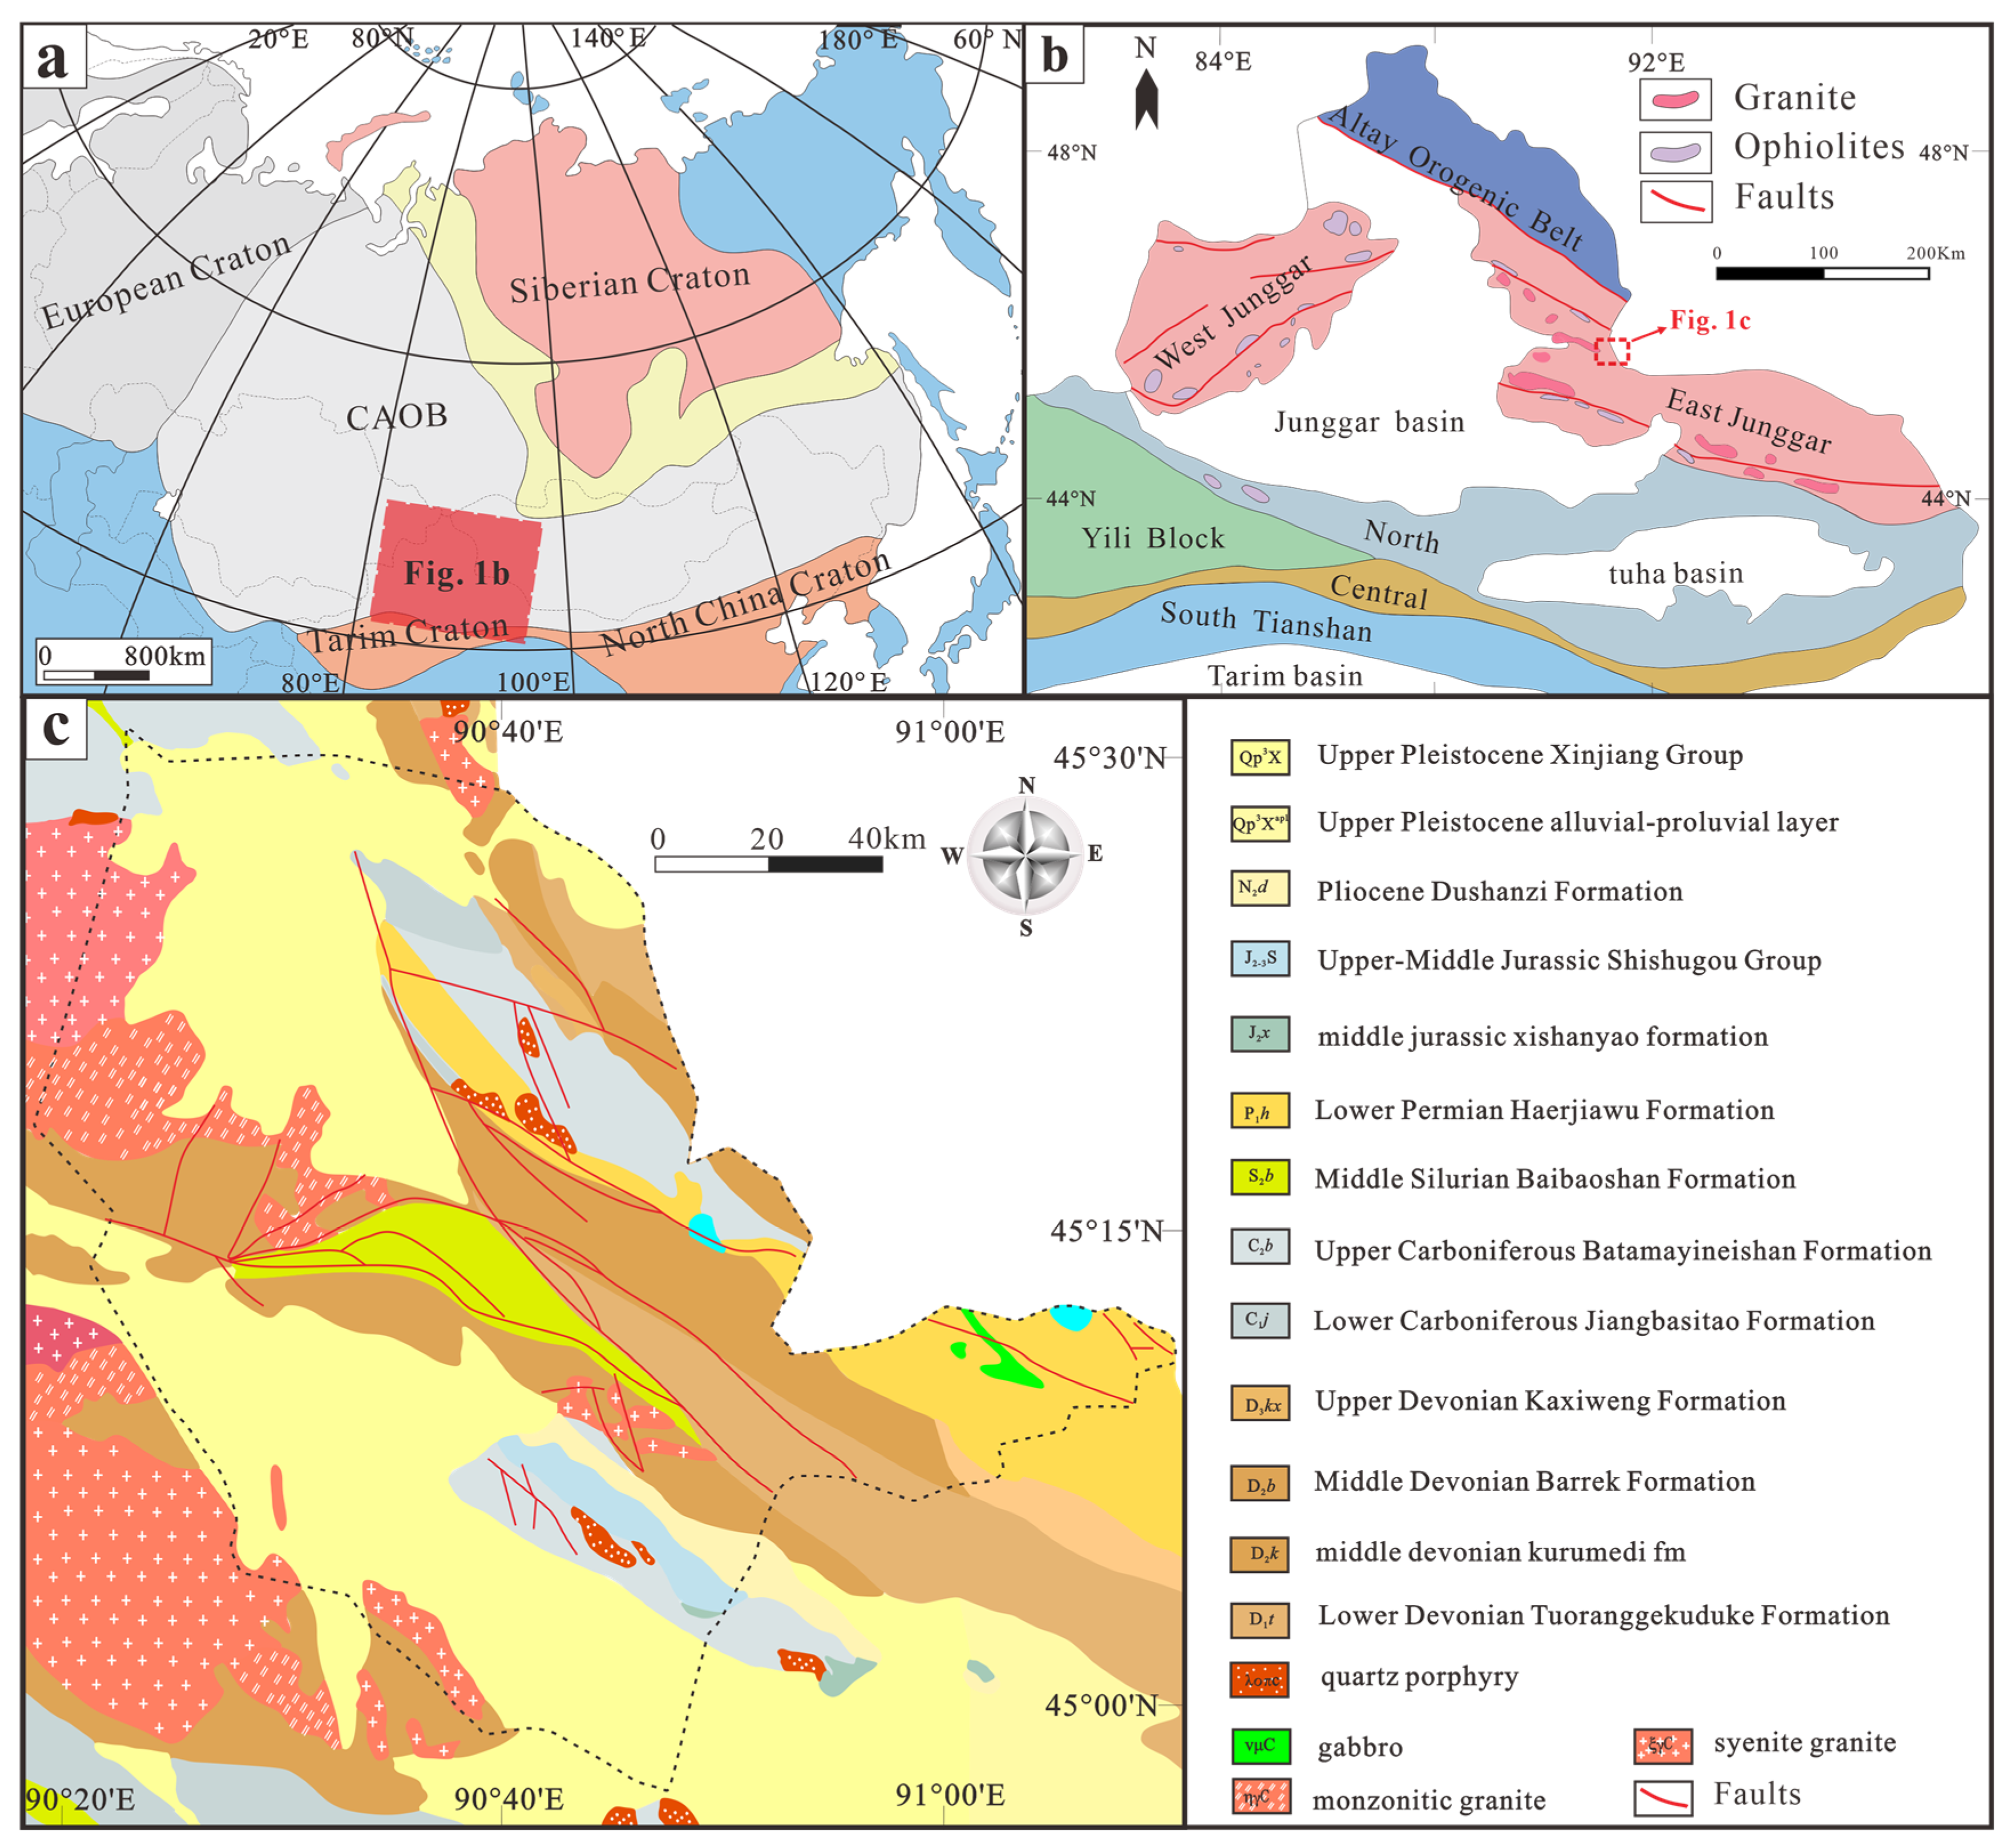
The Central Asian Orogenic Belt (CAOB) has undergone an evolutionary process from the formation of ancient basements to multiple orogenic activities and complex crustal deformation [35,36]. It is one of the largest accretionary orogenic belts in the world [37,38] and is also an important mineral resource concentration area in the world [39]. East Junggar is an important part of the Central Asian Orogenic Belt in northern Xinjiang (Figure 1a) [40]. Since the Paleozoic Era, it has experienced a tectonic evolution history of oceanic spreading, plate subduction, collision, and post-collision [41]. The complex geological background has formed a tectonic-magma belt with magmatic copper-nickel ore, porphyry copper-molybdenum ore, and tectonic altered rock gold ore as products [42]. The geological and tectonic features of East Junggar are tied to the subduction from the Cambrian to the Permian. The exposed strata are mainly Devonian and Carboniferous, featuring widespread meso-basal intrusive rocks and late Paleozoic granitoids [43].
Regional folds, faults, ductile-brittle shear zones, and other structures are developed. The tectonic framework of the eastern Junggar region is the product of tectonic activities along the temporal and spatial changes of the basin-range interface since the late Paleozoic. Its tectonic evolution has experienced three stages of crustal action, which are post-collision extension in the late Carboniferous [44], intraplate rifting in the early-middle Permian, and extension in the early Jurassic [45,46]. The tectonic movement in the region is relatively complex, providing unique geological conditions for mineralization, and is an important part of the youngest Asian continent on earth.
The study area is situated in the northeastern margin of the East Junggar Basin. The region is marked by significant magmatic activity and the development of intrusive rocks [47]. The Devonian period is dominated by diorite-granite, the Carboniferous is gabbro-quartz diorite, gabbro-alkaline gabbro appeared in the late Carboniferous, and the Late Carboniferous to the Early Permian is dominated by granodiorite-granite and intruded by alkali-rich A-type granite, which indicates that the region is in the mature stage of crustal development [48]. The magmatic rocks are related to the generation of mineral. For example, they are very closely related to polymetallic mineralization, such as gold and copper, which provided a favorable heat source for the formation of ores [49]. The main ore and fossil occurrences are mainly found in the strata of the Lower Devonian Tuoranggekuduk Formation (D1t) and the Middle Silurian Baishanbao Formation (S2b). The Lower Devonian Tuoranggekuduk Formation is mainly a set of shallow marine pyroclastic rock, intermediate-basic volcanic lava, and pyroclastic sedimentary rock with carbonate rock construction, and slight metamorphism can be seen locally. The lithology is andesite, andesitic sedimentary breccia tuff, tuff, tuffaceous sandstone, and sandstone, etc. The Baishanbao Formation is a set of marine land margin fine clastic rocks. The rocks are obviously subjected to regional low-temperature dynamic metamorphism, and their lithologies are mainly metamorphosed siliceous rocks, siliceous slate, siliceous sericite slate, argillaceous slate, and phyllic siliceous siltstone.
Fracture structures are prevalent in the area, with the primary directions being north-west (NW) and north-west-west (NWW). These fractures, along with folds in the northwest direction, form the basic tectonic pattern of the area. The NWW-oriented fracture zone was formed earliest and is more developed. The NW-oriented fracture zone is the most developed and was formed concurrently with the NE-oriented fracture zone, cutting the NWW-oriented fracture zone. This has a controlling effect on mineralization. The mineralization is better in the tectonic intersections, where quartz veins and net veins are developed in the late stage. The Baishanbao Formation is a set of marine land margin fine clastic rocks. The rocks are obviously subjected to regional low-temperature dynamic metamorphism, and their lithologies are mainly metamorphosed siliceous rocks, siliceous slate, siliceous sericite slate, argillaceous slate, and phyllic siliceous siltstone (Figure 1c).
Figure 1. Regional geologic map, (a) Overview map of Central Asian Orogenic Belt [38]. (b) Simplified geological map of northern Xinjiang [50]. (c) Simplified geologic map of the Beitashan (the geological map is from the regional geological survey).
Minerals 15 00510 g001

3. Materials and Methods

3.1. Technical Route

The technical route of this research is shown in Figure 2. Firstly, the Landsat OLI data is preprocessed. Secondly, referencing the USGS spectral database, we analyzed the spectral features of hydroxyl- and iron-stained minerals indicative of mineral exploration in the study area. Suitable alteration feature bands for extracting information were selected, and combined bands were subjected to principal component analysis. Subsequently, a training and testing sample database was constructed. Finally, RAHC-AIE is used to train the sample set, and the training results are compared with the other two methods. The optimal model is selected for mineralization alteration mapping, and the experimental results are verified by field investigation.

3.2. Data Source and Preprocessing

3.2.1. Selection of Satellite Data

Landsat 8 OLI is a sensor developed by the United States Geological Survey (USGS) in cooperation with the National Aeronautics and Space Administration (NASA). The OLI imaging image has a width of 185 km × 185 km, with a total of 9 bands. Except for the panchromatic band with a resolution of 15m, the spatial resolution of the remaining bands is 30 m (Figure 3). The spectral range from blue to thermal infrared can obtain rich ground object information and provide favorable data support for the extraction of this alteration information [51].
The Landsat 8 OLI Level-1 TP images involved in this study were from the US Geological Survey Earth Resources Observation and Science Center (EROS) (https://earthexplorer.usgs.gov/, accessed on 8 May 2025). The data numbers are LC81410292017109LGN00 and LC81410282020118LGN00, adopted on 19 April 2017 and 27 April 2020, respectively. The images are clear. At this time, the vegetation coverage area is small, the bare degree of ground objects is ideal, and there is basically no cloud coverage, which is suitable for remote sensing alteration information extraction.

3.2.2. Data Preprocessing

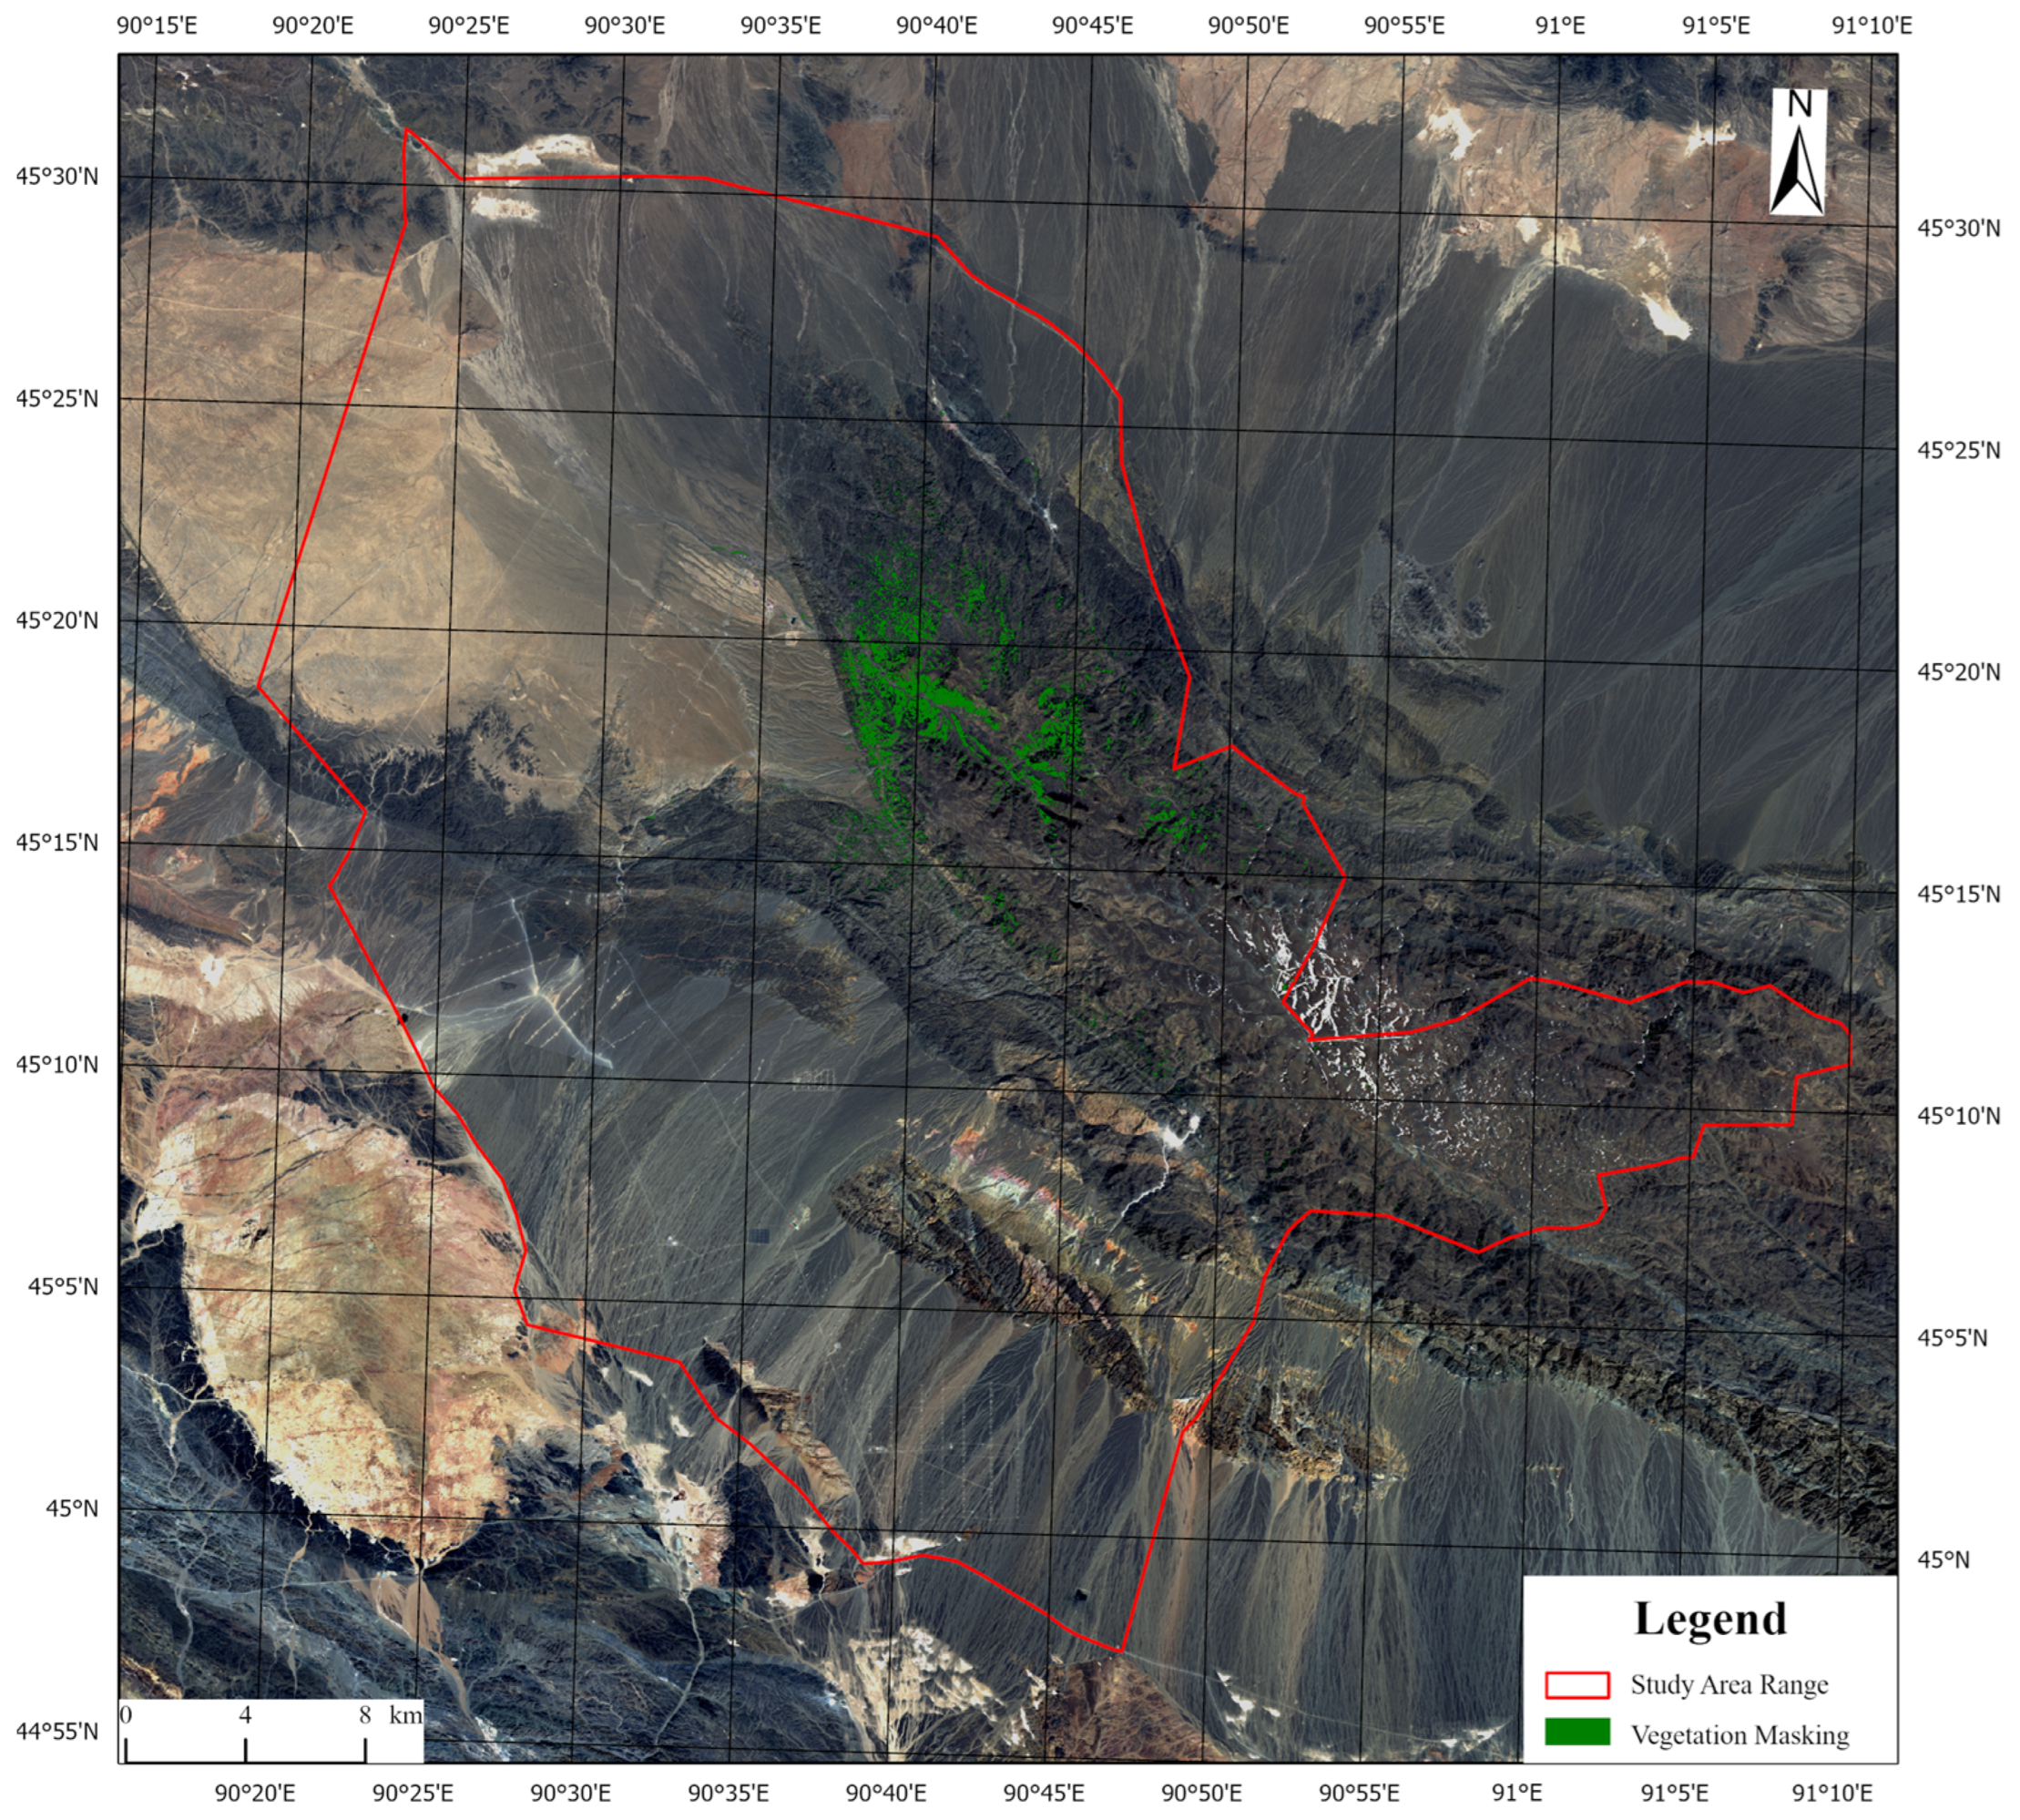
The Landsat 8 OLI Level-1 TP images obtained in this study, covering the study area, have been geometrically corrected as well as topographically corrected. Therefore, this study first performs radiometric calibration on the original Landsat 8 OLI image. Subsequently, Atmospheric correction of radiation data is performed using the classical FLAASH model. During atmospheric correction, the original radiation data from the imaging spectrometer is rescaled into reflectivity units. Finally, basic processing such as image mosaicking, image cropping, and de-disturbance is performed. In this study, the vegetation was extracted using the normalized vegetation index (NDVI), and the calculation formula was: NDVI = (Band5 − Band4)/(Band5 + Band4). The 0.3 < NDVI < 1 segmentation threshold was used to establish the mask file to remove the interference of vegetation, as shown in Figure 4, and, finally, the remote sensing data before the extraction of alteration information was obtained.

3.3. Spectral Characteristics of Minerals

The extraction of alteration information using remote sensing technology mainly relies on the spectral characteristics of minerals. The spectral characteristics of minerals are mostly related to iron ions, hydroxyl groups, carbonates, and some cations. For mineral spectra, molecular vibrations are usually generated by anions such as water (H2O), hydroxyl groups (OH), and acid radical ions (CO32−) in the mineral composition, while the spectra of the electronic genesis are often formed by the leaps of cations such as Fe2+ and Fe3+ ions [6]. In addition, it has been found that many minerals have diagnostic absorption characteristics in the spectral region (0.3–2.5 μm) [52]. For example, iron oxide minerals (limonite, jarosite, hematite) show spectral absorption characteristics in the visible-near infrared (0.4~1.1 μm) range; hydroxyl-containing minerals (clays, sulfates, carbonates) show spectral absorption characteristics in the short-wave infrared (2.0~2.5 μm) range [6].
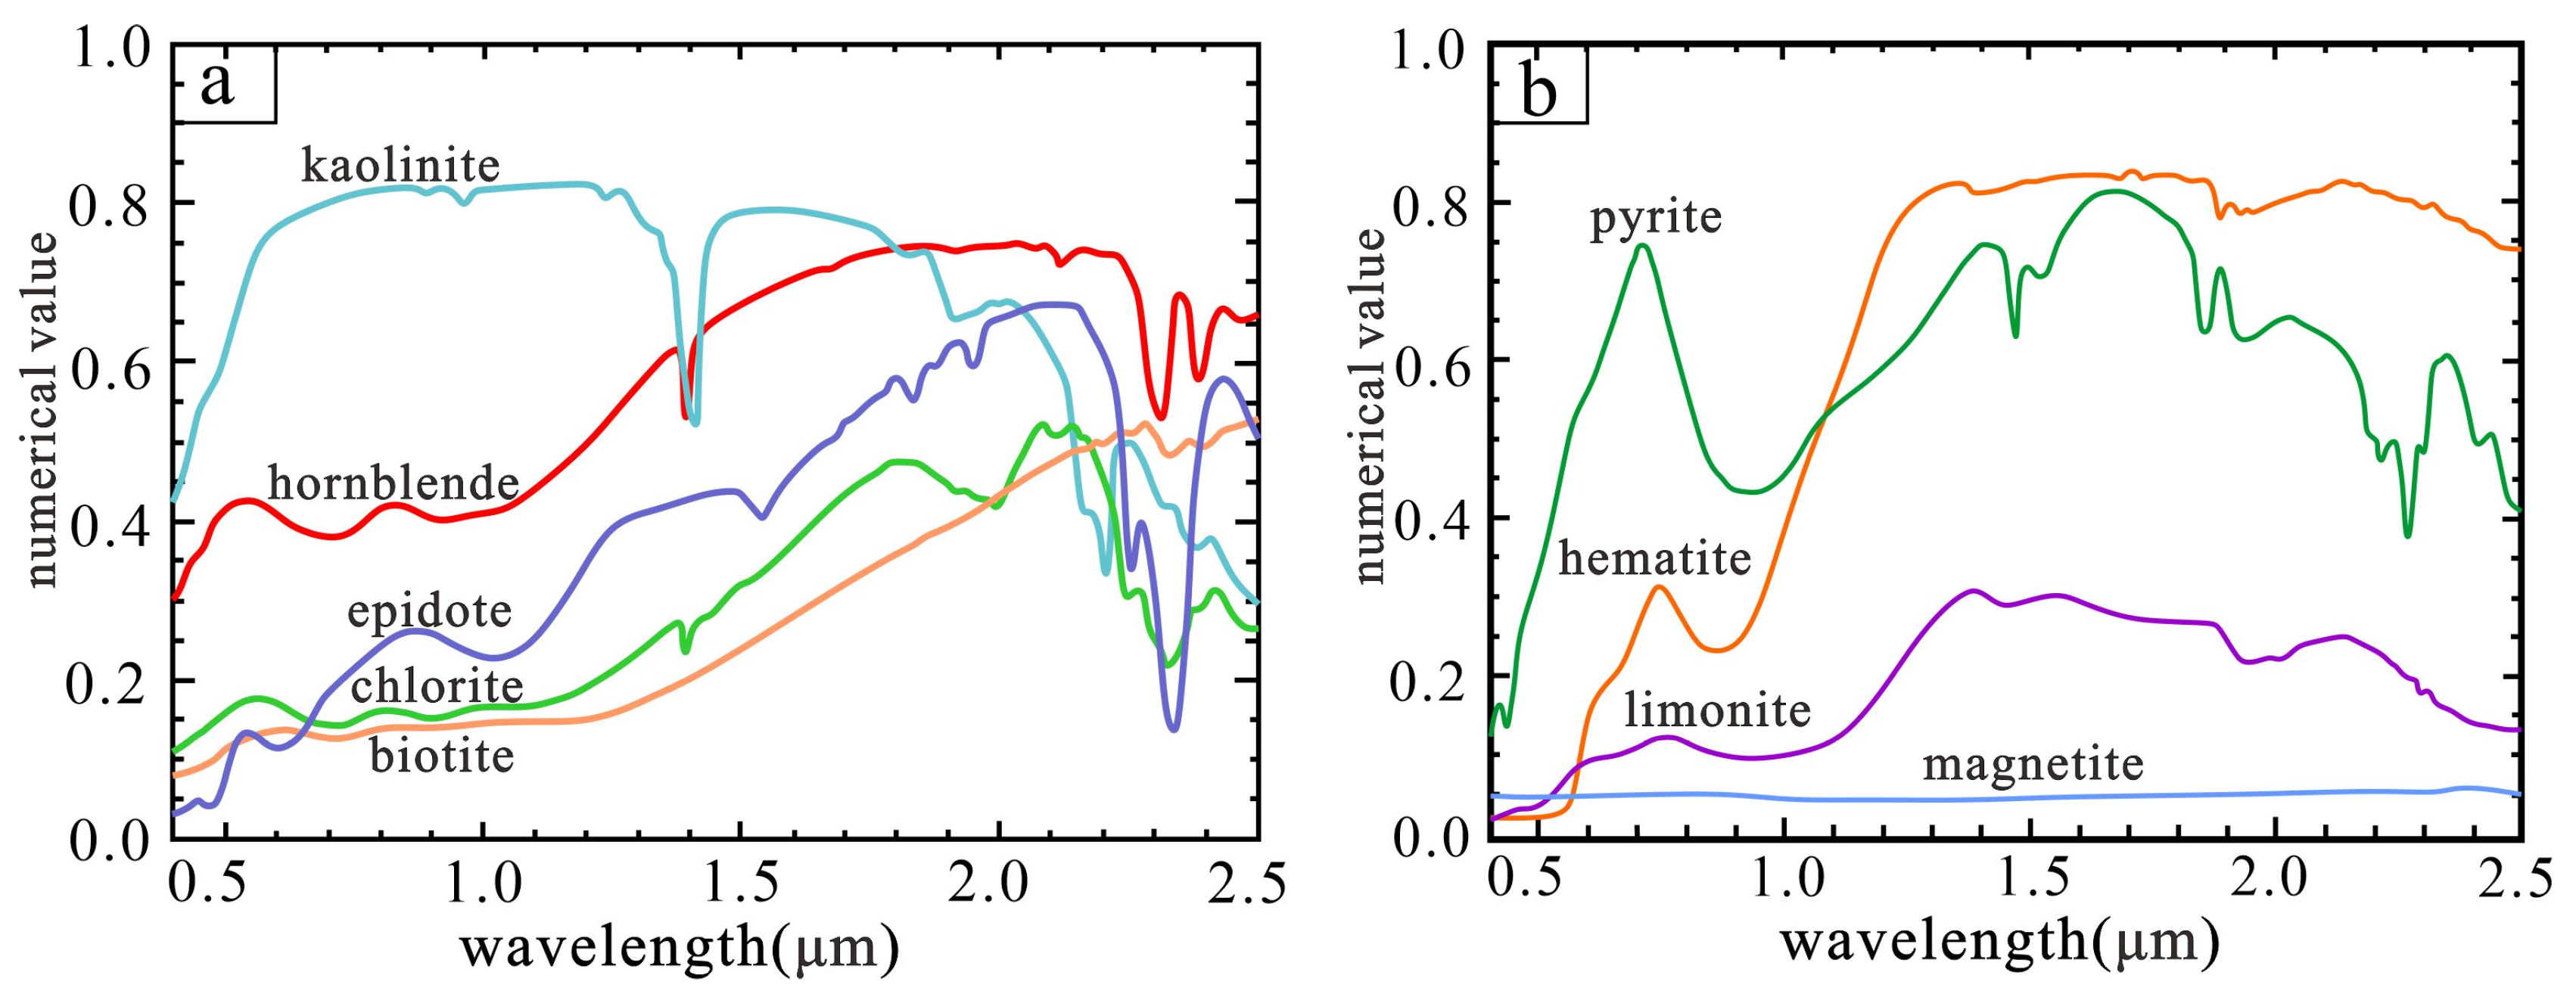
Hydrothermal alteration mainly occurs in the ductile shear zone, the tectonic fracture zone, the intrusive rock, and the surrounding rock. The wall rock alterations in these areas are mainly sericitization, chloritization, epidotization, pyritization, limonite mineralization, carbonatization, and silicification. Therefore, the hydroxyl and iron-stained alteration information is most indicative of mineral exploration in the study area. Subsequently, the extracted alteration types were classified into two categories: iron staining and hydroxyl groups. The development of wall rock alteration in the study area is as follows: Hydroxyl minerals mainly include chlorite, biotite, kaolinite, epidote, and amphibole. Iron-stained minerals include magnetite, limonite, hematite, and pyrite. Referring to the spectral curves of altered minerals in the USGS spectral library, the spectral analysis tools in the ENVI 5.6 software are used to identify the altered minerals. Finally, the corresponding spectral curves of the absorption bands of each altered mineral and the Landsat 8 OLI band are obtained (Figure 5). Different mineral assemblages have different spectral characteristics of alteration types [5]. Chlorite, biotite, kaolinite, epidote, and amphibole show strong reflection characteristics near 0.85 μm, and strong absorption characteristics near 2.10–2.30 μm, corresponding to band 5 (0.845–0.885 μm), 1.57–1.65, and band 7 (2.10–2.30 μm). Limonite, hematite, and pyrite show absorption valleys near 0.45~0.50 μm and 0.86 μm, which have diagnostic characteristics. Band 2 (0.450~0.515 μm) and band 5 (0.845~0.885 μm), corresponding to the OLI data, show strong reflection characteristics near 0.65 μm and 1.61 μm, corresponding to band 4 (0.630~0.680 μm) and band 6 (1.560~1.660 μm) of the OLI data. Based on this, different extraction schemes were constructed.

3.4. Training and Test Sample Generation

In this study, deep learning technology is used to identify altered information containing hydroxyl and iron staining, so samples need to be labeled. Two knowledge-driven mapping methods are utilized to generate training samples. Based on the characteristics of typical altered mineral assemblages in the study area, all reference spectra are divided into two types: hydroxyl and iron staining.
Principal Component Analysis (PCA) is a statistical method widely used in remote sensing image decorrelation and spectral contrast enhancement [40]. It can reduce the dimension of high-dimensional variables, realize data compression, and form principal components with more reasonable internal relations or clearer significance in multi-spectral images through certain mathematical recombination [53]. The correlation of each band’s data was removed by PCA. The principal component is selected to highlight the alteration information and eliminate the interference to a certain extent, so as to highlight the specific geological content [5]. According to the spectral characteristics of minerals, the appropriate bands are selected for PCA, which can effectively enhance and extract the mixed mineralization alteration information.
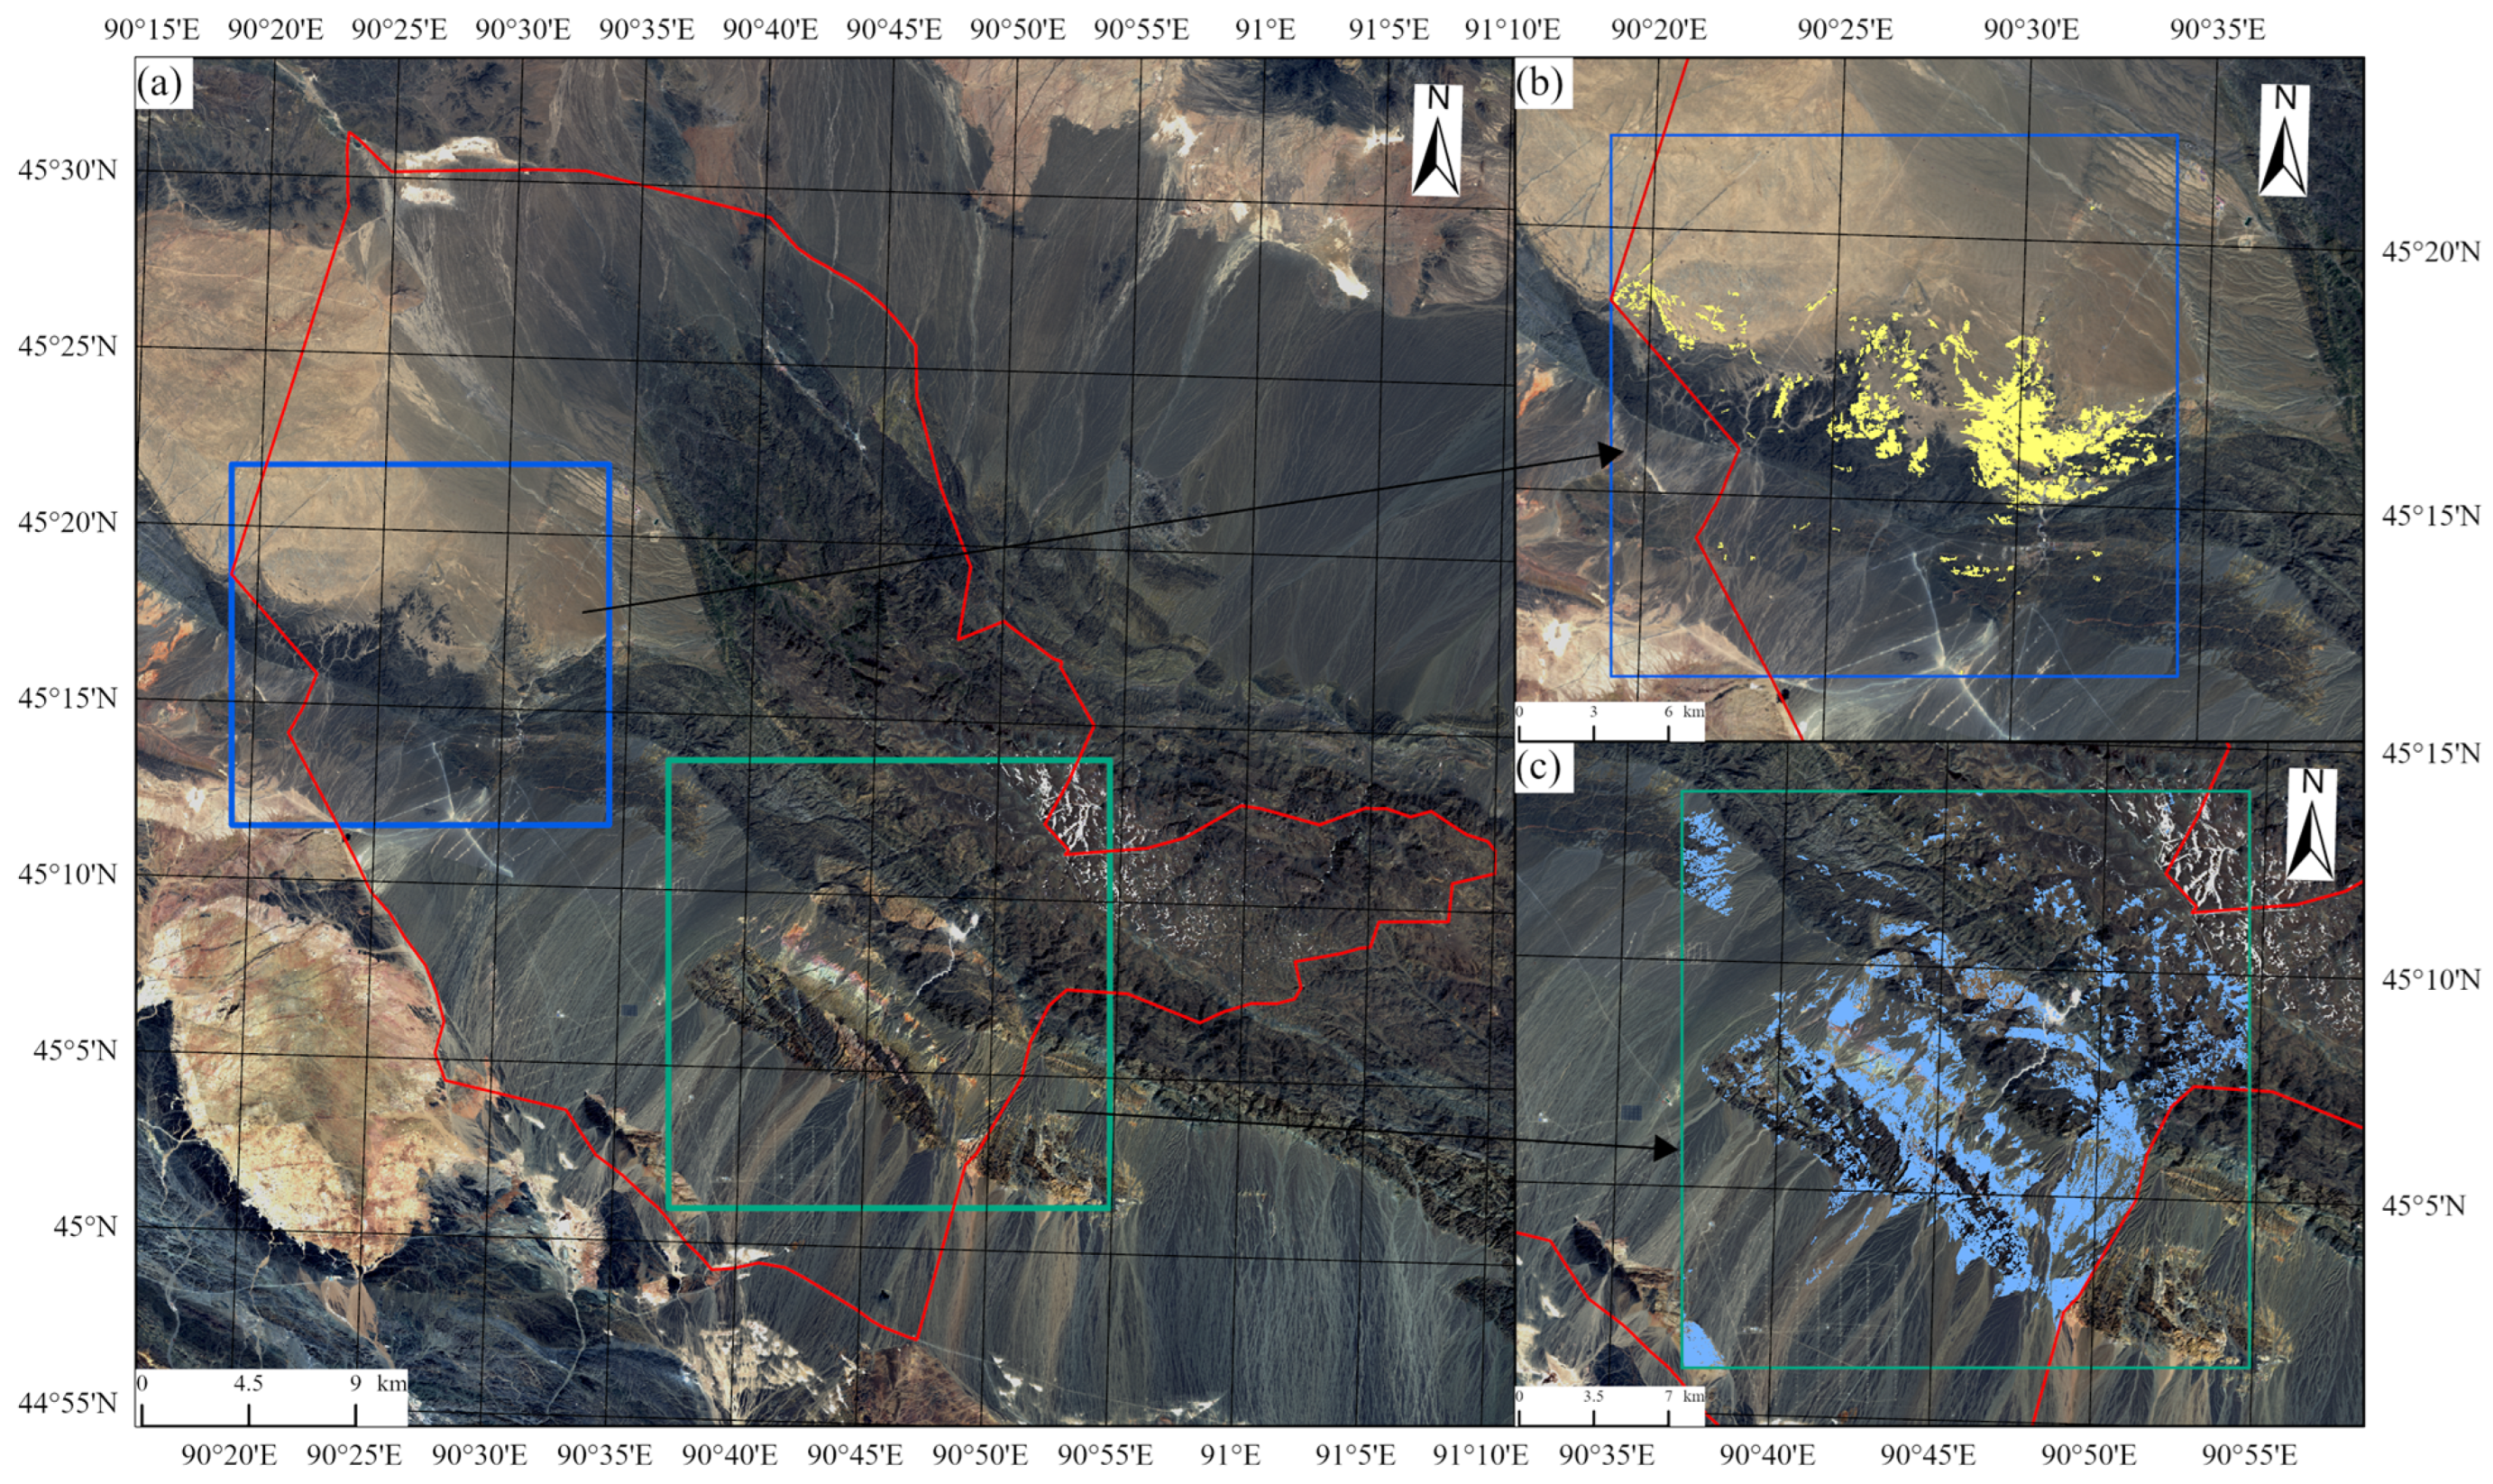
The PCA method was used to make the sample set. According to the spectral characteristics of Fe3+ ions, the iron-stained minerals have absorption valleys at band 2 and band 5, and band 4 shows reflection peaks. Therefore, the four bands of band 2, band 4, band 5, and band 6 were subjected to principal component transformation to extract the sample set of iron-stained mineralized alteration. According to the spectral characteristics of hydroxyl (OH), hydroxyl-containing minerals (montmorillonite, illite, chlorite, tremolite, etc.) have absorption valleys near band 7, and reflectance peaks near band 6. Therefore, the four bands of band 2, band 5, band 6, and band 7 were subjected to principal component transformation to extract the sample set of hydroxyl mineralized alteration. The extraction results were calculated in ENVI 5.6 software, and the output is shown in Figure 6.
When collecting training and test samples of hydroxyl alteration information, 23,074 points are selected as positive samples. When collecting training and test samples of iron-stained alteration information, 78,340 points are selected as positive samples. Background classes, including unaltered rocks, wastelands, and water bodies, are taken as negative samples, as shown in Figure 6. All samples were divided into a training set and a test set according to the ratio of 7:3. In order to avoid the leakage of feature information, ensure that the training set and the test set are independent of each other in spatial distribution and have no intersection.

3.5. Alteration Information Extraction Network Combining Residual Attention and Hybrid Convolution

3.5.1. Network Structure

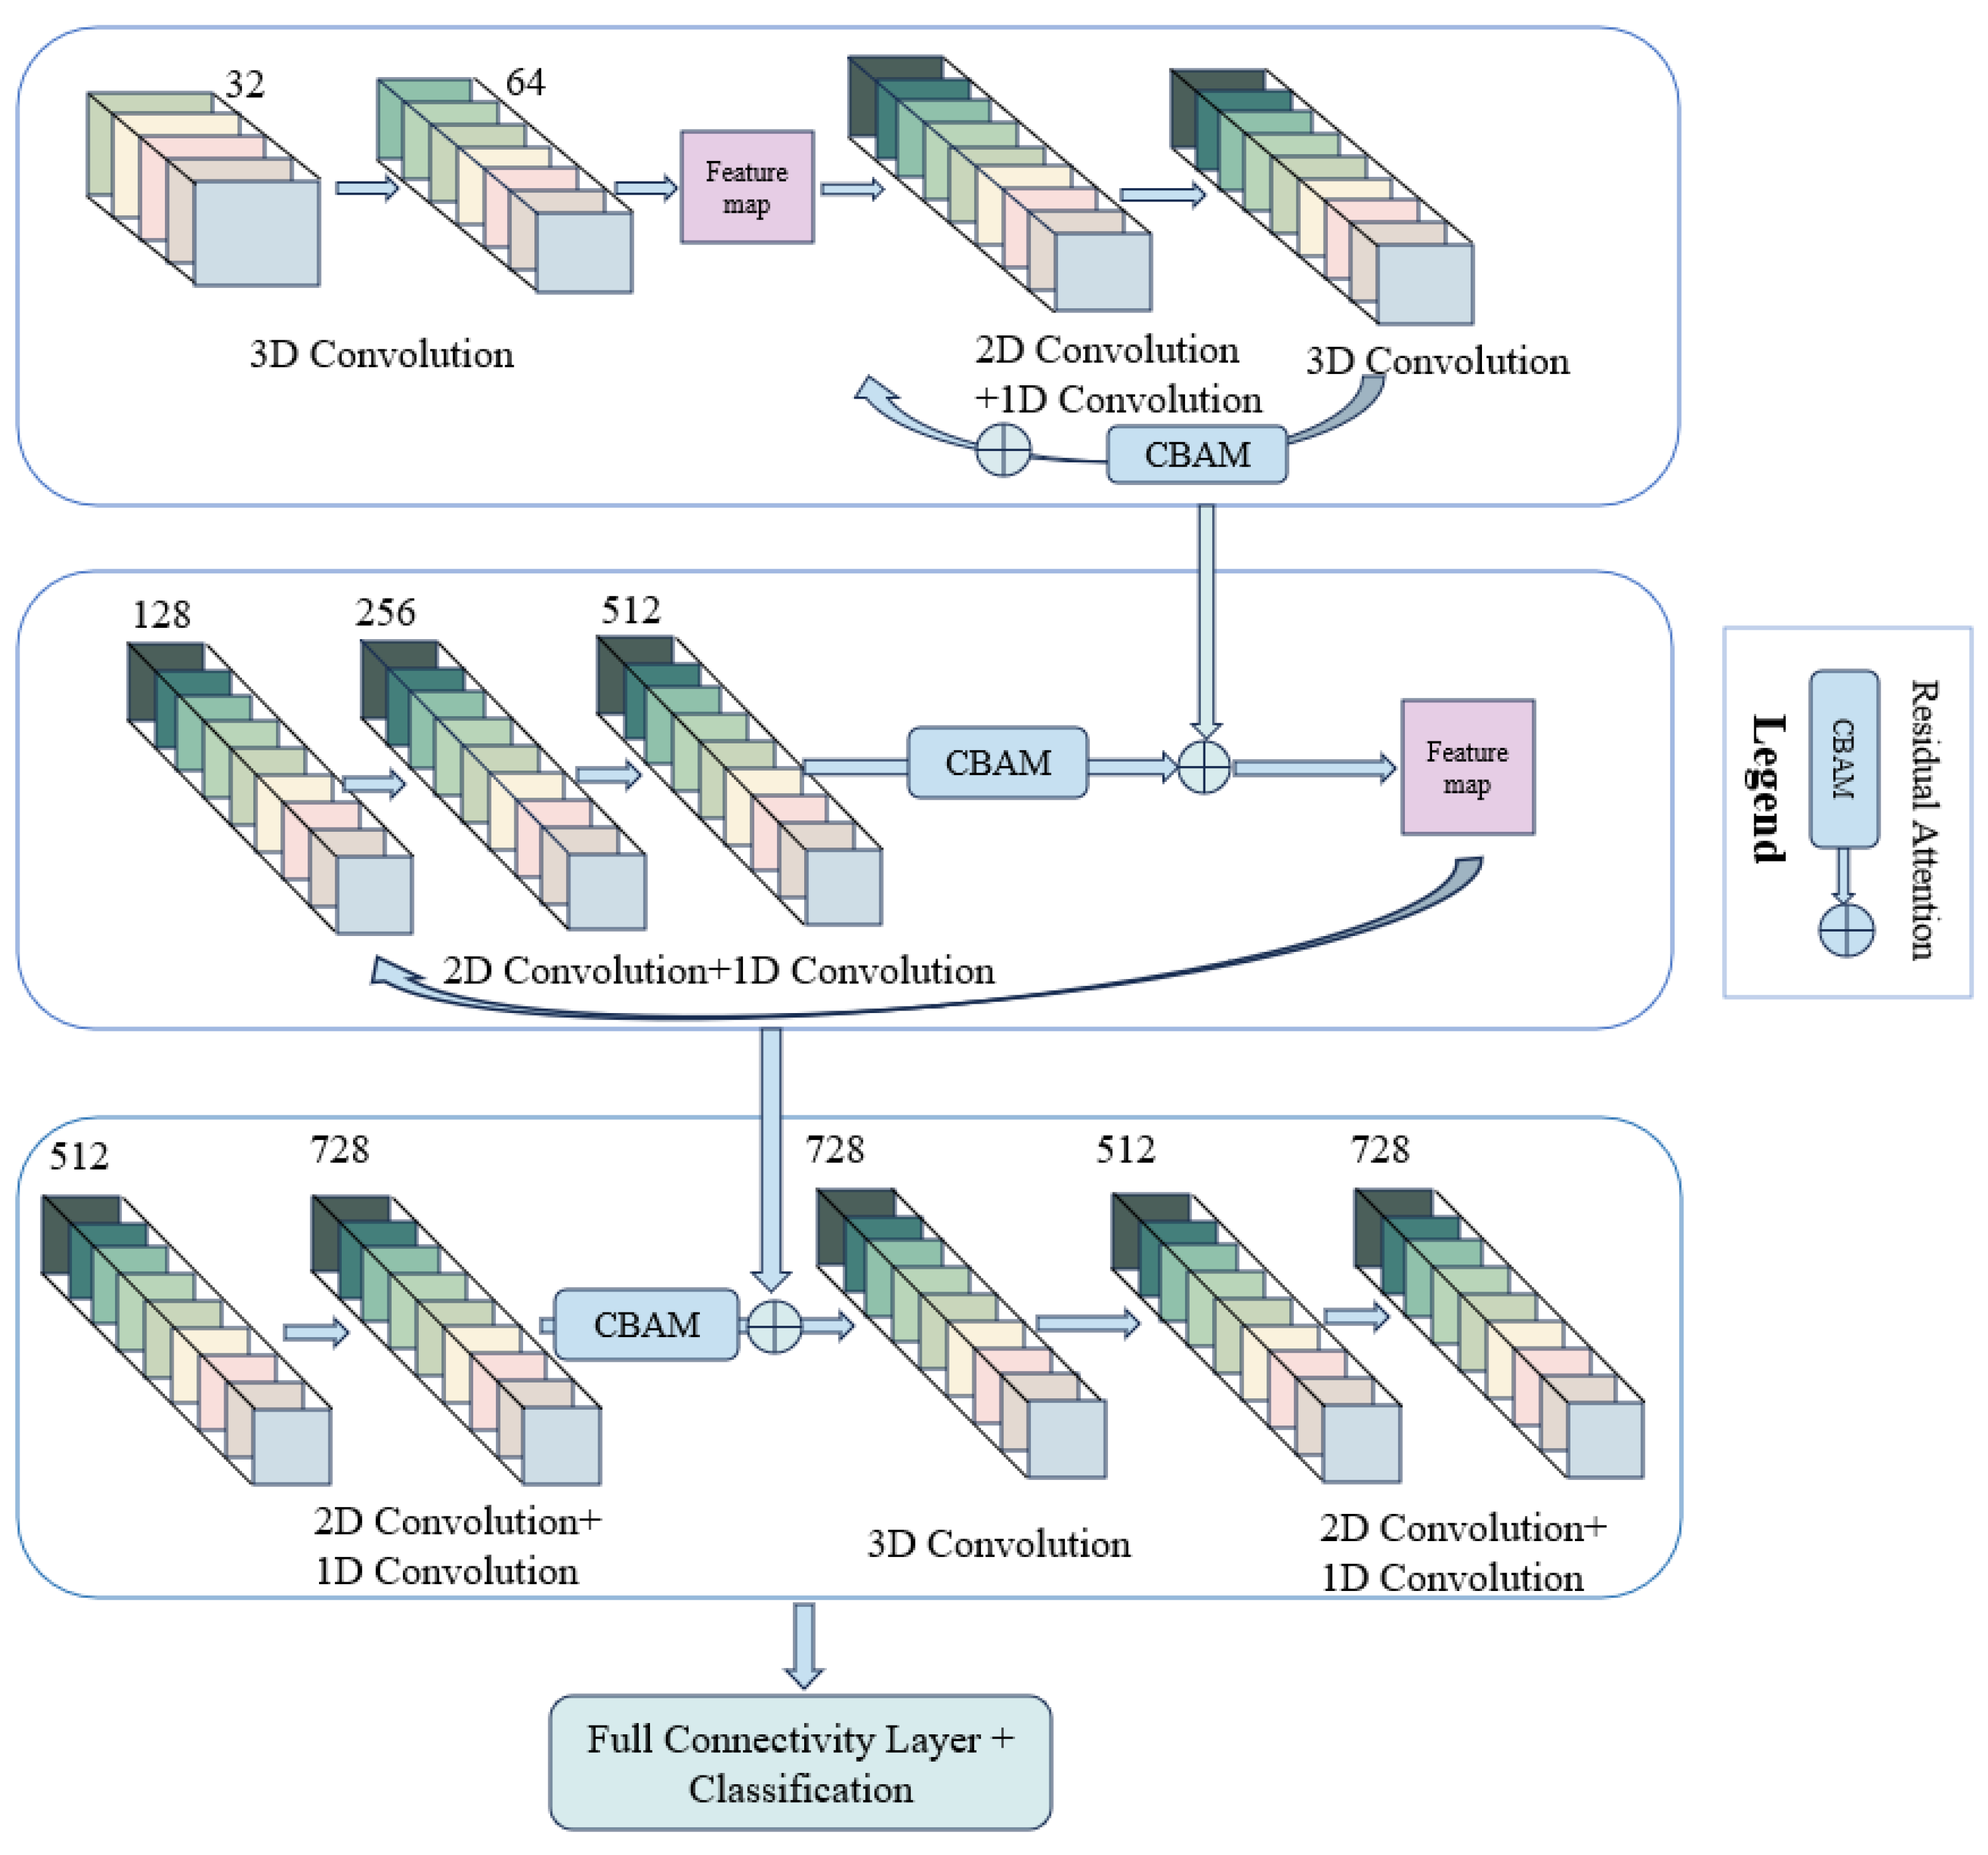
We designed an Alteration Information Extraction Network combining Residual Attention and Hybrid Convolution (RAHC-AIE), which employs the residual attention mechanism and hybrid convolution, as shown in Figure 7. The architecture is carefully divided into three distinct parts, each playing a vital role in feature extraction and fusion:
It begins with two 3D-CNN layers, followed by a 2D-CNN layer, a 1D-CNN layer, and another 3D-CNN layer. The 2D-CNN layer extracts spatial features, capturing local spatial relationships. The 1D-CNN layer then focuses on spectral features, critical for understanding data characteristics. The subsequent 3D-CNN layer integrates these spatial and spectral features. After passing through the 2D-CNN, 1D-CNN, and this 3D-CNN layer, the resulting feature map is fused with features from the two initial 3D-CNN layers via the residual attention mechanism. This mechanism emphasizes important features while suppressing unimportant ones. The filter numbers for 2D-CNN and 1D-CNN (128, 256, 512) are chosen to balance the computational complexity and feature-representation capability. Smaller filters (128) start basic feature extraction, while increasing to 256 and 512 captures more complex details as data progresses.
Comprising a 2D-CNN layer and a 1D-CNN layer, the feature fusion here uses the residual attention mechanism with the first part’s feature map. This process repeats four times. Consistent filter numbers (128, 256, and 512 for 2D-CNN and 1D-CNN) ensure a stable feature-extraction process. Repeating these layers and fusion enhances feature representation, capturing multi-scale and multi-aspect features to improve robustness.
It has two units. The first unit (2D-CNN and 1D-CNN with 512 and 728 filters) extracts high-level spatial (512 filters) and detailed spectral (728 filters) features. The second unit (3D-CNN, 2D-CNN, 1D-CNN) receives feature maps from the first unit and the second part via the residual attention mechanism for fusion. The 3D-CNN layer in the second unit integrates features in a three-dimensional context. Finally, the fully-connected layer aggregates features from all previous layers, ensuring comprehensive information use. The classification layer (e.g., with a softmax activation for multi-class problems) converts these features into class probabilities for final label determination.
Each part of the RAHC-AIE is purposefully designed. The combination of convolution layers and the residual attention mechanism allows the network to effectively extract, fuse, and classify alteration information from input data, ensuring accurate and robust performance in its task.

3.5.2. Residual Attention

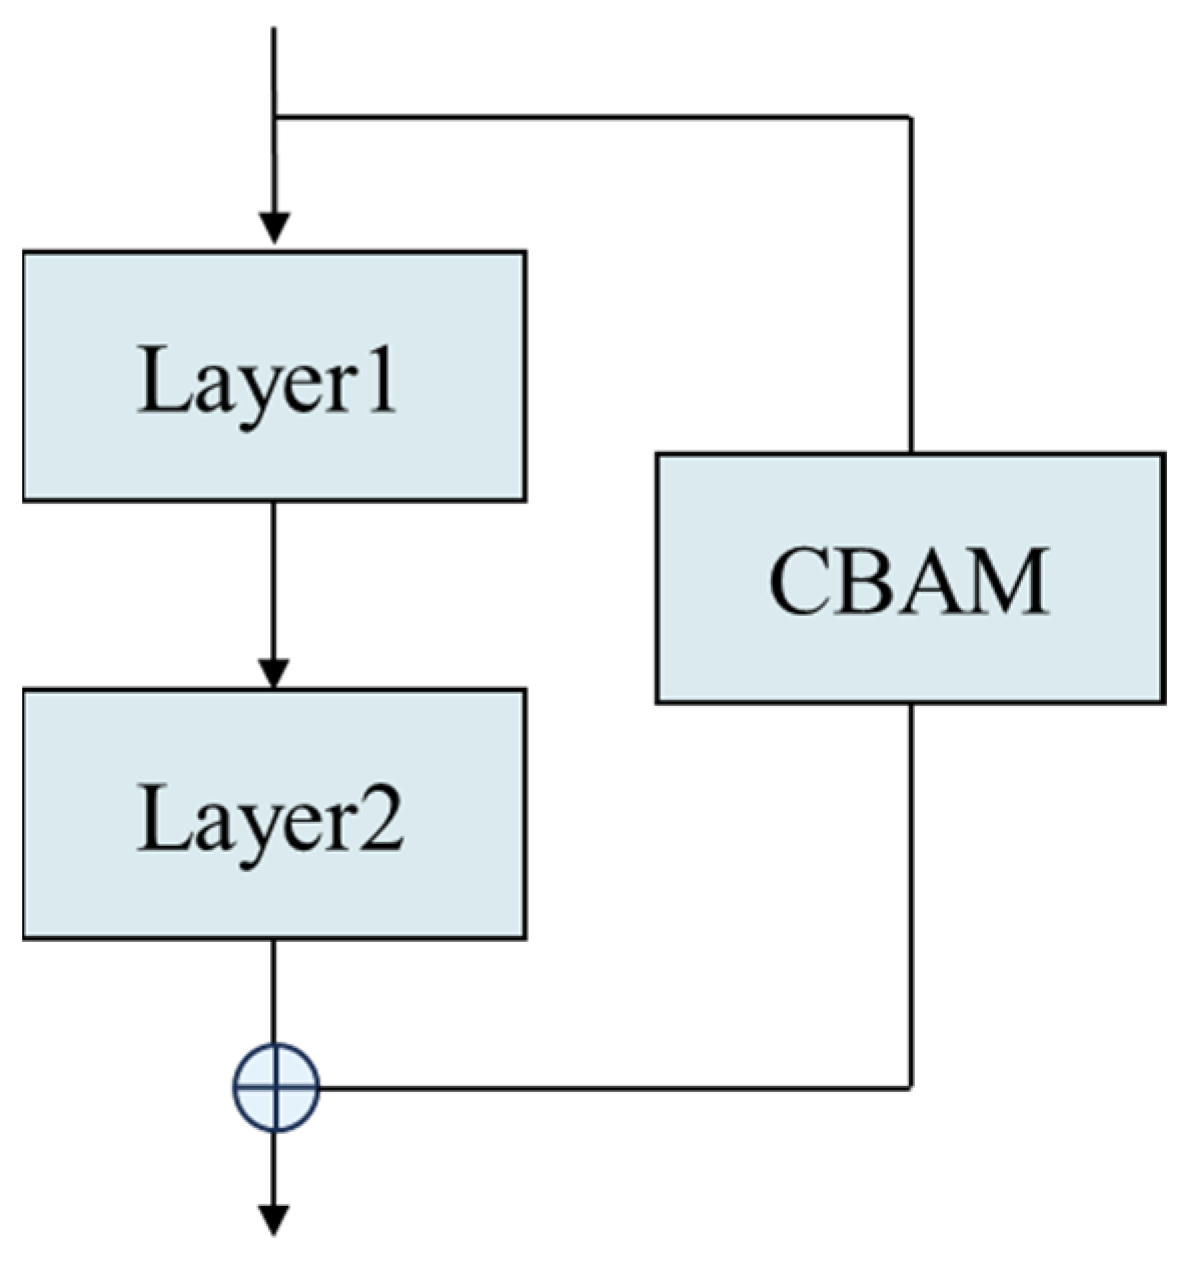
The residual attention mechanism mainly draws on the idea of skip connection and the attention mechanism of the residual network. When using the convolutional neural network for feature extraction, with the increase of network depth, gradient disappearance and feature information loss may occur. As shown in Figure 8, by adding a skip connection, the features of the original input and the output of the last convolutional layer are fused to retain more details and semantic information of the original image.
Assuming that the input feature information is x and the feature after multiple convolutional layers is F ( x ) , the feature information after skip connection is F ( x ) + x .
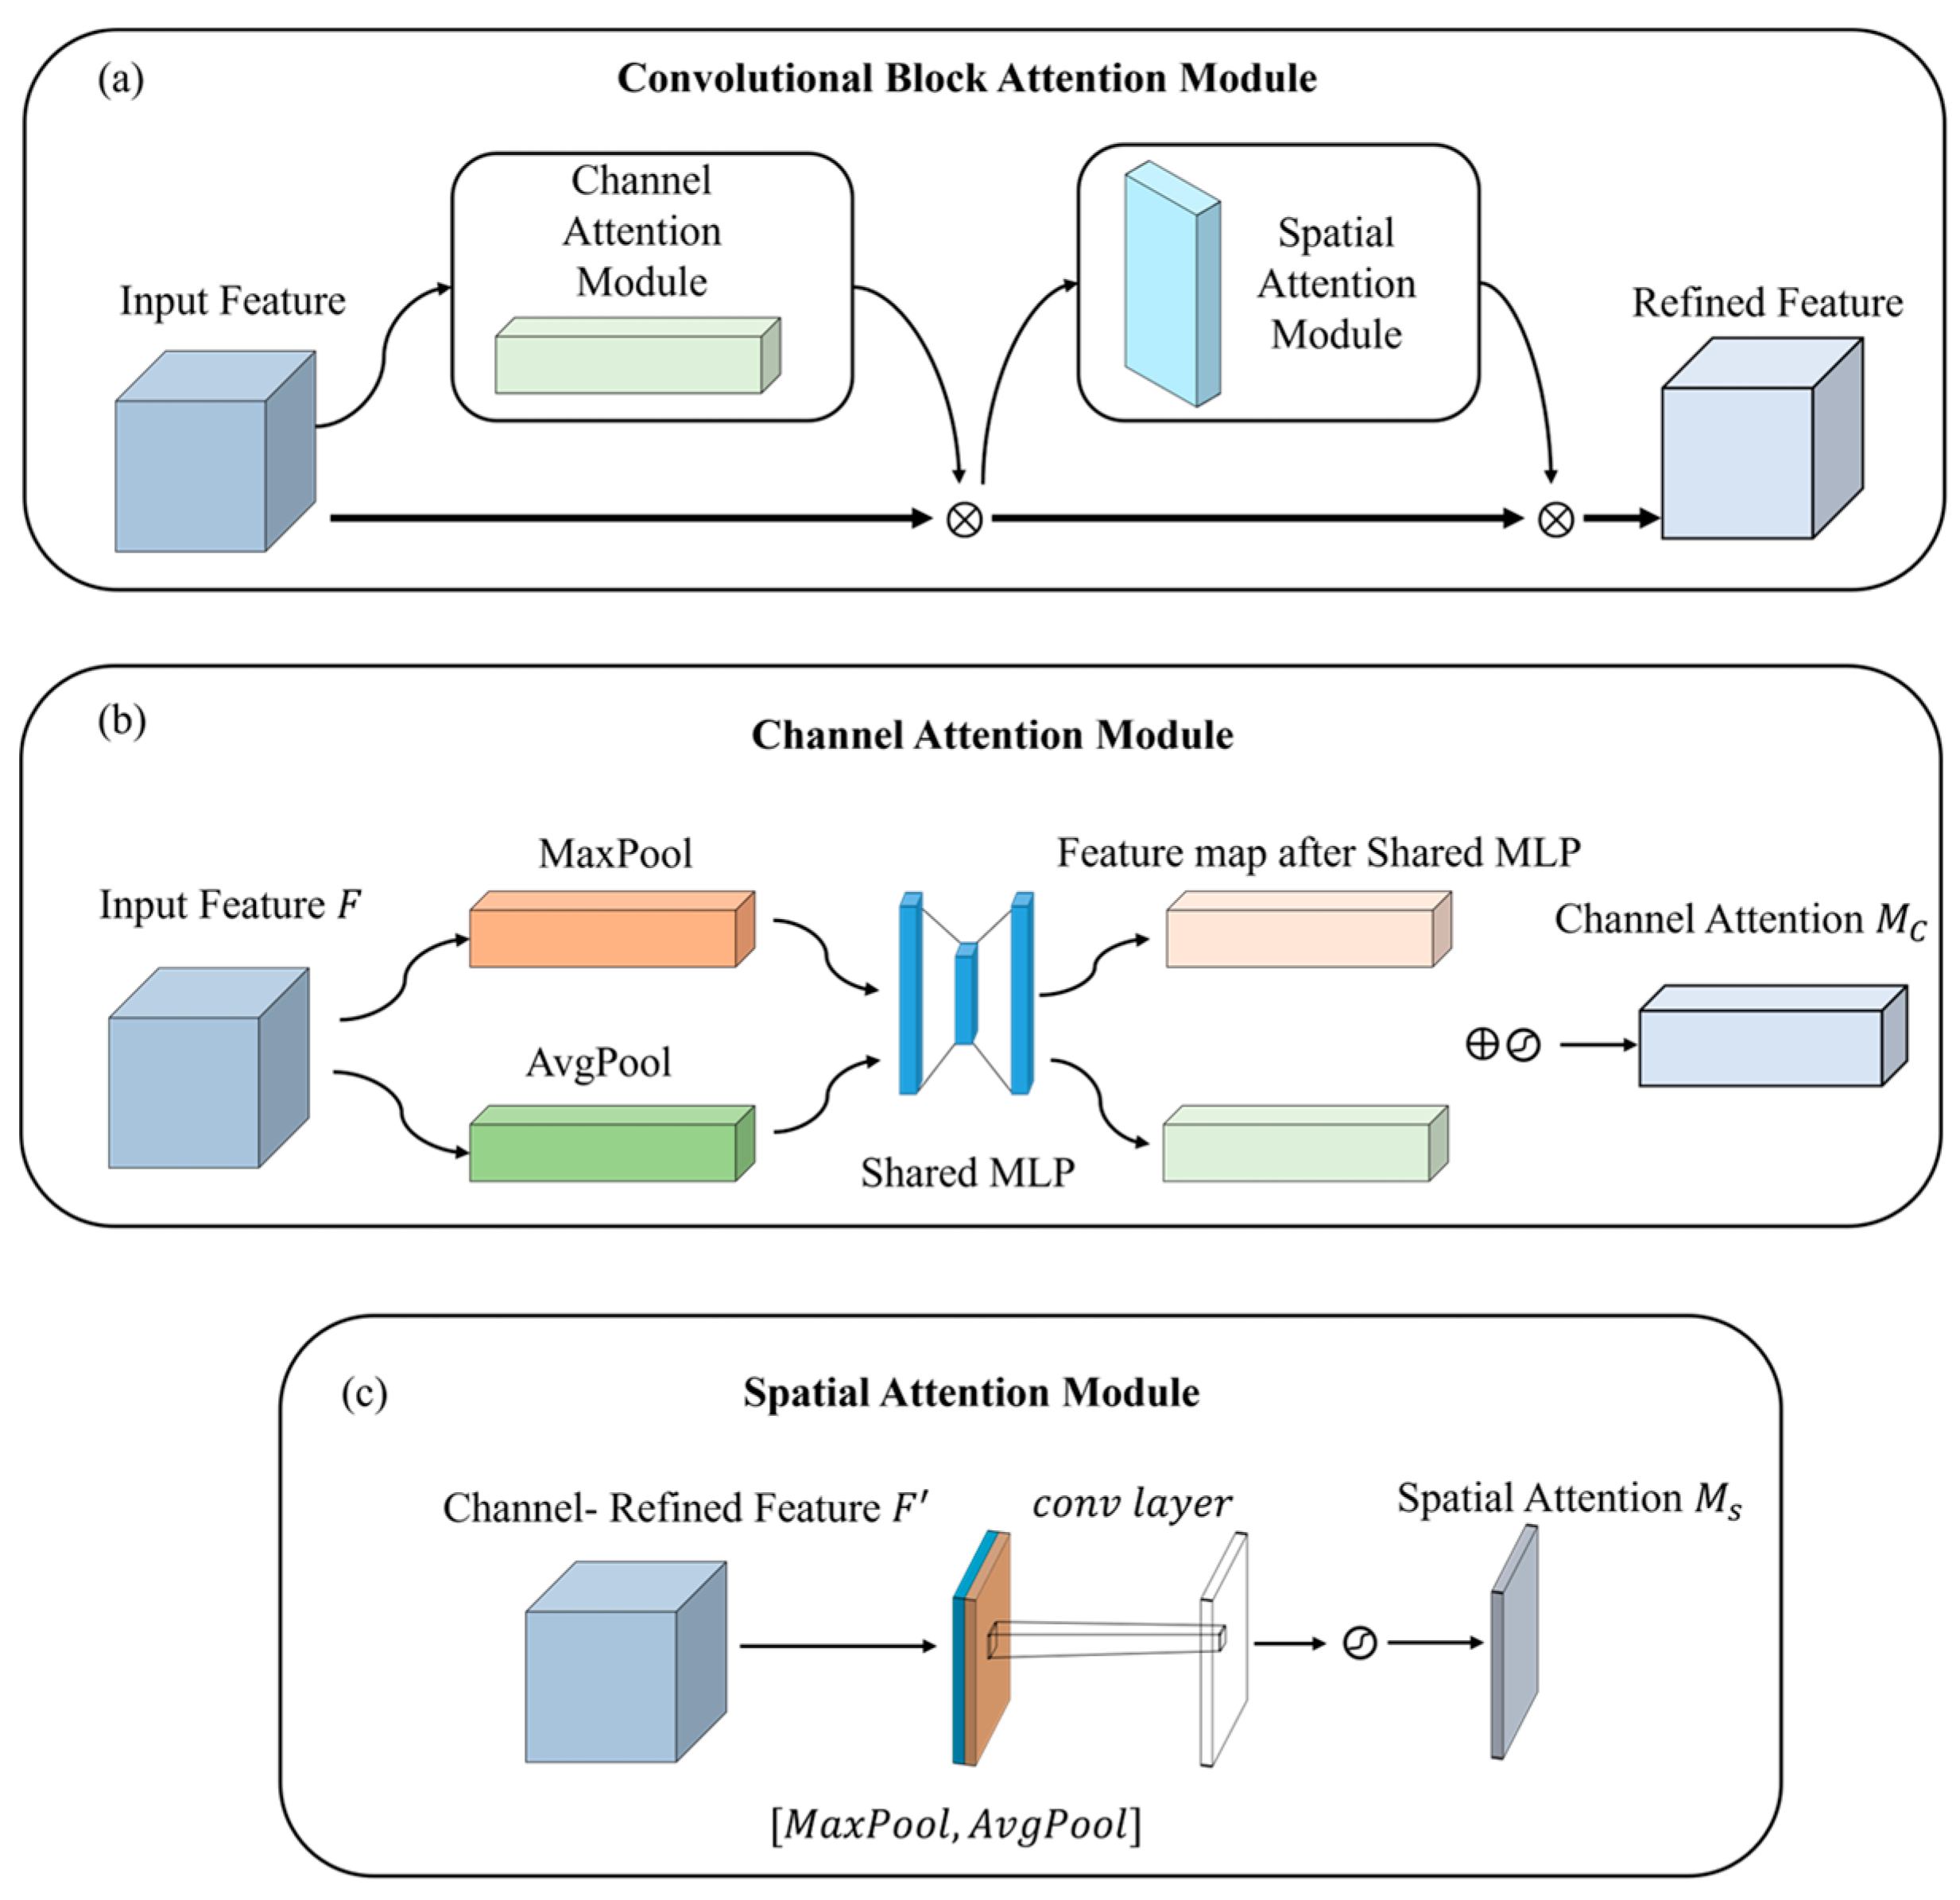
In the field of computer vision, the ability to focus attention on important areas of an image and discard irrelevant information is called attention mechanisms [54]. The attention mechanism is a critical technology in deep learning, primarily used to enhance model performance in data processing. Its core idea is to assign varying weights to different parts of the input, enabling the model to effectively manage long sequences or complex data. This capability allows the model to focus on information pertinent to the current task. The Convolutional Block Attention Module (CBAM) is an attention mechanism designed for Convolutional Neural Networks. It enhances feature representation through two main components, thereby selectively emphasizing information-rich features and suppressing irrelevant features. The CBAM is a lightweight attention module (Figure 9):
The CBAM comprises two main components: the channel attention module and the spatial attention module. Initially, the input feature map undergoes dot product operations with the channel attention module. Subsequently, it undergoes dot product operations with the spatial attention module. Finally, the CBAM processes the results to derive the final feature map. The skip connection and the CBAM are combined to form a residual attention mechanism. As shown in Figure 10, the CBAM module is added to the path of the skip connection, which solves the problem of information loss and enables the model to focus on important feature information.
Assuming the input feature information is x, the feature after multiple convolutional layers is F(x), the feature after CBAM is CBAM(x), and the feature information after the residual attention mechanism is F(x) + CBAM(x).

3.5.3. Experimental Environment Design

The experimental GPU environment was RTX A4000, and TensorFlow (https://github.com/tensorflow/tensorflow, accessed on 8 May 2025) was used as the deep learning framework. In this study, we employed the Adam optimizer for gradient descent. Adam is an adaptive learning rate optimization algorithm that combines the advantages of Adagrad and RMSProp. It can adaptively adjust the learning rate for different parameters, which helps improve the convergence speed and stability of the model.
The parameters of the Adam optimizer are set as follows:
Learning rate: It is set to 0.0001. This learning rate was determined through multiple experiments and validations. A smaller learning rate allows the model to converge more stably during training, avoiding issues such as non-convergence or oscillation around the optimal solution caused by an overly large learning rate.
Decay rate: It is set to 1 × 10⁻⁶. The decay rate is used to gradually reduce the learning rate during training, enabling the model to fine-tune its parameters more precisely in the later stages of training and improving the model’s generalization ability.

3.5.4. Evaluation Indicators

In deep learning, the confusion matrix is often used to evaluate the performance of the model (Figure 11), which is used to visualize the performance of the supervised learning algorithm. In this matrix, each row represents the actual category, each column represents the prediction category, and each matrix cell contains the number of samples under the actual category and the prediction category.
Through the confusion matrix, some important performance indicators can be calculated. Pixel Accuracy (PA) represents the proportion of correctly classified pixels in the total pixels, which is defined as:
P A = T P + T N T P + T N + F P + F N
Mean Pixel Accuracy (MPA) represents the average of the accuracy of various types of pixels, which is defined as:
M P A = T P T P + F P
The kappa coefficient (kappa) is used to measure the improvement of the classifier compared with the random classifier. The value is between [−1, 1], 1 means completely consistent, and 0 means completely random, which is defined as:
K a p p a = p 0 p e 1 p e
where p 0 is the observed accuracy and p e is the expected random accuracy.
Mean F1 Score (Mean_F1) is the average of F1 scores of each category, which combines MPA and Recall. Therefore, Mean_F1 can balance the performance of classifiers in different categories, which is defined as:
R e c a l l = T P T P + F N
F 1 = R e c a l l M P A R e c a l l + M P A
M e a n _ F 1 = i N 1 F 1 N
where N denotes the number of categories.
Frequency Weighted Intersection over Union (FWIoU) is especially suitable for the case of class imbalance. It measures the performance of the model by using the frequency of each category as a weight and calculating the weighted average of all categories of Intersection over Union (IoU). It is defined as:
F W I o U = T P + F N T P + F P + T N + F N T P T P + F P + F N

4. Result

4.1. Sample Performance

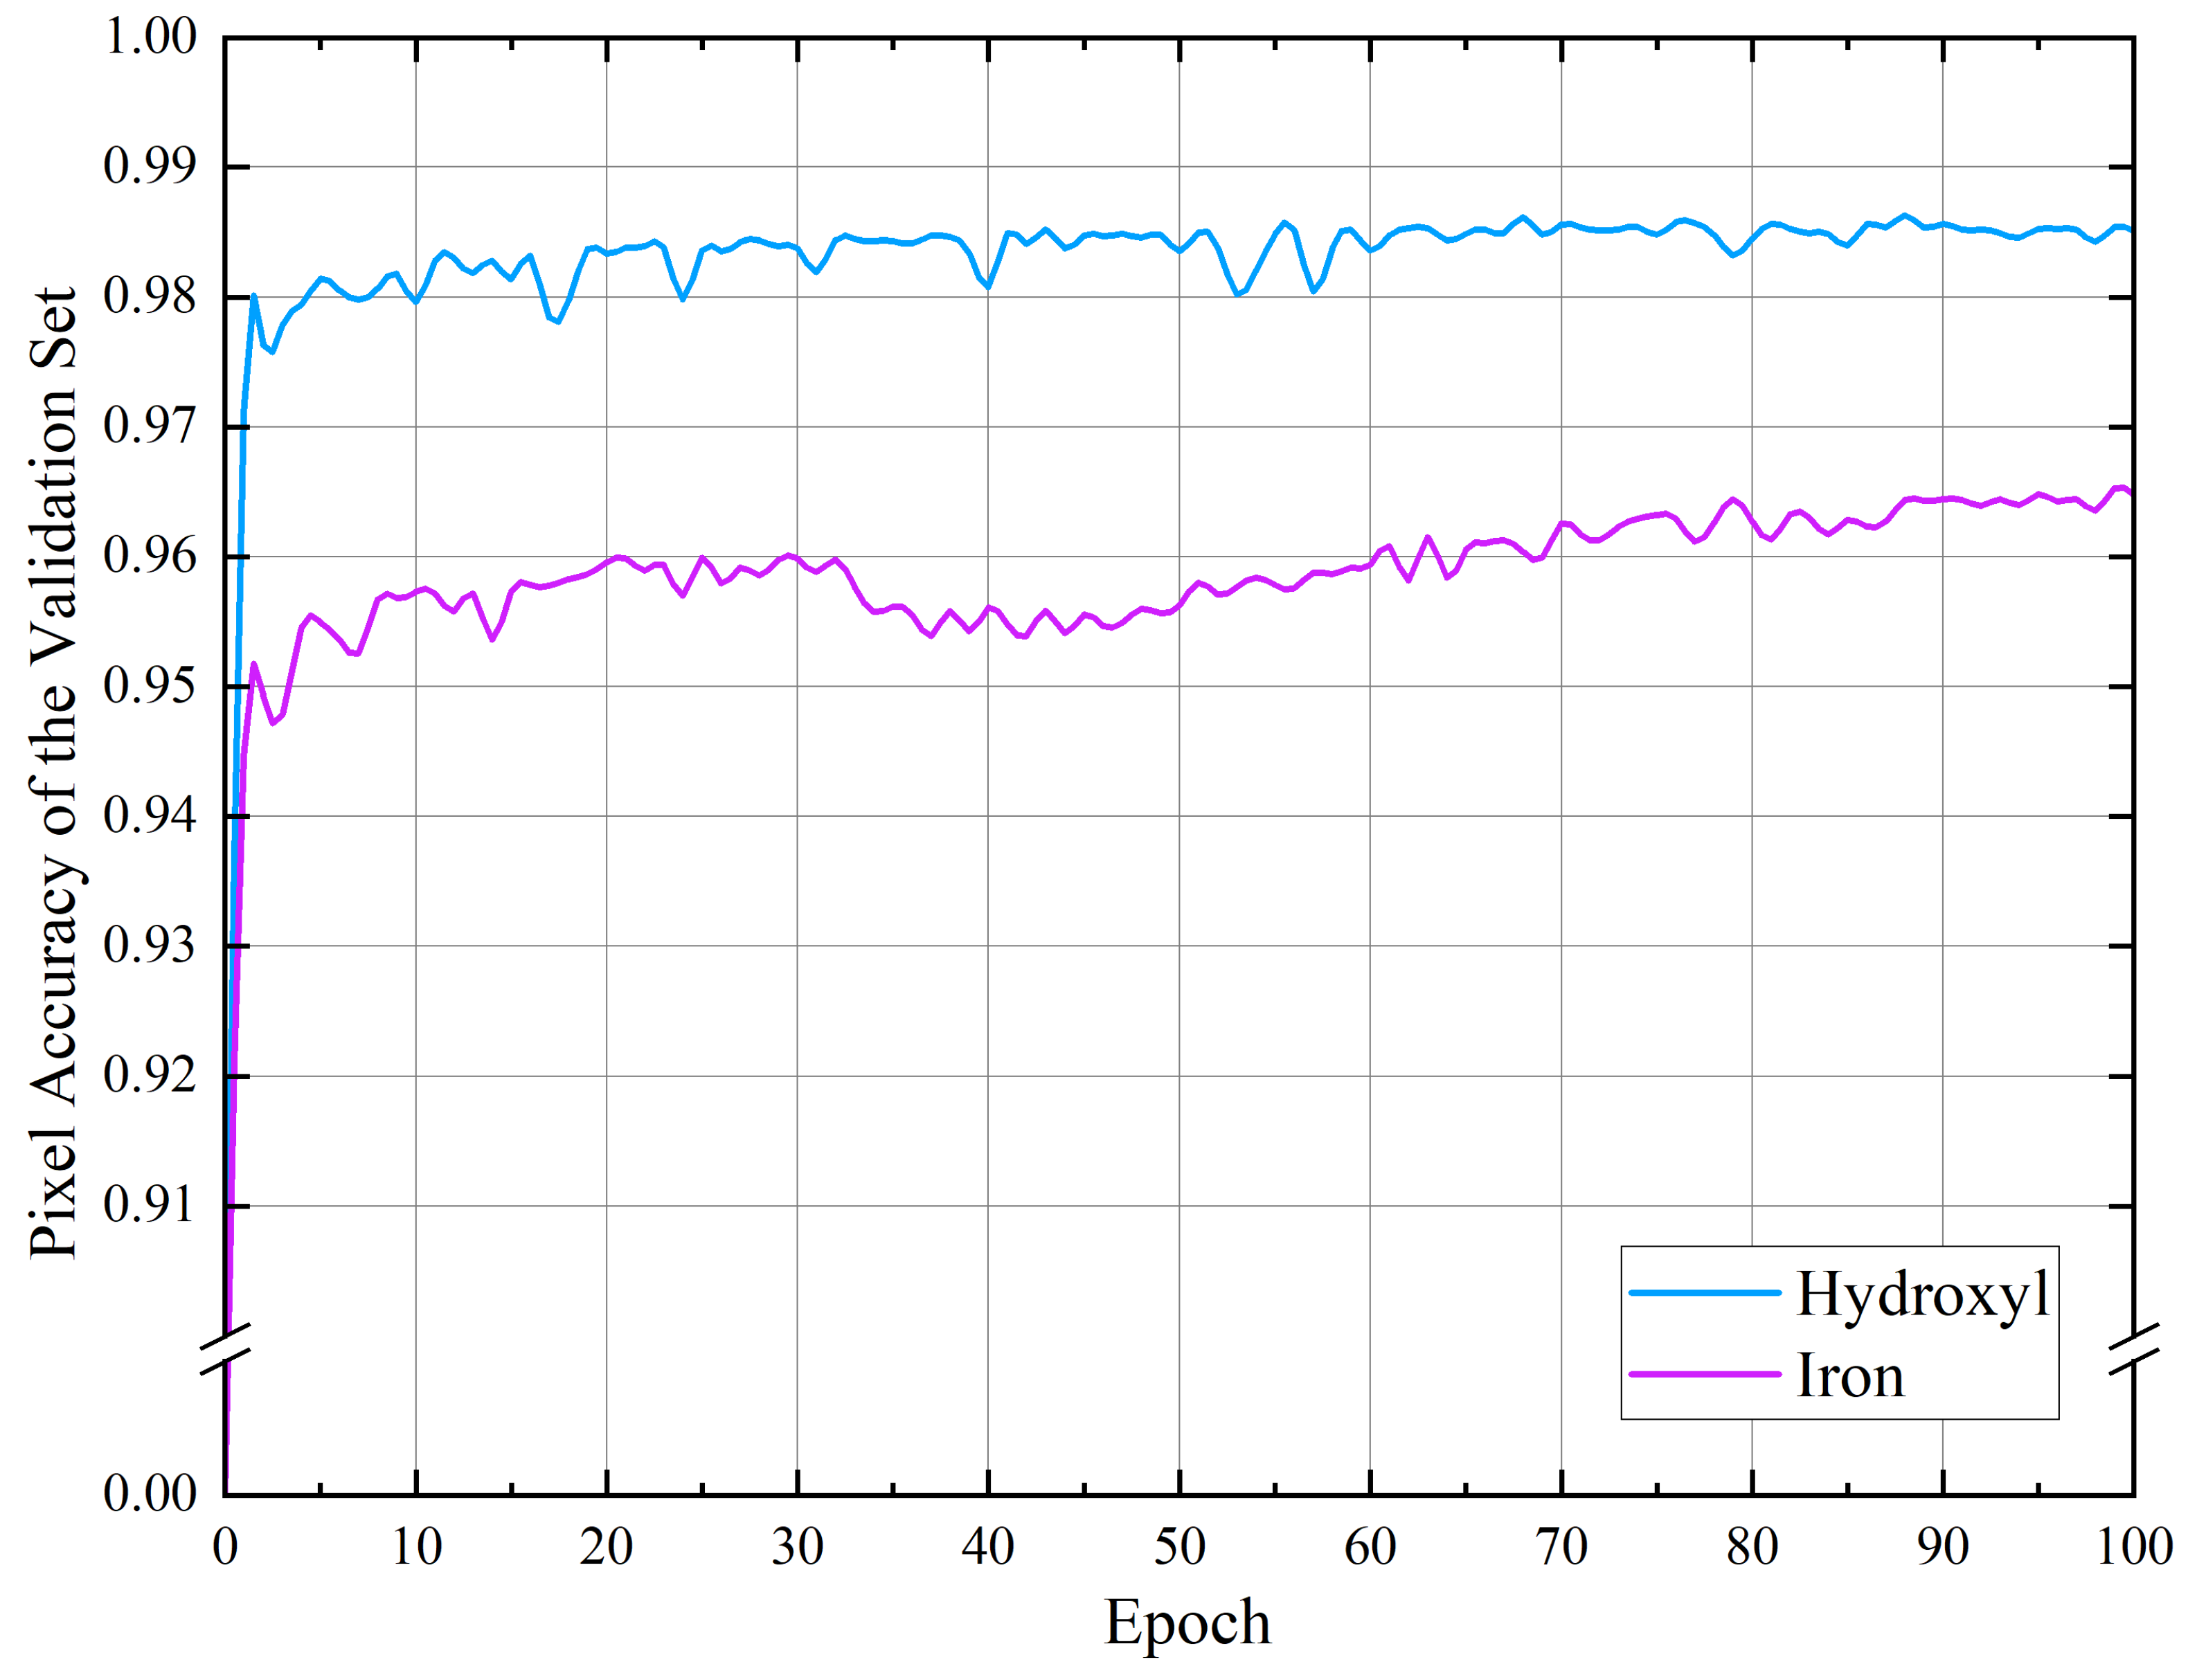
Due to the different regions of the sample set, in this study, we set up two experiments to extract hydroxyl and iron staining alteration information, respectively. The experimental training process is shown in Figure 12.
From the test results (Table 1), when using RAHC-AIE to extract hydroxyl alteration information, PA is 98.61%, MPA is 95.76%, kappa is 85.79%, Mean_F1 is 92.90%, and FWIoU is 97.47%, and when using RAHC-AIE to extract iron-stained alteration information, PA is 96.45%, MPA is 92.20% for PA, 84.14% for MPA, 84.14% for kappa, 92.05% for Mean_F1, and 93.40% for FWIoU. In terms of the performance indexes, RAHC-AIE can better extract hydroxyl and iron staining alteration information.
The pixel accuracy curve on the verification set is shown in Figure 12. The pixel accuracy curve shows that when RAHC-AIE is used to extract hydroxyl information, it reaches the maximum value after five rounds of network iteration, and the network can converge faster. After about 70 rounds, the pixel accuracy curve oscillates significantly smaller. When using RAHC-AIE to extract iron staining information, the maximum value is reached after five rounds of network iteration. Between the 30th and 60th rounds, the pixel accuracy curve is more oscillating. After about 80 rounds, the oscillation of the pixel accuracy curve is obviously smaller and gradually tends to converge.
To further validate the superiority of RAHC-AIE, we compared its performance with baseline models (2D-CNN and SVM). For hydroxyl alteration, RAHC-AIE achieved a PA of 98.61%, significantly higher than 92.35% of 2D-CNN and 90.00% of SVM. In terms of MPA, RAHC-AIE’s 90.41% outperformed 89.21% (2D-CNN) and 90.05% (SVM). For kappa, RAHC-AIE’s 98.16% was superior to 95.15% (2D-CNN) and 96.01% (SVM). Mean_F1 of RAHC-AIE (93.00%) was higher than 93.12% (2D-CNN) and 92.07% (SVM), and FWIoU (97.03%) also exceeded 96.06% (2D-CNN) and 95.04% (SVM).
For iron alteration, RAHC-AIE’s PA (96.45%) was higher than 94.45% (2D-CNN) and 95.46% (SVM). MPA (91.92%) outperformed 89.95% (2D-CNN) and 89.94% (SVM). kappa (95.28 ± 0.67) was better than 92.56% (2D-CNN) and 92.74% (SVM). Mean_F1 (92.25%) exceeded 90.04% (2D-CNN) and 91.25% (SVM), and FWIoU (93.40%) was higher than 93.39% (2D-CNN) and 91.23% (SVM). These results clearly demonstrate that RAHC-AIE outperforms 2D-CNN and SVM in extracting both hydroxyl and iron-stained alteration information, highlighting its effectiveness and superiority.

4.2. The Results of Alteration Information Using the RAHC-AIE

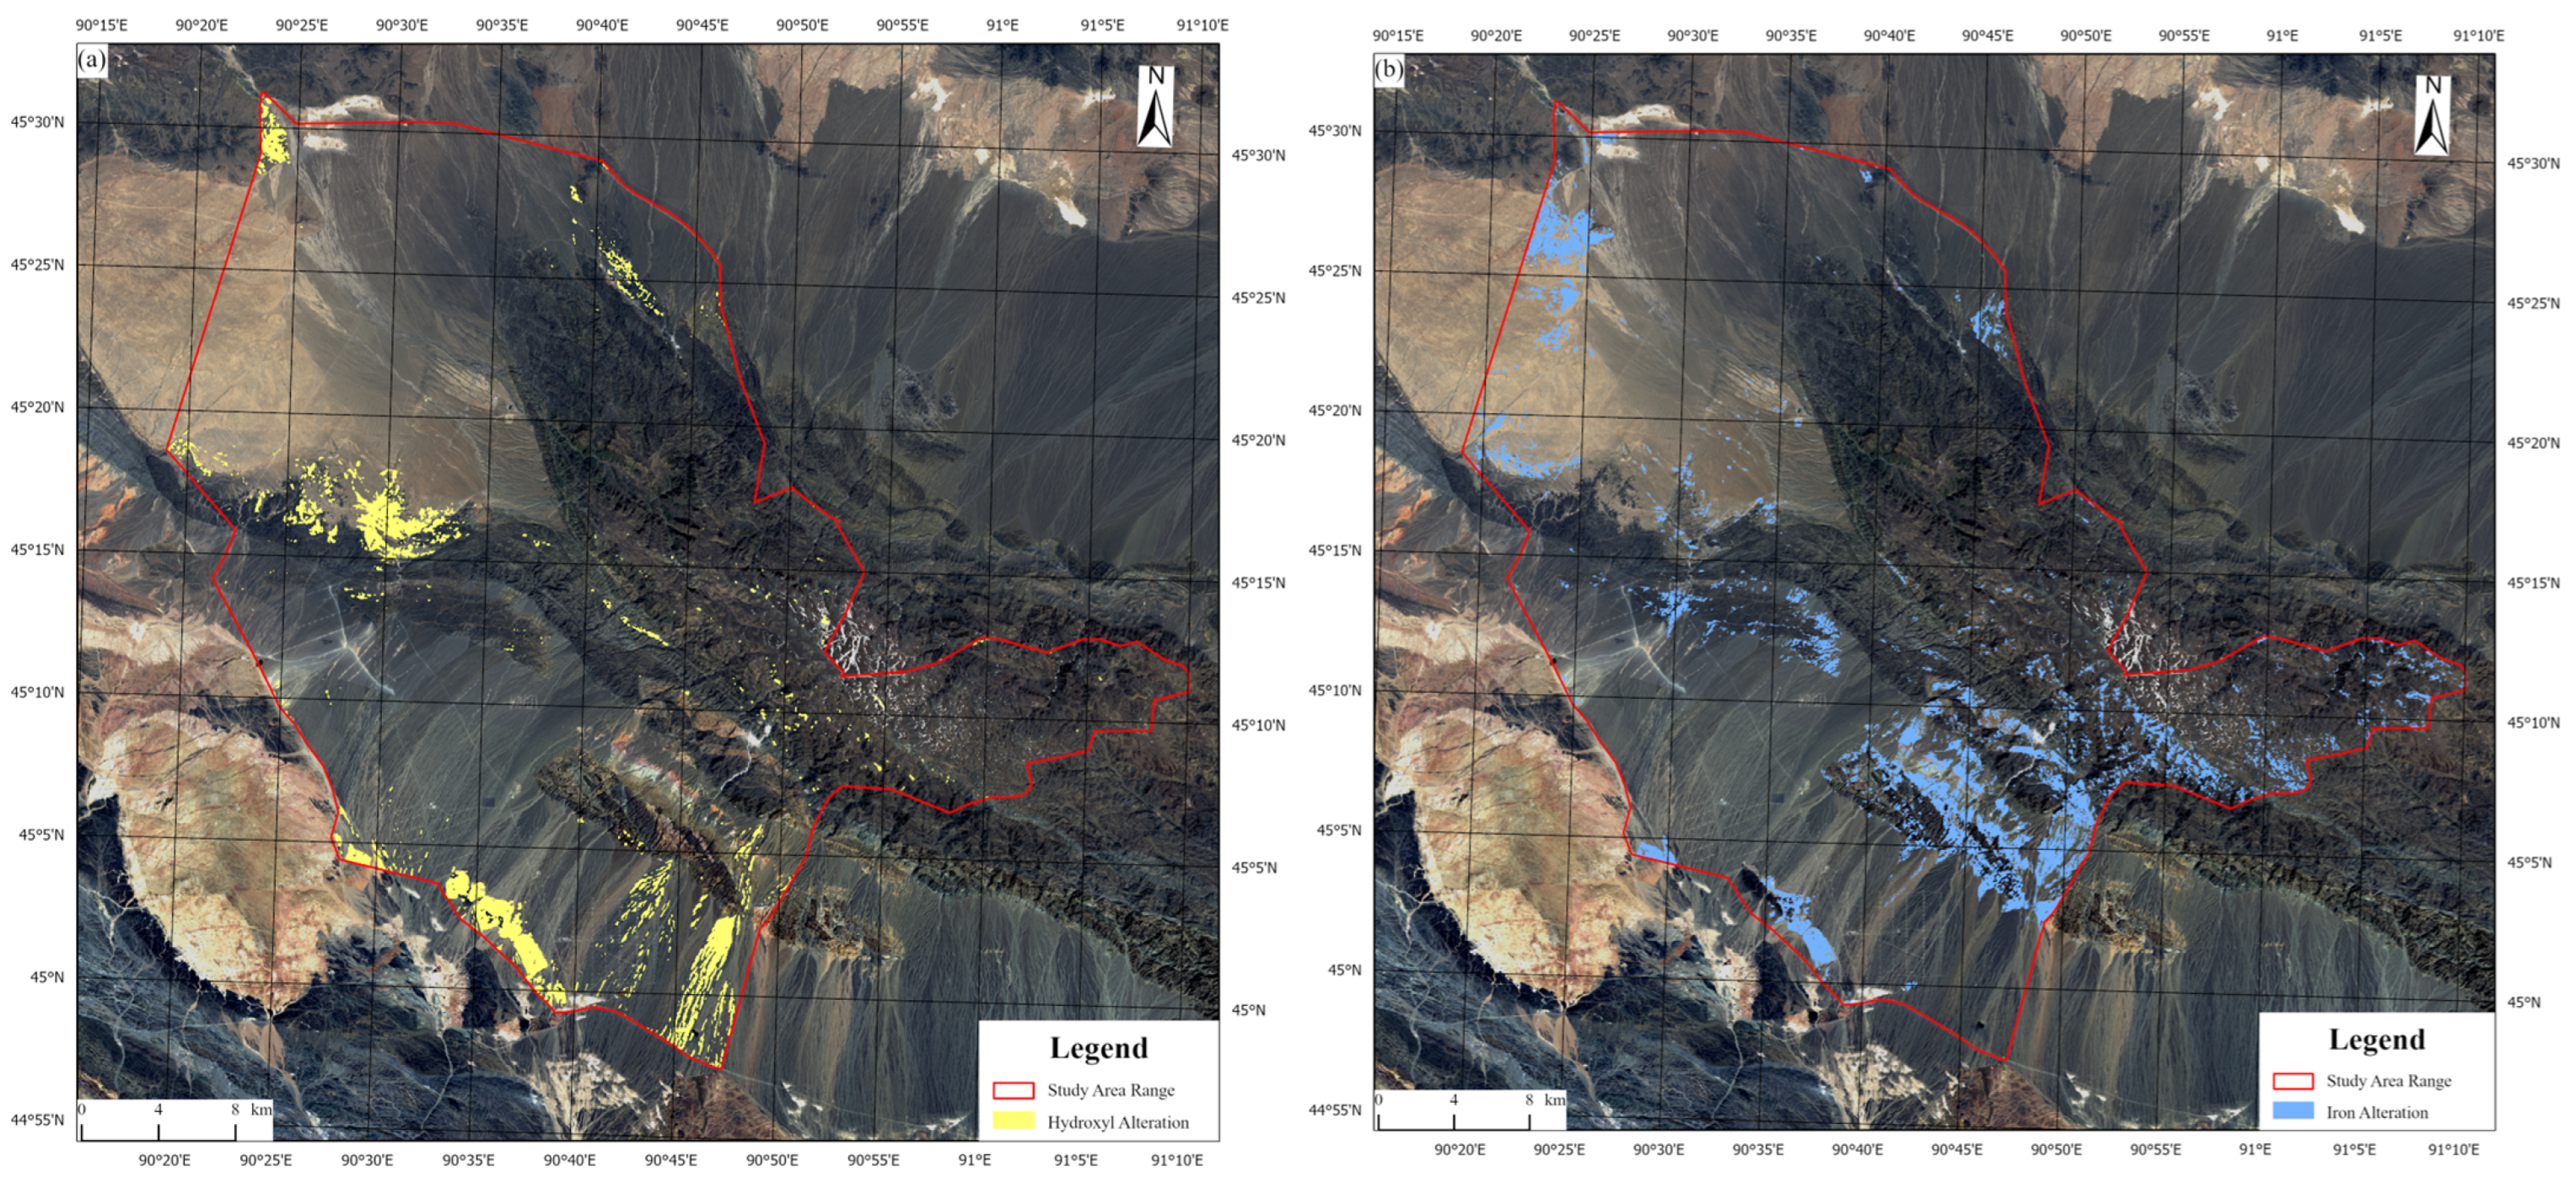
The RAHC-AIE model is used to train the sample set, and the results of the alteration information extracted by the RAHC-AIE model are shown in Figure 13. The area of the hydroxyl alteration anomaly is delineated by yellow pixels, and the distribution of the hydroxyl alteration anomaly is relatively concentrated. The anomaly is mainly distributed in the central and southern parts of Beitashan, with a small amount in the north (Figure 13a). It is worth noting that there are concentrated banded false anomalies in the southern part of the Beita Mountain. Through research, it is found that the banded anomalies distributed along the water system in the exposed Quaternary are mostly pseudo-anomalies, and the pseudo-anomalies in the image need to be eliminated. The median filtering (window size 3 × 3) of the alteration anomaly map can effectively smooth the isolated noise points while retaining the edge features of the real anomaly. For the banded pseudo-anomaly distributed along the water system, the slender structure can be removed by combining the morphological opening operation (first corrosion and then expansion), and the concentrated block real anomaly can be retained. The area of iron-stained alteration anomalies is delineated by yellow pixels. The iron-stained alteration anomalies are abundant. The anomalies are concentrated in the southeast of the Beita Mountain, and some of the anomalies are distributed in the north, middle, and south of the Beita Mountain (Figure 13b). The hydroxyl and iron staining anomalies are mainly distributed in the Devonian and Carboniferous strata, and some anomalies are distributed in intrusive rocks.

4.3. Field Data and Laboratory Analysis

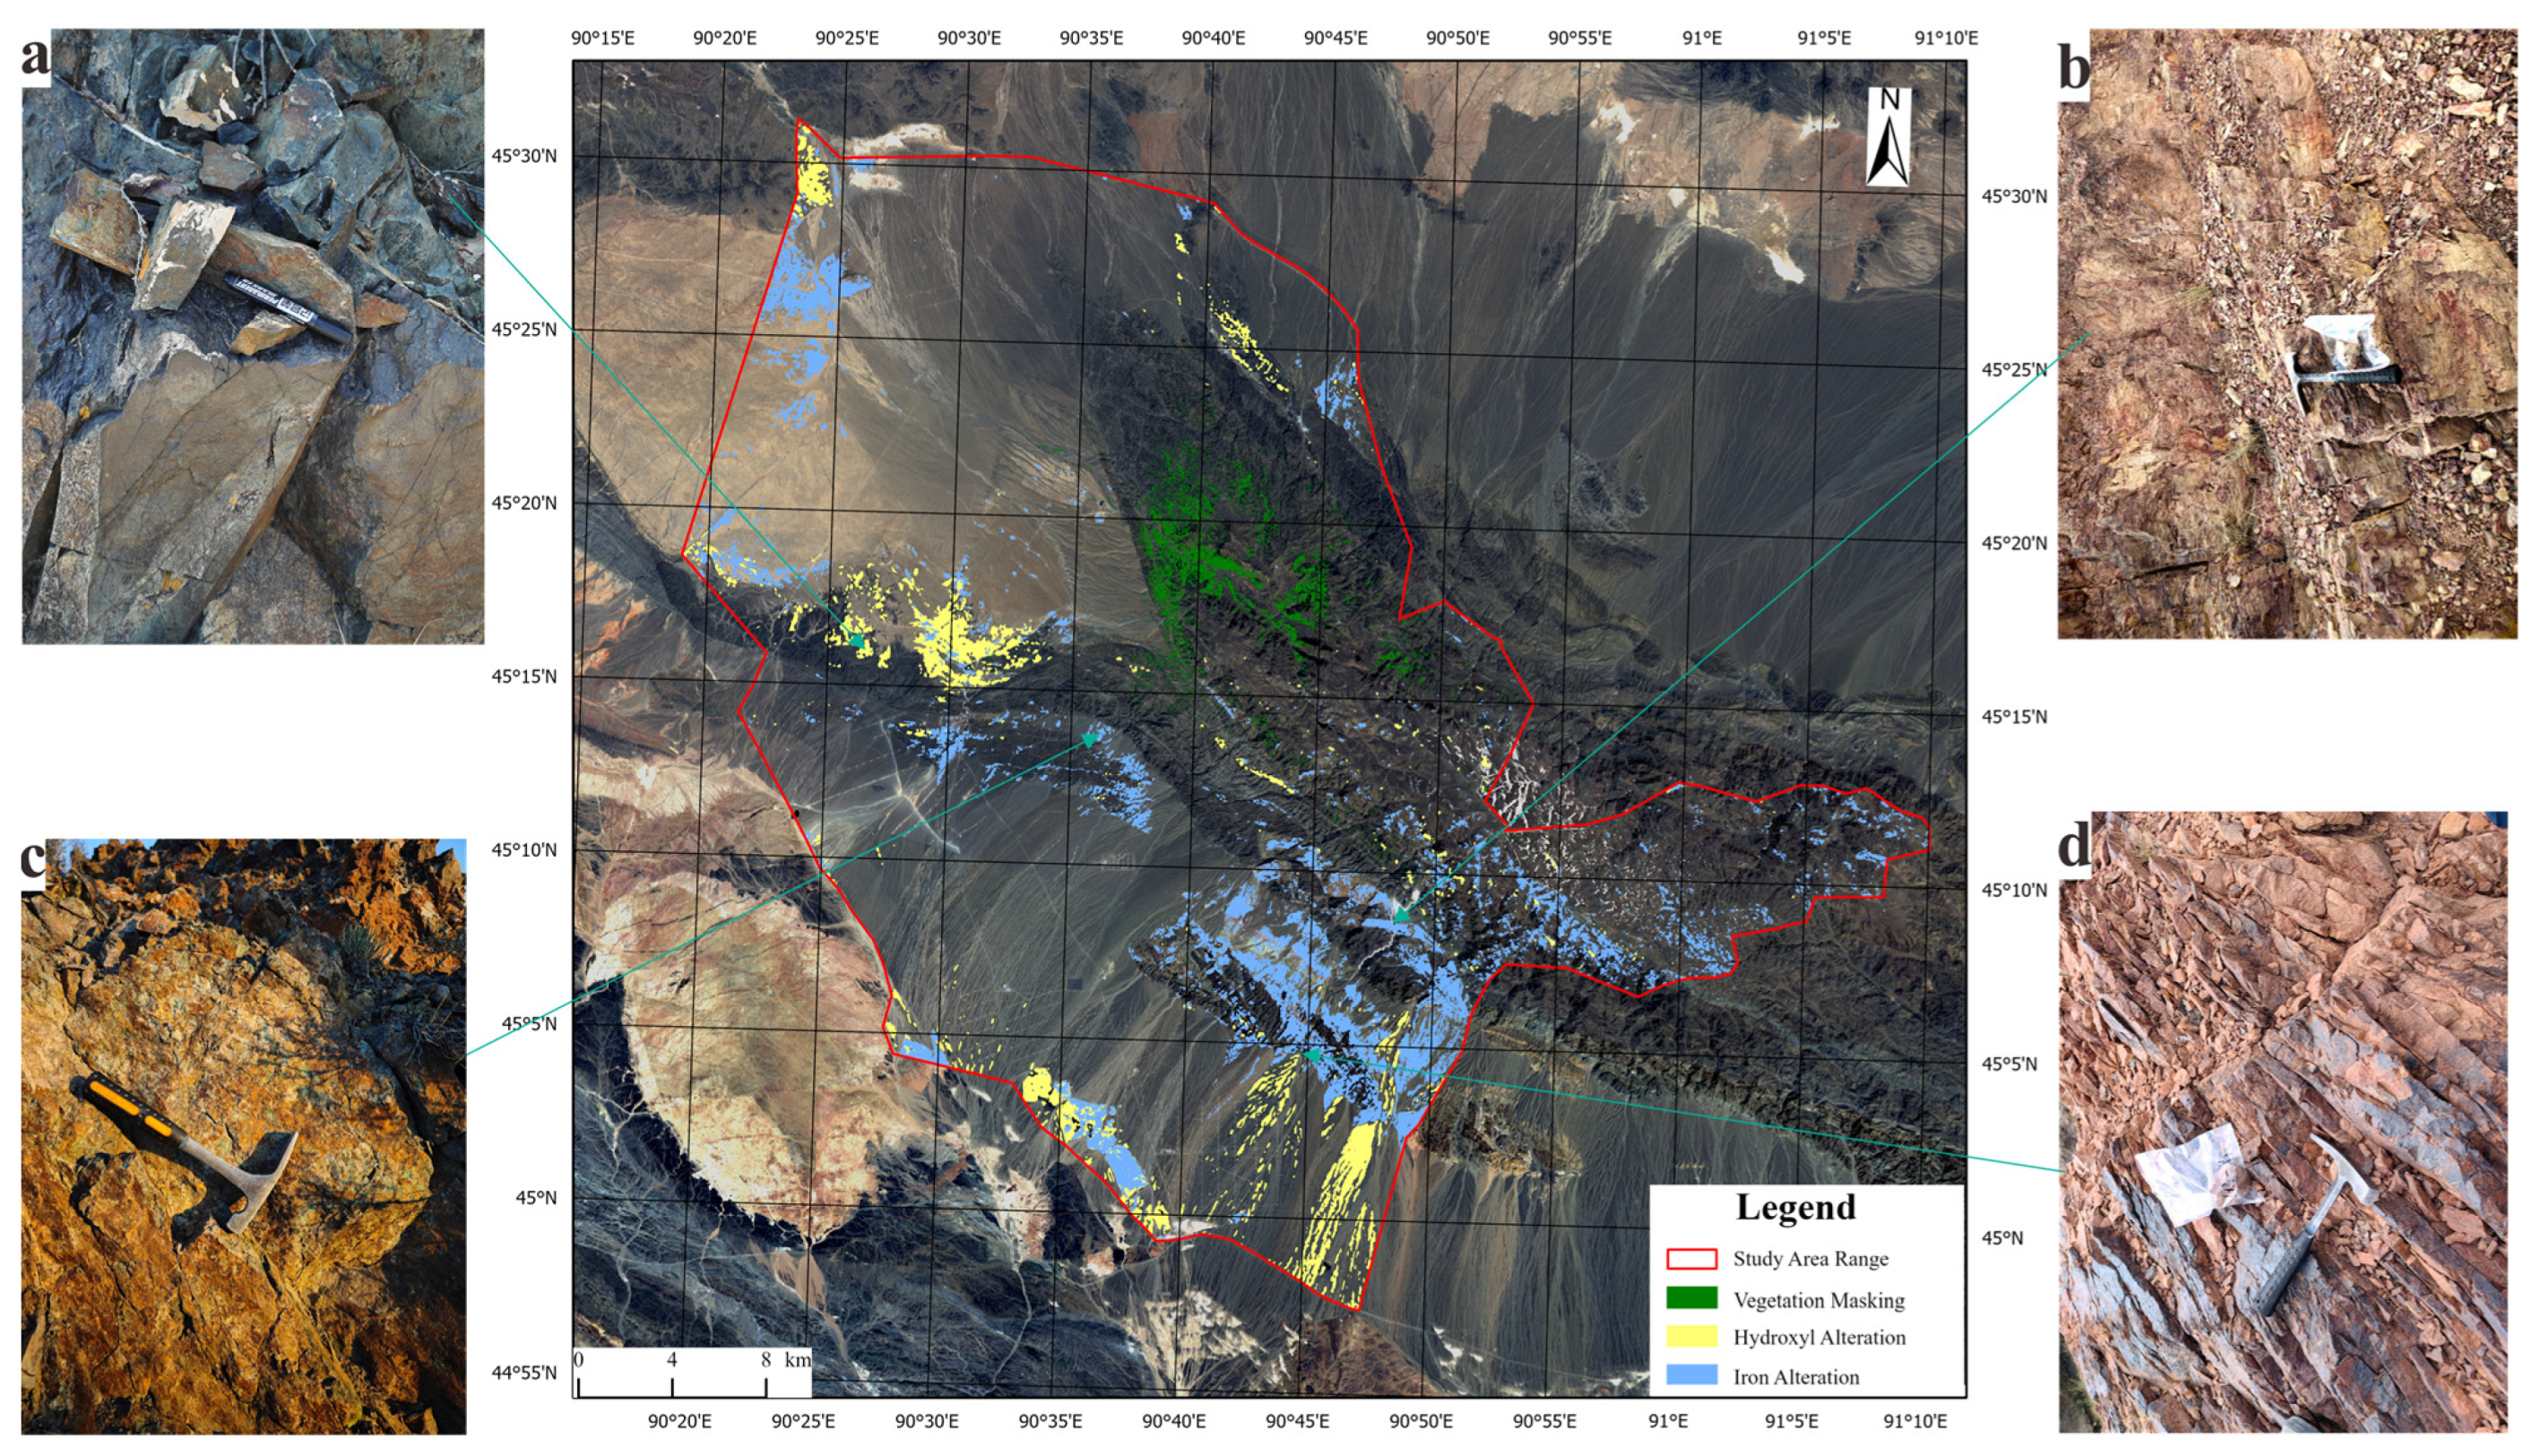
In this study, the RAHC-AIE model is utilized for the extraction of alteration information to extract the spectral and spatial characteristics of the deep part of the multispectral dataset in the Beitashan area. Influenced by magmatic hydrothermal and tectonic activities, limonite mineralization, kaolinization, chloritization, and other alterations in polymetallic deposits are often associated with development. Hydroxyl and iron-stained alteration anomalies can be superimposed to further highlight mineralization characteristics (Figure 14). According to the alteration information concentration area, a wide range of field geological surveys were carried out, and a large number of field photos and rock samples were collected for analysis and verification to evaluate the accuracy of the RAHC-AIE model for alteration information extraction.
Hydrothermal alteration is one of the important conditions for mineralization in the mining area. Field geologic reconnaissance was conducted in the study area to determine, through specialized knowledge, the presence of specific alteration mineral information at the site. We conducted detailed field surveys across the region, establishing 68 sampling sites to validate the model’s accuracy: 43 sites showed alteration occurrences, and 25 sites were unaltered. Among altered sites, the model correctly predicted 35 cases, achieving an 81% field validation accuracy; all unaltered sites were accurately identified by the model.
We found strong limonite mineralization near the verification point of the alteration anomaly, limonite bands can be seen. In addition, malachite and silicification can be seen, which are common in siliceous dikes (Figure 14), which proves the effectiveness of using the RAHC-AIE model to extract alteration information in this study.
Subsequently, the rock samples collected in the study area were polished and sliced for laboratory analysis. The microscopic characteristics of the polished thin sections of the samples were observed under the microscope, which further proved that there were iron-stained alterations dominated by limonite mineralization and pyritization and hydroxyl alterations dominated by epidotization and sericitization in the study area (Figure 15). The results show that the alteration types in this area are diverse, and the alteration is mainly developed in the surrounding rocks such as granite porphyry and tuff, forming a medium-low temperature hydrothermal alteration dominated by silicification, sericitization, limonite, epidotization, and chloritization. The altered rock assemblages mainly include pyrite-sericite-quartzite, chlorite-sericite altered rock, and so on. The identification of the major alteration minerals in the study area helps to delineate favorable zones for mineralization. Combined with field verification and laboratory analysis, this study used the RAHC-AIE model to extract mineralization alteration information, and the results were good, which verified the reliability of the RAHC-AIE model to a certain extent.

5. Discussion

5.1. Ablation Experiment

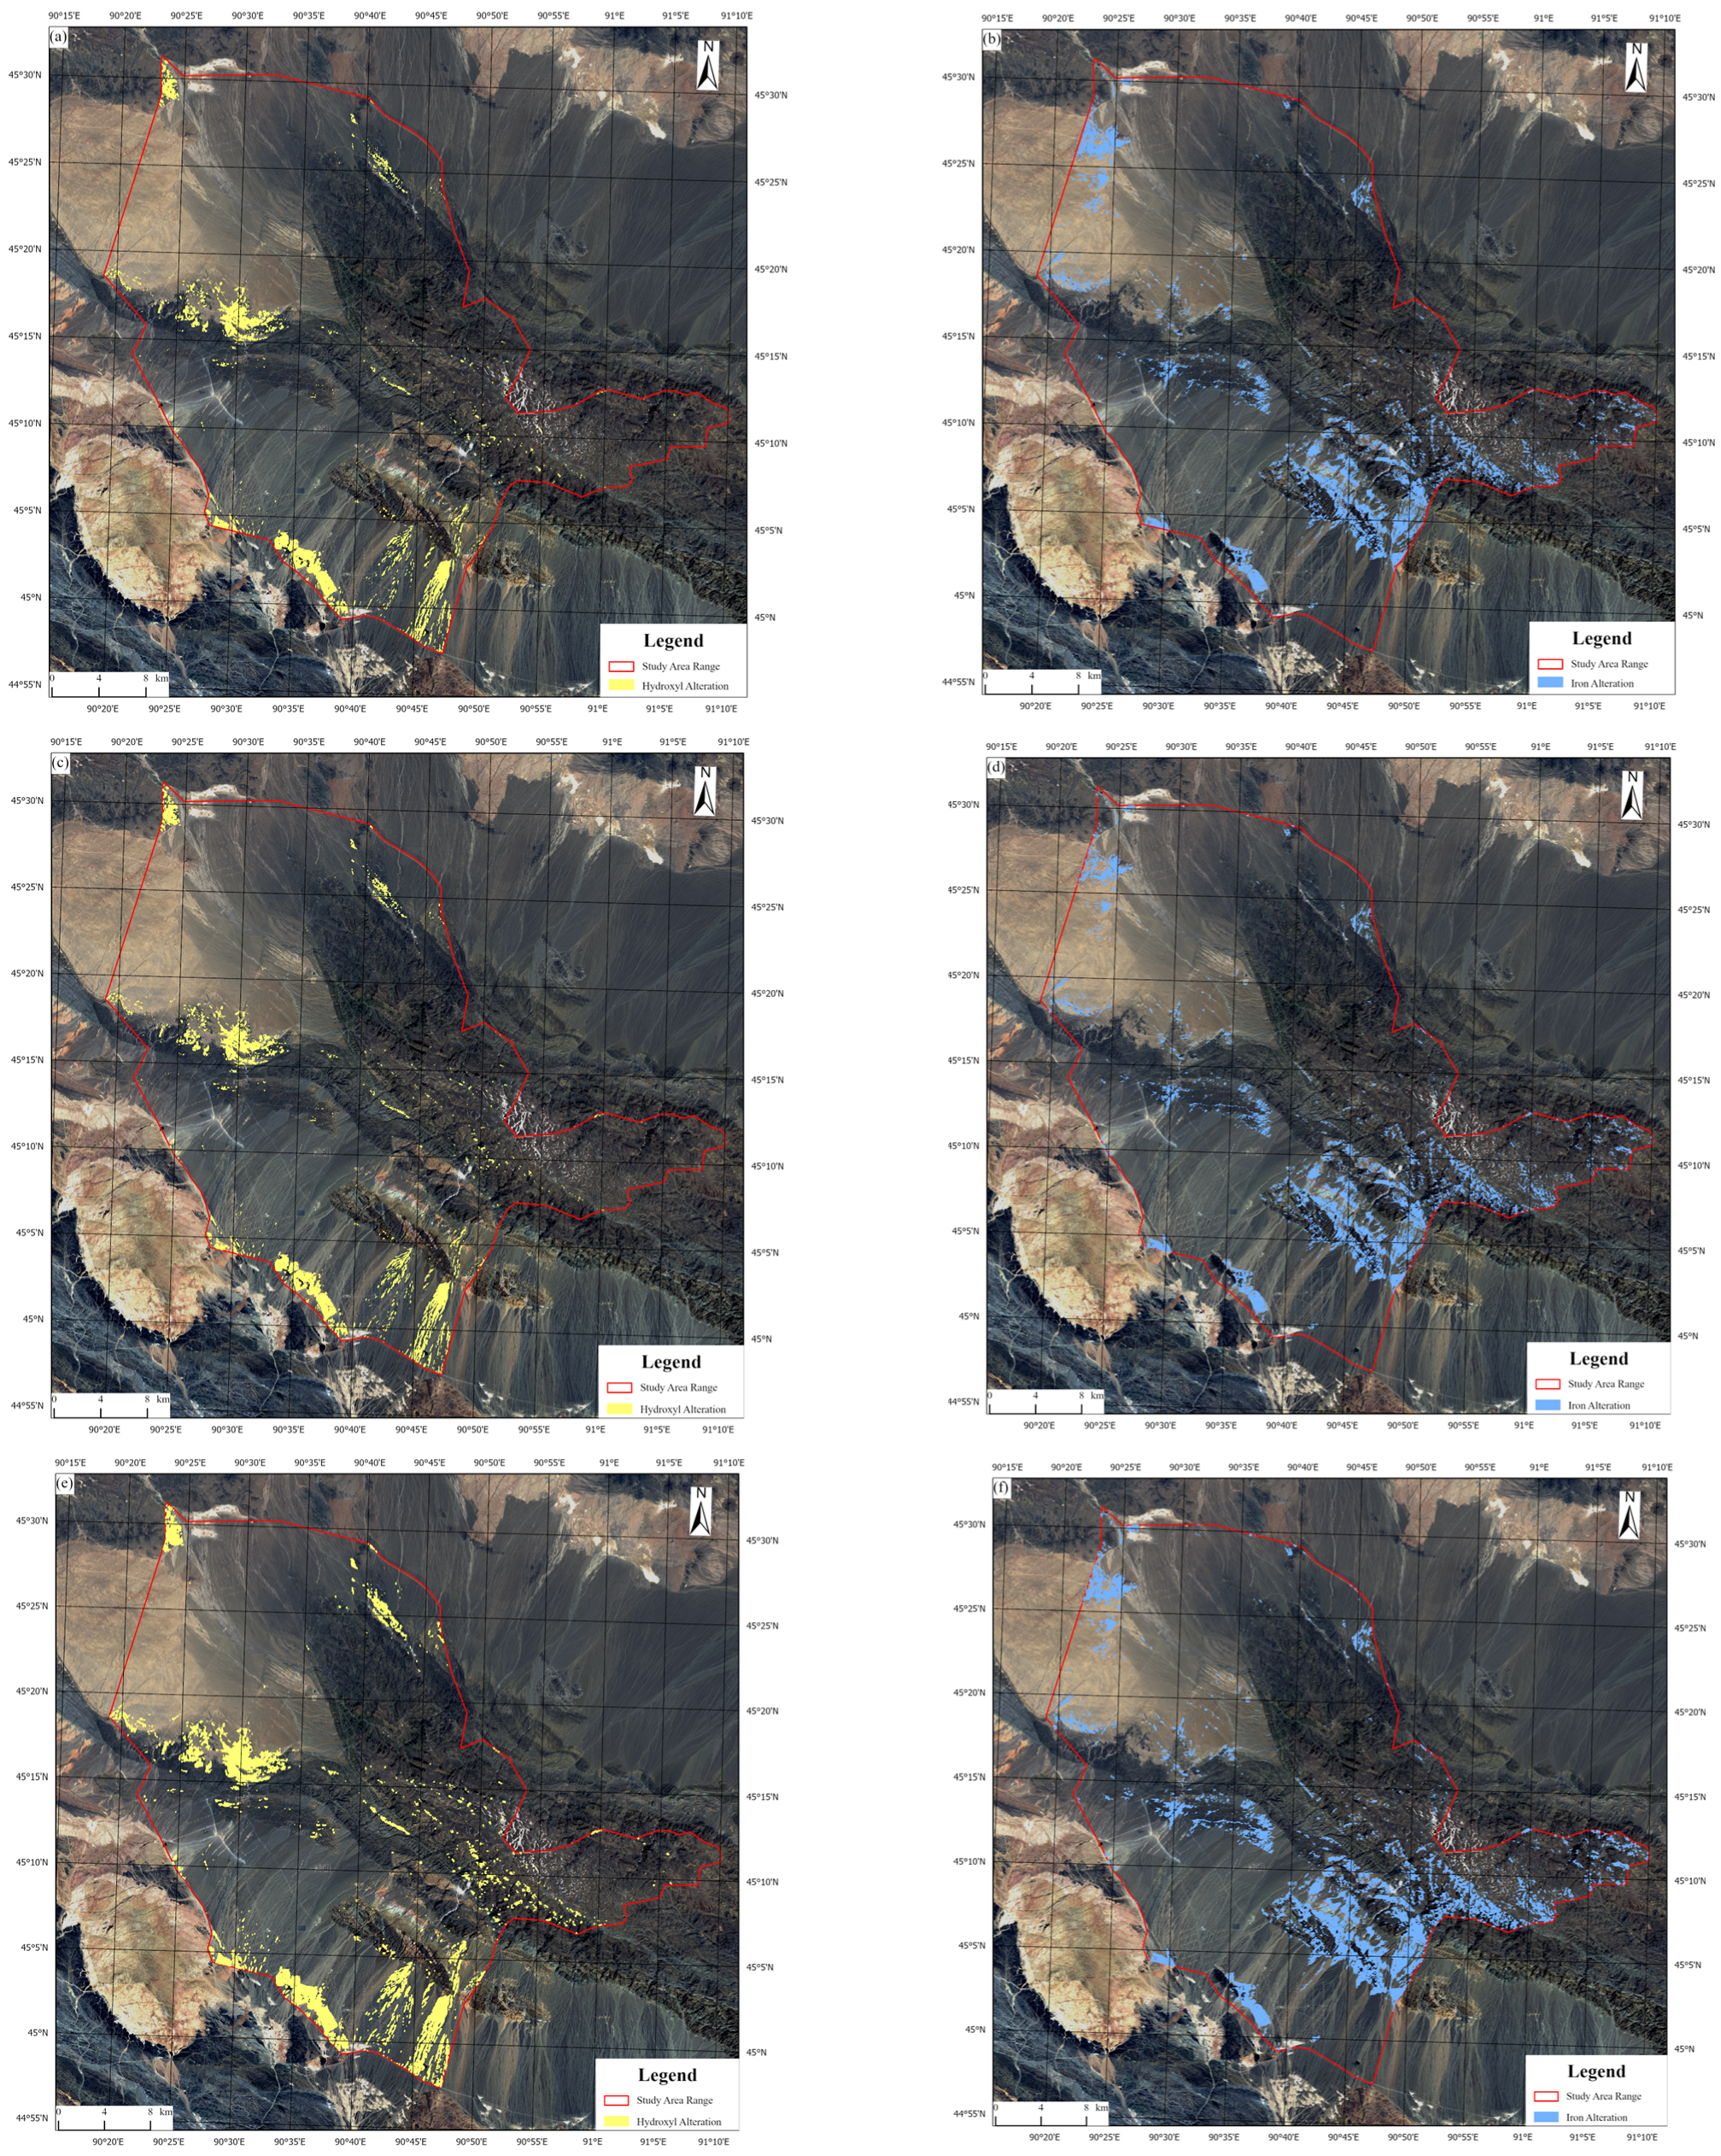
In this study, in order to explore the effect of residual attention mechanism on the overall performance of the model, we remove the CBAM and Residual Attention in RAHC-AIE, called RAHC-AIE without CBAM and RAHC-AIE without Residual Attention. The results are shown in Table 2.
Compared with RAHC-AIE and RAHC-AIE without CBAM, in terms of hydroxyl alteration extraction results, RAHC-AIE has higher PA, kappa, Mean_F1, and FWIoU than RAHC-AIE without CBAM, with PA (+0.26%), kappa (+0.42%), Mean_F1 (+1.00%), and FWIoU (+0.07%); in terms of the iron-stained alteration information, RAHC-AIE outperforms RAHC-AIE without Residual Attention in all aspects, PA (+0.04%), MPA (+0.21%), kappa (+0.02%), Mean_F1 (+0.25%) and FWIoU (+0.08%), and in terms of overall performance, RAHC-AIE slightly outperforms RAHC-AIE without CBAM in most metrics.
Compared with RAHC-AIE and RAHC-AIE without Residual Attention, the PA, kappa, Mean_F1, and FWIoU of RAHC-AIE were significantly higher than those of RAHC-AIE without Residual Attention from the hydroxyl alteration extraction results, with the following differences: PA (+4.45%), kappa (+33.77%), Mean_F1 (+12.00%), and FWIoU (+5.71%). From the perspective of iron-stained alteration information, RAHC-AIE’s performances are also superior to those of RAHC-AIE without Residual Attention, with the following specifications: PA (+3.24%), kappa (+4.45%), Mean_F1 (+12.00%) and FWIoU (+5.71%), kappa (+20.27%), Mean_F1 (+4.75%), and FWIoU (+4.69%).
In summary, RAHC-AIE significantly outperformed RAHC-AIE without CBAM and RAHC-AIE without Residual Attention on most of the metrics, and was slightly inferior to RAHC-AIE without Residual Attention on the MPA metrics. This suggests that the RAHC-AIE method provides higher accuracy and consistency in most cases.
The alteration information extracted by different methods is shown in Figure 16. From the visual results (Figure 16), after canceling CBAM (Figure 16c,d), the boundaries of each category are not as smooth as those of RAHC-AIE. The experimental results show that the CBAM sub-module can improve the performance of RAHC-AIE. The visual results show that CBAM pays more attention to the main mode and can indeed eliminate the influence of some noise modes, which is more in line with human cognitive common sense. After removing the residual attention (Figure 16e,f), there is misclassified alteration information, and the training accuracy of the model is significantly reduced, indicating that the residual attention mechanism has greatly improved the overall performance of the model.

5.2. The Relationship Between Extraction Results and Formation Lithology

Starting from the background and evolution of regional geological structure, the eastern Junggar region has good potential for polymetallic mineralization. The deposits are mainly formed in the Middle Devonian to Late Permian [56,57,58]. In the process of mineralization, magmatic rocks, hydrothermal alteration, hydrothermal migration, and mineral precipitation are the main ore-controlling factors [14]. On the one hand, magmatic activity provides thermal conditions and driving forces for the activation and transfer of ore-forming elements in the mineralization process of this study area. At the same time, through deep remelting and differentiation of magma, some ore-bearing hydrothermal fluids are provided, and filled and metasomatic mineralization along the tectonic cataclastic rock fragmentation zone. In the East Junggar area, numerous magmatic intrusions are exposed [47]. Mineral-bearing hydrothermal fluids formed during volcanic activity and magmatic intrusion were enriched for mineralization along the North Tower Fracture during upward intrusion.
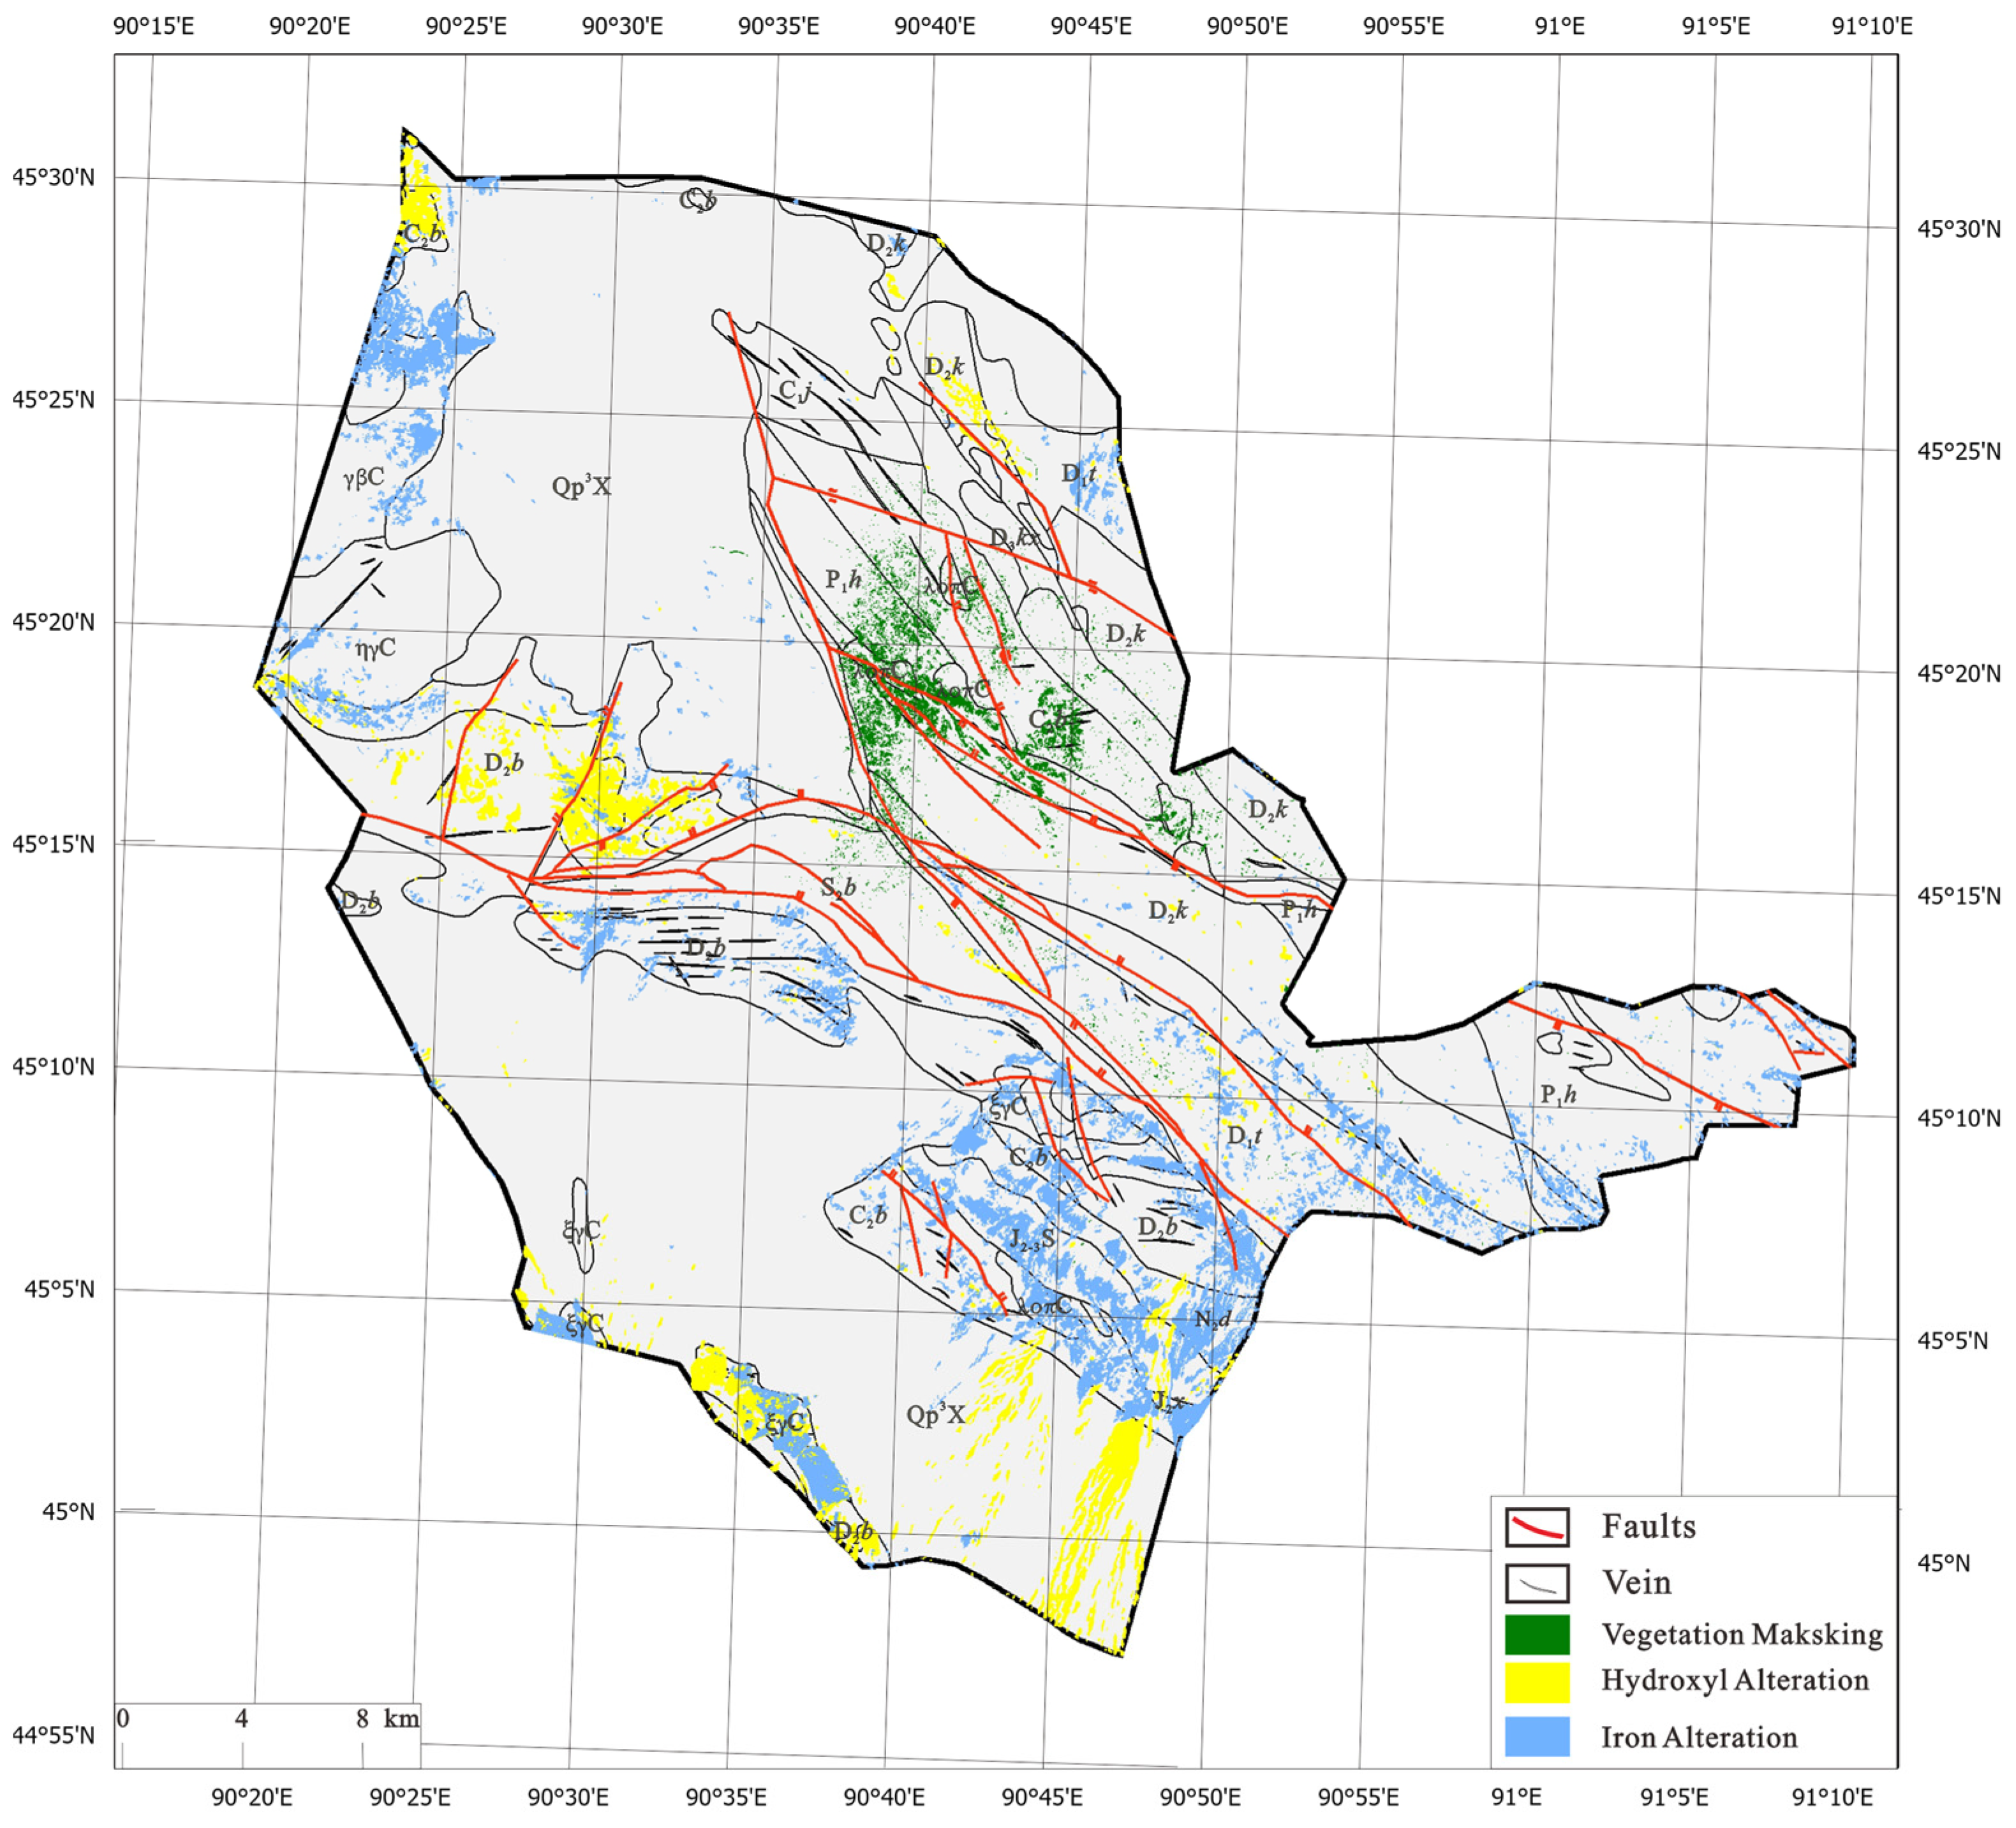
The alteration anomaly information extracted in this study is mainly distributed at the intersection of fractures and geological boundaries with complex stratigraphic lithology changes (Figure 17). The comprehensive alteration information of hydroxyl iron staining is mainly concentrated near the Devonian–Carboniferous strata and granite dykes. Hydroxyl alteration anomalies are centrally distributed in the lithological units of the D, granite and Qp3X strata, and sporadically distributed in the C2b and J2–3S layers. In addition, it was found through the study that the strip anomalies distributed along the water system in the Qp3X layer in the southern part of the study area are mostly pseudo-anomalies, which need to be eliminated in the images. The iron-stained alteration anomalies are commonly distributed in the D, J2–3S, C2b, and granite layers, and sporadically distributed in the P1h layer. The stratigraphy where the combined alteration anomalies are exposed is the Lower Devonian Toljangekuduk Formation, the Upper Carboniferous Batamayineshan Formation, and the Lower Permian Haerjiawu Formation, which is a combination of volcanic and clastic rocks, in descending order of age.
In addition, folds and faults are well developed in the region. Fault structure is the main driving force for the activation and migration of ore-forming materials. It is not only the channel and accumulation place of ore fluid activity, but also one of the dominant factors for the generation and migration of minerals. In the fault development area, tectonic dislocation makes the dense rock fracture into mud and blocks, causing pressure release, making the solution boil again, volatile overflow, making the hydrothermal rich in alkali, and losing the ability to carry metal and enrich mineralization. The study area is located between the NW-trending Shahaitna Enbas fault and the Beitashan deep fault. The rocks in these parts are often easily broken and form a large number of cracks. The NW-trending deep fault in the southern part of the study area is a long-term multiple active fault, and the faults in the same direction on the hanging wall are well developed. The NW-trending fracture may be the channel of mineralized hydrothermal fluid. The fault activity provides a favorable space for the emplacement of dikes and the later hydrothermal activity. The enrichment of mineralized fluid often occurs at the intersection of fractures, and the metallogenic potential is large.
The anomaly distribution range extracted in this paper is closely related to the geological structure, mainly in the three directions of NW, NWW, and NE, which, together with the NW-trending folds, constitute the basic tectonic framework of this area. The comprehensive alteration information of hydroxyl and iron staining is distributed on the edge of the fault structure, showing a blocky and linear distribution, which is consistent with the development direction of the fault structure. It is mainly controlled by the northwest main fault structure and distributed along the structural fault zone. Hydrothermal alteration primarily occurs in the ductile shear zone, tectonic fracture zone, within intrusive rocks, and surrounding rocks.
The mineralization in the study area is controlled by structure and rock mass. The results show that the RAHC-AIE model based on spectral-spatial fusion features can promote the accuracy of alteration information extraction. According to the alteration information extracted by the model, combined with geological data (such as strata, lithology, structural faults), the favorable metallogenic areas are analyzed, which provides basic data and a decision-making basis for the follow-up geological prospecting work. It has a good guiding significance for mineral prediction, and also provides a reference for narrowing the prospecting target area and expanding the prospecting range.

5.3. Significance of Alteration Ore

In mineral exploration, the extraction of mineralized alteration areas and the understanding of the hydrothermal mineralization center are of great significance to prospecting work. It is found that copper, as a kind of iron-philic element, is often associated with a large amount of iron oxides or hydroxides. In the outer edge of the porphyry body, hornfelsization is usually developed and accompanied by a large area of pyritization. Pyrite is oxidized and leached into limonite. The extracted iron-stained alteration anomaly is distributed on the contact zone of the porphyry body, and there is iron-stained alteration dominated by limonite mineralization and pyritization. In addition, there are several Early Permian syenogranite bodies distributed from south to north in the study area. The Early Permian fine-grained porphyritic syenogranite provides material and heat sources for the formation of copper deposits. Therefore, the iron staining anomaly is of great significance to the porphyry copper gold prospecting.

6. Conclusions

This study combines remote sensing and deep learning technologies, and takes the Beitashan as an example to propose a RAHC-AIE deep learning model. The main conclusions are as follows:
(1)
The model mainly combines the hybrid convolution and residual attention mechanism, and has good robustness in the extraction of alteration information. Compared with other models, the classification accuracy is high, and the recognition effect is remarkable.
(2)
According to the distribution of the model extraction results, the field and laboratory verification of hydrothermal alteration was carried out. The laboratory results showed good consistency with the model extraction results.
(3)
With further study of the relationship between alteration information and stratigraphic lithology in this area, it is considered that the alteration zone in Beitashan is related to lithology and tectonic action.
In summary, the use of the RAHC-AIE model for alteration information extraction and mapping of alteration maps has high accuracy, providing a new perspective for mineral resources exploration, thus opening up a new exploration tool for prospecting prediction.

Author Contributions

Conceptualization, Y.Y.; methodology, W.W.; data curation, W.W. and M.C.; writing—original draft, W.W.; writing—review and editing, W.W. and A.W.; visualization—W.W. and Y.T.; supervision, Y.Y. All authors have read and agreed to the published version of the manuscript.

Funding

This study was supported by the Science and Technology Major Project of Xinjiang Uygur Autonomous Region, China (No. 2024B03005-3).

Data Availability Statement

Data will be made available on request.

Conflicts of Interest

Author Ming Chen was employed by the company Zhejiang Tunnel Engineering Group Co., Ltd. The remaining authors declare that the research was conducted in the absence of any commercial or financial relationships that could be construed as a potential conflict of interest.

References

  1. Liu, L.; Chen, J.; Li, X.; Zhou, T.; Li, S.; Sun, L.; Huang, L.; Tang, M.; Chen, J. Short wavelength infrared (SWIR) reflectance spectroscopy of alteration minerals of Qibaoshan ore district, Shandong Province, China. Ore Geol. Rev. 2024, 165, 105868. [Google Scholar] [CrossRef]
  2. Zhou, Y.; Chen, S.; Li, L.; Fan, F.; Zhang, H.; Chen, J.; Yang, K.; Xiu, L.; Xu, M.; Xing, G. Mapping hydrothermal alteration of the Au-Cu deposits in the Zhenghe magmatic-hydrothermal mineralization system, SE China, using Short Wavelength Infrared (SWIR) reflectance spectroscopy. J. Geochem. Explor. 2023, 244, 107113. [Google Scholar] [CrossRef]
  3. Raza, M.Q.; Absar, N. Mineral chemistry of hydrothermal alteration assemblage in hanging wall Shahapur granite associated with vein-type Gogi uranium deposit, Bhima Basin, Eastern Dharwar Craton, India: Implications for physico-chemical conditions of ore formation. Ore Geol. Rev. 2021, 128, 103880. [Google Scholar] [CrossRef]
  4. Cooke, D.R.; Deyell, C.L.; Waters, P.J.; Gonzales, R.I.; Zaw, K. Evidence for Magmatic-Hydrothermal Fluids and Ore-Forming Processes in Epithermal and Porphyry Deposits of the Baguio District, Philippines. Econ. Geol. 2011, 106, 1399–1424. [Google Scholar] [CrossRef]
  5. Shirmard, H.; Farahbakhsh, E.; Pour, A.B.; Muslim, A.M.; Müller, R.D.; Chandra, R. Integration of Selective Dimensionality Reduction Techniques for Mineral Exploration Using ASTER Satellite Data. Remote Sens. 2020, 12, 29. [Google Scholar] [CrossRef]
  6. Hunt, G.R.; Ashley, R.P. Spectra of altered rocks in the visible and near infrared. Econ. Geol. 1979, 74, 1613–1629. [Google Scholar] [CrossRef]
  7. Yao, F.; Liu, S.; Wang, D.; Geng, X.; Wang, C.; Jiang, N.; Wang, Y. Review on the development of multi- and hyperspectral remote sensing technology for exploration of copper–gold deposits. Ore Geol. Rev. 2023, 162, 105732. [Google Scholar] [CrossRef]
  8. Takodjou Wambo, J.D.; Pour, A.B.; Ganno, S.; Asimow, P.D.; Zoheir, B.; Salles, R.d.R.; Nzenti, J.P.; Pradhan, B.; Muslim, A.M. Identifying high potential zones of gold mineralization in a sub-tropical region using Landsat-8 and ASTER remote sensing data: A case study of the Ngoura-Colomines goldfield, eastern Cameroon. Ore Geol. Rev. 2020, 122, 103530. [Google Scholar] [CrossRef]
  9. Zhang, T.B.; Yi, G.H.; Li, H.M.; Wang, Z.Y.; Tang, J.X.; Zhong, K.H.; Li, Y.B.; Wang, Q.; Bie, X.J. Integrating Data of ASTER and Landsat-8 OLI (AO) for Hydrothermal Alteration Mineral Mapping in Duolong Porphyry Cu-Au Deposit, Tibetan Plateau, China. Remote Sens. 2016, 8, 23. [Google Scholar] [CrossRef]
  10. Frutuoso, R.; Lima, A.; Teodoro, A.C. Application of remote sensing data in gold exploration: Targeting hydrothermal alteration using Landsat 8 imagery in northern Portugal. Arab. J. Geosci. 2021, 14, 459. [Google Scholar] [CrossRef]
  11. Ye, B.; Tian, S.F.; Ge, J.; Sun, Y.Q. Assessment of WorldView-3 Data for Lithological Mapping. Remote Sens. 2017, 9, 19. [Google Scholar] [CrossRef]
  12. Kruse, F.A.; Perry, S.L. Mineral Mapping Using Simulated Worldview-3 Short-Wave-Infrared Imagery. Remote Sens. 2013, 5, 2688–2703. [Google Scholar] [CrossRef]
  13. Wang, R.; Xiong, S.; Nie, H.; Liang, S.; Qi, Z.; Yang, J.; Yan, B.; Zhao, F.; Fan, J.; Tong, L.; et al. Remote Sensing Technology and its Application in Geological Exploration. Dizhi Xuebao 2011, 85, 1699–1743. [Google Scholar]
  14. Zhang, X.L.; Zhao, Z.F.; Chen, Q.; Chai, W.; Li, Z.Y.; Zhang, G.; Yang, H.Y.; Niu, L. Mapping hydrothermal alteration of the Pulang porphyry copper deposit, SW China, using ASTER and ZY1-02D satellite data. Ore Geol. Rev. 2023, 161, 16. [Google Scholar] [CrossRef]
  15. Fu, H.; Cheng, Q.; Jing, L.; Ge, Y. Deep learning-based hydrothermal alteration mapping using GaoFen-5 hyperspectral data in the Duolong Ore District, Western Tibet, China. J. Appl. Remote Sens. 2021, 15, 044512. [Google Scholar] [CrossRef]
  16. Cracknell, M.J.; Reading, A.M. Geological mapping using remote sensing data: A comparison of five machine learning algorithms, their response to variations in the spatial distribution of training data and the use of explicit spatial information. Comput. Geosci. 2014, 63, 22–33. [Google Scholar] [CrossRef]
  17. He, J.; Harris, J.R.; Sawada, M.; Behnia, P. A comparison of classification algorithms using Landsat-7 and Landsat-8 data for mapping lithology in Canada’s Arctic. Int. J. Remote Sens. 2015, 36, 2252–2276. [Google Scholar] [CrossRef]
  18. Hu, B.; Wan, B.; Xu, Y.; Tao, L.; Wu, X.; Qiu, Q.; Wu, Y.; Deng, H. Mapping hydrothermally altered minerals with AST_07XT, AST_05 and Hyperion datasets using a voting-based extreme learning machine algorithm. Ore Geol. Rev. 2019, 114, 103116. [Google Scholar] [CrossRef]
  19. Shirmard, H.; Farahbakhsh, E.; Müller, R.D.; Chandra, R. A review of machine learning in processing remote sensing data for mineral exploration. Remote Sens. Environ. 2022, 268, 112750. [Google Scholar] [CrossRef]
  20. Zhang, C.; Zuo, R.; Xiong, Y. Detection of the multivariate geochemical anomalies associated with mineralization using a deep convolutional neural network and a pixel-pair feature method. Appl. Geochem. 2021, 130, 104994. [Google Scholar] [CrossRef]
  21. Dong, Y.; Yang, Z.; Liu, Q.; Zuo, R.; Wang, Z. Fusion of GaoFen-5 and Sentinel-2B data for lithological mapping using vision transformer dynamic graph convolutional network. Int. J. Appl. Earth Obs. Geoinf. 2024, 129, 103780. [Google Scholar] [CrossRef]
  22. Hinton, G.E.; Salakhutdinov, R.R. Reducing the dimensionality of data with neural networks. Science 2006, 313, 504–507. [Google Scholar] [CrossRef] [PubMed]
  23. Song, H.; Kim, Y.; Kim, Y. A Patch-Based Light Convolutional Neural Network for Land-Cover Mapping Using Landsat-8 Images. Remote Sens. 2019, 11, 19. [Google Scholar] [CrossRef]
  24. Mahdianpari, M.; Salehi, B.; Rezaee, M.; Mohammadimanesh, F.; Zhang, Y. Very Deep Convolutional Neural Networks for Complex Land Cover Mapping Using Multispectral Remote Sensing Imagery. Remote Sens. 2018, 10, 21. [Google Scholar] [CrossRef]
  25. Kroupi, E.; Kesa, M.; Navarro-Sánchez, V.D.; Saeed, S.; Pelloquin, C.; Alhaddad, B.; Moreno, L.; Soria-Frisch, A.; Ruffini, G. Deep convolutional neural networks for land-cover classification with Sentinel-2 images. J. Appl. Remote Sens. 2019, 13, 22. [Google Scholar] [CrossRef]
  26. Liu, C.; Wang, W.; Tang, J.; Wang, Q.; Zheng, K.; Sun, Y.; Zhang, J.; Gan, F.; Cao, B. A deep-learning-based mineral prospectivity modeling framework and workflow in prediction of porphyry–epithermal mineralization in the Duolong ore District, Tibet. Ore Geol. Rev. 2023, 157, 105419. [Google Scholar] [CrossRef]
  27. Wang, Z.; Zuo, R. Mineral prospectivity mapping using a joint singularity-based weighting method and long short-term memory network. Comput. Geosci. 2022, 158, 104974. [Google Scholar] [CrossRef]
  28. Xiong, Y.; Zuo, R.; Carranza, E.J.M. Mapping mineral prospectivity through big data analytics and a deep learning algorithm. Ore Geol. Rev. 2018, 102, 811–817. [Google Scholar] [CrossRef]
  29. Zidan, U.; El Desouky, H.A.; Gaber, M.M.; Abdelsamea, M.M. From Pixels to Deposits: Porphyry Mineralization With Multispectral Convolutional Neural Networks. IEEE J. Sel. Top. Appl. Earth Observ. Remote Sens. 2023, 16, 9474–9486. [Google Scholar] [CrossRef]
  30. Jiang, X.; Liu, Q.; Yan, L.; Cao, X.; Chen, Y.; Wei, Y.; Wang, F.; Xing, H. Hyperspectral imaging combined with Spectral-Imagery Feature Fusion Convolutional Neural Network to discriminate different geographical origins of wolfberries. J. Food Compos. Anal. 2024, 132, 106259. [Google Scholar] [CrossRef]
  31. Lv, H.; Li, Y.; Zhang, H.; Wang, R. Multi-dimensional deep dense residual networks and multiple kernel learning for hyperspectral image classification. Infrared Phys. Technol. 2024, 138, 105265. [Google Scholar] [CrossRef]
  32. Song, Y.; Zhang, Z.; Baghbaderani, R.K.; Wang, F.; Qu, Y.; Stuttsy, C.; Qi, H. Land cover classification for satellite images through 1D CNN. In Proceedings of the 2019 10th Workshop on Hyperspectral Imaging and Signal Processing: Evolution in Remote Sensing (WHISPERS), Amsterdam, The Netherlands, 24–26 September 2019; pp. 1–5. [Google Scholar]
  33. Xu, X.; Li, W.; Ran, Q.; Du, Q.; Gao, L.; Zhang, B. Multisource remote sensing data classification based on convolutional neural network. IEEE Trans. Geosci. Remote Sens. 2017, 56, 937–949. [Google Scholar] [CrossRef]
  34. Zhong, Z.; Li, J.; Luo, Z.; Chapman, M. Spectral–spatial residual network for hyperspectral image classification: A 3-D deep learning framework. IEEE Trans. Geosci. Remote Sens. 2017, 56, 847–858. [Google Scholar] [CrossRef]
  35. Khain, E.V.; Bibikova, E.V.; Kröner, A.; Zhuravlev, D.Z.; Sklyarov, E.; Fedotova, A.A.; Kravchenko-Berezhnoy, I.R. The most ancient ophiolite of the Central Asian fold belt:: U-Pb and Pb-Pb zircon ages for the Dunzhugur Complex, Eastern Sayan, Siberia, and geodynamic implications. Earth Planet. Sci. Lett. 2002, 199, 311–325. [Google Scholar] [CrossRef]
  36. Jahn, B.-M. The Central Asian Orogenic Belt and growth of the continental crust in the Phanerozoic. Asp. Tecton. Evol. China 2004, 226, 73–100. [Google Scholar] [CrossRef]
  37. Wang, Z.; Zhang, J.; Wu, C.; Qu, J.; Zhang, B.; Zhao, H.; Zhang, Y.; Yang, Y. A uniform basement: Implications for the tectonics of Beishan Orogenic Belt in the southern Central Asian Orogenic Belt. Precambrian Res. 2024, 404, 107340. [Google Scholar] [CrossRef]
  38. Xu, Q.; Zhao, L.; Niu, B.; Zheng, R.; Yang, Y.; Liu, J. Early Paleozoic arc magmatism in the Kalamaili orogenic belt, Northern Xinjiang, NW China: Implications for the tectonic evolution of the East Junggar terrane. J. Asian Earth Sci. 2020, 194, 104072. [Google Scholar] [CrossRef]
  39. Yang, F.; Geng, X.; Zhang, Z.; Liu, G.; Zhang, H. A review of the geological characteristics and spatiotemporal distribution of copper–gold deposits in the Central Asian Orogenic Belt, Xinjiang, Northwest China. J. Asian Earth Sci. 2024, 259, 105899. [Google Scholar] [CrossRef]
  40. Cheng, Q.M.; Jing, L.H.; Panahi, A. Principal component analysis with optimum order sample correlation coefficient for image enhancement. Int. J. Remote Sens. 2006, 27, 3387–3401. [Google Scholar] [CrossRef]
  41. Xiao, W.; Han, C.; Yuan, C.; Sun, M.; Lin, S.; Chen, H.; Li, Z.; Li, J.; Sun, S. Middle Cambrian to Permian subduction-related accretionary orogenesis of Northern Xinjiang, NW China: Implications for the tectonic evolution of central Asia. J. Asian Earth Sci. 2008, 32, 102–117. [Google Scholar] [CrossRef]
  42. Xiao, W.; Windley, B.F.; Badarch, G.; Sun, S.; Li, J.; Qin, K.; Wang, Z. Palaeozoic accretionary and convergent tectonics of the southern Altaids: Implications for the growth of Central Asia. J. Geol. Soc. 2004, 161, 339–342. [Google Scholar] [CrossRef]
  43. Xiao, Y.; Zhang, H.F.; Shi, J.A.; Su, B.X.; Sakyi, P.A.; Lu, X.C.; Hu, Y.; Zhang, Z. Late Paleozoic magmatic record of East Junggar, NW China and its significance: Implication from zircon U-Pb dating and Hf isotope. Gondwana Res. 2011, 20, 532–542. [Google Scholar] [CrossRef]
  44. Han, B.F.; Ji, J.Q.; Song, B.; Chen, L.H.; Zhang, L. Late Paleozoic vertical growth of continental crust around the Junggar Basin, Xinjiang, China (Part I): Timing of post-collisional plutonism. Acta Petrol. Sin. 2006, 22, 1077–1086. [Google Scholar]
  45. Li, X.; Chen, G.; Wu, C.; Li, J.; Haproff, P.J.; Geng, M.; Wu, S.; Xu, S.; Li, Z.; Yang, D. Tectono-stratigraphic framework and evolution of East Junggar Basin, Central Asia. Tectonophysics 2023, 851, 229758. [Google Scholar] [CrossRef]
  46. Zhang, L.; He, D.; Yi, Z.; Li, D. Tectonic relationship between the Kelameili range and the Dajing depression: Insights into the Carboniferous tectonic-sedimentary framework. Pet. Explor. Dev. 2020, 47, 30–45. [Google Scholar] [CrossRef]
  47. Chen, H.; Wan, B.; Pirajno, F.; Chen, Y.; Xiao, B. Metallogenesis of the Xinjiang Orogens, NW China—New discoveries and ore genesis. Ore Geol. Rev. 2018, 100, 1–11. [Google Scholar] [CrossRef]
  48. Gao, F.; Pei, X.; Cheng, Y.; Guo, R.; Sun, C.; Liu, X.; Li, Z.; Chen, Y.; Wang, M.; Liu, Z. Petrogenesis of the early Permian A-type granites in eastern North Tianshan, Central Asian Orogenic Belt: Implications for the final geodynamic evolution of the Kalamaili suture zone. J. Asian Earth Sci. 2024, 264, 106057. [Google Scholar] [CrossRef]
  49. Li, Q.; Lü, S.; Yang, F.; Geng, X.; Chai, F. Geological characteristics and genesis of the Laoshankou Fe–Cu–Au deposit in Junggar, Xinjiang, Central Asian Orogenic Belt. Ore Geol. Rev. 2015, 68, 59–78. [Google Scholar] [CrossRef]
  50. Xu, Q.-Q.; Ji, J.-Q.; Zhao, L.; Gong, J.-F.; Zhou, J.; He, G.-Q.; Zhong, D.-L.; Wang, J.-D.; Griffiths, L. Tectonic evolution and continental crust growth of Northern Xinjiang in northwestern China: Remnant ocean model. Earth-Sci. Rev. 2013, 126, 178–205. [Google Scholar] [CrossRef]
  51. Roy, D.P.; Wulder, M.A.; Loveland, T.R.; Woodcock, C.E.; Allen, R.G.; Anderson, M.C.; Helder, D.; Irons, J.R.; Johnson, D.M.; Kennedy, R.; et al. Landsat-8: Science and product vision for terrestrial global change research. Remote Sens. Environ. 2014, 145, 154–172. [Google Scholar] [CrossRef]
  52. Bahrami, H.; Esmaeili, P.; Homayouni, S.; Pour, A.B.; Chokmani, K.; Bahroudi, A. Machine Learning-Based Lithological Mapping from ASTER Remote-Sensing Imagery. Minerals 2024, 14, 27. [Google Scholar] [CrossRef]
  53. Sun, Y.; Tian, S.; Di, B. Extracting mineral alteration information using WorldView-3 data. Geosci. Front. 2017, 8, 1051–1062. [Google Scholar] [CrossRef]
  54. Vaswani, A.; Shazeer, N.; Parmar, N.; Uszkoreit, J.; Jones, L.; Gomez, A.N.; Kaiser, L.; Polosukhin, I. Attention Is All You Need. In Proceedings of the 31st Annual Conference on Neural Information Processing Systems (NIPS), Long Beach, CA, USA, 4–9 December 2017. [Google Scholar]
  55. Xi, M.F.; Li, J.; He, Z.L.; Yu, M.M.; Qin, F. NRN-RSSEG: A Deep Neural Network Model for Combating Label Noise in Semantic Segmentation of Remote Sensing Images. Remote Sens. 2023, 15, 18. [Google Scholar] [CrossRef]
  56. Xue, C.J.; Chi, G.X.; Zhao, X.B.; Wu, G.G.; Zhao, Z.F.; Dong, L.H. Multiple and prolonged porphyry Cu-Au mineralization and alteration events in the Halasu deposit, Chinese Altai, Xinjiang, northwestern China. Geosci. Front. 2016, 7, 799–809. [Google Scholar] [CrossRef]
  57. Liang, P.; Chen, H.Y.; Hollings, P.; Xiao, B.; Wu, C.; Bao, Z.W.; Cai, K.D. The Paleozoic tectonic evolution and metallogenesis of the northern margin of East Junggar, Central Asia Orogenic Belt: Geochronological and geochemical constraints from igneous rocks of the Qiaoxiahala Fe-Cu deposit. J. Asian Earth Sci. 2016, 130, 23–45. [Google Scholar] [CrossRef]
  58. Han, C.M.; Mao, W.J.; Zhao, G.C.; Qu, W.J.; Du, A.D. Re-Os dating of the Kalatongke Cu-Ni deposit, Altay Shan, NW China, and resulting geodynamic implications. Ore Geol. Rev. 2007, 32, 452–468. [Google Scholar] [CrossRef]
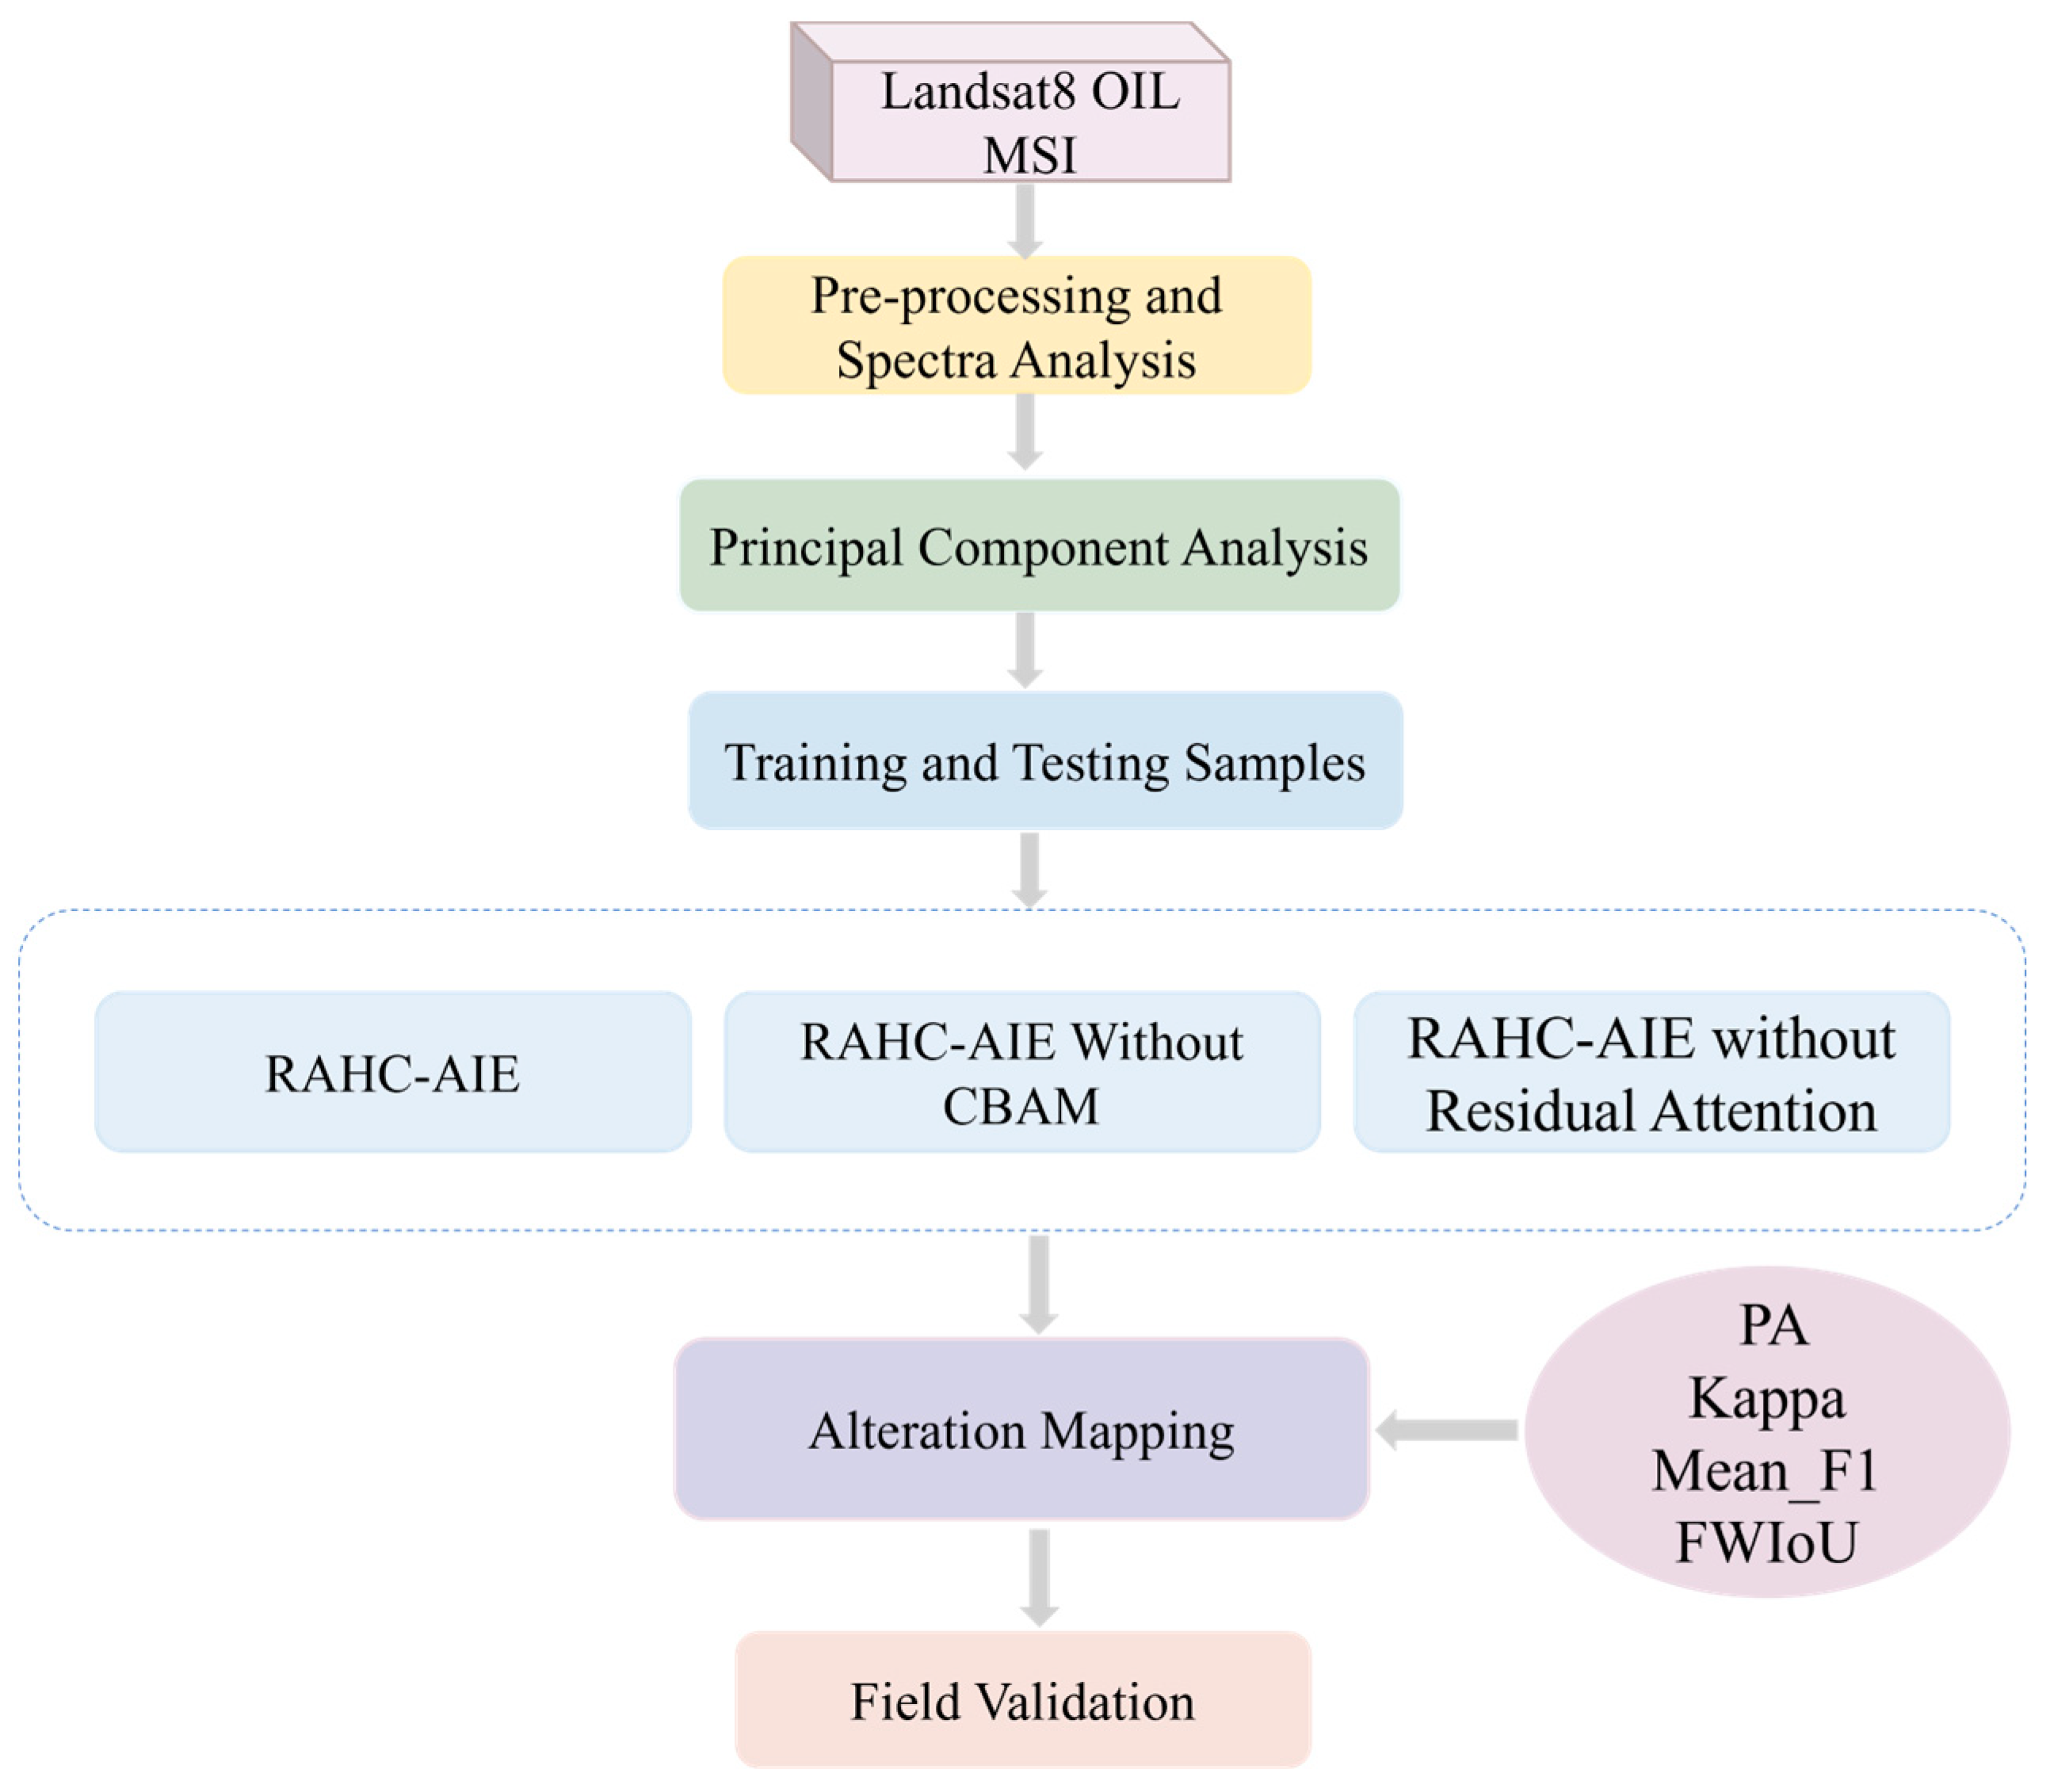
Figure 2. The technical route of this study.
Minerals 15 00510 g002
Figure 3. Technical performance and attributes of the Landsat 8 OLI sensor.
Minerals 15 00510 g003
Figure 4. The green area in the figure is the area covered by vegetation, which will be ignored when extracting the alteration information.
Minerals 15 00510 g004
Figure 5. Spectral curves of alteration minerals in the study area. (a) Spectral curve of hydroxyl alteration minerals. (b) Spectral curve of iron-stained alteration minerals.
Minerals 15 00510 g005
Figure 6. Distribution of the sample set. (a) The blue box in the figure represents hydroxyl alteration, while the green box represents iron staining alteration. (b) Hydroxyl alteration information sample data. (c) Iron staining alteration information sample data.
Minerals 15 00510 g006
Figure 7. Network structure diagram.
Minerals 15 00510 g007
Figure 8. Skip Connection Schematic.
Minerals 15 00510 g008
Figure 9. CBAM module structure diagram [55]. (a) is the overall schematic diagram of the CBAM module, (b) is the schematic diagram of the channel attention module, and (c) is the schematic diagram of the spatial attention module.
Minerals 15 00510 g009
Figure 10. The schematic diagram of the residual attention mechanism.
Minerals 15 00510 g010
Figure 11. Confusion matrix diagram, True Positive (TP), False Negative (FN), False Positive (FP), and True Negative (TN).
Minerals 15 00510 g011
Figure 12. Pixel accuracy curve on the validation set.
Minerals 15 00510 g012
Figure 13. Hydroxyl alteration and iron-stained alteration results. (a) Hydroxy alteration results, (b) Fe-stained alteration results.
Minerals 15 00510 g013
Figure 14. Field-verified alteration photographs; (a) basalt related to limonite mineralization, (b) siliceous dykes developed by limonite mineralization, (c) granite porphyry developed by potassic, malachite and limonite mineralization, and (d) siliceous dykes developed by limonite mineralization.
Minerals 15 00510 g014
Figure 15. Microscopic observation of microphotographs: (a) porphyritic granite-porphyritic structure; (b) amphibolite-flake structure; (c) epidotized tuff-tuff structure; (d) siliceous rock-cryptocrystalline structure; (e) pyrite; and (f) hematite, magnetite ore. Abbreviation: Qtz, quartz; Pl, plagioclase; Bi, biotite; Amp, hornblende; Ep, epidote; Hem, hematite; Mgt, magnetite; Py, pyrite.
Minerals 15 00510 g015
Figure 16. Alteration information extracted by different methods, (a) hydroxyl information extracted by RAHC-AIE, (b) iron-stained information extracted by RAHC-AIE, (c) hydroxyl information extracted by RAHC-AIE without CBAM, (d) iron-stained information extracted by RAHC-AIE without CBAM, (e) RAHC-AIE without Residual Attention extracted hydroxyl information, and (f) RAHC-AIE without Residual Attention extracted iron-stained information.
Minerals 15 00510 g016
Figure 17. The superimposed map of the geological map and altered mineral extraction results.
Minerals 15 00510 g017
Table 1. Experimental performance of hydroxyl and iron staining.
Class LabelAssessmentRAHC-AIE2D-CNNSVM
Hydroxyl AlterationPA98.61 ± 0.5192.35 ± 1.0590.00 ± 1.12
MPA90.41 ± 1.1289.21 ± 1.0390.05 ± 1.15
kappa98.16 ± 0.3295.15 ± 1.1296.01 ± 1.32
Mean_F193.00 ± 0.8993.12 ± 0.8492.07 ± 1.05
FWIoU97.03 ± 0.4596.06 ± 0.3295.04 ± 0.81
Iron AlterationPA96.45 ± 0.7894.45 ± 0.6895.46 ± 0.49
MPA91.92 ± 0.9589.95 ± 0.9589.94 ± 0.94
kappa95.28 ± 0.6792.56 ± 0.4692.74 ± 0.32
Mean_F192.25 ± 0.8290.04 ± 1.2391.25 ± 1.02
FWIoU93.40 ± 0.9193.39 ± 0.9591.23 ± 0.95
Table 2. Performance of different methods.
Class LableAssessmentRAHC-AIERAHC-AIE without CBAMRAHC-AIE without Residual Attention
Hydroxyl AlterationPA98.61 ± 0.5198.35 ± 0.4294.16 ± 0.31
MPA90.41 ± 1.1293.17 ± 1.1596.89 ± 1.25
kappa98.16 ± 0.3297.74 ± 0.2364.39 ± 0.36
Mean_F193.00 ± 0.8992.00 ± 0.8781.00 ± 0.72
FWIoU97.03 ± 0.4596.96 ± 0.3691.32 ± 0.23
Iron AlterationPA96.45 ± 0.7896.41 ± 0.6393.21 ± 0.65
MPA91.92 ± 0.9591.71 ± 0.5895.09 ± 1.02
kappa95.28 ± 0.6795.26 ± 0.3675.01 ± 0.53
Mean_F192.25 ± 0.8292.00 ± 0.6587.50 ± 0.98
FWIoU93.40 ± 0.9193.32 ± 0.3288.71 ± 0.32
Disclaimer/Publisher’s Note: The statements, opinions and data contained in all publications are solely those of the individual author(s) and contributor(s) and not of MDPI and/or the editor(s). MDPI and/or the editor(s) disclaim responsibility for any injury to people or property resulting from any ideas, methods, instructions or products referred to in the content.