Article

The Application of Airborne Gamma-Ray Spectrometric Multi-Element Composite Parameters in the Prediction of Uranium Prospecting Areas in Qinling Region, China

1
Institute of Geophysical and Geochemical Exploration, Chinese Academy of Geological Sciences (CAGS), Langfang 065000, China
2
Key Laboratory of Geophysical Electromagnetic Probing Technologies, Ministry of Natural Resources (MNR), Langfang 065000, China
3
National Center for Geological Exploration Technology, Langfang 065000, China
4
Guizhou Geological Survey, Guiyang 550081, China
*
Authors to whom correspondence should be addressed.
Minerals 2025, 15(5), 492; https://doi.org/10.3390/min15050492
Submission received: 7 February 2025 / Revised: 17 April 2025 / Accepted: 5 May 2025 / Published: 6 May 2025

Abstract

:
Progress in the exploration of uranium deposits in the Qinling region is impacted by a number of factors, including extensive forest distribution, large-scale terrain segmentation, and hidden ore bodies. Airborne gamma-ray spectrometry measurement is a direct method for uranium exploration, with data containing rich uranium mineralization information. In addition to surface mineralization information, such measurements also contain some information on deep uranium mineralization. Based on the geological characteristics of a specific area in the Qinling region, conventional data processing methods of airborne gamma-ray spectrometry (such as total elemental content, uranium, potassium and thorium content, and elemental ratios), the overall spectral characteristics obtained were analyzed. By utilizing the geochemical differences among K, U, and Th element contents, a model of four multi-element combination parameters of airborne gamma-ray spectrometry was constructed, including ancient uranium content, uranium activation migration coefficient, uranium abundance degree coefficient, and uranium migration enrichment coefficient, together with their geological significance. The model enhances the weak anomaly information of airborne gamma-ray spectrometry and provides a detailed analysis of key areas within the study area. Lastly, based on the extraction of multi-element anomaly information from airborne gamma-ray spectrometry data and optimal selection, combined with favorable geological information for exploration, a method for rapidly delineating prospective uranium ore areas is proposed, with three uranium ore prospective areas being predicted within the study area.

1. Introduction

Uranium is a crucial strategic energy mineral resource and serves as a fundamental material basis for the development of the nuclear industry. As early as 2016, China identified uranium and 24 other mineral resources as strategic minerals, intensifying exploration efforts to ensure energy resource security and meet the needs of strategic emerging industries [1]. The introduction of the “Dual Carbon Target” in 2020 has brought new opportunities and vast space for the development of China’s nuclear energy sector. Continuously discovering and delineating more uranium resources is an essential prerequisite and fundamental guarantee for the sustainable development of the nuclear energy industry. With the continuous deepening of uranium deposit exploration efforts, difficulty in discovering near-surface and shallow uranium deposits is increasing. Similarly to other metal minerals, the search for deep-seated, high-grade uranium deposits has become a primary focus of current and future uranium exploration [2,3]. To exploit deep-seated uranium resources, there is an urgent need for technological breakthroughs in deep uranium exploration and assessments of mineralization potential to detect deep-seated uranium resources [4].
Airborne gamma-ray spectrometry (also known as airborne radiometric survey) is a rapid and efficient technical method for directly locating uranium deposits and exploring uranium mineralization environments. It has extensive applications in uranium exploration due to its advantages of wide coverage, low cost, high information content, and being unaffected by terrain constraints [5,6,7,8,9,10,11,12,13,14,15,16,17,18,19,20,21,22,23]. Statistics show that 84% of known uranium deposits nationwide are distributed within or on the edges of high gamma-ray spectrometry fields, demonstrating the superiority of airborne radiometric survey in uranium exploration [24]. Airborne radiometric data primarily reflect the strength of the surface radioactive physical field, with some deep-seated mineralization information superimposed on complex backgrounds. Extracting and identifying concealed uranium mineralization information in shallow-covered areas has become a hot topic in current geoscience research [25,26,27]. In recent years, based on airborne radiometric data, various weak information extraction methods such as the uranium increment method by geological units, the thorium normalization method, the initial uranium-activated uranium–uranium migration coefficient method, the F-parameter method, and the correlation analysis method have been used to explore concealed uranium mineralization information, with excellent results being obtained. However, such surveys present depth limitations [1,4,10,25,26,27,28,29].
The study area is located in the southern Qinling metallogenic belt of the Qinling–Dabie metallogenic province, where there is intense tectonic and magmatic activity, providing favorable geological conditions for uranium mineralization. However, due to factors such as extensive forest cover, rugged terrain, and concealed ore bodies, uranium exploration has not yielded prominent results. Therefore, based on the analysis of the uranium mineralization geological background, we utilized high-precision 1:50,000 airborne gamma-ray spectrometry (AGRS) data. In addition to extracting AGRS uranium anomalies and high-field information directly related to uranium mineralization, various influencing factors were effectively eliminated during AGRS data processing. The above findings highlight the radioactive anomalies associated with uranium mineralization and the metallogenic environment information. Furthermore, parameters related to uranium remobilization enrichment, including paleo-uranium content (Gu), activated uranium migration amount (Fu), uranium abundance coefficient (UA), and uranium migration enrichment coefficient (Uc), were extracted to establish a multi-element combination parameter model, which yielded significant application results.

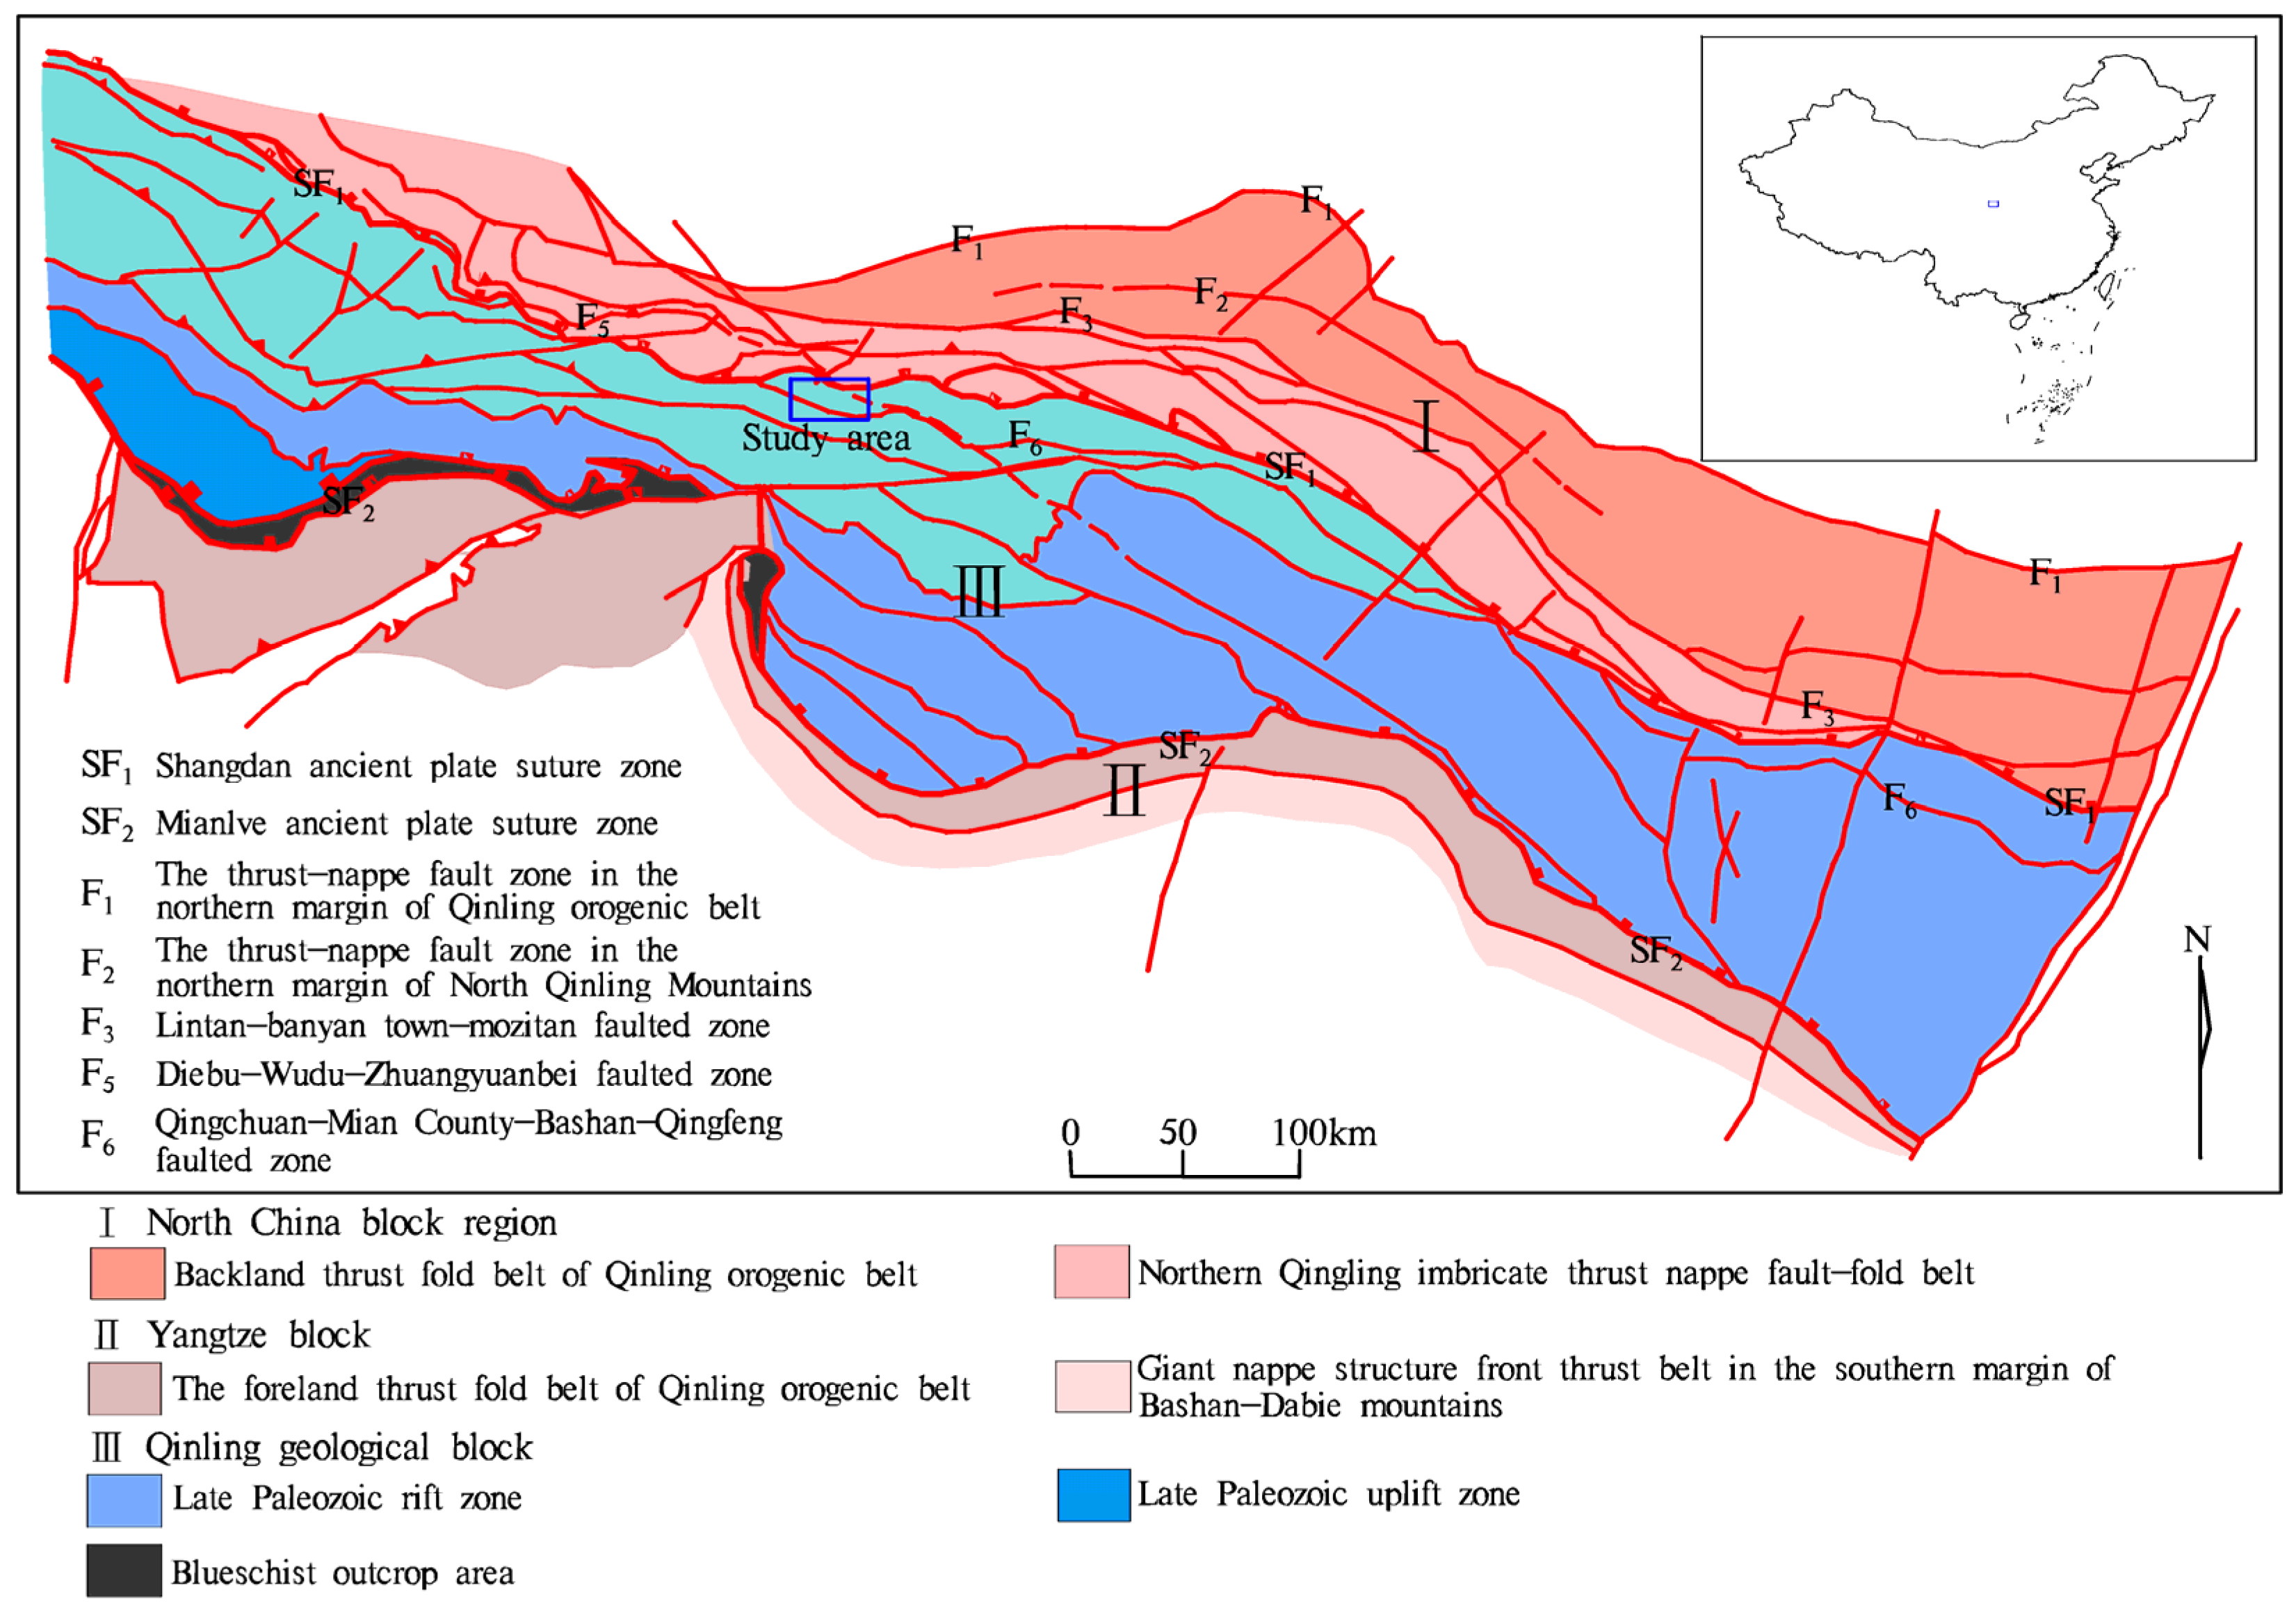
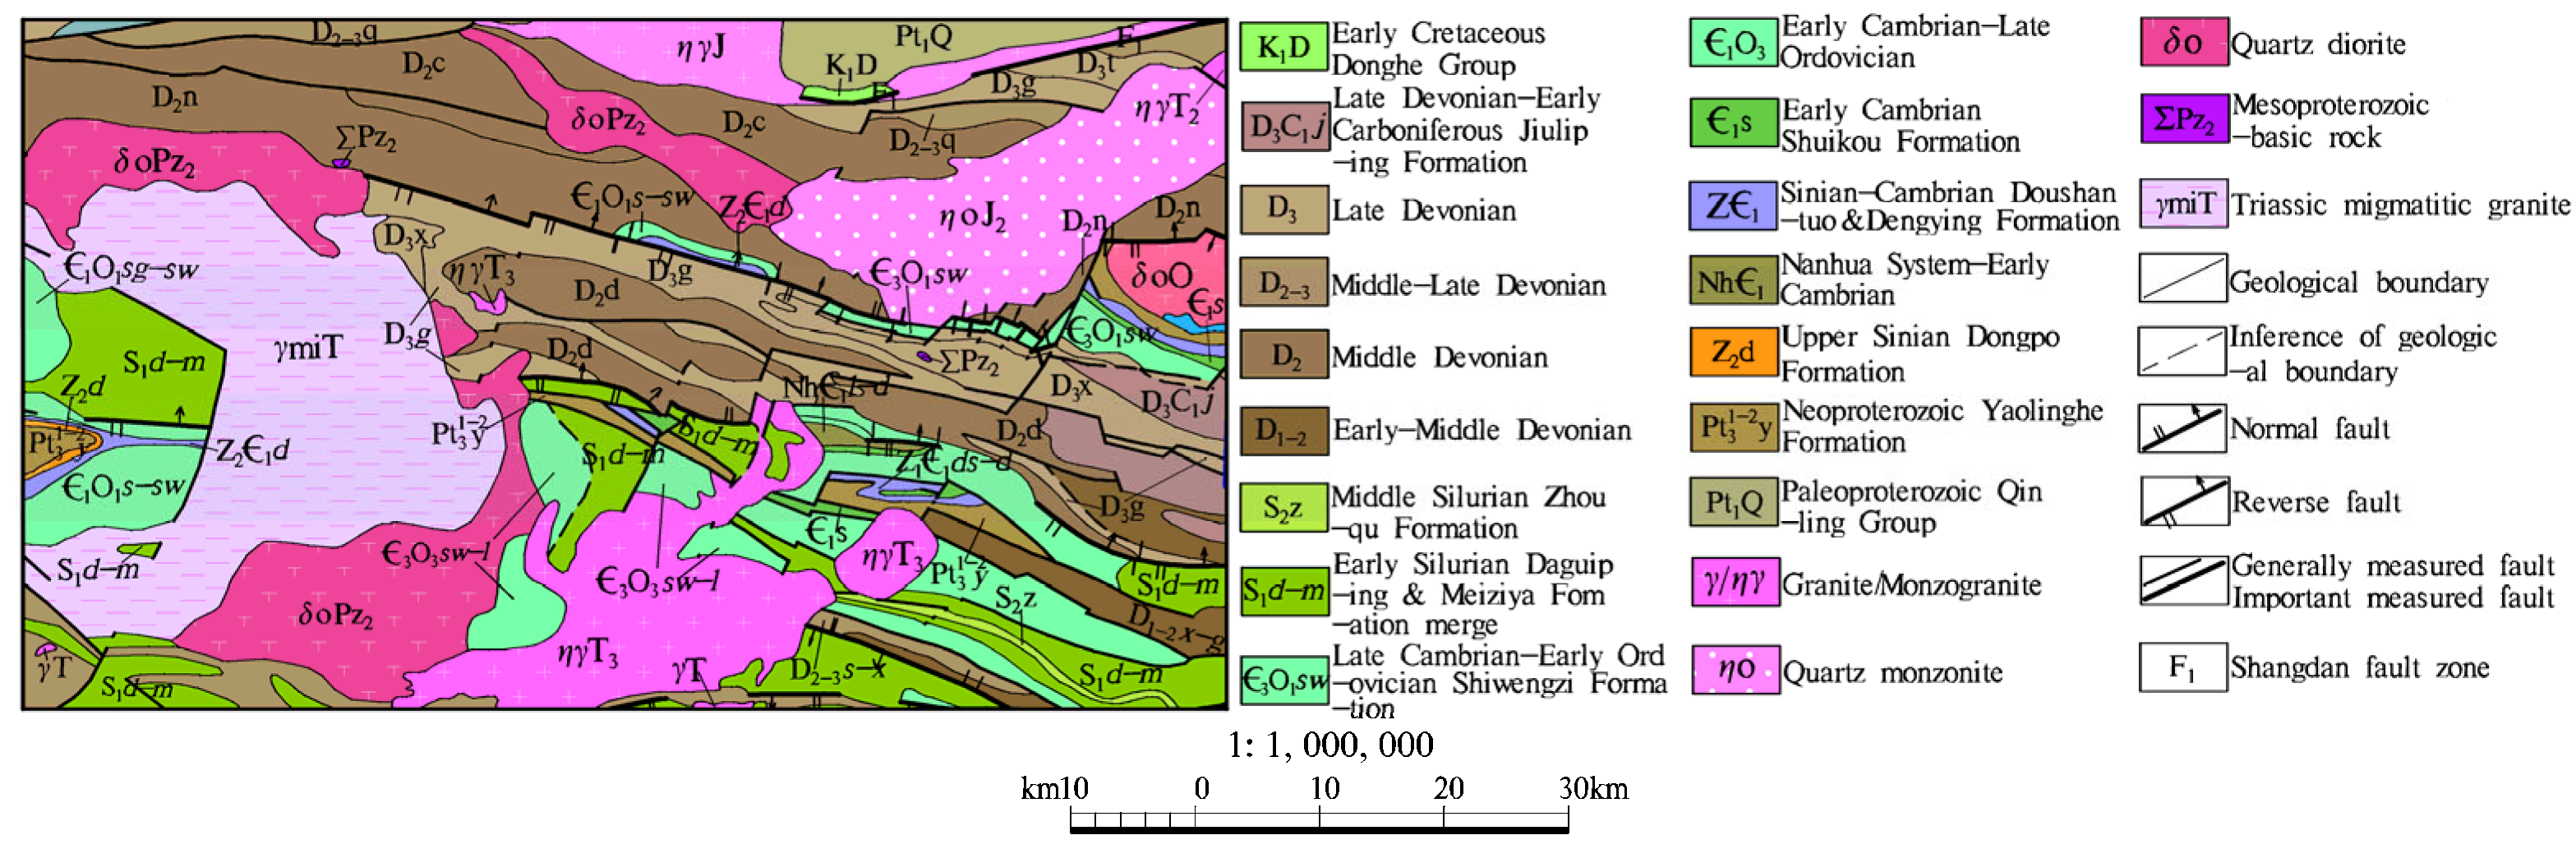
2. Geological Overview of Study Area

The blue boxed area in Figure 1 is the study area referenced herein, located in the central part of the Qinling Orogenic Belt and characterized by deep incisions and large elevation differences, with the maximum drop exceeding one thousand meters. The terrain descends from northwest to southeast. In terms of tectonic zoning, it spans three secondary tectonic units from north to south: the thick-skinned overthrust structure zone of northern Qinling, the Shangdan Fault Zone, and the northern thrust–overthrust structure zone of northern Qinling (the Late Paleozoic rift zone in the northern part of northern Qinling). More than 95% of the area is situated in the Late Paleozoic rift zone of the southern North Qinling microplate. Various types of faults have developed in the study area, either accompanying depressions, valleys, or rivers, or cutting through the surrounding rocks, serving as the main boundaries of the formations in the area (Figure 2). The orientations of the faults are mainly east–west and northwest–southeast, with a few exhibiting a north–northeast trend [30].
The strata in the study area are as follows: In the northern Qinling Orogenic Belt, the main exposure is the ancient and metamorphic Qinling Group (Pt1Q), which is a set of metamorphic rocks with a degree of metamorphism reaching the amphibolite facies, and it is a terrestrial clastic rock–carbonate rock construction. In the northern part of southern Qinling, the thrust–overthrust structure zone comprises a transitional metamorphic and deformed basement from the Middle to Late Precambrian, and the Neoproterozoic Yaolinghe Formation (Pt31−2y) comprises a set of shallow metamorphic marine volcanic lava-volcanic clastic rock and tuff. The cover layer is mainly composed of the Cambrian–Ordovician Doushantuo Formation (Z2Є1d), which is mainly a terrestrial clastic rock, mudstone, and carbonate rock sedimentary construction; the Dengying Formation (Z1Є1ds) is dolomitized marble interlayered with dolomite; the Dongpo Formation (Z2d) is composed of calcareous quartz sandstone and interbedded with conglomerate shale; the Early Paleozoic Cambrian–Ordovician Shiwengzi Formation, Bailongdong Formation, and Liangchakou Formation (Є3O3sw-l) are mainly composed of dolomite, argillaceous dolomite, and other carbonate rocks; the Shuikou Formation (Є3s) and Shuigoukou Formation (Є3O1sw) are generally composed of black siliceous rock and carbonaceous slate; the Shuigoukou Formation, Yuejiaping Formation, and Shiwengzi Formation (Є1O1s-sw) are mainly composed of carbonate rocks and clastic rocks; the Silurian Daguiping Formation (S1d) is mainly composed of carbonaceous quartzite, garnet biotite quartzite interlayered with siliceous crystalline limestone; the Meiziya Formation (S1–2m) is mainly composed of black cloud variegated quartzite, staurolite biotite quartzite interlayered with limestone; and the Zhouqu Formation (S2z) is mainly composed of feldspathic sandstone, carbonaceous slate, sandy slate, and mixed sedimentation. The Devonian strata are widely exposed in the study area, with them belonging to a marine terrestrial clastic–carbonate construction, composed of clastic rocks and carbonate rocks, mainly including the lower-middle Devonian Xichahe Formation (gravel and conglomerate); Gongguan Formation (sandy dolomite and dolomite interbedded with slate) (D1–2x-g); the middle Devonian Dafengou Formation (D2d) dominated by iron and calcium sandstone interbedded with slate and limestone; the Niuerchuan Formation (D2n) dominated by quartz sandstone interlayered with sandy slate and dolomite; the Chigou Formation (D2c) mainly composed of mudstone and striped sandstone; the middle and upper Devonian Qingshiya Formation (D2–3q) dominated by calcareous siltstone, sericite silty slate, sandstone, and marl; the upper Devonian Xinghongpu Formation (D3x) dominated by sandstone and sandy slate interlayered with limestone; and the Gudaoling Formation (D3g) mainly containing limestone, reef limestone, and bioclastic limestone. The Devonian–Carboniferous mainly comprises the Jiuliping Formation (D3C1j) slate interlayered with conglomerate, limestone, and (silt) sandstone. The Mesozoic Donghe Group (K1D) is only exposed in the northern part of the Shangdan Fault Zone and is mainly composed of conglomeratic sandstone and conglomeratic sandstone (Figure 2) [31,32].
The magmatic activity within the area is extremely intense, with the exposed area of rock formations accounting for nearly half of the entire region. Ultrabasic rocks (ΣPz2) sporadically emerge within the area, primarily formed during the Late Paleozoic era. Medium-basic magmatic rocks were formed in the Early Paleozoic, Late Paleozoic, and Mesozoic eras. The predominant magmatic rocks include quartz diorite (δoO, δoPz2), quartz monzonite (ηoJ2), diorite (ηγJ, ηγT3), granite (γT), and mixed granite (γmiT).
The Shangdan Fault Zone within the area transitions from northwest–southeast to northeast–southwest, situated in the northeastern part of the research area. The fault zone mainly consists of a suite of felsic mylonites, granitic mylonites, and acidic volcanic rocks of the Danfeng Group (ηγJ), which exhibit characteristics similar to serpentinite, often appearing in banded and alternating distributions [33].

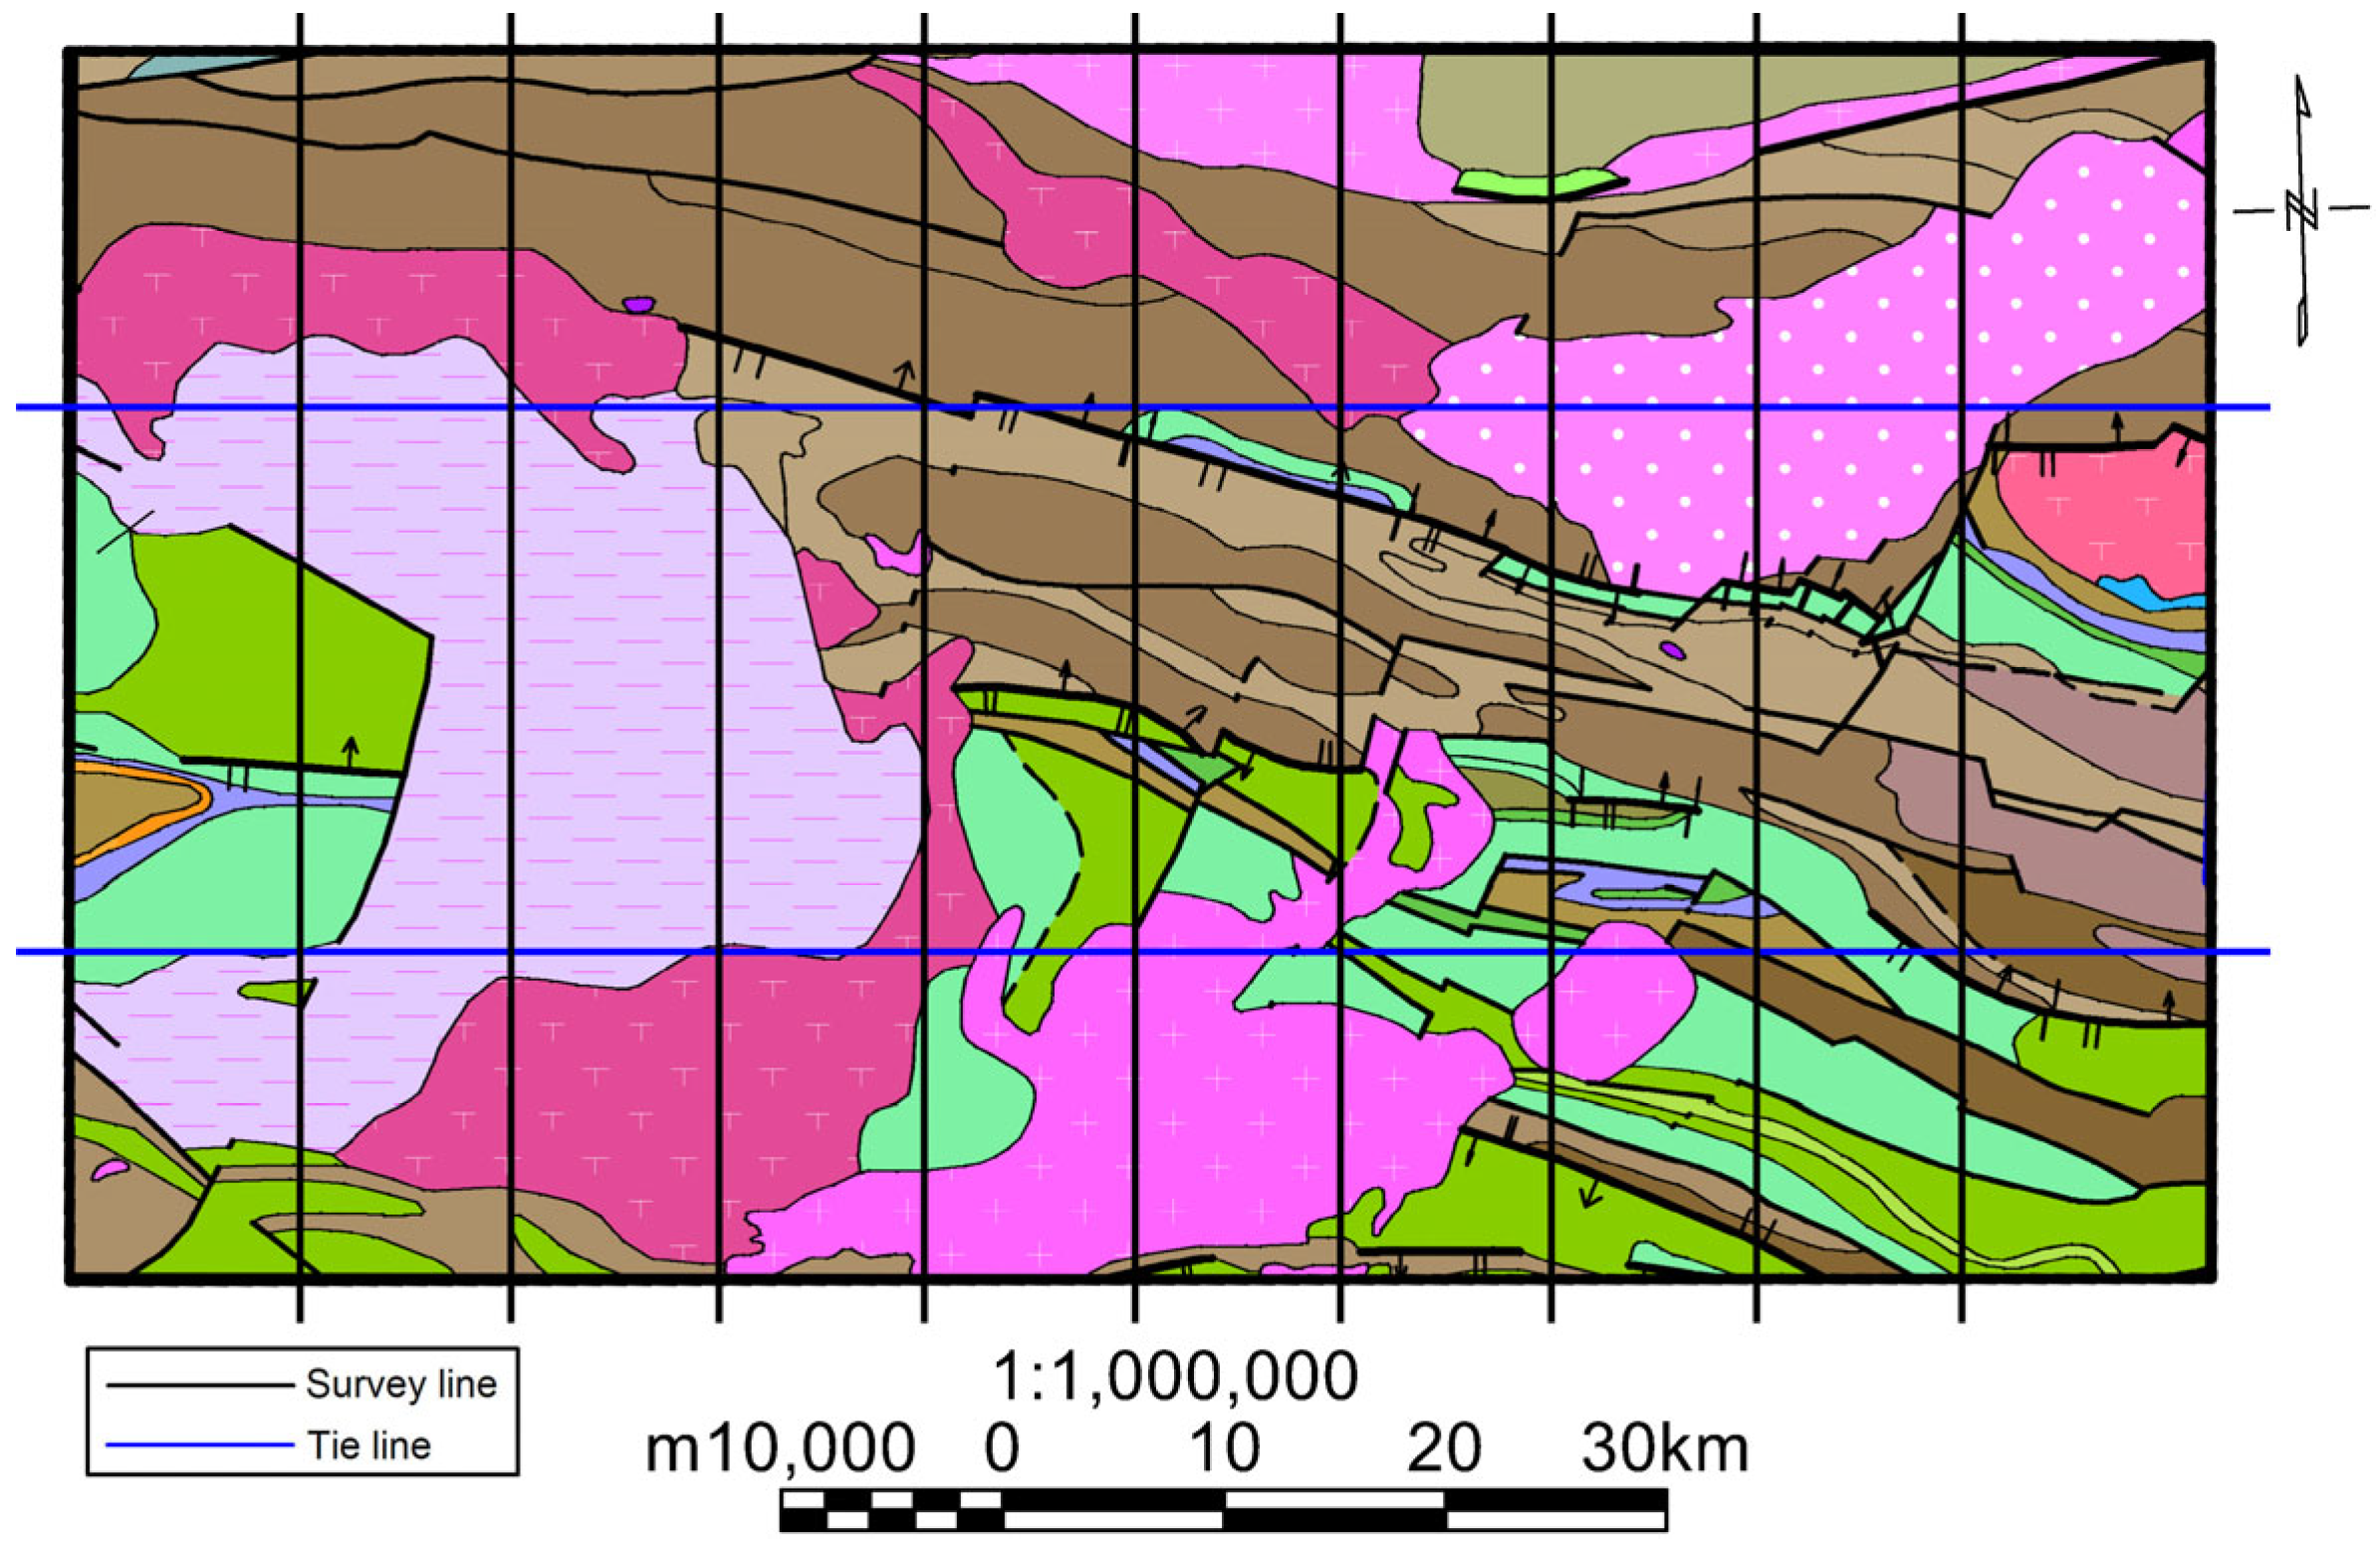
3. Airborne Gamma-Ray Spectrometry Measurement

The main geological structures in the research area are predominantly oriented in a near east–west or northwest–southeast direction. Following the principle of setting survey lines as perpendicular as possible to the direction of the geological structures [34], the primary survey lines in the research area were determined to be oriented north–south (0–180°), with a line spacing of 500 m. Tie lines were set to be perpendicular to the primary survey lines, oriented east–west (90–270°), with a flight line spacing designed to be 7.5 km, based on the principle of the aircraft flying at normal cruising speed for 2–5 min. The measurement scale was 1:50,000. The schematic diagram of the survey network layout in the study area is shown in Figure 3.
For aeromagnetic gamma-ray spectrometry measurement, we utilized the 1024-channel RS-500 high-precision airborne gamma-ray spectrometer introduced by the Radiation Solutions Inc. (Mississauga, ON, Canada) in 2013. The aircraft selected for the task was the Airbus AS350 B3. The survey was conducted and completed by researchers at the Institute of Geophysical and Geochemical Exploration, Chinese Academy of Geological Sciences in October 2019, covering a total of 10,691 km of survey lines. High-quality radiometric data were obtained, with an average flight altitude of 135 m and an average flight speed of 128 km/h, GPS positioning accuracy was 1.97 m eastward, 0.96 m northward, and 2.88 m vertically, along with an average deviation distance of 10.96 m and a survey line spacing density of 500 ± 17.5 m. The spectrometer’s radioactive crystal exhibited excellent stability, with a maximum 7 h variation rate of 3.5%, energy resolution between 8.8% and 10.7%, peak drift ranging from −0.95 to 0.3 channels, and baseline variation rates from −4.89% to 10.27% between morning and evening measurements. The instrument demonstrated flawless performance with zero dead time (0 μs) and a sampling system error rate of 0.00%.
The collected aeromagnetic gamma-ray spectrometry data were subjected to correction for aircraft background, cosmic ray background, atmospheric radon, Compton scatter (stripping coefficient correction), and altitude attenuation. The corrected window count rate was used to calculate the ground concentrations of 40K, 238U, and 232Th nuclides, with uranium and thorium concentrations expressed as eU and eTh, respectively, in parts per million (ppm). Potassium content was expressed as K, in percentage. The total window count rate was converted into equivalent uranium content, known as the unit of radiation (Ur).

4. Method for Extracting Weak Information from Airborne Gamma-Ray Spectrometry Data

The airborne gamma-ray spectrometry data contain information on the concentrations of three natural radioactive isotopes: potassium (K), uranium (U), and thorium (Th). These isotopes exhibit varying levels of activity in different geochemical environments. Potassium is highly active in both oxidizing and reducing environments. Uranium has strong migratory capabilities in its oxidized state, with it being able to dissolve or adsorb and migrate. However, its activity is not as strong in reducing conditions, making it less prone to dissolution and migration. Thorium, with its stable chemical properties, is generally less soluble under most conditions. When uranium is leached and migrates, thorium is typically retained and often migrates in a mechanical transport form [25,27,29].
During the uranium mineralization process, changes in pressure, temperature, pH, and Eh values lead to the redistribution of potassium, uranium, and thorium, resulting in the formation of diffused halos with regular distributions [27,29]. Single-element ratio parameters can reflect the differences in the distribution of different radioactive elements in the same part of the surveyed area; however, their effectiveness is relatively limited and often ambiguous. Therefore, in the processing of airborne gamma-ray spectrometry data, these parameters are often introduced as intermediate variables into the calculation of characteristic parameters. Multi-element combination parameters integrate various information based on single-element ratio parameters, suppressing interference, improving the signal-to-noise ratio, and allowing for the further analysis of the migration characteristics of radioactive elements, thereby better exploring radioactive anomaly information related to uranium mineralization and ore-forming environment in the airborne gamma-ray data [25]. The multi-element combination parameters from airborne gamma-ray spectrometry data and their geological significance are shown in Table 1.
Based on the exploration and summarization of previous studies, it is believed that parameters such as ancient uranium content (Gu), activated uranium migration amount (Fu), uranium abundance index (UA), and uranium migration enrichment factor (Uc) demonstrate more significant effects in the enhancement and extraction of weak information in airborne gamma-ray spectrometry measurements [4,10,25,26,27,29].

5. Analysis and Discussion of Airborne Gamma-Ray Spectrometry Data from the Study Area

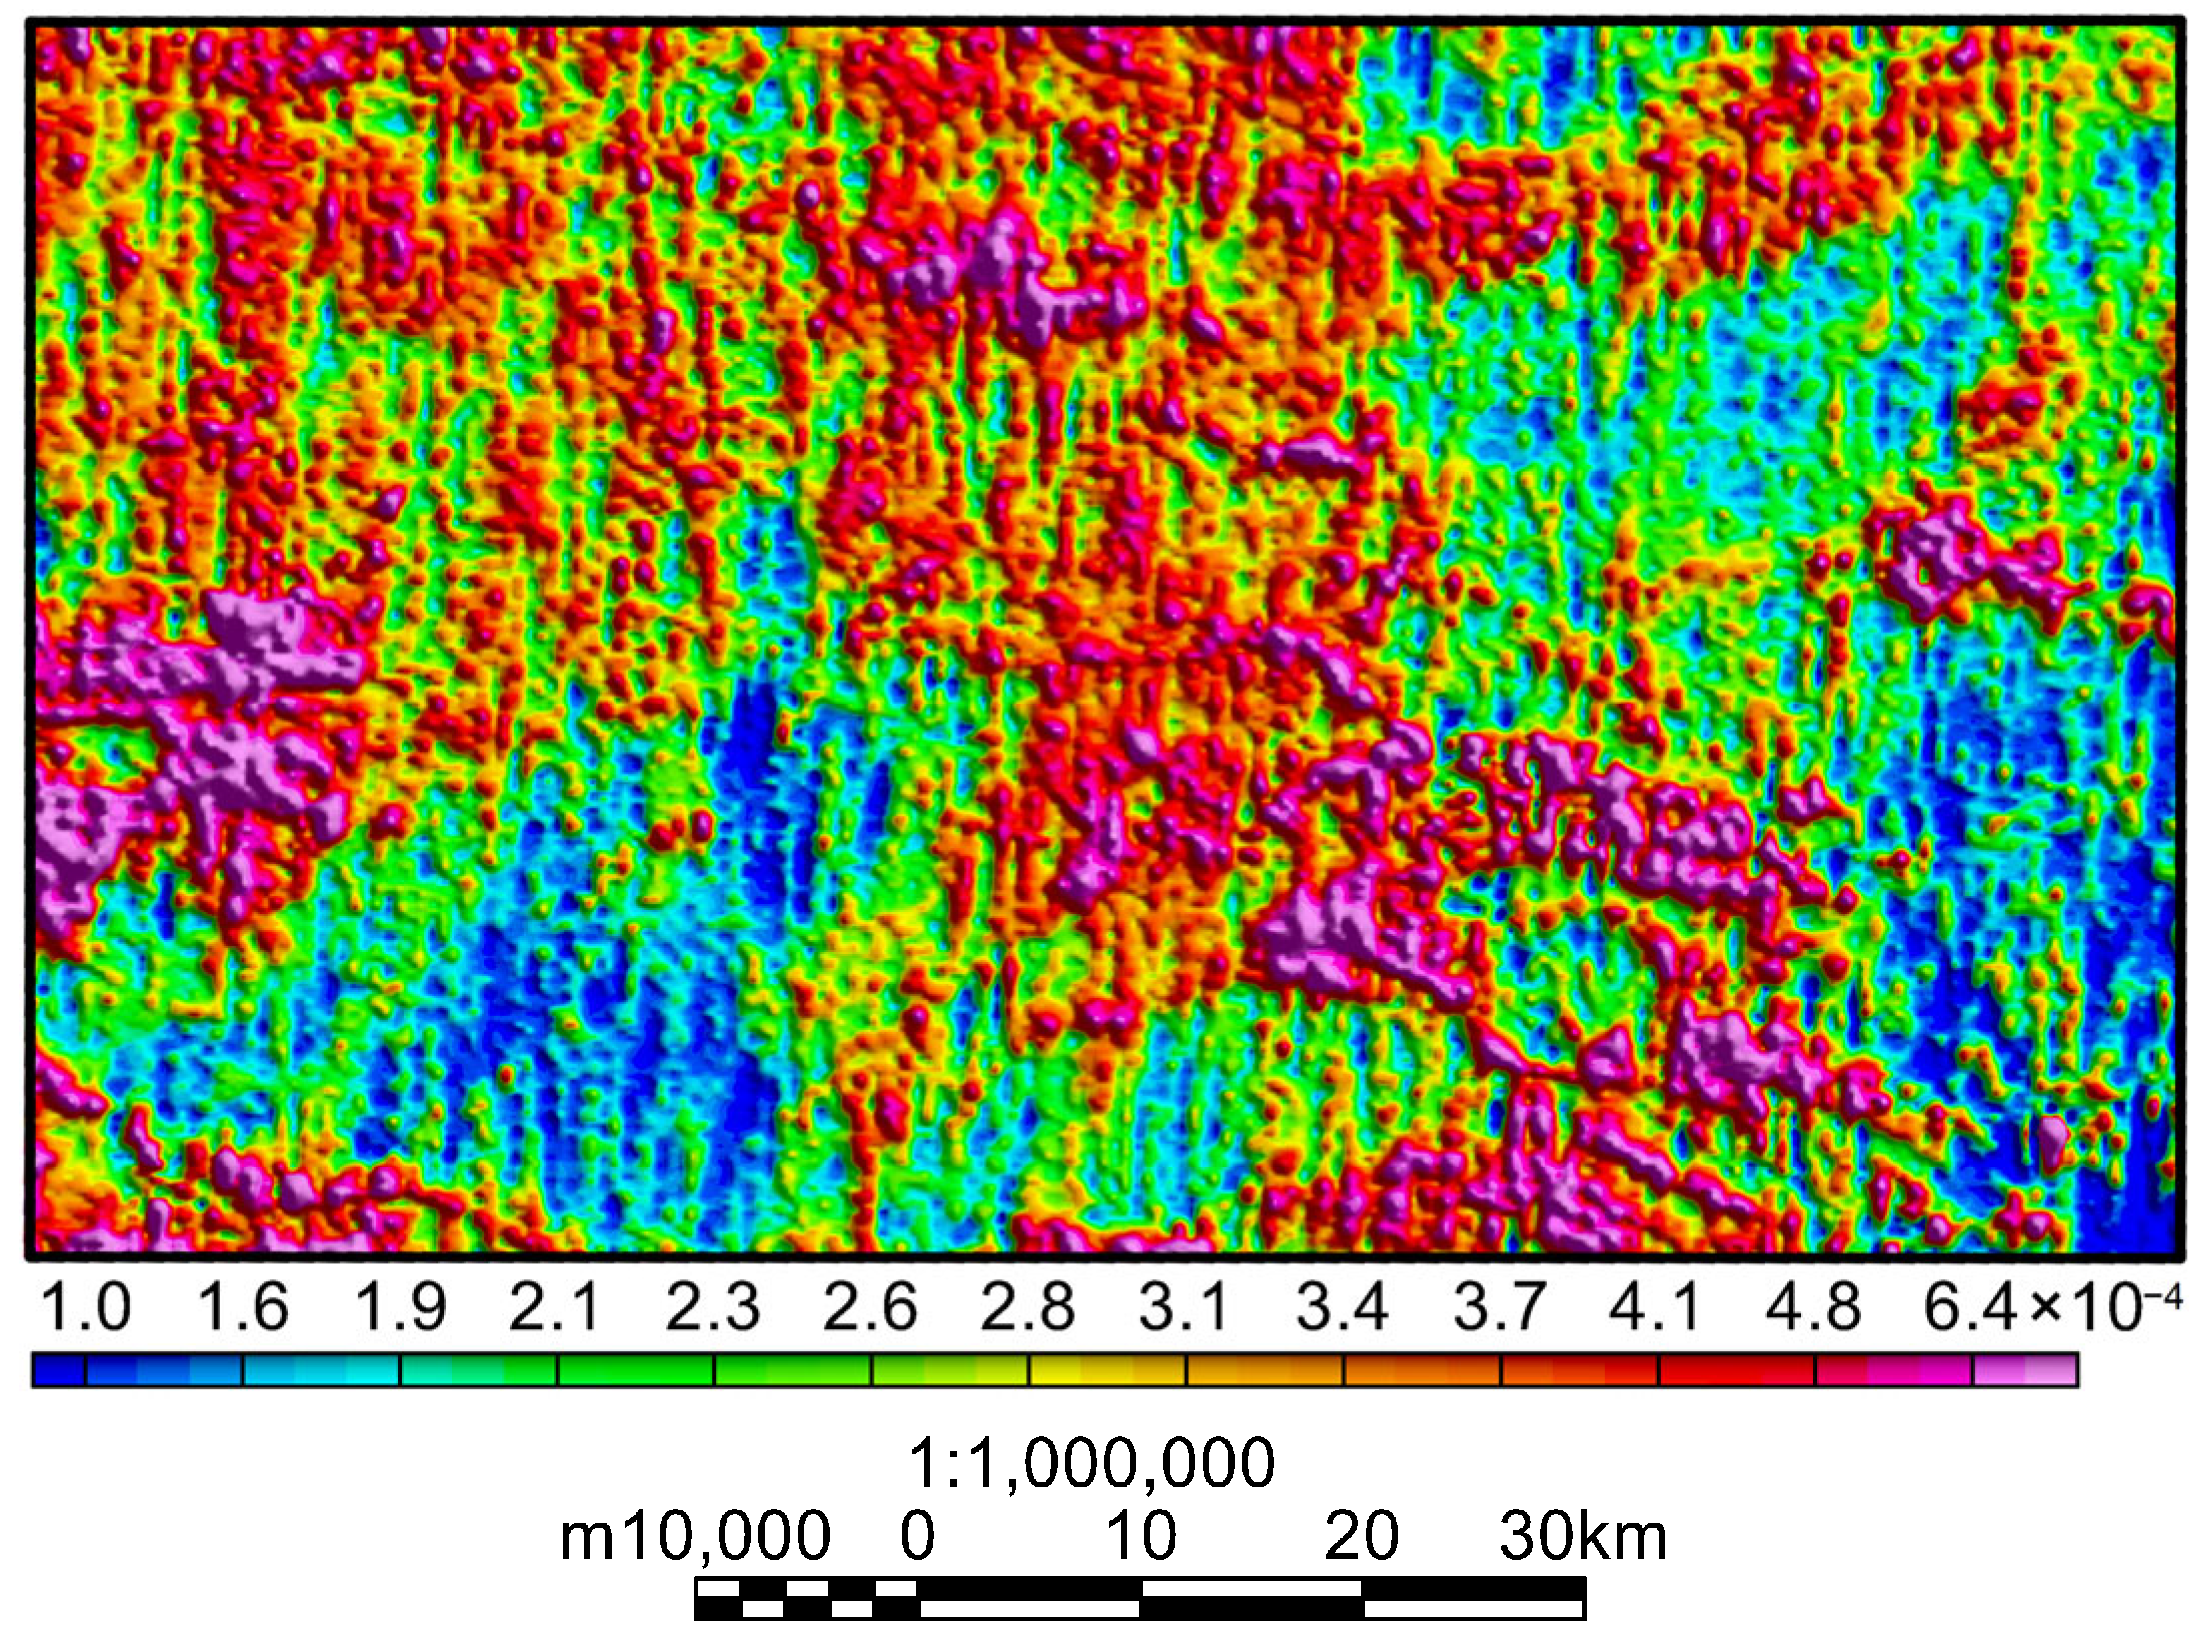
5.1. Overall Characteristics of Aerial Gamma-Ray Spectrometry

A systematic statistical analysis of the radioactive element content in different strata and igneous rocks in the study area was conducted. The mean total count rate was 11.97 Ur, with a mean potassium content of 1.34% (with a crustal Clarke value of 2.04%), a mean uranium content of 3.87 ppm (with a crustal Clarke value of 1.70 ppm), and a mean thorium content of 7.43 ppm (with a crustal Clarke value of 5.80 ppm). The measurement results for the entire area show that the uranium and thorium contents are significantly higher than the crustal Clarke values, indicating the overall characteristic of uranium and thorium enrichment in the study area (Figure 4).
The total count of airborne radioactivity can reflect the overall strength of radioactivity in different rock formations. As shown in Figure 4a, the study area generally exhibits a high radioactive background, with a banded or patchy distribution. High anomaly areas are located within the Shandan Fault Zone (A), the outcrop area of Triassic mixed granites (γmiT) (B), the southern edge of Middle Jurassic quartz diorites (ηoJ2) (C), the outcrop area of Late Triassic diorite granites (ηγT3) (D), and the outcrop area of Silurian strata at the southeastern edge of the study area (E). Weak anomalies are mainly located in the interbedded areas of the Early Paleozoic Cambrian–Ordovician Shuigoukou Formation, the Shiwengzi Formation, the Bailongdong Formation, and the Liangchakou Formation (Є3O3sw-l, Є3O1s-sw). The distribution characteristics of these radioactive anomalies reflect that in areas with intense magmatic activity, the regions where intermediate–acidic volcanic rocks are exposed exhibit higher radioactivity backgrounds, forming patchy high radioactive anomaly areas. The high radioactivity content in the Silurian strata in the southeast of the study area is mainly due to the presence of carbonaceous black rock formations with a higher degree of metamorphism. The background field within the area mainly corresponds to the outcrop areas of Late Paleozoic Devonian strata.
The thorium content within the study area exhibits the highest overall conformity with the airborne radioactivity total count. However, the boundary gradient of high or elevated thorium content is steeper than that of the total count, and the high or elevated thorium content anomalies in local sections are more distinct. The distribution characteristics of potassium content in the region show distinct differences from the overall profile, particularly in the outcrop areas of Middle Jurassic quartz diorites (ηoJ2) (C) and Late Paleozoic quartz diorites (δoPz2) (F), where the potassium content is notably elevated. The overall uranium content corresponds well to the high-value areas within the Shandan Fault Zone (A), the outcrop area of Triassic mixed granites (γmiT) (B), and the outcrop area of Silurian strata (E); however, it should be noted that there are significant differences in their overall forms. The above findings also confirm that in different geochemical environments, the activity levels of uranium, potassium, and thorium exhibit varying strengths.
The distribution characteristics of airborne radioactivity within the area are strictly controlled by regional tectonics: in the northern part, the distribution is influenced by the Shandan Fault Zone and the outcropping magmatic rock bodies, transitioning from northwest to northeast; in the western and southern parts, the distribution forms block-like patterns under the influence of outcropping magmatic rock bodies; and in the southeastern part, the distribution extends northwestward under the control of the Silurian strata.

5.2. Ratio Parameters of Airborne Radioactive Elements

The variation in airborne gamma-ray spectrometric ratio parameters is sometimes more sensitive than absolute values in indicating the degree of rock alteration, delineating alteration zones, and identifying mineralization and other specific geological processes, with it holding significant importance for the prediction of prospecting target areas.

5.2.1. Thorium–Potassium Ratio

Due to the secondary enrichment of potassium and significant loss of thorium in liquid form during alteration processes, the thorium–potassium ratio is commonly used to determine the degree of alteration in rocks [35]. Research has shown that a decrease in the eTh/K ratio, with a minimum value less than 2 (typically greater than 3 in intrusive and sedimentary rocks), indicates geochemical uniformity in the area and suggests the presence of altered rocks at potassium anomalies [36]. As shown in Figure 5, the alteration processes in the study area are mainly concentrated in the exposed areas of the Precambrian Qinling Group north of the Shangdan Fault Zone, the western part of the Middle Jurassic quartz diorite (ηoJ2), and the exposed areas of the Late Paleozoic quartz syenite (δoPz2).

5.2.2. Thorium–Uranium Ratio

In the study by B.B. Sherbinna (1941), the eTh/eU ratio generally ranges from 3.5 to 3.3. When the eTh/eU ratio of a rock mass is between 2.0 and 0.7 (often 0.7), it typically forms a uranium ore deposit; when the ratio is between 2.5 and 4.0, it forms a uranium–thorium mixed ore deposit; and when the ratio is greater than 5.0 to 8.0, it forms a thorium ore deposit [37]. The thorium–uranium ratio in the exposed areas of the Triassic mixed granite (γmiT) and the Silurian strata in the study area ranges from 0.3 to 3.7, indicating a potential formation of uranium ore deposits. The average thorium–uranium ratio for the entire area is 3.15, suggesting that uranium mineralization in the study area is mainly associated with uranium and thorium coexistence (Figure 6). The thorium–uranium ratio is also commonly used to analyze the general rules of sedimentary environments and facies: when eTh/eU is less than 2, this generally indicates a deep-water sedimentary environment under strong reducing conditions, often resulting in gray or green shales; when 2 < eTh/eU < 7, it belongs to a transitional environment from reducing to oxidizing, such as coastal or littoral sedimentary environments; when eTh/eU is greater than 7, this indicates an oxidizing environment, typically associated with continental sedimentation [38,39]. Various sedimentary environments are reflected in the study area.

5.2.3. Uranium–Potassium Ratio

In the 1980s, Indian scientists used the eU/K ratio as an indicator of uranium mineralization [1]. By calculating the eU/K ratio in different rock formations, they concluded that a high uranium–potassium ratio typically indicates the presence of uranium mineralization. In the study area, high eU/K ratio zones are mainly distributed in the Shandan Fault Zone, the exposed areas of the Triassic mixed granite (γmiT), and the Silurian strata (Figure 7). In future prospecting studies, attention should be paid to these high eU/K ratio areas.

5.3. Characteristics of Multi-Element Combination Parameters in Key Areas

Multi-element combination parameters integrate various information based on single-element ratio parameters to allow for the further analysis of the characteristics of radioactive element activation and migration. This targeted analysis aids in the evaluation of prospective areas for uranium mineralization and provides important criteria for delineating prospective uranium mining areas [40]. An image of the calculated results of the multi-element combination parameters in the study area is shown in Figure 8.
From the compilation of airborne gamma-ray spectrometry data, it was observed that the average uranium content in the study area is 3.87 ppm, which is significantly higher than the crustal Clarke value of 1.7 ppm, indicating that this is a high uranium region. However, there are significant differences in uranium content among the different geological formations and rock types (Figure 4c). In general, in the source areas (Paleozoic strata, igneous rocks), the ancient uranium content (Gu) is higher, and the activated uranium migration amount (Fu) is negative or significantly low, indicating uranium activation and migration, representing the uranium source layer in the study area.
In the Qinling region, the uranium polymetallic ore-bearing layers are primarily uranium mineralized in granite rocks dominated by the Shandan Fault Zone. The Silurian Diebu Formation, Zhouqu Formation, and Bailongjiang Formation collectively form a marine carbonaceous siliceous mudstone assemblage. The uranium deposits (points) in the study area are mainly characterized by layer-controlled hydrothermal altered carbonaceous siliceous mudstone deposits, with the primary type being hot water-altered carbonaceous siliceous mudstone deposits and the secondary type being layer-controlled carbonaceous siliceous mudstone deposits. The following subsections provide a detailed analysis of the key areas in the region of study.

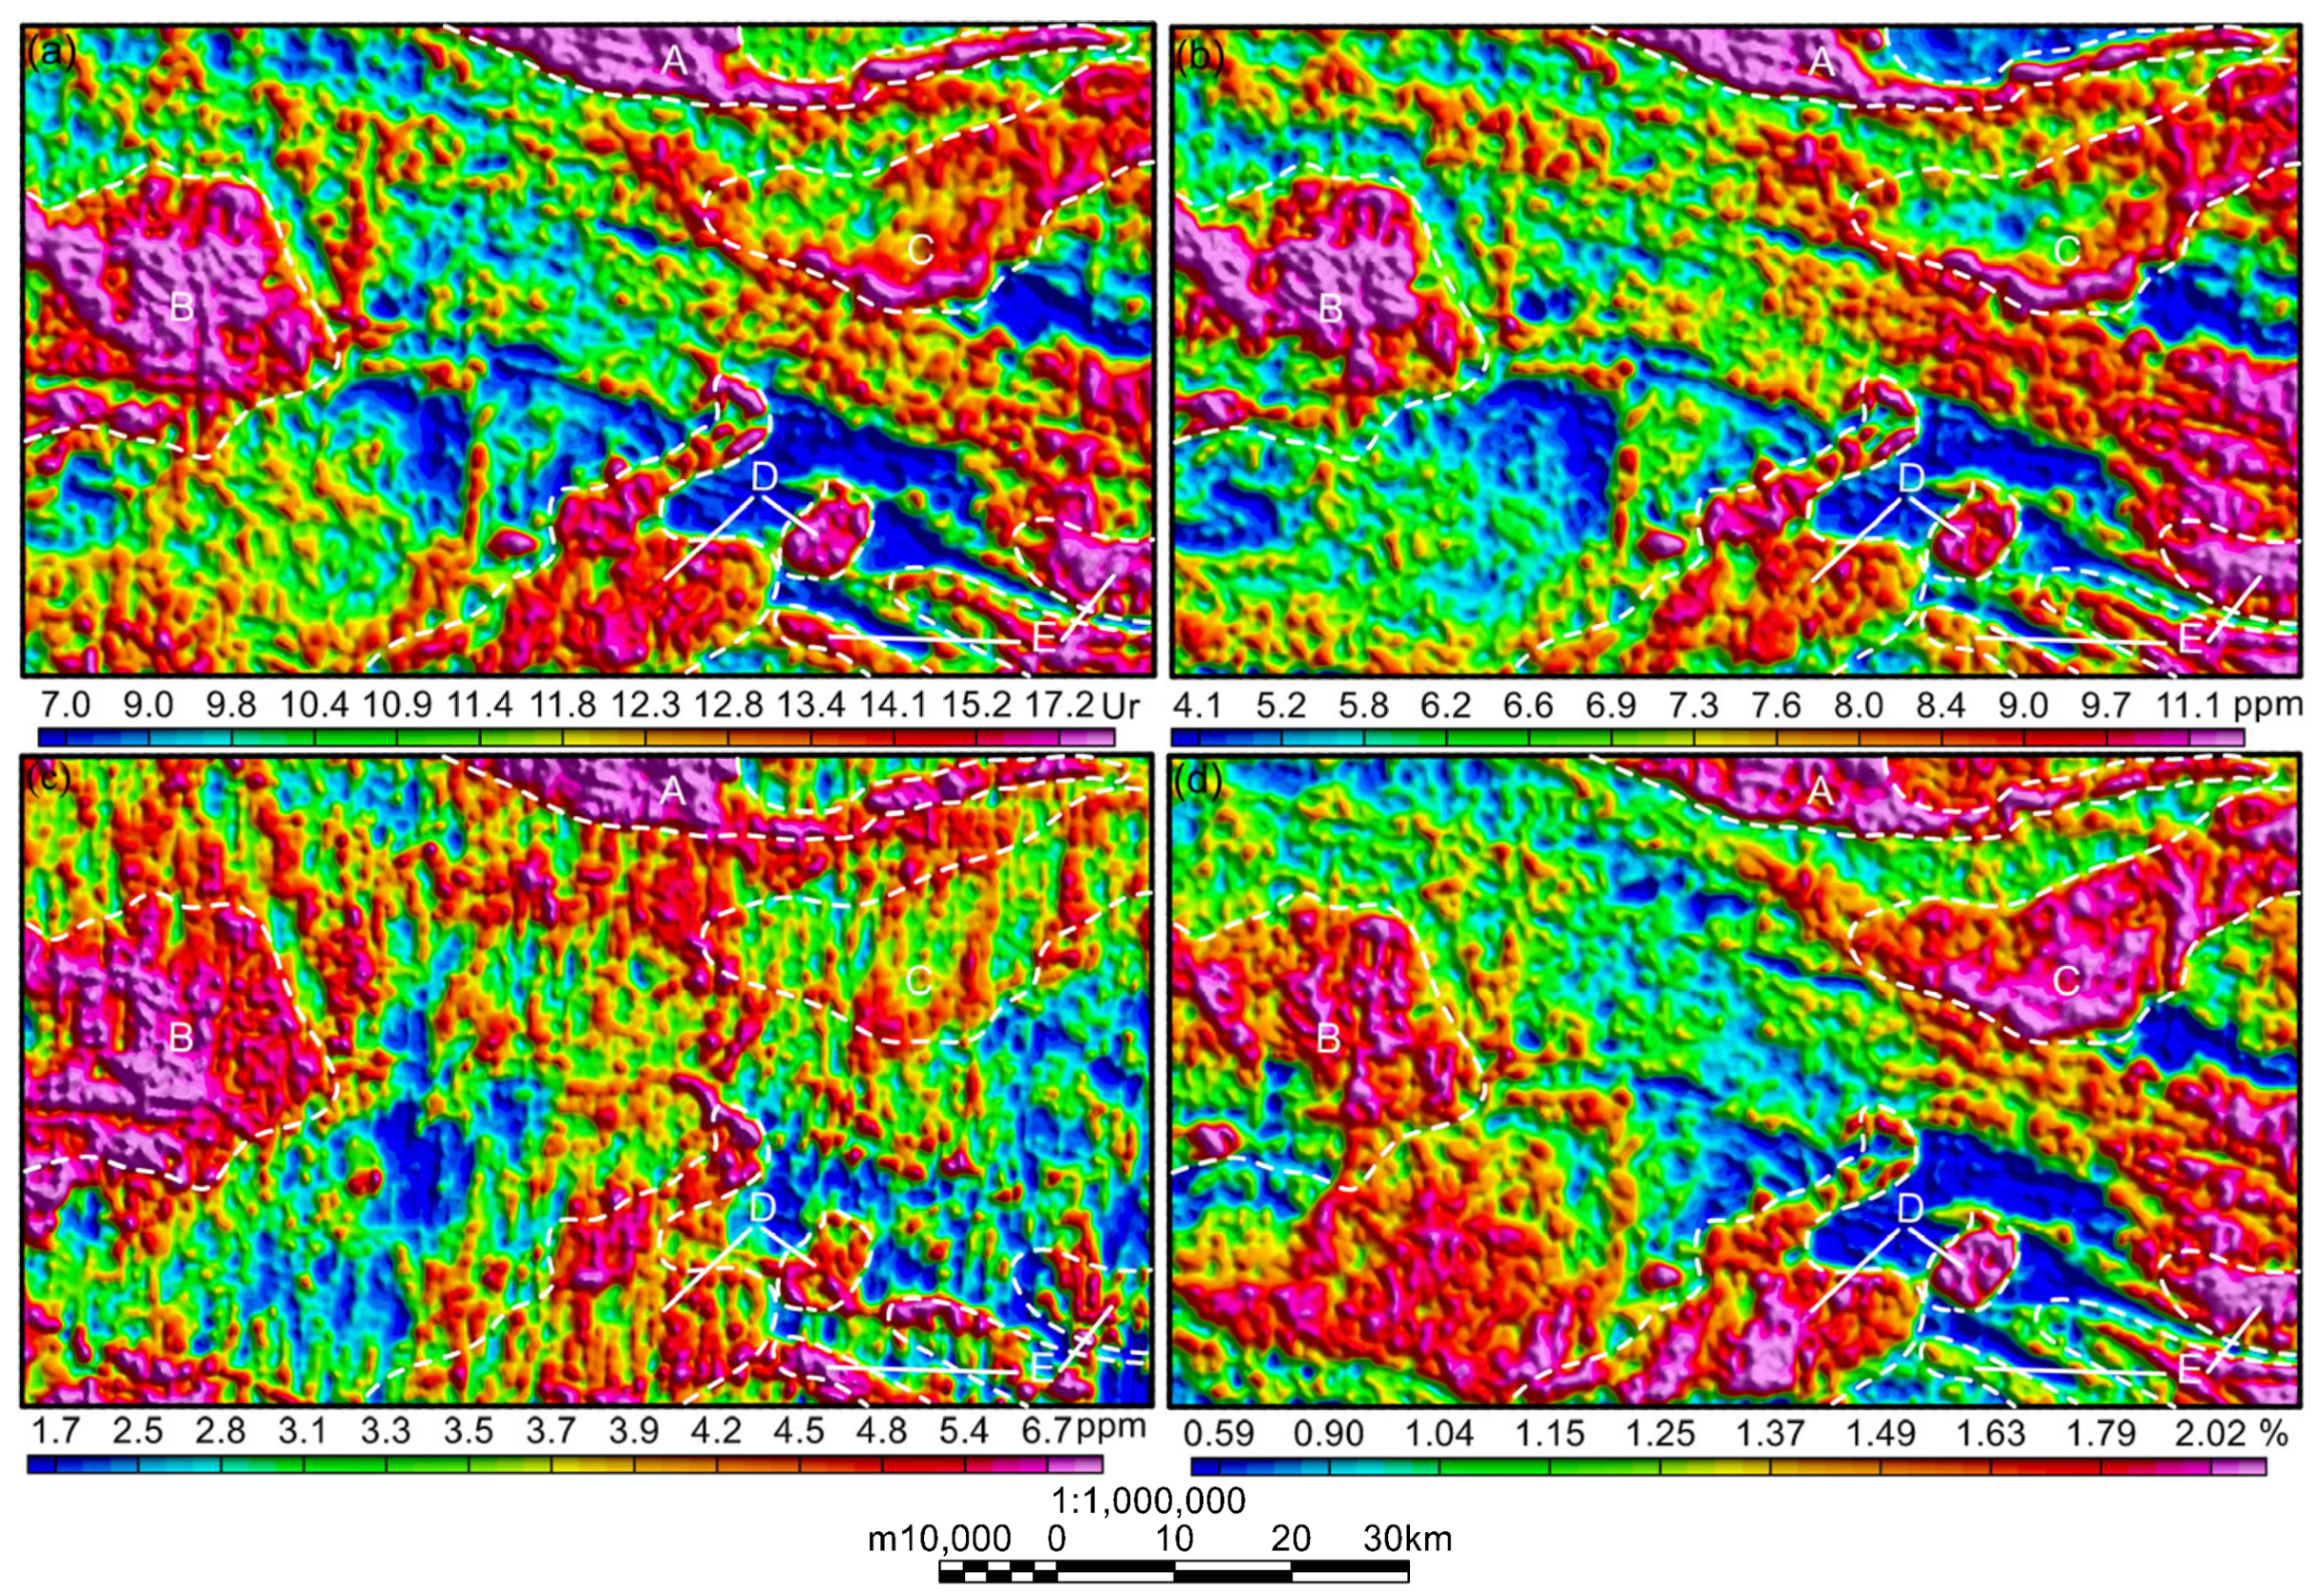
5.3.1. The Radioactive Parameter Characteristics in Area A

The distribution trend of uranium content (Figure 4c) in area A, which mainly refers to the location of the Shangdan Fault Zone and the acidic volcanic rocks of the Danfeng Group, shows a high-value zone with eU > 3.9 ppm, indicating a source area with magmatic rocks as the erosion source, exhibiting a banded distribution. Through subtle information extraction, it can be clearly observed (Figure 8) that the paleo-uranium content (Gu) generally corresponds to the uranium content distribution, also representing a high-value zone. The overall migration of activated uranium (Fu) is predominantly positive, with an average migration amount of 1.49 ppm, indicating the post-metamorphic migration of uranium elements in the area. The uranium abundance index (UA) exhibits a high-value zone across the entire study area, indicating significant hydrothermal alteration and serving as an important indicator of uranium mineralization. Similarly, the uranium migration enrichment factor (Uc) also shows a high-value anomaly zone, indicating that in addition to the original high uranium content in the uranium source layer (body), uranium elements further migrated and formed superimposed post-enrichment under geochemical processes, which is an important indicator for delineating prospective mining areas.
Simultaneously, it shares geological commonalities with the uranium metallogenic laws of the entire Qinling region. The geological map at a scale of 1:1,000,000 indicates that the lithology is Jurassic biotite granite (ηγJ). However, field measurements showed that in the eastern narrow area of the Shangdan Fault Zone, there are mainly biotite gneiss and granitic gneiss; in comparison, in the broader western area, the Danfeng Group’s biotite granite (ηγJ) dominates, with a few exposed pegmatite veins.

5.3.2. The Radioactive Parameter Characteristics in Area B

Area B is located at the western edge of the study area, mainly exposing Triassic mixed granite (γmiT), with minor exposures of Cambrian–Ordovician Doushantuo Formation (Z2Є1d), Dongpo Formation (Z2d), Early Paleozoic Cambrian–Ordovician Shuigoukou Formation, Yuejiaping Formation, and Shiwengzi Formation with interbeds (Є1O1s-sw), in addition to the Silurian Daguiping Formation and Meiziya Formation with interbeds (S1d-m).
The uranium distribution trend in the study area shows a high-value area (Figure 4c), with the average eU content reaching 6.29 ppm, nearly four times the crustal abundance value of 1.70 ppm, with a maximum value of 34.55 ppm. This area is considered an erosion source area with metamorphic rock bodies as the source, distributed in block-like patterns. Through weak information extraction, it can be clearly observed (Figure 8) that the high-value area of ancient uranium content (Gu) is about half the size of the high-value uranium content area. The high-value area is mainly distributed in the northern half of the B area, similar to the distribution pattern of high thorium content in the area, but with clearer gradients. The average ancient uranium content is 4.88 ppm, with a maximum value of 9.05 ppm, indicating a significant uranium enrichment phenomenon in this area in the later stages. The overall pattern of activated uranium migration (Fu) shows that the northern part of the area is dominated by negative values, indicating uranium migration away from this area, while the southern part is characterized by positive values, suggesting uranium migration into this area. The average migration outflow of activated uranium in the area is roughly 1.3 ppm, while the average inflow is roughly 2.7 ppm, indicating the presence of uranium migration into the area after rock formation. The uranium abundance index (UA) shows a bias toward high-value areas, especially in the Silurian outcrop area north of the Cambrian strata, indicating the possible intrusion of magmatic rock bodies and significant hydrothermal alteration. The uranium migration enrichment factor (Uc) also exhibits high-value anomaly areas, indicating that uranium elements have further migrated and enriched on the basis of the original high uranium content source layer(s), providing important evidence for delineating prospective mineral exploration areas.

5.3.3. The Radioactive Parameter Characteristics in Area C

Area C is mainly located in the outcrop area of Middle Jurassic quartz diorite (ηoJ2), with developed faults on the southern margin, transitioning from a northwest–southeast direction to a northeast–southwest distribution. The uranium content image (Figure 4c) shows a low background field, with an average of 3.85 ppm, slightly lower than the overall average of 3.87 ppm in the study area. Through weak information extraction (Figure 8), we found that the ancient uranium content (Gu) differs slightly from the present uranium content, showing lower intermediate ancient uranium content, while the southern and eastern edges exhibit characteristics of moderately high to high ancient uranium content, with an average of 4.33 ppm, higher than the present uranium content. The activated uranium migration amount (Fu) exhibits a region in the middle with lower ancient uranium content, indicating the migration of uranium elements into this area, while areas with higher or high ancient uranium content exhibit significant negative values, suggesting a clear phenomenon of uranium element migration away from these areas. The uranium abundance index (UA) appears as a higher field in the southwest, where magmatic activity is more intense, indicating possible hydrothermal alteration. The uranium migration enrichment factor (Uc) mainly features a moderate background field, with no clear evidence of significant superimposed enrichment of uranium elements after rock formation.

5.3.4. The Radioactive Parameter Characteristics in Area D

Area D refers to the Middle Triassic monzogranite outcrop region in the southern part of the study area (ηγT3). The uranium content (Figure 4c) is predominantly at background levels, with some local areas showing slightly higher concentrations, with an average of 4.47 ppm, slightly higher than the regional average of 3.87 ppm. Through weak signal extraction (Figure 8), the ancient uranium content (Gu) in this area generally shows a higher to high field zone, with an average content of approximately 4.29 ppm, slightly lower than the current average uranium content. The activated uranium migration amount (Fu) ranges from −5.02 to 10.07 ppm, with an average migration amount of about 0.18 ppm, indicating that there has been some uranium migration into the area after rock formation, though the amount is relatively small. The uranium migration enrichment factor (Uc) is similar to the current uranium content profile, mainly showing background levels with some local areas of higher concentration. The above results indicate that, based on the original uranium source, uranium migration and enrichment due to geochemical processes occur primarily within the rock body, with only minor noticeable enrichment.

5.3.5. The Radioactive Parameter Characteristics in Area E

Area E is located in the southeast corner of the study area, where the Silurian Daguiping Formation and the Meiziya Formation are interlayered (S1d-m), with mainly dark gray-to-black metamorphic rocks. The uranium content, as depicted in the image (Figure 4c), is characterized by predominantly high-to-very high values, with the high-value areas aligning closely with the geological strike, exhibiting a northwest orientation and an average content of approximately 3.84 ppm. The maximum value can reach 13.38 ppm, which is slightly lower than the average value of the entire study area but more than twice the crustal abundance value. After weak signal extraction (Figure 8), the ancient uranium content (Gu) in this area shows some differences compared to the current uranium content. The high-value areas of ancient uranium content are mainly concentrated in the central and northern parts of Area E and align well with the geological strike, whereas the southern edge appears as a background field. The average ancient uranium content is approximately 4.70 ppm, higher than the current uranium content. The distribution pattern of activated uranium migration (Fu) is similar to the current uranium content, with the distinction that the Silurian strata in the southern exposure area show a negative activated uranium migration amount, ranging from −6.98 to 9.27 ppm, with an average of about −0.86 ppm, indicating uranium element depletion and outward migration within the area. The uranium abundance index (UA) image has a similar overall pattern to the activated uranium migration amount (Fu), with high-value strip-like features in the central and southern parts, possibly related to fault contacts between strata, both of which have experienced hydrothermal alteration, favoring uranium mineralization. The uranium migration enrichment factor (Uc) has a similar overall pattern to the current uranium content, predominantly exhibiting high to very high values along the northwest orientation following the geological strike. The above results indicate that, based on the original uranium source layer, uranium elements have further migrated and formed superimposed post-enrichment through different geochemical processes, providing important evidence for delineating prospective areas for exploration.

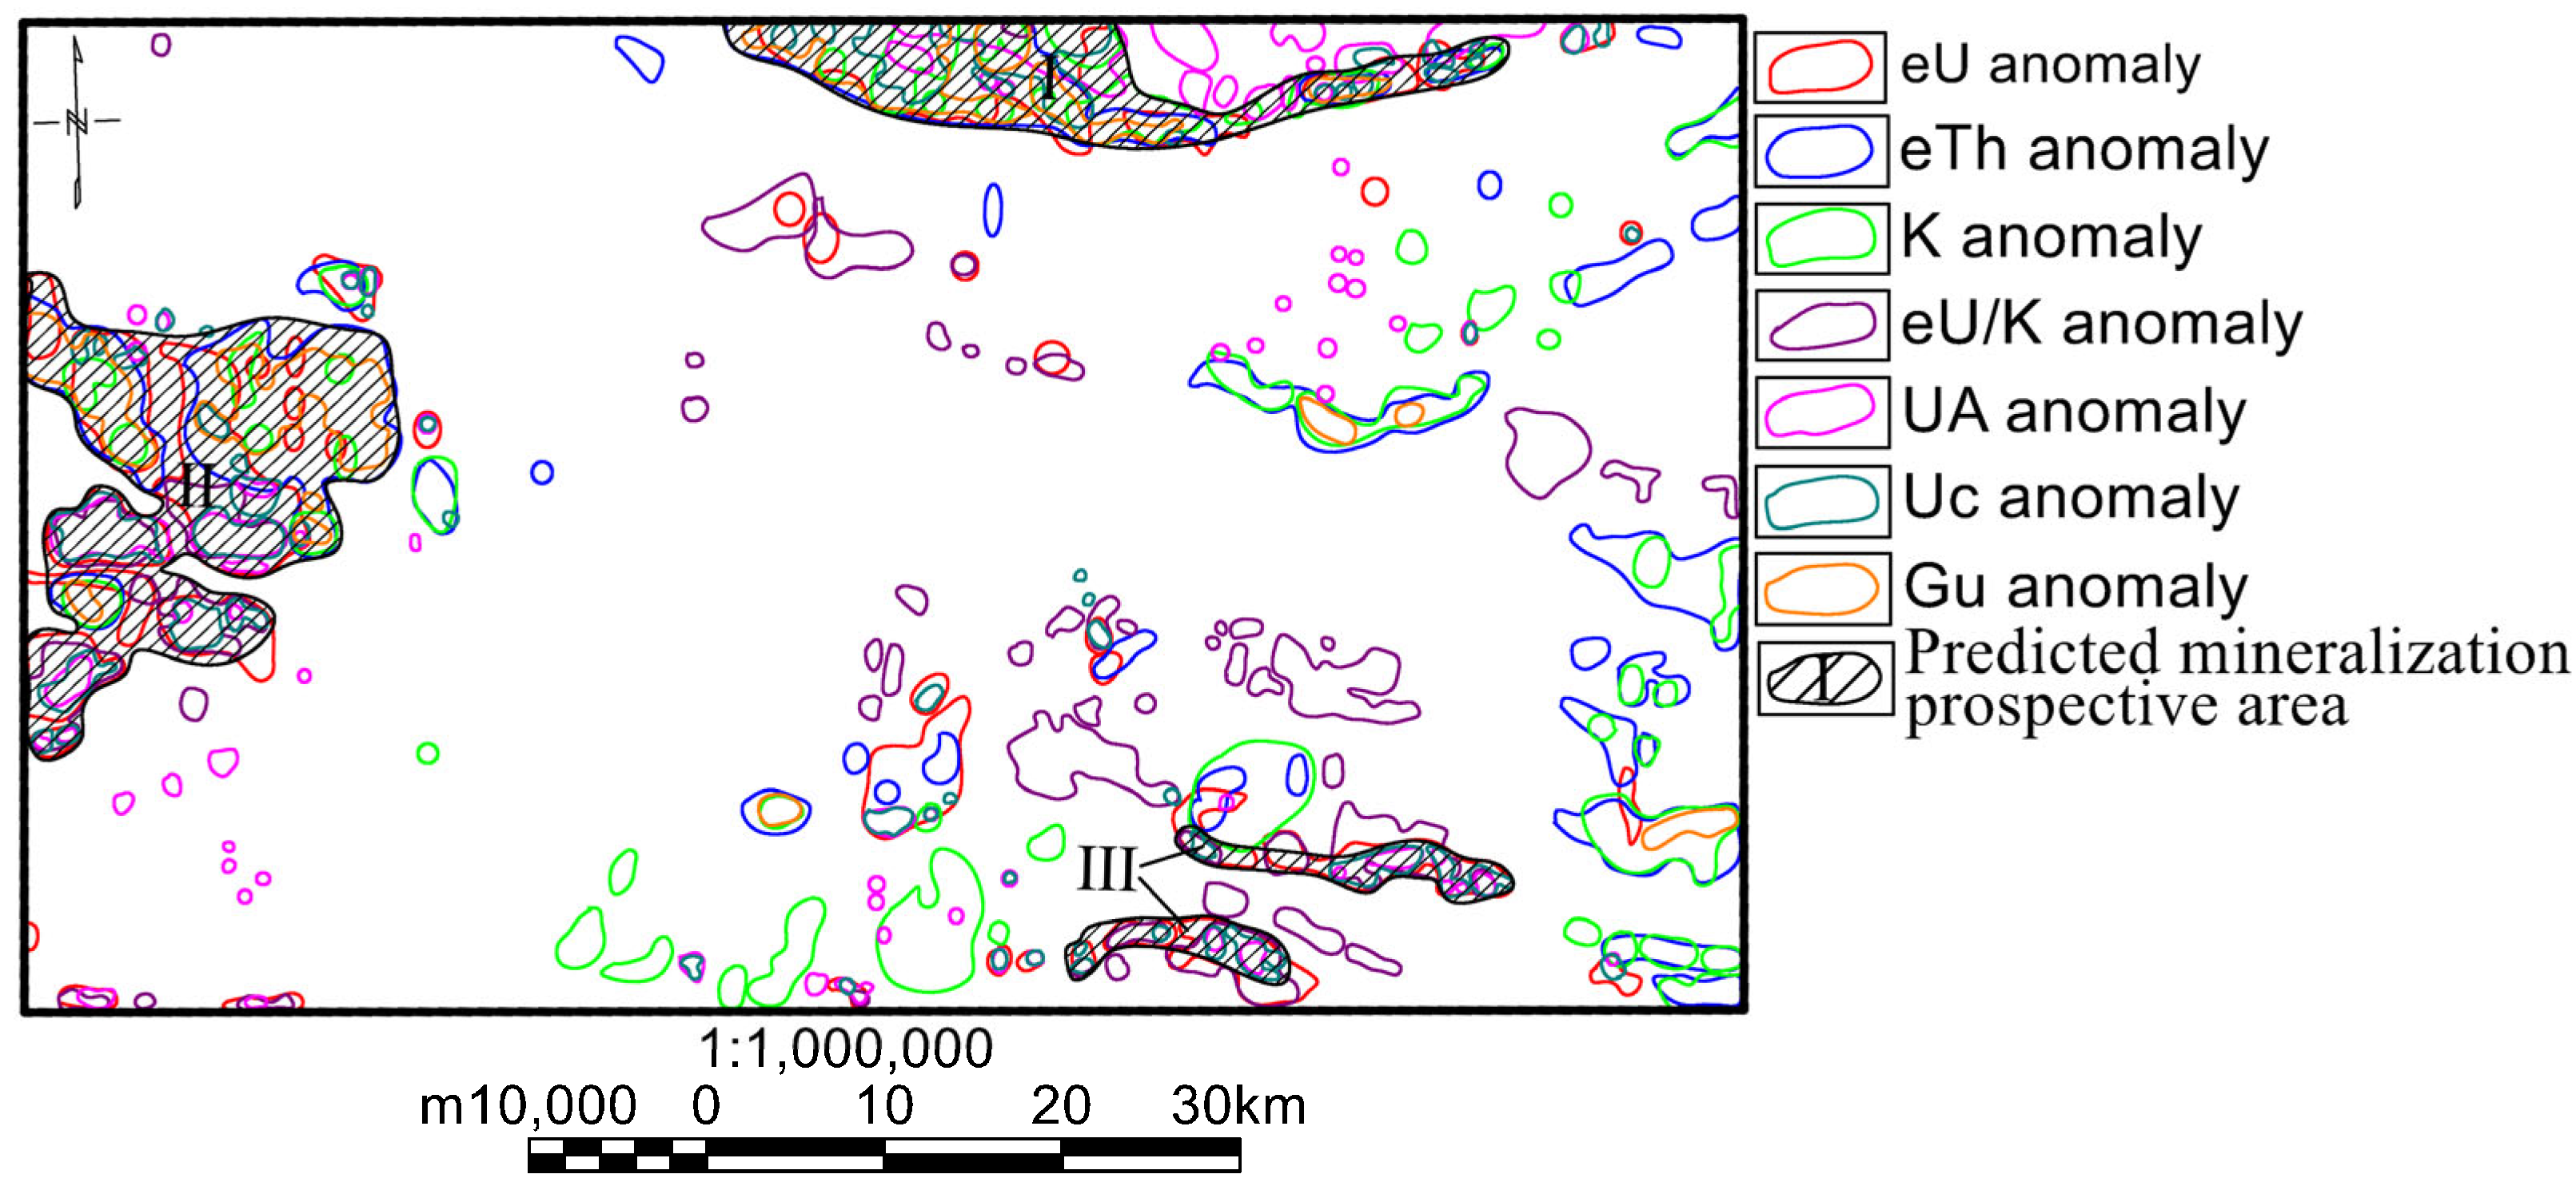
5.4. Prediction of Uranium Mineralization Prospective Area

Based on the above analysis of ore-forming conditions, high-value anomalies in uranium content (>9.77 ppm), thorium content (>13.56 ppm), potassium content (>2.57%), and uranium–potassium ratio (>7.41 × 10⁻⁴), along with high-value anomalies in the uranium abundance coefficient (>1.88 ppm) and uranium migration enrichment coefficient (>114.94 ppm) identified through weak information enhancement extraction, located within zones of positive uranium migration (i.e., late uranium migration zones), were delineated. The exclusion criteria included water bodies, Quaternary zones, and altitudes exceeding 180 m. High-value anomalies were selected based on three times the standard deviation above the regional mean. Based on the selected anomalies from airborne gamma-ray spectrometry parameters, areas with the richest comprehensive anomaly information were circumscribed as prospective mineralization zones, with a total of three prospective zones (Zones I to III) being identified within the study area, as detailed in Figure 9.

6. Conclusions

From the results presented above, the following conclusions were drawn:
  • By utilizing the geochemical properties and geochemical activity characteristics of the radioactive elements uranium, thorium, and potassium, a mathematical model based on multi-element combination parameters was developed in addition to the traditional analysis of uranium content, thorium content, potassium content, total count, and basic ratio parameters from airborne gamma-ray spectrometry data. This model aids in elucidating the geological significance represented by these parameters and enhances the extraction of subtle information from the data. It enables the rapid assessment of uranium mineralization conditions, the prediction of prospective mineralization zones, and the analysis of uranium abundance, uranium source layers (bodies), uranium element activation and migration patterns, and uranium migration enrichment levels within the study area. This approach demonstrates practical value in evaluating uranium mineralization conditions and predicting prospective mineralization zones.
  • Prospective uranium areas exhibit elevated uranium, potassium, and thorium contents, characterized by a high uranium–potassium ratio. Following the enhancement and extraction of subtle information, these areas or their vicinity display high paleo-uranium values (Gu), indicating the presence of uranium source layers (bodies). The overall activated uranium migration amount (Fu) is predominantly positive, signifying uranium influx after rock formation. The increase in potassium and uranium content is significantly greater than that of thorium content, leading to a notable rise in the uranium abundance index (UA), indicative of possible hydrothermal alteration in the area. The uranium migration enrichment factor (Uc) also exhibits high values, suggesting that uranium elements have migrated and accumulated on top of existing high-uranium source layers through geochemical processes. These high-value anomalies of elements serve as crucial indicators for predicting prospective uranium mineralization zones, with richer indicator information indicating more favorable uranium mineralization conditions.
  • By combining geological data from the study area with the overall characteristics of airborne gamma-ray spectrometry total count and uranium, potassium and thorium content, in addition to the characteristics of ratio parameters between elements, a detailed analysis was conducted. Following a comprehensive explanation of the multi-element combination parameters in key areas, favorable uranium mineralization anomalies from airborne gamma-ray spectrometry data were identified. Three prospective uranium mineralization zones were predicted, characterized by superior mineralization geological conditions, rich airborne gamma-ray spectrometry anomaly information, and promising mineral exploration potential within the area.

Author Contributions

Conceptualization, Y.X., J.L. and S.W.; methodology, Y.X.; validation, F.L., N.L. and G.L.; investigation, N.Q.; writing—original draft preparation, Y.X.; writing—review and editing, G.L. and Y.L.; supervision, all participants. All authors have read and agreed to the published version of the manuscript.

Funding

This research was funded by the Public Welfare Geological Survey Project (grant Nos. DD20230245 and DD20190552), the National Key Research and Development Program (grant No. 2017YFC0602004), and the Guizhou Provincial Basic Research Program (Natural Science) (grant No. QKHJC-ZK[2023]G194).

Data Availability Statement

Owing to legal and institutional restrictions, the original data cannot be provided.

Acknowledgments

We thank Zhiqiang Cui for many insightful discussions. We also appreciate the contributions of Hongshan Zheng and Junjie Liu during the field data collection process, particularly in ensuring data quality and instrument reliability.

Conflicts of Interest

The authors declare no conflict of interest.

References

  1. Yang, H.; Zhao, T.Y.; Li, S.J.; Jia, Z.Y.; Jin, J.Q.; Liang, X.J. Anomaly characteristics of airborne gamma- ray spectrometric survey and uranium prospecting direction in Huayangchuan, Qinling. Geol. China 2019, 46, 651–661. [Google Scholar]
  2. Qin, M.K.; Li, Z.Y.; Cai, Y.Q.; Guo, Q.; Song, J.Y.; Liu, Z.Y.; Huang, S.H. Strategic Thinking on Strengthening Three New Breakthroughs for the Uranium Exploration in China. World Nucl. Geosci. 2022, 39, 383–389. [Google Scholar]
  3. Qin, M.K.; Li, Z.Y.; Liu, Z.Y.; Huang, S.H.; Cai, Y.Q.; Liu, Y.; Ye, F.W.; Li, H.Y.; Ge, X.K.; Zhang, J.L.; et al. Significant Progresses and Prospects in the Science and Technology Innovation of Uranium Geology in China Since 2000. Uranium Geol. 2024, 40, 189–203. [Google Scholar]
  4. Yang, L.Q.; Zhao, D.; Liu, J.F.; Li, B.H. Research on the Extraction Technology of Aero Radioactive Information for Uranium Exploration. Uranium Geol. 2024, 40, 352–358. [Google Scholar]
  5. Raghuwanshi, S.S. Airborne gamma-ray spectrometry in uranium exploration. Adv. Space Res. 1992, 12, 77–86. [Google Scholar] [CrossRef]
  6. Abd El Nabi, H.S. Evaluation of airborne gamma-ray spectrometric data for the Missikat uranium deposit, Eastern Desert, Egypt. Appl. Radiat. Isot. 2001, 54, 497–507. [Google Scholar] [CrossRef]
  7. Winkelmann, I.; Thomas, M.; Vogl, K. Aerial measurements on uranium ore mining, milling and processing areas in Germany. J. Environ. Radioact. 2001, 53, 301–311. [Google Scholar] [CrossRef]
  8. Asfahani, J.; Al-Hent, R.; Aissa, M. Aerial gamma spectrometric survey as a tool for evaluating the uranium remobilization degree: Case study from Al-Awabed area, Northern Palmyrides, Syria. Appl. Radiat. Isot. 2008, 66, 1262–1274. [Google Scholar] [CrossRef]
  9. Asfahani, J.; Al-Hent, R.; Aissa, M. Radioactive and geological analysis of airborne gammas pectrometric data for locating favorable traps for uranium prospecting in the Syrian desert (Area-1), Syria. Appl. Radiat. Isot. 2012, 70, 2317–2327. [Google Scholar] [CrossRef]
  10. Ke, D.; Han, S.Y.; Hou, H.Q.; Zhao, D. Aero-radioactive information extraction and integration for the exploration of granite-type uranium deposits. Uranium Geol. 2009, 25, 349–354. [Google Scholar]
  11. Hu, M.K.; Cai, G.Q.; Shen, Z.X.; Li, B.H. Prognoses of prospective areas for uranium metallogenesis with full-spectrum information of airborne gamma-ray survey. Prog. Rep. China Nucl. Sci. Technol. 2009, 1, 160–163. [Google Scholar]
  12. Che, Y.F.; Zhang, Y.L.; Zhao, Y.J.; Lin, Z.Y. Application of airborne spectrometry data to the exploration of calcrete-hosted uranium deposit in Yilgarn Area Western Australia. Uranium Geol. 2015, 31, 44–51. [Google Scholar]
  13. Hafeez, T.H.A.; Youssef, M.A.S.; Waheed, H. Mohamed. Utilization of airborne gamma ray spectrometric data for geological mapping and radioactive mineral exploration of Gabel Umm Tineidba area, south eastern desert, Egypt. World J. Eng. 2015, 12, 149–160. [Google Scholar] [CrossRef]
  14. Maacha, L.; Jaffal, M.; Jarni, A.; Kchikach, A.; Mouguina, E.M.; Zouhair, M.; Ennaciri, A.; Saddiqi, O. A contribution of airborne magnetic, gamma ray spectrometric data in understanding the structure of the Central Jebilet Hercynian massif and implications for mining. J. Afr. Earth Sci. 2017, 134, 389–403. [Google Scholar] [CrossRef]
  15. Srinivas, D.; Babu, V.R.; Patra, I.; Tripathi, S.; Ramayya, M.S.; Chaturvedi, A.K. Assessment of background gamma radiation levels using airborne gamma ray spectrometer data over uranium deposits, Cuddapah Basin, India e A comparative study of dose rates estimated by AGRS and PGRS. J. Environ. Radioact. 2017, 167, 1–12. [Google Scholar] [CrossRef]
  16. Elkhadragy, A.A.; Ismail, A.A.; Eltarras, M.M.; Azzazy, A.A. Utilization of airborne gamma ray spectrometric data for radioactive mineral exploration of G.Abu Had—G.Umm Qaraf area, South Eastern Desert, Egypt. Nriag J. Astron. Geophys. 2017, 6, 148–161. [Google Scholar] [CrossRef]
  17. Youssef, M.A.S.; Sabra, M.E.M.; Abdeldayem, A.L.; Masoud, A.A.; Mansour, S.A. Uranium migration and favourable sites of potential radioelement concentrations in Gabal Umm Hammad area, Central Eastern Desert, Egypt. NRIAG J. Astron. Geophys. 2017, 6, 368–378. [Google Scholar] [CrossRef]
  18. Bedini, E.; Rasmussen, T.M. Use of airborne hyperspectral and gamma-ray spectroscopy data for mineral exploration at the Sarfartoq carbonatite complex, southern West Greenland. Geosci. J. 2018, 22, 641–651. [Google Scholar] [CrossRef]
  19. Li, H.Y.; Jiang, M.Z.; Chen, G.S.; Quan, X.D.; Chang, S.S. The brilliant achievements and technological innovation of airborne radioactivity survey in China. Geophys. Geochem. Explor. 2018, 42, 645–652. [Google Scholar]
  20. Ismael, M.I.; El-Husseiny, A.A.; Othman, A.A. Structural and mineral exploration study at the transition zone between the North and the Central Eastern Desert, Egypt, using airborne magnetic and gamma-ray spectrometric data. Geocarto Int. 2022, 37, 13098–13126. [Google Scholar]
  21. Mamouch, Y.; Attou, A.; Miftah, A.; Ouchchen, M.; Dadi, B.; Achkouch, L.; Et-tayea, Y.; Allaoui, A.; Boualoul, M.; Randazzo, G.; et al. Mapping of Hydrothermal Alteration Zones in the Kelâat M’Gouna Region Using Airborne Gamma-Ray Spectrometry and Remote Sensing Data: Mining Implications (Eastern Anti-Atlas, Morocco). Appl. Sci. 2022, 12, 957. [Google Scholar] [CrossRef]
  22. Tarshan, A. Detection of Uranium Anomalies and Alteration Zones Using Airborne Gamma-Ray Spectrometry at Gabal Attala and Its Surrounding Area, Eastern Desert, Egypt. Earth Sci. 2022, 11, 121–129. [Google Scholar] [CrossRef]
  23. Jiang, Z.; Han, X.Z.; Lin, Z.Y.; Hu, H.; Lai, Q.; Gu, Y.; Wu, Z.J.; Zhao, X. Large-Scale Aerial Gamma Spectroscopy for Exploring Sandstone-type Uranium Deposits: A Case Study of Gexi Area, Inner Mongolia. Appl. Geophys. 2023, 20, 1–12. [Google Scholar] [CrossRef]
  24. Yu, B.C. The development of airborne radiometric survey in China. Uranium Geol. 1990, 6, 99–119. [Google Scholar]
  25. Zhao, X.G.; Wu, H.N.; Yang, J.J.; Zhang, Y.Y.; Zhao, C.P.; Bai, G.J.; Wang, J.H. Geological significance of weak information enhancement of airborne gamma energy spectral data for sandstone type uranium deposits. Geol. China 2007, 34, 478–485. [Google Scholar]
  26. Hou, H.Q.; Han, S.Y.; Ke, D. Application study of methods and techniques for weak information extraction of sandstone-hosted uranium deposits. Geol. Bull. China 2015, 34, 1344–1349. [Google Scholar]
  27. Zhang, E.; Duan, M.; Lu, H.X.; Feng, B.; Cao, Q.Y.; Yang, Y.C. Application of airborne gamma energy spectral data to uranium metallogenic prognosis in Zhalantun area. Contrib. Geol. Miner. Resour. Res. 2019, 34, 601–607. [Google Scholar]
  28. Wang, Y.Z.; Li, B.H.; Zhang, J.W.; Feng, C.Y.; Shan, Y.; Cao, Q.Y. Airborne radioactivity data processing and application in the potential evaluation of uranium resource in China. Uranium Geol. 2012, 28, 361–369. [Google Scholar]
  29. Feng, B.; Zhang, E.; Cheng, X.; Lu, H.X.; Fan, F. Application of airborne gamma energy spectral data to uranium metallogenic prognosis in Baiyintaohai area. Prog. Rep. China Nucl. Sci. Technol. 2019, 6, 526–533. [Google Scholar]
  30. Zhang, G.W.; Zhang, B.R.; Yuan, X.C.; Xiao, Q.H. Qinling Orogenic Belt and Continental Dynamics; Science Press: Beijing, China, 2001; pp. 117–154. [Google Scholar]
  31. Shanxi Institute of Geological Survey. 1:250000 Regional Geological Survey Report of Zhen’an; Shanxi Institute of Geological Survey: Xi’an, China, 2003; pp. 13–211. [Google Scholar]
  32. Pang, J.F.; Ding, X.Z.; Han, K.Y.; Zeng, Y.; Chen, A.S.; Zhang, Y.L.; Zhang, Q.H.; Yao, D.S. The national 1:1000000 geological map spatial database. Geol. China 2017, 44 (Suppl. S1), 8–18. [Google Scholar]
  33. Tu, W.C.; Song, C.Z.; Ren, S.L.; Li, J.H.; Zhang, H.; Zhang, Y.; Wang, Z. An analysis of tectonic deformation and forming environment of Shang-Dan fault zone, Qinling. J. Hefei Univ. Technol. 2012, 35, 820–827. [Google Scholar]
  34. State Administration of Science, Technology and Industry for National Defence (SASTIND). Specification for Airborne Gamma-Ray Spectrometry Survey; State Administration of Science, Technology and Industry for National Defence (SASTIND): Beijing, China, 2018. [Google Scholar]
  35. Xin, F.C.; Xin, L.; Li, Z.D. Gamma energy spectrum ratio parameters: Geologic implication and application in searching of hidden gold deposit. Geol. Resour. 2007, 16, 306–310. [Google Scholar]
  36. Wang, M.J.; Zhang, W.B.; Ou, J.F.; Wang, S.T.; Xiong, S.Q.; Fan, Z.G. Explanation of Aerial Geophysical Exploration Methods and Applications; Geology Press: Beijing, China, 1992; pp. 66–100. [Google Scholar]
  37. Wang, J.F. The Course of Uranium Geochemistry; Atom Energy Press: Beijing, China, 1986; pp. 1–572. [Google Scholar]
  38. Zhang, S.Y.; Fan, Y.R.; Li, H.Y. Karst carbonate reservoir division and contrast based on natural gamma ray spectrometry logging in Tahe Oilfield. J. China Univ. Pet. 2006, 30, 35–41. [Google Scholar]
  39. Yang, X.F.; Lin, C.S.; Yang, H.J.; Peng, L.; Liu, J.Y.; Xiao, T.J.; Tong, J.Y.; Wang, H.P.; Li, H.P. Application of natural gamma ray spectrometry in analysis of Late Ordovician carbonate sequence stratigraphic analysis in middle Tarim Basin. Oil Geophys. Prospect. 2010, 45, 384–391. [Google Scholar]
  40. Zhang, Y.Y.; Zhao, C.P. Study and application on gamma energy spectrum data in Erlian basin, Inner Mongolia. Uranium Geol. Northwest China 1998, 1, 38–42. [Google Scholar]
Figure 1. Division of tectonic units in Qinling Orogenic Belt.
Minerals 15 00492 g001
Figure 2. Geologic map of study area.
Minerals 15 00492 g002
Figure 3. A schematic diagram of the survey network layout in the study area.
Minerals 15 00492 g003
Figure 4. An airborne gamma-ray image map of the elemental content of gamma-rays in the study area. (a) TC; (b) eTh; (c) eU; (d) K.
Minerals 15 00492 g004
Figure 5. An image map of the eTh/K ratio in the study area.
Minerals 15 00492 g005
Figure 6. An image map of the eTh/eU ratio in the study area.
Minerals 15 00492 g006
Figure 7. An image map of the eU/K ratio in the study area.
Minerals 15 00492 g007
Figure 8. Image map of weak information enhancement of multi-element combination parameters in study area’s airborne radiometric data. (a) Gu; (b) Fu; (c) UA; (d) Uc. The white dashed line represents the range of abnormal areas, and the letters A–E indicate the five abnormal area numbers.
Minerals 15 00492 g008
Figure 9. Delineation of multi-parameter anomalies in airborne gamma-ray spectrometry and prediction map of prospective uranium ore-forming areas.
Minerals 15 00492 g009
Table 1. Multi-element combination parameter model and geological significance of airborne gamma-ray spectrometry.
Method TypeParametersMathematical ModelGeological Significance
Single-elementUranium content
Potassium content
Thorium content
e U K e T h Studying the regional distribution patterns and trends of various elements and comparing differences in elemental contents to obtain valuable geological prospecting information.
Single-element ratiosUranium–thorium ratio
Uranium–potassium ratio
Thorium–potassium ratio
e T h / e U e U / K e T h / K In special circumstances, elements may be relatively enriched or depleted, with U separating from Th and K through precipitation. Therefore, changes in ratios can indicate processes such as weathering, depositional environments, mineralization, and other specific geological actions.
Multi-
element combination parameters
Paleo-uranium content (Gu) e T h / ( e T h ¯ / e U ¯ ) Using the relative stability of thorium elements, high-value zones indicate the uranium source layer (body) under the element’s state.
Activated uranium migration amount (Fu) e U G u Utilizing the difference between measured uranium and “paleo-uranium” to quantify the activation migration of uranium elements in the later stages of diagenesis. Evaluating the leaching or superimposed enrichment of uranium elements in the study area based on the average value or trend of Fu within the region to understand the differences and numerical changes between paleo-uranium and present-day measured uranium. Assessing the activation migration amount of uranium in the region.
Uranium abundance index (UA) e U · K / e T h Also known as the F-parameter, the alteration degree of rocks in hydrothermal uranium exploration plays a significant indicative role. By normalizing uranium and thorium to potassium elements, it can highlight the low-to-medium temperature potassic alteration zones. A higher value indicates a stronger degree of rock alteration. Additionally, it is important to understand the original abundance level and superimposed enrichment status of uranium.
Uranium migration enrichment factor (Uc) e U 3 / e T h · K The migration and enrichment of uranium under geochemical processes in the search for prospective areas.
Note: e T h ¯ and e U ¯ represent the average thorium content and average uranium content in the study area.
Disclaimer/Publisher’s Note: The statements, opinions and data contained in all publications are solely those of the individual author(s) and contributor(s) and not of MDPI and/or the editor(s). MDPI and/or the editor(s) disclaim responsibility for any injury to people or property resulting from any ideas, methods, instructions or products referred to in the content.

