Abstract
Fly ash is produced in thermoelectric power plants and is commonly used in the construction industry due to its pozzolanic properties. This study investigates the relationship between the chemical composition and the radioactive content of fly ash (FA) from 10 different samples and bottom ash (BA) from one of these samples. The results indicate a significant correlation between the chemical composition of FA and its content of natural radionuclides from the uranium and thorium series, along with . The oxides , , and exhibited a greater influence compared to and in relation to the radioactive content of FA. Furthermore, the presence of and showed an inverse relationship with the content of natural radionuclides from the uranium series. On the other hand, the radionuclides of the thorium series were associated with the presence of the oxides and . FA and BA exhibited significant differences in their composition, with higher activity concentrations in BA than in FA, except for and . The most critical estimated annual effective dose for workers was , indicating no significant radiological risk for workers.
1. Introduction
Fly ash (FA) is a by-product generated during coal combustion in thermal power plants. This ash forms when the minerals present in coal (silica, alumina, and various metal oxides) melt at furnace temperatures typically ranging between 1200–1700 °C [1]. The morphology of FA particles includes cenospheres (spherical and hollow) and is also characterized by high surface porosity [2]. These particles are carried by the various combustion gases and retained in systems composed of electrostatic precipitators or bag filters to prevent their release into the atmosphere [3]. The particle diameter range varies between 1 and 100 µm [4,5]. The fineness of fly ash particles plays a crucial role in their reactivity and performance in concrete applications. Recent studies have shown that a smaller fly ash particle size is related to their ability to mitigate the alkali–silica reaction (ASR). Thus, the presence of finer particles provides a greater surface area for reactions and a better filling effect in the concrete matrix [6]. Shehata and Thomas [7] demonstrated that both the chemical composition and particle size distribution of fly ash play a determining role in their effectiveness to control ASR expansion in concrete. The ash separated by electrostatic precipitators represents the finest fraction, accounting for 10%–20% [8]. On the other hand, particles with diameters greater than 50 form part of bottom ash (BA), which can even reach diameters of up to 200 µm [9]. The main difference between FA and BA lies in their chemical composition, as FA has a higher content of and alumina (), whereas BA contains more and due to the incomplete fusion and gravitational segregation of heavy minerals during combustion [10]. The major oxides in FA are (35%–70%), (10%–30%), (1%–15%), and (1%–40%), whose proportion varies depending on the type of coal [11]. Therefore, FA are commonly used as supplementary cementitious materials in cements and geopolymers due to their high reactivity. Fly ash is classified as type C and F based on its content and amorphous content [12]. Venkatanarayanan and Rangaraju [13] conducted research to differentiate the effects of chemical composition and fineness of fly ash in ASR mitigation. These authors found that although chemical composition is important (especially regarding CaO content), fineness contributes independently to ASR mitigation through increased pozzolanic reactivity and the reduction of pore solution alkalinity. This correlation between fineness and ASR mitigation has been confirmed in other studies, such as those conducted by Ramjan et al. [6], who demonstrated that reducing fly ash fineness can significantly decrease ASR expansion through chemical and physical mechanisms. Type C ash contains a percentage greater than 20% and meets the criterion that is less than 50%. The common uses of FA in construction materials are as follows: (i) the formation of geopolymers and sustainable concretes along with ground granulated blast furnace slag (GGBS) [14], (ii) stabilization of clayey or expansive soils in foundations [15], also combined with GGBS in high-moisture soils [16], (iii) formation of compressed earth blocks [17], (iv) fabrication of geopolymeric pastes for 3D printing [18], and (v) replacement of cement in conventional concretes, enhancing workability while maintaining mechanical properties [16]. Furthermore, Aydın et al. [19] investigated how the grinding process affects both mechanical properties and ASR resistance in cement mortars manufactured with fly ash. The main findings of this study revealed that grinding fly ash to achieve greater particle fineness significantly improves its ability to prevent ASR-induced expansion, while simultaneously improving compressive strength and other mechanical properties. Recent research by Eker et al. [20] has emphasized that high-calcium fly ash (Class C) at different fineness levels can significantly improve concrete durability properties, particularly in terms of ASR resistance. These studies highlight the joint importance of considering not only the percentage of cement replacement with fly ash but also its fineness to optimize concrete durability against expansive reactions. For all these reasons, FA are used in the construction industry, providing significant benefits within the recycling framework of a circular economy [21].
The presence of natural radionuclides in fly ash is directly related to the type of coal used in the furnace of the thermoelectric power plant. Lignite or sub-bituminous coals exhibit a higher uranium (U) content due to the increased presence of organic matter in their composition, formed in reducing environments that favor higher U adsorption [22,23]. On the other hand, coals composed of anthracites have a higher thorium (Th) content due to their association with minerals, such as monazite or zircon [24,25]. Results obtained in a previous study [26] showed an association between , , and with , potentially due to the presence of calcium silicates. However, it was considered necessary to conduct further studies to confirm these findings. Additionally, different existing studies on the relationship between chemical composition and radioactive content in ashes generated by thermoelectric power plants show that the activity concentration of radionuclides varies significantly between FA and BA. This variation depends on the type of coal burned and the combustion process [27,28]. Likewise, radionuclide concentrations in the ashes (FA and BA) can be up to ten times lower than in the original coal, reflecting the complex redistribution processes during combustion [28]. FAs generally exhibit higher activity concentrations than BAs, as FAs have a greater retention capacity due to their smaller particle size and chemical composition compared to BAs [9,29,30,31]. The present study provides new results on the radiological content of FAs, as well as examining the variation between chemical composition and the content of natural radionuclides, in addition to assessing the potential radiological risk associated with the handling and reuse of these residues [9,31,32]. Therefore, this study investigates these two aspects and utilizes new computational methods based on neural networks to identify which oxides significantly influence the radioactive content of radionuclides associated with the natural radioactive series of thorium and uranium, along with .
Based on all the aforementioned, our working hypothesis was that the chemical composition is related to the activity concentrations of natural radionuclides; however, the high heterogeneity of the FA due to the different burned coals makes it complex to seek an analytical relationship that connects both magnitudes. Moreover, the annual effective dose of these ashes does not pose a radiological risk to workers. For this reason, 10 ashes from different Spanish thermoelectric power plants were selected, and their chemical and radiological characterization was carried out. The percentage of thermoelectric energy accounted for 1.1% of electricity generation in Spain during 2024, due to the energy transition underway in the country. For this reason, the availability of coal ash has become increasingly limited. This study includes 10 fly ash samples and one bottom ash sample, representing 100% of the coal-fired power plants in operation in Spain during the sampling period (2024–2025), ensuring geographic representativeness across two autonomous communities (Andalusia and Aragon). The decline in global coal demand (−7.3% CAGR 2020–2025, [33]) and Spain’s accelerated phase-out schedule (complete decommissioning by 2025) make this sampling representative of the characteristics of coal ash in Spain. The FA and BA ashes from one of the plants were used to compare the radiological content and the percentage of oxides. The partial objectives of this study were as follows: (i) to group and seek correlations among the different FAs analyzed using gamma spectrometry and X-ray fluorescence and to obtain the contribution of the different oxides in relation to the various radionuclides studied, (ii) to compare the chemical composition and radioactive content of an FA and BA obtained from the same thermoelectric plant, and (iii) to estimate the annual effective dose of this type of material for workers exposed to such residues.
2. Materials, Equipment, and Methods
2.1. Materials
The materials tested were 10 fly ashes (FAs) and one bottom ash (BA) from different Spanish thermal power plants. The samples were dried at 105 °C, sieved to 200 μm, and placed in cylindrical containers with a diameter of 76 mm and a height of 30 mm. The containers were hermetically sealed using parafilm and taped around the cylindrical container to prevent losses. The containers were left to rest for 21 days to allow 226Ra to reach secular equilibrium with its short-lived gamma-emitting progeny: 214Pb and 214Bi.
2.2. Equipment
2.2.1. X-Ray Fluorescence
The chemical composition of the tested materials was determined by XRF with a Bruker S8 Tiger 4 kW model (Karlsruhe, Germany). Loss on ignition (LOI) and chloride ion contents were determined according to the European standard EN 196-2 [34]. The analysis was performed on an aliquot of each of the 10 FAs and the BA analyzed.
2.2.2. Gamma Spectrometry
Gamma spectrometry was performed by measuring the samples using four HPGe detectors (Mirion-Canberra, Meriden, CT, USA). The detectors were as follows: two XtRA type and two BeGE. The electronics associated with each detector consisted of a DSA-LX module that integrates a high voltage source, an amplifier, an analog-to-digital converter, an electronic peak stabilizer, and communication with the personal computer. Figure 1 shows the different parts of the measurement system along with the measurement geometry. The detectors were characterized by Mirion-Canberra (Meriden, CT, USA) for the use of LabSOCS (Mirion-Canberra, Meriden, CT, USA), which allows calculating the counting efficiency based on the sample dimensions and the chemical composition of the sample matrix [35].
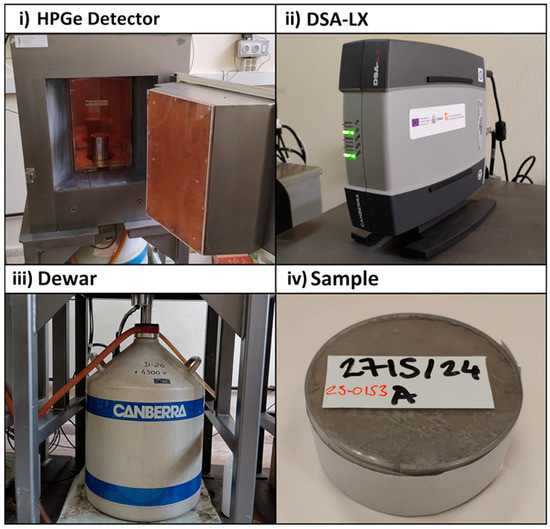
Figure 1.
Diagram of the gamma spectrometry equipment: (i) HPGe germanium detector with passive lead shielding and Cu and Zn layers to attenuate Pb X-rays, (ii) DSA-LX, (iii) dewar containing to cool the detector, and (iv) cylindrical container for measuring the samples.
The spectra were acquired and analyzed using the Genie 2000 software by Mirion-Canberra [36]. The activity concentration of was determined both directly through the 186 keV photopeak and indirectly through its short-lived progeny and . The interference caused by in the 186 keV photopeak of was corrected using the algorithm developed by Suárez-Navarro et al. [37]. Likewise, the interference of in the 1460 keV photopeak of was also corrected using the same algorithm. The coincidence summing effect was corrected using Genie 2000′s Peak-To-Total algorithm, which employs the total efficiency curve as a function of the energy generated by Mirion-Canberra during the detector characterization [38]. The uncertainties associated with the activity concentration were calculated using the Genie 2000 software. Genie 2000 applies uncertainty propagation arising from the following: (i) the calculation of the photopeak area, (ii) background subtraction, (iii) counting efficiency of the geometry used, which is a combination of that provided by LabSOCS and that due to the efficiency curve fitting, (iv) nuclear parameters employed in the calculation (half-life and emission intensity), and (v) the aliquot of the sample. Table 1 displays the photopeaks used, along with their emission probabilities for the radionuclides of the uranium and thorium series, as well as . The sample counting time was 80,000 s, and the background counting time was 600,000 s. The samples were measured in duplicate, except for 2 samples for which insufficient material was available, and the available material was measured. The gamma spectrometry laboratory is accredited by ENAC (Spanish National Accreditation Body) [39].

Table 1.
Radionuclides and photopeaks used for determining the activity concentration of radionuclides belonging to the natural radioactive series of uranium and thorium, along with [40].
2.3. Statistical Methods Used
2.3.1. Principal Component Analysis
Principal Component Analysis (PCA) was used to identify correlations between the chemical composition obtained through X-ray fluorescence and the radionuclide content of natural radioactive series. PCA met the two necessary conditions for its application: the number of variables was smaller than the number of samples, and the Kaiser–Meyer–Olkin (KMO) index exceeded 0.7 [26]. PCA was performed using RStudio 2024.12.1 Build 563 software with the FactoMineR and factoextra libraries. The variables considered were those whose contribution to the two components was greater than , where is the number of variables selected in the PCA [41]. PCA results were represented using an HJ-Biplot graph to depict the scores of the different FA samples used in this study.
2.3.2. Comparison Between FA and BA
The statistical comparison between the FAs and BAs of one of the thermoelectric plants was conducted using the following: (i) the relative difference between FA and BA and (ii) the Student’s paired t-test or the Wilcoxon rank-sum test (depending on whether the distribution was normal). The percentage relative difference () was determined using Equation (1):
where FA and BA are the percentages of an oxide or the activity concentrations of a radionuclide for the FA or BA, and is the arithmetic mean of the oxide percentages or the activity concentration of a radionuclide for the FA and BA. Values greater than 0 indicate enrichment in favor of the FA, and negative values indicate enrichment with respect to the BA. The means were compared by first testing if the values followed a normal distribution using the Shapiro–Wilk test. The Student’s t-test was applied when the Shapiro-Wilk test result indicated normality, and the Wilcoxon rank-sum test was used when the data were not normal. The Student’s t-test was applied as a two-tailed test since the aim was to verify whether the means of the chemical composition and the activity concentrations of the natural radionuclides were statistically indistinguishable. The two tests used to compare the means of the FAs and BAs were conducted with a significance level of α = 0.05, so the null hypothesis was accepted when the p-value was higher than this level of significance.
2.4. Determination of the Weight of the Different Oxides
The determination of the weights of the different oxides was carried out using a neural network, whose design is shown in Figure 2. The neural network was designed with an input layer consisting of the oxide percentages obtained by XRF, considered as independent variables. The output layer was a neuron containing the activity concentration of each radionuclide considered. Therefore, different neural networks were prepared for each radionuclide, considering the same input layer in each of them. The possible collinearity between the input variables (percentages of oxides) and output variables (radionuclides) was corrected using the variance inflation factor (VIF), determined through the car library of RStudio 2024.12.1 Build 563. The neural network was designed using Python with the Keras libraries of TensorFlow, employing the Adam optimizer and a loss function based on the mean squared error (MSE) criterion using the Google Colab environment. The activation functions of the neurons in the hidden layer were RELU, while linear functions were used for the output neurons (Figure 2).
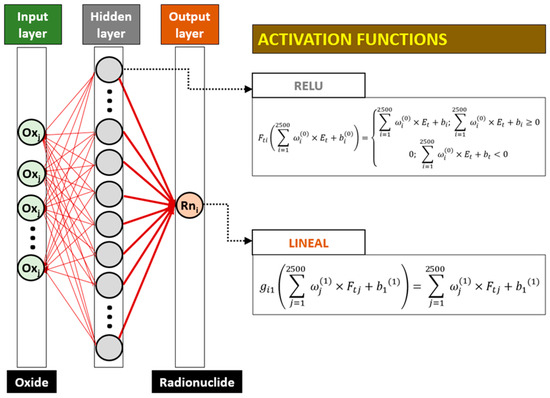
Figure 2.
Diagram of the neural network through which Garson’s algorithm was applied.
The neural network was optimized during the training process by minimizing the loss function , which is expressed using the mean squared error (MSE) according to Equation (2):
The minimization of the function was carried out through an iterative procedure known as gradient descent, as described by Equation (3):
For the case of the bias parameters, Equation (3) is rewritten as follows:
This training process aims to find the optimal values for both the synaptic weights and the biases of each of the neurons in the neural network. To achieve this, a dataset referred to as an epoch was used, which must have adequate homogeneity to facilitate the convergence of the algorithm. The dataset is divided into two subsets: 70% is used to train the neural network, and the remaining 30% is used to evaluate its performance. The weights are adjusted for each training epoch based on the samples processed, and the loss function is evaluated for both data subsets. Therefore, the model will exhibit structural overfitting when there is no significant divergence between the values of the loss function obtained for each group after each epoch. The convergence of the model and its generalization capability are evaluated by representing the evolution of the loss function over 1000 epochs throughout the training process.
The different neural networks were tested by observing their convergence during the training stage and verifying the estimated values using the Root Mean Square Error (RMSE) and Residual Standard Error (RSE). The RMSE evaluates the average magnitude of prediction errors (Equation (5)):
where n is the number of observations, is the observed value, and is the value predicted by the model. The RSE determines the variability of prediction errors (Equation (6)):
where is the standard deviation of the predicted error for observation i.
The weights of the independent variables (oxide percentages) were evaluated using Garson’s algorithm, which allowed for the identification of those oxides most closely related to the activity concentration of natural radionuclides [42]. The neural network was used as if it were a multiple regression analysis, so the number of values used for its design and operation is considered adequate.
2.5. Assessment of the Effective Doses of the FA and BA for Workers
The annual effective doses () were determined for a ‘large heap’ scenario considering doses from external radiation (), inhalation (), and ingestion (), according to Equation (7):
where , , and are given by the following expressions:
where , , and are the dose conversion factors for external radiation, inhalation, and ingestion for workers in a ‘large heap’ scenario obtained from Radiation Protection 122 [43]. Additionally, is the annual exposure time (), is the breathing rate (), is the dust concentration in the proposed scenario (), is the ingestion rate (), and is the radionuclide activity concentration for which the annual effective dose rate () is determined [44]. The uncertainty associated with the annual effective dose rate was determined as the quadratic sum of the uncertainties of , , and , which were derived from the uncertainties of the activity concentrations of each radionuclide involved in the calculation (226Ra, 210Pb, 212Pb and 40K).
3. Results
3.1. Chemical and Radiological Composition of the FA
3.1.1. Chemical Composition
Figure 3 presents box-and-whisker plots displaying the percentages of metal oxides determined via XRF. The figure is divided into two subsets of oxides: those with percentages greater than 3% and those with percentages less than 3%. The box-and-whisker plots reveal very high variability, reflecting the heterogeneity of the analyzed ashes. Although the box-and-whisker plots show values that could be considered outliers, no statistical tests for anomalous results have been conducted on them, as their removal could affect the subsequent Principal Component Analysis (PCA). The medians of the oxides were as follows: 59.8%, 18.1%, 6.6%, 4.4%, 1.6%, 0.05%, 1.4%, 0.4%, 1.0%, and 0.19%. The plots indicate a negative skew (below -1) for , , and , suggesting higher accuracy at percentages above the median value (quartiles 3 and 4). Conversely, a positive skew (above 1) was observed for , , and , reflecting greater precision for quartiles 1 and 2. Additionally, the most symmetrical distributions (with skews below ±1) were those of , , , and .
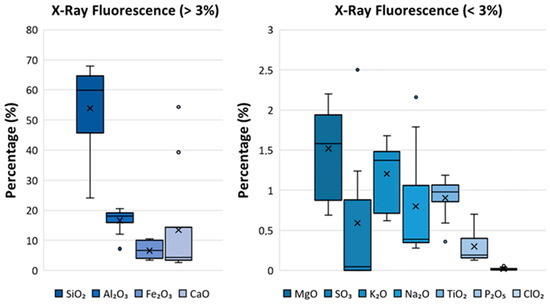
Figure 3.
Box-and-whisker plots showing the percentages of the principal oxides in the analyzed fly ash determined via X-ray fluorescence. The results of the percentages of oxides used for the box-and-whisker plots are provided in Table S1 of the supplementary information.
3.1.2. Activity Concentrations of Natural Radionuclides
Figure 4 shows the box-and-whisker plot with the activity concentrations of radionuclides belonging to the natural radioactive series of uranium and thorium, along with . The box-and-whisker plot reveals a positive skew in the uranium radioactive series due to one sample analyzed being higher than the rest of the FAs, with values of and at and , respectively. This sample was responsible for the values located outside the interquartile range. The activity concentrations of radionuclides from the thorium series (, , and ) had medians equivalent to the average. However, the different gamma emitters represented in the box-and-whisker plots showed high heterogeneity. Furthermore, the activity concentration of was higher than that of the remaining gamma emitters of the uranium series.
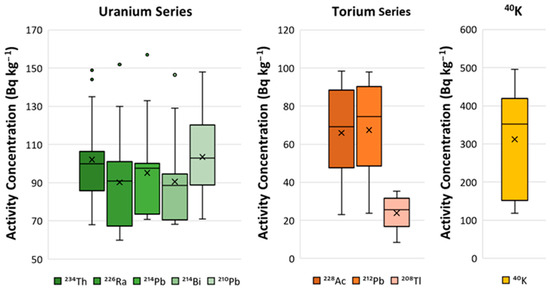
Figure 4.
Box-and-whisker plots of the activity concentrations of natural gamma-emitting radionuclides belonging to the natural radioactive series of uranium and thorium, along with . The activity concentrations of natural radionuclides from the uranium and thorium radioactive series, along with those of , used for the box-and-whisker plots are provided in Table S2 of the supplementary information.
Figure 5 illustrates the relationship between the thorium radioactive series (228Ac) and the uranium radioactive series (234Th). The R2 value is low, indicating that the linear function accounts for only 32.1% of the data variability; however, the function facilitates the observation of the relationship between both radioactive series. The relationship suggests that the proportion of the uranium series in the FA is greater than that of the thorium series, as the slope is less than one.
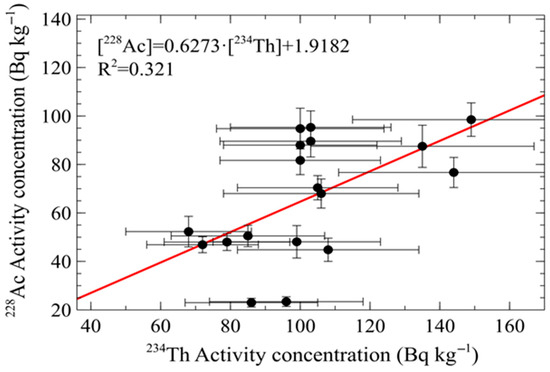
Figure 5.
Relación entre la serie radiactiva del torio (228Ac) y la serie radiactiva del uranio (234Th).
3.2. Correlation Between Chemical Composition and Radioactive Content
Figure 6 shows the results of the principal component analysis (PCA) represented in a Biplot graph. The two obtained factors accounted for 95.7% of the variance. The variables that exceeded a contribution percentage greater than (see Section 2.3.1.) were, among the oxides, , , , , and ; and regarding natural radionuclides, they were , , , , and . The Kaiser–Meyer–Olkin (KMO) index was equal to 0.71, indicating a satisfactory correlation. Factor 1 represented the contribution of the various oxides obtained through XRF. Factor 2 represented, as the most significant variable, the activity concentration of . The remaining radionuclides contributed more significantly to Factor 1, although and from the uranium series were evenly distributed between Factor 1 and Factor 2. The represented variables showed a correlation between the radionuclides of the actinium series ( and ). The activity concentrations of and did not show any relationship with the oxide percentages as they formed a 90° angle (with the correlation being equal to the cosine of the angle formed between two vectors). The sample scores were represented with green points, their diameter being proportional to the magnitude of their contribution. The scores showed that sample 4A had a higher activity concentration of radionuclides from the uranium series (represented by and ) compared to the other samples. Likewise, three groupings of fly ash were obtained: (i) 2A, 2B, 3A, 3B, characterized mainly by a higher percentage of and a lower presence of radionuclides from the thorium series; (ii) samples 1A, 1B, 5A, and 5B, characterized mainly by a lower activity concentration of ; and (iii) the remaining samples, in which a higher content of natural radionuclides and a higher percentage of were observed.
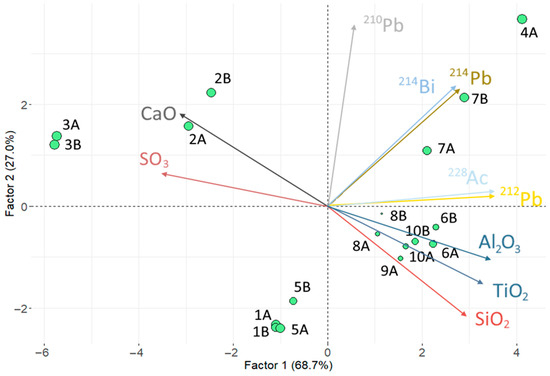
Figure 6.
HJ-Biplot graph with the result of the principal component analysis comparing the chemical composition obtained via XRF and the radioactive content of the samples (radioactive series of uranium and thorium along with ) for the different fly ash (FA) analyzed in this study.
3.3. Evaluation of the Influence of Chemical Composition on the Radioactive Content of FAs
Figure 7 shows the results obtained by applying Garson’s algorithm to the four neural networks designed to evaluate the influence of chemical composition on the radioactive content of FAs. The oxides used were , , , , and , and the gamma-emitting radionuclides considered were , , , and , since the VIF obtained in both sets were below 10, ensuring no collinearity among them. Figure 8 also illustrates the evolution of the loss functions () as a function of epochs for the different radionuclides studied, as determined by expression 2. All radionuclides yielded consistent results, with decreasing from values greater than 104 to values below 102. Consequently, the values obtained demonstrated adequate convergence for both the training and test datasets. These findings confirmed that the proposed networks are capable of capturing the existing nonlinear relationships between the radionuclides and the chemical composition without exhibiting overfitting, thus indicating a correct parametrization of the neural network. The RMSE and RSE values obtained for , , and were less than 15%, while those for were greater than 50%. The results showed that the most influential oxide for estimating the activity concentrations of the different radionuclides was . Likewise, it was observed how the weights of and are more influential than those obtained for and . Figure 8 shows the Pearson correlation matrix obtained for the oxides and natural radionuclides used in the neural network. The highest correlations were found for (0.85), (0.70), (0.83), and with and (0.98 and 0.80, respectively).
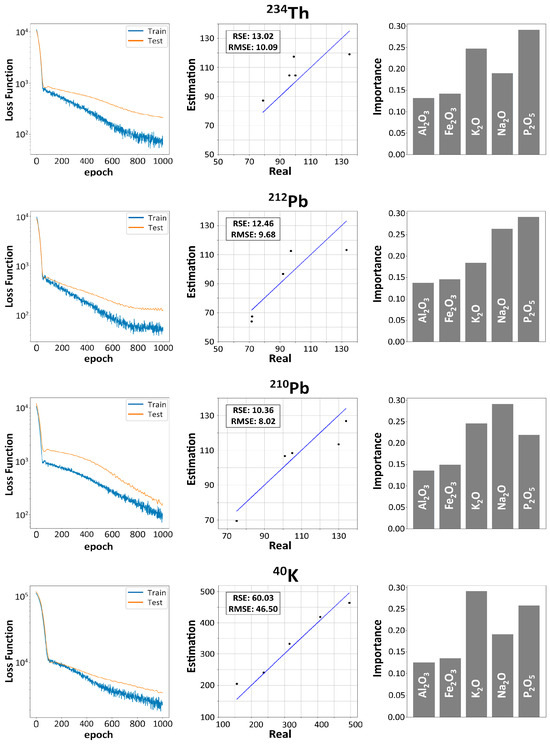
Figure 7.
Evaluation of the oxides , , , , and in the activity concentration of , , , and for the fly ash (FA) analyzed in this study.
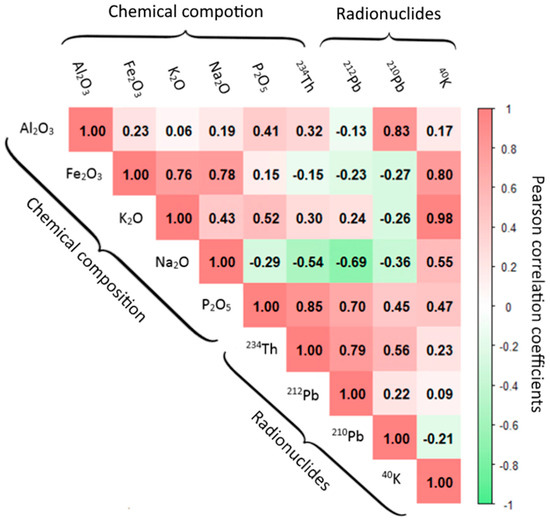
Figure 8.
Pearson correlations between natural radionuclides and oxides used in the neural network.
3.4. Comparison Between the Chemical and Radiological Composition of FA and BA
Figure 9 illustrates the relationship between fly ash (FA) and bottom ash (BA) for chemical compositions expressed as a percentage in oxides and the activity concentrations of the main gamma emitters. Positive differences indicate a higher content in FA, while negative differences signify a higher content in BA. Figure 9a demonstrates that FA contains higher levels of , , and , whereas BA is richer in , , , , and . The activity concentrations of natural radionuclides in BA were systematically higher than those in FA. However, the activity concentrations of and were 40% higher in FA compared to BA. The means of the two data sets were compared using the Wilcoxon rank-sum test, as the Shapiro–Wilk test determined that the values did not follow a normal distribution. The oxide percentages of FA and BA did not show significant differences between them, although Figure 9a highlights a significant difference for . Similarly, the activity concentrations did not exhibit significant differences when the Wilcoxon rank-sum test was applied. However, Figure 9b shows how all radionuclides except for and were systematically lower in the fly ash. For this reason, it was decided to remove the activity concentration of since it significantly deviated from the rest of the values, and the Shapiro–Wilk test was applied again. The test result indicated in this case that the distribution was normal, so the Student’s t-test for paired results was applied, verifying in this new case that there were significant differences between the FA and BA means.
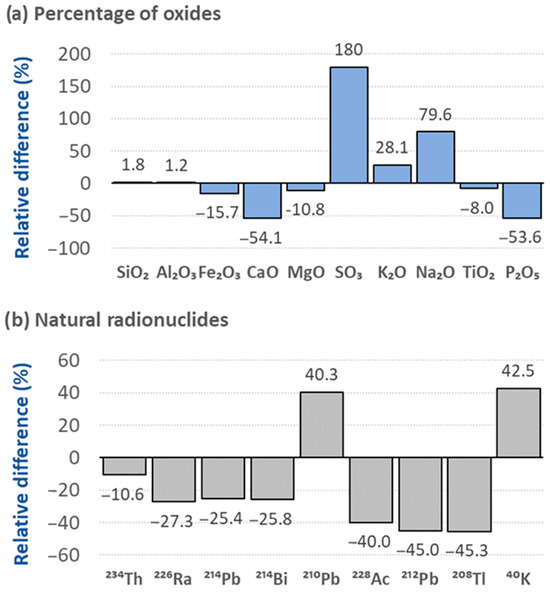
Figure 9.
Comparison between the chemical composition of the oxides of the different metals determined by XRF and the natural radionuclides present in the fly ash (FA) and bottom ash (BA).
3.5. Assessment of the Effective Doses of the FA and BA for Workers
The effective doses () were calculated for the fly ashes (FAs) and bottom ashes (BAs) from the thermoelectric power plant where the FAs and BAs were analyzed, as well as for the FA that exhibited the highest activity concentrations of gamma-emitting radionuclides from the uranium and thorium decay series. The obtained for BA () was higher than that for FA (). Additionally, the obtained for the FA with the highest activity concentration of natural radionuclides was . Therefore, the effective doses obtained were all safe from the perspective of radiological protection, being lower than the effective dose limit for the general public () [45].
4. Discussion
The results obtained allowed us to confirm our hypothesis that there is a relationship between the chemical composition of fly ashes and their content of natural radionuclides. However, this relationship is highly dependent on the composition of the burned coals, and, therefore, given the high heterogeneity of the coals used, any potential correlation becomes very complex. Despite this, it was observed that the oxides contributing the most were , , and , while and had a lesser impact.
The oxides with the highest percentage in fly ash (FA) (75%–80%), namely , , and , are consistent with those found in other studies [25]. These oxides provide the FAs with cementitious properties when reacting with [46]. The percentage of obtained in the FAs shows significant heterogeneity, as has also been observed in other studies [47]. The percentage of classifies FAs into Class F with a percentage between 1 and 10% and Class C with a percentage above 20% [12]. Additionally, the presence of minor oxides, such as and [48], allows us to establish associations with natural radionuclides both in the principal component analysis (PCA) and with the neural network (NN) (Figure 6 and Figure 7). The content of natural radionuclides also shows significant heterogeneity, consistent with the chemical composition. Figure 4 indicates that the activity concentrations of gamma-emitting radionuclides from the uranium radioactive series are higher than those from the thorium series. However, this increase is not very pronounced. Therefore, it is assumed that the power plants combusted a higher proportion of lignite coal compared to anthracite coal [22,24,46]. Furthermore, the concentration of is associated with finer particles because its melting point is 1759 °C, so it partially evaporates at the furnace flame temperature and condenses in the FA [1]. The results obtained reflect behavior consistent with the findings of other authors, such as Karangelos et al. [24].
The HJ-Biplot chart, which represents the PCA results, allowed for the observation of the groupings present in the results of our study. The coals burned in Spanish thermoelectric power plants are mixtures of bituminous and sub-bituminous coals (accounting for 65%–75%), domestic lignites representing 20%–30%, and imported anthracites and bituminous coals making up the remainder [49]. These percentages are reflected in Figure 4, which shows that the uranium series was greater than the thorium series. Therefore, it can be assumed that less than half of the uranium entering the furnace would be in the form of carbonate complexes (Na2[UO2(CO3)2] or Na2[UO2[UO2(CO3)]]). Additionally, the acidic conditions of lignite would cause the carbonate complexes to transform into uraninite (UO2) or coffinite (SiO2·U(SiO4)1−x(OH)4x) when sufficient SiO2 is present in the medium. On the other hand, these uranium compounds and the operating conditions of the plants—with a stoichiometric excess of oxygen of 10% and temperatures between 1500–1600 °C—would lead to the formation of UO3, which is volatile. Moreover, uranium could undergo a secondary process and combine with molten silica [45]. However, this effect could not be reflected in the Biplot graph and would indicate a lower presence of organic carbon in the form of lignites, with a higher presence of the uranium series [22,23] as compared to the remaining coals, which are richer in the thorium series [24,25]. Furthermore, Ra would be present in coffinite and zircon, which would imply lower mobility of 226Ra compared to 228Ra [45]. This aspect was reflected in the Biplot graph by the observed association between 228Ac (the gamma-emitting descendant of 228Ra) and Al2O3 and SiO2. 232Th and 228Th would undergo the same effect as 228Ra due to their association with zircon (ZrSiO4) [45], which was also reflected in the Biplot graph by the relationships between 212Pb and SiO2, since 212Pb would be in equilibrium with 228Th due to the time elapsed between the sampling of FA and the laboratory measurements. On one hand, it was observed that the presence of and was inversely proportional to the content of natural radionuclides. The lower radioactive content is due to the competition between and and , which affects their retention, along with the high pH of calcareous compounds [50]. This behavior was observed in the two FAs that could be considered as class C compared to those regarded as type F. The results also showed an association between the thorium series () and, to a lesser extent, the uranium series ( and ) with the oxides of and . This finding was also noted in a previous study, as these two oxides cause retention of natural radionuclides, and their presence is attributed to the combustion of pyrite (), siderite (), rutile (), and ilmenite () [51], which are not completely decomposed during combustion [52]. Additionally, it was observed that the greater presence of is not associated with chemical composition, as it forms a 90° angle with the vectors of the metal oxides, which could justify its volatility and retention by adsorption on FA particles, independent of their chemical composition. Therefore, the results obtained are consistent with the usual chemical and radiological composition ranges of FAs [29]. Furthermore, radionuclides from the thorium series showed an association with and due to incomplete combustion, while would undergo adsorption processes.
The associations identified in the PCA were partially reflected in the weights obtained by Garson’s algorithm for the studied variables: , , , , and (oxides) and , , , and (natural radionuclides). The variables used were those that did not exhibit collinearity (VIF values < 10). The neural network was employed instead of a multiple regression analysis due to the flexibility provided by the NN, as the number of neurons used allowed for a better fit. This use of the NN enables valid results to be obtained with a reduced number of samples, as in the case of this study. The most significant weight was obtained for , followed by the oxides of and (Figure 7). These weights were also reflected in the Pearson correlation matrix, where correlations greater than 0.7 were observed for and with (Figure 8). Although is a minor oxide, its association with the radionuclides of the uranium and thorium series is significant, as phosphate compounds exhibit a high concentration of radionuclides from the uranium and thorium series [53,54]. On the other hand, a correlation was observed between and that was not reflected in the PCA and is attributed to the ability of FAs to retain through an exchange mechanism with and , as well as to their surface adsorption capacity [55]. The correlation found between and could be due to the association of potassium feldspars with pyrite identified by other authors [56]. Finally, the correlation of 0.98 found between and confirms the coherence of the correlations obtained with the NN weights, as it is due to the percentage of in natural potassium. Therefore, the neural network weights and the correlations found have allowed us to demonstrate the relationship between chemical composition and radiological content, which was the main premise of our working hypothesis.
The chemical and radiological compositions of the FA and BA revealed significant differences in percentage terms (Figure 9). These differences could not be confirmed using mean tests (paired Student’s t-test and Wilcoxon rank-sum test). However, when was excluded from the mean comparison, significant differences were observed. The results indicate that the BA had a higher activity concentration than the FA, except for and . The potentially lower organic matter content of the coals burned in Spanish thermoelectric power plants could be the reason why radionuclide concentrations found in the BA are higher than those in the corresponding FA. The coals burned in Spanish thermal power plants are mixtures of bituminous and sub-bituminous coals with the presence of anthracites, and it is likely that they have a much lower lignite content and, consequently, lower organic matter content. As previously indicated, the typical volatile compounds of the radionuclides UO3 [57], Ra(OH)2 [39], and ThCl4 [17] are more closely associated with coals with a high lignite content [28]. These volatile compounds would be retained by the finer particles of the FA due to their higher specific surface area and absorption capacity. Therefore, the lower formation of the aforementioned volatile compounds that are retained in the FA would justify the higher presence in the BA. However, the thorium radionuclides (228Ac, 212Pb, and 208Tl) were retained at a lower percentage in the BA, which is consistent with the findings of other authors [27]. Likewise, 210Pb exhibited the expected behavior, as it is independent of the type of coal burned. The elevated activity concentration of is attributed to its volatility at flame temperature and its association with microparticles generated in the furnace. Similarly, the higher activity concentration of was noted by other researchers, such as Lewandowski et al. [58], who observed a higher percentage of , consistent with our findings. This increased content can be explained by the fact that K in the FA is associated with glassy phases or amorphous aluminosilicates, whereas in the BA, K is likely associated with more stable crystalline structures, like feldspars or micas, where its mobility is lower [59]. The remaining radionuclides are predominantly present in the BA, possibly due to the incomplete combustion of the oxides containing them [52]. Additionally, the distribution of radionuclides in FA and BA may also depend on the type of coal, as noted by Fidanchevski et al. [9], who reported higher activity concentrations of and in the BA compared to the FA. Therefore, further studies are required to corroborate these findings.
Finally, the activity concentrations of natural radionuclides present in FA and BA pose no radiological risk to workers at thermoelectric plants or storage areas for these residues. The most critical annual effective dose was , which is far below the annual effective dose limit for the general public of .
5. Conclusions
This study has made it possible to verify the relationship between the chemical composition of fly ash (FA) and its radioactive content in natural radionuclides. Additionally, a higher content of natural radionuclides has been observed in bottom ash (BA) compared to FA. This research has expanded knowledge regarding the limited studies in the literature by establishing specific correlations between the composition of oxides obtained through X-ray fluorescence and the content of gamma-emitting radionuclides. This provides information beyond what previous studies have reported, since, unlike these, all fly ashes came from the same country, while other correlations were made with FAs from different locations, which makes it more complex to establish adequate correlations.
The oxides of , , and had the greatest influence in the correlation between chemical composition and radioactive content of the FA. On the other hand, the results indicated a dependence on the percentage of , , and and the radioactive content. The application of neural networks through the use of the Garson algorithm represents a novel methodological approach in this field, allowing for a more precise identification of the weights that exist between the correlations found between chemical and radiological parameters. The likely influences the presence of and due to chemical competition reactions between these cations. The and exhibit a significant relationship with radionuclides from the thorium series due to their association with minerals, such as rutile or ilmenite. Additionally, the showed independence from the chemical composition, which can be attributed to adsorption processes on the finer particles of the FA, as this element has higher volatility at the combustion temperature of the furnace.
The activity concentrations of natural radionuclides from the uranium and thorium series were higher in BA than in FA. Unlike previous research that compared general properties of FA and BA, our study provides a direct comparison of materials generated under identical conditions from the same thermoelectric plant, offering statistically more representative conclusions. The type of coal influences this behavior, being associated with oxides that are not completely oxidized in the flame. However, undergoes more complete oxidation as it is associated with vitreous phases or amorphous aluminosilicates. This study enabled obtaining these results in the ashes generated under the same conditions, implying greater precision than when FA and BA are compared in general. Therefore, it is once again evident that the heterogeneity of the burned coals has a direct relationship with the results of this type of study.
The annual effective dose determined for the ashes (FA and BA) used in this study was , which is a value far below the level established in the Spanish regulations for the general public. Therefore, the results presented in this study demonstrate that the use of this type of ash would be safe from the perspective of radiological safety and that the use of these ashes in the construction industry is suitable for recycling strategies within a circular economy. However, prior characterization or the availability of historical data ensuring their safe use is necessary.
Future research should focus on applying the methodology developed in this study to a wider range of coals to develop predictive models that estimate radioactive content based on chemical composition. Additionally, studies investigating the leaching behavior of radionuclides from these materials under various environmental conditions would provide valuable information for their long-term management, thus avoiding environmental damage. Evaluating the effect of FA and BA particle size on radionuclide distribution could also provide information to optimize their processing for safer industrial applications.
Supplementary Materials
The following supporting information can be downloaded at: https://www.mdpi.com/article/10.3390/min15050471/s1, Table S1. Chemical composition (wt.%) of the analyzed fly ashes and bottom ash obtained by XRF; Table S2. Activity concentration (Bq kg−1) of the radionuclides from the natural radioactive series of uranium and thorium, and 40K from the analyzed fly ashes and bottom ash.
Author Contributions
Conceptualization, M.Á.S. and J.A.S.-N.; methodology, M.Á.S., J.A.S.-N., V.M.E.-S., J.F.B. and C.A.; software, J.A.S.-N. and J.F.B.; validation, M.Á.S., J.A.S.-N., V.M.E.-S. and J.F.B.; formal analysis, J.A.S.-N.; investigation, M.Á.S., J.A.S.-N., V.M.E.-S., J.F.B. and C.A.; resources, M.Á.S. and G.H.; data curation, J.A.S.-N.; writing—original draft preparation, J.A.S.-N.; writing—review and editing, J.A.S.-N. and M.Á.S.; supervision, J.A.S.-N. and M.Á.S. All authors have read and agreed to the published version of the manuscript.
Funding
This research received no external funding.
Data Availability Statement
The original contributions presented in this study are included in the article/Supplementary Materials. Further inquiries can be directed to the corresponding author.
Conflicts of Interest
The authors declare no conflict of interest.
References
- Vilakazi, A.Q.; Ndlovu, S.; Chipise, L.; Shemi, A. The Recycling of Coal Fly Ash: A Review on Sustainable Developments and Economic Considerations. Sustainability 2022, 14, 1958. [Google Scholar] [CrossRef]
- Paul, K.T.; Satpathy, S.K.; Manna, I.; Chakraborty, K.K.; Nando, G.B. Preparation and Characterization of Nano structured Materials from Fly Ash: A Waste from Thermal Power Stations, by High Energy Ball Milling. Nanoscale Res. Lett. 2007, 2, 397. [Google Scholar] [CrossRef]
- Lanzerstorfer, C. Fly ash from coal combustion: Dependence of the concentration of various elements on the particle size. Fuel 2018, 228, 263–271. [Google Scholar] [CrossRef]
- Arditsoglou, A.; Petaloti, C.; Terzi, E.; Sofoniou, M.; Samara, C. Size distribution of trace elements and polycyclic aromatic hydrocarbons in fly ashes generated in Greek lignite-fired power plants. Sci. Total Environ. 2004, 323, 153–167. [Google Scholar] [CrossRef]
- Sarkar, A.; Rano, R.; Mishra, K.K.; Sinha, I.N. Particle size distribution profile of some Indian fly ash—A comparative study to assess their possible uses. Fuel Process. Technol. 2005, 86, 1221–1238. [Google Scholar] [CrossRef]
- Ramjan, S.; Tangchirapat, W.; Jaturapitakkul, C.; Chee Ban, C.; Jitsangiam, P.; Suwan, T. Influence of Cement Replacement with Fly Ash and Ground Sand with Different Fineness on Alkali-Silica Reaction of Mortar. Materials 2021, 14, 1528. [Google Scholar] [CrossRef] [PubMed]
- Shehata, M.H.; Thomas, M.D.A. The effect of fly ash composition on the expansion of concrete due to alkali–silica reaction. Cem. Concr. Res. 2000, 30, 1063–1072. [Google Scholar] [CrossRef]
- Sarkar, A.; Vishwakarma, S.; Banichul, H.; Mishra, K.K.; Roy, S.S. A Comprehensive Analysis of the Particle Size and Shape of Fly Ash from Different Fields of ESP of a Super Thermal Power Plant. Energy Sources Part A Recovery Util. Environ. Eff. 2012, 34, 385–395. [Google Scholar] [CrossRef]
- Fidanchevski, E.; Angjusheva, B.; Jovanov, V.; Murtanovski, P.; Vladiceska, L.; Aluloska, N.S.; Nikolic, J.K.; Ipavec, A.; Šter, K.; Mrak, M.; et al. Technical and radiological characterisation of fly ash and bottom ash from thermal power plant. J. Radioanal. Nucl. Chem. 2021, 330, 685–694. [Google Scholar] [CrossRef]
- Khoshnoud, P. Polymer Foam/Fly Ash Composites: Evaluation of Mechanical, Interfacial, Thermal, Viscoelastic and Microstructural Properties; The University of Wisconsin-Milwaukee: Milwaukee, WI, USA, 2017. [Google Scholar]
- Mishra, J.; Nanda, B.; Patro, S.K.; Krishna, R.S. Sustainable Fly Ash Based Geopolymer Binders: A Review on Compressive Strength and Microstructure Properties. Sustainability 2022, 14, 15062. [Google Scholar] [CrossRef]
- ASTM C618; Standard Specification for Coal Fly Ash and Raw or Calcined Natural Pozzolan for Use in Concrete. ASTM: West Conshohocken, PA, USA, 2023.
- Kizhakkumodom Venkatanarayanan, H.; Rangaraju, P.R. Decoupling the effects of chemical composition and fineness of fly ash in mitigating alkali-silica reaction. Cem. Concr. Compos. 2013, 43, 54–68. [Google Scholar] [CrossRef]
- Alahmari, T.S.; Abdalla, T.A.; Rihan, M.A.M. Review of Recent Developments Regarding the Durability Performance of Eco-Friendly Geopolymer Concrete. Buildings 2023, 13, 3033. [Google Scholar] [CrossRef]
- Saad, A.H.; Nahazanan, H.; Yusuf, B.; Toha, S.F.; Alnuaim, A.; El-Mouchi, A.; Elseknidy, M.; Mohammed, A.A. A Systematic Review of Machine Learning Techniques and Applications in Soil Improvement Using Green Materials. Sustainability 2023, 15, 9738. [Google Scholar] [CrossRef]
- Nukah, P.D.; Abbey, S.J.; Booth, C.A.; Nounu, G. Mapping and synthesizing the viability of cement replacement materials via a systematic review and meta-analysis. Constr. Build. Mater. 2023, 405, 133290. [Google Scholar] [CrossRef]
- Raj, A.; Sharma, T.; Singh, S.; Sharma, U.; Sharma, P.; Singh, R.; Sharma, S.; Kaur, J.; Kaur, H.; Salah, B.; et al. Building a Sustainable Future from Theory to Practice: A Comprehensive PRISMA-Guided Assessment of Compressed Stabilized Earth Blocks (CSEB) for Construction Applications. Sustainability 2023, 15, 9374. [Google Scholar] [CrossRef]
- de Rubeis, T.; Ciccozzi, A.; Giusti, L.; Ambrosini, D. On the use of 3D printing to enhance the thermal performance of building envelope—A review. J. Build. Eng. 2024, 95, 110284. [Google Scholar] [CrossRef]
- Aydın, S.; Karatay, Ç.; Baradan, B. The effect of grinding process on mechanical properties and alkali–silica reaction resistance of fly ash incorporated cement mortars. Powder Technol. 2010, 197, 68–72. [Google Scholar] [CrossRef]
- Eker, H.; Demir Şahin, D.; Çullu, M. Effect of Reduced Fineness of Fly Ash Used on the Alkali–Silica Reaction (ASR) of Concrete. Iran. J. Sci. Technol. Trans. Civil Eng. 2023, 47, 2203–2217. [Google Scholar] [CrossRef]
- Velandia Silva, C.A. Libro de Abstracts-Book of Abstracts. In Proceedings of the I International Conference Sustainable Construction and Demolition; Universitat Politecnica de Valencia: Valencia, Spain, 2022; p. 130. [Google Scholar]
- Cevik, U.; Damla, N.; Koz, B.; Kaya, S. Radiological Characterization around the Afsin-Elbistan Coal-Fired Power Plant in Turkey. Energy Fuels 2008, 22, 428–432. [Google Scholar] [CrossRef]
- Chen, J.; Chen, P.; Yao, D.; Huang, W.; Tang, S.; Wang, K.; Liu, W.; Hu, Y.; Zhang, B.; Sha, J. Abundance, Distribution, and Modes of Occurrence of Uranium in Chinese Coals. Minerals 2017, 7, 239. [Google Scholar] [CrossRef]
- Karangelos, D.J.; Petropoulos, N.P.; Anagnostakis, M.J.; Hinis, E.P.; Simopoulos, S.E. Radiological characteristics and investigation of the radioactive equilibrium in the ashes produced in lignite-fired power plants. J. Environ. Radioact. 2004, 77, 233–246. [Google Scholar] [CrossRef] [PubMed]
- Peppas, T.K.; Karfopoulos, K.L.; Karangelos, D.J.; Rouni, P.K.; Anagnostakis, M.J.; Simopoulos, S.E. Radiological and instrumental neutron activation analysis determined characteristics of size-fractionated fly ash. J. Hazard. Mater. 2010, 181, 255–262. [Google Scholar] [CrossRef]
- Cano, A.; Suarez-Navarro, J.A.; Puertas, F.; Fernandez-Jimenez, A.; Alonso, M.D.M. New Approach to Determine the Activity Concentration Index in Cements, Fly Ashes, and Slags on the Basis of Their Chemical Composition. Materials 2023, 16, 2677. [Google Scholar] [CrossRef] [PubMed]
- Bhangare, R.C.; Tiwari, M.; Ajmal, P.Y.; Sahu, S.K.; Pandit, G.G. Distribution of natural radioactivity in coal and combustion residues of thermal power plants. J. Radioanal. Nucl. Chem. 2014, 300, 17–22. [Google Scholar] [CrossRef]
- Krylov, D.A.; Sidorova, G.P. Radioactivity of coals and ash and slag wastes at coal-fired thermal power plants. Therm. Eng. 2013, 60, 239–243. [Google Scholar] [CrossRef]
- Temuujin, J.; Surenjav, E.; Ruescher, C.H.; Vahlbruch, J. Processing and uses of fly ash addressing radioactivity (critical review). Chemosphere 2019, 216, 866–882. [Google Scholar] [CrossRef]
- Font, J.; Casas, M.; Forteza, R.; Cerda, V.; Garcias, F. Natural radioactive elements and heavy metals in coal, fly ash and bottom ash from a thermal power plant. J. Environ. Sci. Health Part A Environ. Sci. Eng. Toxicol. 1993, 28, 2061–2073. [Google Scholar] [CrossRef]
- Ahmed, I.K.; Khalaf, H.N.B.; Ambrosino, F.; Mostafa, M.Y.A. Fly ash radiological characterization from thermal power plants in Iraq. J. Radioanal. Nucl. Chem. 2021, 329, 1237–1245. [Google Scholar] [CrossRef]
- Khan, I.U.; Sun, W.; Lewis, E. Estimation of various radiological parameters associated with radioactive contents emanating with fly ash from Sahiwal coal–fuelled power plant, Pakistan. Environ. Monit. Assess. 2020, 192, 715. [Google Scholar] [CrossRef]
- DNV. Energy Transition Outlook 2024. In A Global and Regional Forecast to 2050; DNV AS: Høvik, Norway, 2024; p. 261. [Google Scholar]
- European Standard EN 196-2; Method of Testing Cement. Part 2: Chemical Analysis of Cement. European Committee for Standardization: Brussels, Belgium, 2014.
- Barba-Lobo, A.; Expósito-Suárez, V.M.; Suárez-Navarro, J.A.; Bolívar, J.P. Robustness of LabSOCS calculating Ge detector efficiency for the measurement of radionuclides. Radiat. Phys. Chem. 2023, 205, 110734. [Google Scholar] [CrossRef]
- Canberra. Genie 2000 Operations Manual; Canberra Industries: Meriden, CT, USA, 2012. [Google Scholar]
- Suárez-Navarro, J.A.; Gascó, C.; Alonso, M.M.; Blanco-Varela, M.T.; Lanzon, M.; Puertas, F. Use of Genie 2000 and Excel VBA to correct for γ-ray interference in the determination of NORM building material activity concentrations. Appl. Radiat. Isot. 2018, 142, 1–7. [Google Scholar] [CrossRef]
- Canberra. Coincidence Summing Library (Nuclides and Lines); Canberra Industries, Inc.: Meriden, CT, USA, 2008. [Google Scholar]
- UNE-EN ISO/IEC 17025:2017; General Requirements for the Competence of Testing and Calibration Laboratories. UNE, I.E.: Madrid, Spain, 2017.
- Be, M.; Chisté, V.; Dulieu, C.; Kellett, M.; Mougeot, X.; Arinc, A.; Chechev, V.; Kuzmenko, N.; Kibédi, T.; Luca, A. Table of Radionuclides (Vol. 8-A= 41 to 198); Bureau International Des Poids et Mesures (BIPM): Sèvres, France, 2016. [Google Scholar]
- Kassambara, A. Practical Guide to Principal Component Methods in R: PCA, M (CA), FAMD, MFA, HCPC, Factoextra, 2017; Volume 2.
- Expósito-Suárez, V.M.; Suárez-Navarro, J.A.; Caro, A.; Sanz, M.B.; Hernaiz, G.; González-Sanabria, A.; Suárez-Navarro, M.J.; Jordá-Bordehore, L.; Chamorro-Villanueva, H.; Arlandi, M.; et al. Radiological characterization of the tailings of an abandoned copper mine using a neural network and geostatistical analysis through the Co-Kriging method. Environ. Geochem. Health 2024, 46, 297. [Google Scholar] [CrossRef] [PubMed]
- European Commission. Radiation protection 122. In Practical Use of the Concepts of Clearance and Exemption Part II: Application of the Concepts of Exemption and Clearance to Natural Radiation Sources; Radiation Protection; European Commission: Brussels, Belgium, 2001. [Google Scholar]
- Iwaoka, K.; Tabe, H.; Yonehara, H. Natural radioactivity of bedrock bath instruments and hot spring instruments in Japan. J. Radioanal. Nucl. Chem. 2013, 295, 817–821. [Google Scholar] [CrossRef]
- BOE. Real Decreto 1029/2022, de 20 de Diciembre, por el que se Aprueba el Reglamento Sobre Protección de la Salud Contra Los Riesgos Derivados de la Exposición a las Radiaciones Ionizantes; BOE: Madrid, Spain, 2022. [Google Scholar]
- Wang, Y.; Acarturk, B.C.; Burris, L.; Hooton, R.D.; Shearer, C.R.; Suraneni, P. Physicochemical characterization of unconventional fly ashes. Fuel 2022, 316, 123318. [Google Scholar] [CrossRef]
- Zielinski, R.A. Radioactive Elements in Coal and Fly Ash: Abundance, Forms, and Environmental Significance. In U.S. Geological Survey Fact Sheet FS-163-97; USGS Publications Warehouse: Reston, VA, USA, 1997. [Google Scholar]
- Gupta, V.; Pathak, D.K.; Siddique, S.; Kumar, R.; Chaudhary, S. Study on the mineral phase characteristics of various Indian biomass and coal fly ash for its use in masonry construction products. Constr. Build. Mater. 2020, 235, 117413. [Google Scholar] [CrossRef]
- Greenpeace. Las trampas del carbón. In Informe Sobre las Centrales Térmicas de Carbón en España (in Spanish); Greenpeace: Madrid, Spain, 2015. [Google Scholar]
- Elmehdi, H.M.; Ramachandran, K.; Al-Khalaileh, S.T.; El-Sayed Ahmed, S.; Daoudi, K.; Gaidi, M. Distribution of naturally occurring radioactive materials (NORMs) in Sharjah: Geological drivers and public health implications. Case Stud. Chem. Environ. Eng. 2025, 11, 101150. [Google Scholar] [CrossRef]
- Wu, J.; Yang, Y.; Tou, F.; Yan, X.; Dai, S.; Hower, J.C.; Saikia, B.K.; Kersten, M.; Hochella, M.F. Combustion conditions and feed coals regulating the Fe- and Ti-containing nanoparticles in various coal fly ash. J. Hazard. Mater. 2023, 445, 130482. [Google Scholar] [CrossRef]
- Vassilev, S.V.; Vassileva, C.G. A new approach for the classification of coal fly ashes based on their origin, composition, properties, and behaviour. Fuel 2007, 86, 1490–1512. [Google Scholar] [CrossRef]
- Kuzmanović, P.; Petrović, L.F.; Hansman, J.; Forkapić, S.; Mrđa, D.; Radić, J.K. Radioactivity of phosphate rocks and products used in Serbia and assessment of radiation risk for workers. J. Radioanal. Nucl. Chem. 2023, 332, 699–712. [Google Scholar] [CrossRef]
- Wen, H.; Pan, Z.; Giammar, D.; Li, L. Enhanced Uranium Immobilization by Phosphate Amendment under Variable Geochemical and Flow Conditions: Insights from Reactive Transport Modeling. Environ. Sci. Technol. 2018, 52, 5841–5850. [Google Scholar] [CrossRef]
- Koshy, N.; Singh, D.N. Fly ash zeolites for water treatment applications. J. Environ. Chem. Eng. 2016, 4, 1460–1472. [Google Scholar] [CrossRef]
- Zhang, J.; Jin, C.; Xing, L.; He, H.-T.; Zhao, Y.; Xin, Y.; Xu, Y.; Zhao, C.; Sun, P. Mineralogy and geochemistry of the coal seam of Shanxi Formation in Guotun Mine, Juye Coalfield, North China. Energy Explor. Exploit. 2019, 37, 1779–1803. [Google Scholar] [CrossRef]
- Zhang, Y.; Shi, M.; Wang, J.; Yao, J.; Cao, Y.; Romero, C.E.; Pan, W.-p. Occurrence of uranium in Chinese coals and its emissions from coal-fired power plants. Fuel 2016, 166, 404–409. [Google Scholar] [CrossRef]
- Levandowski, J.; Kalkreuth, W. Chemical and petrographical characterization of feed coal, fly ash and bottom ash from the Figueira Power Plant, Paraná, Brazil. Int. J. Coal Geol. 2009, 77, 269–281. [Google Scholar] [CrossRef]
- Jones, K.B.; Ruppert, L.F.; Swanson, S.M. Leaching of elements from bottom ash, economizer fly ash, and fly ash from two coal-fired power plants. Int. J. Coal Geol. 2012, 94, 337–348. [Google Scholar] [CrossRef]
Disclaimer/Publisher’s Note: The statements, opinions and data contained in all publications are solely those of the individual author(s) and contributor(s) and not of MDPI and/or the editor(s). MDPI and/or the editor(s) disclaim responsibility for any injury to people or property resulting from any ideas, methods, instructions or products referred to in the content. |
© 2025 by the authors. Licensee MDPI, Basel, Switzerland. This article is an open access article distributed under the terms and conditions of the Creative Commons Attribution (CC BY) license (https://creativecommons.org/licenses/by/4.0/).