
Probing the Critical Element Chemistry of Coal-Combustion Fly Ash: Examination of Zircon and Associated Minerals from a Beneficiated Kentucky Fly Ash

 ,
, 
 , and
, and
Abstract

1. Introduction
2. Materials and Methods
2.1. Beneficiation
2.2. Scanning Electron Microscopy–Energy Dispersive Spectroscopy (SEM-EDS)
2.3. Transmission Electron Microscopy (TEM) and Spectroscopy
3. Results
3.1. SEM-EDS
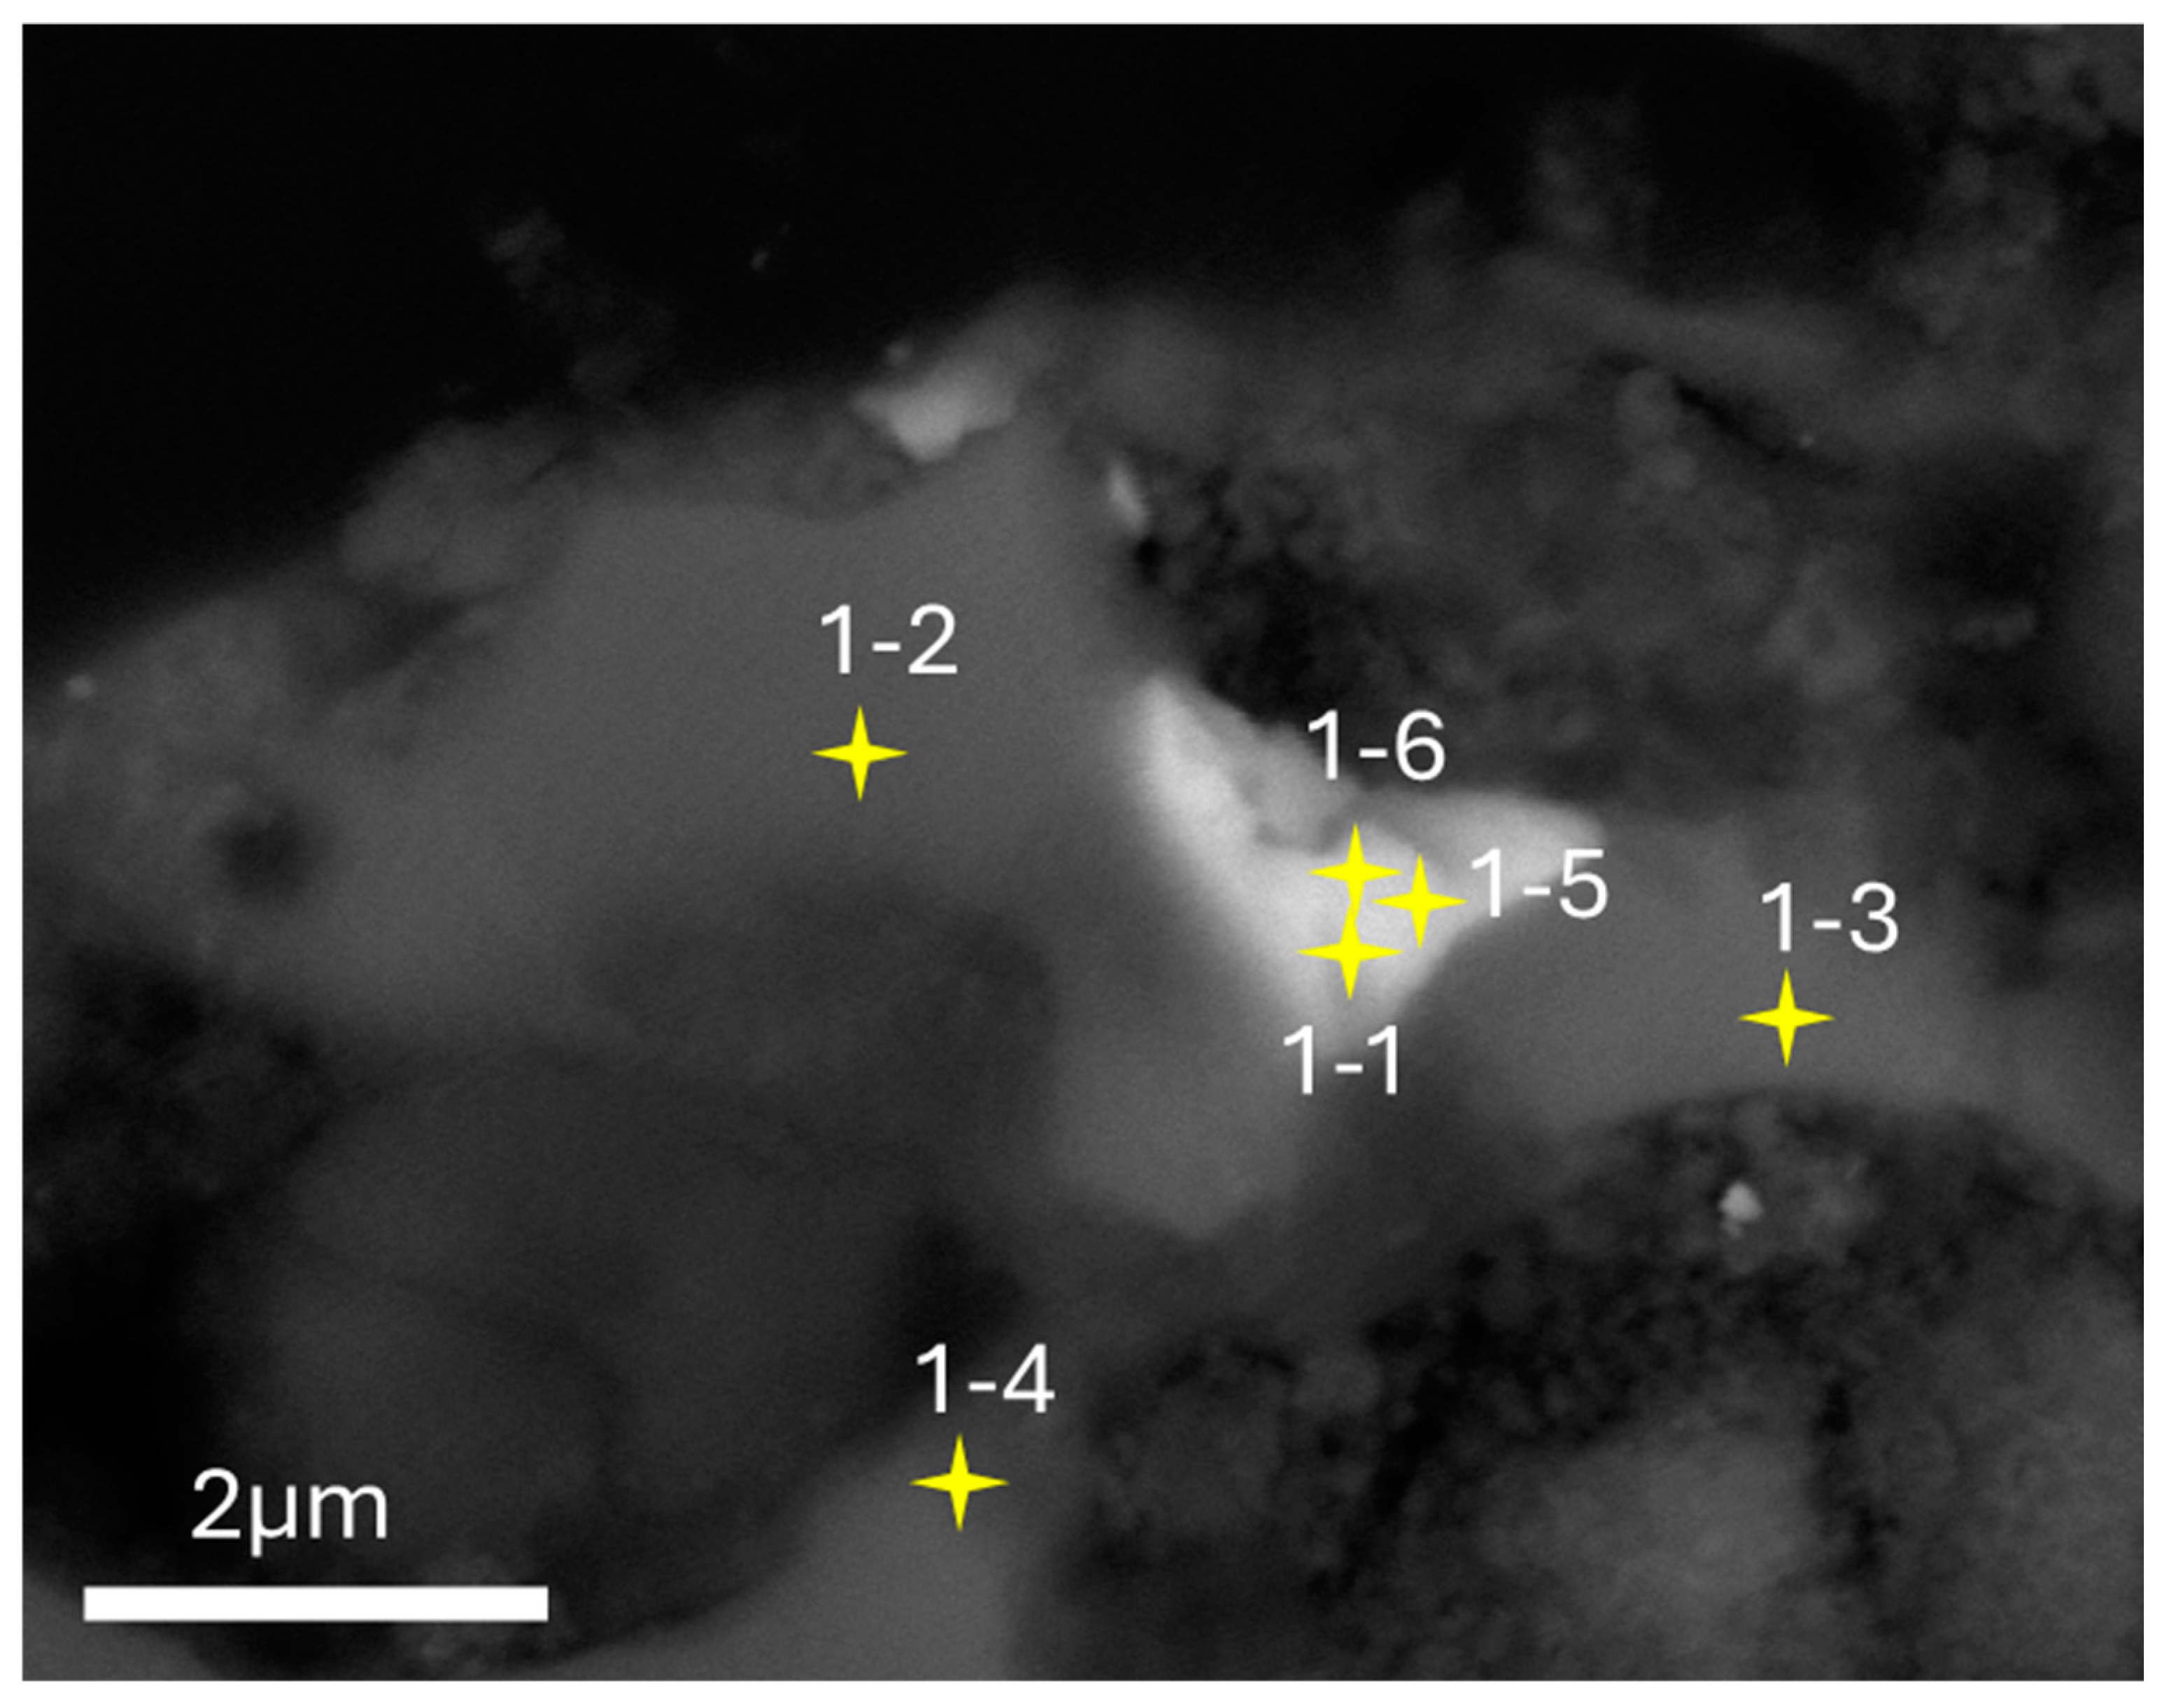
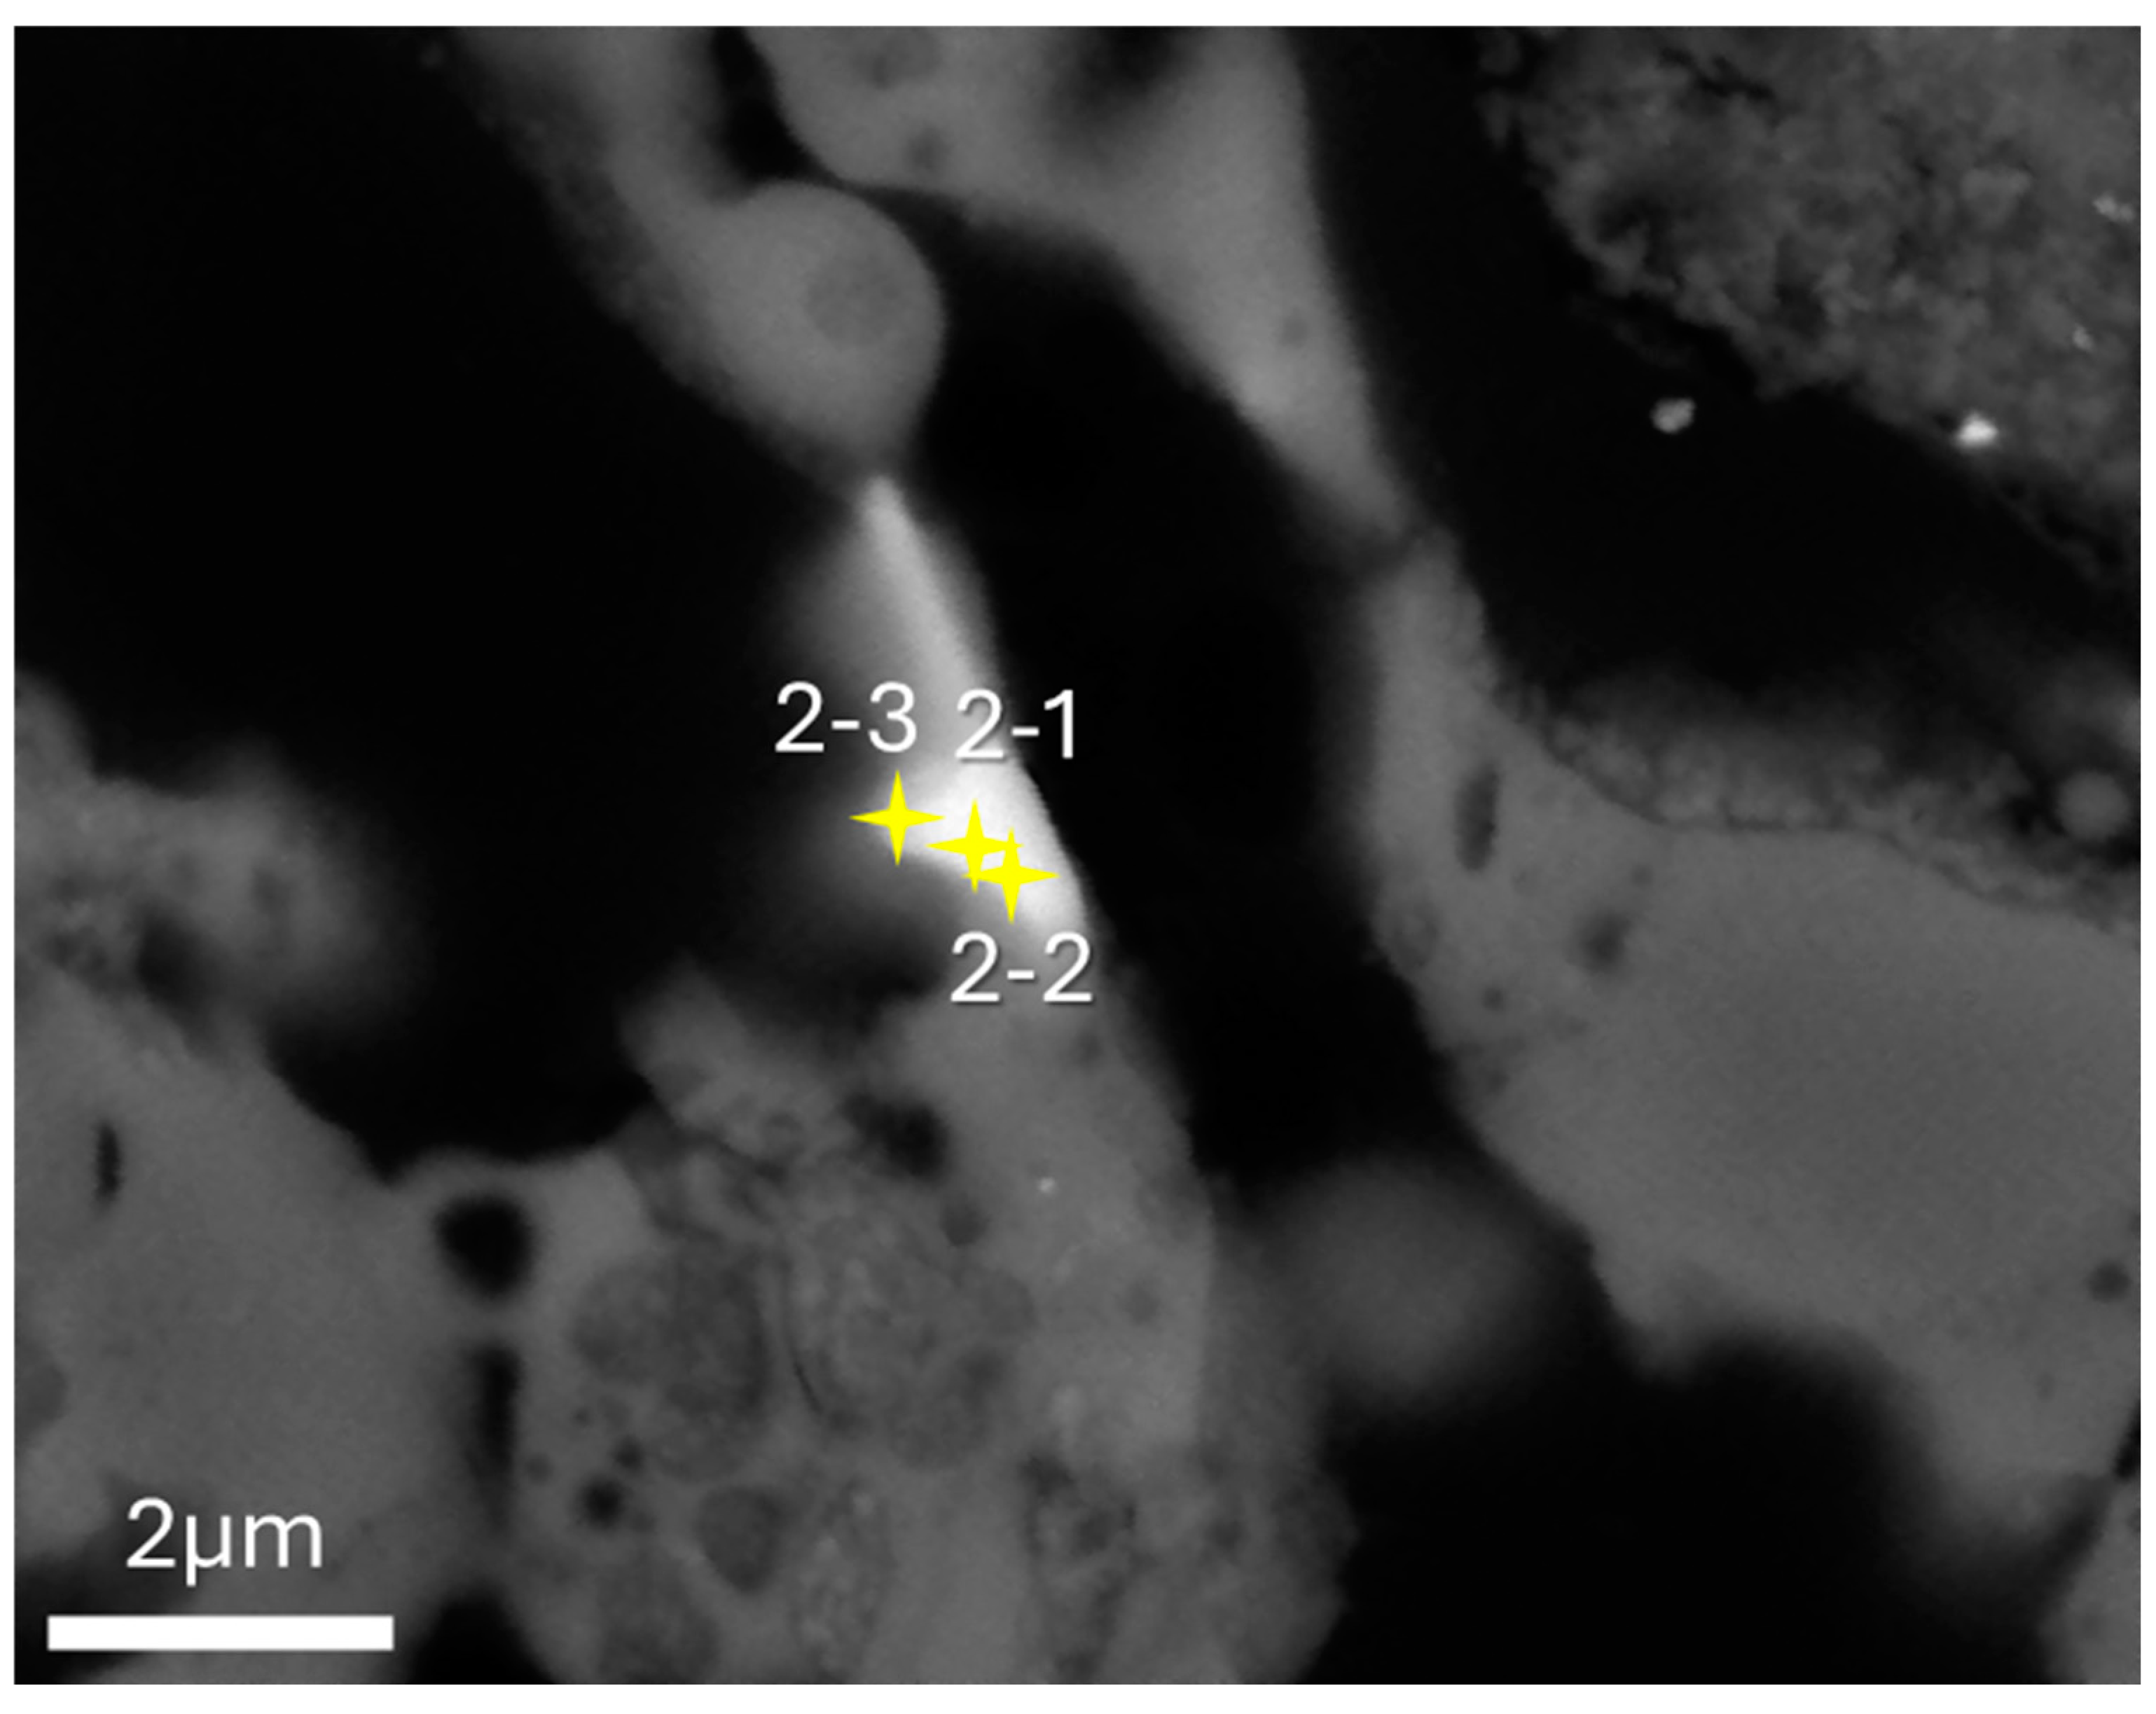
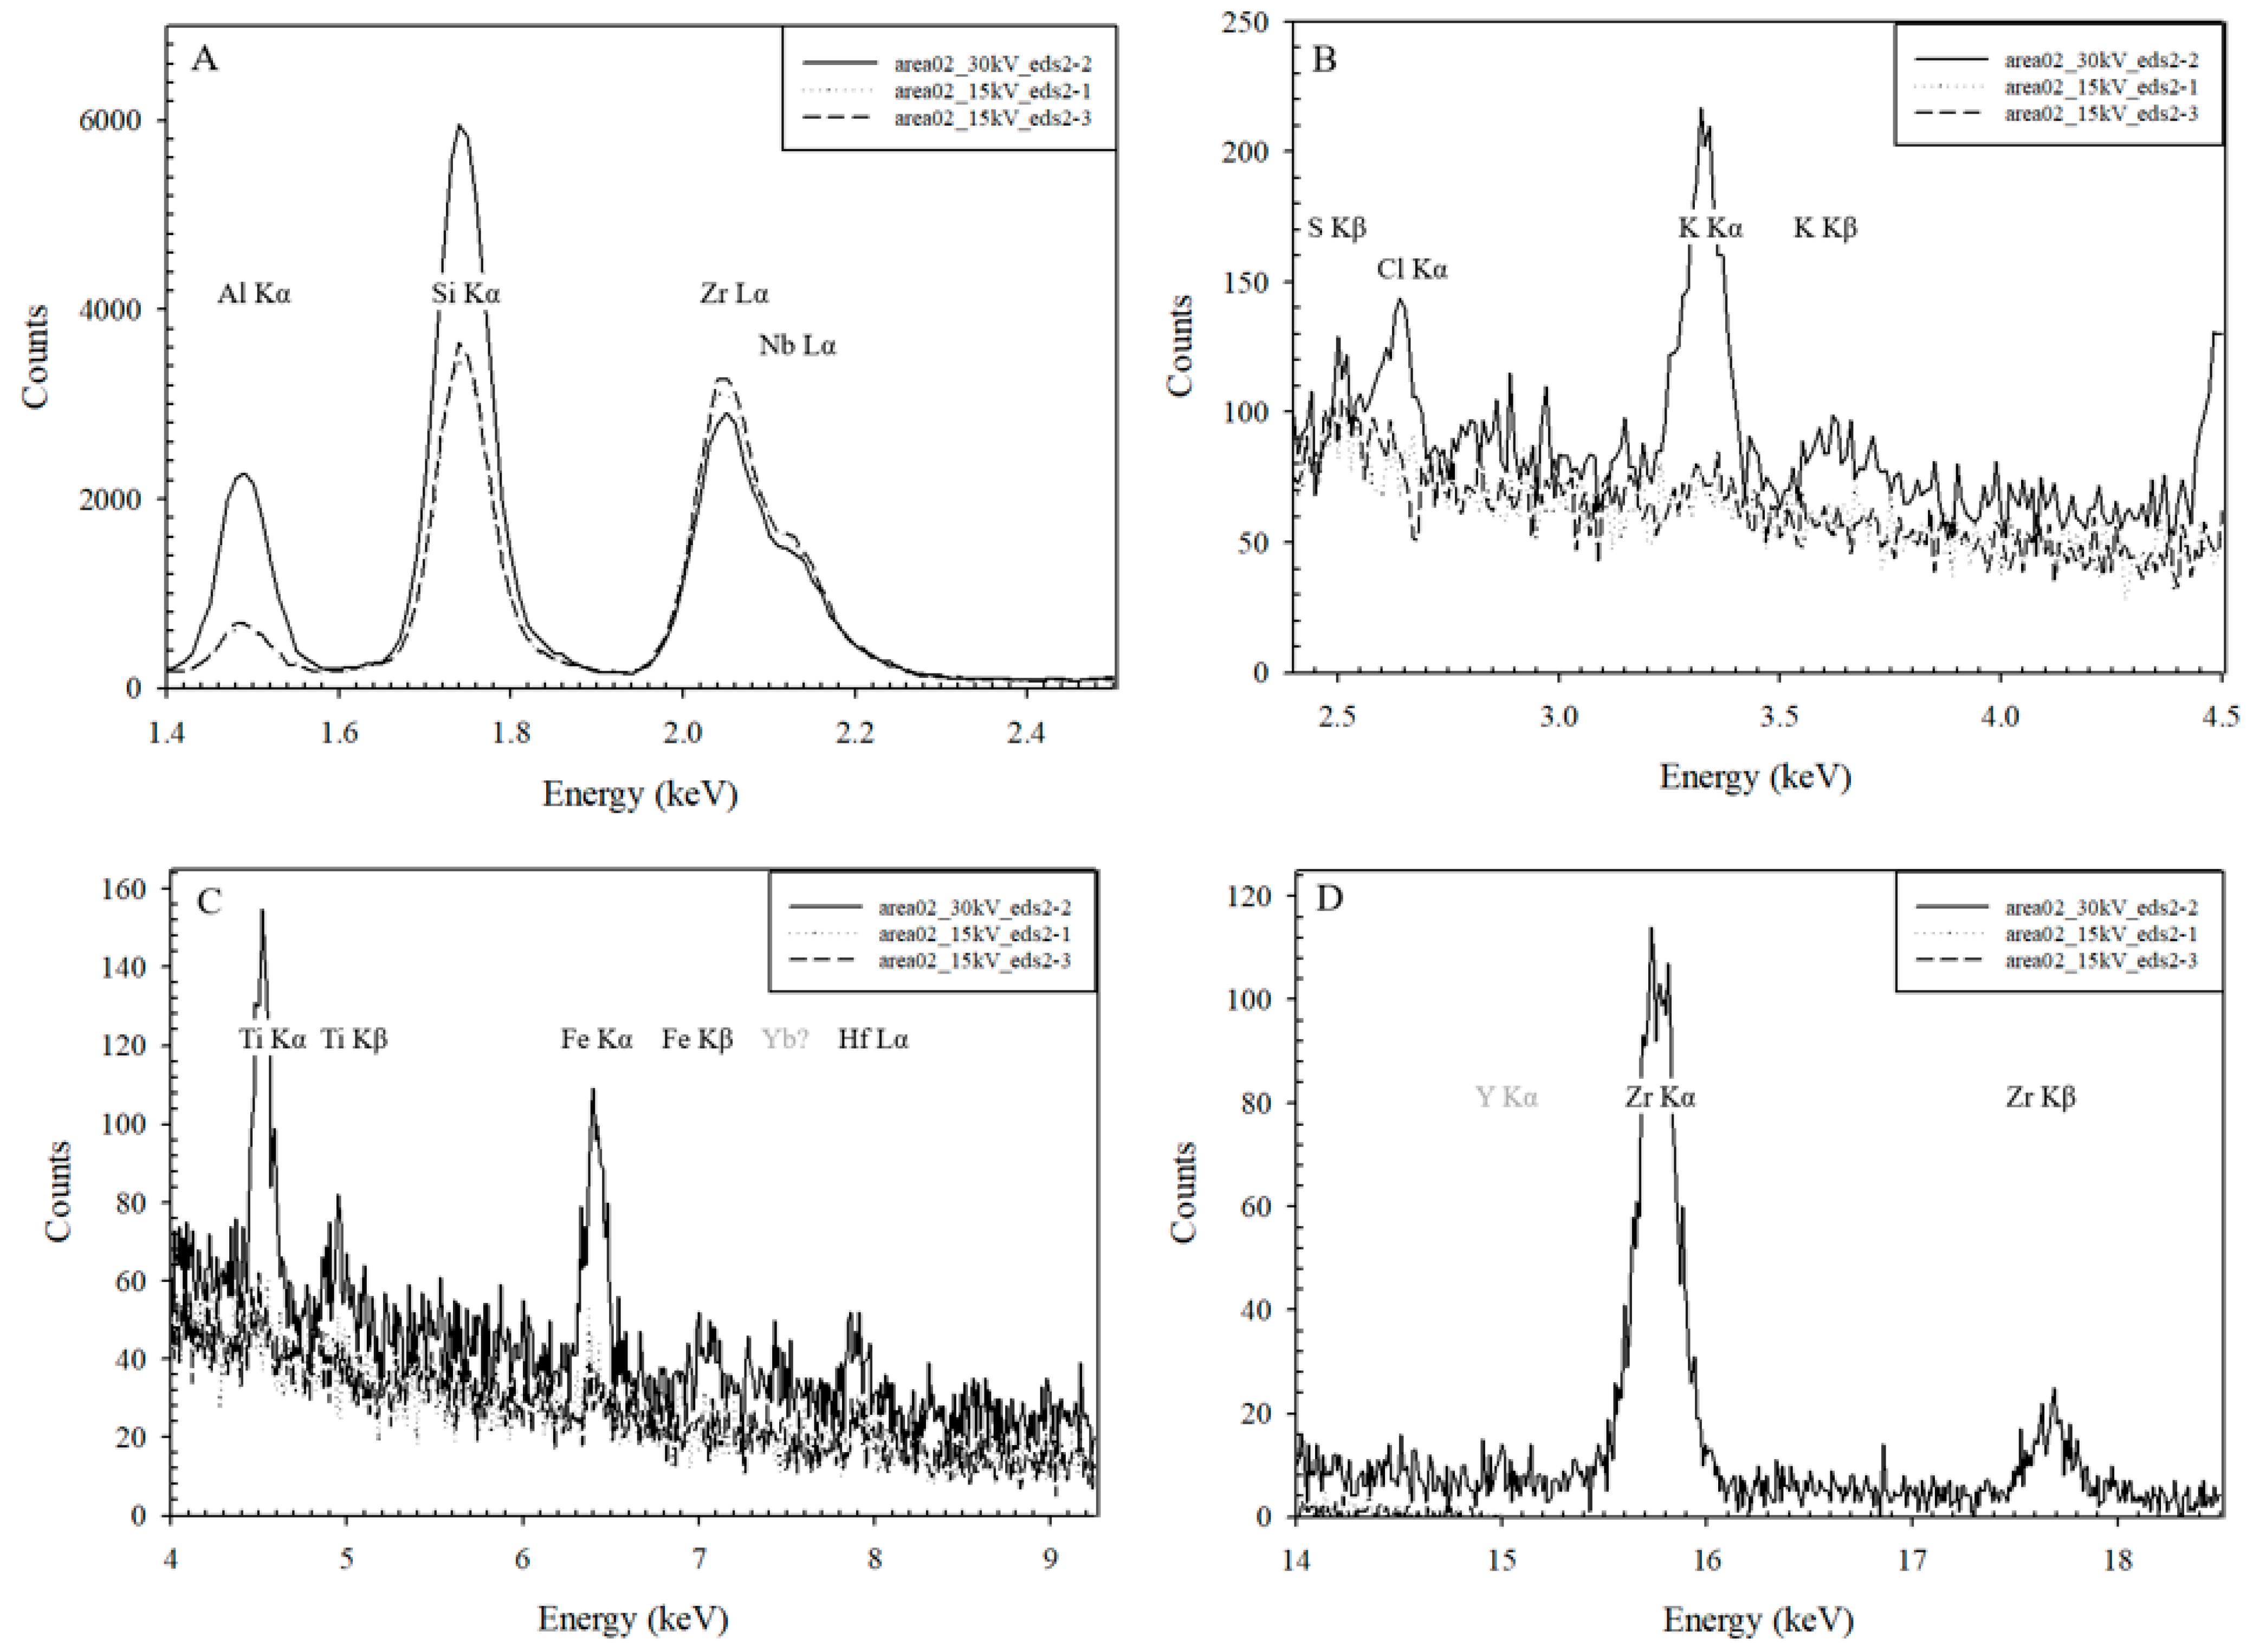
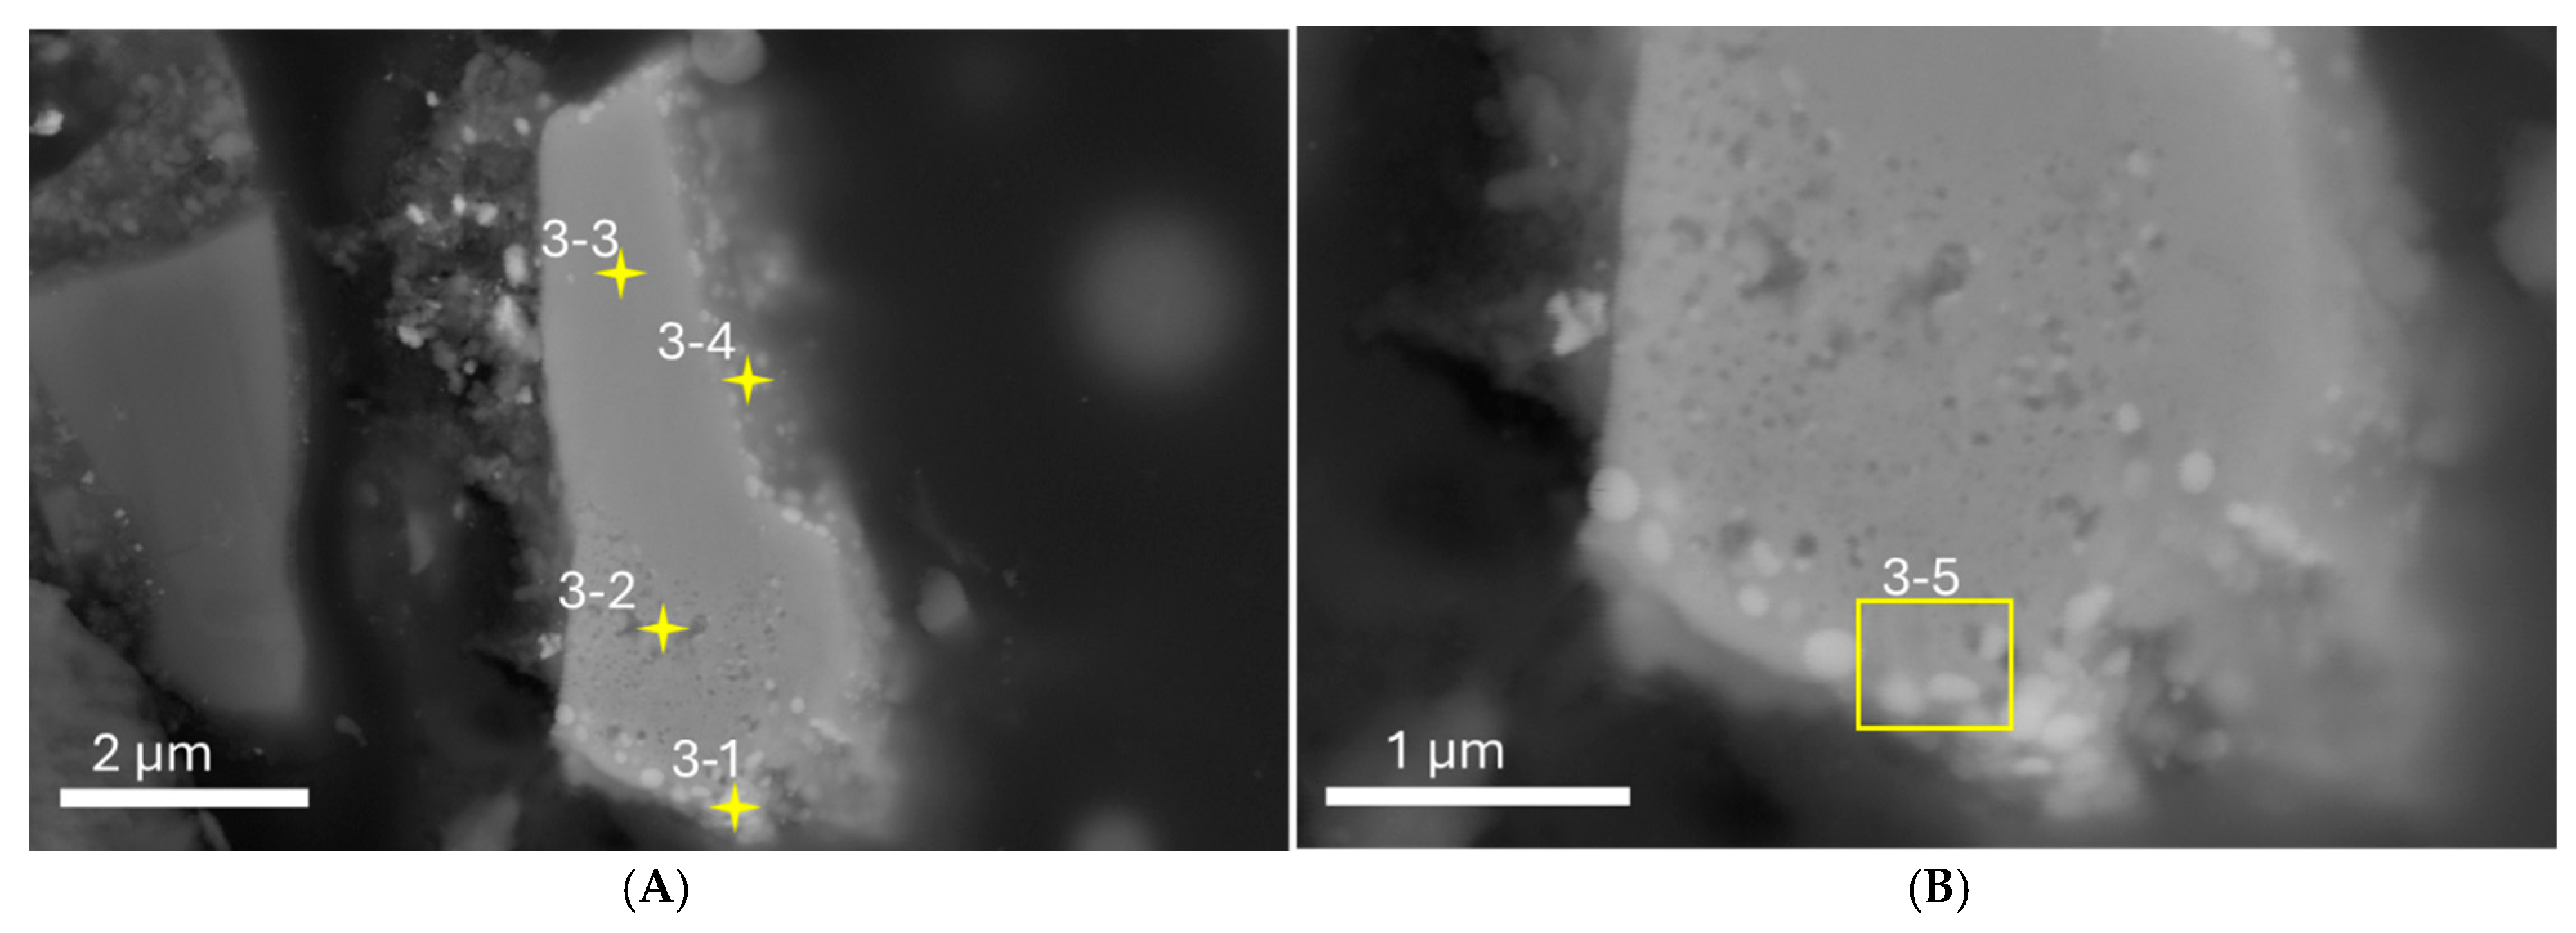
3.2. TEM-EDS
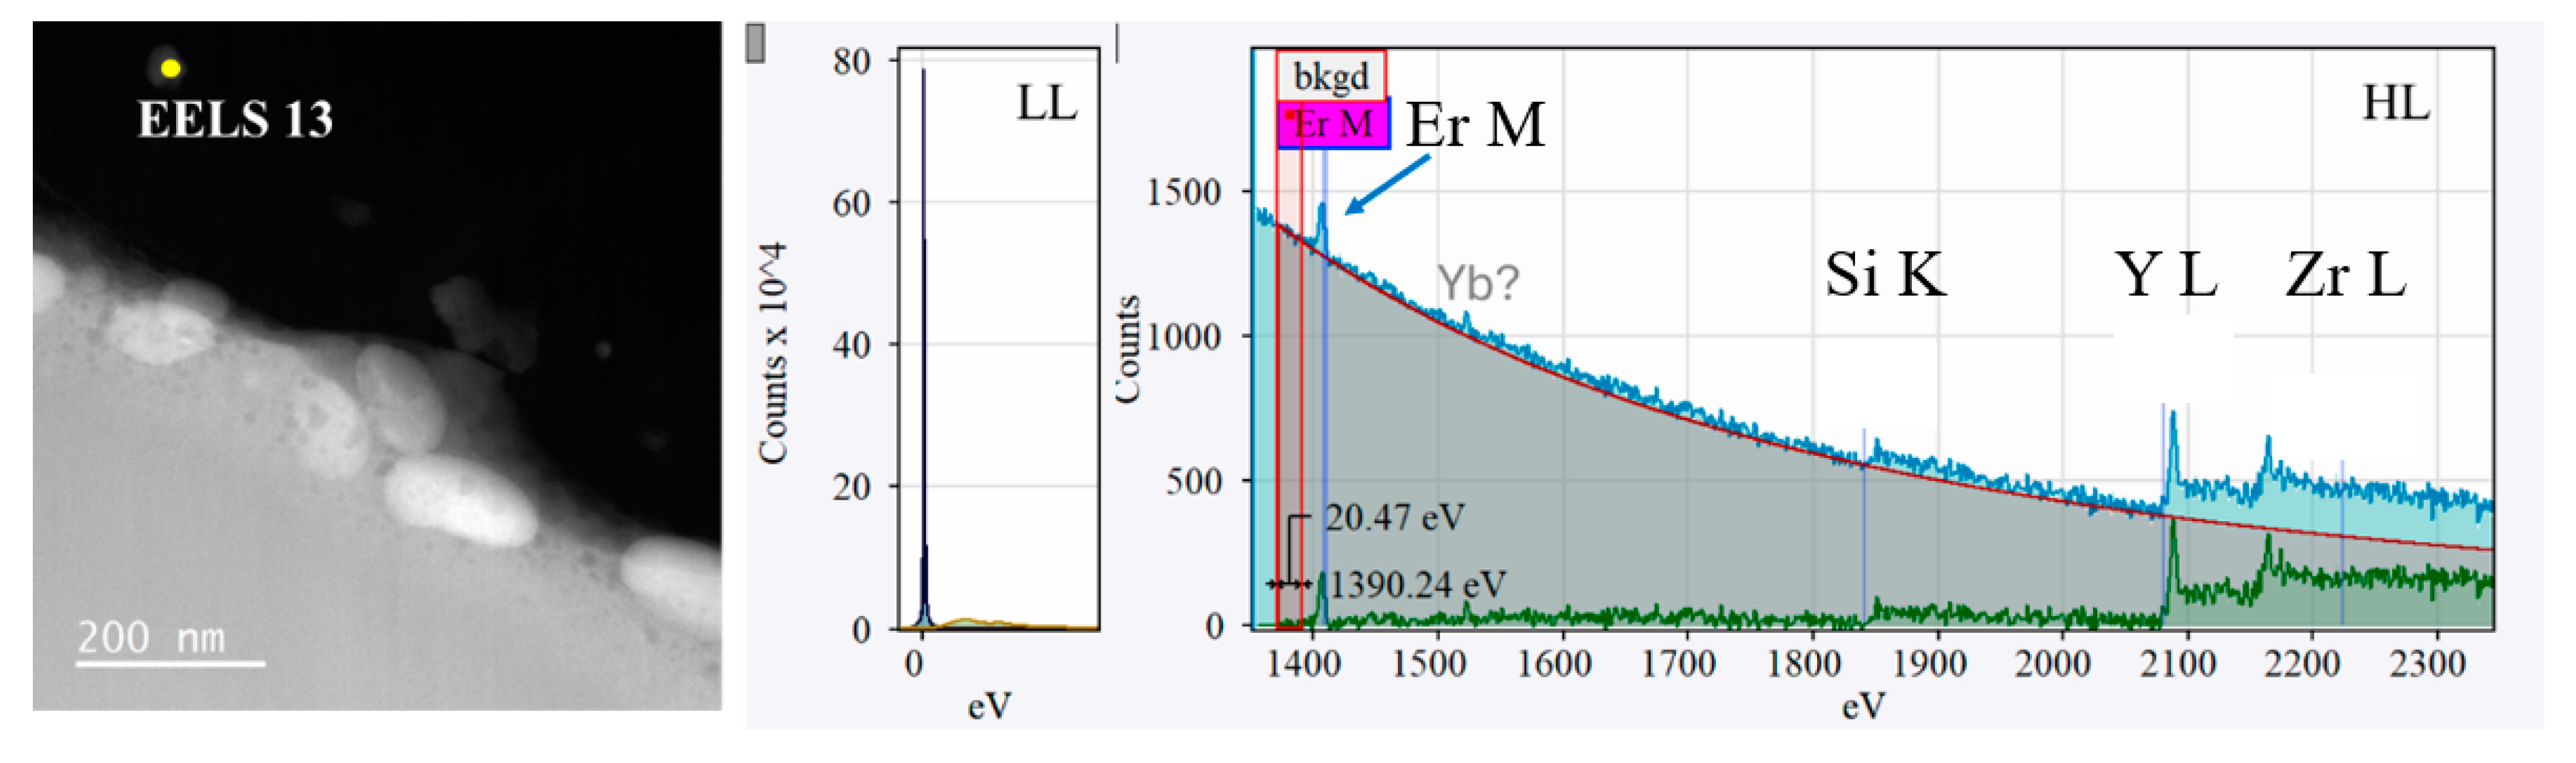
3.3. EELS
4. Discussion
5. Conclusions
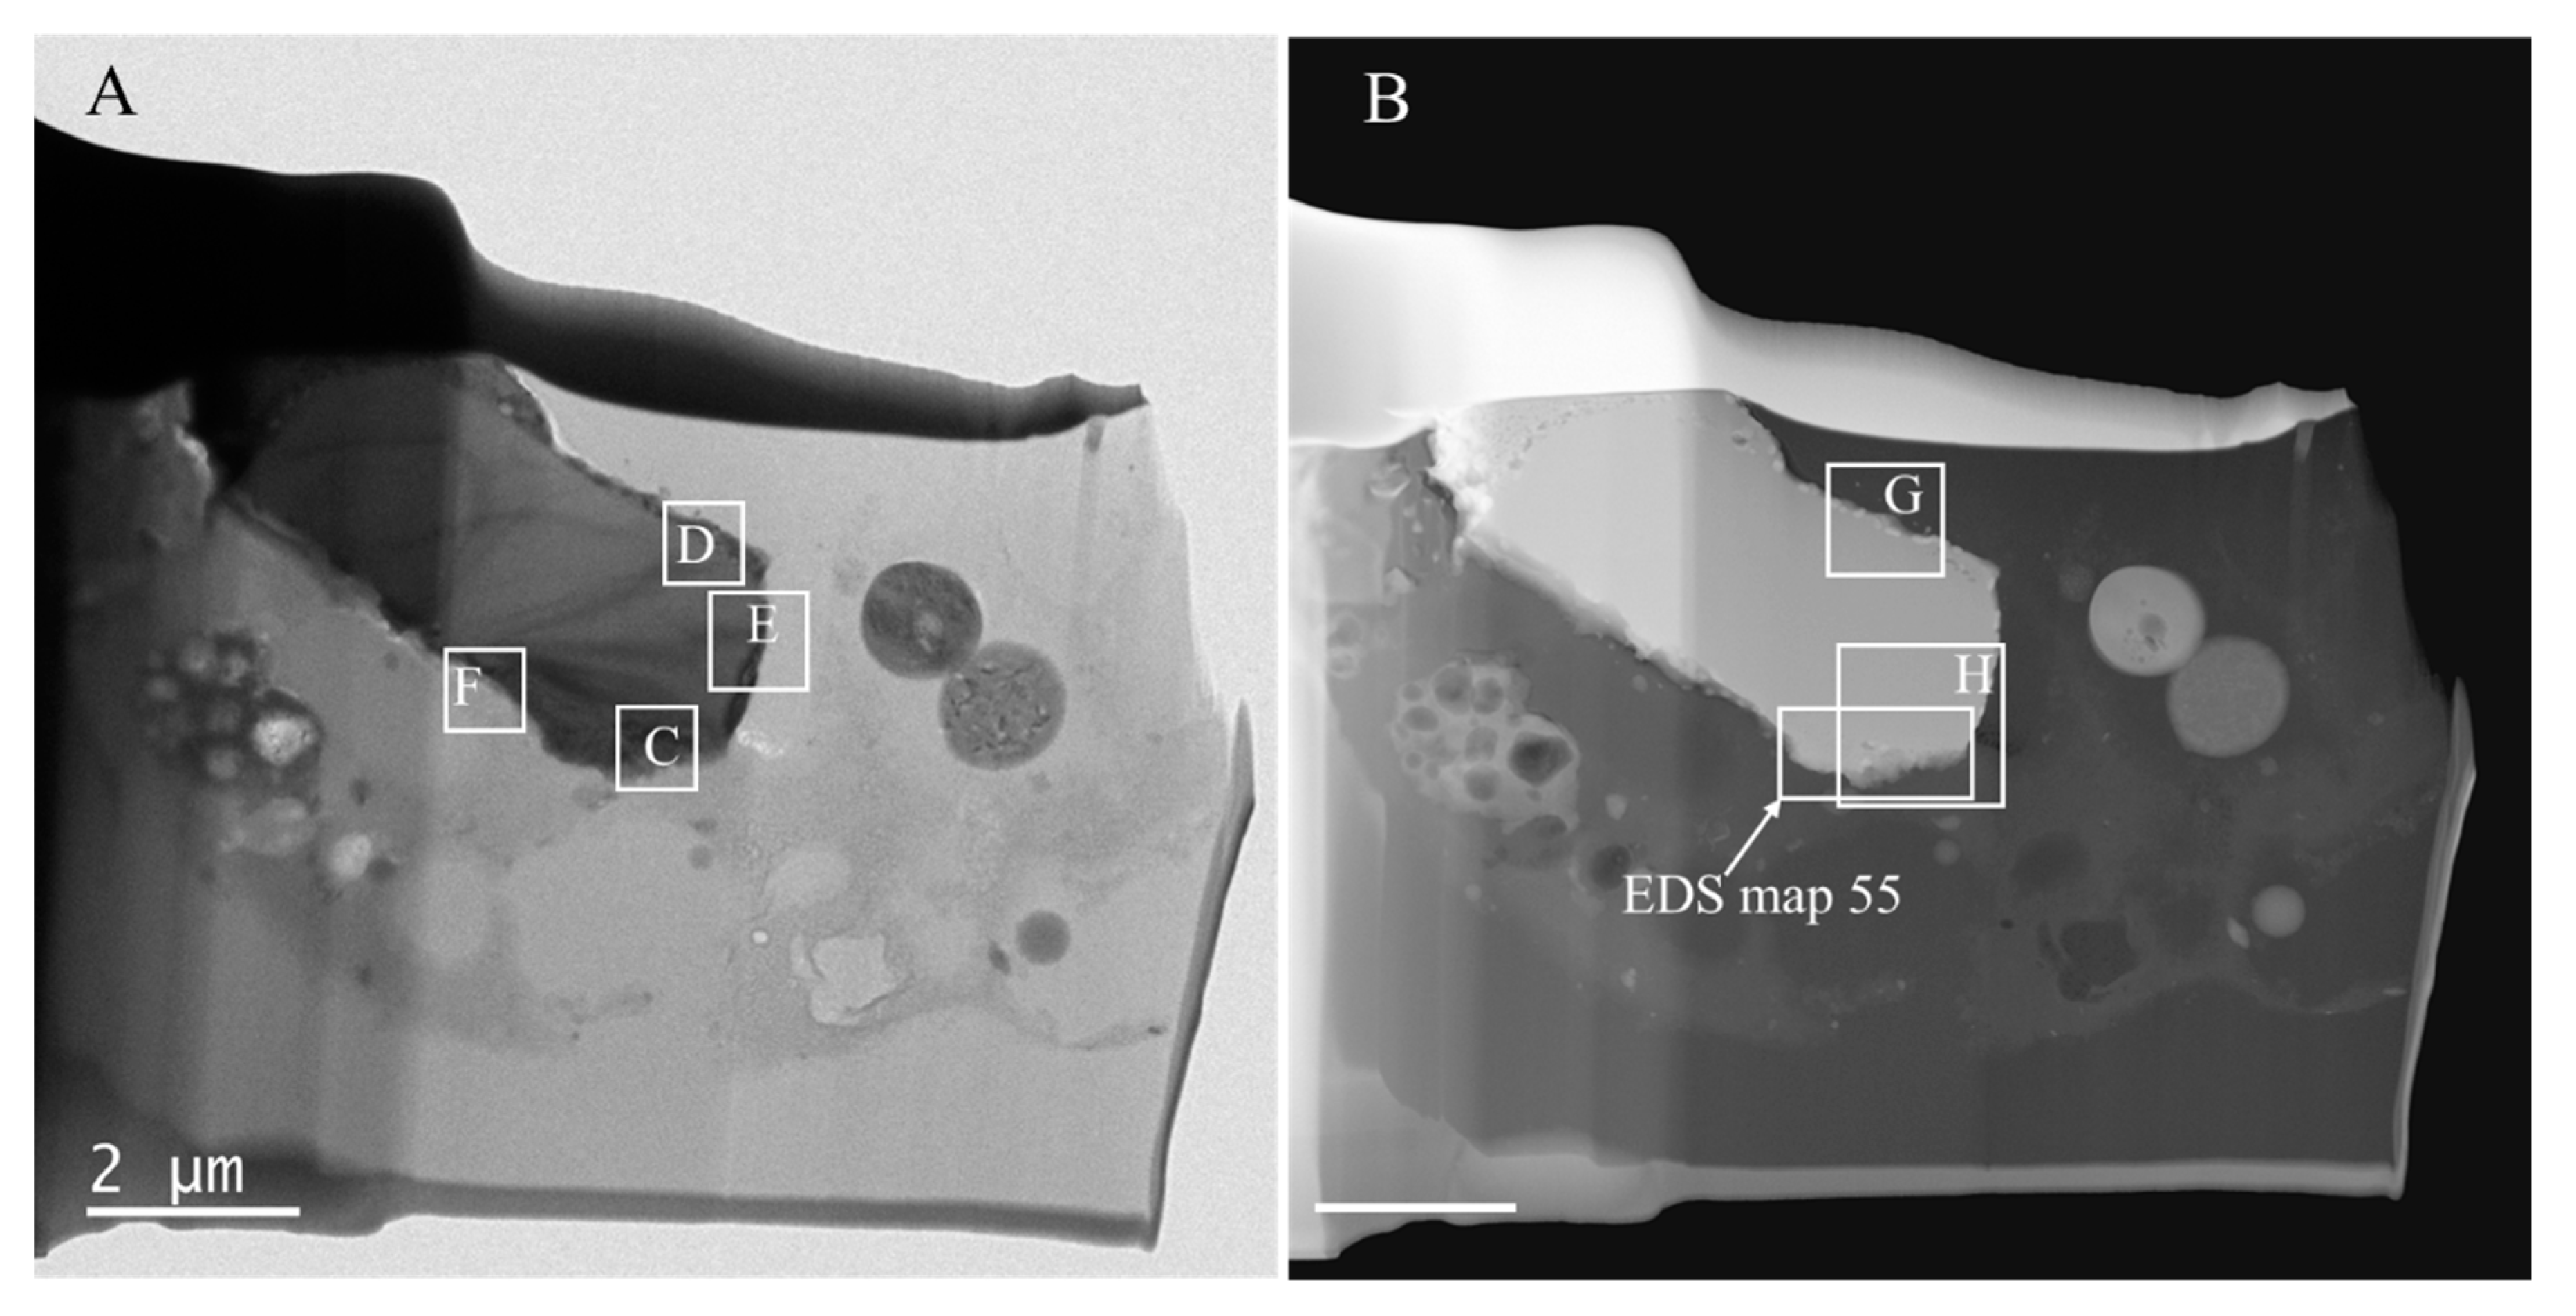
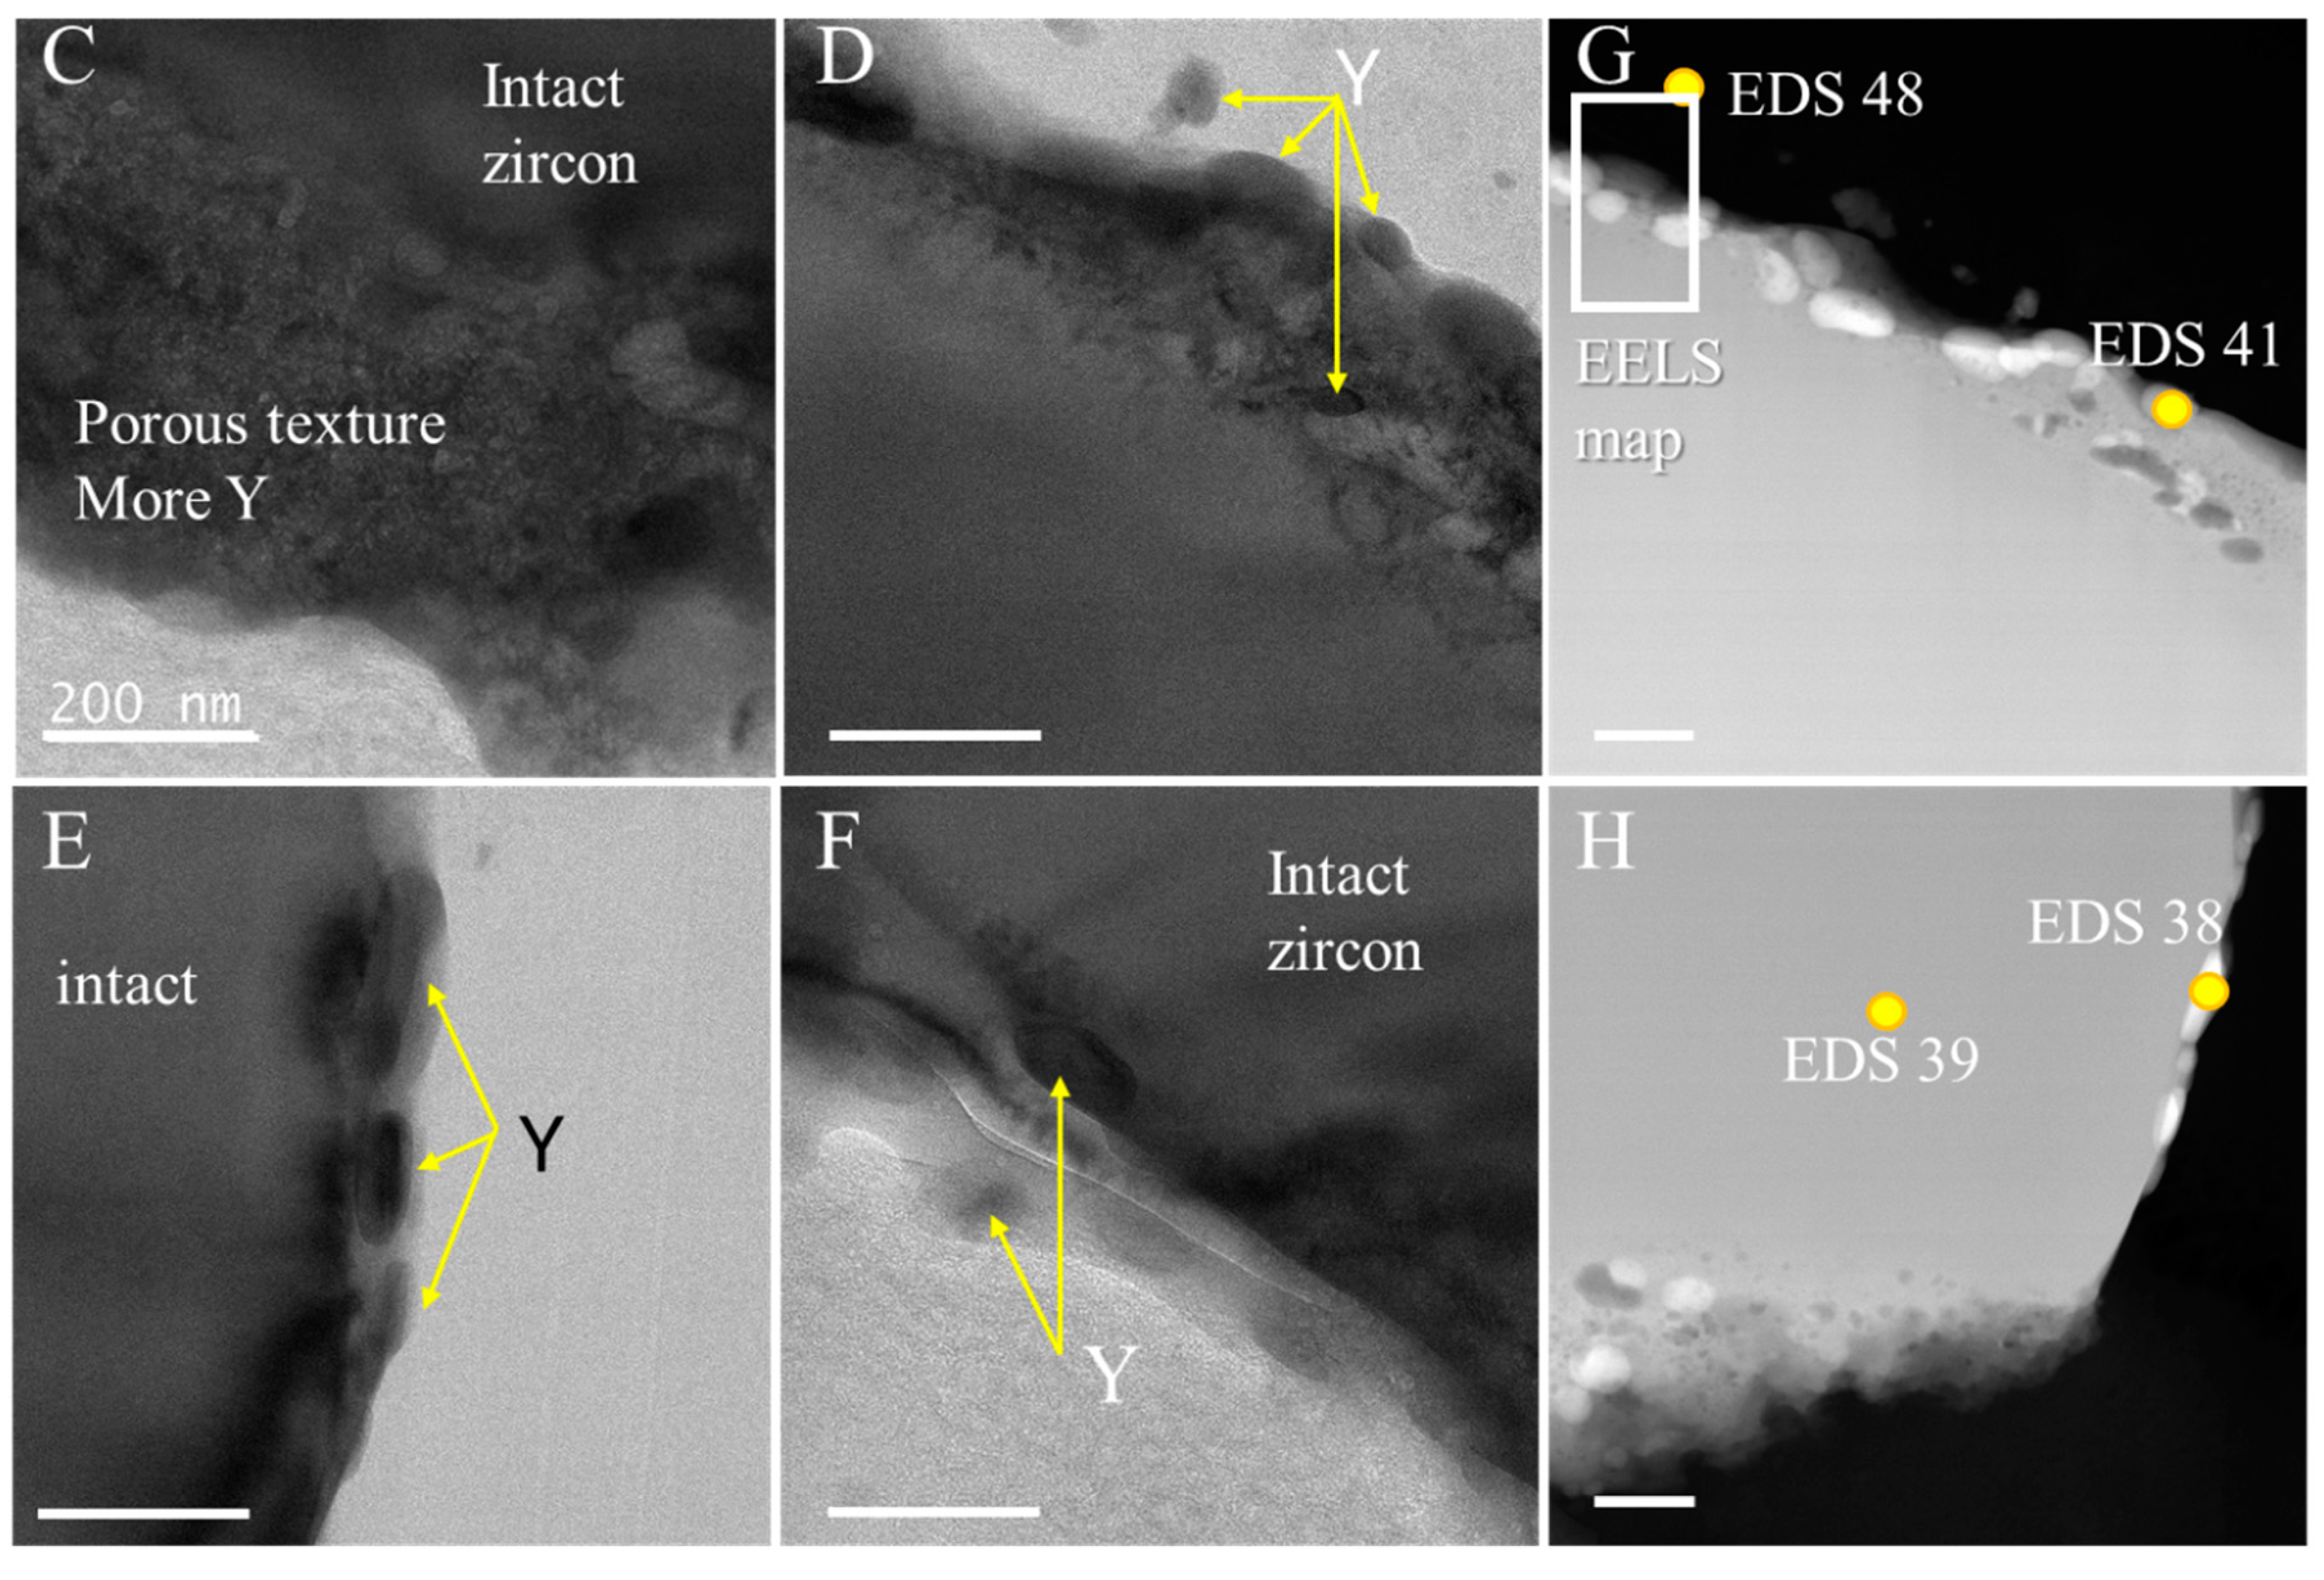
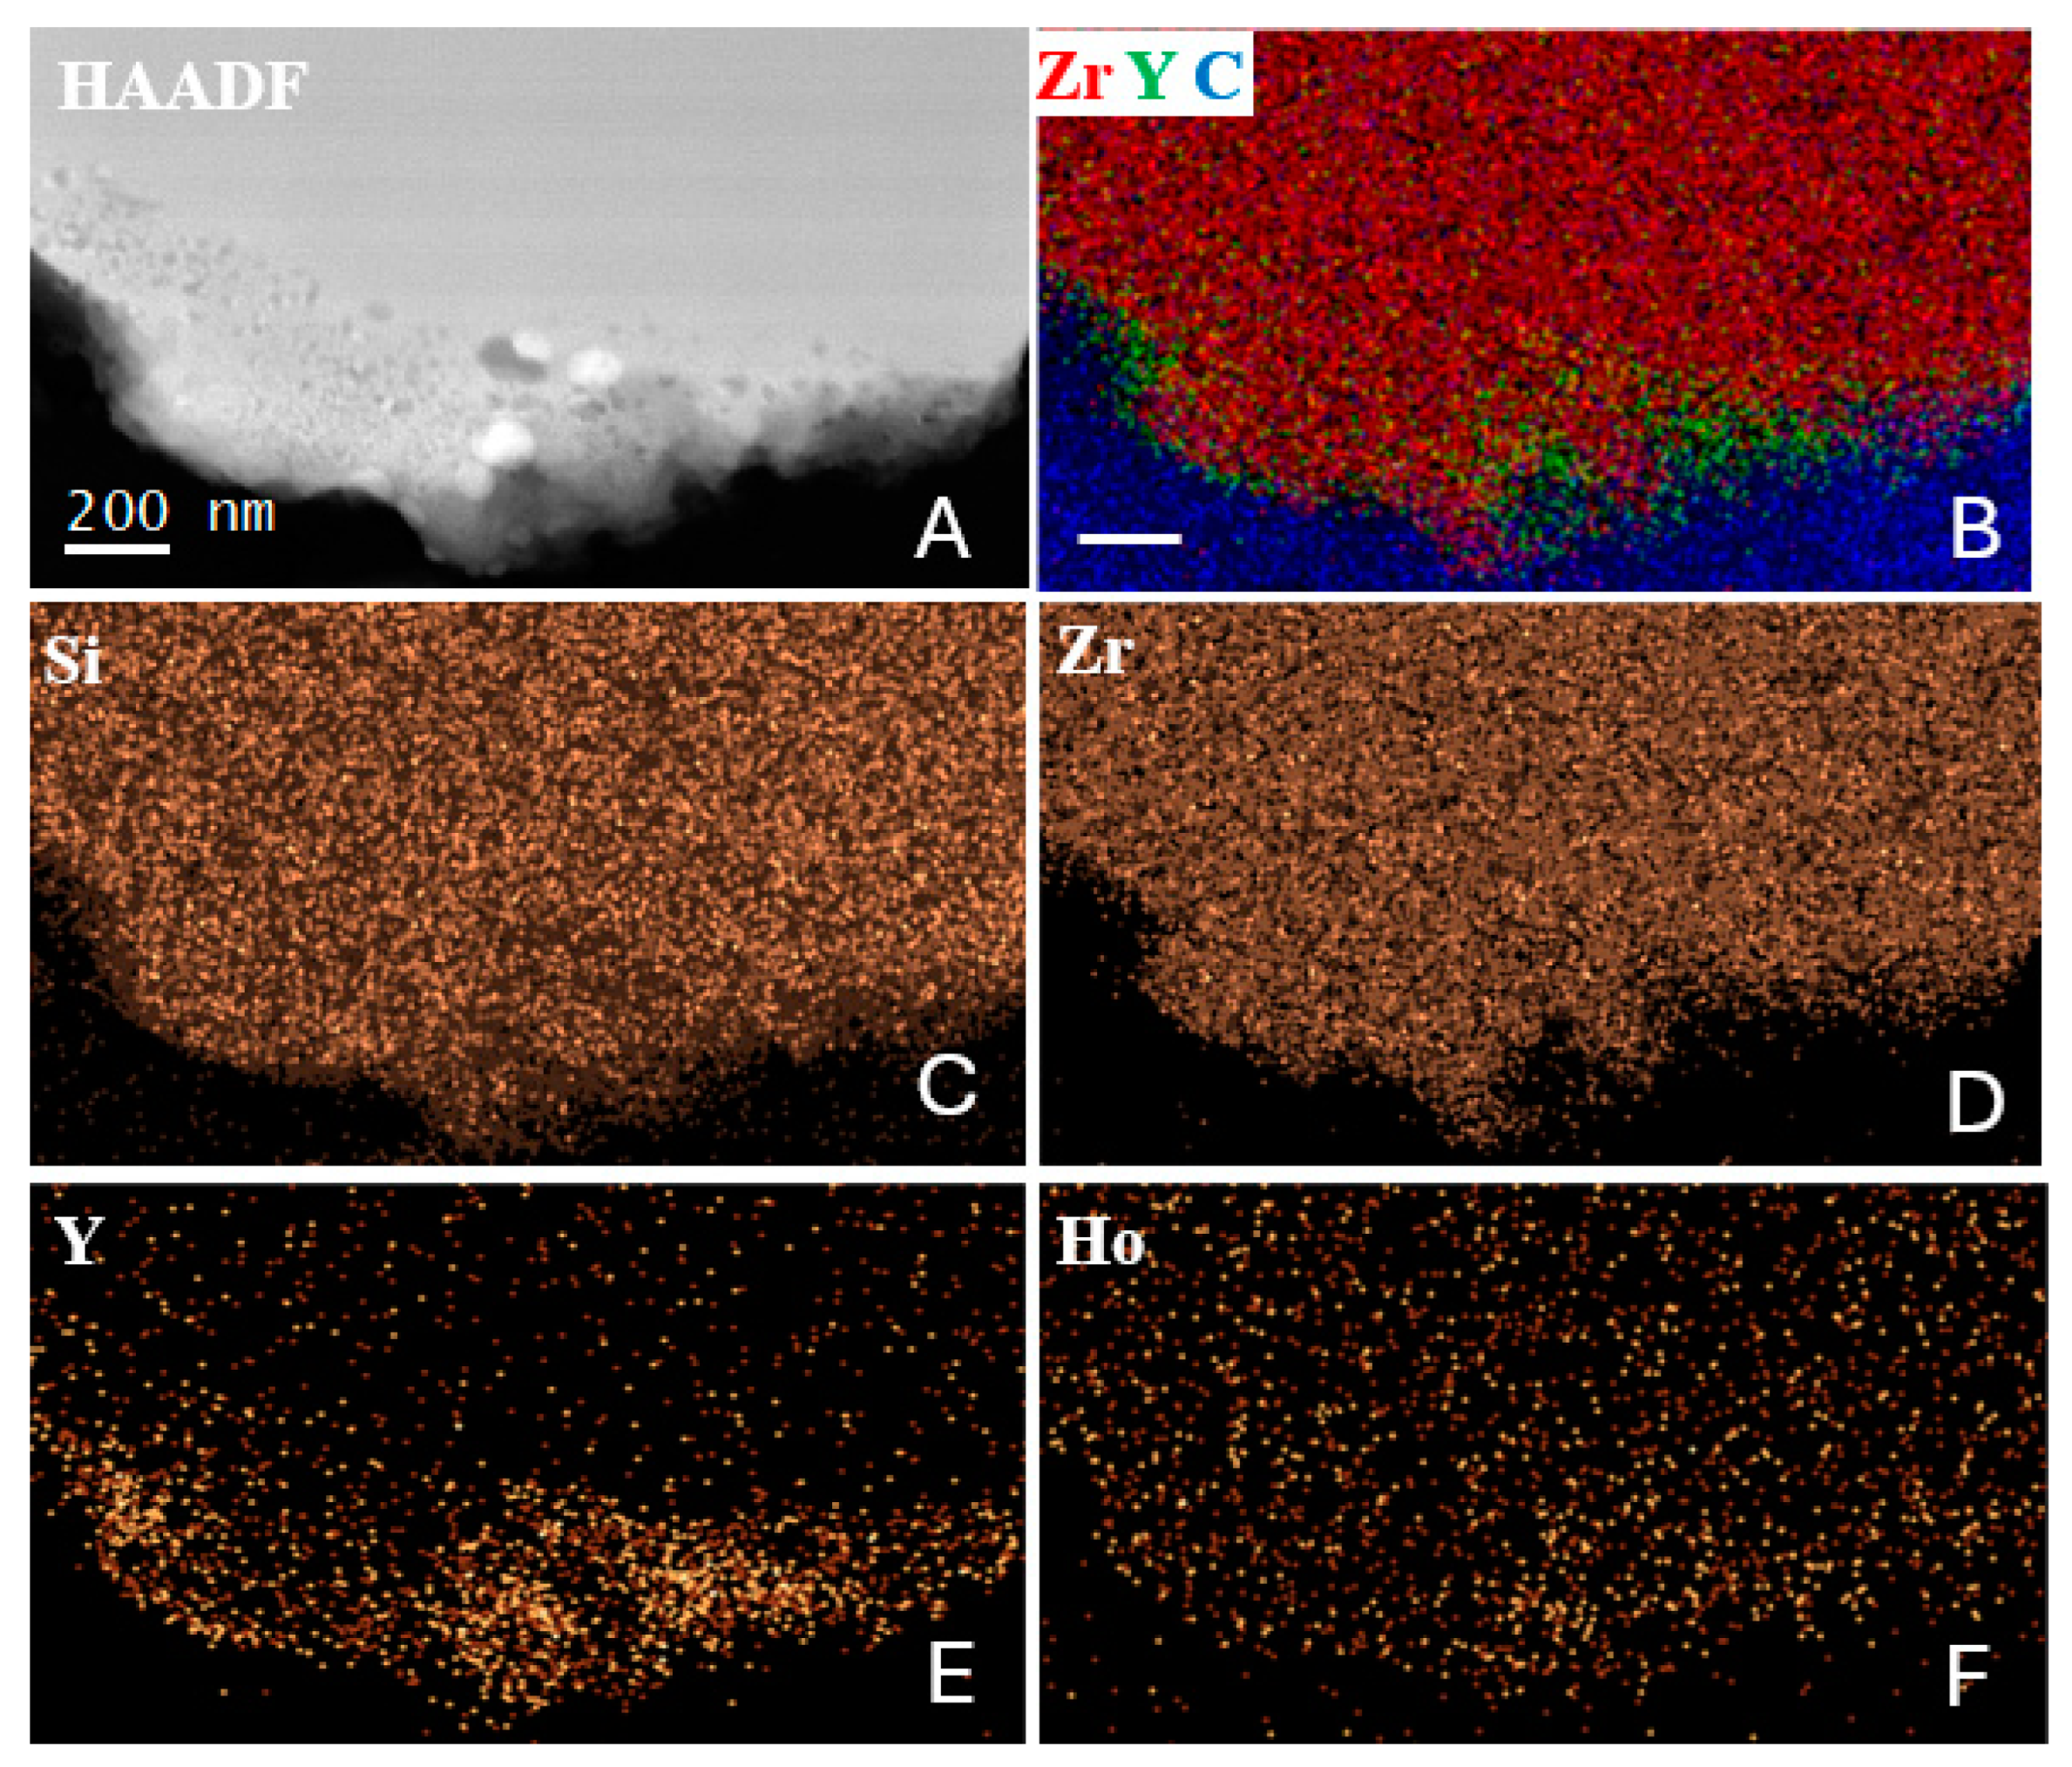
- TEM-EDS examination of the mineral assemblage showed that a solid zircon core was surrounded by a porous edge with Y- and heavy-REE-bearing minerals.
- The porous edge may be a consequence of the coal combustion-driven heating of metamict zircon and Y-bearing minerals with damaged crystal structures. Within the zircon core, even though some phase changes [12], the uniform structure of the mineral suggests that the zircon mineralogy remained unchanged.
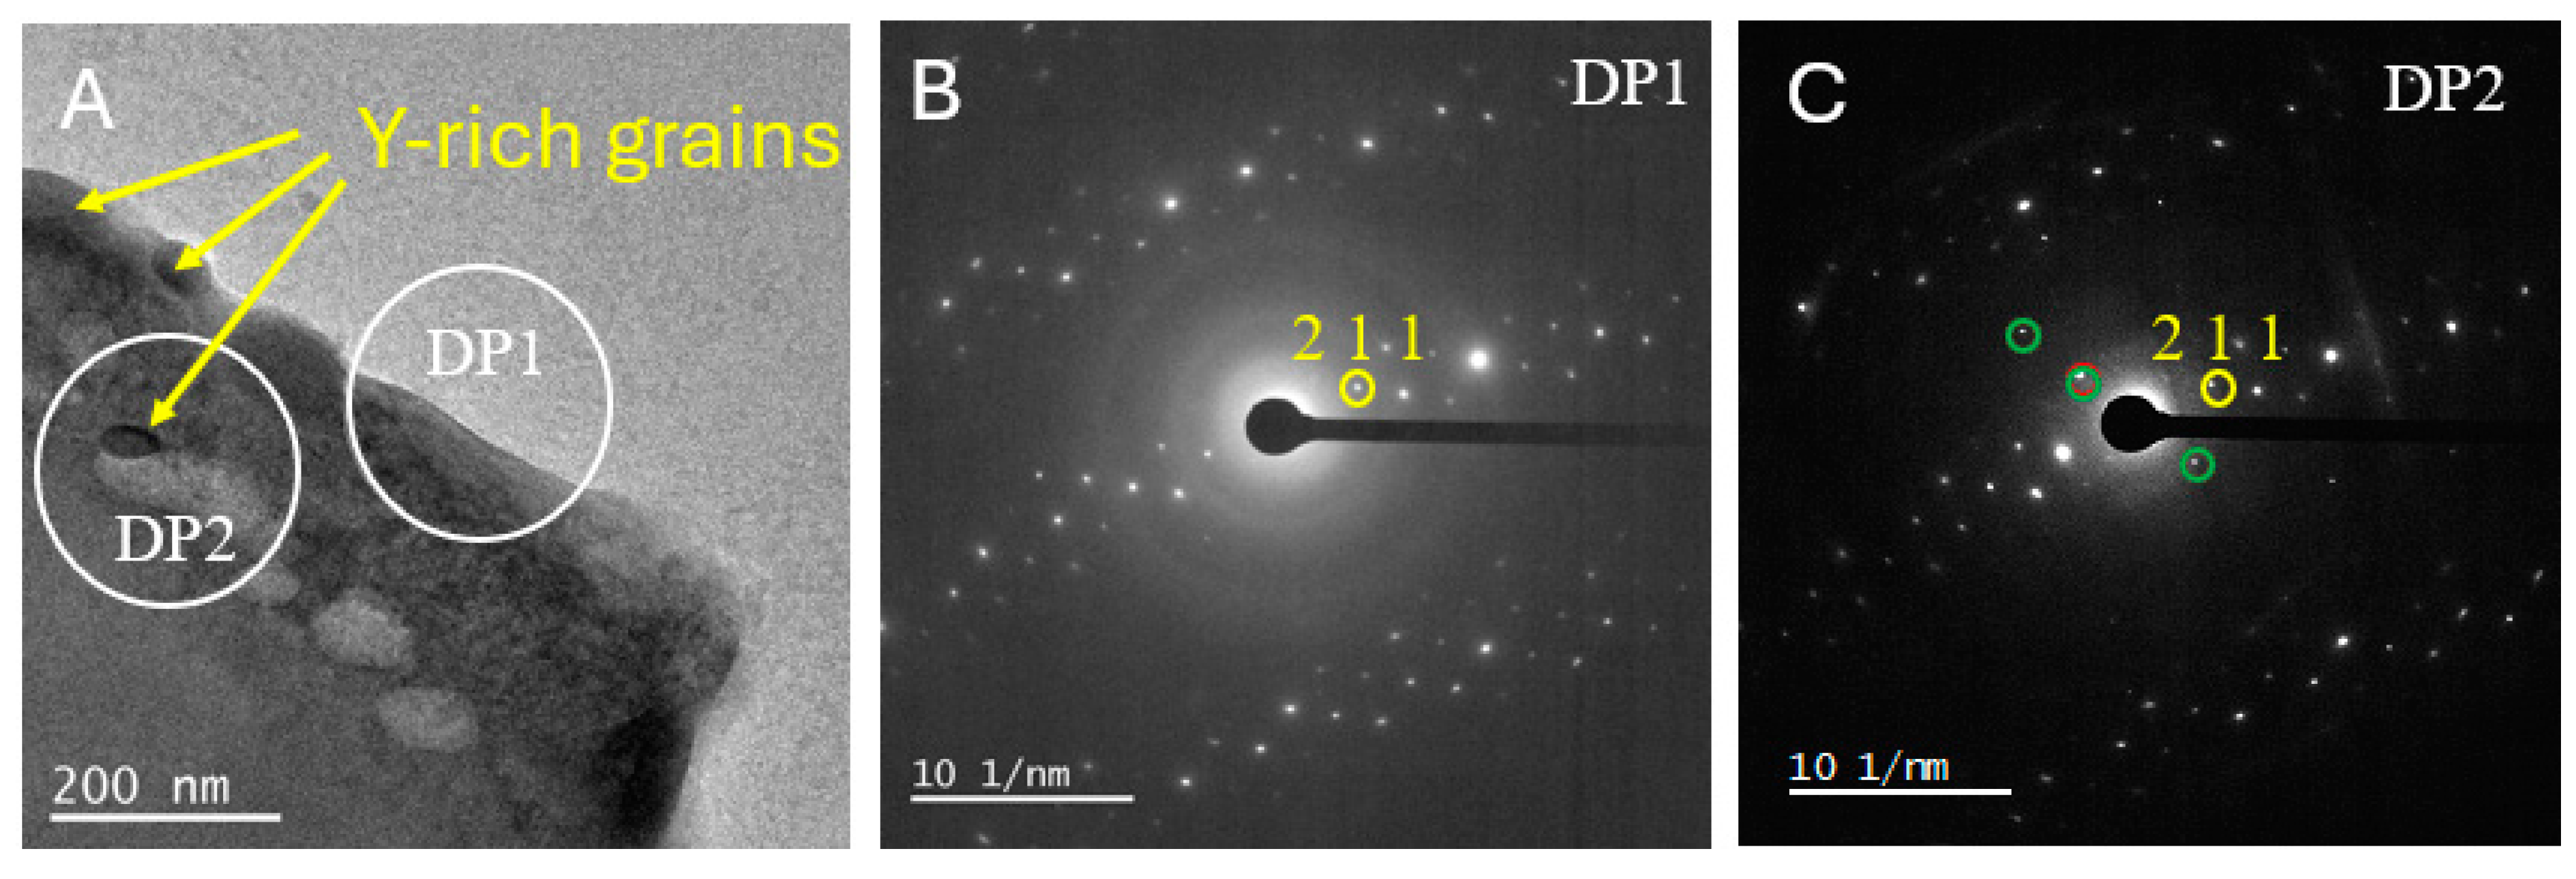
- In spite of the potential damage to the mineral crystallinity in the metamict rim of the zircon, minerals, including zircon, are present. The SAED mineralogy of very fine minerals was not definitive, but the diffraction patterns point towards the presence of fergusonite (YNbO4) and yttriaite (Y2O3).
- Not inconsequential to the fate of zircons and the associated minerals in the coal-fired boiler is their origin. Zircons, having a detrital and/or volcanic source, are inherited from the feed coal. In some cases, the zircons in the coal developed over the course of multiple generations, with the core mineral serving as the nuclei for the successive growth of new layers. In the case of the minerals under investigation here, it is proposed that the fergusonite–zircon–yttriaite–baddeleyite (?) rind surrounding the zircon contained small amounts of radionuclides (although none were seen in significant amounts in the EDS study), which, upon decay, damaged the structure of the minerals, leading to the porosity of the mineral aggregates upon heating and the abrading of mineral assemblages in the turbulence of the gas/particle mix in the boiler. The abraded particles are collectively part of the fly ash, but they are no longer attached to the original zircon grains.
Supplementary Materials
Author Contributions
Funding
Data Availability Statement
Conflicts of Interest
References
- Mills, S. Rare Earth Elements—Recovery from Coal-Based Materials; ICSC/334; International Centre for Sustainable Carbon: London, UK, 2024; p. 96. [Google Scholar]
- Hower, J.C.; Kolker, A.; Hsu-Kim, H.; Plata, D.L. Rare earth elements in coal combustion fly ash and their potential recovery. In Rare Earth Elements: Sustainable Processing, Purification and Recovery; Karamalidis, A.K., Eggert, R.G., Eds.; American Geophysical Union Special Publication; John Wiley & Sons, Inc.: Washington, DC, USA, 2025; Volume 79, pp. 25–71. [Google Scholar]
- US Department of Energy. Critical Minerals and Materials Program: Project Portfolio. 2023. Available online: https://netl.doe.gov/sites/default/files/2024-04/Final%202023%20CM%20Project%20Portfolio%20032924.pdf (accessed on 16 December 2024).
- US Department of Energy. Project Selections for FOA 3077: Regional Scale Collaboration to Facilitate a Domestic Critical Minerals Future: Carbon Ore, Rare Earth, and Critical Minerals (CORE-CM) Initiative—Round 1. 2025. Available online: https://www.energy.gov/fecm/project-selections-foa-3077-regional-scale-collaboration-facilitate-domestic-critical-minerals (accessed on 23 January 2025).
- Hower, J.C.; Cantando, E.; Eble, C.F.; Copley, G.C. Characterization of stoker ash from the combustion of high-lanthanide coal at a Kentucky bourbon distillery. Int. J. Coal Geol. 2019, 213, 103260. [Google Scholar] [CrossRef]
- Berti, D.; Groppo, J.G.; Joshi, P.; Preda, D.V.; Gamliel, D.P.; Beers, T.; Schrock, M.; Hopps, S.D.; Morgan, T.D.; Zechmann, B.; et al. Electron microbeam investigations of the spent ash from the pilot-scale acid extraction of rare earth elements from a beneficiated Kentucky fly ash. Int. J. Coal Geol. 2025, 303, 104738. [Google Scholar] [CrossRef]
- Hower, J.C.; Groppo, J.G.; Hsu-Kim, H.; Taggart, R.K. Signatures of Rare Earth Element distributions in fly ash derived from the combustion of Central Appalachian, Illinois, and Powder River basin coals. Fuel 2021, 301, 121048. [Google Scholar] [CrossRef]
- Liu, J.; Dai, S.; Berti, D.; Eble, C.F.; Dong, M.; Gao, Y.; Hower, J.C. Rare earth and critical element chemistry of the volcanic ash-fall parting in the Fire Clay coal, eastern Kentucky, USA. Clays Clay Miner. 2023, 71, 309–339. [Google Scholar] [CrossRef]
- Hay, D.C.; Dempster, T.J.; Lee, M.R.; Brown, D.J. Anatomy of a low temperature zircon outgrowth. Contrib. Mineral. Petrol. 2010, 159, 81–92. [Google Scholar] [CrossRef]
- Drost, K.; Wirth, R.; Košler, J.; Jørgensen, H.F.; Ntaflos, T. Chemical and structural relations of epitaxial xenotime and zircon substratum in sedimentary and hydrothermal environments: A TEM study. Contrib. Mineral. Petrol. 2013, 165, 737–756. [Google Scholar] [CrossRef]
- Berti, D.; Slowey, N.C.; Yancey, T.E.; Deng, Y. Rare earth nanominerals in bentonite deposits of the Eocene Texas coastal plains. Appl. Clay Sci. 2022, 216, 106373. [Google Scholar] [CrossRef]
- Quercia, G.; Perera, Y.; Tovar, H.; Rodriguez, E. Thermal degradation of zirconium silicate (ZrSiO4) ferrules. Acta Microsc. 2007, 16, 205–206. [Google Scholar]
- Butterman, W.C.; Foster, W.R. Zircon stability and the ZrO2-SiO2 phase diagram. Am. Mineral. 1967, 52, 880–885. [Google Scholar]
- Salje, E.K.H.; Chrosch, J.; Ewing, R.C. Is ‘metamictization’ of zircon a phase transition? Am. Mineral. 1999, 84, 107–1116. [Google Scholar] [CrossRef]
- Chen, R.; Siidra, O.I.; Firsova, V.A.; Ugolkov, V.L.; Vlasenko, N.S.; Bocharov, V.N.; Arevalo-Lopez, A.M.; Colmont, M.; Tokarev, I.V. Thermal evolution of the metamict fergusonite-(Y). Phys. Chem. Miner. 2024, 51, 8. [Google Scholar] [CrossRef]
- Siégel, C.; Bryan, S.E.; Allen, C.M.; Gust, D.A. Use and abuse of zircon-based thermometers: A critical review and a recommended approach to identify antecrystic zircons. Earth Sci. Rev. 2018, 176, 87–116. [Google Scholar] [CrossRef]
- Hikichi, Y.; Nomura, T. Melting temperatures of monazite and xenotime. J. Am. Ceram. Soc. 1987, 70, C252–C253. [Google Scholar] [CrossRef]
- Roth, R.S. (Ed.) Phase Equilibria Diagrams, Vol. XI: Oxides; American Ceramic Society: Westerville, OH, USA, 1995; p. 487. [Google Scholar]
- Fabrichnaya, O.; Wang, C.; Zinkevich, M.; Aldinger, F.; Levi, C.G. Phase equilibria and thermodynamic properties of the ZrO2-GdO1.5-YO1.5 system. J. Phase Equilibria Diffus. 2005, 26, 591–604. [Google Scholar] [CrossRef]
- Hower, J.C.; Groppo, J.G.; Joshi, P.; Preda, D.V.; Gamliel, D.P.; Mohler, D.T.; Wiseman, J.D.; Hopps, S.D.; Morgan, T.D.; Beers, T.; et al. Distribution of Lanthanides, Yttrium, and Scandium in the pilot-scale beneficiation of fly ashes derived from eastern Kentucky coals. Minerals 2020, 10, 105. [Google Scholar] [CrossRef]
- Joshi, P.B.; Preda, D.V.; Skyler, D.A.; Tsinberg, A.; Green, B.D.; Marinelli, W.J. Recovery of Rare Earth Elements and Compounds from Coal Ash. U.S. Patent 8,968,688, 2015. Available online: https://patentimages.storage.googleapis.com/b1/76/40/96ade5301b206b/US8968688.pdf (accessed on 20 March 2025).
- Hower, J.C.; Groppo, J.G.; Jewell, R.F.; Wiseman, J.D.; Duvallet, T.Y.; Oberlink, A.E.; Hopps, S.D.; Morgan, T.D.; Henke, K.R.; Joshi, P.; et al. Distribution of Rare earth elements in the pilot-scale processing of fly ashes derived from eastern Kentucky coals: Comparisons of the feed and processed ashes. Fuel 2021, 295, 120562. [Google Scholar] [CrossRef]
- Scott, J.; Thomas, P.J.; MacKenzie, M.; McFadzean, S.; Wilbrink, J.; Craven, A.J.; Nicholson, W.A.P. Near-simultaneous dual energy range EELS spectrum imaging. Ultramicroscopy 2008, 108, 1586. [Google Scholar] [CrossRef] [PubMed]
- Malis, T.; Cheng, S.C.; Egerton, R.F. EELS log ratio technique for specimen-thickness measurement in the TEM. J. Electron Microsc. Tech. 1988, 8, 193. [Google Scholar] [CrossRef] [PubMed]
- Stroud, R.M.; Singerling, S.A. Fundamentals of transmission electron microscopy in earth and planetary sciences. In Treatise on Geochemistry, 3rd ed.; Elsevier: Amsterdam, The Netherlands, 2025; Volume 8, pp. 861–881. [Google Scholar]
- Marks, S. What Makes TEM EDS Different from SEM EDS? Oxford Instruments 2022. Available online: https://www.oxinst.com/blogs/what-makes-tem-eds-different-from-sem-eds (accessed on 27 January 2025).
- Ramdohr, P. The Ore Minerals and Their Intergrowths, 2nd ed.; Pergamon: Oxford, UK, 1980; p. 1207. [Google Scholar]
- Webmineral.com. 2025. Available online: https://www.webmineral.com/ (accessed on 28 January 2025).
- Minedat.org. 2025. Available online: https://www.mindat.org/ (accessed on 28 January 2025).


Disclaimer/Publisher’s Note: The statements, opinions and data contained in all publications are solely those of the individual author(s) and contributor(s) and not of MDPI and/or the editor(s). MDPI and/or the editor(s) disclaim responsibility for any injury to people or property resulting from any ideas, methods, instructions or products referred to in the content. |
© 2025 by the authors. Licensee MDPI, Basel, Switzerland. This article is an open access article distributed under the terms and conditions of the Creative Commons Attribution (CC BY) license (https://creativecommons.org/licenses/by/4.0/).
Share and Cite
Berti, D.; Groppo, J.G.; Joshi, P.; Preda, D.V.; Gamliel, D.P.; Beers, T.; Schrock, M.; Hopps, S.D.; Morgan, T.D.; Zechmann, B.; et al. Probing the Critical Element Chemistry of Coal-Combustion Fly Ash: Examination of Zircon and Associated Minerals from a Beneficiated Kentucky Fly Ash. Minerals 2025, 15, 461. https://doi.org/10.3390/min15050461
Berti D, Groppo JG, Joshi P, Preda DV, Gamliel DP, Beers T, Schrock M, Hopps SD, Morgan TD, Zechmann B, et al. Probing the Critical Element Chemistry of Coal-Combustion Fly Ash: Examination of Zircon and Associated Minerals from a Beneficiated Kentucky Fly Ash. Minerals. 2025; 15(5):461. https://doi.org/10.3390/min15050461
Chicago/Turabian StyleBerti, Debora, John G. Groppo, Prakash Joshi, Dorin V. Preda, David P. Gamliel, Todd Beers, Michael Schrock, Shelley D. Hopps, Tonya D. Morgan, Bernd Zechmann, and et al. 2025. "Probing the Critical Element Chemistry of Coal-Combustion Fly Ash: Examination of Zircon and Associated Minerals from a Beneficiated Kentucky Fly Ash" Minerals 15, no. 5: 461. https://doi.org/10.3390/min15050461
APA StyleBerti, D., Groppo, J. G., Joshi, P., Preda, D. V., Gamliel, D. P., Beers, T., Schrock, M., Hopps, S. D., Morgan, T. D., Zechmann, B., & Hower, J. C. (2025). Probing the Critical Element Chemistry of Coal-Combustion Fly Ash: Examination of Zircon and Associated Minerals from a Beneficiated Kentucky Fly Ash. Minerals, 15(5), 461. https://doi.org/10.3390/min15050461