Article

Influences of Alkali-Carbonate Melt on the Electrical Conductivity of Dunite—Origin of the High Conductivity Anomaly Within the Tanzanian Cratonic Mantle

Key Laboratory of Earth and Planetary Physics, Institute of Geology and Geophysics, Chinese Academy of Sciences, Beijing 100029, China
*
Author to whom correspondence should be addressed.
Minerals 2025, 15(5), 466; https://doi.org/10.3390/min15050466
Submission received: 25 March 2025 / Revised: 18 April 2025 / Accepted: 28 April 2025 / Published: 30 April 2025

Abstract

:
Archean craton comprises ancient and stable continental lithosphere, lacking significant seismic activity, magmatic activity, and tectonic deformation. Typically, its lithospheric mantle exhibits high electrical resistivity. However, within the Archean Tanzanian cratonic mantle, a high conductivity layer has been discovered, with an electrical conductivity of approximately 0.1 S/m. We conducted the electrical conductivity experiments on olivine aggregates containing sodium carbonate at the pressure of 3 GPa and the temperature ranging from 600 to 1200 °C. It was found that a very small amount of alkali-carbonate melt can significantly increase the electrical conductivity of dunite. The mass fraction of alkali-carbonate melt is less than 2.0 wt% in the highly conductive layer of the Tanzanian cratonic mantle. The permeability barriers made the melts preserve within the depth range of 80 to 120 km. Therefore, the presence of alkali-rich carbonate melts may be the best mechanism to explain the high conductivity anomaly in the lithospheric mantle of the Tanzanian craton. In contrast, the carbonate melts with high mobility migrated directly to shallow depths along fractures in the mobile belt/rift zone, leaving a dry and resistive residual mantle.

1. Introduction

Magnetotelluric (MT) surveys have found that at the margins of Archean cratons such as Kaapvaal, Zimbabwe, Rio de la Plata, Dharwar, and São Francisco, there exists a low velocity and high conductivity layer [1,2,3,4,5,6,7,8]. The genesis of these layers is often associated with tectonic and metasomatic activities that occurred after the formation of the cratons [6]. Interestingly, within the lithospheric mantle of the Archean Tanzanian and Slave cratons, as well as the Proterozoic Gawler craton, there also exists a highly conductive layer, with electrical conductivities reaching up to 0.1 S/m [9,10,11,12,13]. Water in nominal anhydrous minerals, hydrous minerals such as amphibole and phlogopite, and accessory minerals such as graphite and sulfides contribute to the increase in the electrical conductivity of peridotite in the asthenosphere, the subduction zones, and the mantle wedges [14,15,16,17,18]. None of these conductive substances can fully explain the high conductivity anomaly in the lithospheric mantle of the cratons, requiring either unreasonably high contents or introducing petrological challenges [9,19]. Additionally, the surface heat flow of the cratons is relatively low, ranging from 35 to 50 mWm−2 [20], indicating that the cratonic mantle is characterized by low temperature, low water content, high resistivity, and/or high seismic wave velocity. Therefore, how can we explain the high conductivity anomalies in the stable lithospheric mantle of the cratons?
The Tanzanian craton and adjacent areas serve as an ideal natural laboratory to study the evolution of the cratons, the controls of tectonic activity, and the causes of geophysical anomalies. The East African Rift, the most extensive and best-exposed active continental rift on Earth, is located on the eastern and western edges of the Tanzanian craton. The eastern branch of rifts intersects the Tanzanian craton and the Mozambique belt [8,11]. Within the rift areas, there is widespread outcrops of the carbonatite and low-SiO2 alkaline magmas, and in the Oldoinyo Lengai area, there exists the only active carbonatite volcano on Earth, with its carbonatite lava containing nearly 30 wt% Na2O [21,22]. Within the craton domain, there is a significant outcrop of kimberlites and volcanic rocks, which are rich in water, carbon, and alkaline elements [23,24,25]. The volcanic lavas within the craton are richer in potassium than those found in the rift. The enrichment of potassium is closely associated with the presence of phlogopite within mantle-derived xenoliths and is also linked to the carbonate present in magmas [23]. Additionally, the parental melts of kimberlite likely stem from carbonatite-like melts or reduced “proto-kimberlitic” melts at >300 km depth [26,27]. During ascent, these melts interact with oxidized mantle minerals. In the process, they may acquire CO2, CaO, H2O, K2O, and Na2O while simultaneously losing SiO2, thereby giving rise to alkali-rich carbonate melts or alkali-rich carbonated silicate melts within the cratonic mantle. In the central Tanzania craton, two-dimensional (2D) MT models indicate the presence of a high conductivity layer at depths below 100 km [12,28], while the latest three-dimensional (3D) MT models suggest the depth of this conductor is shifted vertically upwards (~50 km) compared to the 2D model [11]. The electrical conductivity within this layer ranges from 0.02 to 0.20 S/m. There is no low-velocity anomaly in the vicinity of the mantle conductor in the central Tanzanian craton [29,30,31]. Both 2D and 3D MT inversions also show that the Tanzanian cratonic mantle is more conductive and thicker compared to the Mozambique belt/East African rift zone [11,12]. The temperature of the lithosphere of the Tanzania craton is lower than that of the Mozambique belt/East African rift zone [32,33], yet its conductivity and S-wave velocity are higher [11,12,29]. Temperature may be the cause of the differences in S-wave velocities between the two, but it is not the cause of the differences in electrical conductivity. The explanation for the high conductivity anomaly within the lithospheric mantle of the Tanzanian craton, as well as the differences in conductivity between tectonically stable and active regions, not only helps us better understand the composition of the Tanzanian craton but also has significant implications for our understanding of the thinning and destruction processes of cratons.
Magnetotellurics (MT) is a useful geophysical exploration tool that utilizes natural alternating electromagnetic fields to reveal the composition and structures of the interior of Earth and planets. It is not shielded by high-resistivity layers and has strong resolution capabilities for highly conductive layers, because electrical conductivity is a physical parameter that is highly sensitive to temperature, volatiles (H2O or CO2), and interconnected secondary conductive phases (e.g., melts, fluids, hydrous minerals). The lithospheric mantle of the Tanzanian craton has undergone varying degrees of modification due to the percolation of melts [23,34,35]. Research on the mantle xenoliths has revealed the presence of alkali-rich carbonate melts in the deep mantle [36,37,38]. Consequently, the experimental studies on the electrical conductivity of olivine aggregates containing sodium carbonate (Na2CO3) were conducted at high temperatures and high pressure. The influences of alkali-rich carbonate melts on the electrical conductivity of peridotite were analyzed. Simultaneously, combined with the MT inversion results, the origins of the high conductivity layer in the lithospheric mantle of the Tanzanian craton were discussed. The composition within the craton (such as melt content, etc.) was limited.

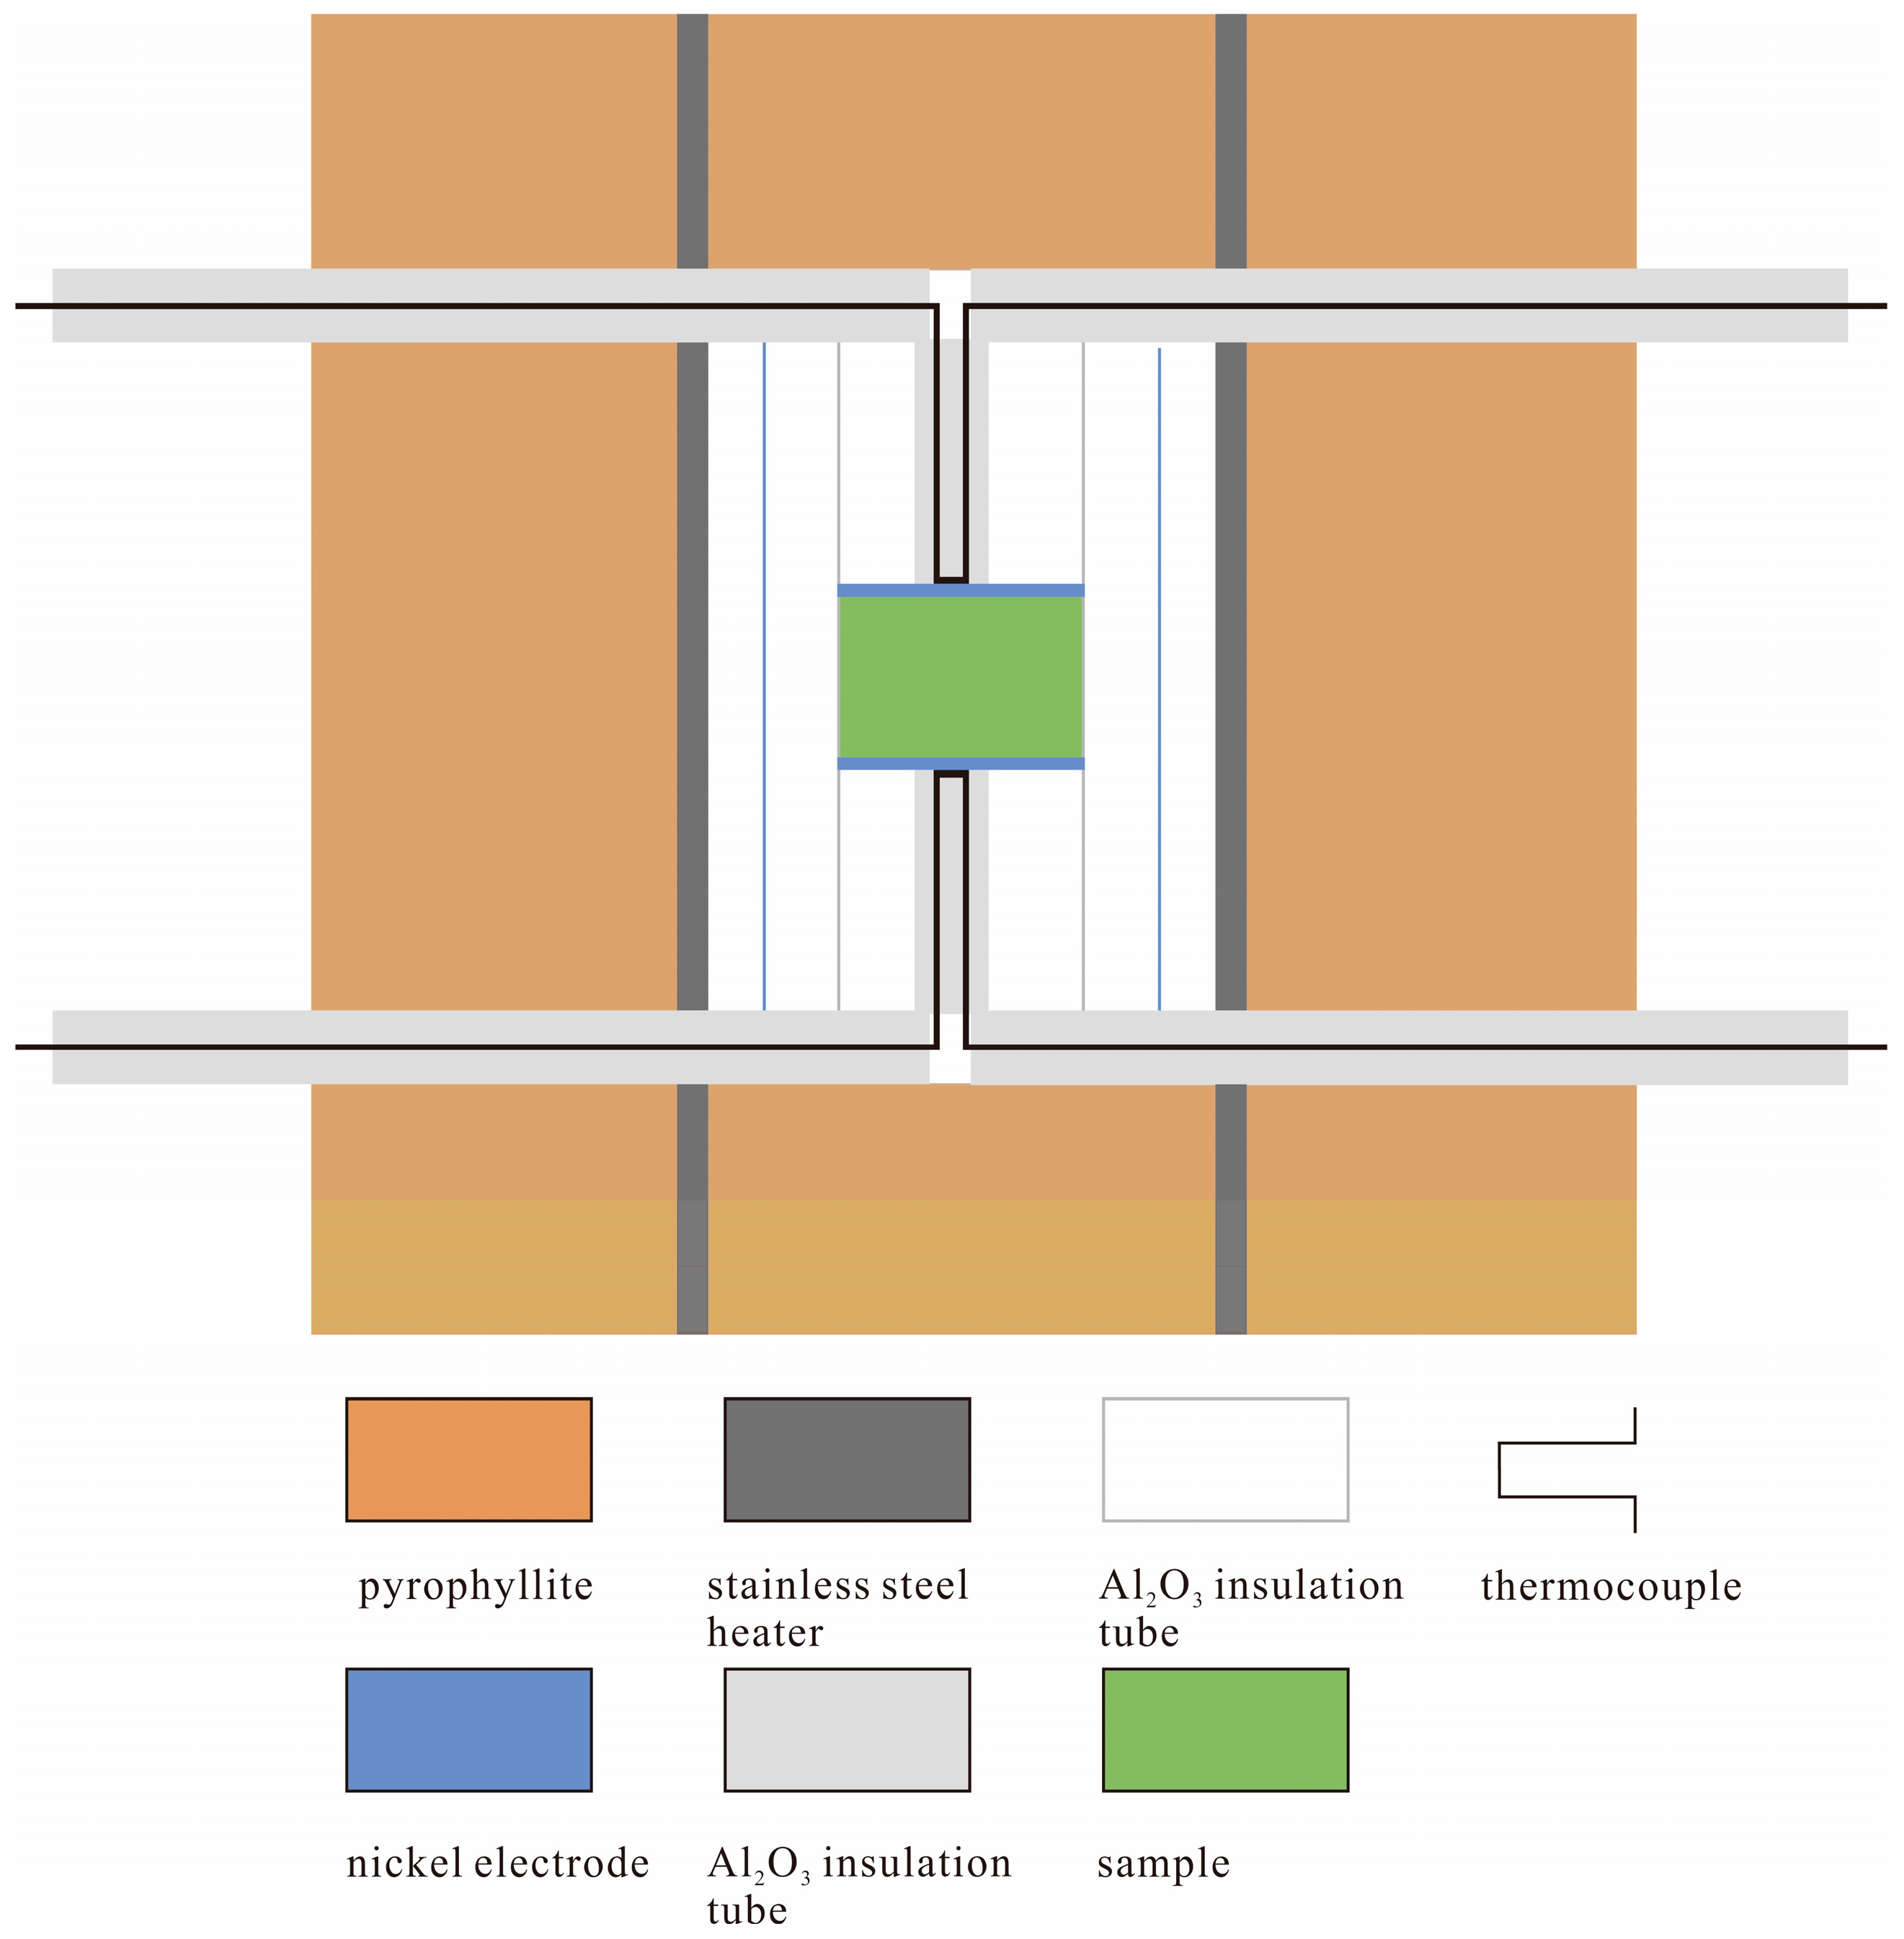
2. Materials and Methods

Olivine (Fo#90, with a water content of less than 10 ppm) was selected from the lherzolite of Damaping in Hebei Province, China, and then cleaned, dried, and crushed to approximately 80 μm. The olivine powder was mixed with high-purity sodium carbonate at a specific ratio and manually ground for an additional 6 h in an agate mortar to ensure the uniform mixing of olivine and Na2CO3. The mixed samples were pressed into thin discs with a diameter of 6 mm using a pellet press. To prevent significant geometric dimension differences at the two ends of the samples, the thickness of the samples was controlled to be within 3.5 mm. The experimental setup was depicted in Figure 1, where two layers of the stainless-steel sheets were used as heaters. A pair of K-type thermocouples were positioned at the upper and lower ends of the sample in order to gauge the temperature. The maximum temperature difference within the sample is about 20 °C. Nickel foil with a diameter of about 5 mm was used as the electrode, and one of the leads of the thermocouple was used as the electrode wire. Accessories such as pyrophyllite and ceramic tubes were heated at 1000 °C for 10 h to remove moisture from the materials and to achieve the mechanical properties corresponding to standard pressure conditions. The olivine samples mixed with Na2CO3 were first hot-pressed at 3 GPa and 650 °C for 10 h, followed by the measurement of electrical conductivity using a hinged six-sided anvil press at the High-Pressure Laboratory of the University of Chinese Academy of Sciences. Impedance spectroscopic measurements were conducted using a Solartron 1260 impedance Gain-Phase Analyzer with a frequency ranging from 1 MHz to 0.1 Hz. The applied voltage was set to be 1 V. The details of the measurement technique were described by Shen et al. [39] and Yoshino et al. [40,41]. Since the resistances of the carbonate-bearing olivine samples are relatively high, the two-electrode method was used to carry out the impedance spectroscopic measurements. However, the resistances of pure carbonate melt are extremely low, the pseudo-four-electrode method needs to be used to eliminate the errors caused by the lead wires. Figure 2 shows examples of the impedance spectra plotted in a complex impedance plane (a Cole-Cole plot). The resistance of olivine aggregate samples containing 1.0 wt%, 0.5 wt%, and 0.25 wt% sodium carbonate were obtained by fitting the impedance spectra using the Zview software (3.4d) based on a simple RC equivalent circuit models during multiple cycles of heating and cooling [39]. The resistance of the pure sodium carbonate sample was determined by the intercept of a nearly vertical curve crossing the real impedance axis during the heating process [40,41].
The electrical conductivity (σ) of the samples is determined using the following formula:
σ = L π × r 2 × R ,
In the formula, R represents the resistance of the sample, L is the height of the sample, and r is the radius of the electrode foils. To minimize the errors introduced by geometric dimensions, CT scanning was utilized at the Institute of Geology and Geophysics, Chinese Academy of Sciences, to obtain three-dimensional images of the samples, from which the values of L and r were obtained. The maximum difference in electrical conductivity caused by the geometric parameters of the sample is within 0.02 logarithmic units.

3. Results

The experimental results are shown in Figure 3. For pure sodium carbonate samples, at a constant temperature of 1125 °C, multiple impedance spectrum measurements were conducted within 40 min. It was found that there were no significant differences in the experimental results, indicating that the interior of the sample had reached equilibrium. The electrical conductivity value was approximately 3 S/m. Between 1150 °C and 1175 °C, the electrical conductivity of the sample deviated from the original trend with a slight jump, indicating that the sample began to melt. The melting point of pure Na2CO3 is determined to be 1175 ± 25 °C, which is consistent with the previous findings [42]. After maintaining the temperature at 1175 °C for 30 min, the electrical conductivity of the sample kept increasing slowly. When the temperature rose to 1200 °C, the electrical conductivity of the sample rapidly increased to approximately 250 S/m, and then increased slowly with the increase in temperature, indicating that the sample was in a completely molten state. Within a temperature range of approximately 50 °C, from 1150 °C to 1200 °C, the electrical conductivity of pure Na2CO3 sample jumped by about two orders of magnitude. For the olivine sample containing sodium carbonate, it is possible to determine whether the sample undergoes partial melting by observing the change in the slope of the curve of the electrical conductivity varying with temperature. As shown in Figure 3, the Na2CO3-bearing olivine aggregates begin to melt at 800 °C at 3 GPa, which is consistent with the results of the separation experiment conducted by Bekhtenova et al. [43]. In the case of a small melt fraction (when the volume fraction is less than 1%), the surface tension will impede the migration of the melt and overcome the influence of the temperature gradient on the distribution state of the melt [44]. Furthermore, the composition of the sodium carbonate melt in the experiment did not change significantly. These makes the electrical conductivities obtained during multiple heating and cooling cycles for the partially molten samples (where T > 850 °C) almost coincide.
Figure 4 shows the variation of electrical conductivity with temperature for partially molten samples during the first cooling and the second heating cycle. The electrical conductivities of pure sodium carbonate melts are 5–6 orders of magnitude higher than those of the olivine aggregates. A small amount (0.25 wt%) of carbonate melt can significantly enhance the conductivity of the olivine aggregates by more than one order of magnitudes.
The electrical conductivity of olivine aggregates containing sodium carbonate melts follows the Arrhenius relationship with temperature:
σ = σ 0 e x p H R T ,
where σ0 is the pre-exponential factor (S/m), H is the activation enthalpy (kJ/mol), T is the absolute temperature (K), and R is the ideal gas constant. The pre-exponential factors and activation enthalpies obtained by fitting the Arrhenius relationships are listed in Table 1. It is found that the activation enthalpy of olivine aggregates containing a small amount of sodium carbonate melt (<1 wt%) has a weak correlation with the melt mass fraction (F, wt%). The pre-exponential factor is a function of the melt mass fraction, with the relationship given by logσ0 = 1.33 × log(F) + 3.87. We fixed the activation enthalpy of olivine aggregates containing a small amount of sodium carbonate melt at 65.97 ± 0.72 kJ/mol, and their conductivity can be uniformly described by the following equation:
σ = 10 3.87 × F 1.33 × e x p 65.97 × 1000 R T ,
the activation enthalpy of pure sodium carbonate melt is approximately 36 kJ/mol, which is consistent with previous results [41,46]. Na+ is the main charge carrier in the carbonatitic melt [41].

4. Discussion

4.1. Cause of High Conductivity in the Lithospheric Mantle of the Cratons

Both 2D and 3D MT surveys have detected electrical conductivity anomalies in the lithospheric mantle within the central Tanzanian craton [11,12,28], but no velocity anomalies have been found in the vicinity [29,31]. As shown in the red and yellow shaded areas in Figure 5, the high conductivity layers are at a depth of 100–200 km and 50–100 km respectively, with conductivity ranging between 0.02 and 0.20 S/m. Özaydın et al. [19] analyzed the effect of graphite films, water in nominally anhydrous minerals, and hydrous minerals such as amphibole and phlogopite on the conductivity of lherzolite and found that none of these could explain the high conductivity anomaly observed in the lithospheric mantle of the Tanzanian craton. If the hydrous lherzolite contains 2–6% phlogopite (with a fluorine content of 0.52 wt%) which are basically connected, it could barely explain the high conductivity phenomenon at a depth range of 100–150 km in the 2D model (the conductivity between 0.01 S/m and 0.10 S/m). However, at least 25% and 6% of phlogopite (with a fluorine content of 2.75 wt%) would be required to achieve mantle conductivities of 0.10 and 0.02 S/m at a depth of 75 km, corresponding to a temperature of approximately 760 °C [9]. Adding 5–15% phlogopite to lherzolite can reduce the shear wave velocity by 2–7% [48], which can be detected by seismic observations, but no low-velocity phenomena have been observed near the high conductivity layer. Therefore, phlogopite is not a suitable candidate causing the high conductivity anomaly in the shallow part of the Tanzanian cratonic mantle. Sulfide minerals are conductive but are unlikely to form a connected network in the mantle because of the low abundance of sulfur and the high dihedral angle in the olivine-FeS system. Hydrous silicate melts were also eliminated as candidates because the solidus temperature of hydrous mantle rocks is significantly higher than the temperature of the mantle beneath the Tanzanian craton (Figure 5). Up to this point, these conductive substances such as water in nominally anhydrous minerals, graphite, amphibole, phlogopite, sulfide, and hydrous silicate melts have been unable to explain the high conductivity anomaly in the lithospheric mantle of the Tanzanian craton.
The geothermal gradient curve of the Tanzanian craton intersects the solidus of Na/K-carbonated peridotite at approximately 800 °C (at a depth of approximately 80 km, Figure 5) [43], suggesting that alkali-rich carbonate melt may be a likely mechanism explaining the high conductivity phenomenon in the lithospheric mantle. The reasons are as follows. (1) Within the Tanzanian craton, there are numerous Jurassic to Quaternary kimberlites exposed in the neighborhood of the high conductivity layer, such as Mwadui and Eyasi areas [23,24,27]. Studies on mantle xenoliths have also indicated the presence of alkali-carbonate fuilds/melts in the deep mantle [37,38]. When carbonatites are rich in alkali elements, their solidus is significantly reduced. As shown in Figure 5, below 80 km, the solidus curve of the peridotite containing sodium carbonate or potassium carbonate is lower than the geothermal curve of the Tanzanian cratonic mantle, leading to partial melting of the carbonated rock and generation of an alkali-rich carbonate melt. The presence of alkali-rich carbonate melt is a prerequisite for the formation of a high-conductivity layer. (2) The conductivity of the alkali-carbonate melt is several orders of magnitude higher than that of the peridotite (Figure 4), and a small amount of alkali-carbonate melt forming a connected network greatly enhances the conductivity of mantle rocks, thus forming a high conductivity layer in the mantle. The high conductivity characteristic of alkali-carbonate melt is a necessary condition for the formation of a high-conductivity layer. Then, what is the proportion of alkali-carbonate melt in the high conductivity layer of the cratonic mantle?
Based on the Equation (3) and the geothermal curve of the Tanzanian craton (black dashed line in Figure 5), we modeled the bulk conductivity of dunite containing sodium carbonate melt as shown in Figure 6. This model is used to constrain the melt mass fraction required to produce the observed high conductivity phenomenon in the lithospheric mantle of the Tanzanian craton. Further, according to the one-dimensional (1D) electrical structure of the southern and northern profiles of the central Tanzanian craton (blue and red lines in Figure 5, respectively), the mass fractions of sodium carbonate melt were estimated in the depth range of 80–135 km (corresponding to a temperature range of about 800–1185 °C) beneath the Tanzanian craton, shown as the blue and red lines in Figure 6, respectively. Under constant electrical conductivity conditions, the melt mass fraction decreases rapidly with increasing temperature/depth; under constant temperature/depth conditions, the lower electrical conductivity indicates the lower melt mass fraction. The proportion of melt depends on the temperature distribution and the magnitude of electrical conductivity.
Using the three most likely electrical conductivity values (0.10, 0.03, and 0.01 S/m, corresponding to log σ values of −1.00, −1.52, −2.00) within the mantle conductor, we estimated the mass fraction of alkali-carbonate melt at the different depths/temperatures (Table 2).
For the 3D model (shown as the yellow shaded area in Figure 5) [11], the high conductivity layer is located in the shallow mantle (50–100 km). Considering that the mantle contains water [53], it is possible for Na/K-carbonated peridotite to melt below a depth of 65 km. Given an extreme case of 75 km/760 °C and 0.10 S/m (resistivity of 10 Ω·m), the proportion of alkali-carbonate melt is estimated to be higher than 7 wt% (Table 2). Such a high proportion of carbonate melt exists impossibly in the mantle for a long time and would cause a significant decrease in seismic wave velocity to an observable extent. Therefore, the high conductivity phenomenon with a conductivity higher than 0.10 S/m is unlikely explained by the presence of the alkali-carbonate melt above the depth of 80 km (Table 2, Figure 6). Of course, if the conductivity is relatively low in the mantle conductor, considering the minimum value of 0.01 S/m (resistivity of 100 Ω·m), even at a shallower depth of 65 km with a temperature of 688 °C, the proportion of alkali-carbonate melt is estimated to be lower than 1.91 wt%. This proportion would further decrease due to the water content in the cratonic mantle.
For the 2D model (shown as the red shaded area in Figure 5) [12], even under extreme conditions of 100 km/938 °C and 0.10 S/m, the required proportion of alkali-carbonate melt is only 3 wt%; below 100 km, as the temperature increases, the melt proportion decreases (Table 2, Figure 6). The carbonate melt has a low dihedral angle and high mobility at 3 GPa, it easily forms a connected network in peridotite [54], which will enhance the conductivity of the partially molten sample. Therefore, the presence of alkali-carbonate melt is the most possible mechanism to explain the high conductivity anomaly below the depth of 100 km.
For the 1D electrical profiles (shown as the blue and red lines in Figure 5) [28], the conductivity of the southern profile is between 0.01 S/m and 0.03 S/m, and the mass fraction of alkali-carbonate melt is between 0.89 wt% and 0.45 wt%. Below 100 km, the conductivity of the southern profile hardly changes, at approximately 0.03 S/m. Owing to the continuous increase in the temperature, the melt fractions gradually decrease to 0.45 wt% at the depth of 135 km (shown in the blue lines in Figure 6). The conductivity of the northern profile is between 0.01–0.15 S/m, and the content of alkali-carbonate melt is between 0.82 wt% and 1.94 wt%. Below 100 km, the conductivity of the northern profile slowly increases, and the melt proportion increases from 1.73 wt% at 100 km (σ ≈ 0.05 S/m) to 1.94 wt% at 120 km (σ ≈ 0.11 S/m) and then slowly decreases to 1.71 wt% at 135 km (σ ≈ 0.15 S/m) (shown as the red lines in Figure 6). Because the solidi of peridotite containing sodium carbonate and dolomite intersect the geothermal gradient curve of the Tanzanian craton at approximately 80 km (temperature 800 °C) and 120 km (temperature 1070 °C), respectively, we define this area as the region where alkali-rich carbonate melts are present, with a melt fraction < 1.94 wt%.
In summary, we considered that the alkali-rich carbonate melts may be the best mechanism to explain the high conductivity anomaly at 80–120 km depth in the lithospheric mantle of the Tanzanian craton for a number of reasons: (1) There has been significant kimberlite magmatic activity and the alkali-rich volcanic lavas in the Tanzanian craton, indicating that there was/still is a large amount of carbonate melt in deep mantle of Tanzanian craton. (2) Affected by the mantle plume existing below East Africa [31], the temperature within the Tanzanian cratonic mantle is higher than that of most cratons, such as Slave; therefore, the alkali-rich carbonated peridotite can melt below 80 km within the Tanzanian craton. (3) As low as 0.05 wt% carbonate melt can form a connected network in peridotite [54] and stably exist in the mantle over a long period [44,55]. (4) The upper part of the Tanzanian lithospheric mantle is a high-resistivity cap layer that hinders the upward movement of the melt, allowing it to remain below the impermeable layer for long periods of time [41]. (5) The alkali-rich carbonate melt has extremely high conductivity. The high conductivity anomaly in the deeper part (>120 km) can be explained by the presence of an extremely low proportion of calcium-magnesium carbonate melt. However, the high conductivity in the shallow part (<80 km) is not sufficiently explained by any existing conductive mechanism.
Based on our experimental results, we estimated that the content of alkali-rich carbonate melt is approximately 1–2 wt% within the high conductivity layer of the Tanzanian craton (80–120 km). Assuming that all carbon is stored in the mantle in the form of carbonate melt, the carbon content is approximately 0.11–0.23 wt% in the high conductivity layer. Foley and Fischer estimated that the carbon content enriched at the bottom of the cratonic lithosphere since the formation of the craton is 0.43–0.86 wt%, which is higher than our calculated results [24]. The southern profile of the Tanzanian craton is far from various tectonic activity sites, and the variation in electrical conductivity with depth may represent the electrical distribution of the entire craton. The electrical conductivity of the lithosphere of the Tanzanian craton given by the southern profile is higher than that of other continental lithospheres. We estimate that the content of alkali-rich carbonate melts in the depth range of 80–135 km is between 0.89–0.45 wt%, corresponding to a carbon content of 0.10–0.05 wt%. Aiuppa et al. inferred that the carbon content in the 100–150 km depth range of the African Craton is approximately 0.04–0.07 wt%, which is close to our lowest value [56]. Taking the average, we believe that the carbon content of the lithospheric mantle of the Tanzanian craton is approximately 0.07 wt%, and the carbon content in the high conductivity layer is approximately 0.20 wt%.
High-density fluids (HDFs) are commonly observed as inclusions in fibrous diamonds [57], which are enriched in volatile and incompatible elements. Brines are one class of HDFs that were recently proposed as an alternative explanation to melts for anomalous high conductivity and seismic velocity located between 80–120 km depth in the Archean Slave craton [9,58,59]. For the Archean Tanzanian craton, since no low-velocity zone is found surrounding the high-conductivity layer, brine is not the best option to explain the high-conductivity anomaly in the lithospheric mantle of the Archean Tanzanian craton. Bettac et al. cannot exclude the hydrous carbonate melts as another option to explain the low velocity and high conductivity of the central Slave mantle [9]. However, the surface heat flow of the Slave craton is relatively low, around 37 mWm−2 [20]. At a depth of 100 km, its mantle temperature (~735 °C) is about 200 °C lower than that of the Tanzanian craton. The solidus curves of hydrous carbonated peridotite and alkali-carbonated peridotite are above the geothermal curve of the Slave craton above 150 km depth (Figure 5), thus hydrous carbonate melts and alkali-rich carbonate melts are not candidates to explain the coincidence of the low velocity and high conductivity in the central Slave craton.
For the Archean Gawler craton, a high conductivity zone also exists within the lithospheric mantle [13], located below 80 km and extending to 154 km, with a conductivity greater than 0.1 S/m. The surface heat flow of the Gawler craton is relatively high, around 50 mWm−2. The temperatures are 945 °C and 1308 °C at 80 km and 120 km depths beneath the Gawler craton, respectively. Ignoring the effect of pressure on the electrical conductivity of partially molten samples, and based on our experimental results of peridotite containing sodium carbonate, it is estimated that about 2.92 wt% and 0.95 wt% of anhydrous alkali-carbonate melts are required to reach a conductivity of 0.10 S/m at 80 km and 120 km depths beneath the Gawler craton, respectively. Using conventional Archie’s law σ b u l k = σ f φ m , where σbulk is the electrical conductivity of the partially molten sample, σf is the electrical conductivity of the liquid phase, φ is the volume fraction of the melt in vol%, and m describes the degree of interconnectivity of the melt. The value of m will be <2 for the well-interconnected liquid phase, and it will tend to unity only if the liquid phase is fully interconnected and is the only conductive phase [60]. Due to the lack of density value of Na2CO3 melt/liquid at high temperature and high pressure, we treat the mass fraction of melt as the volume fraction of melt. Based on our experimental results, the values of m obtained by linearly fitted are 1.80 and 1.67 at 945 °C and 1308 °C, respectively. To achieve a mantle conductivity of 0.10 S/m at depths of 80 km and 120 km, it is estimated that the volume fractions of anhydrous alkali-carbonate (Na2CO3) melts are 1.84% and 0.84%, respectively. According to the experimental results of Sifre et al. [46], the required volume fractions of hydrous alkali-rich carbonate melts (MgCO3 + CaCO3 + K2CO3 + Na2CO3 + H2O) are 2.66% and 1.14%, respectively. The volume fractions of the two types of melts estimated by Archie’s empirical formula show a significant difference, mainly due to the different concentrations of charge carriers (Na+, K+) in the liquid phase. In summary, the presence of anhydrous and hydrous alkali-rich carbonate melts can fully explain the high-conductivity phenomenon in the lithospheric mantle of the Gawler craton.
Currently, highly conductive layers have only been discovered within the lithospheric mantle of three cratons. Among them, two high conductivity anomalies associated with mantle upwelling (Tanzania and Gawler cratons) can be explained by the presence of carbonate melts, while one high conductivity anomaly related to deep subduction (Slave craton) seems to be more appropriately explained by the presence of brines.

4.2. Cause of High Resistivity in the Lithospheric Mantle of Mozambique Mobile Belts/East African Rifts

The temperatures of the lithospheric mantle of Mozambique mobile belts/East African rifts are higher than those of the Tanzanian craton; however, its conductivities are one to two orders of magnitude lower than those of the craton below 100 km (Figure 5). Why is the electrical conductivity in high-temperature regions lower than that in low-temperature regions? We will discuss this issue qualitatively below.
Based on the temperature distribution in the Tanzanian craton and the Mozambique mobile belt, the solidi of carbonated peridotite, and decarbonation reactions [52,61], we have delineated the potential regions of occurrence for different melt compositions, as shown in Figure 7.
In the central region of the Tanzanian craton, extensive exposures of kimberlite are found, with numerous igneous rocks distributed near its eastern boundary. These igneous rocks within and at the edges of the craton contain Na2O + K2O > 3.5 wt% [23]. The experiments have shown that kimberlite melts coexisting with high-calcium pyroxene in the asthenosphere have Na2O ≥ 2.5 wt% [63]. Recent P-wave velocity studies have revealed that the lithospheric thickness gradually decreases from 135 km in the craton to 90 km in the mobile belt, and two super mantle plumes exist beneath the Tanzanian craton and East Africa [31]. We speculate that carbonated rocks containing small amounts of Na and K in the asthenosphere of the Tanzanian craton underwent melting due to the influence of the mantle plume. A small amount of carbon-rich melt (i.e., CaMg-carbonatitic melt or proto-kimberlitic melt), with lower density and faster migration rate, rapidly ascended to the bottom of the cratonic mantle and accumulated there (at approximately 135–150 km depth) [11,31]. Due to the relatively low temperature of 1300 °C at the bottom of the Tanzanian craton’s lithosphere (Figure 5), the melt became enriched in CO2, Na2O, and K2O [63]. As the melt continued to rise, magnesite crystallized out at 120 km, leaving behind an alkali-rich carbonate melt (Figure 7). At 80 km, dolomite and alkaline carbonates crystallized out from the alkali-rich carbonate melt, forming a permeable barrier that hindered the continued upward migration of the alkali-rich melt [64]. The alkali-rich carbonate melt with a low melt fraction was confined to the 80–120 km depth range within the lithospheric mantle. Na+/K+ ions served as the main charge carriers within the melt, and the connected or partially connected alkali-rich carbonate melts formed a highly conductive layer. The upper part of this highly conductive layer, as shown by both 2D and 3D MT models, was a high-resistivity layer (Figure 5) [11,12], which should be the result of the melt not continuing to migrate to the shallow part.
In the Mozambique mobile belt and Eastern African rifts, numerous fractures have developed, with widespread exposures of carbonate magma. In the Oldoinyo Lengai area, there is a rare exposure of Na-rich carbonate lava containing about 30 wt%Na2O [21]. Due to the abundant fracture development in the Mozambique region and its high geothermal temperature (Figure 7), CaMg-carbonate magma or kimberlite magma near the lithosphere-asthenosphere boundary (the carbonated silicate melt shown in Figure 7 is considered as kimberlite melt) can migrate directly to shallow depths or even to the surface along the fractures, releasing large amounts of CO2 [24,65]. Therefore, the amount of CO2 degassed from the Mozambique belt is greater than that from the Tanzanian craton, and the released CO2 primarily originates from the lithospheric mantle [66]. Because there is almost no melt present in the lithospheric mantle, its electrical conductivity is much lower than that of the Tanzanian craton’s lithospheric mantle (Figure 5). However, a highly conductive layer has been found in the shallow crust of the Mozambique region, which may be caused by the emplacement of carbonate melt to shallow depths [11,12].
In summary, owing to the presence of permeability barriers, carbonate melts in the deep part of the Tanzanian craton have accumulated over a long geological history, leading to high conductivity anomalies observable by geophysical methods. On the Mozambique, CO2 from the deep mantle migrates directly to the surface, and since the melts are not concentrated, they do not cause geophysical anomalies within the mantle.

5. Conclusions

In this paper, we measured the electrical conductivity of dunite samples containing 1.0 wt%, 0.5 wt%, and 0.25 wt% Na2CO3, as well as pure Na2CO3 samples, at 3 GPa. The following research results were obtained:
(1)
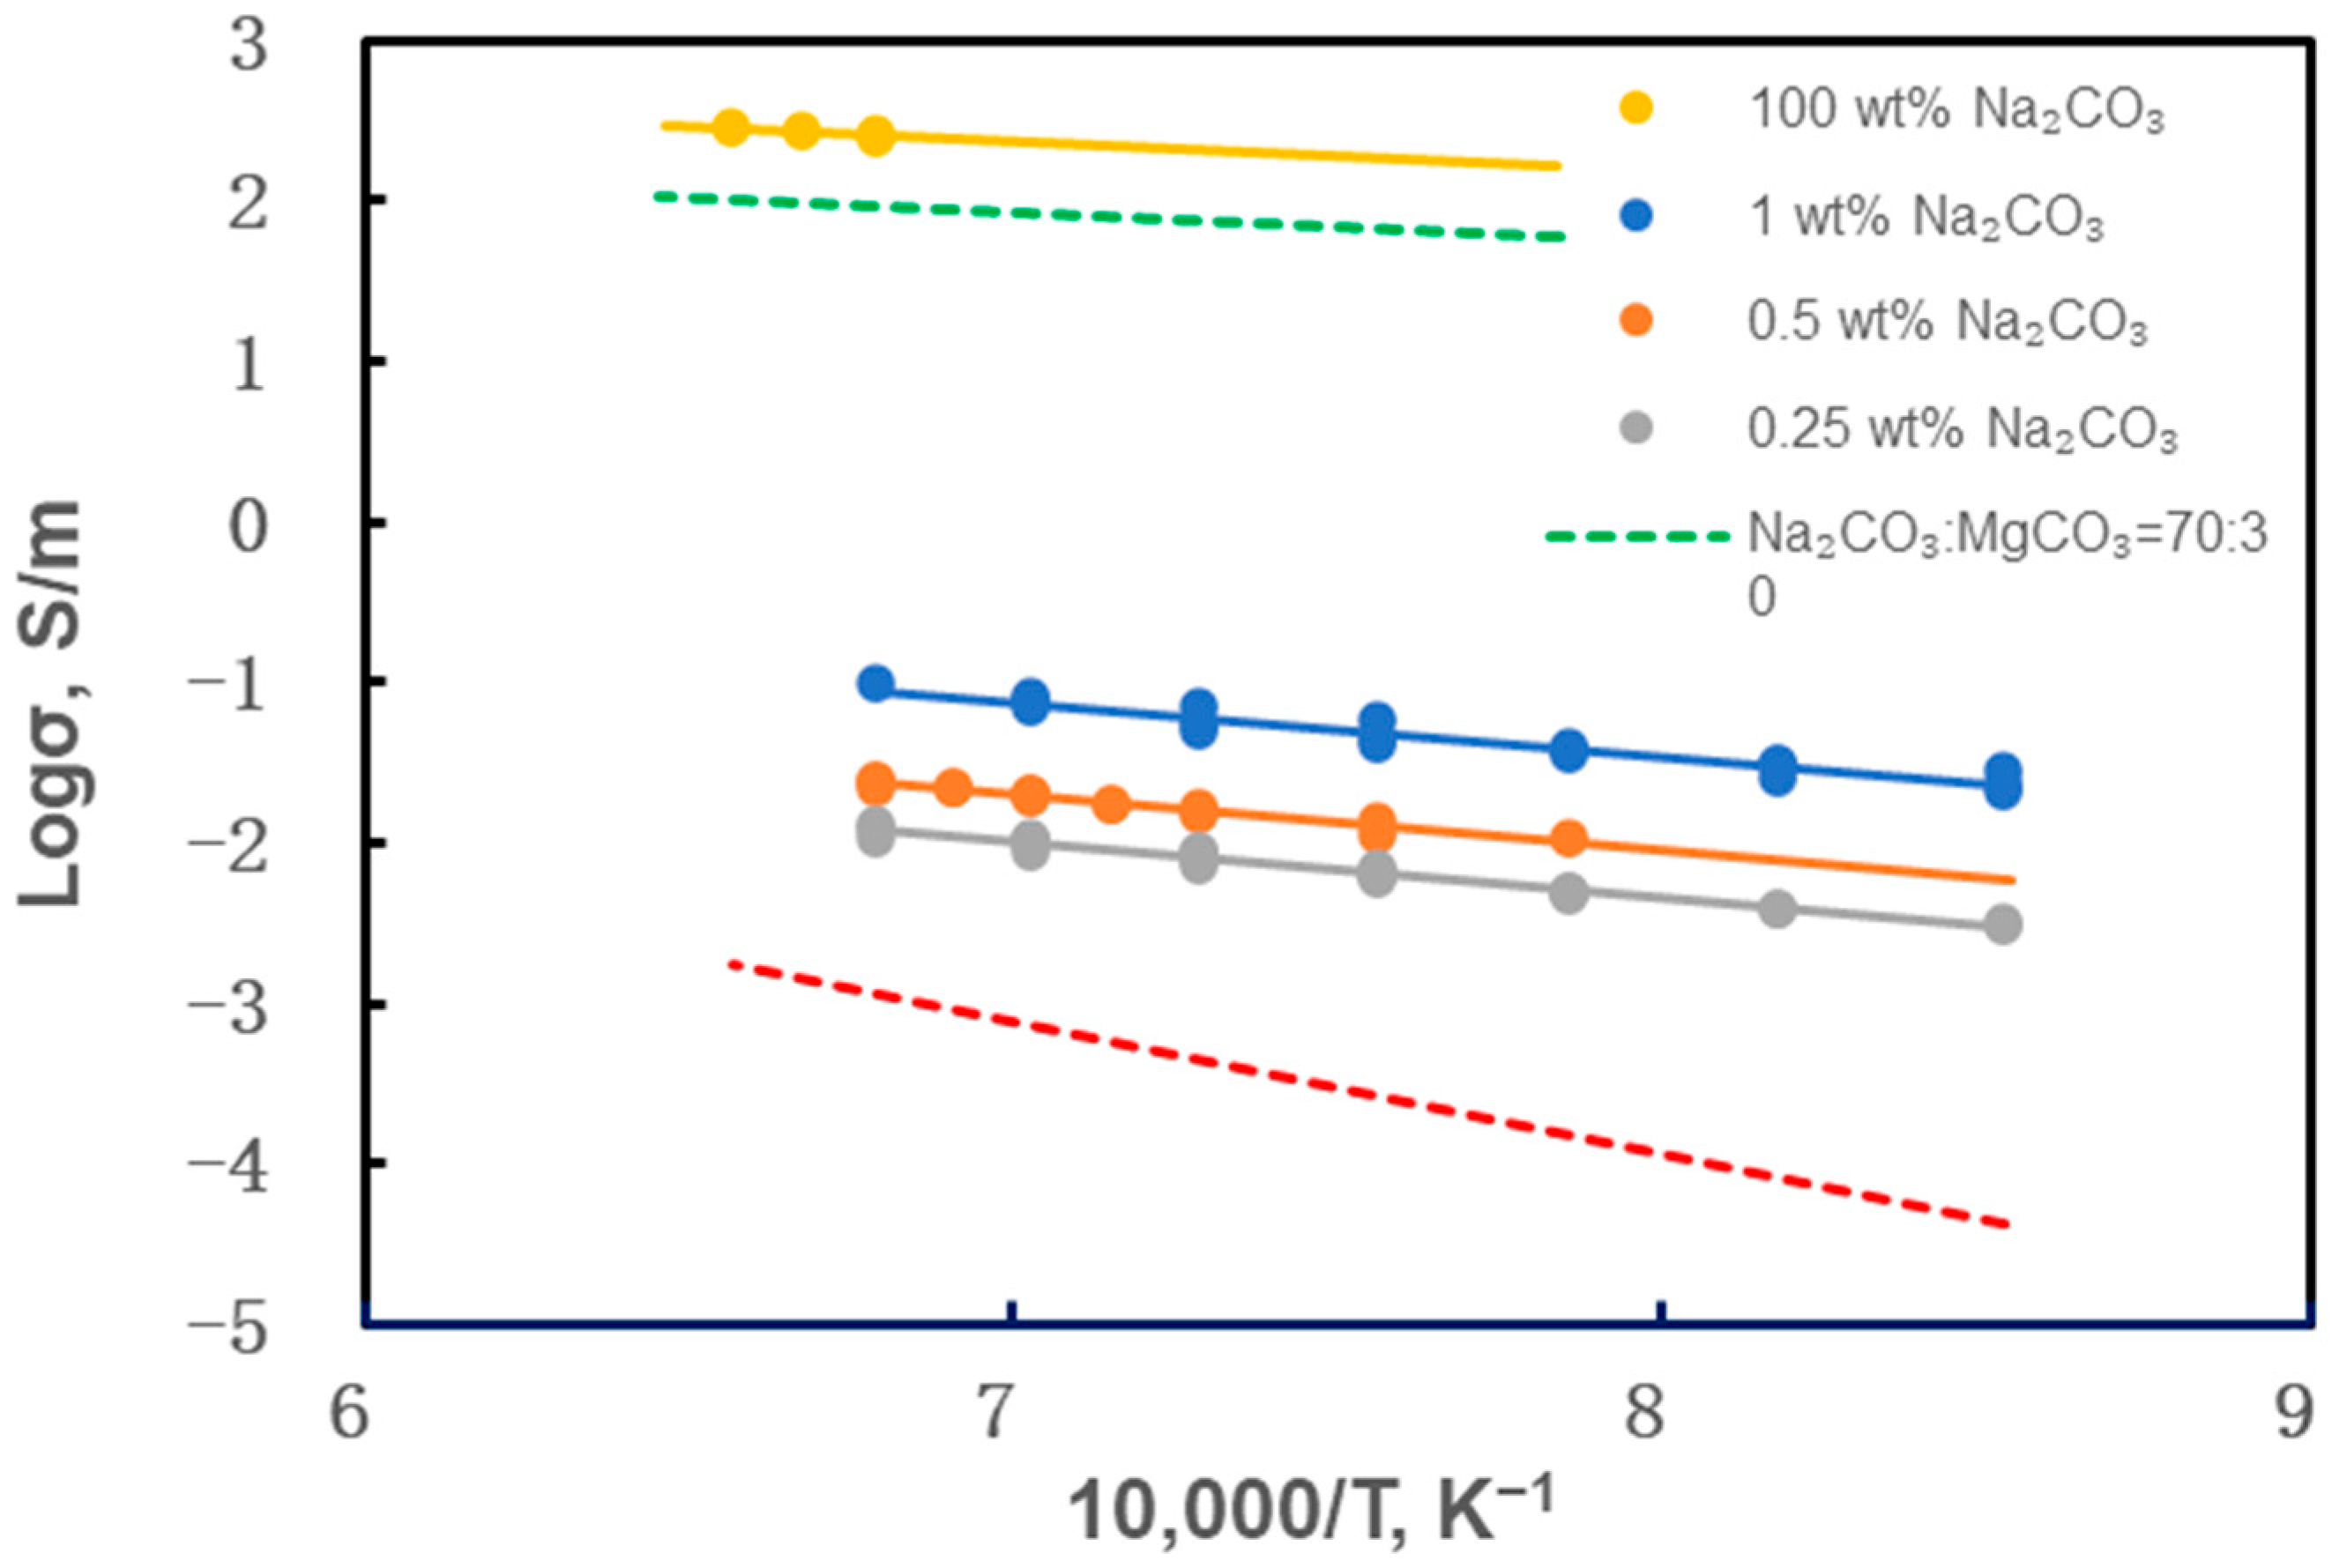
The experiments revealed that the dunite samples containing Na2CO3 began to melt above 800 °C, leading to a rapid increase in electrical conductivity. A small amount of alkali-carbonate melt can increase the electrical conductivity of dunite by 1–2 orders of magnitude. Pure Na2CO3 started to melt above 1175 °C, reaching an electrical conductivity of 200–300 S/m. In partially molten Na2CO3-bearing peridotite samples, Na+ is the main charge carrier.
(2)
The carbon content of the lithospheric mantle of the Tanzanian craton is approximately 0.07 wt%, and the carbon content in the high conductivity layer is approximately 0.20 wt%. The carbon-rich phases at the bottom of the craton, such as alkali-rich carbonates, are more prone to melting due to the thermal influence of the deep mantle plume. Therefore, the presence of alkali-rich carbonate melt is the most likely and suitable mechanism to explain the high conductivity anomalies within the Archean Tanzanian craton.
(3)
The permeability barrier of the lithospheric mantle is the main reason why the electrical conductivity of the lithospheric mantle of the Tanzanian craton is 1–2 orders of magnitude higher than that of the lithospheric mantle of the Mozambique mobile belt, and it is also a prerequisite for the existence of a high conductivity layer within the Tanzanian craton.
(4)
The global average carbon content of the upper mantle is approximately 0.035 wt% [56]. In comparison, the Tanzanian craton is more carbon-rich. Carbon plays an important role in the evolution of cratons, as the presence of carbon-rich melts can disrupt the stability of cratons and cause thinning of the cratonic lithosphere. Our explanation for the causes of high conductivity in cratons and high resistivity in active zones also indirectly explains why the lithosphere of the Tanzanian craton is currently only about 135 km thick [31].

Author Contributions

Conceptualization, X.H. and W.D.; Methodology, X.H.; Validation, X.H. and W.D.; Formal analysis, X.H. and W.D.; Investigation, X.H. and W.D.; Resources, X.H.; Writing—original draft, X.H. and W.D.; Writing—review & editing, X.H. and W.D.; Visualization, W.D.; Supervision, X.H.; Project administration, X.H.; Funding acquisition, X.H. All authors have read and agreed to the published version of the manuscript.

Funding

This research was jointly supported by the National Natural Science Foundation of China (Nos. 42174107).

Data Availability Statement

Data are contained within the article.

Acknowledgments

The authors wish to thank Duojun Wang and Libing Wang at the High-Pressure Laboratory of the University of Chinese Academy of Sciences for help with the conductivity measurement. Thank the editor and the two anonymous reviewers for the valuable comments and suggestions.

Conflicts of Interest

The authors declare no conflict of interest.

Abbreviations

The following abbreviations are used in this manuscript:
MTMagnetotelluric
EnEnstatite
MagMagnesite
FoForsterite
DolDolomite
DiDiopside

References

  1. Evans, R.L.; Jones, A.G.; Garcia, X.; Muller, M.; Hamilton, M.; Evans, S.; Fourie, C.J.S.; Spratt, J.; Webb, S.; Jelsma, H.; et al. Electrical lithosphere beneath the Kaapvaal craton, southern Africa. J. Geophys. Res.-Solid Earth 2011, 116. [Google Scholar] [CrossRef]
  2. Miensopust, M.P.; Jones, A.G.; Muller, M.R.; Garcia, X.; Evans, R.L. Lithospheric structures and Precambrian terrane boundaries in northeastern Botswana revealed through magnetotelluric profiling as part of the Southern African Magnetotelluric Experiment. J. Geophys. Res.-Solid Earth 2011, 116. [Google Scholar] [CrossRef]
  3. Bologna, M.S.; Dragone, G.N.; Muzio, R.; Peel, E.; Nuñez-Demarco, P.; Ussami, N. Electrical Structure of the Lithosphere From Rio de la Plata Craton to Parana Basin: Amalgamation of Cratonic and Refertilized Lithospheres in SW Gondwanaland. Tectonics 2019, 38, 77–94. [Google Scholar] [CrossRef]
  4. Azeez, K.K.A.; Veeraswamy, K.; Gupta, A.K.; Babu, N.; Chandrapuri, S.; Harinarayana, T. The electrical resistivity structure of lithosphere across the Dharwar craton nucleus and Coorg block of South Indian shield: Evidence of collision and modified and preserved lithosphere. J. Geophys. Res.-Solid Earth 2015, 120, 6698–6721. [Google Scholar] [CrossRef]
  5. Bologna, M.S.; Padilha, A.L.; Vitorello, I.; Pádua, M.B. Signatures of continental collisions and magmatic activity in central Brazil as indicated by a magnetotelluric profile across distinct tectonic provinces. Precambrian Res. 2011, 185, 55–64. [Google Scholar] [CrossRef]
  6. Krueger, H.E.; Gama, I.; Fischer, K.M. Global Patterns in Cratonic Mid-Lithospheric Discontinuities From Sp Receiver Functions. Geochem. Geophys. Geosyst. 2021, 22, e2021GC009819. [Google Scholar] [CrossRef]
  7. Selway, K.; Ford, H.; Kelemen, P. The seismic mid-lithosphere discontinuity. Earth Planet. Sci. Lett. 2015, 414, 45–57. [Google Scholar] [CrossRef]
  8. Wölbern, I.; Rümpker, G.; Link, K.; Sodoudi, F. Melt infiltration of the lower lithosphere beneath the Tanzania craton and the Albertine rift inferred from S receiver functions. Geochem. Geophys. Geosyst. 2012, 13. [Google Scholar] [CrossRef]
  9. Bettac, S.P.; Unsworth, M.J.; Pearson, D.G.; Craven, J. New constraints on the structure and composition of the lithospheric mantle beneath the Slave craton, NW Canada from 3-D magnetotelluric data-Origin of the Central Slave Mantle Conductor and possible evidence for lithospheric scale fluid flow. Tectonophysics 2023, 851, 229760. [Google Scholar] [CrossRef]
  10. Jones, A.G.; Lezaeta, P.; Ferguson, I.J.; Chave, A.D.; Evans, R.L.; Garcia, X.; Spratt, J. The electrical structure of the Slave craton. Lithos 2003, 71, 505–527. [Google Scholar] [CrossRef]
  11. Özaydin, S.; Selway, K.; Foley, S.F.; Ezad, I.S.; Griffin, W.L.; Tarits, P.S.; Hautot, S. Role of Metasomatism in the Development of the East African Rift at the Northern Tanzanian Divergence: Insights From 3D Magnetotelluric Modeling. Geochem. Geophys. Geosyst. 2024, 25, e2023GC011191. [Google Scholar] [CrossRef]
  12. Selway, K. Negligible effect of hydrogen content on plate strength in East Africa. Nat. Geosci. 2015, 8, 543–546. [Google Scholar] [CrossRef]
  13. Thiel, S.; Heinson, G. Electrical conductors in Archean mantle—Result of plume interaction? Geophys. Res. Lett. 2013, 40, 2947–2952. [Google Scholar] [CrossRef]
  14. Wang, D.; Mookherjee, M.; Xu, Y.; Karato, S.-I. The effect of water on the electrical conductivity of olivine. Nature 2006, 443, 977–980. [Google Scholar] [CrossRef] [PubMed]
  15. Hu, H.; Dai, L.; Li, H.; Sun, W.; Li, B. Effect of dehydrogenation on the electrical conductivity of Fe-bearing amphibole: Implications for high conductivity anomalies in subduction zones and continental crust. Earth Planet. Sci. Lett. 2018, 498, 27–37. [Google Scholar] [CrossRef]
  16. Li, Y.; Yang, X.; Yu, J.H.; Cai, Y.F. Unusually high electrical conductivity of phlogopite: The possible role of fluorine and geophysical implications. Contrib. Mineral. Petrol. 2016, 171, 37. [Google Scholar] [CrossRef]
  17. Zhang, B.; Yoshino, T. Effect of graphite on the electrical conductivity of the lithospheric mantle. Geochem. Geophys. Geosyst. 2017, 18, 23–40. [Google Scholar] [CrossRef]
  18. Watson, H.C.; Roberts, J.J.; Tyburczy, J.A. Effect of conductive impurities on electrical conductivity in polycrystalline olivine. Geophys. Res. Lett. 2010, 37, L02302. [Google Scholar] [CrossRef]
  19. Özaydin, S.; Selway, K. MATE: An Analysis Tool for the Interpretation of Magnetotelluric Models of the Mantle. Geochem. Geophys. Geosyst. 2020, 21, e2020GC009126. [Google Scholar] [CrossRef]
  20. Hasterok, D.; Chapman, D.S. Heat production and geotherms for the continental lithosphere. Earth Planet. Sci. Lett. 2011, 307, 59–70. [Google Scholar] [CrossRef]
  21. Dawson, J.B.; Garson, M.S.; Roberts, B. Altered former alkalic carbonatite lava from Oldoinyo Lengai, Tanzania: Inferences for calcite carbonatite lavas. Geology 1987, 15, 765–768. [Google Scholar] [CrossRef]
  22. Dawson, J.B. Sodium carbonate lavas from Oldoinyo Lengai. Nature 1962, 195, 1075–1076. [Google Scholar] [CrossRef]
  23. Foley, S.F.; Link, K.; Tiberindwa, J.V.; Barifaijo, E. Patterns and origin of igneous activity around the Tanzanian craton. J. Afr. Earth Sci. 2012, 62, 1–18. [Google Scholar] [CrossRef]
  24. Foley, S.F.; Fischer, T.P. An essential role for continental rifts and lithosphere in the deep carbon cycle. Nat. Geosci. 2017, 10, 897–902. [Google Scholar] [CrossRef]
  25. Dawson, J.B. Quaternary kimberlitic volcanism on the Tanzania craton. Contrib. Mineral. Petrol. 1994, 116, 473–485. [Google Scholar] [CrossRef]
  26. Russell, J.K.; Porritt, L.A.; Lavallee, Y.; Dingwell, D.B. Kimberlite ascent by assimilation-fuelled buoyancy. Nature 2012, 481, 352–356. [Google Scholar] [CrossRef]
  27. Foley, S.F.; Yaxley, G.M.; Kjarsgaard, B.A. Kimberlites from Source to Surface: Insights from Experiments. Elements 2019, 15, 393–398. [Google Scholar] [CrossRef]
  28. Selway, K. Electrical Discontinuities in the Continental Lithosphere Imaged with Magnetotellurics. In Lithospheric Discontinuities; Yuan, H., Romanowicz, B., Eds.; Geophysical Monograph Book Series; AGU: Washington, DC, USA, 2019; Volume 239, pp. 89–109. [Google Scholar]
  29. O’Donnell, J.P.; Adams, A.; Nyblade, A.A.; Mulibo, G.D.; Tugume, F. The uppermost mantle shear wave velocity structure of eastern Africa from Rayleigh wave tomography: Constraints on rift evolution. Geophys. J. Int. 2013, 194, 961–978. [Google Scholar] [CrossRef]
  30. Celli, N.L.; Lebedev, S.; Schaeffer, A.J.; Gaina, C. African cratonic lithosphere carved by mantle plumes. Nat. Commun. 2020, 11, 92. [Google Scholar] [CrossRef]
  31. Boyce, A.; Bastow, I.D.; Cottaar, S.; Kounoudis, R.; De Courbeville, J.G.; Caunt, E.; Desai, S. AFRP20: New P-Wavespeed Model for the African Mantle Reveals Two Whole-Mantle Plumes Below East Africa and Neoproterozoic Modification of the Tanzania Craton. Geochem. Geophys. Geosyst. 2021, 22, e2020GC009302. [Google Scholar] [CrossRef]
  32. Afonso, J.C.; Ben-Mansour, W.; O’Reilly, S.Y.; Griffin, W.L.; Salajeghegh, F.; Foley, S.; Begg, G.; Selway, K.; Macdonald, A.; Januszczak, N.; et al. Thermochemical structure and evolution of cratonic lithosphere in central and southern Africa. Nat. Geosci. 2022, 15, 405–410. [Google Scholar] [CrossRef]
  33. Lee, C.-T.; Rudnick, R. Compositionally stratified cratonic lithosphere and Geochemistry of peridototic xenoliths from the Labait volcano Tanzania. In Proceedings of the 7th International Kimberlite Conference, Cape Town, South Africa, 11–17 April 1998; Gurney, J.J., Richardson, S.R., Eds.; 1999; pp. 503–521. Available online: https://www.researchgate.net/publication/290162967 (accessed on 27 April 2025).
  34. Lloyd, F.E.; Bailey, D.K. Light element metasomatism of the continental mantle: The evidence and the consequences. Phys. Chem. Earth 1975, 9, 389–416. [Google Scholar] [CrossRef]
  35. Foley, S.F.; Jacob, D.E.; O’Neill, H.S.C. Trace element variations in olivine phenocrysts from Ugandan potassic rocks as clues to the chemical characteristics of parental magmas. Contrib. Mineral. Petrol. 2011, 162, 1–20. [Google Scholar] [CrossRef]
  36. Rosenthal, A.; Foley, S.F.; Pearson, D.G.; Nowell, G.M.; Tappe, S. Petrogenesis of strongly alkaline primitive volcanic rocks at the propagating tip of the western branch of the East African Rift. Earth Planet. Sci. Lett. 2009, 284, 236–248. [Google Scholar] [CrossRef]
  37. Giuliani, A.; Kamenetsky, V.S.; Phillips, D.; Kendrick, M.A.; Wyatt, B.A.; Goemann, K. Nature of alkali-carbonate fluids in the sub-continental lithospheric mantle. Geology 2012, 40, 967–970. [Google Scholar] [CrossRef]
  38. Sharygin, I.S.; Golovin, A.V.; Tarasov, A.A.; Dymshits, A.M.; Kovaleva, E. Confocal Raman spectroscopic study of melt inclusions in olivine of mantle xenoliths from the Bultfontein kimberlite pipe (Kimberley cluster, South Africa): Evidence for alkali-rich carbonate melt in the mantle beneath Kaapvaal Craton. J. Raman Spectrosc. 2022, 53, 508–524. [Google Scholar] [CrossRef]
  39. Shen, K.; Wang, D.; Zhang, R.; Chen, G.; Han, K.; Chen, P.; Zhang, R.; Zhang, Z. Amphibole’s influence on mid-lithosphere discontinuity: Insights from electrical conductivity. Geophys. Res. Lett. 2025, 52, e2024GL113651. [Google Scholar] [CrossRef]
  40. Yoshino, T.; Laumonier, M.; McIsaac, E.; Katsura, T. Electrical conductivity of basaltic and carbonatite melt-bearing peridotites at high pressures: Implications for melt distribution and melt fraction in the upper mantle. Earth Planet. Sci. Lett. 2010, 295, 593–602. [Google Scholar] [CrossRef]
  41. Yoshino, T.; Gruber, B.; Reinier, C. Effects of pressure and water on electrical conductivity of carbonate melt with implications for conductivity anomaly in continental mantle lithosphere. Phys. Earth Planet. Inter. 2018, 281, 8–16. [Google Scholar] [CrossRef]
  42. Podborodnikov, I.V.; Shatskiy, A.; Arefiev, A.V.; Chanyshev, A.D.; Litasov, K.D. The system Na2CO3-MgCO3 at 3GPa. High Press. Res. 2018, 38, 281–292. [Google Scholar] [CrossRef]
  43. Bekhtenova, A.; Shatskiy, A.; Podborodnikov, I.V.; Are, A.V.; Litasov, K.D. Phase relations in carbonate component of carbonatized eclogite and peridotite along subduction and continental geotherms. Gondwana Res. 2021, 94, 186–200. [Google Scholar] [CrossRef]
  44. Holtzman, B.K. Questions on the existence, persistence, and mechanical effects of a very small melt fraction in the asthenosphere. Geochem. Geophys. Geosyst. 2016, 17, 470–484. [Google Scholar] [CrossRef]
  45. Xu, Y.; Shankland, T.J.; Duba, A.G. Pressure effect on electrical conductivity of mantle olivine. Phys. Earth Planet. Inter. 2000, 118, 149–161. [Google Scholar] [CrossRef]
  46. Sifré, D.; Hashim, L.; Gaillard, F. Effects of temperature, pressure and chemical compositions on the electrical conductivity of carbonated melts and its relationship with viscosity. Chem. Geol. 2015, 418, 189–197. [Google Scholar] [CrossRef]
  47. Yoshino, T.; McIsaac, E.; Laumonier, M.; Katsura, T. Electrical conductivity of partial molten carbonate peridotite. Phys. Earth Planet. Inter. 2012, 194–195, 1–9. [Google Scholar] [CrossRef]
  48. Rader, E.; Emry, E.; Schmerr, N.; Frost, D.; Cheng, C.; Menard, J.; Yu, C.Q.; Geist, D. Characterization and Petrological Constraints of the Midlithospheric Discontinuity. Geochem. Geophys. Geosyst. 2015, 16, 3484–3504. [Google Scholar] [CrossRef]
  49. Rudnick, R.; McDonough, W.; Orpin, A. Northern Tanzanian peridotite xenoliths: A comparison with Kaapvaal peridotites and inferences on metasomatic interactions. In Kimberlites, Related Rocks and Mantle Xenoliths. Meyer, H.O.A., Leonardos, O., Eds.; Proceeding of the Fifth International Kimberlite Conference, Brasilia. 1994, Volume 1, pp. 336–353. Available online: https://www.researchgate.net/publication/280948731 (accessed on 27 April 2025).
  50. Dasgupta, R.; Mallik, A.; Tsuno, K.; Withers, A.C.; Hirth, G.; Hirschmann, M.M. Carbon-dioxide-rich silicate melt in the Earth’s upper mantle. Nature 2013, 493, 211–215. [Google Scholar] [CrossRef]
  51. O’Leary, J.A.; Gaetani, G.A.; Hauri, E.H. The effect of tetrahedral Al3+ on the partitioning of water between clinopyroxene and silicate melt. Earth Planet. Sci. Lett. 2010, 297, 111–120. [Google Scholar] [CrossRef]
  52. Falloon, T.J.; Green, D.H. The solidus of carbonated, fertile peridotite. Earth Planet. Sci. Lett. 1989, 94, 364–370. [Google Scholar] [CrossRef]
  53. Selway, K.; Yi, J.; Karato, S.I. Water content of the Tanzanian lithosphere from magnetotelluric data: Implications for cratonic growth and stability. Earth Planet. Sci. Lett. 2014, 388, 175–186. [Google Scholar] [CrossRef]
  54. Minarik, W.G.; Watson, E.B. Interconnectivity of carbonate melt at low melt fraction. Earth Planet. Sci. Lett. 1995, 133, 423–437. [Google Scholar] [CrossRef]
  55. Heaman, L.M.; Kjarsgaard, B.A.; Creaser, R.A. The timing of kimberlite magmatism in North America: Implications for global kimberlite genesis and diamond exploration. Lithos 2003, 71, 153–184. [Google Scholar] [CrossRef]
  56. Aiuppa, A.; Casetta, F.; Coltorti, M.; Stagno, V.; Tamburello, G. Carbon concentration increases with depth of melting in Earth’s upper mantle. Nat. Geosci. 2021, 14, 697–703. [Google Scholar] [CrossRef]
  57. Weiss, Y.; Czas, J.; Navon, O. Fluid Inclusions in Fibrous Diamonds. Rev. Mineral. Geochem. 2022, 88, 475–532. [Google Scholar] [CrossRef]
  58. Aulbach, S. Cratonic Lithosphere Discontinuities: Dynamics of Small-Volume Melting, Metacratonization, and a Possible Role for Brines. In Lithospheric Discontinuities; Yuan, H., Romanowicz, B., Eds.; Geophysical Monograph Book Series; AGU: Washington, DC, USA, 2019; Volume 239, pp. 177–203. [Google Scholar]
  59. Guo, H.H.; Keppler, H. Electrical Conductivity of NaCl-Bearing Aqueous Fluids to 900 °C and 5 GPa. J. Geophys. Res.-Solid Earth 2019, 124, 1397–1411. [Google Scholar] [CrossRef]
  60. Glover, P.W.J. A generalized Archie’s law for n phases. Geophysics 2010, 75, E247–E265. [Google Scholar] [CrossRef]
  61. Newton, R.C.; Sharp, W.E. Stability of forsterite + CO2 and its bearing on the role of CO2 in the mantle. Earth Planet. Sci. Lett. 1975, 26, 239–244. [Google Scholar] [CrossRef]
  62. Hirschmann, M.M. Mantle solidus: Experimental constraints and the effects of peridotite composition. Geochem. Geophys. Geosyst. 2000, 1. [Google Scholar] [CrossRef]
  63. Stamm, N.; Schmidt, M.W. Asthenospheric kimberlites: Volatile contents and bulk compositions at 7 GPa. Earth Planet. Sci. Lett. 2017, 474, 309–321. [Google Scholar] [CrossRef]
  64. Sparks, D.W.; Parmentier, E.M. Melt extraction from the mantle beneath spreading centers. Earth Planet. Sci. Lett. 1991, 105, 368–377. [Google Scholar] [CrossRef]
  65. Hammouda, T.; Laporte, D. Ultrafast mantle impregnation by carbonatite melts. Geology 2000, 28, 283–285. [Google Scholar] [CrossRef]
  66. Muirhead, J.D.; Fischer, T.P.; Oliva, S.J.; Laizer, A.; van Wijk, J.; Currie, C.A.; Lee, H.; Judd, E.J.; Kazimoto, E.; Sano, Y.; et al. Displaced cratonic mantle concentrates deep carbon during continental rifting. Nature 2020, 582, 67–72. [Google Scholar] [CrossRef] [PubMed]
Figure 1. Schematic diagram of the experimental assembly.
Minerals 15 00466 g001
Figure 2. Complex impedance spectra represented in a Cole-Cole plot, the imaginary part (Z″) of the impedance is plotted against the real part (Z′) for the olivine sample containing 1.0 wt% Na2CO3 (left) and pure Na2CO3 sample (right) at 3 GPa.
Minerals 15 00466 g002
Figure 3. The relationship between the logarithm of the electrical conductivity and the reciprocal of temperature for Na2CO3-bearing samples during multiple heating and cooling cycles at 3 GPa. (a) the experimental results of pure sodium carbonate sample; (bd) the experimental results of olivine aggregate samples containing 1.0 wt%, 0.5 wt%, and 0.25 wt% sodium carbonate, respectively.
Minerals 15 00466 g003
Figure 4. Logarithm of electrical conductivity (log σ) for alkali-rich carbonated olivine aggregates after partial melting as a function of reciprocal of temperature (K−1). The dots represent the experimental results for partially molten samples with different Na2CO3 contents at a pressure of 3 GPa. The solid lines indicate results linearly fitted by Equation (2). The red dashed line represents the electrical conductivities for olivine aggregates at 4 GPa [45]. The green dashed line represents the electrical conductivities for the anhydrous alkali-rich carbonate melt at a pressure of 3.4 GPa. The molar ratio of Na2CO3 to MgCO3 in the carbonate mixture was 7:3 [41].
Minerals 15 00466 g004
Figure 5. Solidi of carbonated peridotite, geotherm curves, and conductivity-depth profiles of the Tanzanian craton (southern and northern profiles) and Mozambique belt/East Africa rift, respectively. The red and blue dots represent the geothermometry data estimated by using pyroxene in xenoliths/xenocrysts from the Lashaine [49] and Labait [33] regions, respectively. The black and green dashed lines are the depth–temperature profiles calculated using surface heat flow values of 44 and 50 mWm−2 [20], representing the geothermal gradients of the Tanzanian craton and the Mozambique Belt, respectively. Other dashed lines are the solidi of the carbonated peridotite, where the carbonates added in the peridotite are K2CO3 (red), Na2CO3 (purple), and CaMgCO3 (black) [43,50]. The yellow dashed line is the solidus of peridotite containing 200 ppm water [51], and the black dotted line is the solidus of Hawaiian pyrolite + 2.06 wt% CO2 + 2.12 wt% H2O [52]. The blue and red lines represent the conductivity-depth profiles of the central Tanzanian craton, and the gray line represents the conductivity-depth profile of the Mozambique mobile belt/East Africa rift zone [28]. The depth range of the high-conductivity layer provided by the 3D model (yellow shaded area [11]) is approximately 50 km shallower than that of the 2D model (red shaded area [12]).
Minerals 15 00466 g005
Figure 6. Relationship between the melt mass fraction and depth/temperature calculated using Equation (3) for various conductivity in the lithospheric mantle of Tanzanian craton. The red and blue curves are the profiles of the melt fraction-depth calculated using the conductivity-depth of the northern and southern profiles and the distribution of temperature in the lithospheric mantle of the Tanzanian craton, respectively. The dashed lines show the melt mass fraction versus depth/temperature for the different electrical conductivity contours. The digits are the values of log σ.
Minerals 15 00466 g006
Figure 7. Distribution of melt in the continental lithospheric mantle. The solidi of the Na/K-carbonated peridotite and Ca/Mg-carbonated peridotite intersect the geotherm of the Tanzanian craton at depths of 80 and 120 km, respectively. The depth range between them was defined as the enrichment region of the alkali-rich carbonate melt. The region between the solidus of the Ca/Mg-carbonated peridotite and 25 wt% CO2 isopleths for the carbonated silicate melts is defined as the enrichment region of the Ca/Mg carbonate melt. The region between the 25 wt% CO2 isopleths and solidus of the volatile-free peridotite was defined as the region where carbonated silicate melts were present. The region where silicate melts were present was determined using the results of Hirschmann [62]. The decarbonation reaction (En + Mag = Fo + CO2 [60]; 4En + Dol = 2Fo + Di + 2CO2 [52]) and decarbonation model [26] were used to determine the decarbonation region. In areas with a high heat flow, the decarbonation reaction occurs at shallow depths. CO2 in the carbonatitic or kimberlitic melts transported upward is volatile exsolution. The temperature distribution is displayed based on the data from Hasterok et al. [20]. Mantle adiabat was calculated for a potential temperature of 1300 °C using thermal expansivity of 2.58 × 10⁻⁵ K−1 and grain heat capacity of 0.72 kJ·kg−1·K−1.
Minerals 15 00466 g007
Table 1. Fitting results by using Arrhenius relationship for Na2CO3-bearing olivine aggregates after partial melting, alkali-rich carbonate melts, dolomite melt, and San Carlos olivine.
SampleP (GPa)T (°C)logσ0 (S/m)H (kJ/mol)R2Ref.
0.25 wt% Na2CO33900–12000.4667.050.97This study
0.5 wt% Na2CO331000–12000.7065.640.95This study
1 wt% Na2CO33900–12001.2665.220.94This study
100 wt% Na2CO331200–12503.7136.480.81This study
Na2CO3:MgCO3 = 70:303.41000–14273.2034.73 [41]
Na2CO3:MgCO3 = 50:5031050–13503.3333.55 [46]
Dolomite31327–15273.1338 [47]
San Carlos olivine41000–14002.69159 [45]
Table 2. Mass fractions of alkali-carbonate melt (wt%) at the different depth/temperature in the Tanzanian cratonic mantle.
Conductivities75 km/760 °C 100 km/938 °C 130 km/1152 °C
σ max = 0.107.03 3.00 1.43
σ median = 0.032.84 1.21 0.58
σ min = 0.011.24 0.53 0.25
Disclaimer/Publisher’s Note: The statements, opinions and data contained in all publications are solely those of the individual author(s) and contributor(s) and not of MDPI and/or the editor(s). MDPI and/or the editor(s) disclaim responsibility for any injury to people or property resulting from any ideas, methods, instructions or products referred to in the content.

