1. Introduction
As it is known, 95% of global REY (group of metals including 15 lanthanides and yttrium) deposits belong to China. However, in recent years, large-scale use of rare earth resources with high concentration and growing demand for high-grade rare earth deposits have caused REY stocks to deplete in China. As a result, REY extraction from unconventional resources has high economic and strategic value since the demand for rare earth products continue to rise annually [
1].
The continuous development of new advanced technologies caused an increased demand for rare earth elements (REEs) on the international market, and special attention is given to finding new resources to create an adequate supply for current and future use. Since the use of main commercially viable REE-rich sources containing up to 70% rare earth oxides (REO), such as carbonaceous bastnasite and phosphate monazite is becoming limited, research focus shifts toward ion-adsorption clays as an alternative source of lanthanides in ion-absorbed rare earth ore (IAREO) [
2]. An increased importance is given to developing technologies for their extraction from rich deposit processing products, which are seen not as waste but as actual technogenic raw materials, such as coals [
3], phosphoric slag [
4], phosphogypsum [
5,
6], or clays [
7,
8]. Although argillaceous deposits containing adsorbed lanthanides have significantly lower REE content than other sources (0.05–0.5 REEs by mass), their abundance in surface layers, high specific surface area for adsorption, and relative extraction and processing simplicity make them economically important sources of rare earth elements.
The Kundybay deposit is located in Northern Kazakhstan and is one of the main and largest REE deposits in Central Asia [
9,
10]. The weathering core crust of the Kundybay deposit is a promising and relatively new industrial-genetic type of REE, featuring a complex mineralogical structure consisting of various minerals such as quartz (SiO
2), churchite (YPO
4×2H
2O), bastnasite ((Ce,La,Y)CO
3F), kaolinite, etc. REE content in this ore ranges from 0.048–0.064%, and according to some data, it reaches 0.320% [
11,
12]. It is known that REs and REEs can be interspersed within the matrix structure of argillaceous ores [
2]. Consequently, enrichment methods used in metallurgy (flotation, magnetic concentration, etc.) are ineffective [
13].
Acidic leaching is the main way of leaching for REEs. Normally, acids such as H
2SO
4, HNO
3, and HCl, and their combinations are used [
14,
15]. However, there is no universally perfect acid that maximizes leaching efficiency for REE extraction from all sources. The efficiency of various acid types or their combinations largely depends on the specific mineralogy and elemental composition of processed materials. For example, in this study, silicate REE in the form of Ca
2RE
8(SiO
4)
6O
2 was leached by HCl solution with 3 mol/L concentration, where the yield of La, Ce, and Nd reached 99.79%, 99.89%, and 99.73%, respectively [
16]. However, the use of H
2SO
4 solution yielded only 88% of RE = La, Ce, Pr, Nd. This incomplete transition is associated with the formation of CaSO
4, which in turn, co-sediments REEs [
17]. Pan et al. [
18] use a mixture of H
2SO
4 and HF to define the REE aluminosilicate fraction in coal and conclude that 69% of REMs are present in aluminosilicate form. The use of HF is related to a higher electronegativity of F
− compared to other anions; due to this, it displaces the O
2− ion from the Si–O bond because of its strong polarizing effect [
19].
Water leaching is a simple and inexpensive process, depending on the initial material’s solubility. Rare earth minerals such as carbonates and phosphates have low water solubility. Thus, they are usually transformed into more soluble forms—chlorides or sulphates—before water leaching [
20]. For example, after treating the Kundybay deposit ore with H
2SO
4 at 200 °C followed by water leaching at 90 °C, 84% of REEs were extracted [
21]. In the case of mixed REE minerals, water leaching may dissolve calcinated products such as REE chlorides or sulphates, while slag components with low solubility are filtered out. Despite low costs, water leaching requires proper raw material preparation through preliminary annealing or similar treatment in order to turn REEs into soluble forms.
In recent years, ion sorption methods of REE extraction have gained more attention from the scientific community thanks to their efficiency, selectivity, and eco-friendliness. This type of ore is presented mainly by such minerals such as mica, potassium feldspar, caolinite, and quartz. Due to negative charge formation on clay particles and REE ions pulling to their surface, standard ion exchange technology takes place. Organic salts, sulphates, chlorides, and calcium/magnesium/ammonium/sodium nitrates are used as electrolytes [
22,
23,
24]. According to hydration theory, leaching ability of electrolytes mainly depends potential of hydration ions’, as the force of cation gravitation toward clay minerals involves electrical interactions that depend on the ion charge and the distance between the hydration ion and the clay mineral surface. In case of identical concentration and ion valence, the smaller the hydration ion radius is, the higher the cation adsorption ability is; thus, the higher the leaching ability is; the higher the valence is, the higher the cation adsorption ability leading to stronger leaching ability. However, the REM leaching order found by Yang et al. and Yanfei et al. (Al
3+ > NH
4+ > Mg
2+) suggests that there can be another interaction between ammonium ions and clay particle surfaces, for example, hydrogen bond formation [
24,
25]. The leaching yield salt solutions for ion sorption ores exceeds 95% [
26,
27,
28].
Various theoretical models are widely used in contemporary literature to study the kinetics of REE leaching from solid materials. One of the widely used models is the shrinking-core model, which includes the diffusion controlling model, the chemical reaction on the surface, and the mixed controlling model [
29,
30].
Chemical reaction controlling type:
Diffusion controlling type:
Mixed controlling type:
where
x is the rare earth leaching efficiency,
t is the leaching time,
k1,
k2, and
k3 are apparent reaction rate constants, and
β is the solid substance and film diffusion resistance ratio.
Yang and Honaker (2020) [
31] studied kinetics of REE leaching from aluminosilicate ore. Leaching was performed using a 1M H
2SO
4 solution. It was found that process activation energy at the initial stage of reaction was 36 kJ/mol and fell to 27 kJ/mol in the following stages. The observed leaching mechanism changes from chemical reaction to diffusion control through product shell. Also, Kim et al. (2014) [
32] studied lanthanum leaching from slag using H
2SO
4. The authors argue that this process kinetics is defined by two stages: initial chemical reaction and following diffusion through ashes layer. The activation energy for the chemical reaction stage is 10 kJ/mol, and for the diffusion stage—24.8 kJ/mol.
For ion adsorption, the activation energy varies between 8.48 and 8.59 kJ/mol; the process is controlled by internal diffusion [
33,
34].
The choice of opening method depends on multiple factors, the main one being the mineralogical composition of the layers. It should be noted that currently there is no data on the Kundybay deposit weathering crust ore processing targeted at REE concentrating. The abovementioned studies deal either with REE concentrate from the Kundybay deposit or with ores of similar composition, or aim at white soot obtaining technology development. Thus, it is important to perform complex kinetics research and systematically estimate the influence of reagents in order to find optimal REE extraction technology specifically for the ores from this deposit. The objective of this study is to research the kinetics and process intensification for REE extraction from the weathering crust ores of the Kundybay deposit. The obtained kinetic data will allow us to define limiting stages of the process and optimize technological parameters for the efficient extraction of rare earth elements’.
2. Materials and Methods
2.1. Initial Raw Material Sample Preparation
A gross sample of 5.00 kg of the Kundybay deposit weathering crust ore was mixed using the coning and quartering method and reduced through quartering, followed by sample collection using the chessboard method. The ore was crushed on a disk grinder ID-65 (Vibrotechnik LLC, St. Petersburg, Russia), to +0.04–0.063 mm grain size.
2.2. X-Ray Phase Analysis (XRD)
Initial raw material samples’ and post-leaching cakes’ structural characteristics were found using X-ray diffraction (XRD) on a MiniFlex 600 unit (Rigaku, Tokyo, Japan) using Cu Kα radiation at 40 kV and 15 mA. Measurements were taken within the range of 2θ between 3° and 100° at a speed of 2°/min and step 0.01°. The PDF-2 database was used for deciphering.
2.3. Morphological and Elemental Analysis
The morphology and the elemental distribution of the samples were conducted using the Scanning Electron Microscope–SEM Hitachi SU8230 (Hitachi, Tokyo, Japan), coupled with an Energy-Dispersive X-ray (EDX) detector, operated at 30 kV and cold-field emission (Oxford Instruments, Oxford, UK, AZtec Software, version 3.3). The samples were mounted on a double-sticky carbon band on top of Cu-Zn stubs. To prevent the alteration of the samples, no further processing was conducted (i.e., sputter coating with noble metals).
2.4. Analyzing Possibilities of REE Extraction by Salt Solutions
In order to estimate the efficiency of REE leaching from the Kundybay deposit weathering crust ore, 2% solutions of (NH
4)
2SO
4, MgSO
4, and Al
2(SO
4)
3 were used. Leaching was performed for 1 h,
T = 25 °C, L:S ratio = 10, mixing rate 180 rpm, and pH = 4. Leaching was performed through the method given in [
2].
2.5. Inductively Coupled Plasma Mass Spectrometry (ICP-MS)
After leaching, samples were diluted 100-fold and quantitatively analyzed for REE content by the ICP-MS method Agilent 7500a (Agilent Technologies, Inc., Santa Clara, CA, USA). Solutions containing 5 to 1000 µg/L of REE amount were used for calibration by the External Standard Method.
2.6. Experimental Ore Properties and Composition
In order to find SiO2 content, the method of sintering with Na2CO3 followed by sintered mass treatment with HCl was used. Sintering conditions were 40 min at 800 °C.
The percentage of SiO
2(X) was calculated according to the formula:
where:
is the mass of smelting pot with baked SiO2 sediment;
is the mass of baked smelting pot;
is the mass of ore aliquot, g.
For qualitative elemental analysis, preliminary sample decomposition in a microwave sample preparation system «Speedwave4» (Berghof GmbH, Eningen, Germany) was performed. An ore aliquot (0.2–0.4 g) and acid mixture (HCl, HNO3, and HF) were put in a Teflon autoclave and air-sealed. Decomposition was completed at 60 atm pressure, 2500 Hz microwave radiation, and 110 °C for 30 min. Sample uncovering was performed through the selection of decomposing mixture, acid concentration, temperature program, phase contact time, and L:S ratio. After decomposition, the autoclave content was transferred into a 50 mL flask and filled to the mark with distilled water. The obtained solutions were analyzed using ICP-MS. Subsequently, ore uncovering was completed through leaching in laboratory conditions by concentrated acid mixtures of HCl, H2SO4, and HNO3, followed by HF treatment for silicon removal.
The metals percentage (X) was calculated using the following formula:
where:
C is the metal concentration, mg/L;
V is the solution volume, L;
m is the mass of ore aliquot, g.
2.7. Reagents
ICP-MS multi-element calibration standard-1, 10 µg/mL Ce, Dy, Er, Eu, Gd, Ho, La, Lu, Nd, Pr, Sc, Sm, Tb, Th, Tm, Y, Yb in 5% HNO3, 100 mL, Agilent
sodium pyrosulfite, 98.9% (GOST 11683-76), CAS: 7681-57-4, EKOS-1
sulphuric acid 96.3% (GOST 2184-77), CAS: 7664-93-9, EKOS-1
hydrochloric acid 36% (GOST 3118-77), CAS: 7647-01-0, EKOS-1
fluohydric acid 45% (GOST 10484-78), CAS: 7664-39-3, EKOS-1
sodium hydroxide 99% (GOST 4328-77), CAS: 1310-73-2, EKOS-1
sodium carbonate 99.8% (GOST 83-79), CAS: 497-19-8, EKOS-1.
2.8. Finding Optimal Conditions for REE Leaching from Experimental Ore
The following were selected as controlled parameters in the optimal conditions finding process: L:S (5, 10, 20), temperature (20, 50, 70 °C), leaching mixture composition H2SO4 50 g/L, Na2S2O5 20 g/L, and HF 3 g/L; HCl 100 g/L; H2SO4 100 g/L. Leaching experiments were performed in thermal-resistant beakers of 100 mL volume on a heated electromagnetic mixer IKA RCT basic (IKA, Staufen, Germany), with a mixing rate of 150 rpm for 2 h.
2.9. Kinetic Modelling
The contracting core model, widely used to describe solid and liquid phase interaction processes, was applied to study ore leaching kinetics [
35]. The experimental part used the Kundybay deposit weathering crust ore samples and a leaching solution containing HCl, HF, and Na
2S
2O
5. It was supposed that ore particles have a spherical shape, which allows to the application of the contracting core model. The kinetic study of the leaching process was described through two main mechanisms: surface reaction and diffusion through forming product layer, which are expressed through Equations (1) and (2).
Kinetic constants obtained experimentally were used to calculate the leaching process activation energy via the Arrhenius equation:
where
k is the reaction speed constant for chemical reaction (
kc) and diffusion (
kd),
A is the pre-exponential factor (frequency factor),
R is the gas constant,
T is the thermodynamic temperature,
Ea is the activation energy for chemical reaction process, and E
c is for diffusion E
d.
3. Results
Ore elemental composition was defined to identify ore type, its properties estimation, and further optimization of leaching processes (
Table 1). The weathering crust is represented by elements such as O, Si, Al, Fe, and K; however, REEs were under the limit of detection of the EDX detector used. The total REE content found using the ICP-MS method is 372.7 ppm (
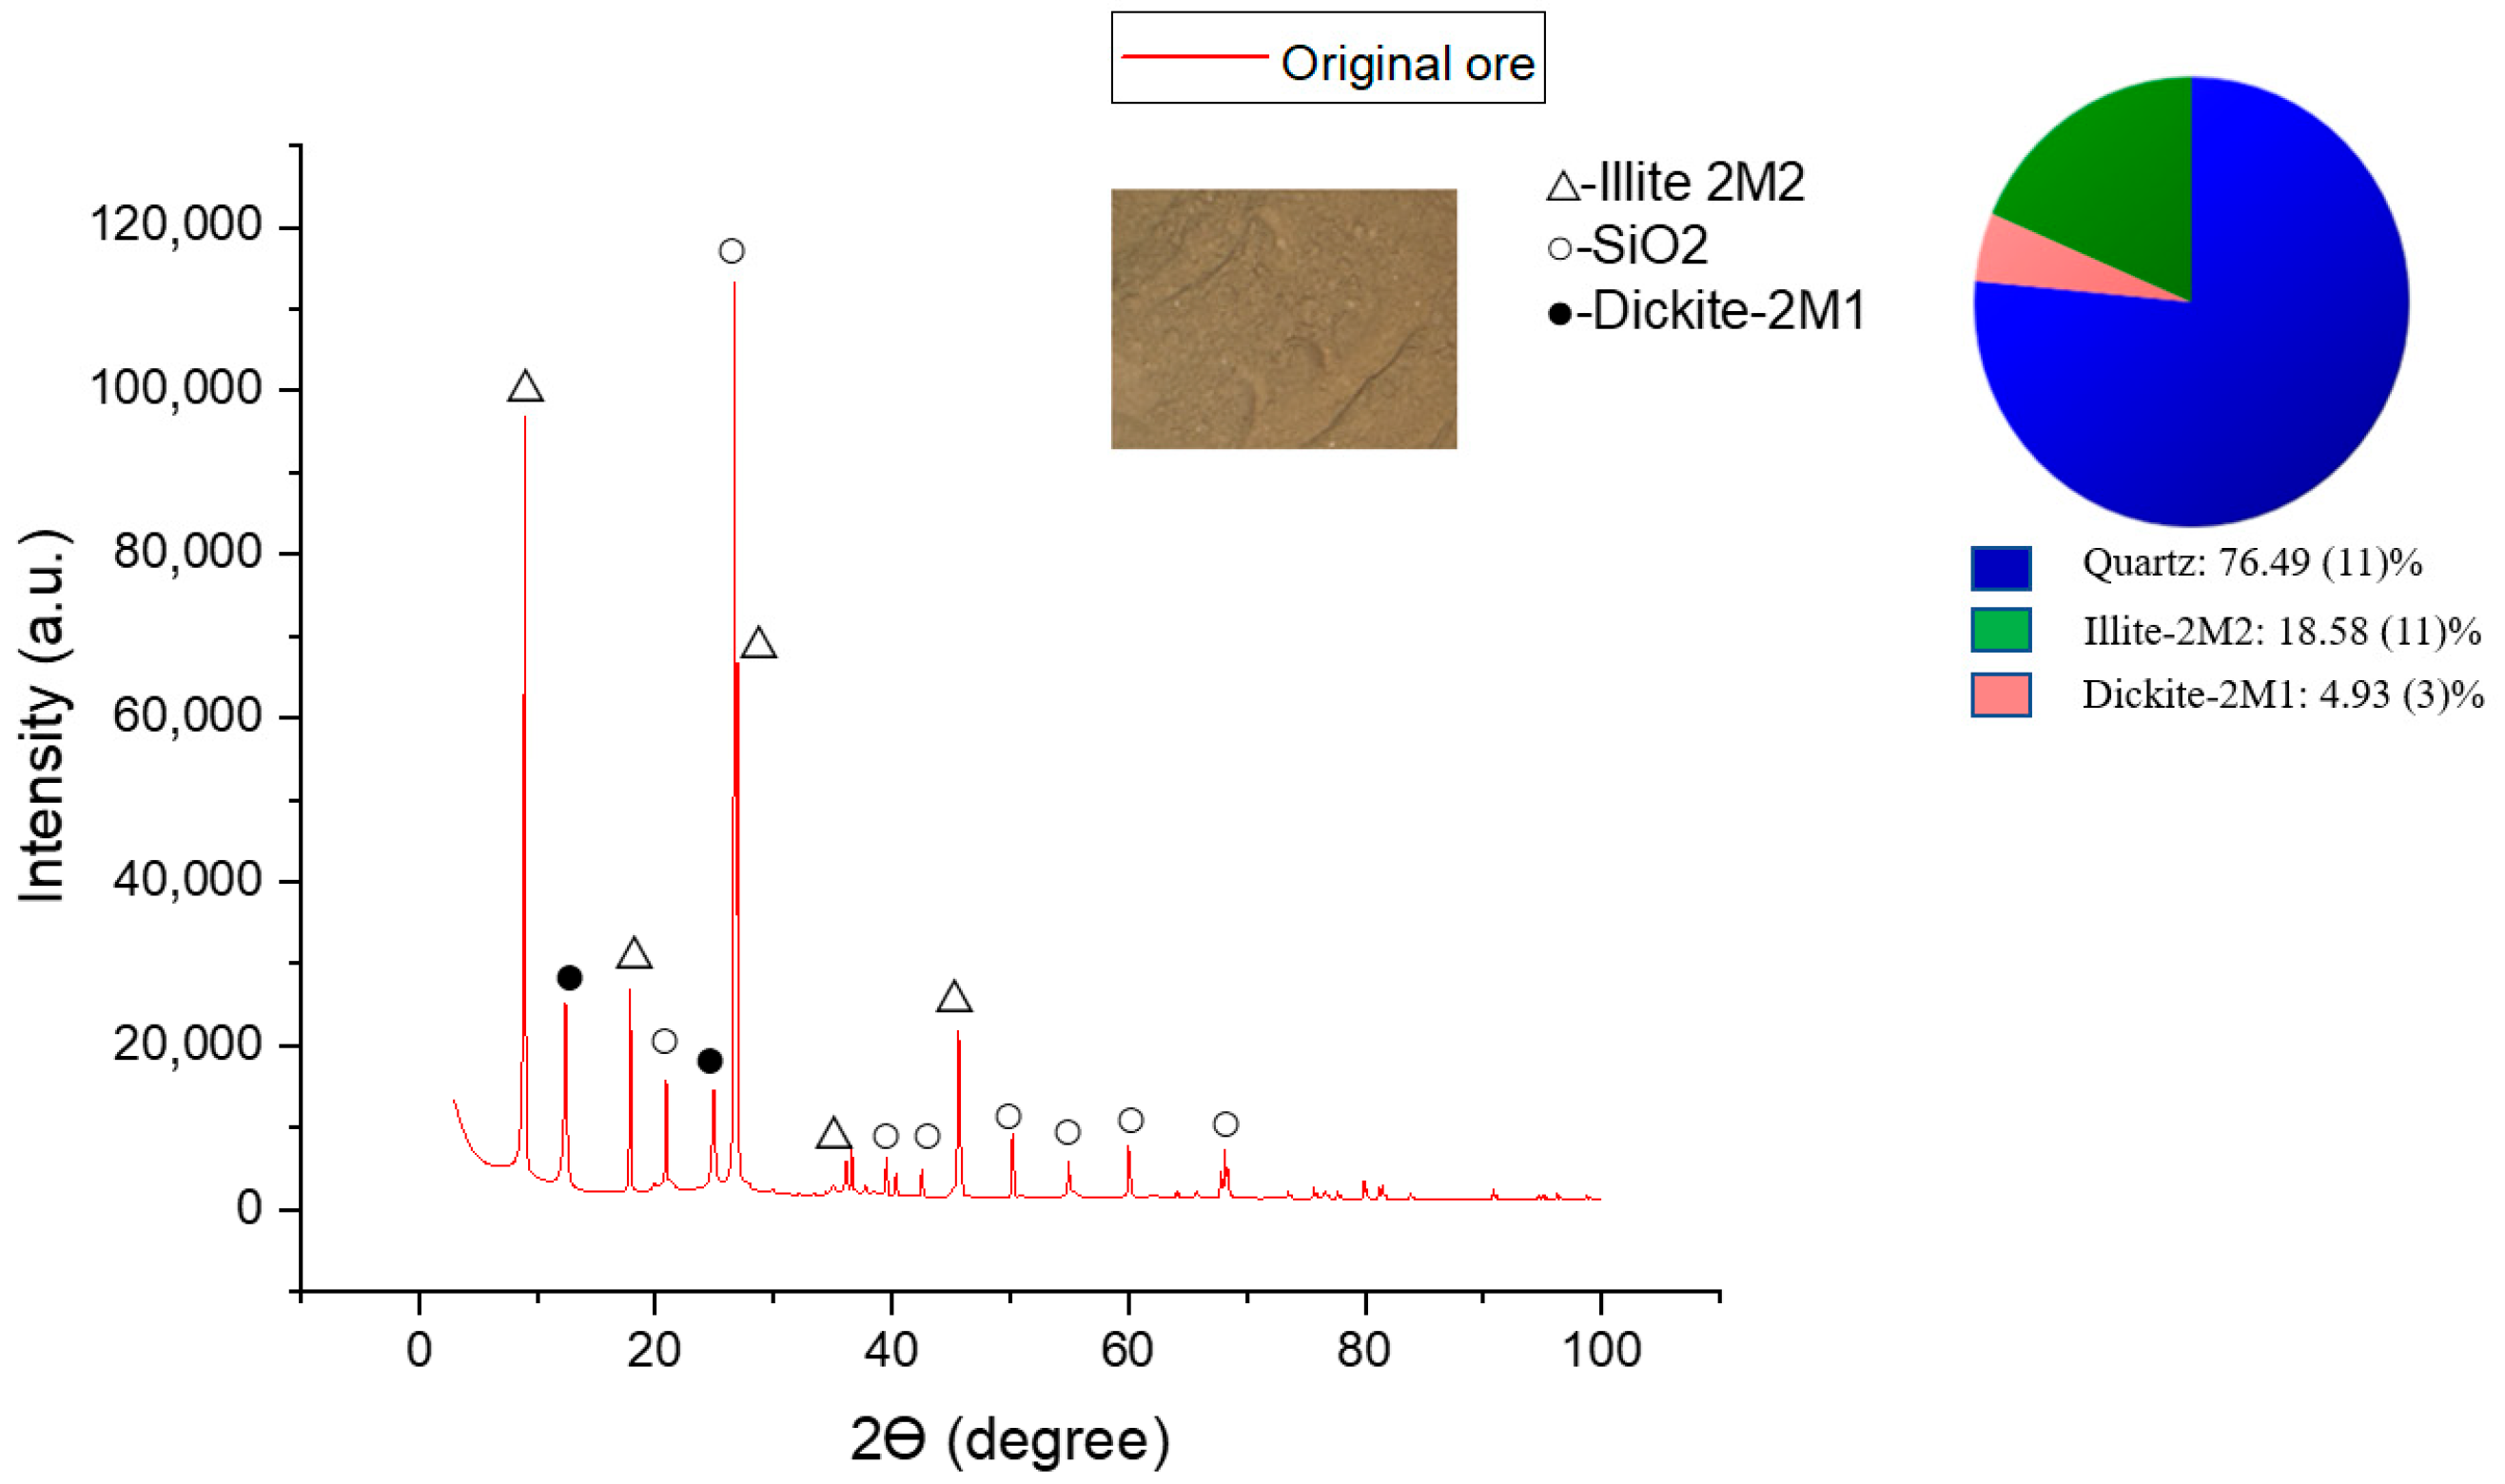
Table 2). The main REE content in the ore is the following (ppm): La (55.2 ± 0.2), Ce (116.2 ± 0.5), Nd (61.2 ± 0.2), Y (52.2 ± 0.1), Sc (22.9 ± 0.1). According to previous studies, the prevailing elements in the weathering crust are light lanthanides with a dominant content of cerium [
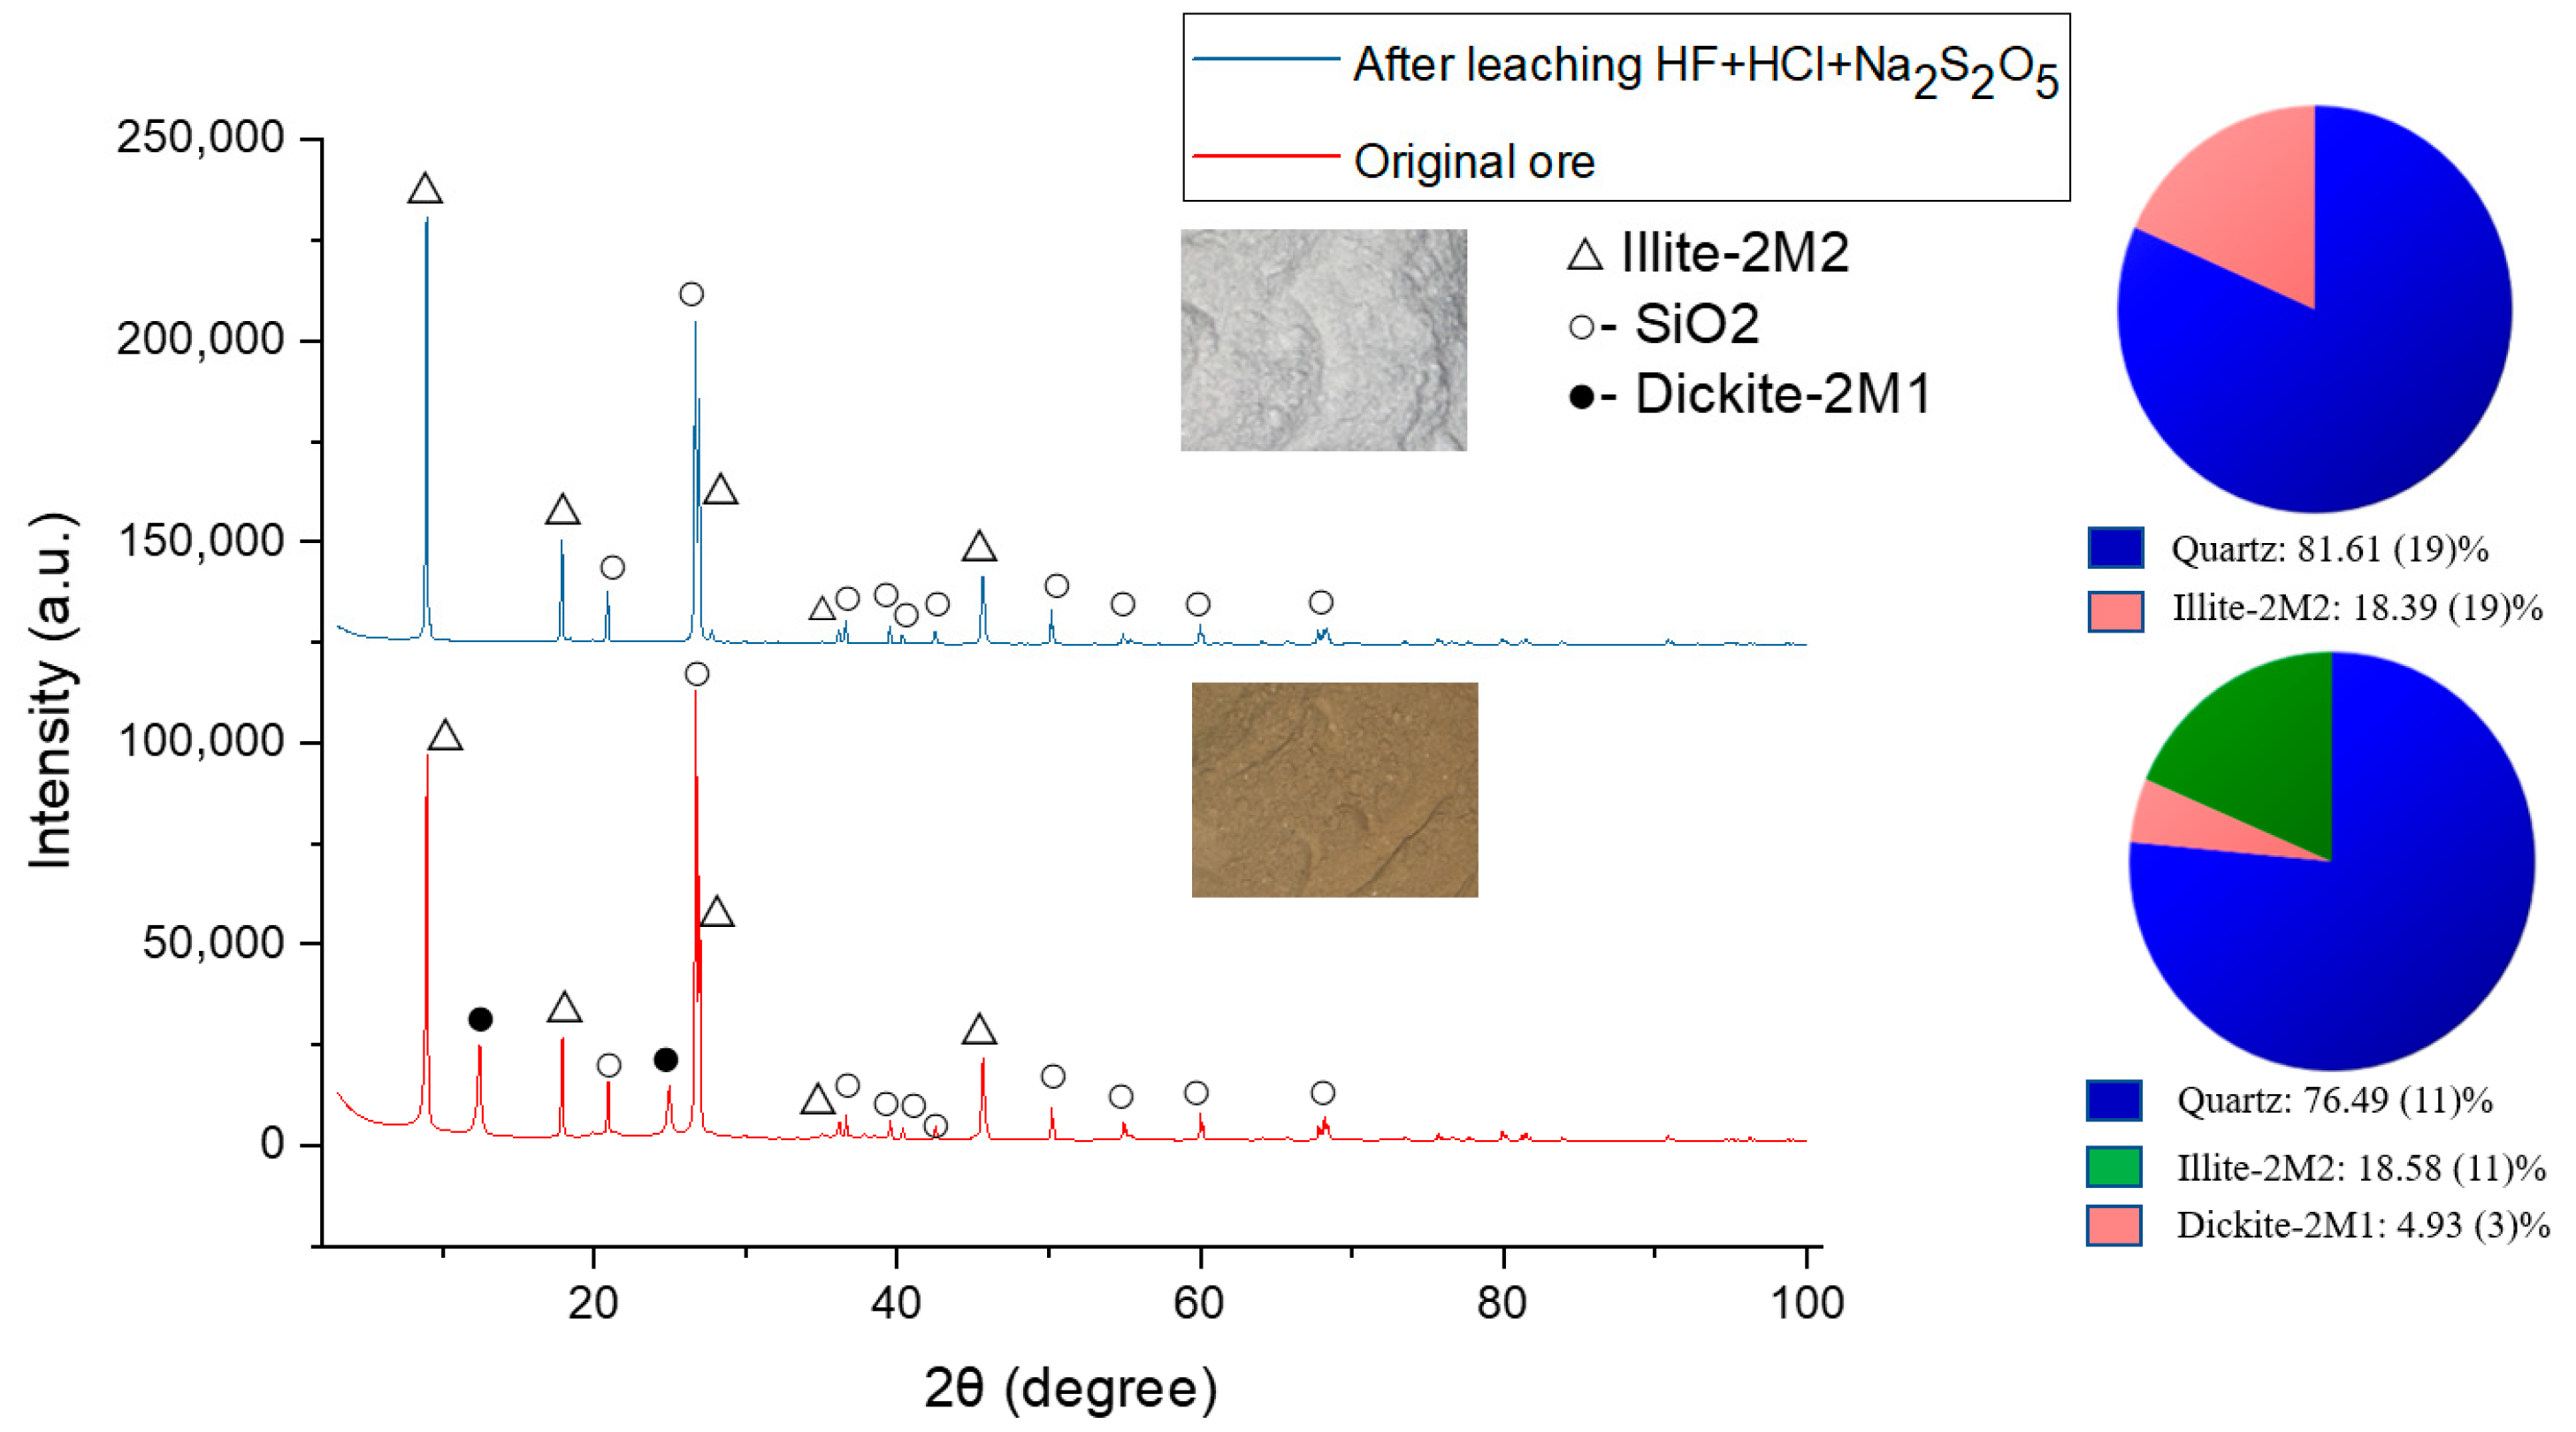
36]. Primary ore phases defined by the XRD method are quartz (SiO
2)—76.49%, illite (KAl
2(Si
3Al)O
10(OH)
2×H
2O)—18.58% and dickite (Al
2Si
2O
5(OH)
4)—4.93%. Intense peaks typical of quartz are seen at 2
θ = 26.7° (d = 3.33 Å), 2
θ = 20.92° (d = 4.24 Å), which prove its presence as the primary phase. Illite peaks are identified at 2
θ = 8.95° (d = 9.86 Å), 2
θ = 17.89° (d = 4.95 Å), 2
θ = 26.94° (d = 3.306 Å), and dickite peaks at 2
θ = 12.41° (d = 7.12 Å), 2
θ = 24.93° (d = 3.56 Å), and 2
θ = 45.64° (d = 1.986 Å). Dickite is found in the weathering crust of kaolinite deposits. This is explained by the fact that kaolinite found in the Kundybay deposit ore is exposed to geothermal activity, which causes the formation of dickite along with minerals [
21,
37]. In the weathering process, dickite and illite form microstructures in combination with secondary iron oxide compounds, which explains the yellow color of weathering crust (
Figure 1) [
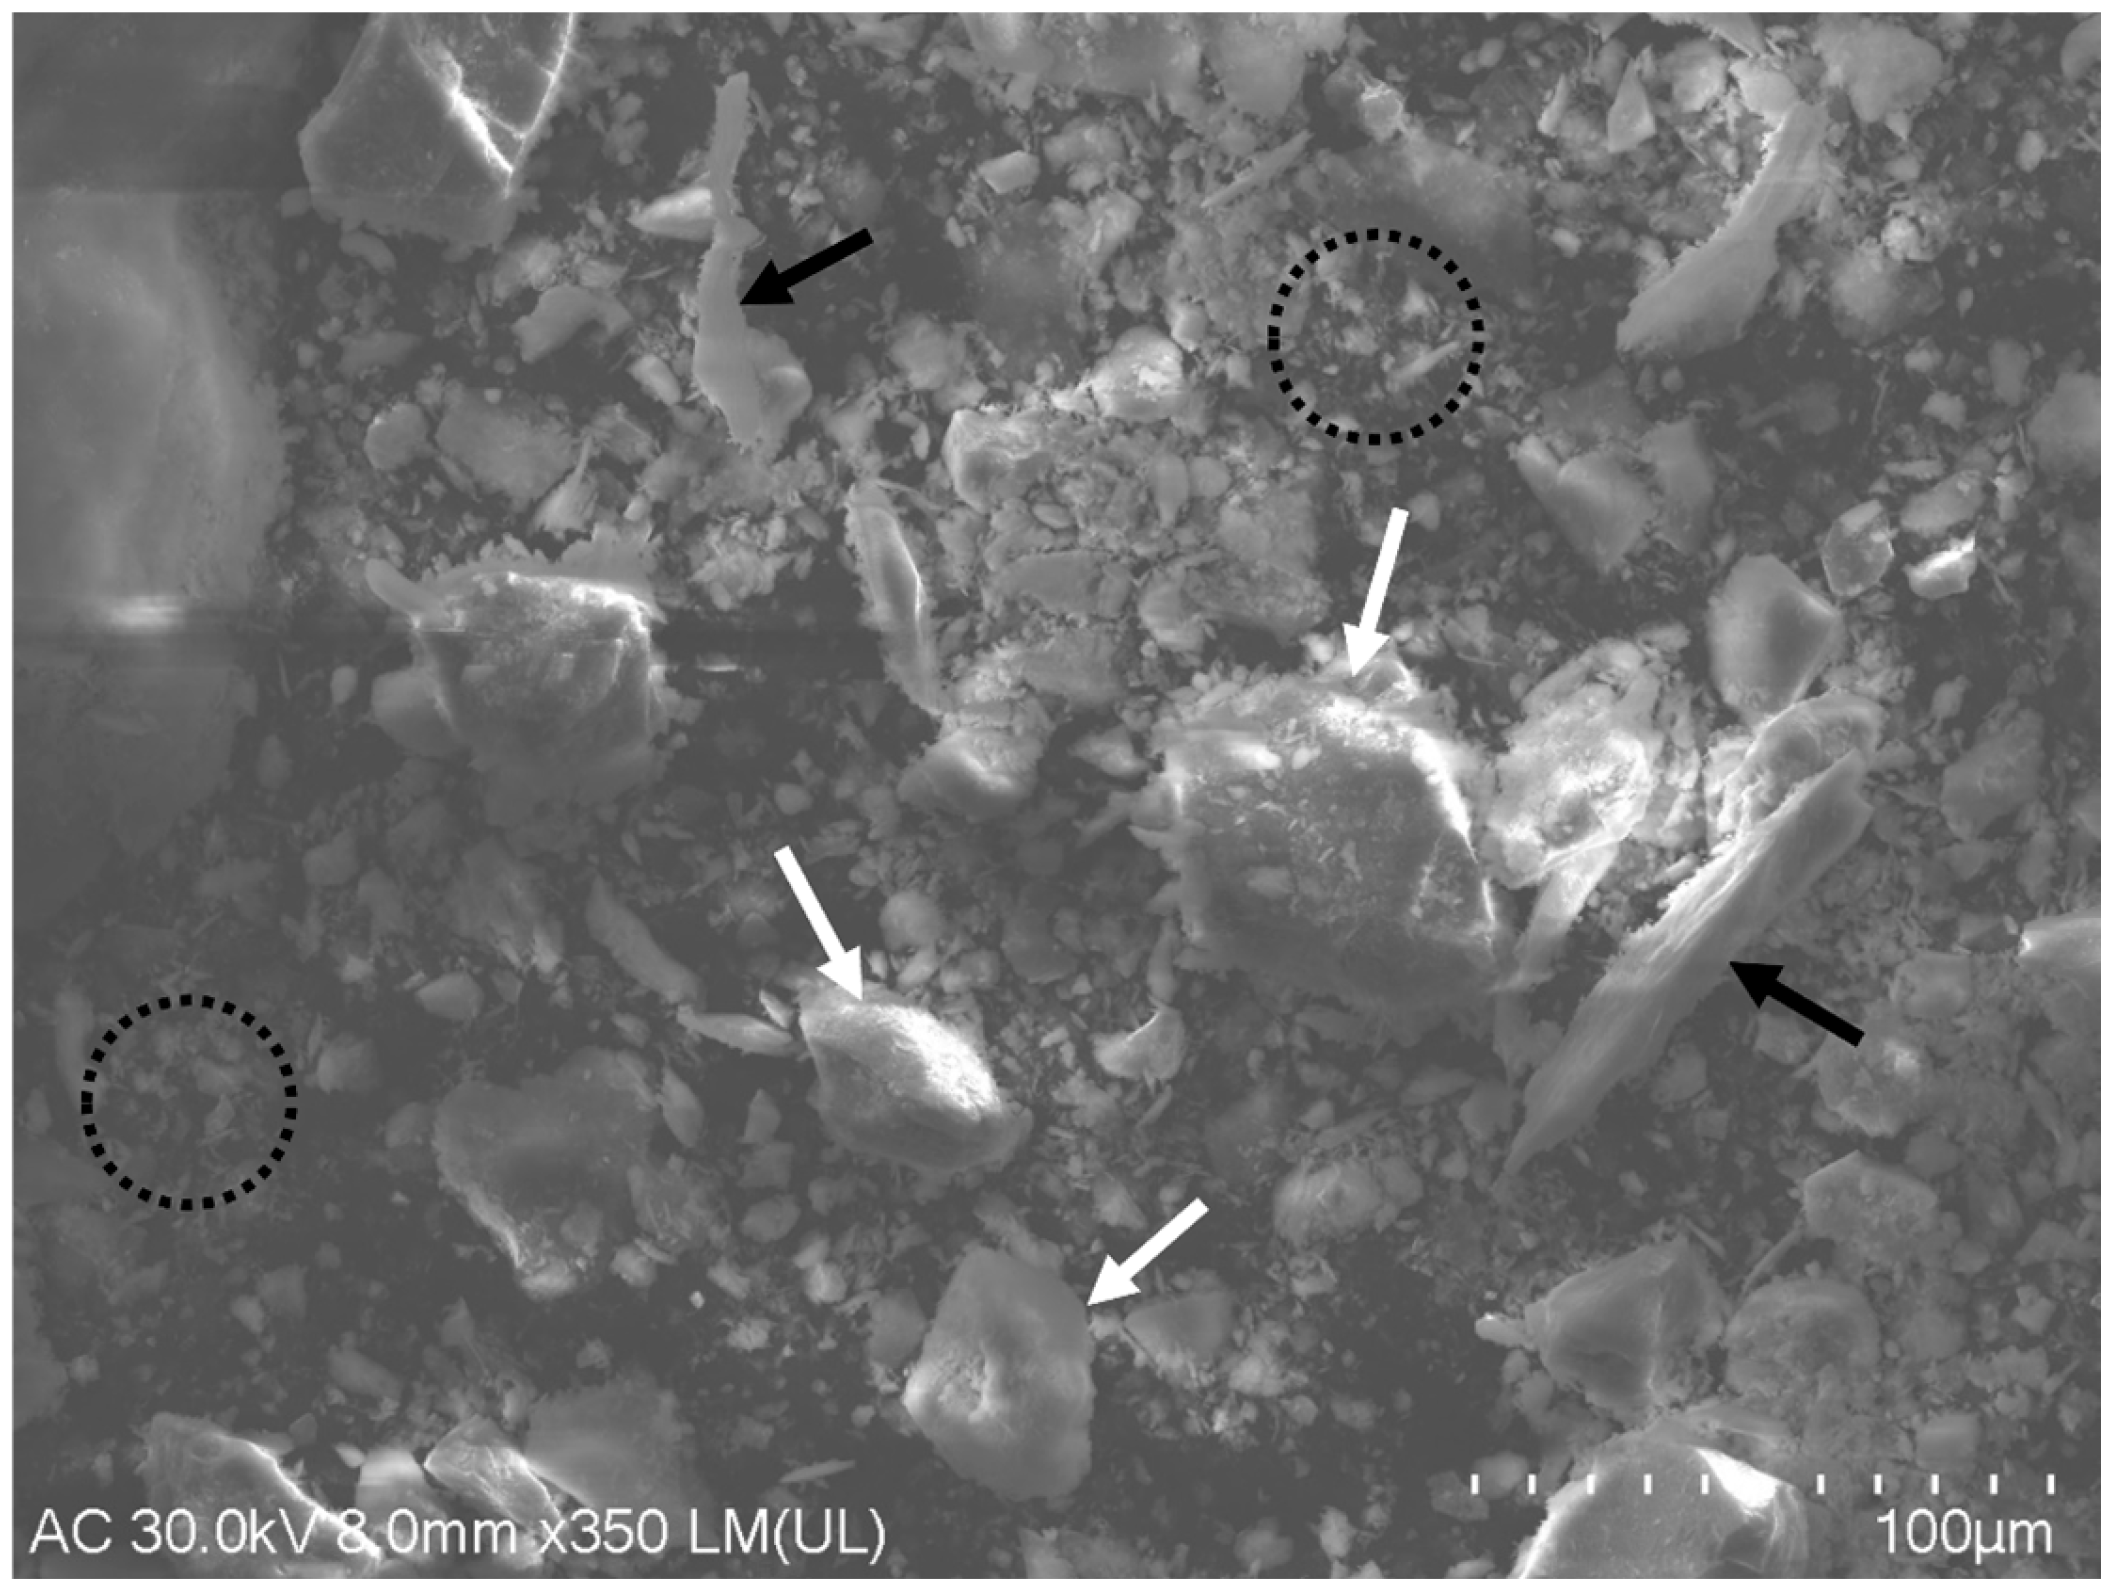
38]. SEM analysis of the initial ore shows various distributions of the morphology, with bulk blocks with smooth and sharp edges as well as smaller particles (
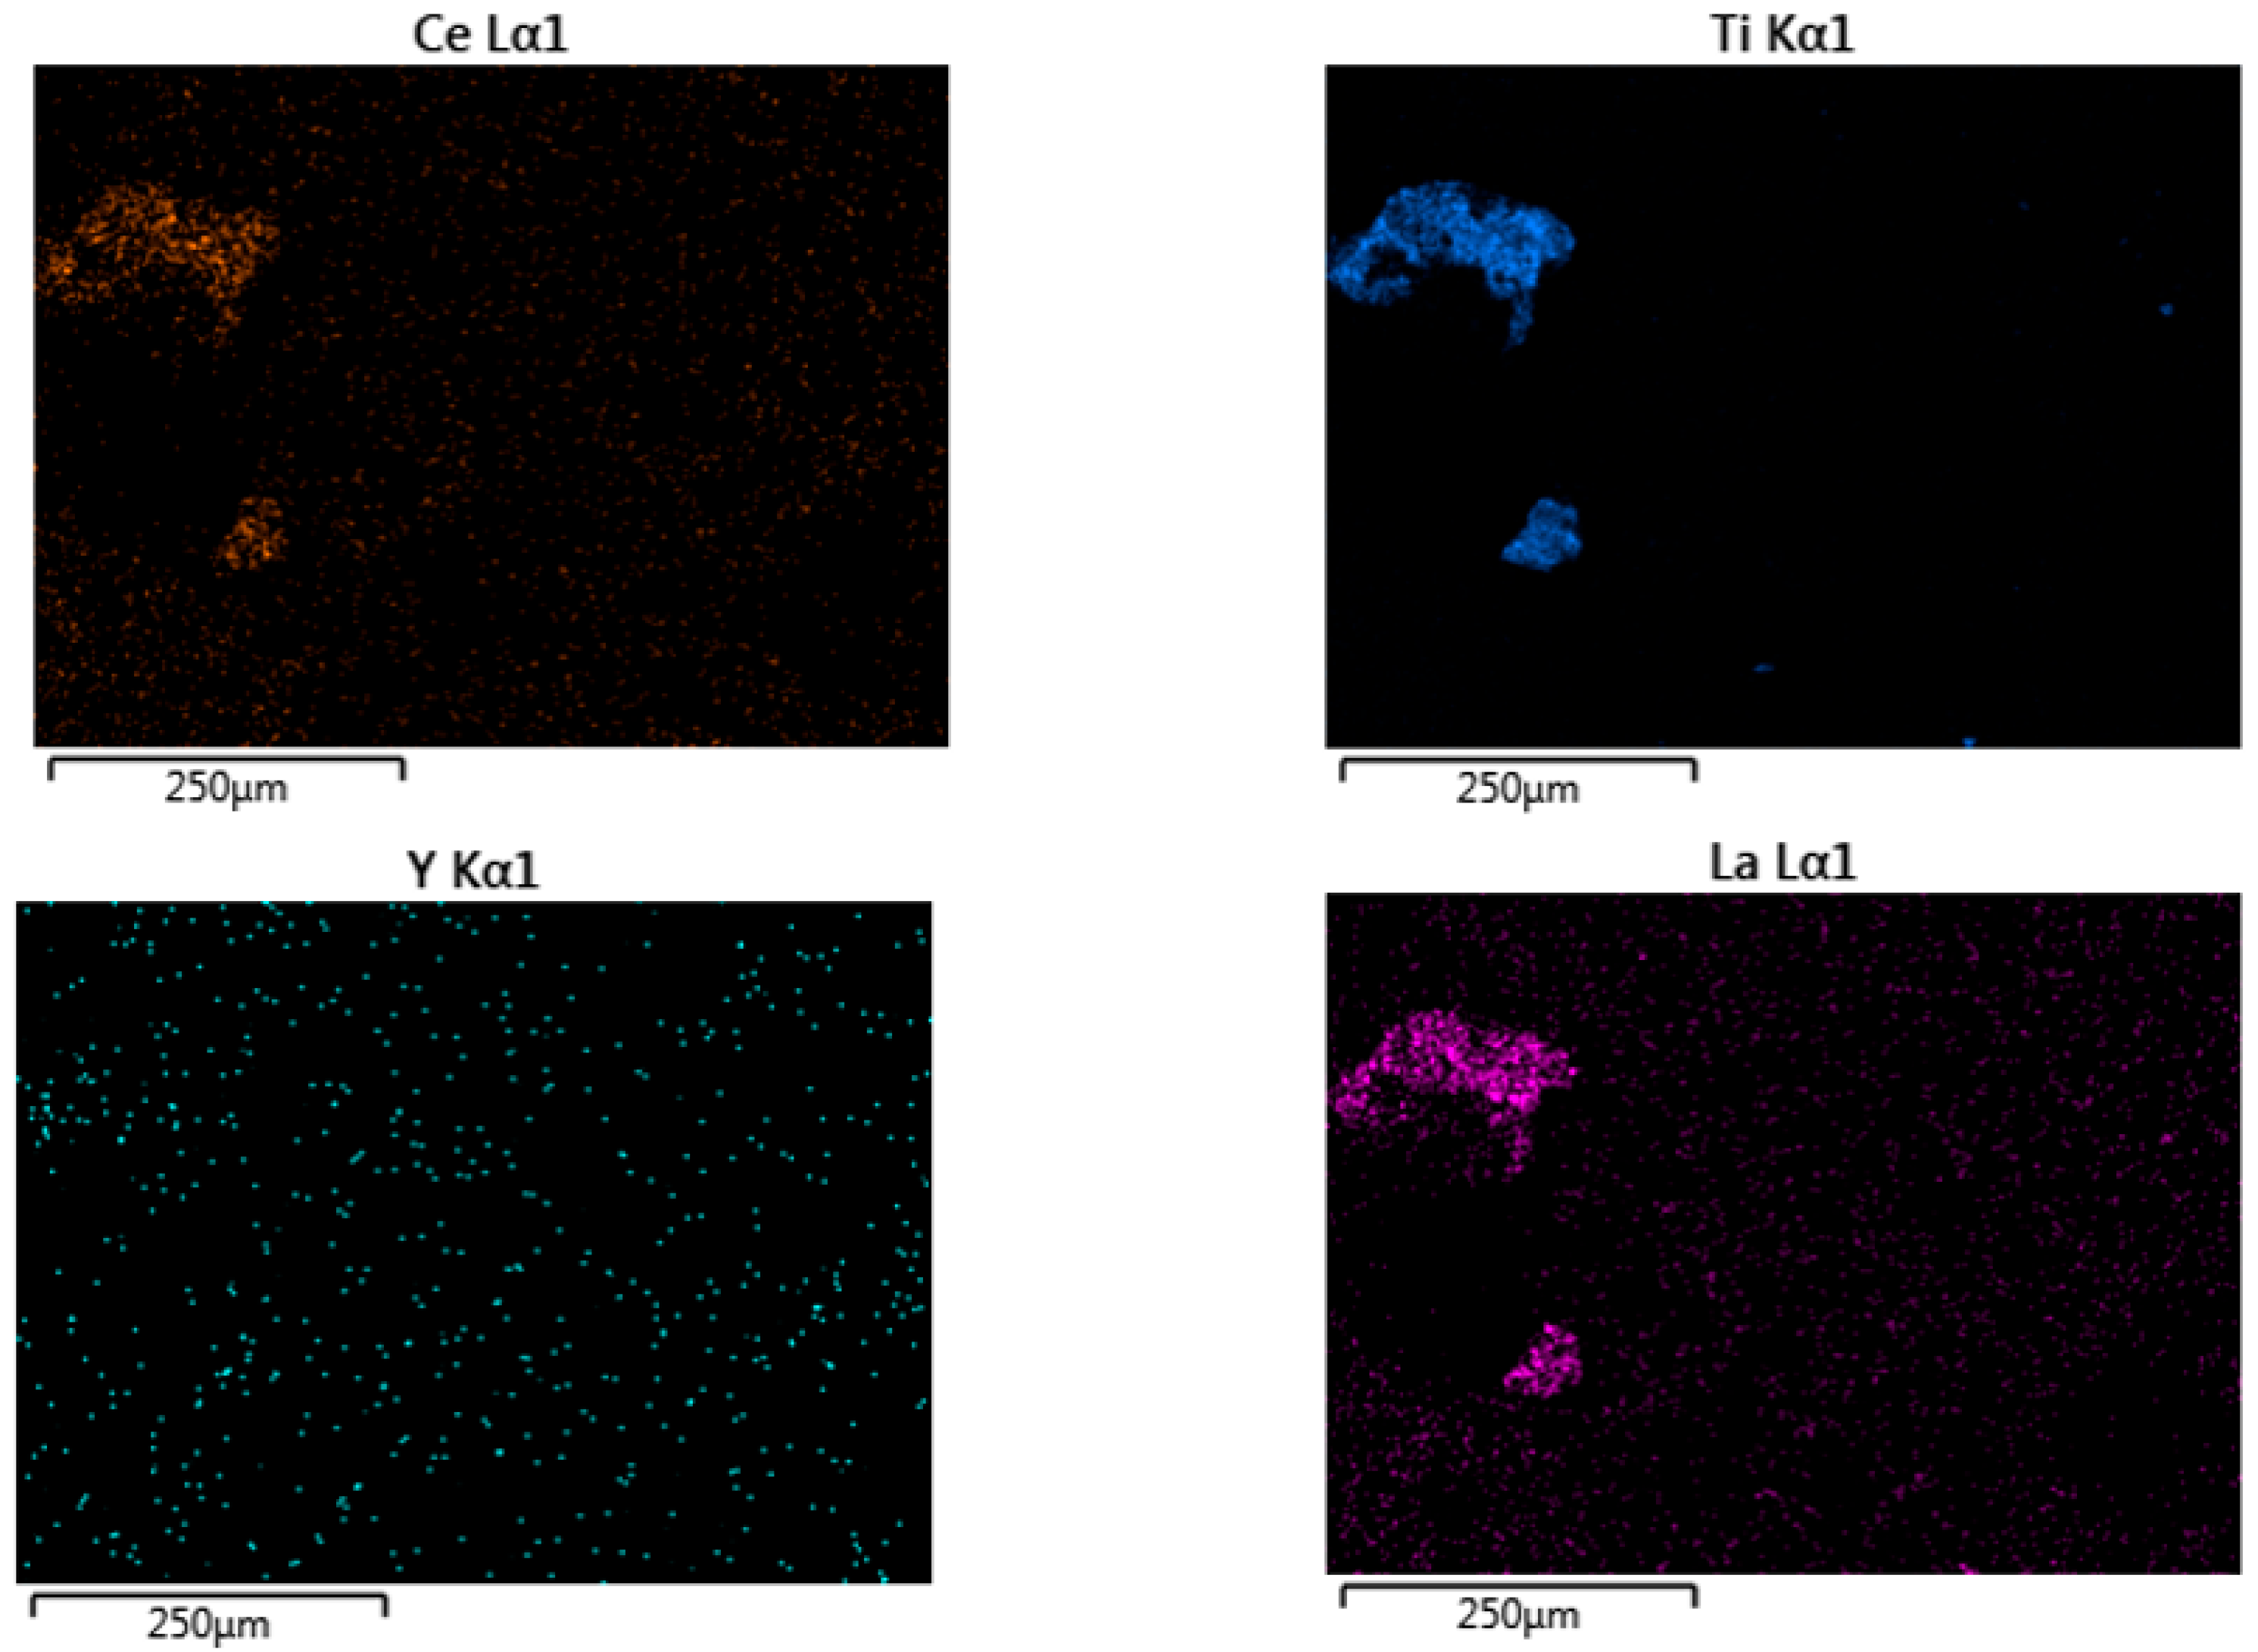
Figure 2). The REE mineral phases in the ore were under the limit of detection of the EDX detector. However, the elemental map reveals areas with La, Ce, and Ti concentrations (
Figure 3).
Despite the presence of clay minerals such as illite (KAl
2(Si
3Al)O
10(OH)
2×H
2O) and dickite (Al
2Si
2O
5(OH)
4), whose structure may include adsorbed forms of REEs, the results of leaching using salt solutions show extremely low total extraction not exceeding 1.2% (
Table 3). This suggests that REEs are mostly present in the ore in the form of their own phosphate and silicate minerals or isomorphically included in silicate minerals composition. Primary REE silicate minerals are allanite ((Ce,Ca,Y)
2(Al,FE
2+,Fe
3+)
3(SiO
4)
3(OH)), gadolinite (Y
2Fe
2+Be
2Si
2O
10), thortveitite (Sc,Y)
2Si
2O
7), cascandite (Ca(Sc,Fe
3+)HSi
3O
9), and gerwustite ((Na,Ca,Fe
2+)(Sc,Mg,Fe
2+)Si
2O
6) [
39]. Considering this, the acid leaching method was selected for further studies. This method allows for the destruction of the structure of clay minerals containing REE and transfers them into soluble form. HCl/H
2SO
4 acids were selected as leaching solutions (LS because they dissolve REE well [
40]. HF is an efficient reagent for the destruction of silicate minerals [
41], which are matrices for REE. Na
2S
2O
5 is a reducing agent that reduces iron for its further separation from REE [
42].
3.1. Investigation of the L/S Effect
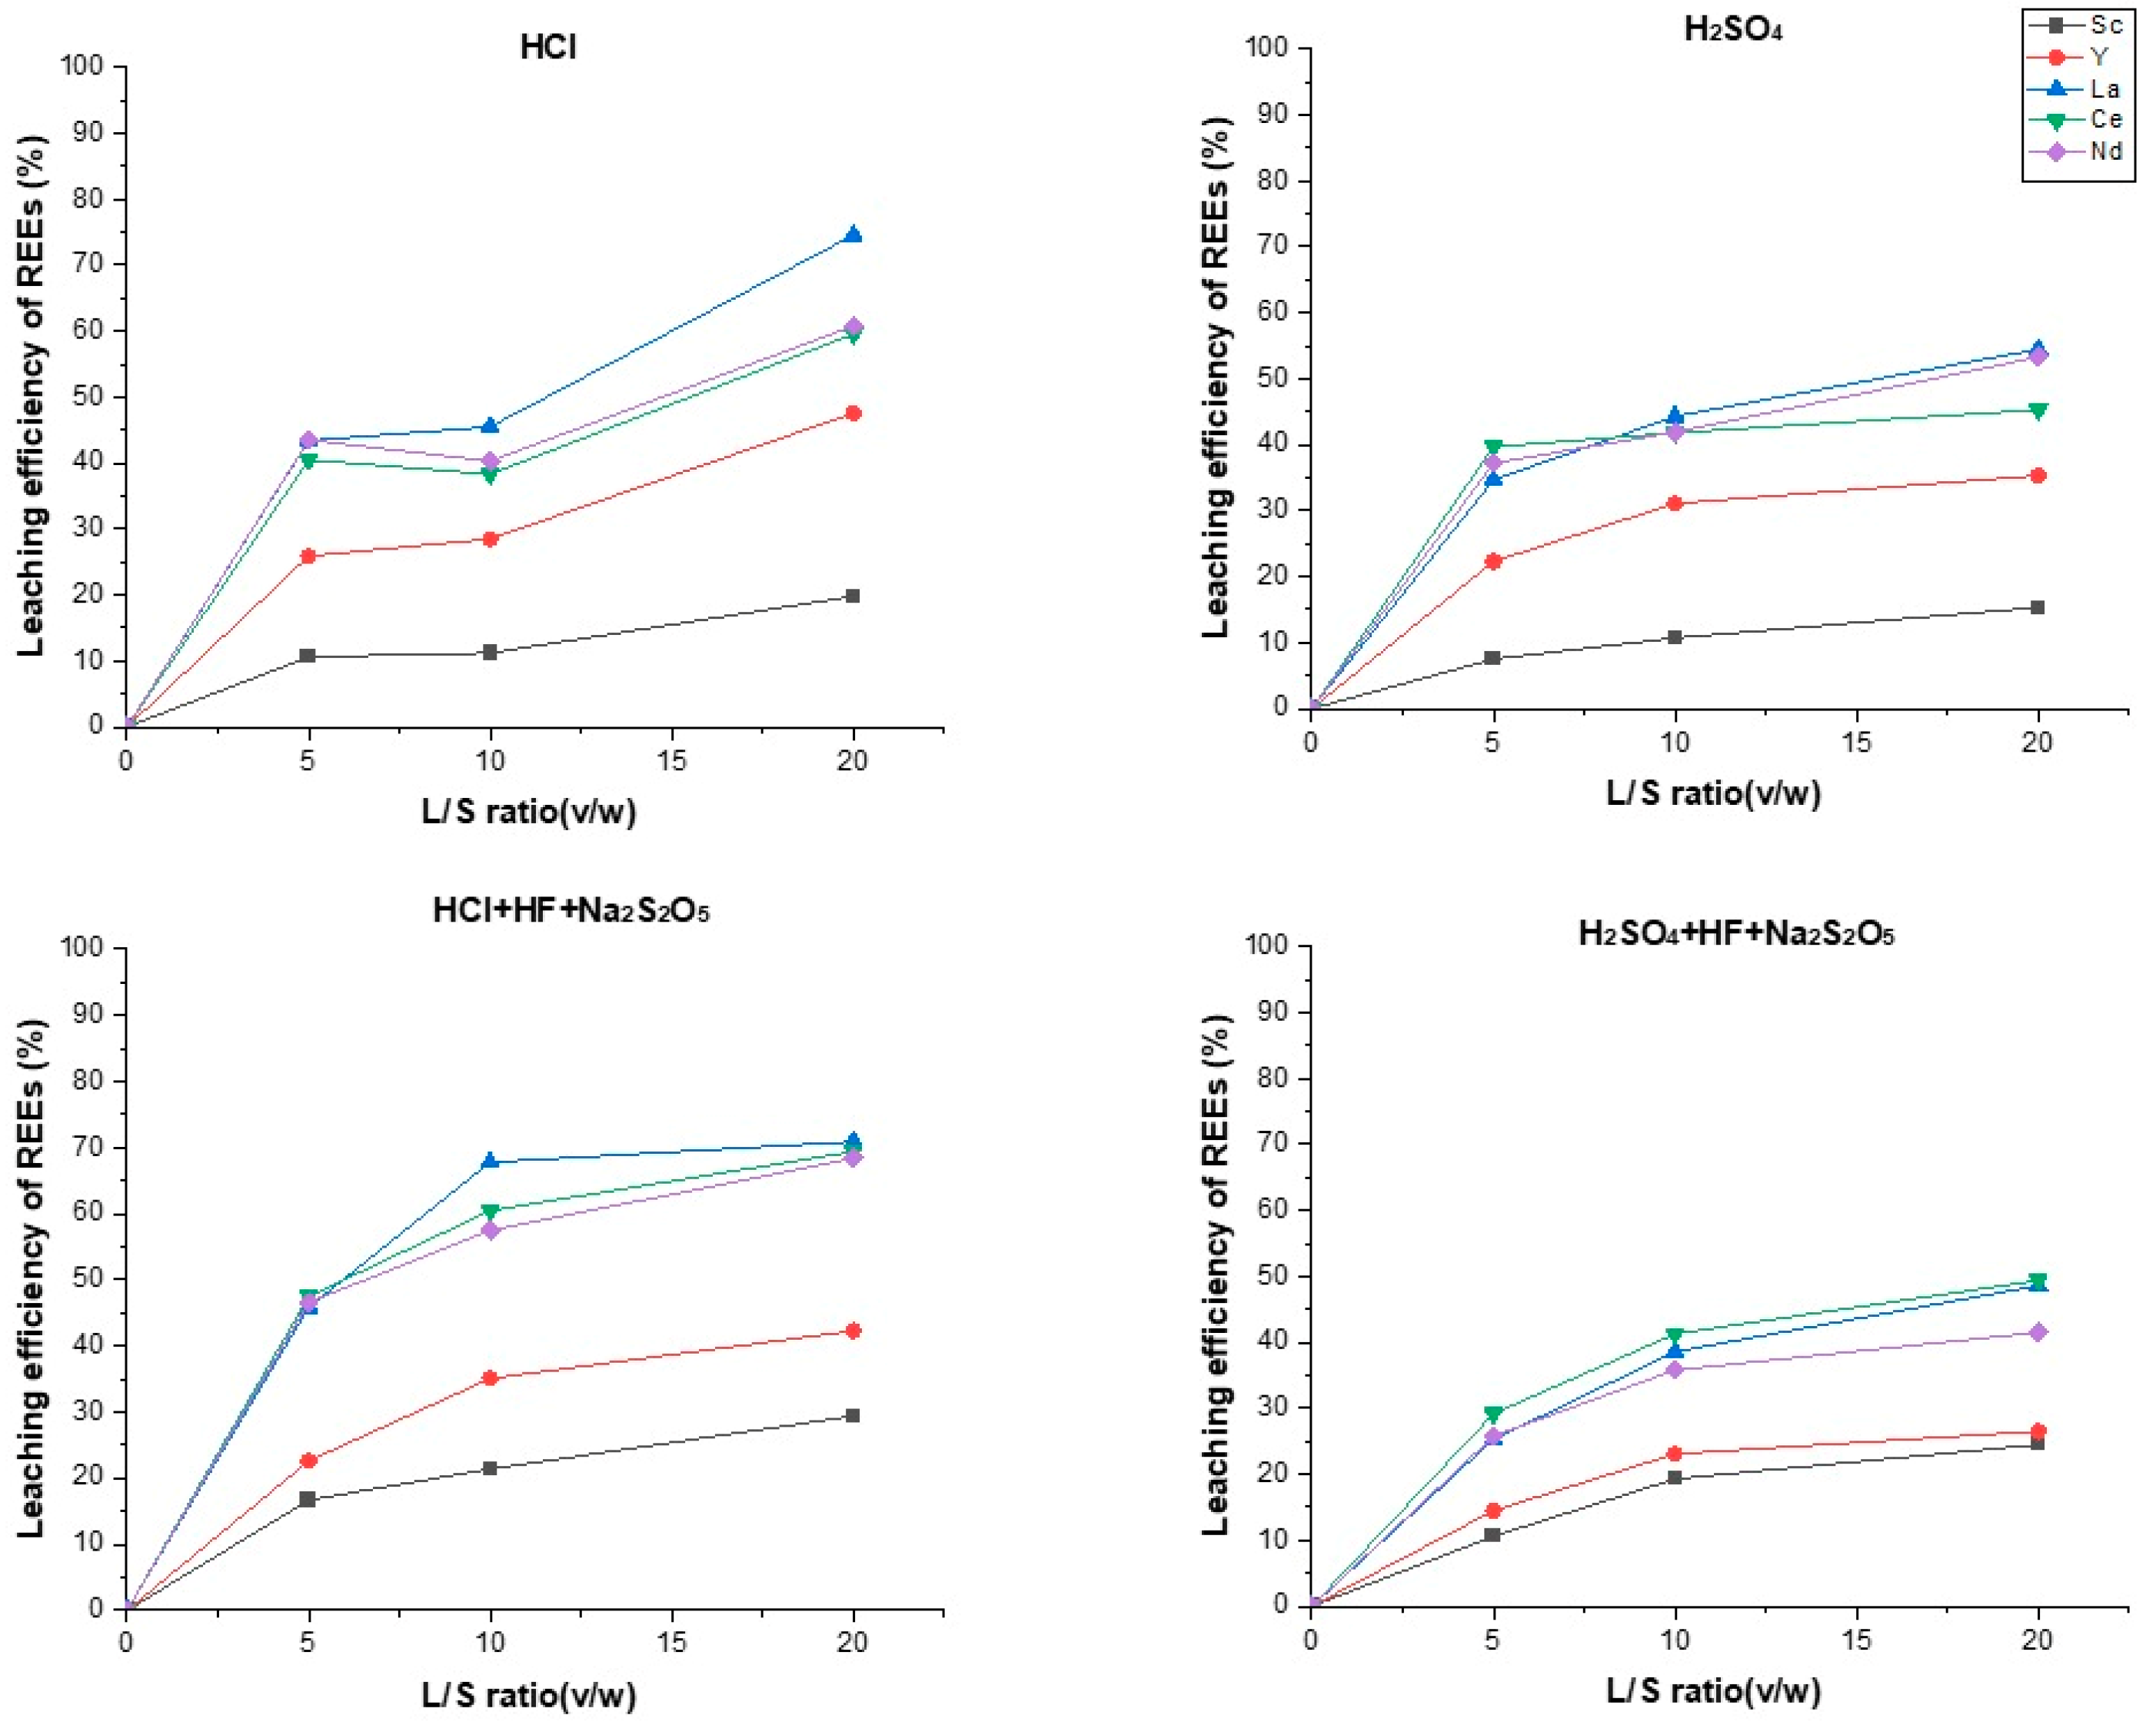
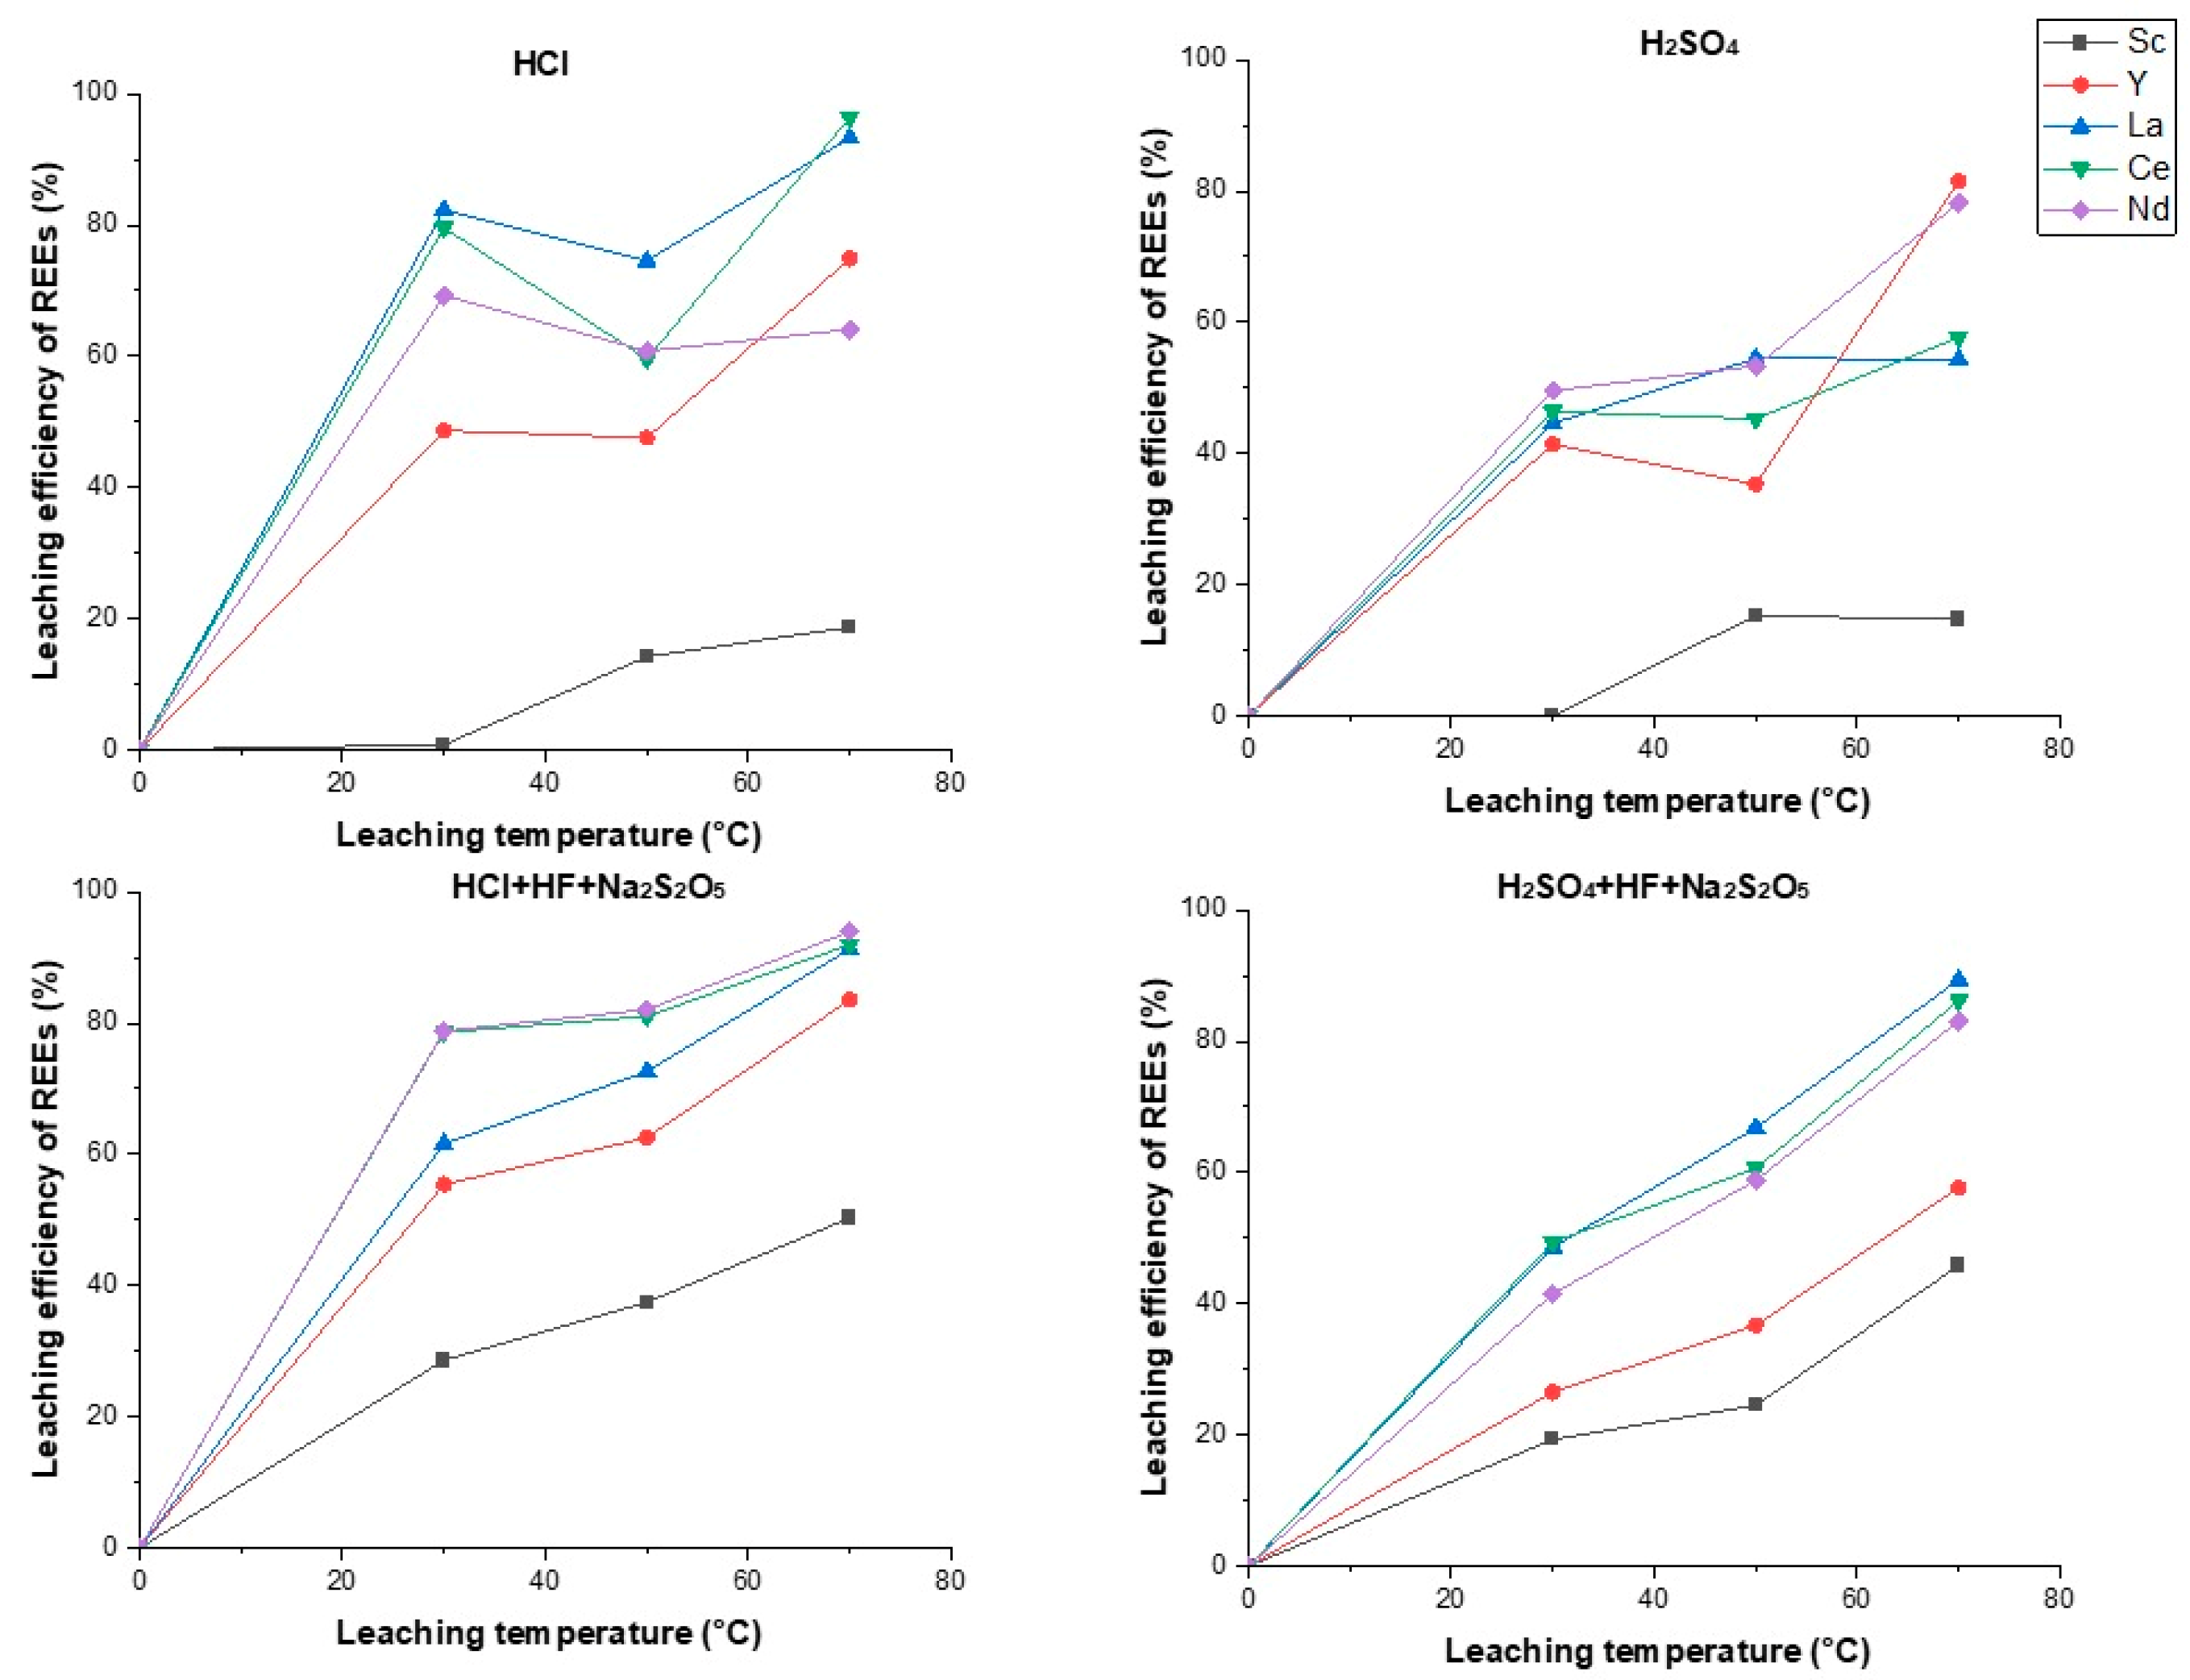
For all leaching solutions, an increase in the L/S ratio positively influences REE extraction (
Figure 4). At higher L/S, a more efficient REE solution is reached as acid ions go deeper into ore pores [
43]. In the case of using an HCl 100 g/L solution, the total REE extraction rate is higher than in the case of leaching using H
2SO
4 100 g/L. At L/S = 5 and with the use of HCl, Sc extraction is 10.6%, and in the case of using H
2SO
4, it is 7.5%. The extraction rate using HCl is 25.9%, whereas using H
2SO
4 is 22.3%. As L/S increases, REE extraction rises in both cases. This way, the La extraction rate using HCl rises from 43.4% to 74.6%, and using H
2SO
4, it rises from 34.7% to 54.5%. A similar trend is typical for Ce and Nd. This behavior can be explained by the fact that HCI destroys the mineralogical matrix more easily than H
2SO
4. There is a study on REE leaching from phosphate ores, where La leaching activation energy with HCl (10.3 kJ/M) is lower than with H
2SO
4 (16.7 kJ/M) [
44].
In the case of using a leaching solution consisting of HCl, HF, and Na2S2O5, the highest REE extraction rates are achieved. For example, for La and Ce at L/S = 20, extraction rates are over 70%; similarly, Nd is extracted by 68.4%.
In the case of using a leaching solution consisting of H2SO4, HF, and Na2S2O5, the Sc extraction rate is 10% higher than with a solution consisting of H2SO4 (L/S = 20); however, absolute values are generally lower than with HCl (70.9%) under the same conditions.
3.2. Temperature Optimization Results
At increased temperatures, there is a tendency of REE yield to rise (
Figure 5) as temperature rise speeds up chemical reactions and diffusion [
45]. For single component leaching solutions, raising the temperature to 70 °C helps increase the extraction rates of Y, La, and Ce, while Nd is extracted less efficiently at the same temperature. For leaching solutions consisting of HCl/H
2SO
4, HF, and Na
2S
2O
5, temperature rise consistently increases the yield of all REEs. Compared to a leaching solution consisting of H
2SO
4, HF, and Na
2S
2O
5, the best results are achieved with a combination of HCl, HF, and Na
2S
2O
5 at 70 °C, where the extraction of La, Ce, and Nd are 91.3%, 92.0%, and 94.1%, respectively.
3.3. Investigation of the Leaching Solution Concentration
Single component leaching solutions extract La, Ce, Nd, and Y to 75%–80% and Sc to 20%. Leaching with single component solutions gives unsatisfactory results due to the fact that REEs are most likely to be present in hard-opened silicate matrices [
40]. After the HCl concentration increased from 50 to 150 g/L, Sc leaching rose from 12.3% to 18.3%, while the H
2SO
4 concentration change did not bring significant changes (
Table 4). Y, La, Ce, and Nd leaching decreased with acid concentration rise. Leaching efficiency decline can be explained by the concept of solvation. As electrolyte concentration rises, the share of water in the solution falls, which causes a decrease in the number of water molecules available for the leaching reaction as cations and anions hold them strongly in the solution [
46].
In the case of using a leaching solution consisting of HCl, HF, and Na
2S
2O
5, with HF addition, the total REE extraction rate reaches 90%–95% (
Table 5). In addition, an HF concentration increase from 3 to 12 g/L causes the Sc extraction rate to rise from 50.3% to 91.2%.
Sc’s ionic radius is smaller than those of other REEs (Sc-0.745, Y-0.9, La-1.032, Ce-1.01, Nd-0.983 nm) [
47]. Due to this, Sc
3+ can displace Ti, Fe, and Al in silicate structures or be included in quartz minerals [
48]. Additionally, an increase in dickite dissolution and REE extraction rates are seen, which most likely suggests REE inclusion in dickite composition (
Figure 6). Dickite is similar to other kaolinite group minerals and can dissolve in acidic environments, especially in the presence of HF. For example, at HF treatment, dickite dissolves faster than some other kaolinite polymorphic forms [
49]. The reaction between dickite and HF is described by the Equation (7):
3.4. Process Kinetics Study
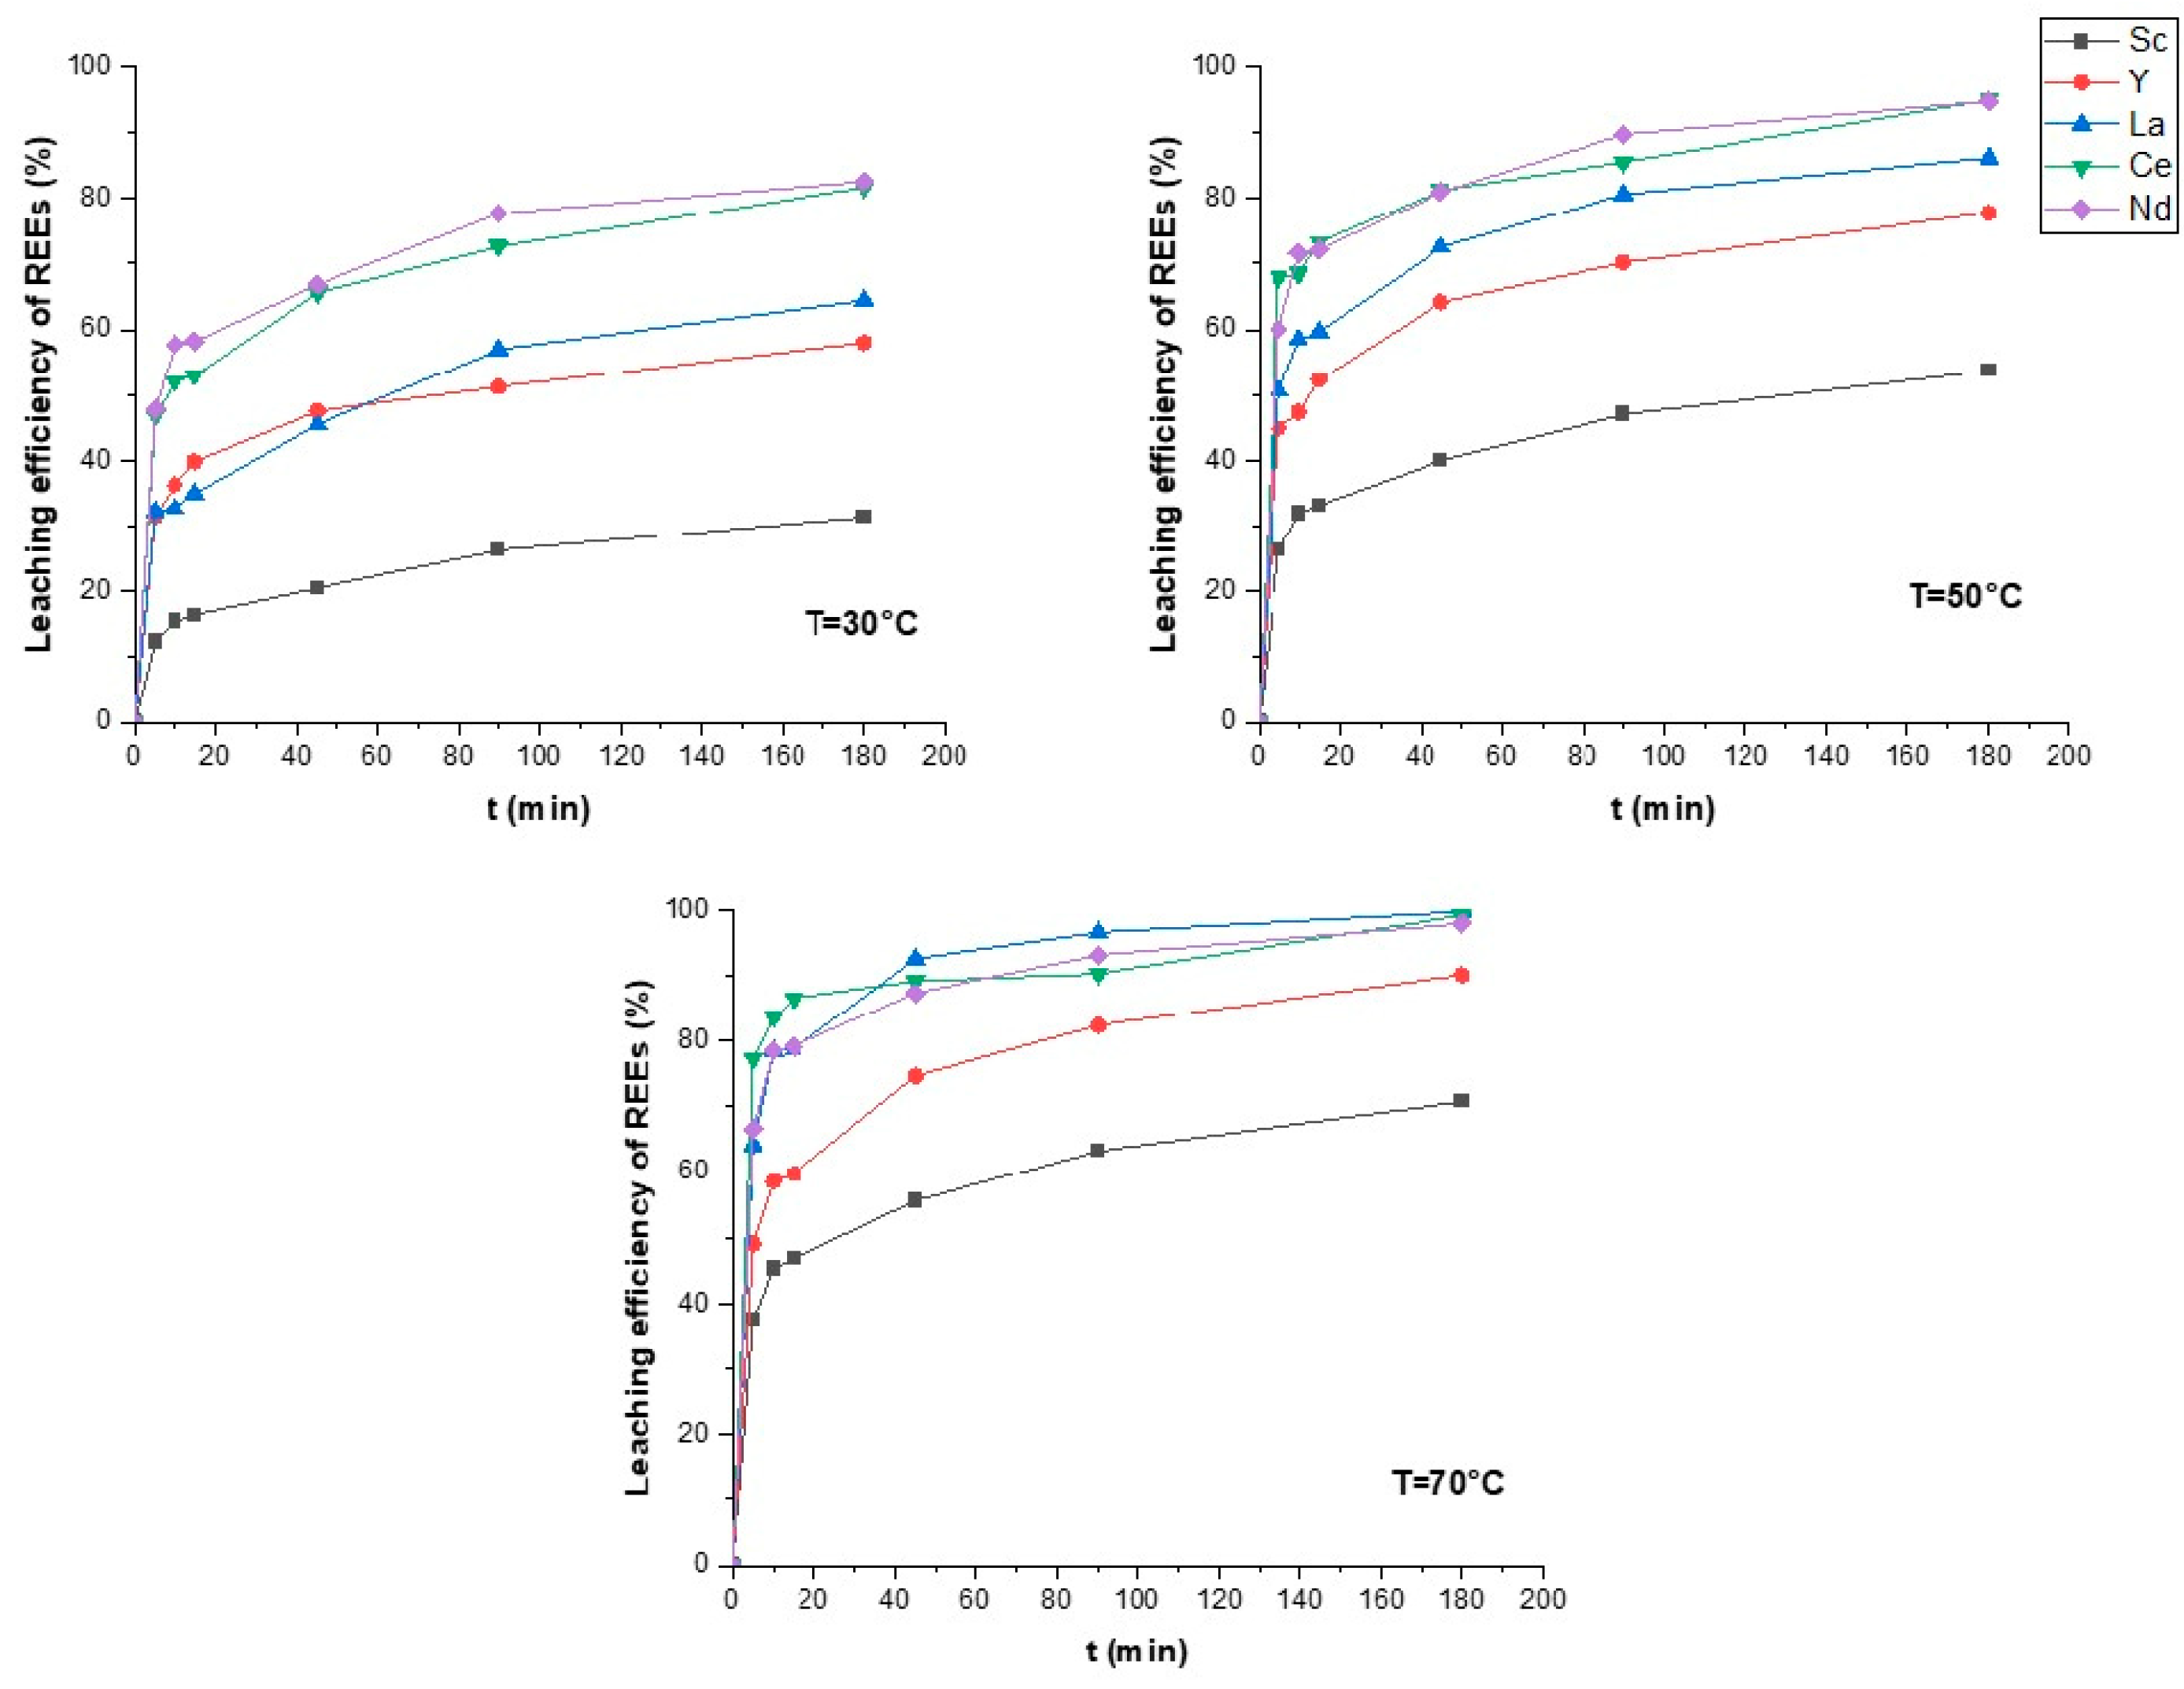
The study of any chemical reaction is an important part of understanding chemical processes. Most leaching processes are reactions between liquid and solid phases. Our leaching system consists of the Kundybay ore weathering crust and a leaching solution consisting of HCl, HF, and Na2S2O5. Based on the fact that ore particles have a spherical shape, a kinetic study of leaching can be performed using the shrinking core model.
Both mechanisms show relatively good correlation with experimental data, proving that the kinetic model can describe the process in two steps. In the beginning of the process, the limiting stage is the chemical reaction of REE minerals interacting with leaching solution components. It should be noted that some REEs (La, Ce, Nd) are leached faster than Sc, Y (
Figure 7). This may be related to REE distribution in different minerals, which have different chemical natures and stabilities. Then the leaching process is managed by a diffusion model through the product layer as silicic acid formed during silicate minerals dissolving turns into a silicic acid product [
41]. The formed silicic acid creates resistance, blocking the ore particles surface, thus reducing the diffusion of the leaching solution.
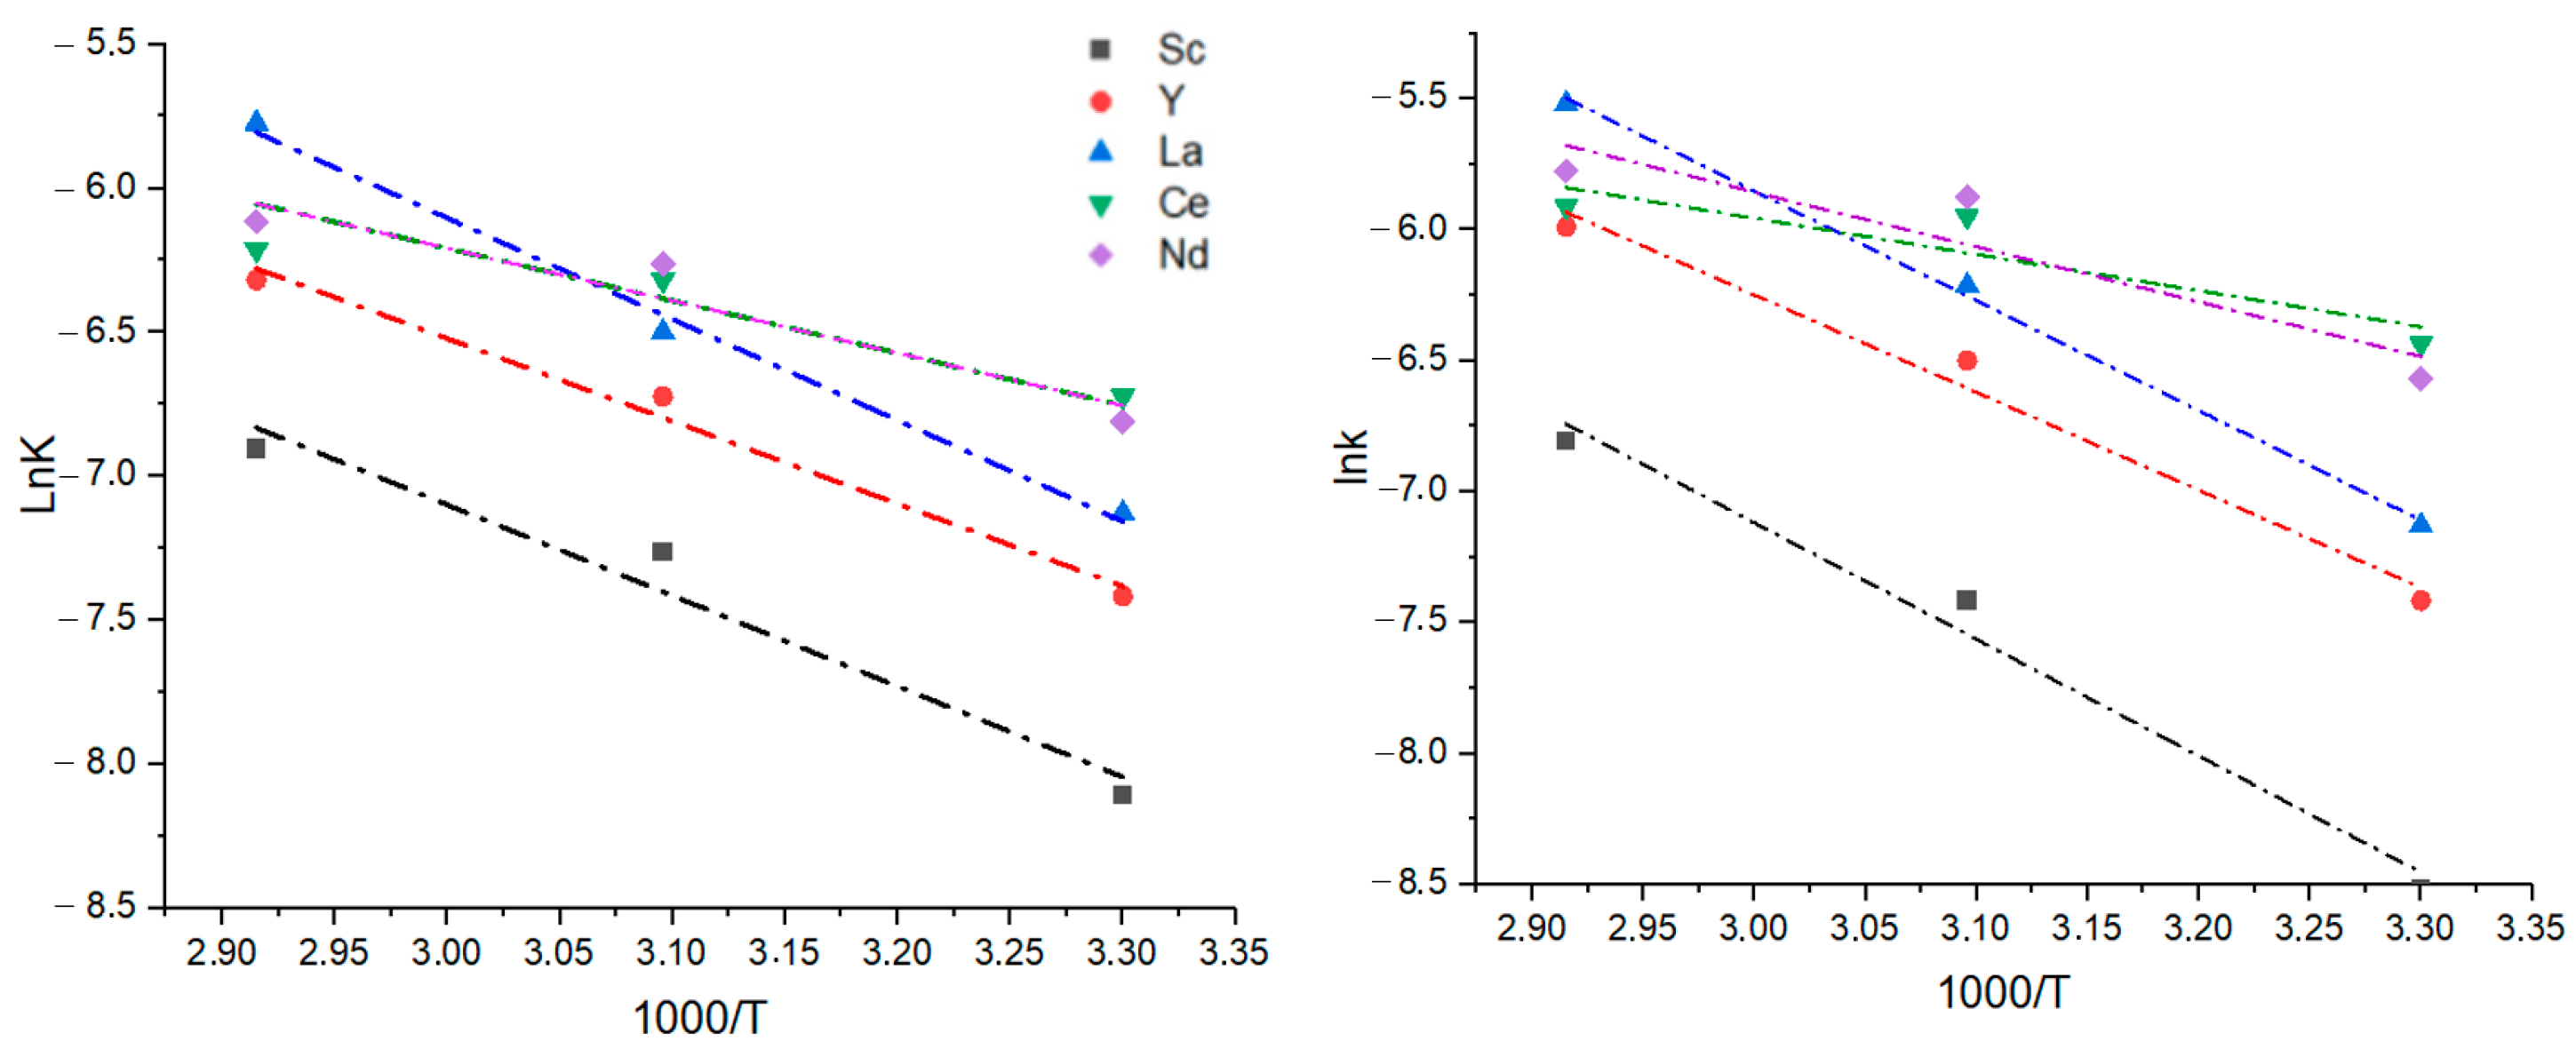
Kinetic constants given in
Table 6 and
Table 7 are used to calculate process activation energy using Equation (4), also known as the Arrhenius equation (
Table 8).
According to the Arrhenius equation, the slope of the line equals −
Ea/
R (
Figure 8). Thus, activation energy can be calculated using a straight-line equation. The activation energy of the chemical reaction process and diffusion is given in
Table 8. The diffusion process’s activation energy is higher than chemical reaction activation energy for all elements. This is explained by the fact that diffusion through forming a silicic acid layer requires more energy than the chemical reaction of matrix destruction and ions complexing themselves. Relatively high activation energies for Sc, Y, and La suggest that they are mostly present in silicate phases, which require overcoming energy barriers for their dissolving: 1—silicon backbone destruction; 2—leaching solution ions diffusion through silicic acid layer toward ore particles. On the other hand, activation energies of the chemical reaction process and diffusion for Ce and Nd have similar values. Cerium and neodymium are likely present in an easily opened form, forming reaction products, and do not create an energy barrier for further leaching solution ions diffusing onto the ore surface. Considering this, it can be suggested that REEs in the Kundybay deposit weathering crust have different mineralogical distributions.


 ,
, 

