
Computational and Experimental Research on Dense Medium Separation of Low-Grade Spodumene

Abstract
1. Introduction
2. Materials and Methods
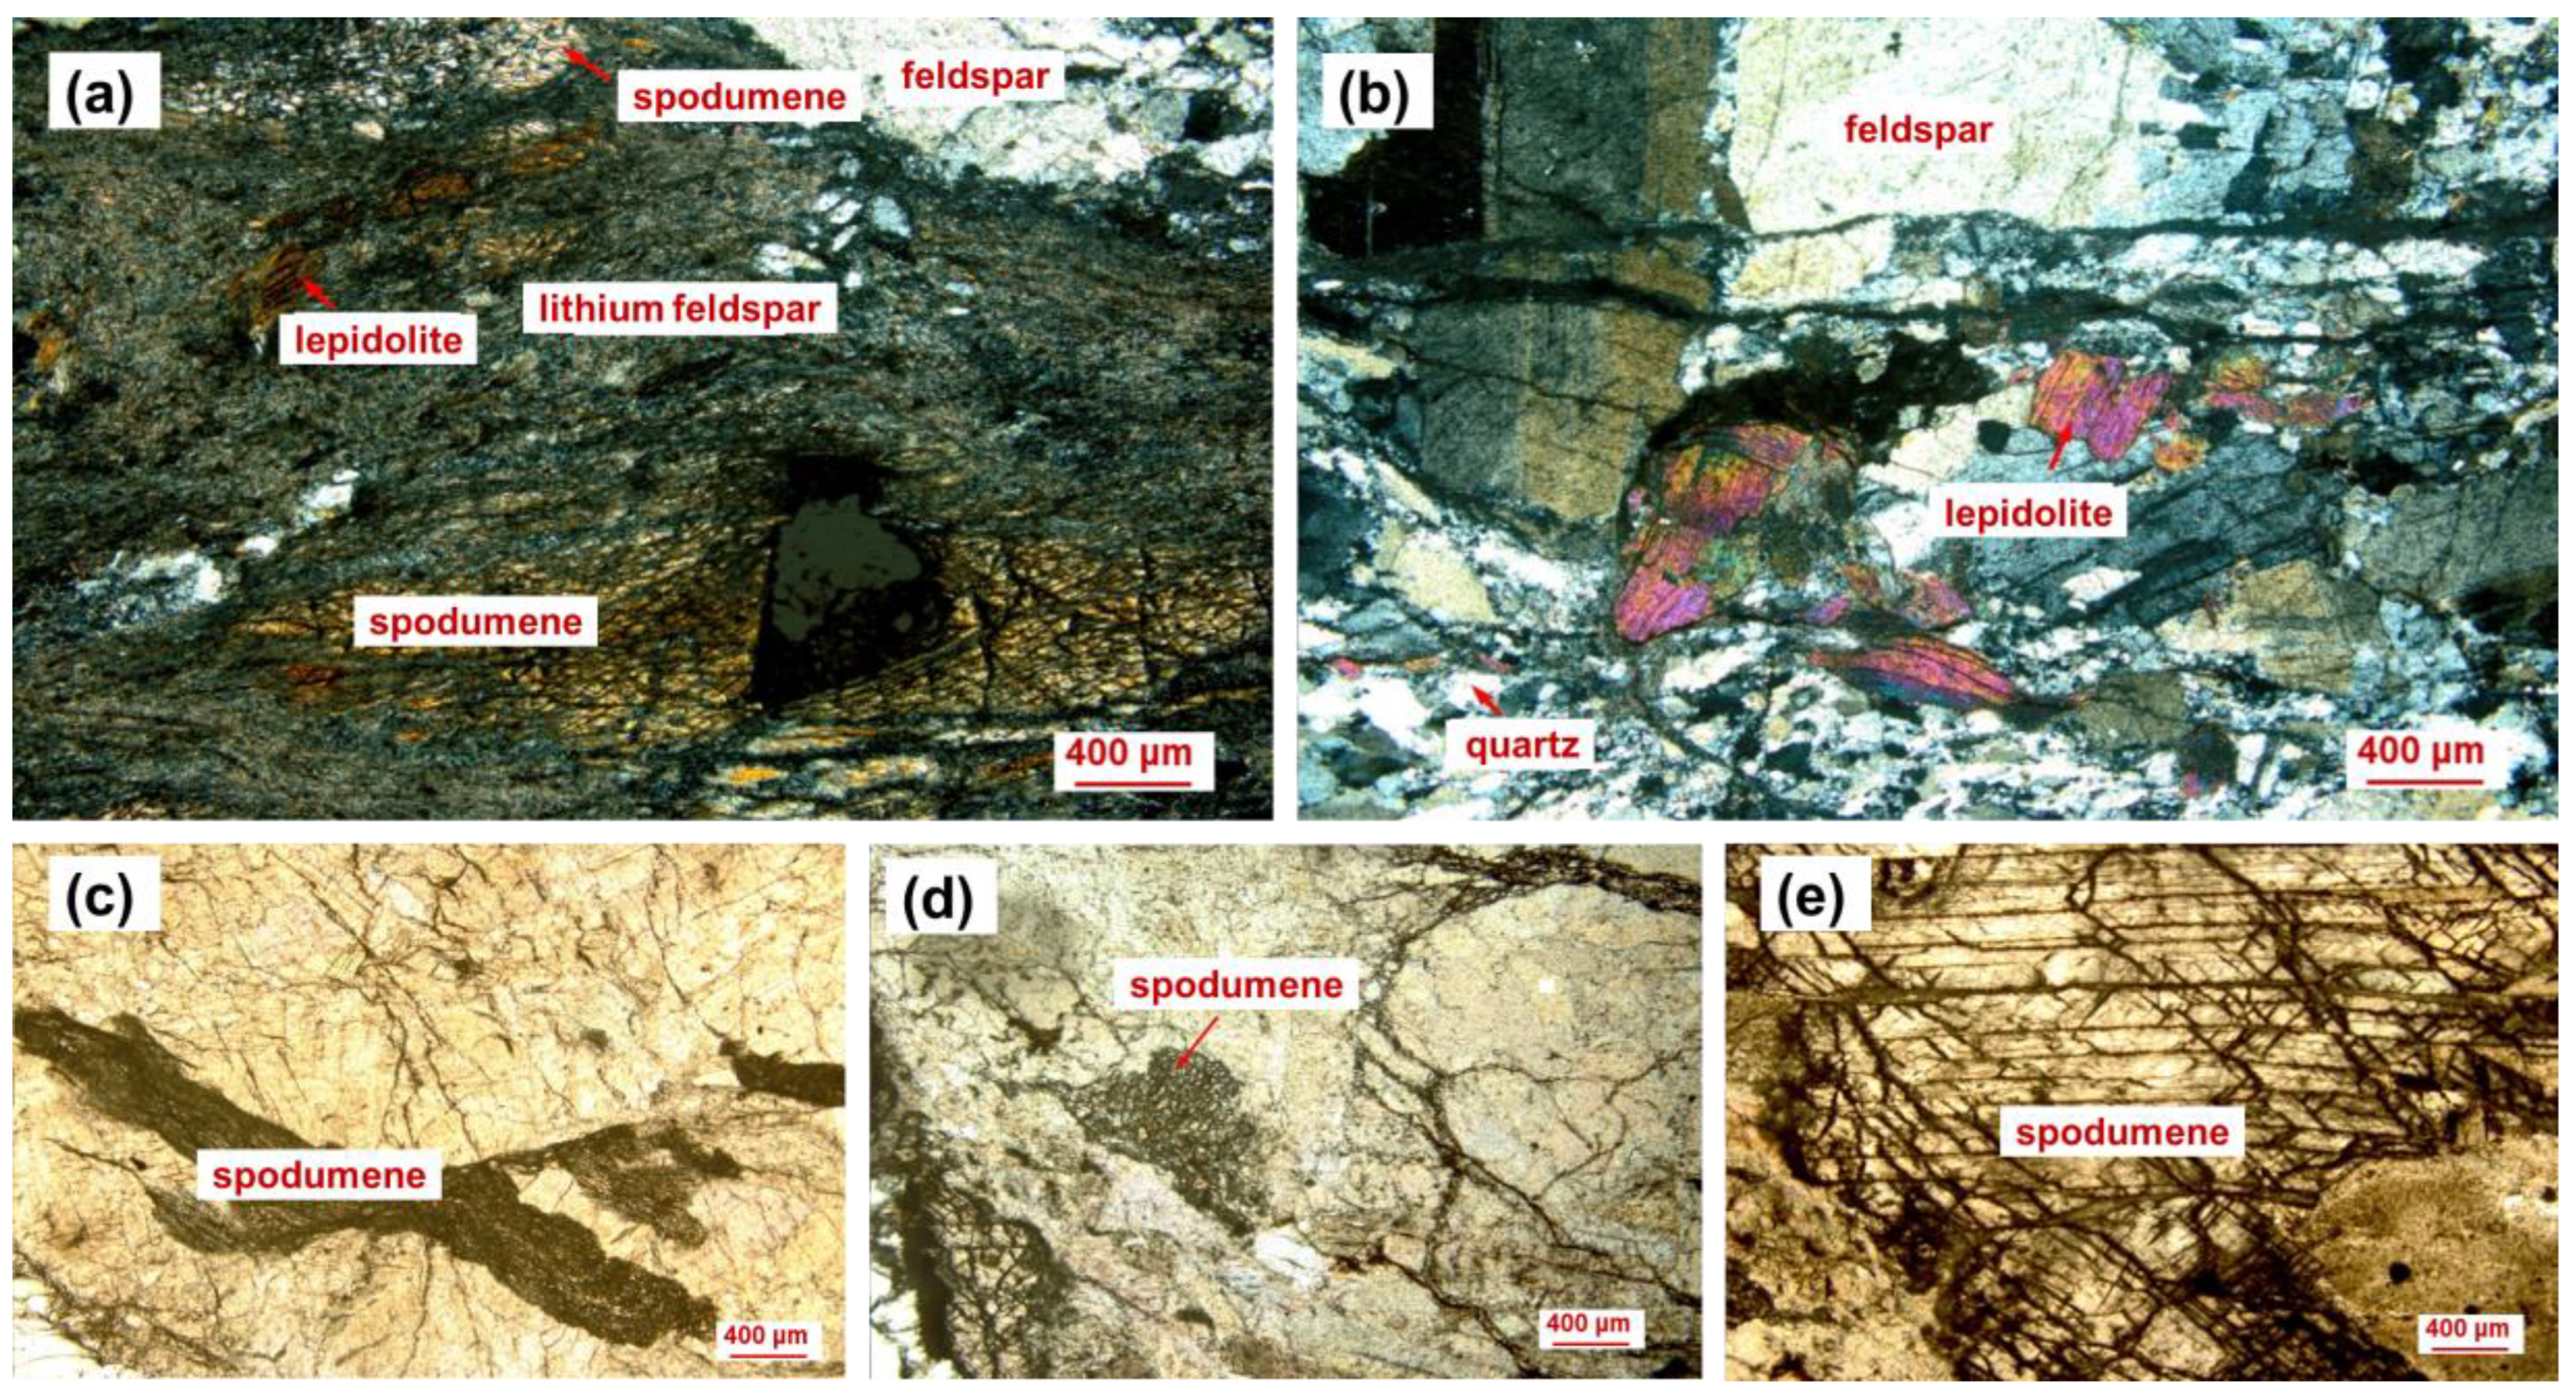
2.1. The Avatar Spodumene Ore and Mineralogy
2.2. Sample Preparation and Characterization
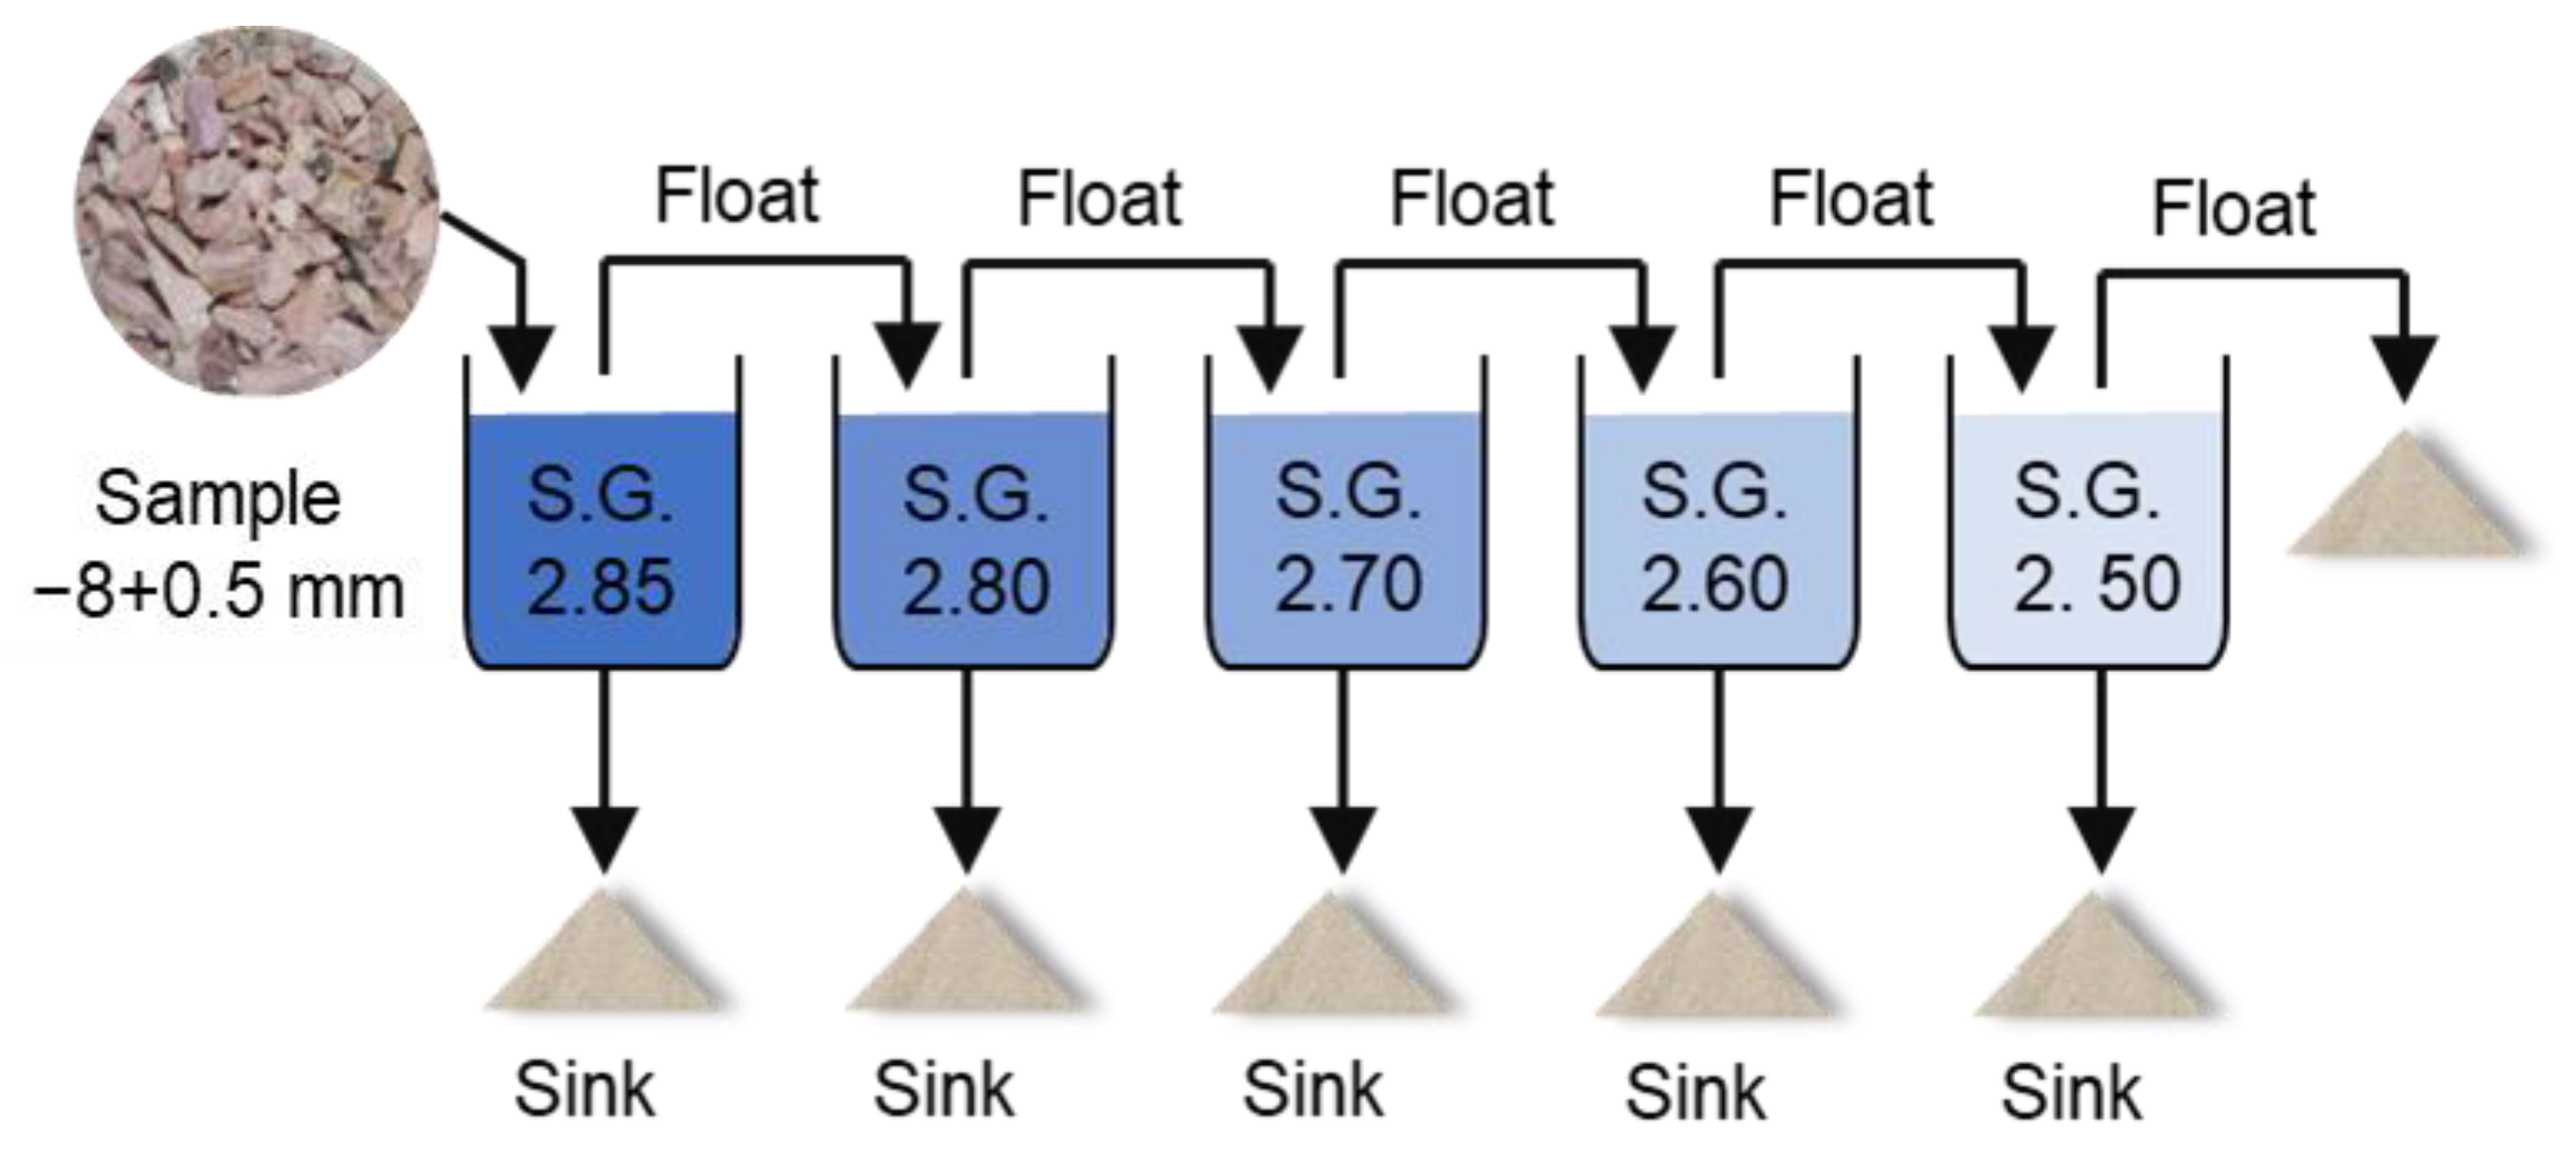
2.3. Heavy Liquid Separation Test
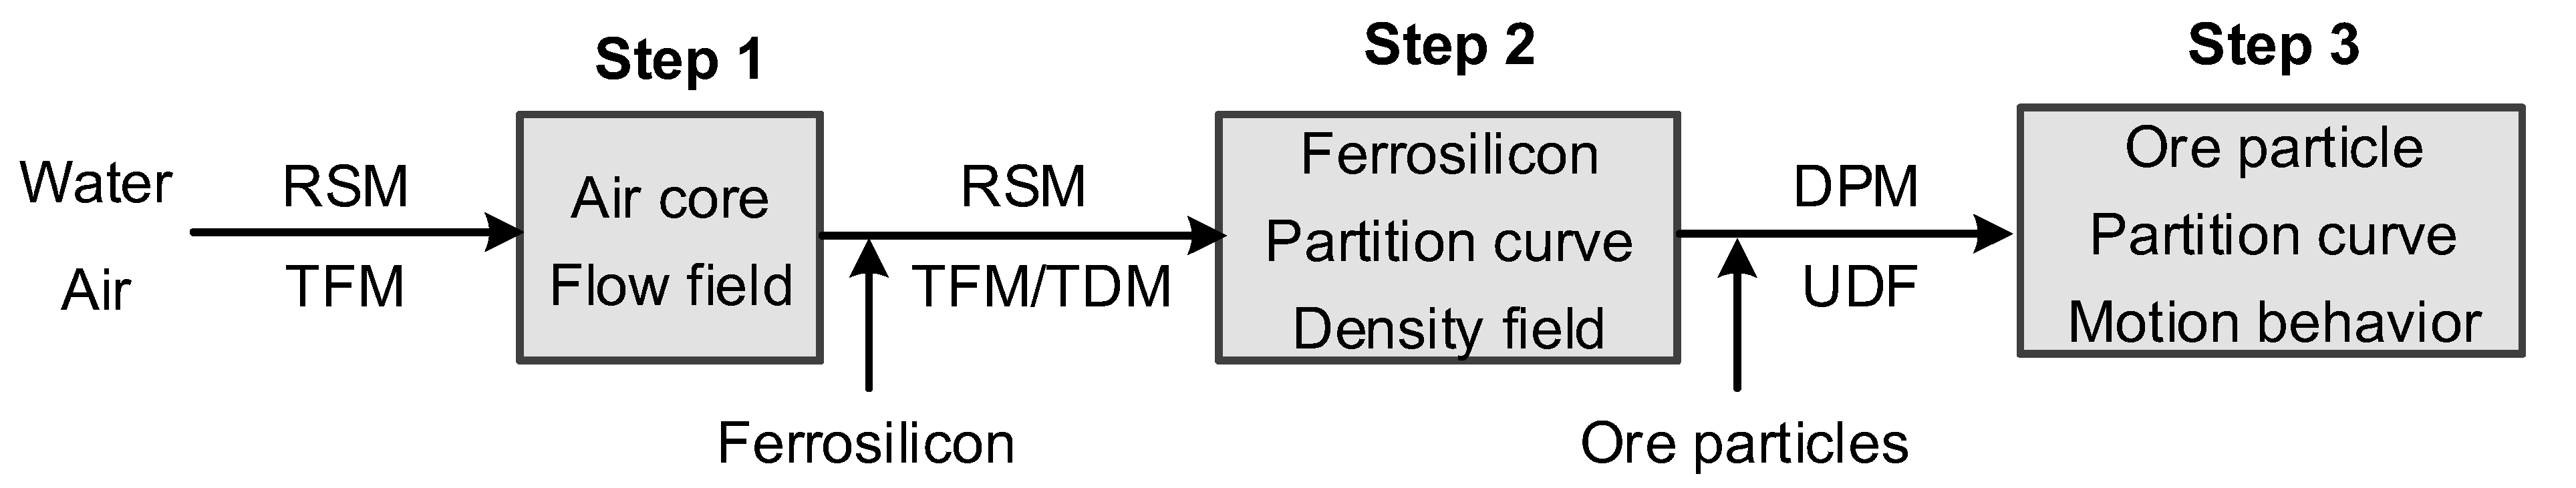
2.4. Numerical Simulation
2.4.1. Model Strategy
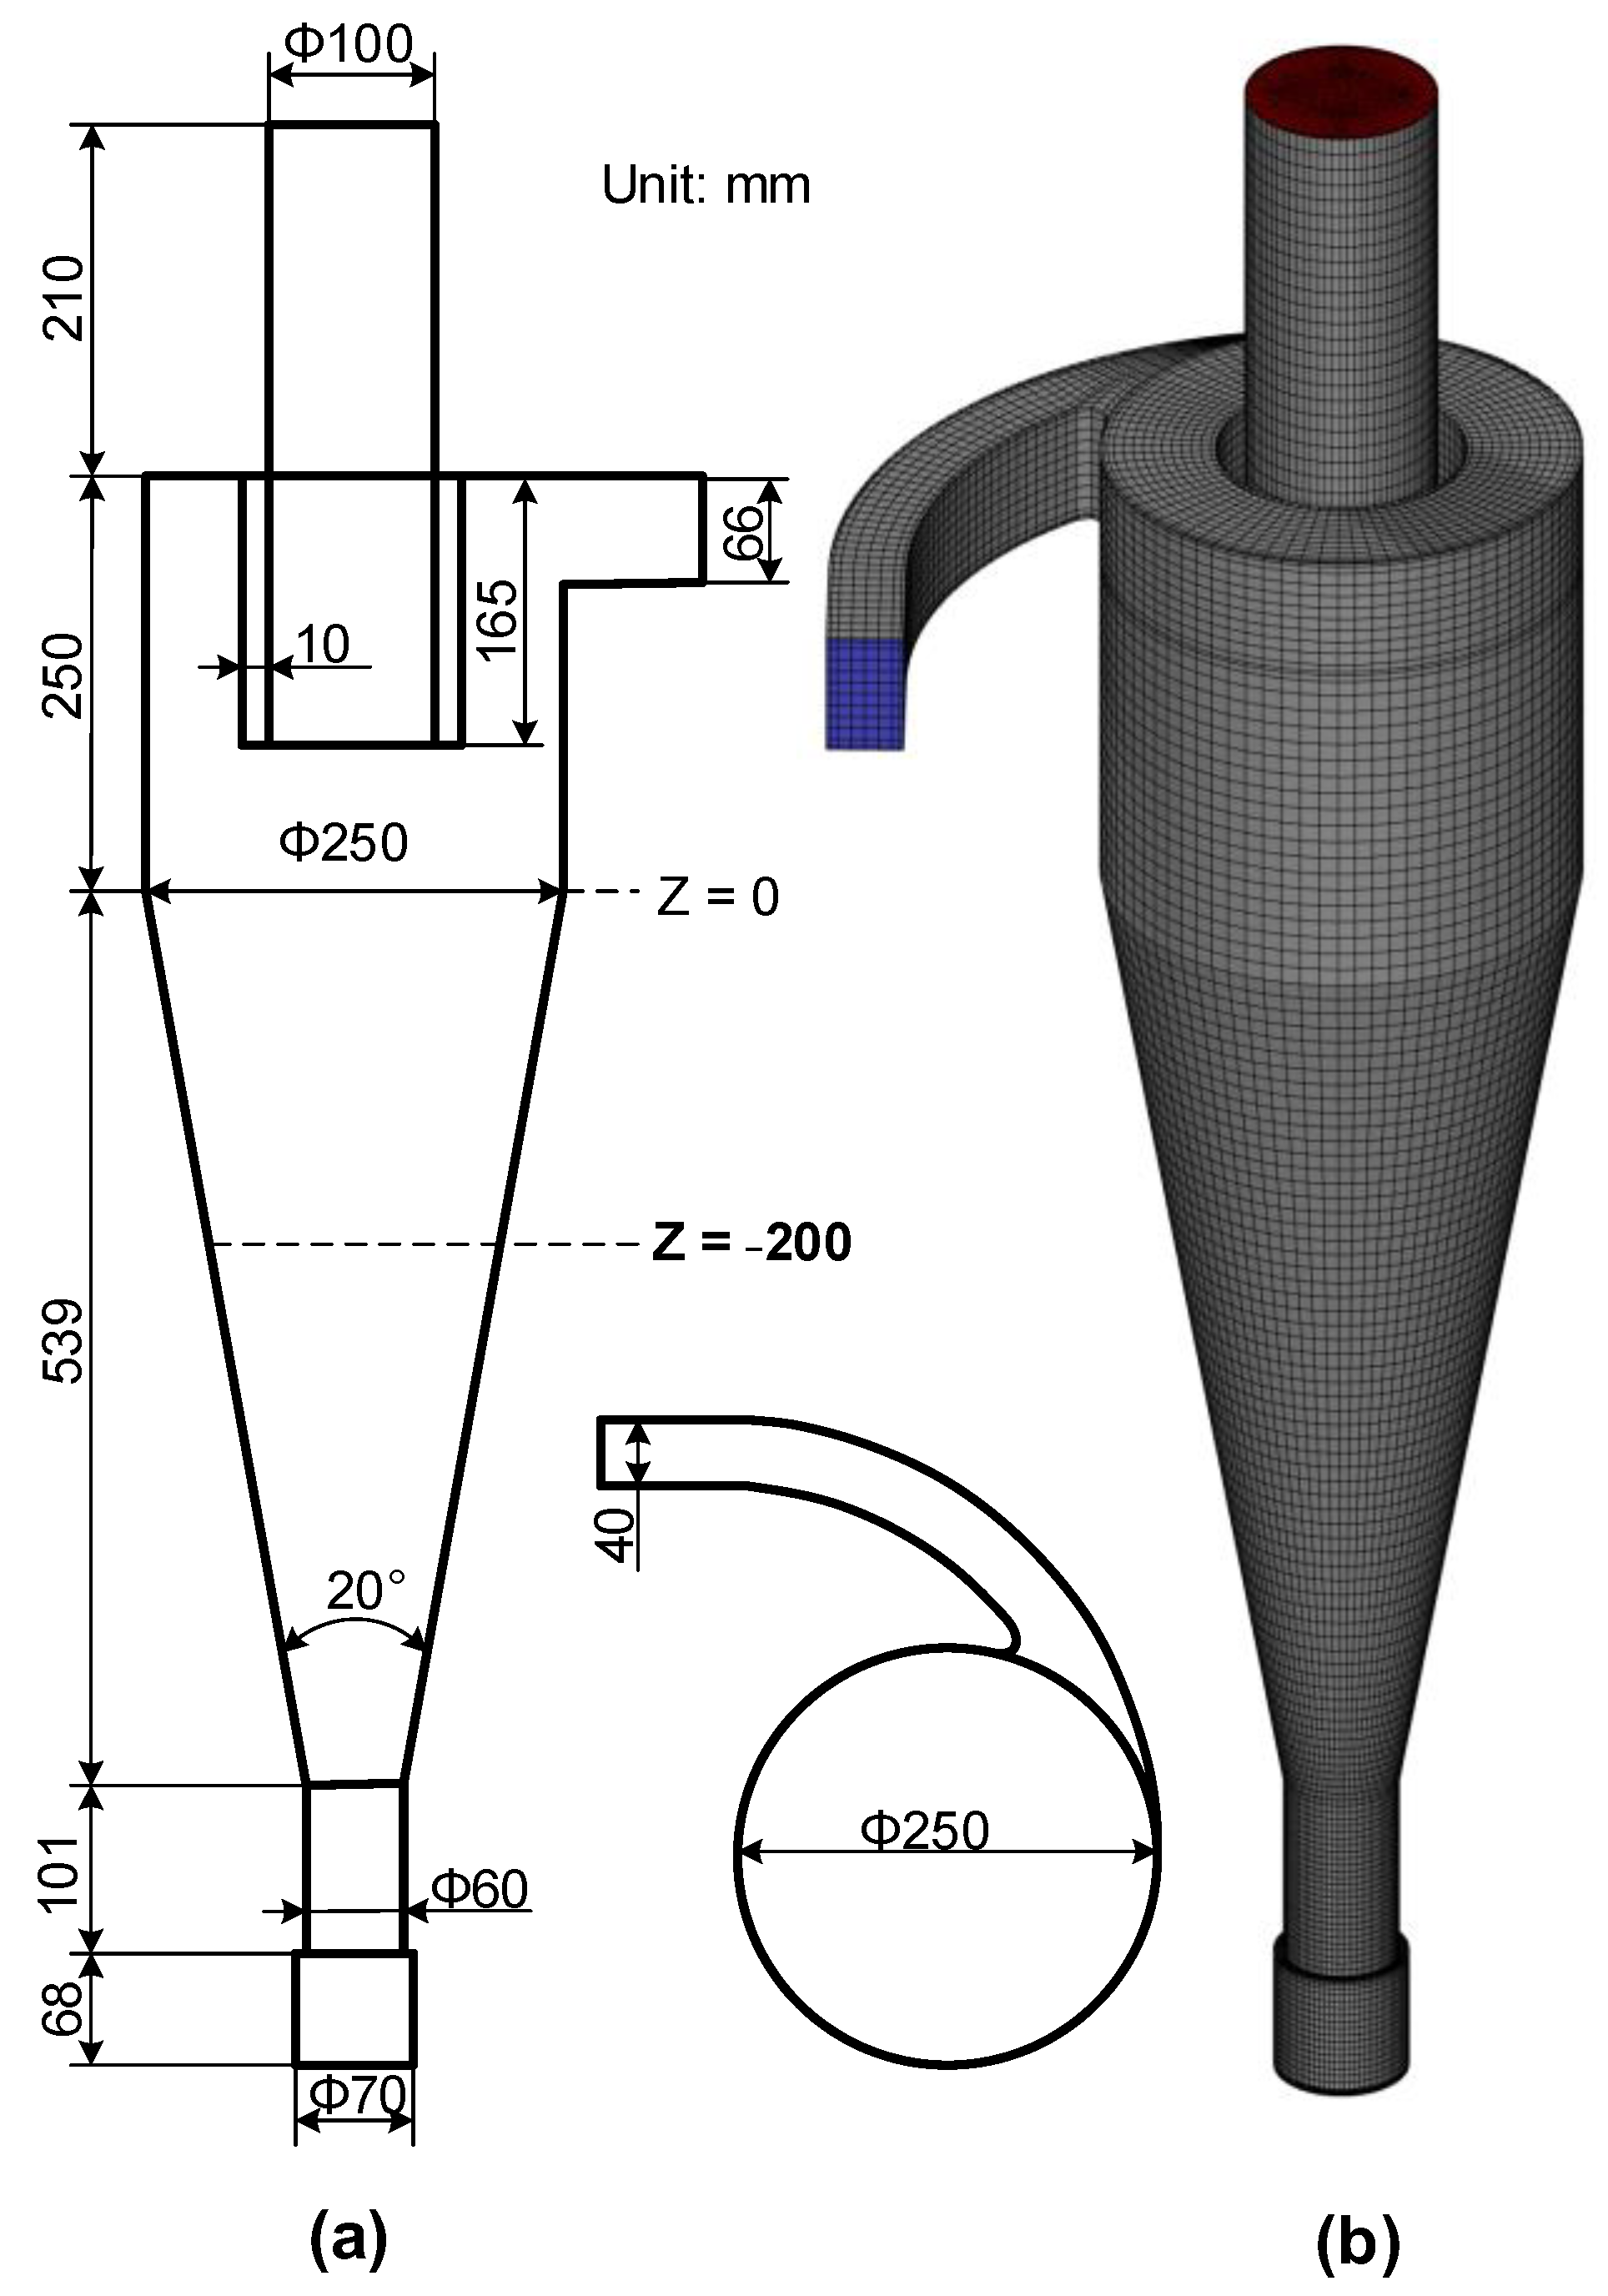
2.4.2. Geometry and Mesh
2.4.3. Simulation Conditions
2.5. Laboratory Experimental Work
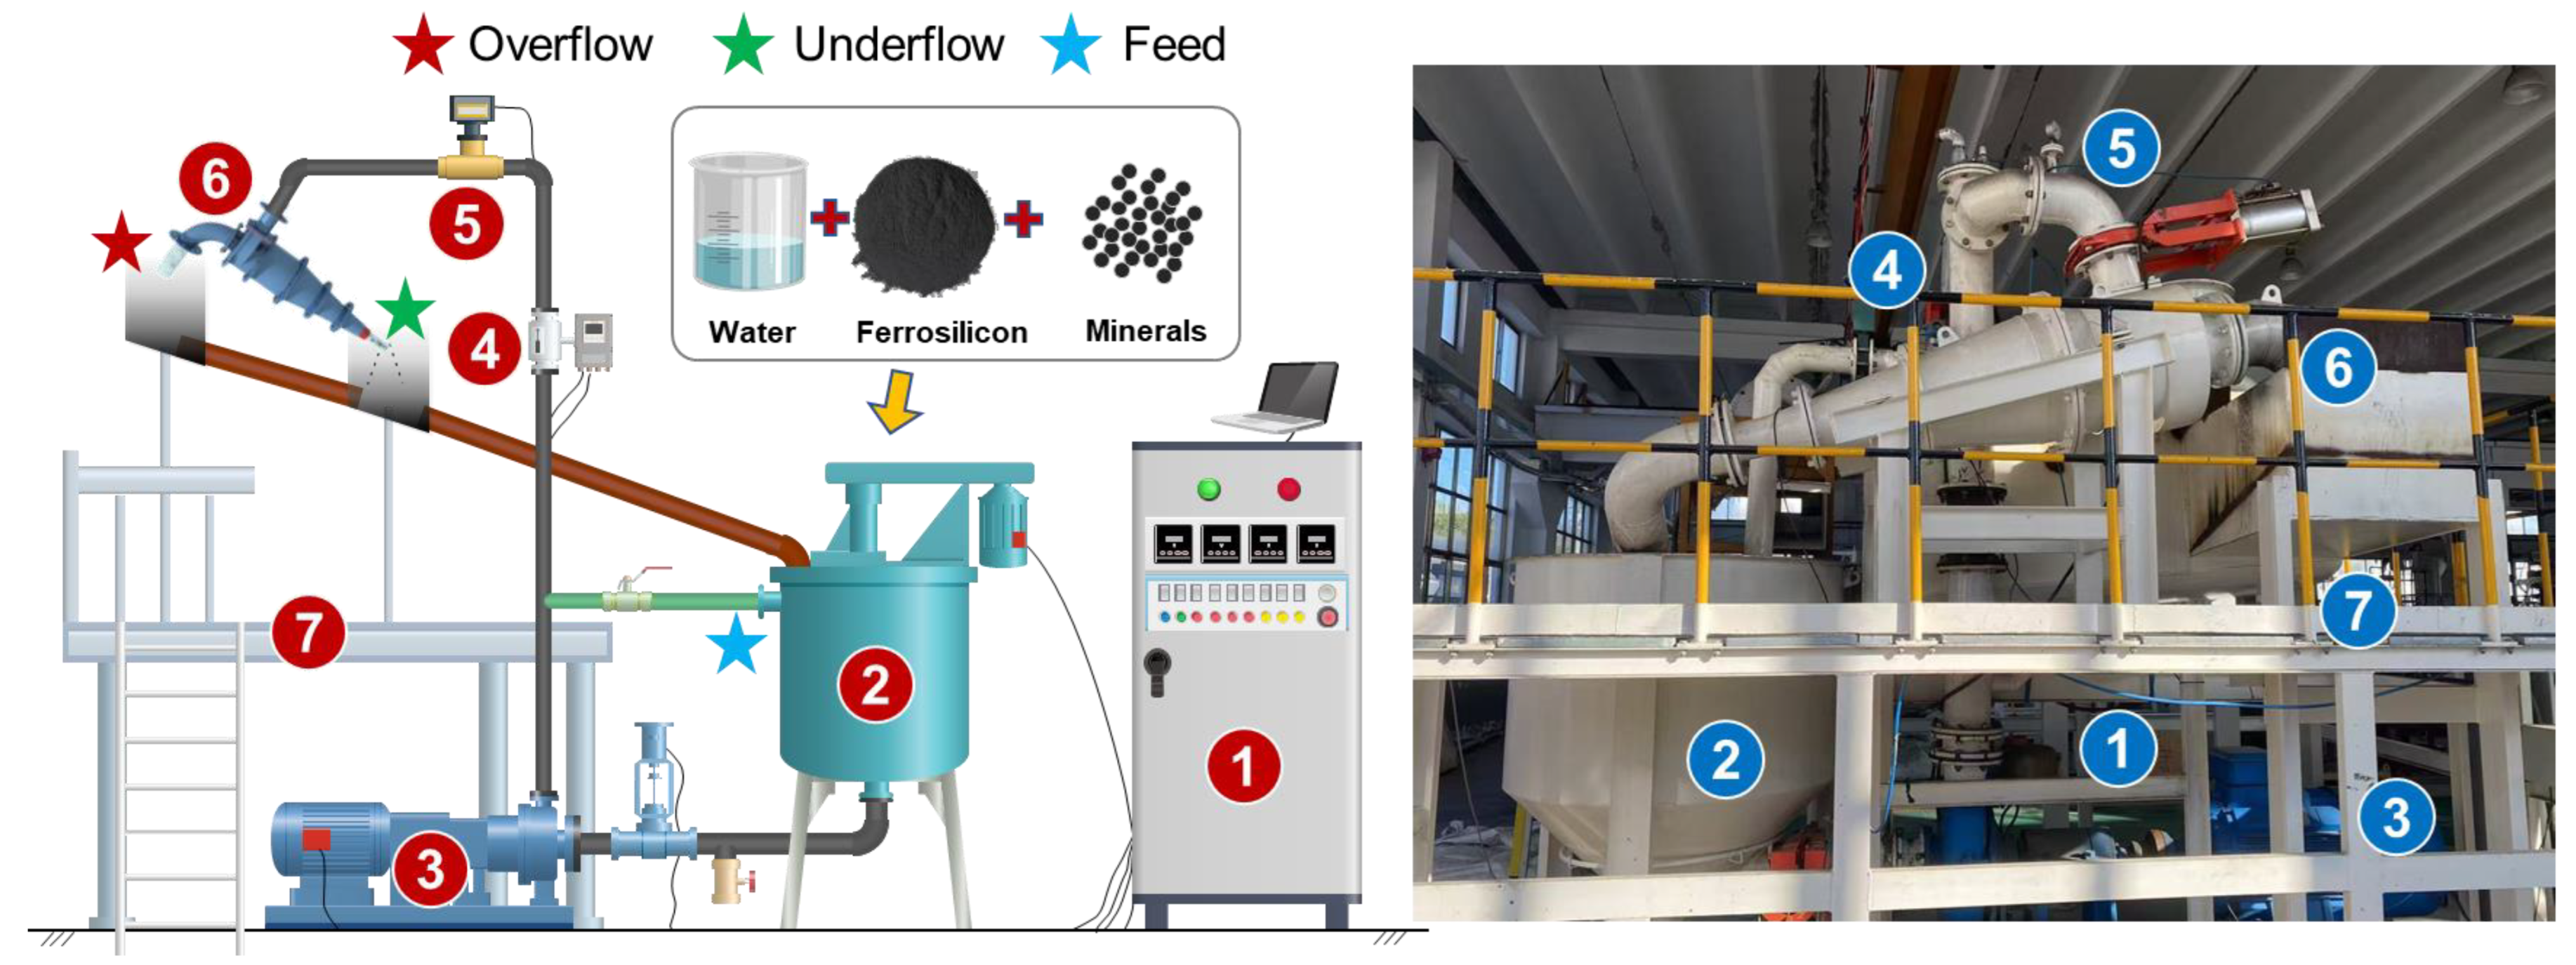
2.5.1. Test Rig
2.5.2. Properties of Dense Medium
2.5.3. Test Procedure and Data Collection
- (1)
- Material preparation
- (2)
- Sampling
- (3)
- Product processing
3. Results and Discussion
3.1. Heavy Liquid Separation Performance
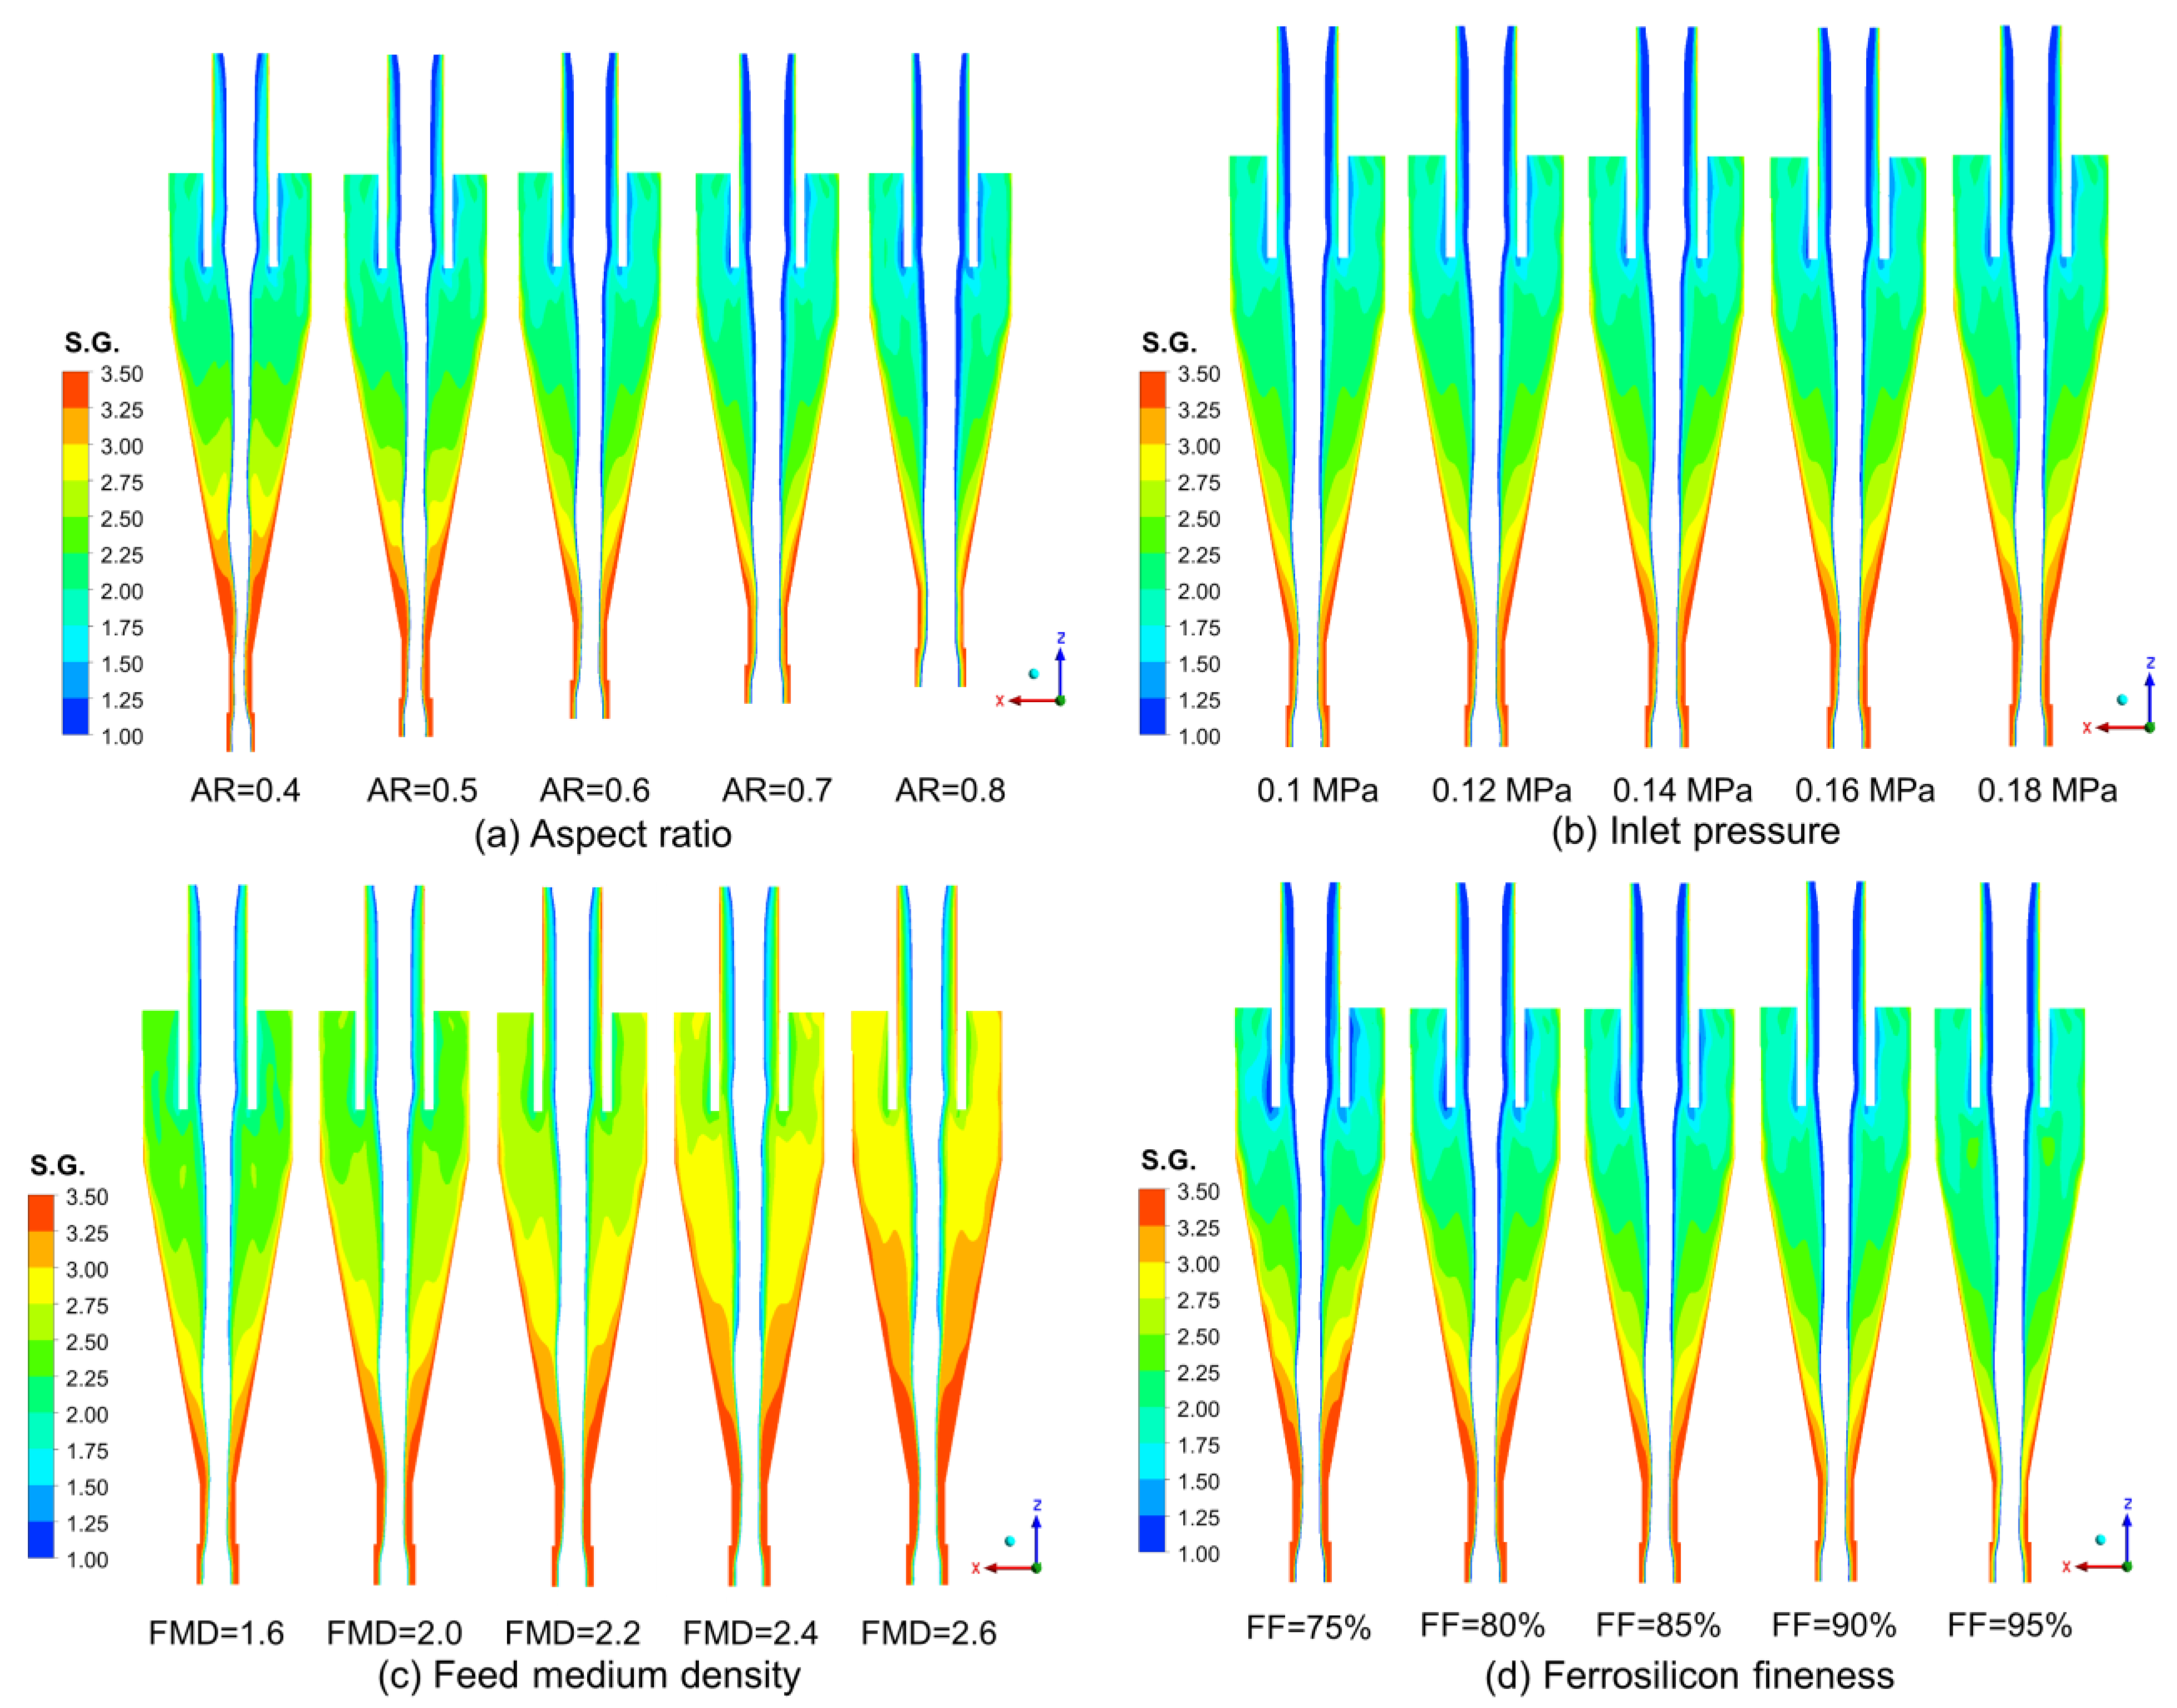
3.2. Effect of Primary Factors on Medium Stability Obtained from CFD Tests
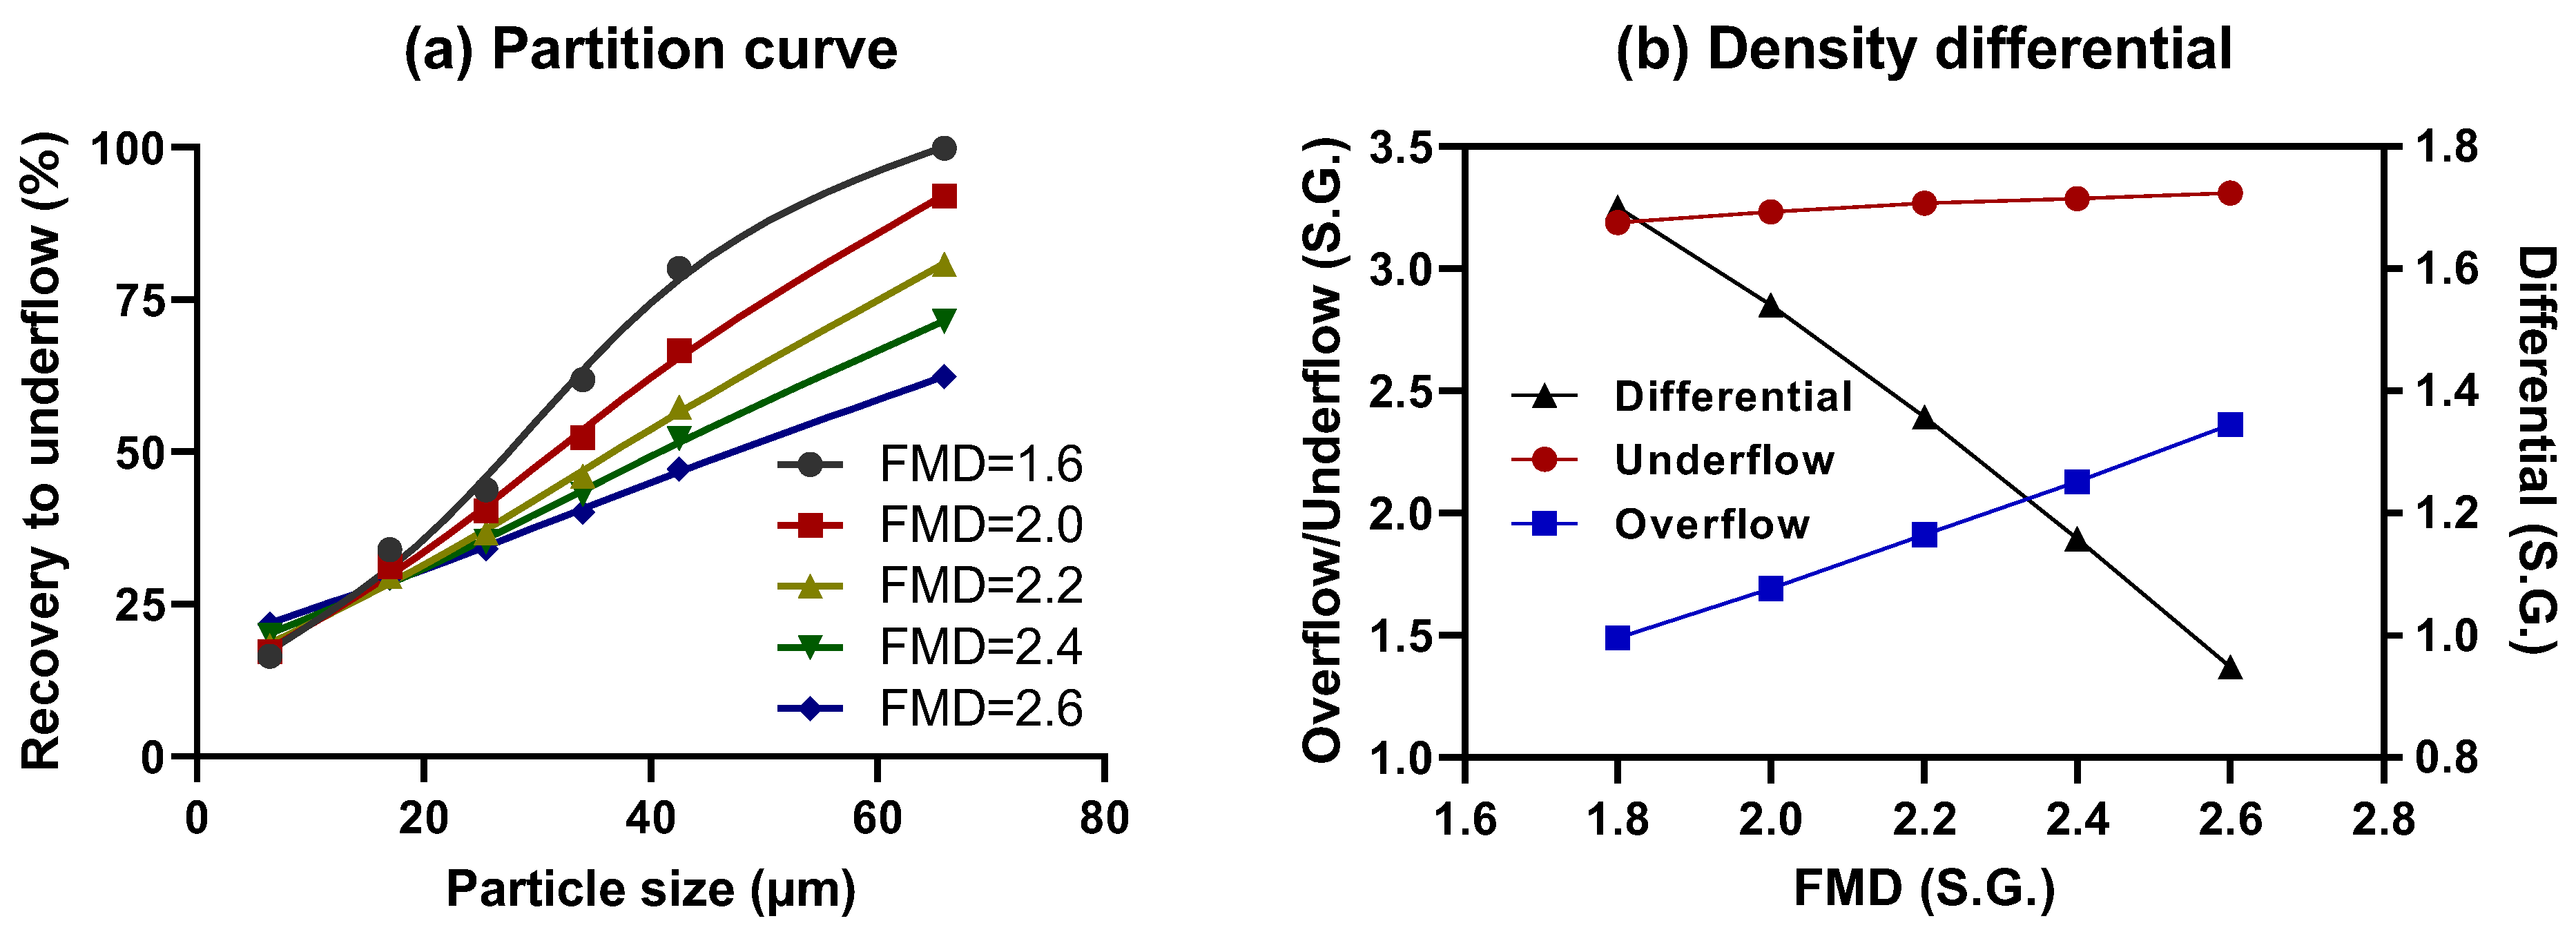
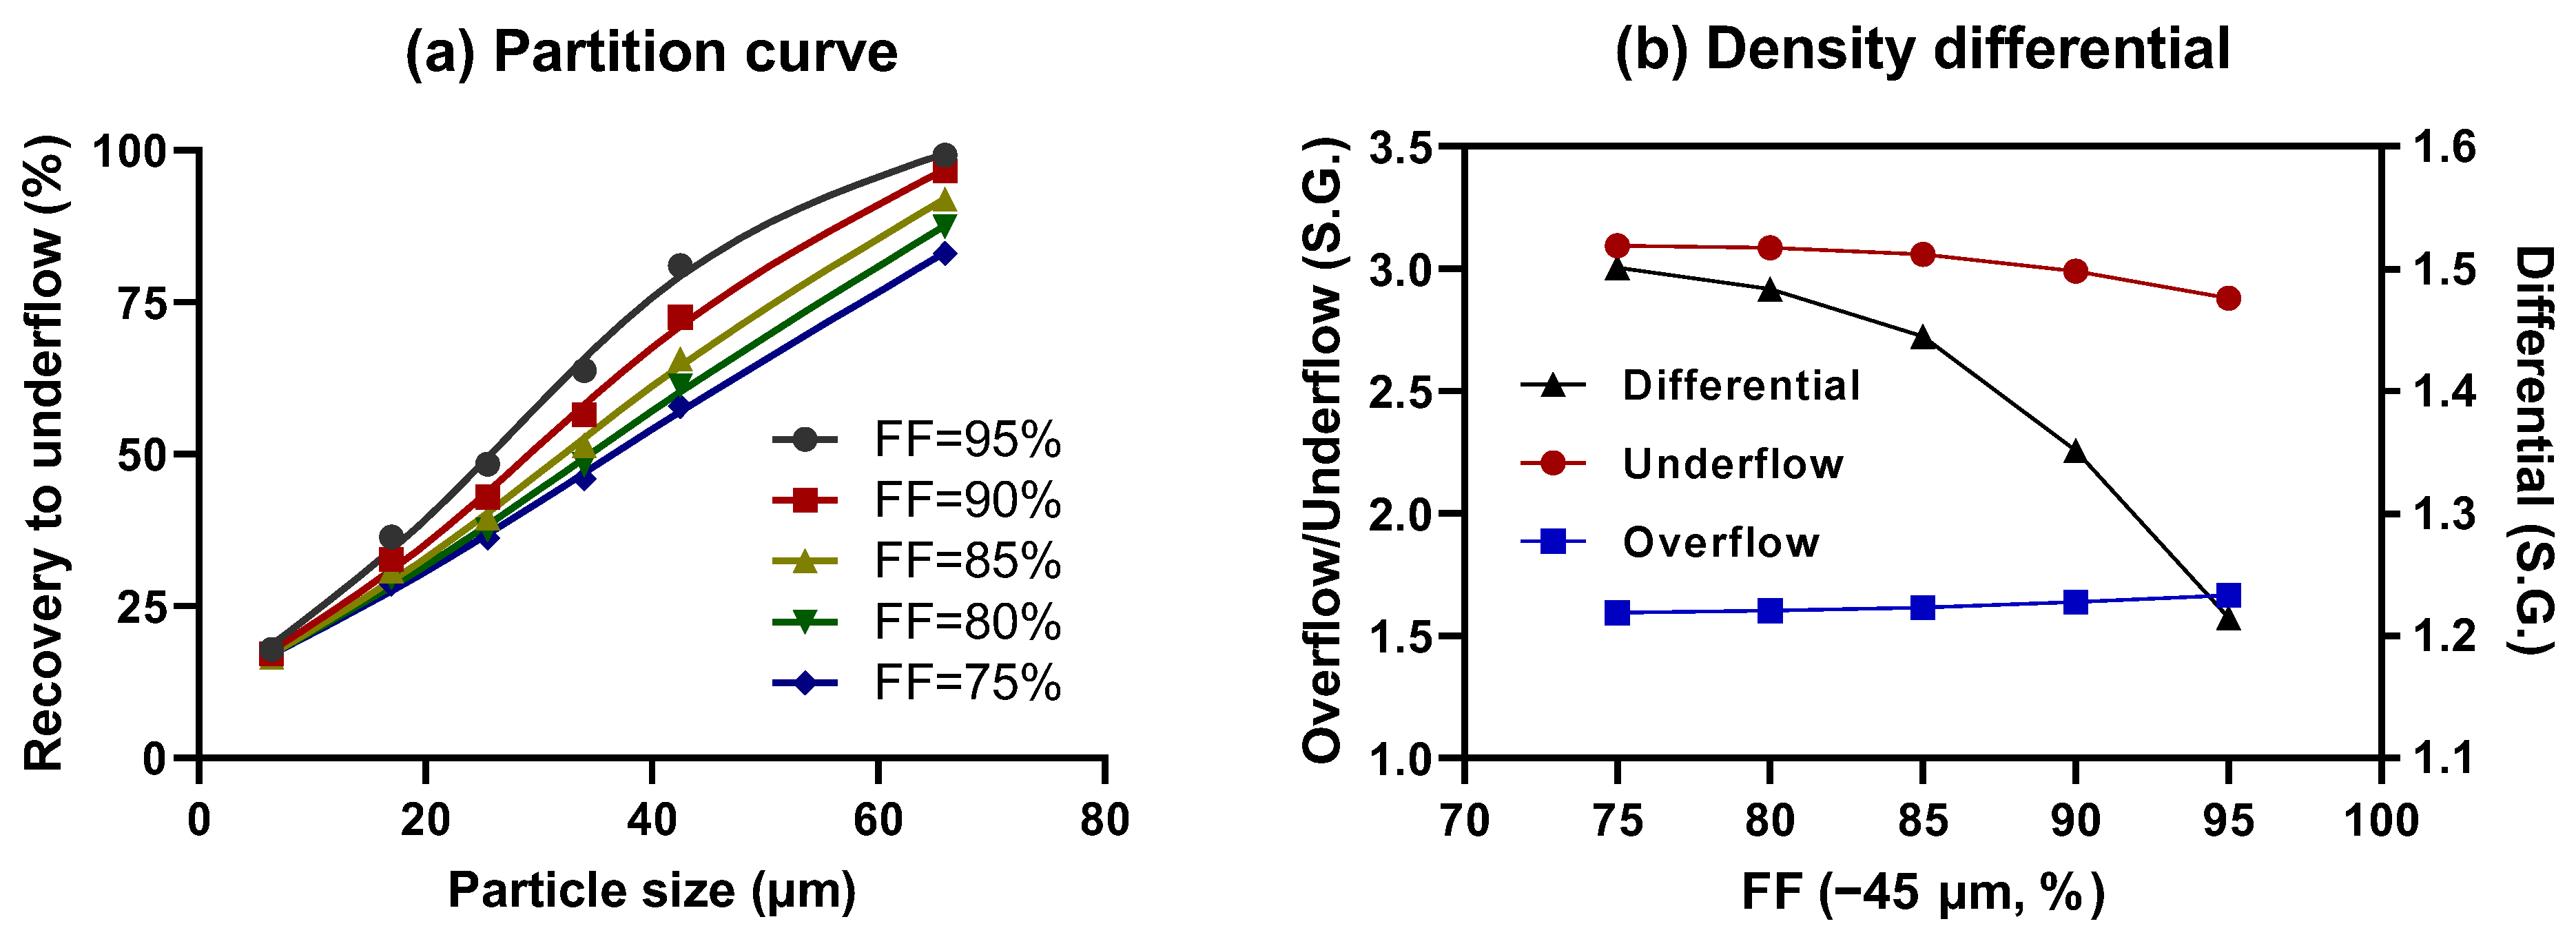
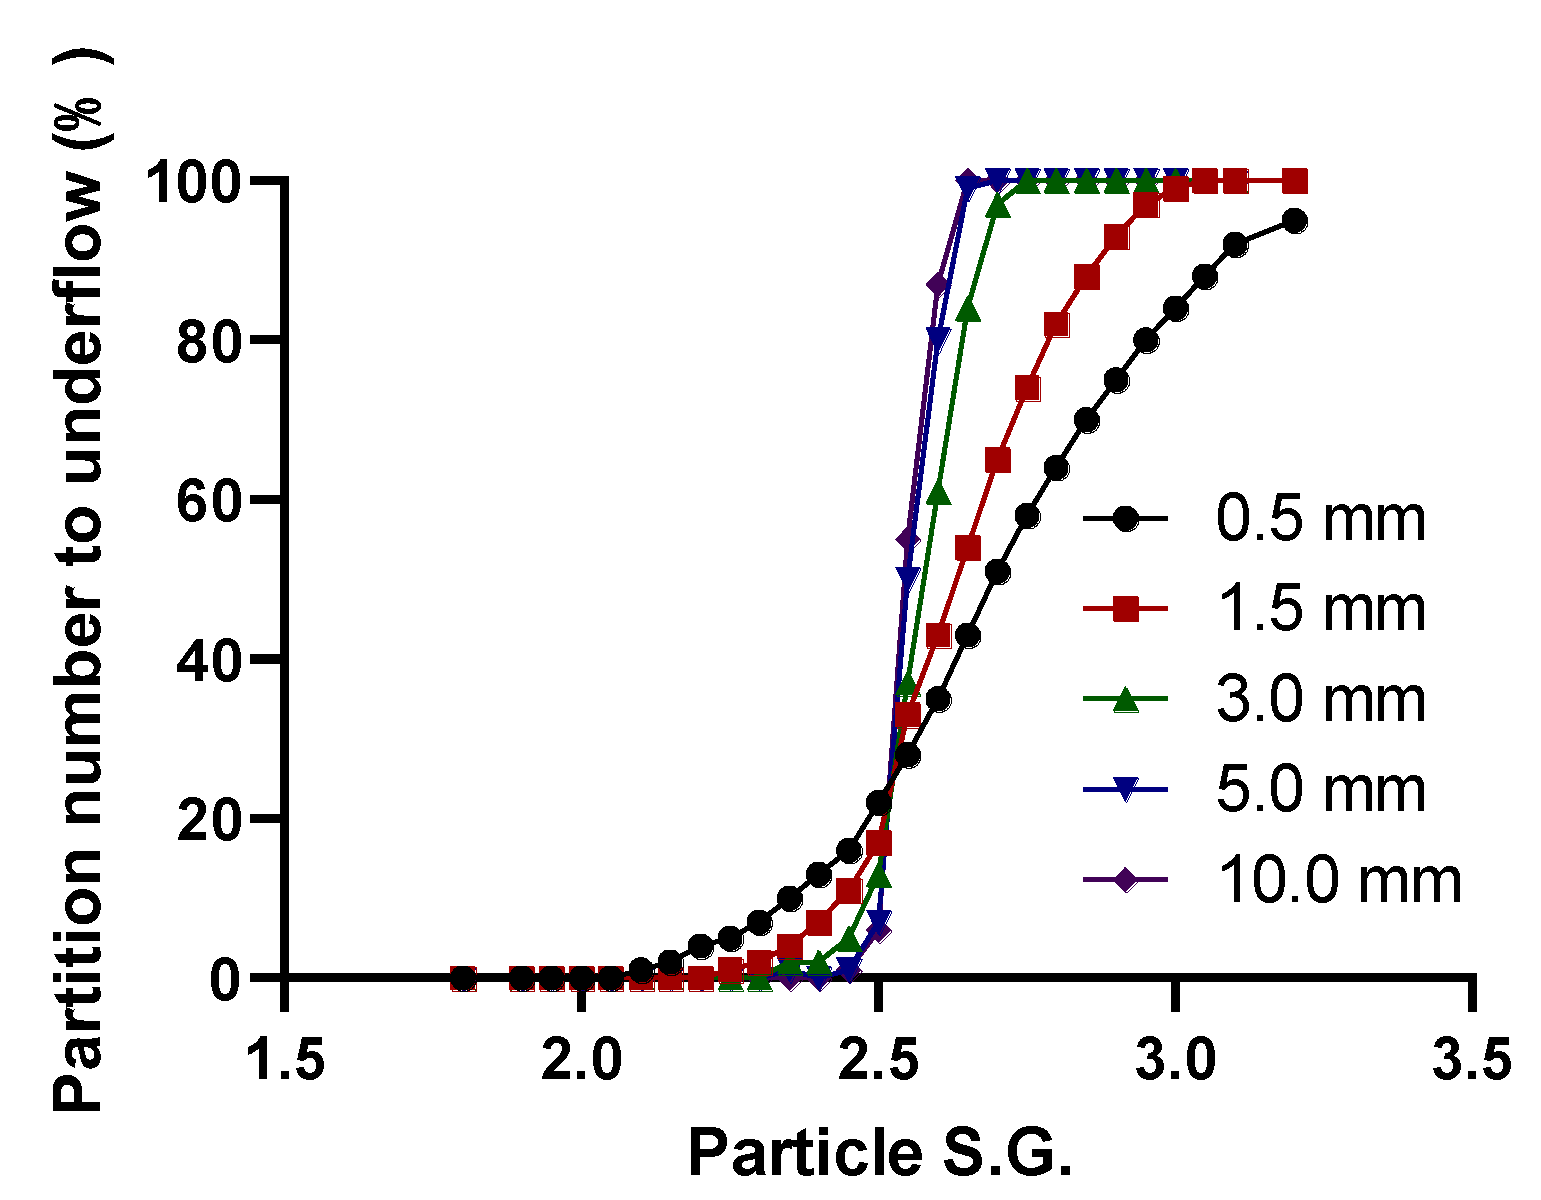
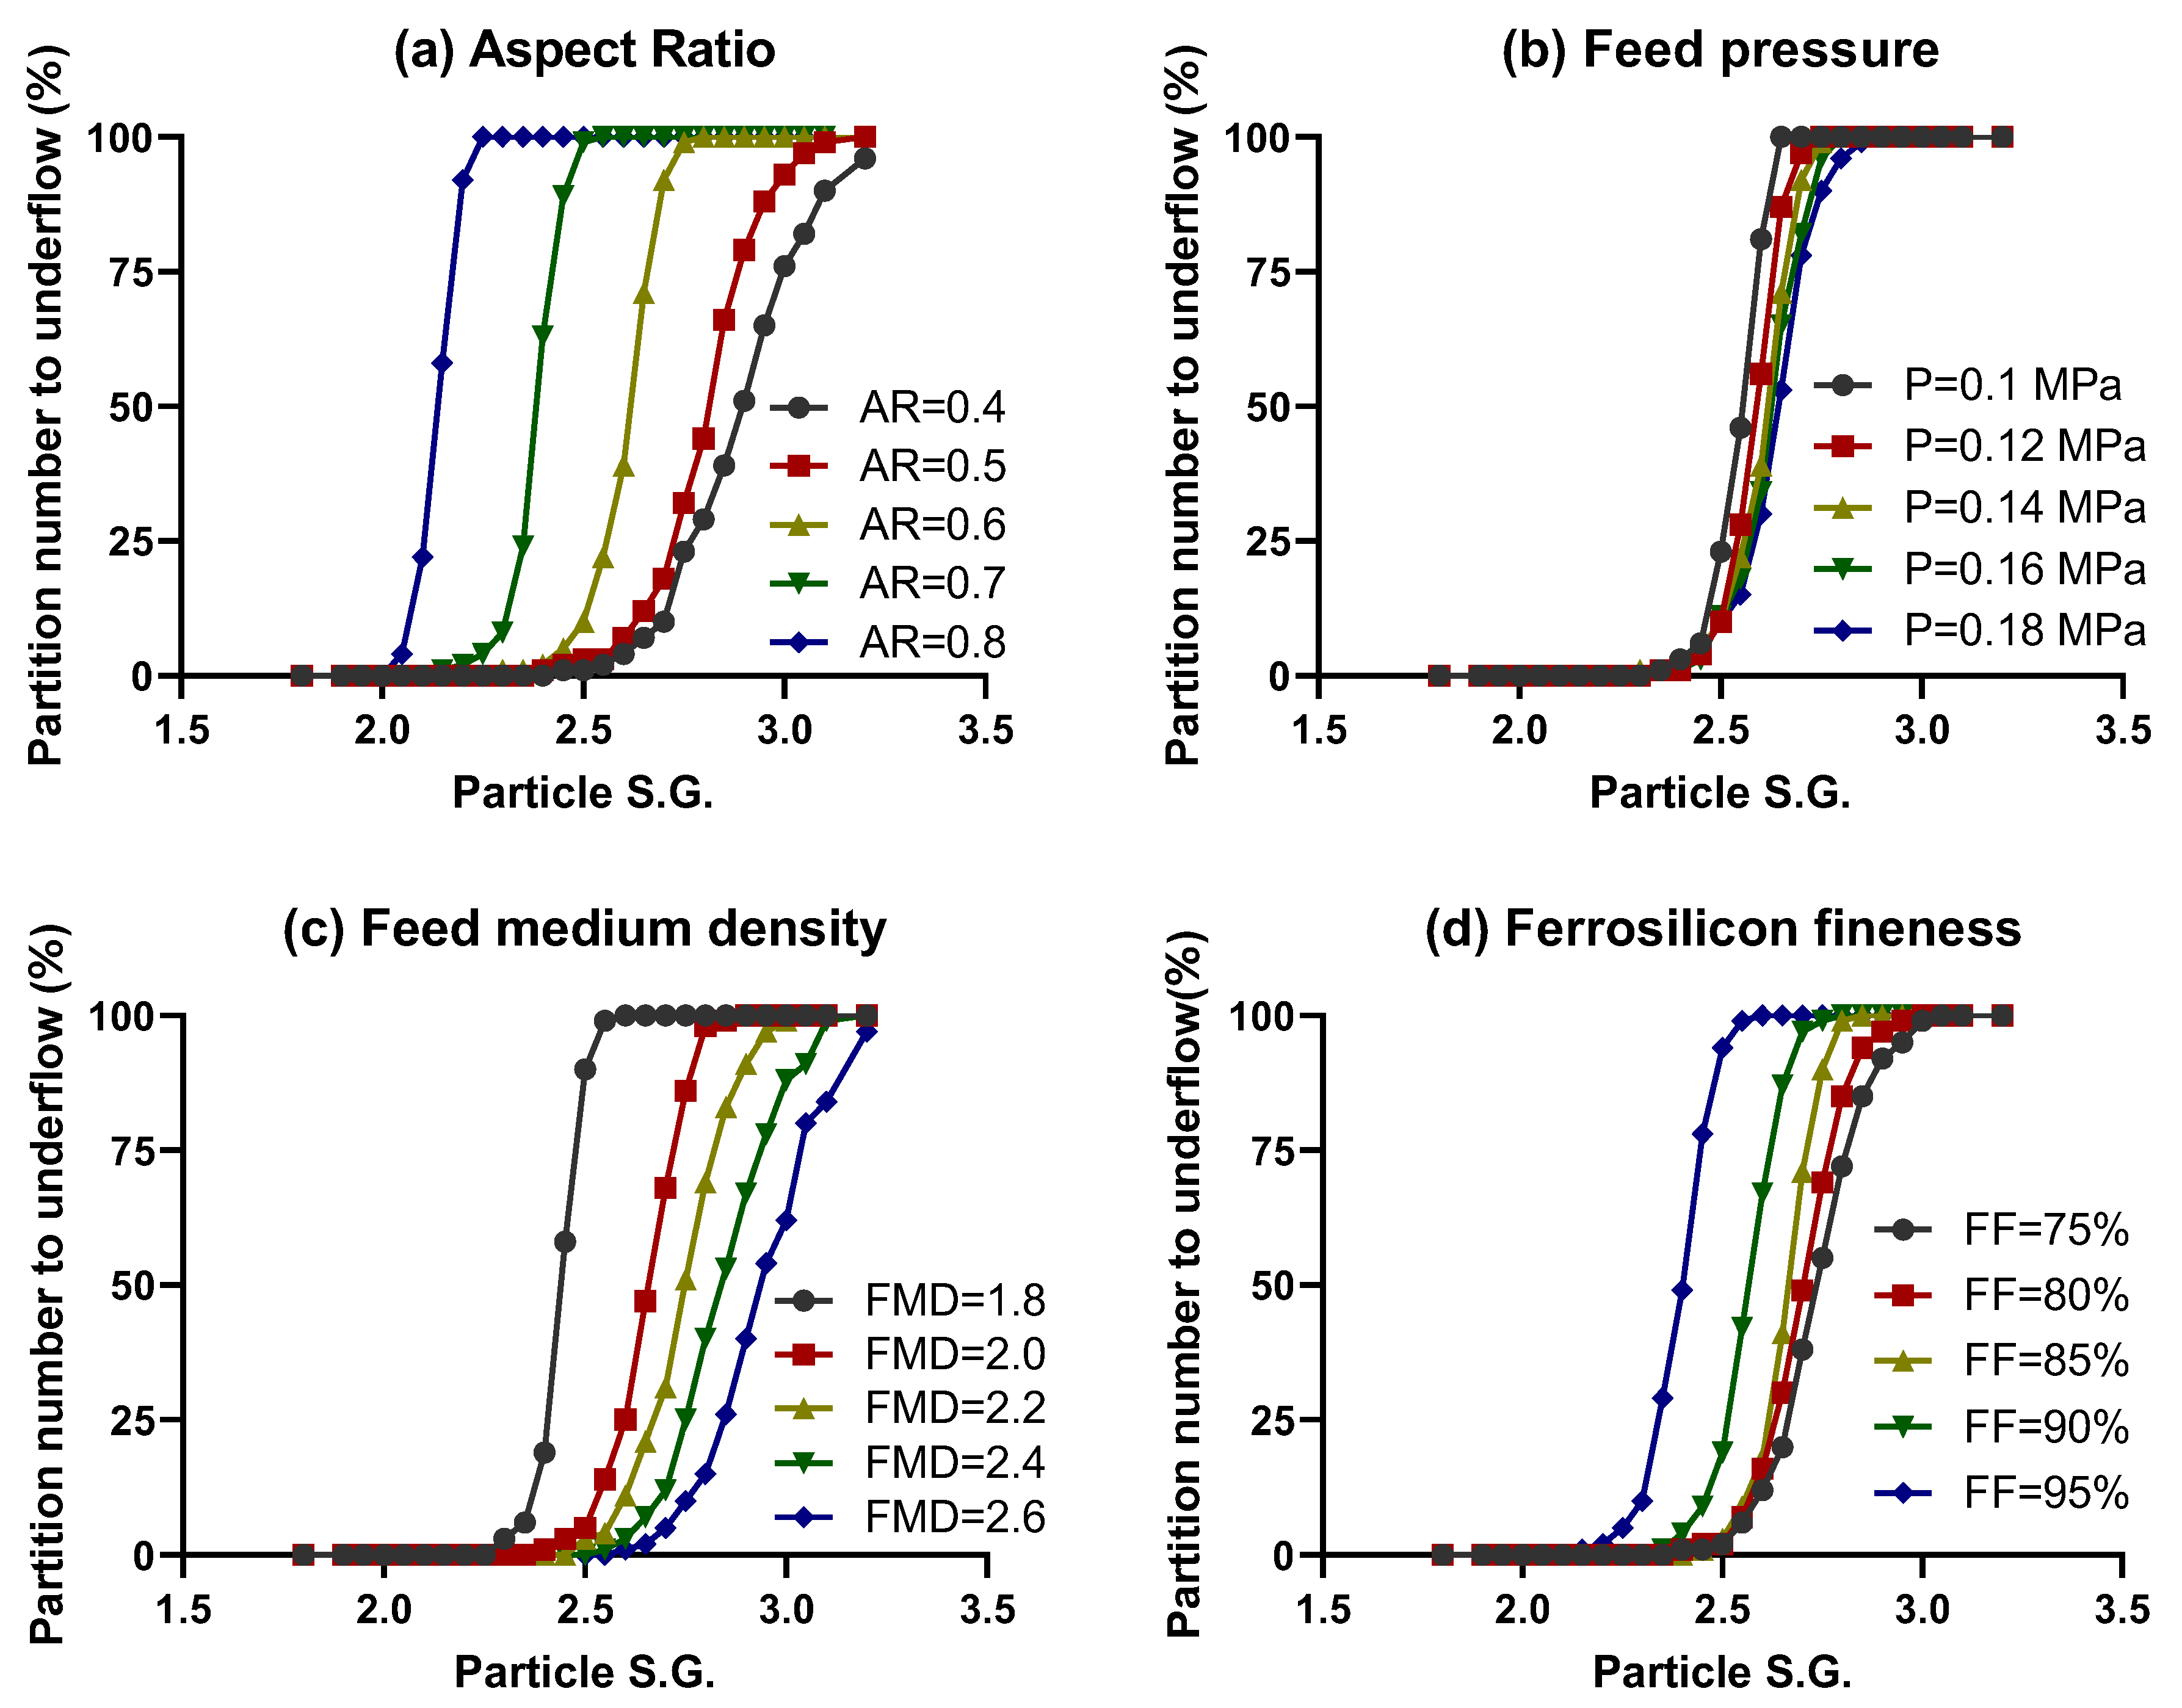
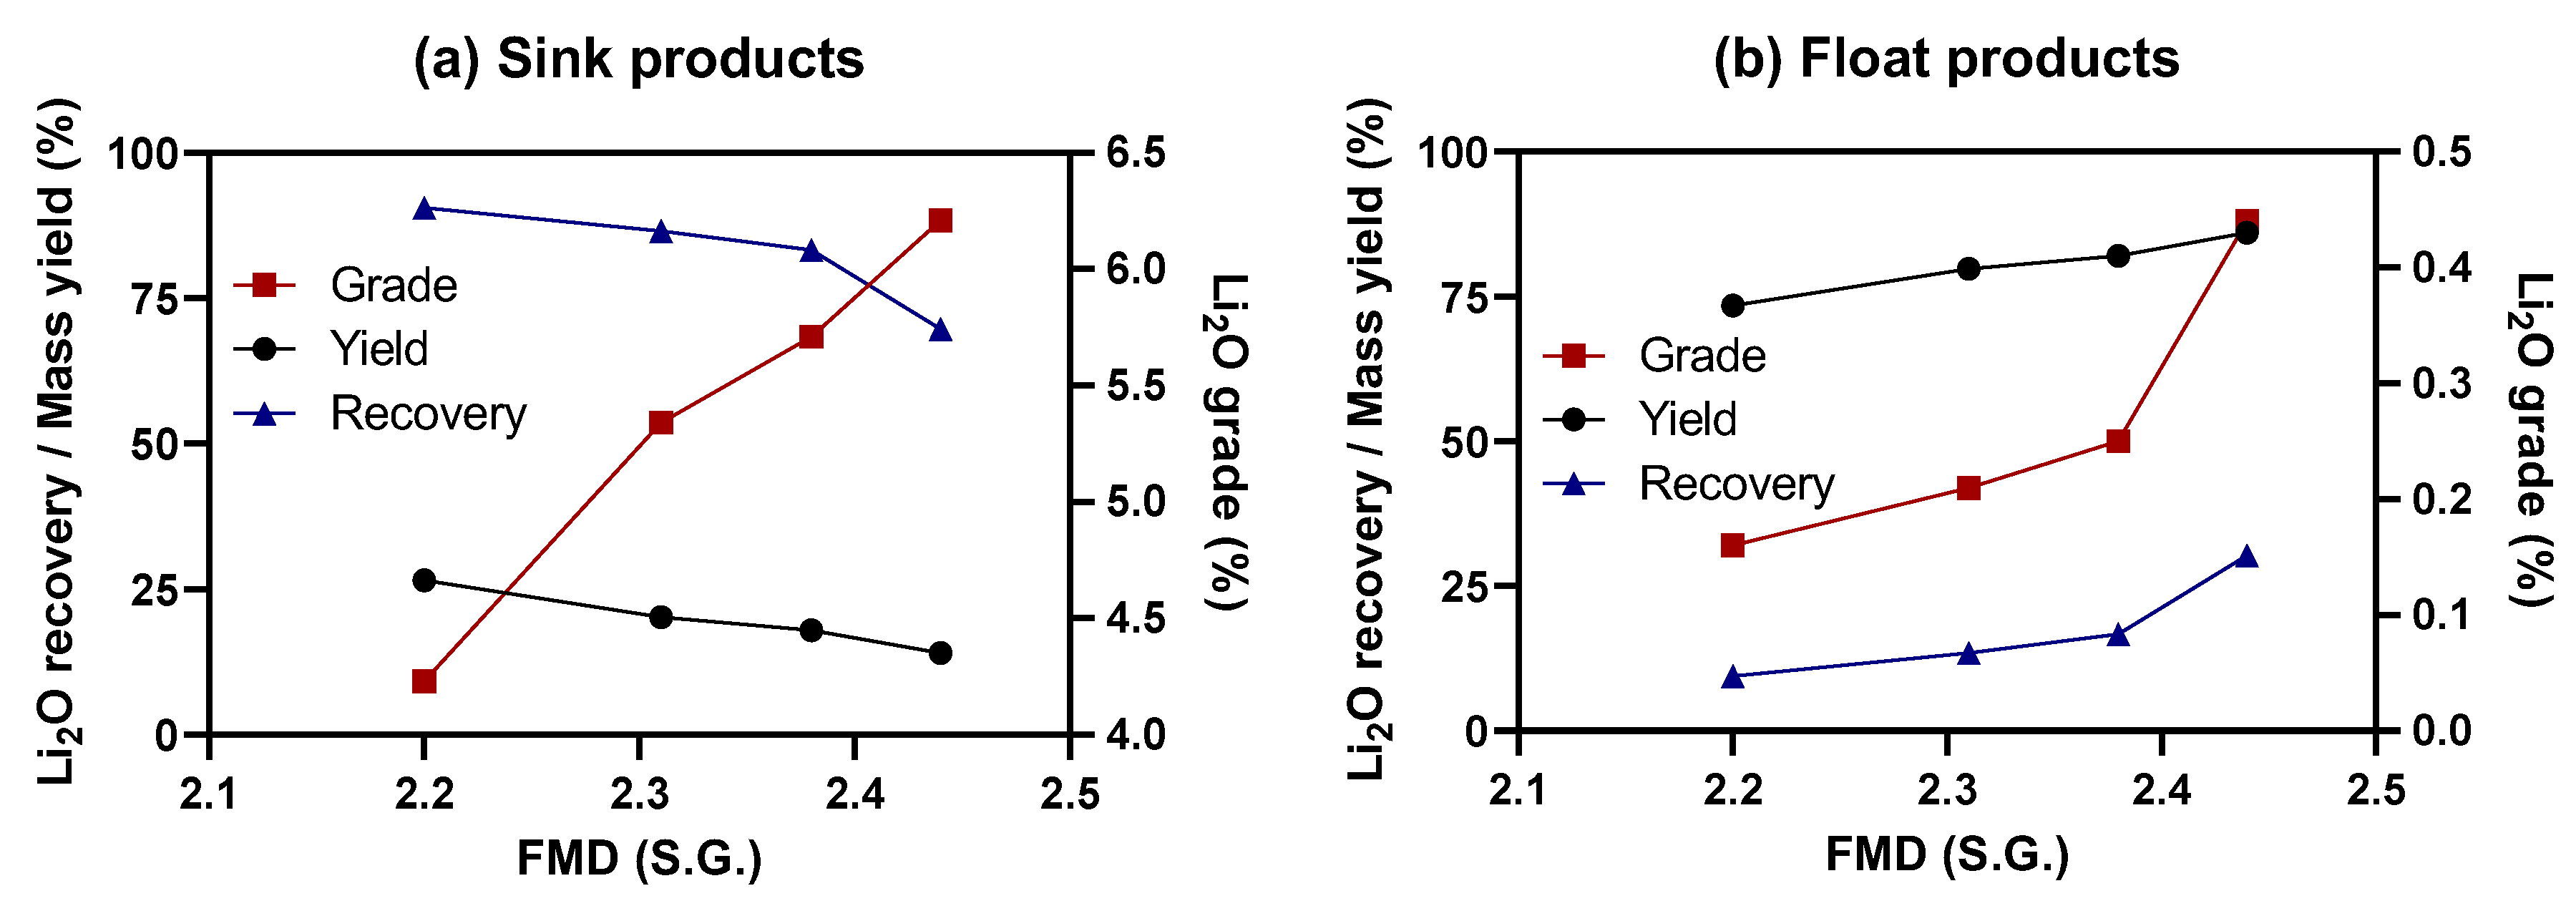
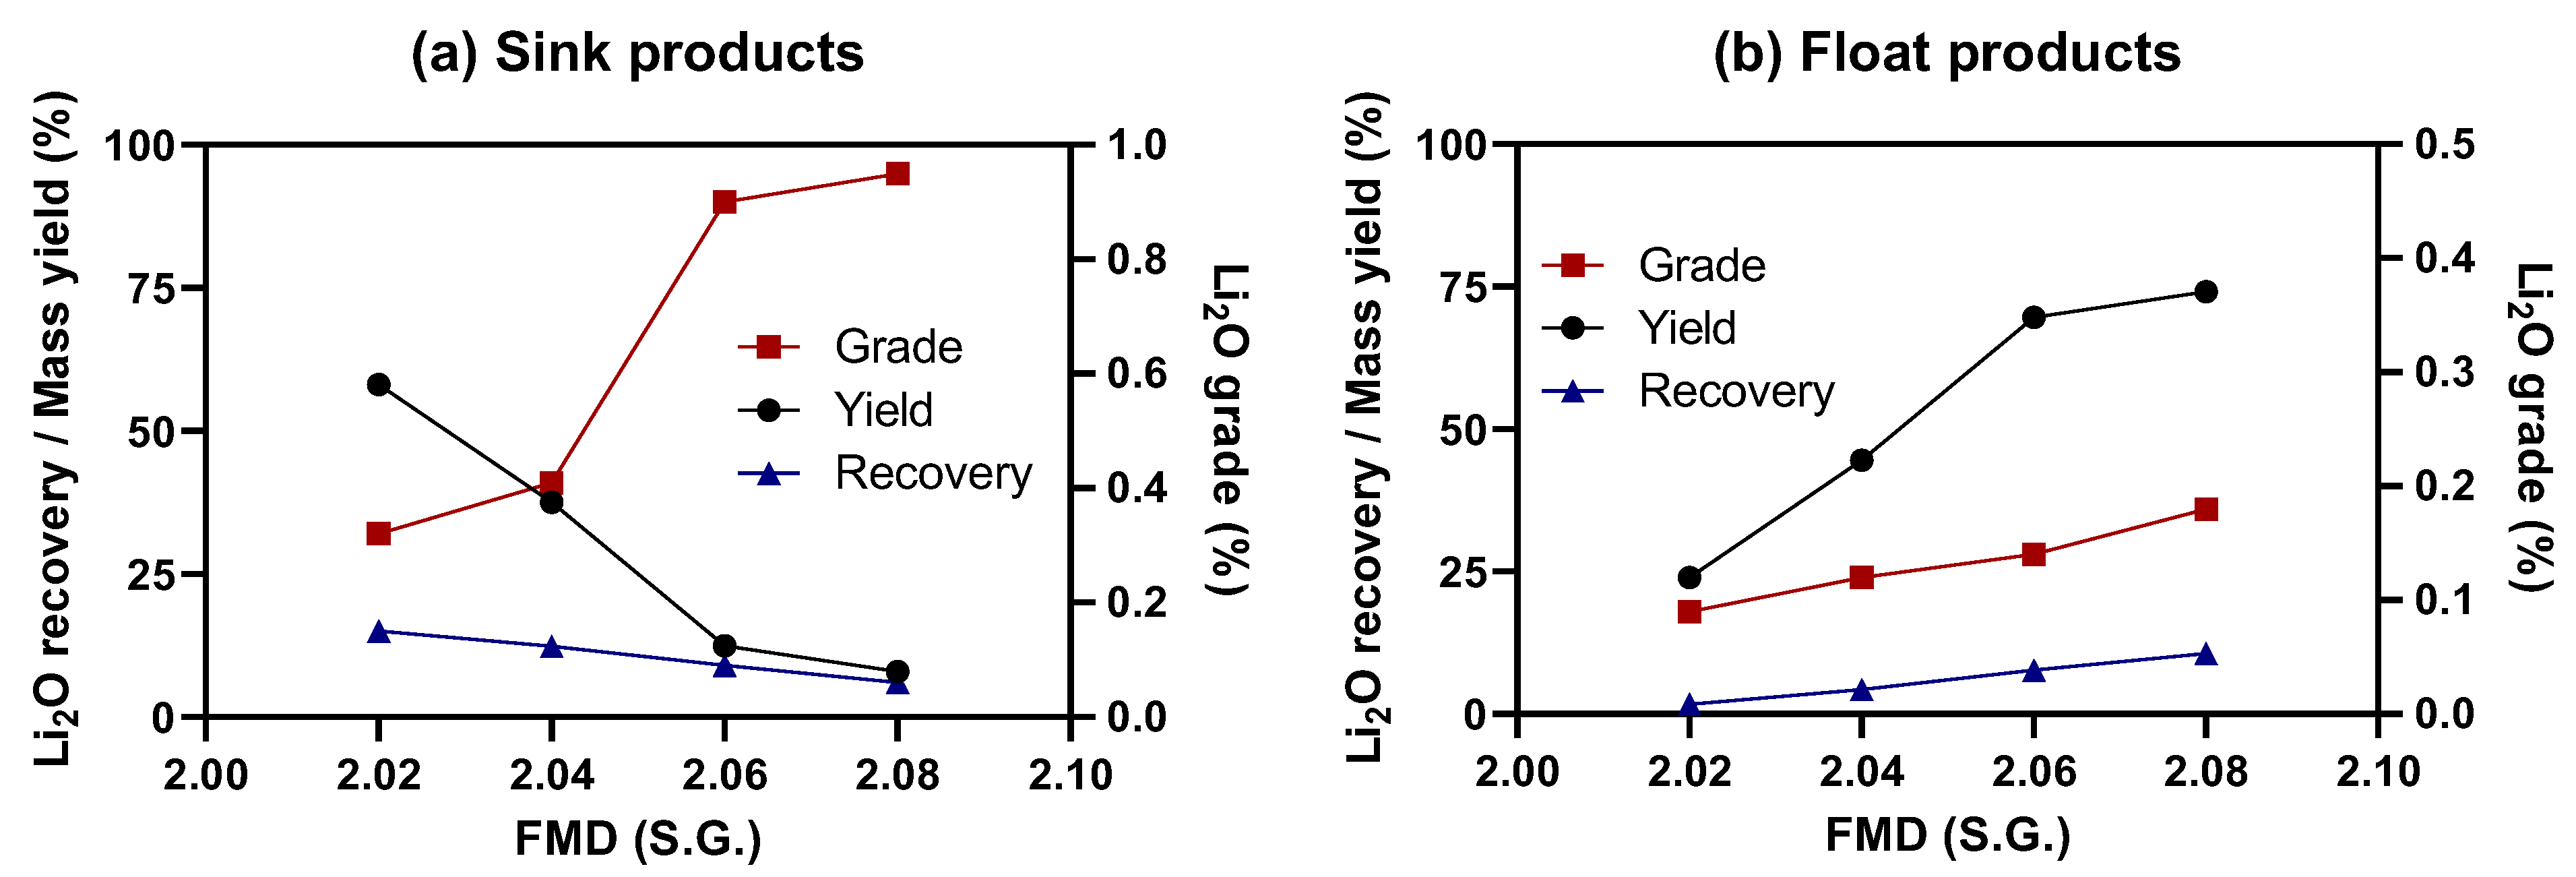
3.3. Effects of Primary Factors on Ore Separation Obtained from CFD Tests
3.4. Laboratory DMC Physical Tests
3.4.1. First-Stage DMS Tests
3.4.2. Second-Stage DMS Tests
3.4.3. Continuous Two-Stage DMS
4. Conclusions
Supplementary Materials
Author Contributions
Funding
Data Availability Statement
Acknowledgments
Conflicts of Interest
References
- Moss, R.; Tzimas, E.; Kara, H.; Willis, P.; Kooroshy, J. Critical Metals in Strategic Energy Technologies; Publications Office of the European Union: Luxembourg, 2011. [Google Scholar]
- Gu, S.; Zhang, L.; Fu, B.; Wang, X.; Ahn, J.W. Feasible route for the recovery of strategic metals from mixed lithium-ion batteries cathode materials by precipitation and carbonation. Chem. Eng. J. 2021, 420, 127561. [Google Scholar] [CrossRef]
- Dorn, F.M.; Peyré, F.R. Lithium as a Strategic Resource. J. Lat. Am. Geogr. 2020, 19, 68–90. [Google Scholar] [CrossRef]
- Liu, J.; Zhang, Y.; Zhou, J.; Wang, Z.; Zhu, P.; Cao, Y.; Zheng, Y.; Zhou, X.; Yan, C.; Qian, T. Advances and prospects in improving the utilization efficiency of lithium for high energy density lithium batteries. Adv. Funct. Mater. 2023, 33, 2302055. [Google Scholar] [CrossRef]
- Jaskula, B. Lithium Statistics and Information; United States Geological Survey: Reston, VA, USA, 2024. Available online: https://pubs.usgs.gov/periodicals/mcs2024/mcs2024-lithium.pdf (accessed on 1 February 2025).
- Seefurth, R.N.; Sharma, R.A. Investigation of lithium utilization from a lithium-silicon electrode. J. Electrochem. Soc. 1977, 124, 1207. [Google Scholar] [CrossRef]
- Tadesse, B.; Makuei, F.; Albijanic, B.; Dyer, L. The beneficiation of lithium minerals from hard rock ores: A review. Miner. Eng. 2019, 131, 170–184. [Google Scholar] [CrossRef]
- Xie, R.; Zhao, Z.; Tong, X.; Xie, X.; Song, Q.; Fan, P. Review of the research on the development and utilization of clay-type lithium resources. Particuology 2024, 87, 46–53. [Google Scholar] [CrossRef]
- Kesler, S.E.; Gruber, P.W.; Medina, P.A.; Keoleian, G.A.; Everson, M.P.; Wallington, T.J. Global lithium resources: Relative importance of pegmatite, brine and other deposits. Ore Geol. Rev. 2012, 48, 55–69. [Google Scholar] [CrossRef]
- Bowell, R.J.; Lagos, L.; de los Hoyos, C.R.; Declercq, J. Classification and characteristics of natural lithium resources. Elements 2020, 16, 259–264. [Google Scholar] [CrossRef]
- Gourcerol, B.; Gloaguen, E.; Melleton, J.; Tuduri, J.; Galiegue, X. Re-assessing the European lithium resource potential—A review of hard-rock resources and metallogeny. Ore Geol. Rev. 2019, 109, 494–519. [Google Scholar] [CrossRef]
- Sahoo, S.K.; Tripathy, S.K.; Nayak, A.; Hembrom, K.C.; Dey, S.; Rath, R.K.; Mohanta, M.K. Beneficiation of lithium bearing pegmatite rock: A review. Miner. Process. Extr. Metall. Rev. 2024, 45, 1–27. [Google Scholar] [CrossRef]
- Kundu, T.; Rath, S.S.; Das, S.K.; Parhi, P.K.; Angadi, S.I. Recovery of lithium from spodumene-bearing pegmatites: A comprehensive review on geological reserves, beneficiation, and extraction. Powder Technol. 2023, 415, 118142. [Google Scholar] [CrossRef]
- Oliazadeh, M.; Aghamirian, M.; Ali, S.; Legault, E.; Gibson, C. Flowsheet development for benefication of lithium minerals from hard rock deposits. In Extraction 2018, Proceedings of the First Global Conference on Extractive Metallurgy; Springer: Cham, Switzerland, 2018; pp. 2293–2307. [Google Scholar]
- Legault-Seguin, E.; Mohns, C.; Rylatt, M.; Lakefield, O. Dense Medium Separation—An Effective and Robust Preconcentration Technology. In Proceedings of the 48th Annual Canadian Mineral Processors Operators Conference, Ottawa, ON, Canada, 19–21 January 2016; pp. 19–21. [Google Scholar]
- Xie, R.; Zhu, Y.; Liu, J.; Li, Y.; Wang, X.; Shumin, Z. Research status of spodumene flotation: A review. Miner. Process. Extr. Metall. Rev. 2021, 42, 321–334. [Google Scholar] [CrossRef]
- Leißner, T.; Bachmann, K.; Gutzmer, J.; Peuker, U.A. MLA-based partition curves for magnetic separation. Miner. Eng. 2016, 94, 94–103. [Google Scholar] [CrossRef]
- Gibson, C.E.; Aghamirian, M.; Grammatikopoulos, T.; Smith, D.L.; Bottomer, L. The recovery and concentration of spodumene using dense media separation. Minerals 2021, 11, 649. [Google Scholar] [CrossRef]
- Munson, G.A.; Clarke, F.F. Mining and concentrating spodumene in the Black Hills, South Dakota. AIME Trans. 1955, 202, 1041. [Google Scholar]
- Redeker, I.H. Concentration of spodumene from North Carolina pegmatite ores. In Proceedings of the SME Fall Meeting and Exhibit, St. Louis, MI, USA, 4 January 1979; pp. 11–13. [Google Scholar]
- Amarante, M.; de Sousa, A.; Leite, M. Processing a spodumene ore to obtain lithium concentrates for addition to glass and ceramic bodies. Miner. Eng. 1999, 12, 433–436. [Google Scholar] [CrossRef]
- Bradley, K.; Liu, J.; Anguelov, R.; Hadley, T. The beneficiation and metallurgical process for the production of mixed REE Product from the nechalacho deposit. In Conference of Metallurgists; Springer: Cham, Switzerland, 2022; pp. 681–698. [Google Scholar]
- Ferrara, G. State-of-the-art and New developments in dense medium separation processes. In Mineral Processing, Proceedings of a Conference Honouring Professor P. C. Kapur on His 60th Birthday, New Delhi, India; Allied Publishers Ltd.: New Delhi, India, 1995; pp. 311–331. [Google Scholar]
- He, Y.; Laskowski, J. Effect of dense medium properties on the separation performance of a dense medium cyclone. Miner. Eng. 1994, 7, 209–221. [Google Scholar] [CrossRef]
- Scott, I.A.; Napier-Munn, T.J.; Timothy, J. A dense medium cyclone model for simulation. In Proceedings of the 4th Samancor Symposium on Dense Media Separation: Dense Media 90, Cairns, Australia, 22–23 February 1990. [Google Scholar]
- Collins, B.; Napier-Munn, T.J.; Sciarone, M. The production, properties, and selection of ferrosilicon powders for heavy-medium separation. J. South Afr. Inst. Min. Metall. 1974, 75, 103–115. [Google Scholar]
- Davis, J. A Study of Coal Washing Dense Medium Cyclones. Ph.D. Thesis, University of Queensland, Brisbane, Australia, 1987. [Google Scholar]
- Wood, C.J. A Performance Model for Coal-Washing Dense Medium Cyclones. Ph.D. Thesis, University of Queensland, Brisbane, Australia, 1990. [Google Scholar]
- Zhao, Q.; Cui, B.; Shen, Y.; Liu, W.; Zhao, S.; Feng, Y. Understanding the characteristics and functions of axial velocity fluctuation zone in hydrocyclones: Part 1 flow pattern. Chem. Eng. Sci. 2024, 283, 119368. [Google Scholar] [CrossRef]
- Narasimha, M.; Brennan, M.; Holtham, P.N. A review of CFD modelling for performance predictions of hydrocyclone. Eng. Appl. Comp. Fluid Mech. 2007, 1, 109–125. [Google Scholar] [CrossRef]
- Yao, Y.; Shang, M.; Huang, Z.; Zhou, T.; Zhang, M.; Yang, H.; Lyu, J. Effects of the inlet duct length on the performance of a dense medium cyclone: An experimental and numerical study. Chem. Eng. Res. Des. 2022, 187, 41–50. [Google Scholar] [CrossRef]
- Tian, J.Y.; Ni, L.; Song, T.; Olson, J.; Zhao, J.N. An overview of operating parameters and conditions in hydrocyclones for enhanced separations. Sep. Purif. Technol. 2018, 206, 268–285. [Google Scholar] [CrossRef]
- Ni, L.; Tian, J.Y.; Song, T.; Jong, Y.; Zhao, J.N. Optimizing geometric parameters in hydrocyclones for enhanced separations: A review and perspective. Sep. Purif. Rev. 2018, 48, 30–51. [Google Scholar] [CrossRef]
- Vakamalla, T.R.; Mangadoddy, N. Numerical simulation of industrial hydrocyclones performance: Role of turbulence modelling. Sep. Purif. Technol. 2017, 176, 23–39. [Google Scholar] [CrossRef]
- Vakamalla, T.R.; Mangadoddy, N. Rheology-based CFD modeling of magnetite medium segregation in a dense medium cyclone. Powder Technol. 2015, 277, 275–286. [Google Scholar] [CrossRef]
- Vakamalla, T.R.; Mangadoddy, N. Comprehensive dense slurry CFD model for performance evaluation of industrial hydrocyclones. Ind. Eng. Chem. Res. 2021, 60, 12403–12418. [Google Scholar] [CrossRef]
- Narasimha, M.; Brennan, M.S.; Holtham, P.N.; Napier-Munn, T.J. A comprehensive CFD model of dense medium cyclone performance. Miner. Eng. 2007, 20, 414–426. [Google Scholar] [CrossRef]
- Kuang, S.B.; Qi, Z.; Yu, A.B.; Vince, A.; Barnett, G.D.; Barnett, P.J. CFD modeling and analysis of the multiphase flow and performance of dense medium cyclones. Miner. Eng. 2014, 62, 43–54. [Google Scholar] [CrossRef]
- Dunglison, M.; Napier-Munn, T.; Shi, F. The rheology of ferrosilicon dense medium suspensions. Miner. Process. Extr. Metall. Rev. 2000, 20, 183–196. [Google Scholar] [CrossRef]
- Bosman, J. The art and science of dense medium selection. J. S. Afr. Inst. Min. Metall. 2014, 114, 529–536. [Google Scholar]
- Zhao, Q.; Cui, B.; Shen, Y.; Liu, W.; Zhao, S.; Feng, Y. Understanding the characteristics and functions of axial velocity fluctuation zone in hydrocyclones part 2 particle classification. Chem. Eng. Sci. 2024, 284, 119444. [Google Scholar] [CrossRef]
- Zhao, Q.; Cui, B.; Ji, A.; Song, T.; Shen, Y. Experimental and numerical study of the effect of particle size distribution on hydrocyclone classification. Adv. Powder Technol. 2024, 35, 104398. [Google Scholar] [CrossRef]
- Chu, K.W.; Chen, J.; Yu, A.B. Applicability of a coarse-grained CFD-DEM model on dense medium cyclone. Miner. Eng. 2016, 90, 43–54. [Google Scholar] [CrossRef]
- Chen, J.; Chu, K.; Zou, R.; Yu, A.; Vince, A.; Barnett, G.; Barnett, P. Systematic study of effect of particle size distribution in a dense medium cyclone by Johnson’s SB function. Miner. Eng. 2016, 91, 16–33. [Google Scholar] [CrossRef]
- Chen, J.; Chu, K.; Zou, R.; Yu, A.B.; Vince, A.; Barnett, G.D.; Barnett, P.J. Systematic study of the effect of particle density distribution on the flow and performance of a dense medium cyclone. Powder Technol. 2017, 314, 510–523. [Google Scholar] [CrossRef]
- Aketi, V.A.K.; Reddy, V.T.; Mangadoddy, N.; Raparla, S.K.; Kumar, R. Numerical simulation of near-gravity coal particle behavior in a dense medium cyclone using a mixture model coupled with a discrete phase model. Int. J. Coal Prep. Util. 2021, 41, 554–576. [Google Scholar] [CrossRef]
- Narasimha, M.; Brennan, M.S.; Holtham, P.N.; Banerjee, P.K. Prediction of Magnetite Segregation and Coal Partitioning in Dense Medium Cyclone Using Computational Fluid Dynamics Technique. In Computational Fluid Dynamics; IntechOpen: London, UK, 2010. [Google Scholar]
- Li, Z.; Chu, K.; Zhou, Z.; Feng, Y.; Wang, A. Prediction of medium-to-coal ratio effect in a dense medium cyclone by using both traditional and coarse-grained CFD-DEM models. Particuology 2022, 68, 44–56. [Google Scholar] [CrossRef]
- Kumar, M.; Mangadoddy, N.; Banerjee, R.; Sreedhar, G.E.; Raparla, S.K.; Kumar, R. Hydrodynamic force analysis of magnetite medium inside dense medium cyclone using multiphase GPU parallelized ASM model. Miner. Eng. 2021, 170, 107061. [Google Scholar] [CrossRef]
- Olade, M. Solid mineral deposits and mining in Nigeria: A sector in transitional change. AJOSR 2019, 2, 1–16. [Google Scholar]
- Abdulfattah, F.; Bwala, M.D.; Alabi, O.O.; Sayyadi, M.G.; Hassan, S.B. Characterization and Beneficiation of Nigerian Lithium Ore: An Overview. In TMS Annual Meeting & Exhibition; Springer: Cham, Switzerland, 2023; pp. 239–246. [Google Scholar]
- Wang, S.; Wang, J.; Qiu, G.; Shen, L. Effects of ferrosilicon fineness on the multiphase flow field and separation performance of dense medium cyclones for low-grade ores. ACS Omega 2024, 9, 50544–50560. [Google Scholar] [CrossRef]
- Napier-Munn, T. The dense medium cyclone—Past, present and future. Miner. Eng. 2018, 116, 107–113. [Google Scholar] [CrossRef]
- Scott, I.A.; Napier-Munn, T. A dense medium cyclone model based on the pivot phenomenon. Trans. Inst. Min. Met. Sec. C 1992, 101, 61–76. [Google Scholar]
- Chu, K.W.; Chen, J.; Wang, B.; Yu, A.B.; Vince, A.; Barnett, G.D.; Barnett, P.J. Understand solids loading effects in a dense medium cyclone: Effect of particle size by a CFD-DEM method. Powder Technol. 2017, 320, 594–609. [Google Scholar] [CrossRef]
- YS/T 261-2011; Non-Ferrous Metal Industry Standard of the People’s Republic of China. Spodumene Concentrate. Ministry of Industry and Information Technology of the People’s Republic of China: Beijing, China. Available online: https://www.chinesestandard.net/PDF.aspx/YST261-2011 (accessed on 1 February 2025).
- Gidaspow, D.; Bezburuah, R.; Ding, J. Hydrodynamics of circulating fluidized beds: Kinetic theory approach. In Proceedings of the 7th International Conference on Fluidization, Brisbane, Australia, 3–8 May 1992; pp. 75–82. [Google Scholar]
- Schaeffer, D.G. Instability in the evolution equations describing incompressible granular flow. J. Differ. Equ. 1987, 66, 19–50. [Google Scholar] [CrossRef]
- Lun, C.; Savage, S.B.; Jeffrey, D.; Chepurniy, N. Kinetic theories for granular flow: Inelastic particles in Couette flow and slightly inelastic particles in a general flowfield. J. Fluid Mech. 1984, 140, 223–256. [Google Scholar] [CrossRef]
- Delgadillo, J.A.; Rajamani, R.K. A comparative study of three turbulence-closure models for the hydrocyclone problem. Int. J. Miner. Process. 2005, 77, 217–230. [Google Scholar] [CrossRef]
- Kuang, S.B.; Chu, K.W.; Yu, A.B.; Vince, A. Numerical study of liquid-gas-solid flow in classifying hydrocyclones: Effect of feed solids concentration. Miner. Eng. 2012, 31, 17–31. [Google Scholar] [CrossRef]
- Ghodrat, M.; Kuang, S.B.; Yu, A.B.; Vince, A.; Barnett, G.D.; Barnett, P.J. Numerical analysis of hydrocyclones with different vortex finder configurations. Miner. Eng. 2014, 63, 125–138. [Google Scholar] [CrossRef]
- Schiller, L.; Naumann, Z. A drag coefficient correlation. Zeit. Ver. Deutsch. Ing. 1933, 77, 318–320. [Google Scholar]
- Burns, A.D.; Frank, T.; Hamill, I.; Shi, J.M. The Favre averaged drag model for turbulent dispersion in Eulerian multi-phase flows. In Proceedings of the 5th International Conference on Multiphase Flow, Yokohama, Japan, 30 May 2004; pp. 1–17. [Google Scholar]
- Haider, A.; Levenspiel, O. Drag coefficient and terminal velocity of spherical and nonspherical particles. Powder Technol. 1989, 58, 63–70. [Google Scholar] [CrossRef]


| Element | Li2O | BeO | K2O | Na2O | SiO2 | Al2O3 |
|---|---|---|---|---|---|---|
| Assay/% | 1.08 | 0.01 | 2.69 | 4.67 | 72.60 | 15.91 |
| Element | MgO | TFe | MnO | P2O5 | S | |
| Assay/% | 0.59 | 0.33 | 0.11 | 0.02 | 0.01 |
| Size Fraction/mm | Yield/% | Li2O Grade/% | Li2O Distribution/% |
|---|---|---|---|
| −8 + 6 | 5.15 | 2.16 | 10.26 |
| −6 + 4 | 17.28 | 1.75 | 27.88 |
| −4 + 2 | 13.64 | 1.19 | 14.97 |
| −2 + 0.5 | 40.12 | 0.90 | 33.29 |
| −0.5 | 23.80 | 0.62 | 13.60 |
| Total | 100.00 | 1.08 | 100.00 |
| Run | Factor | Symbol and Unit | Value |
|---|---|---|---|
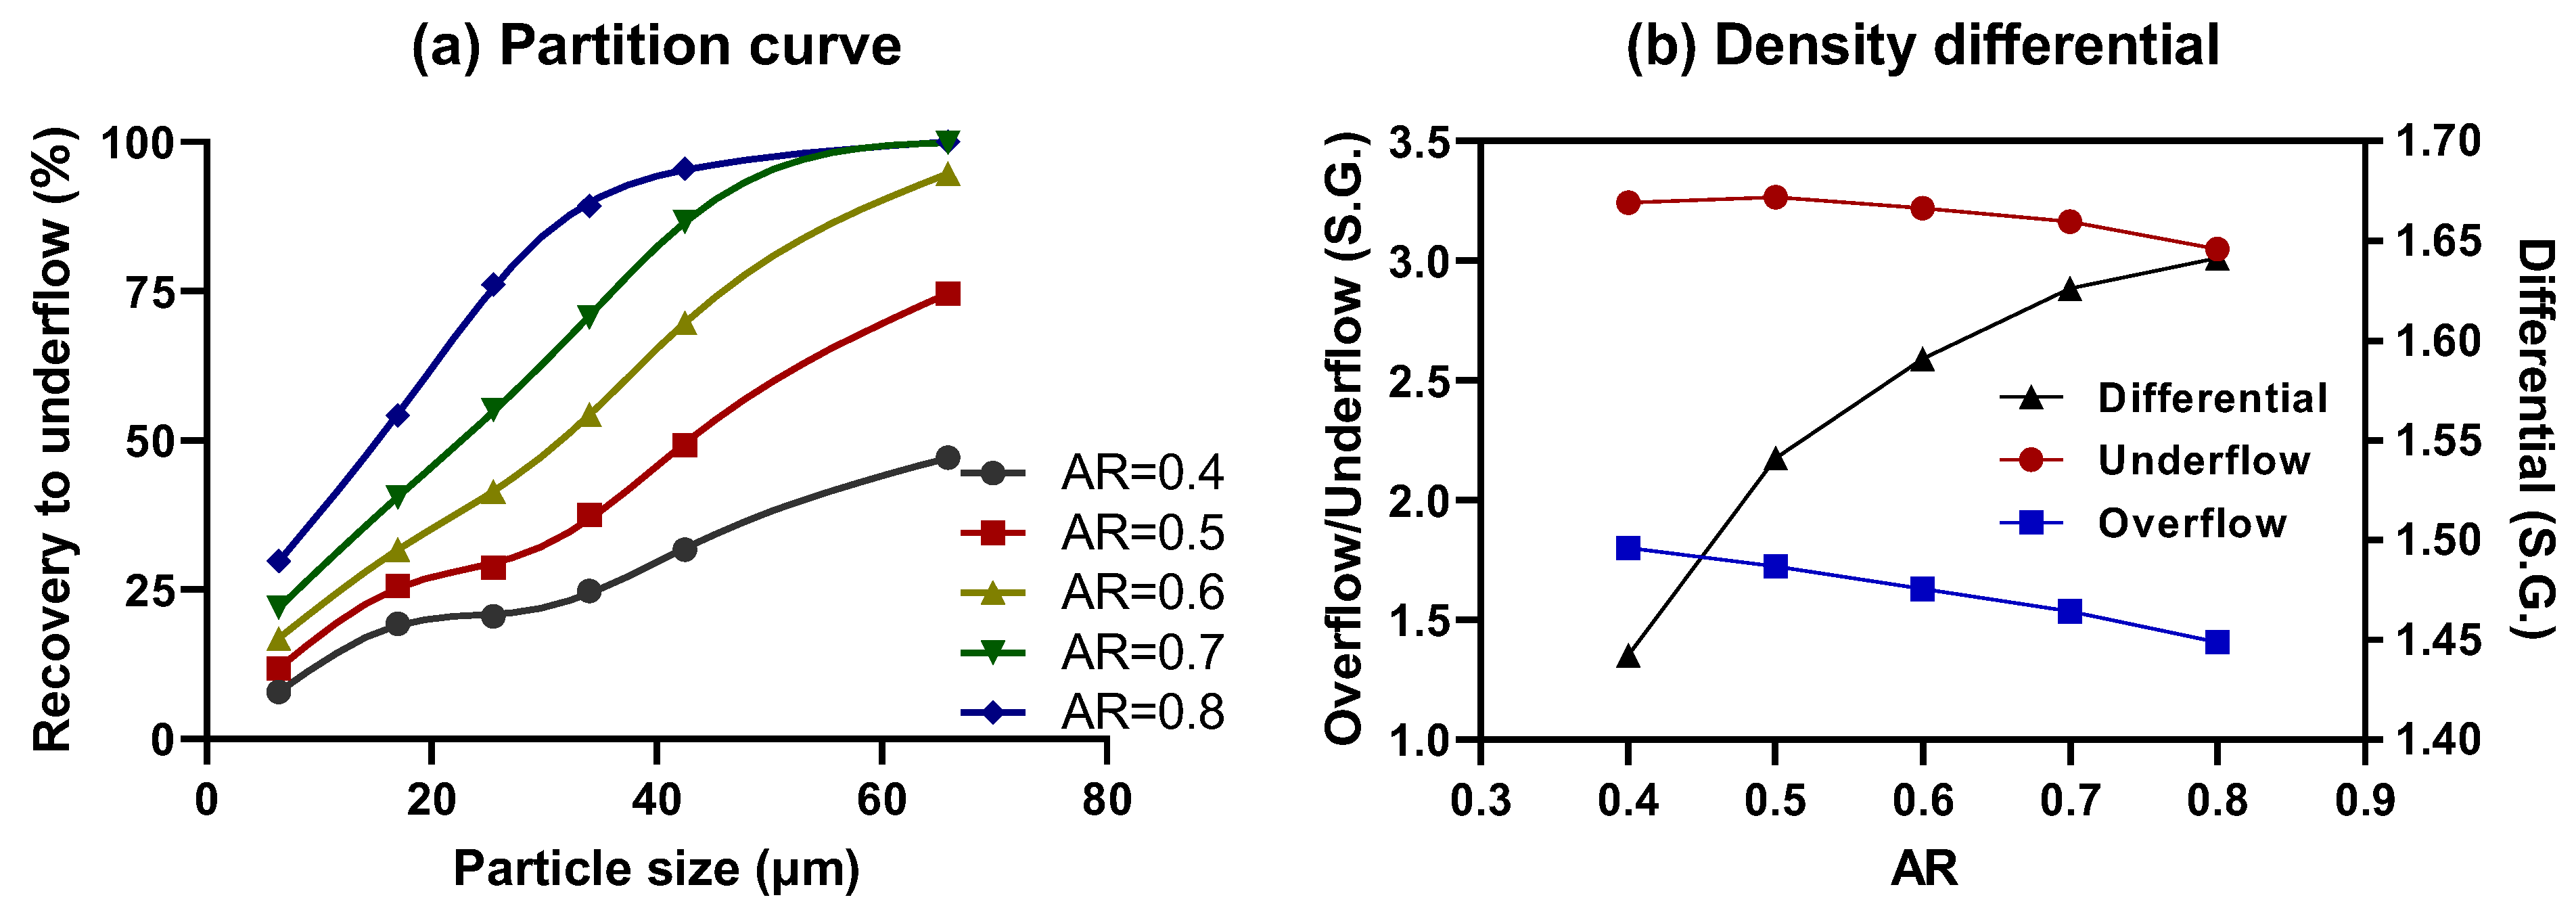
| 1–5 | Aspect ratio | AR | 0.4, 0.5, 0.6 *, 0.7, 0.8 |
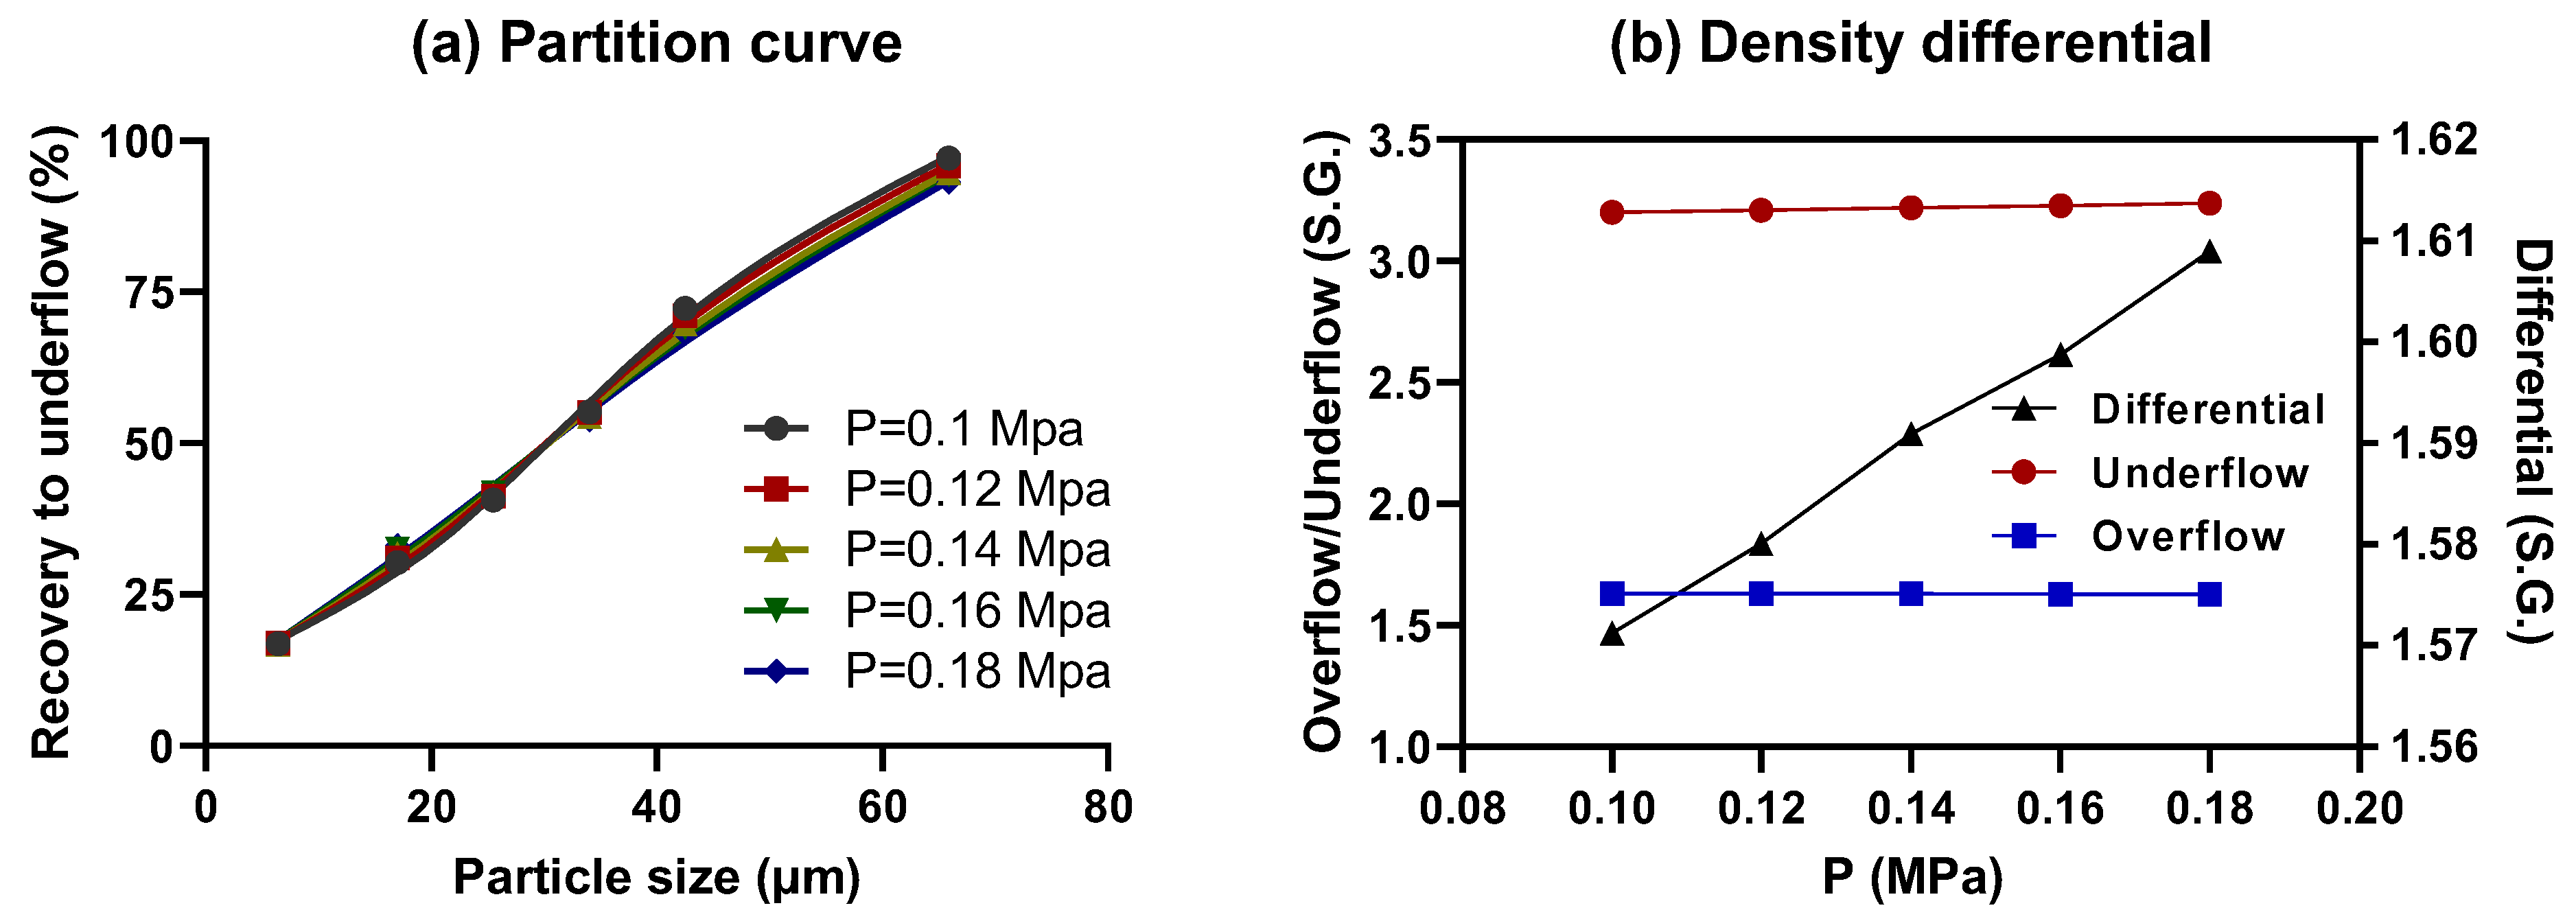
| 6–9 | Inlet pressure | P, MPa | 0.1, 0.12, 0.14 *, 0.16, 0.18 |
| 10–13 | Feed medium density | FMD, S.G. | 1.8, 1.94 *, 2.0, 2.2, 2.4, 2.6 |
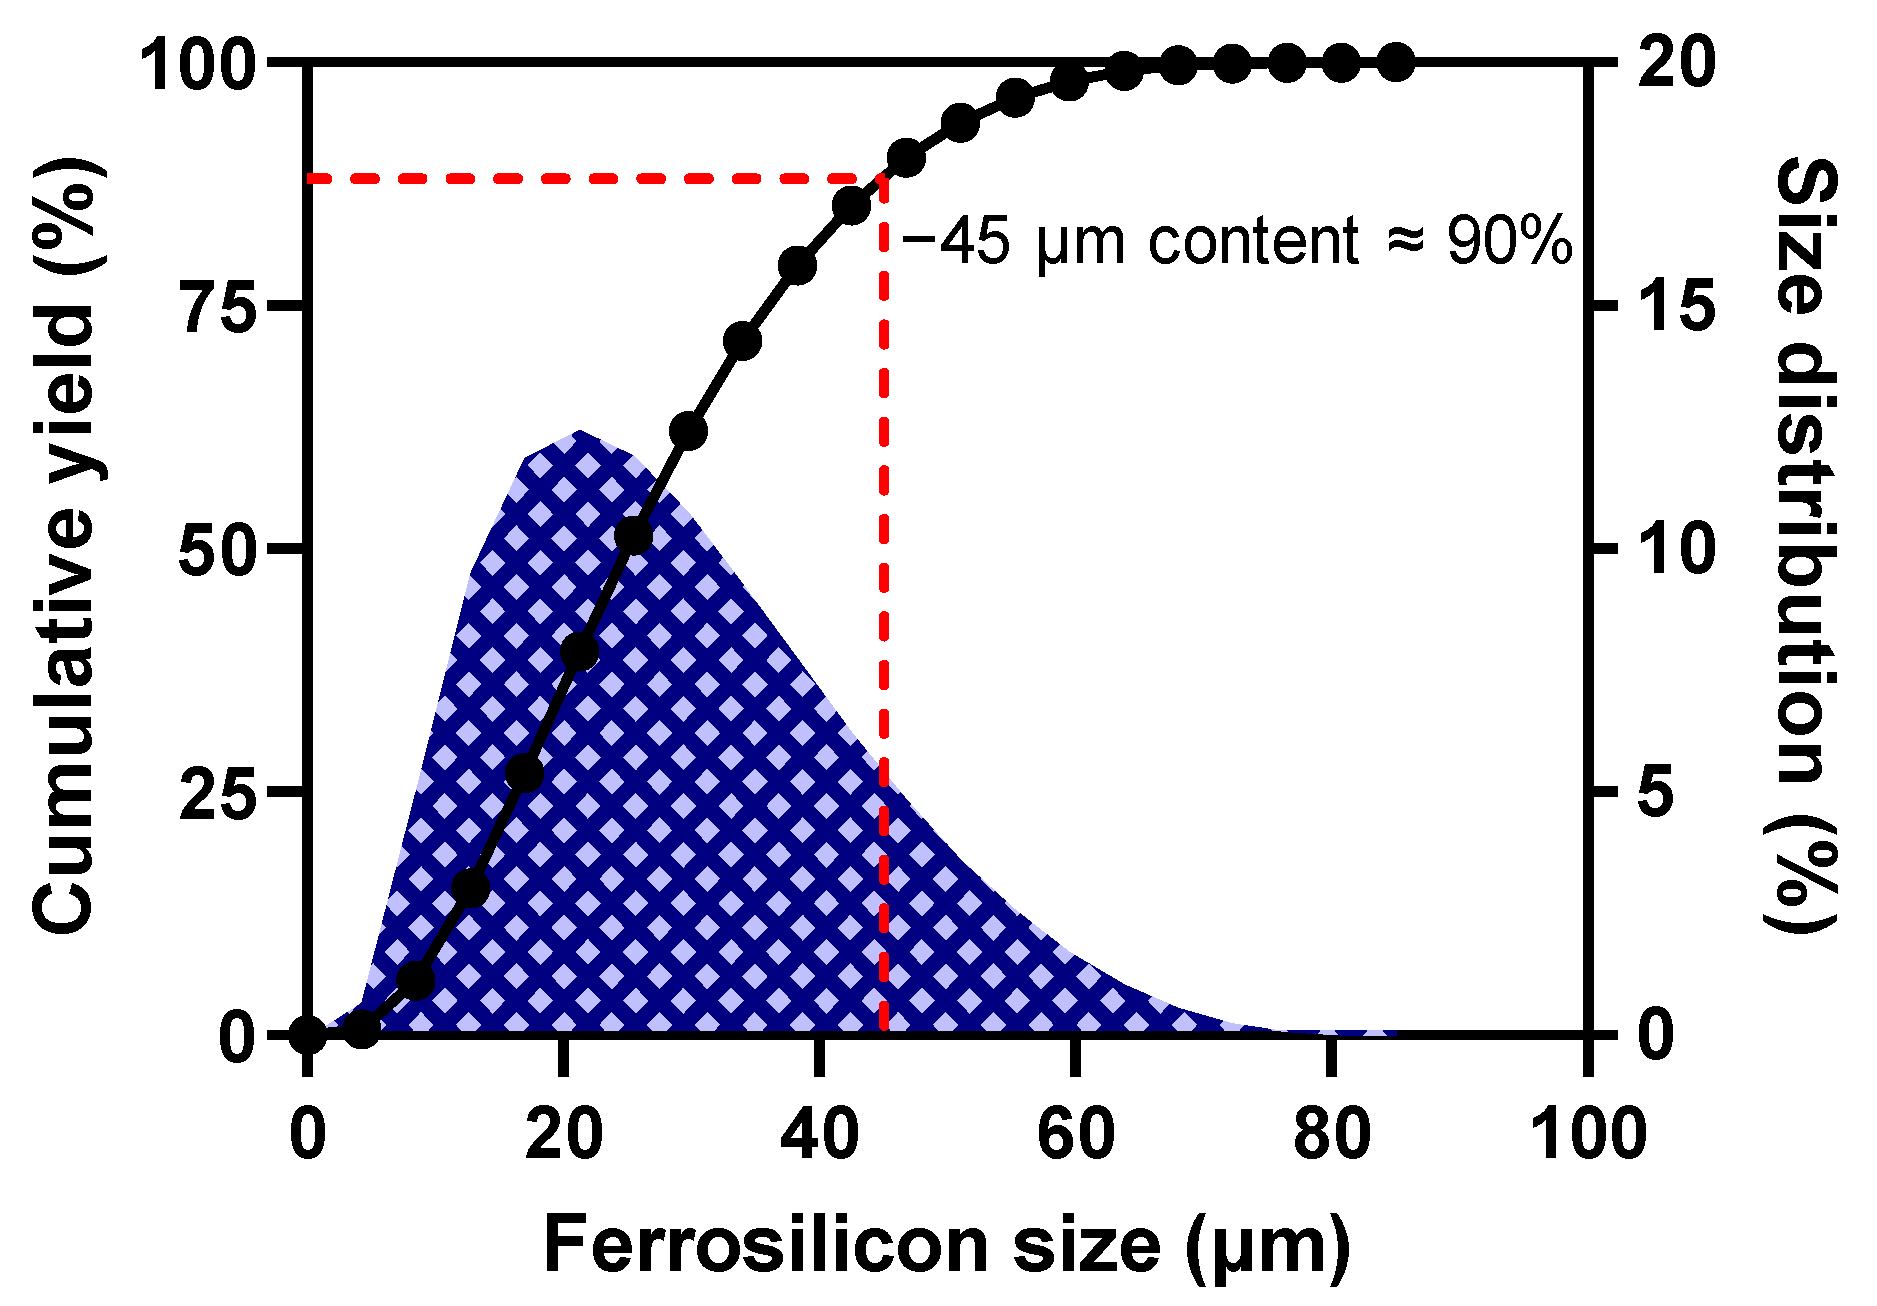
| 14–17 | Ferrosilicon fineness | FF, −45 μm content, % | 95%, 90% *, 85%, 80%, 75% |
| Size Fraction/μm | Mean Size/μm | Yield/% | Cumulative Yield/% | Volume Fraction/% |
|---|---|---|---|---|
| −12.75 | 6.40 | 15.13 | 15.13 | 2.37 |
| −21.25 + 12.75 | 17.00 | 24.32 | 39.45 | 3.81 |
| −29.75 + 21.25 | 25.50 | 22.64 | 62.09 | 3.55 |
| −38.25 + 29.75 | 34.00 | 17.01 | 79.10 | 2.67 |
| −46.75 + 38.25 | 42.50 | 11.07 | 90.17 | 1.74 |
| −85 + 46.75 | 65.90 | 9.83 | 100.00 | 1.54 |
| Products | Yield/% | Li2O Grade/% | TFe/% | Li2O Recovery/% |
|---|---|---|---|---|
| Concentrate | 17.88 | 5.68 | 0.43 | 83.60 |
| Middling | 12.66 | 0.86 | 0.31 | 8.96 |
| Tailings | 69.46 | 0.13 | 0.15 | 7.44 |
| Feed | 100.00 | 1.21 | 0.25 | 100.00 |
Disclaimer/Publisher’s Note: The statements, opinions and data contained in all publications are solely those of the individual author(s) and contributor(s) and not of MDPI and/or the editor(s). MDPI and/or the editor(s) disclaim responsibility for any injury to people or property resulting from any ideas, methods, instructions or products referred to in the content. |
© 2025 by the authors. Licensee MDPI, Basel, Switzerland. This article is an open access article distributed under the terms and conditions of the Creative Commons Attribution (CC BY) license (https://creativecommons.org/licenses/by/4.0/).
Share and Cite
Wang, S.; Wang, J.; Qiu, G.; Shen, L.; Liao, R.; Wu, L. Computational and Experimental Research on Dense Medium Separation of Low-Grade Spodumene. Minerals 2025, 15, 434. https://doi.org/10.3390/min15050434
Wang S, Wang J, Qiu G, Shen L, Liao R, Wu L. Computational and Experimental Research on Dense Medium Separation of Low-Grade Spodumene. Minerals. 2025; 15(5):434. https://doi.org/10.3390/min15050434
Chicago/Turabian StyleWang, Shuli, Jun Wang, Guanzhou Qiu, Li Shen, Rui Liao, and Lianjun Wu. 2025. "Computational and Experimental Research on Dense Medium Separation of Low-Grade Spodumene" Minerals 15, no. 5: 434. https://doi.org/10.3390/min15050434
APA StyleWang, S., Wang, J., Qiu, G., Shen, L., Liao, R., & Wu, L. (2025). Computational and Experimental Research on Dense Medium Separation of Low-Grade Spodumene. Minerals, 15(5), 434. https://doi.org/10.3390/min15050434