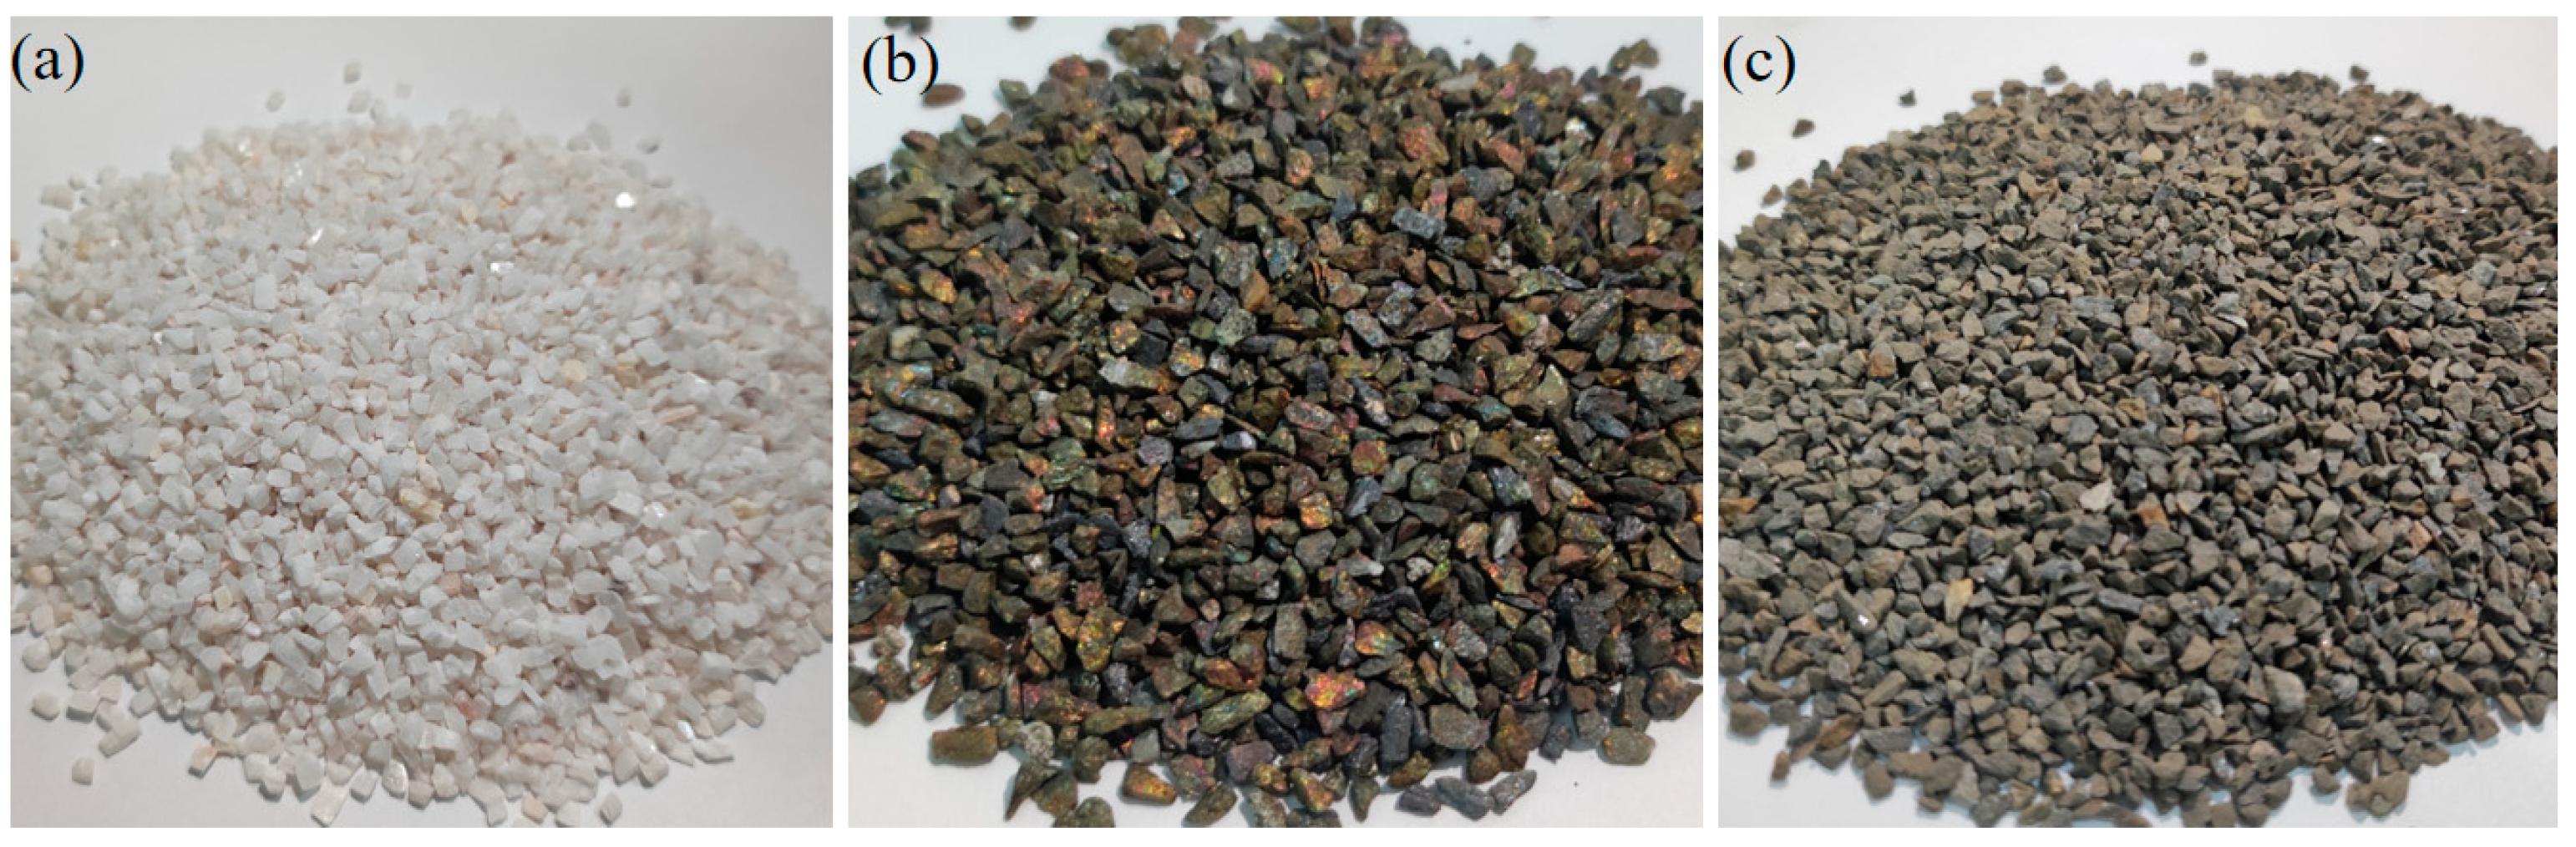
Article

Study on Impact and Abrasion Resistance of Minerals Based on JK Drop Weight Test and Grinding Test

1
College of Resources, Environment and Materials, Guangxi University, Nanning 530004, China
2
College of Chemistry and Chemical Engineering, Guangxi University, Nanning 530004, China
3
Hechi University, Hechi 546300, China
*
Author to whom correspondence should be addressed.
Minerals 2025, 15(4), 407; https://doi.org/10.3390/min15040407
Submission received: 19 March 2025 / Revised: 8 April 2025 / Accepted: 8 April 2025 / Published: 12 April 2025
(This article belongs to the Section Mineral Processing and Extractive Metallurgy)

Abstract

:
Most grinding operations are the process of reducing the particle size of ore materials under the combined action of impact and abrasion. The action mechanism of impact damage and abrasion damage of materials in the grinding process is different, and the ability of each constituent mineral of ore to resist impact damage and abrasion damage is different. In order to study the independent action mechanism and interaction law of impact and abrasion in grinding, mineral ores calcite, chalcopyrite, and sphalerite are studied in this paper. The JK drop weight test method and batch grinding test method are used to study the changes and laws of various indexes of three mineral ores under a single impact condition, a single abrasion condition, and the coexistence of the two effects. The results show that the impact crushing parameters of the three mineral ores and the corresponding hardness grade of the ores are related to the particle size. The smaller the particle size of the material, the smaller the value of the impact crushing capacity parameter A × b. The order of impact crushing resistance of the three mineral ores is consistent with the characterization results of ore Mohs hardness. Under the same particle size condition, the order of impact crushing parameter A × b of the three mineral ores is calcite > sphalerite > chalcopyrite. The first-order linear model can better fit the grinding kinetics in the cascading state, and its kinetic parameters are related to ore hardness and feed particle size. The t10 is more suitable to characterize the grinding effect in the dropping state than in the cascading state.

1. Introduction

Grinding operations are widely used in various industries such as mining, chemical, cement, construction, and thermal power [1,2,3]. More than 5% of the power generation is used in the grinding field every year, and millions of tons of steel are lost [4,5,6]. Capital investment and operating costs associated with grinding circuits constitute approximately 60% of the total costs incurred by ore dressing plants [7,8]. Traditional grinding operations have high energy consumption and large consumption of grinding medium [9,10,11], and the particle size distribution of the grinding products has a very important impact on subsequent beneficiation processes (such as flotation, magnetic separation, and leaching) [12,13,14,15]. Therefore, the grinding operation plays a very important role in the concentrator, which directly determines the production capacity and economic benefits of the concentrator.
In China, with the continuous development and utilization of mineral resources, the ore grade is gradually depleted and the resource quality is gradually reduced. Those mineral resources with high grade, easy mining, easy grinding, and easy beneficiation have been gradually exhausted and replaced by low-grade and complex mineral raw materials [16,17]. These low-quality ores with complex composition have a large number of constituent minerals and great differences in physical and chemical properties of constituent minerals, which seriously affect the subsequent separation efficiency of grinding products and the economic and technical indicators of the concentrator [18,19,20,21]. Therefore, optimizing the grinding operation, studying grinding theory, improving the grinding process efficiency, and reducing the grinding cost are of great significance to reduce production costs and improve resource recovery and utilization rates [22,23,24].
For metal mineral resources, common ores are usually composed of two or more minerals, and their mineral composition and ore properties are relatively complex [25,26]. There are great differences in the physical, chemical, and mechanical properties of different minerals in the same ore, and the subsequent separation operation also has different requirements for the separation particle size of different constituent minerals. In the practice of grinding production, under-grinding and over-grinding often exist at the same time. It is difficult to regulate the grinding process, and the significance of grinding optimization is very prominent [27,28]. In addition, the difference in crushing resistance of different minerals in the ores is the comprehensive expression of the difference in impact resistance and abrasion resistance [29,30,31,32]. The macro result is the selective grinding of minerals. Although researchers have long found the phenomenon of selective grinding and carried out corresponding theoretical research [33,34,35,36], at present, no one has studied the phenomenon of selective grinding from the perspective of mineral impact failure and abrasion failure. Compared with common ore, the structure and physicochemical properties of mineral ores are stable. Through the independent study of the grinding behavior characteristics of ore composition minerals, it can be extended to the study of the ore grinding mechanism. Therefore, for complex polymetallic ores, if the analysis of the grinding process can be extended from the whole ore to the specific constituent minerals, and the grinding process can be analyzed through the separation of impact and abrasion, it will certainly promote the deepening of the grinding analysis theory and the optimization control of grinding. However, there have been no previous studies analyzing impact and abrasion separately in grinding. Therefore, through the study of the response of the minerals to breakage when subjected to different breakage mechanisms, this paper mainly studies the crushing behavior characteristics of three mineral ores under the conditions of single impact, single abrasion, and the coexistence of the two effects so as to explore and analyze the grinding mechanism of ore constituent minerals and provide a corresponding theoretical basis for the follow-up study on grinding analysis and the optimal regulation mechanism of polymetallic complex ores.

2. Materials and Methods

2.1. Materials

The materials used in the JK drop weight test are calcite, chalcopyrite, and sphalerite. Photos of the samples are shown in Figure 1. According to the standards and design requirements of the JK drop weight test, the three types of minerals are crushed by a jaw crusher and screened using a vibrating screen to select the particle size required for the test (−63.0 + 550 mm, −45.0 + 37.5 mm, −31.5 + 26.5 mm, −22.4 + 19.0 mm, −15.4 + 13.2 mm, −11.2 + 9.5 mm, −8.0 + 6.7 mm, −5.6 + 4.75 mm). Then, irregular particles such as fine stripes and cones are removed from the obtained material at each particle size level, and the surface of the remaining regular particles is washed and naturally dried for use in the test.
The materials used in the batch grinding test are still natural mineral ores, i.e., calcite, chalcopyrite, and sphalerite. According to the test design requirements, the three raw ores are crushed to −3.35 mm by the jaw crusher and disc crusher and then divided into three particle sizes of −3.35 + 2.36 mm, −2.36 + 1.70 mm, and −1.70 + 1.18 mm by a vibrating screen. The materials of the three particle sizes are fully mixed and a splitter was used to make 40 sub-samples of representative mineral ore samples weighing 200 g for testing.

2.2. Methods

This study investigated the breakage characteristics of minerals under the effects of impact mechanism, abrasion mechanism, and the coexistence of impact and abrasion mechanisms through three types of experiments discussed in Section 2.2.1, Section 2.2.2 and Section 2.2.3.

2.2.1. Drop Weight Tests to Study Impact Behavior of Mineral Ores

The JK drop weight test is a method proposed by JKMRC to measure the impact crushing characteristics of materials [37]. By changing the mass and drop height of the drop hammer, different impact crushing kinetic energy can be obtained to impact crush the material particles. Then, through the particle size analysis of the particle crushing products, the relationship equation between the characteristic particle size of each impact crushing test product (usually expressed by t10, that is, the percentage of particles whose size is less than 1/10 of the feed particle size in the crushing products) and the specific input energy (Ecs) is established, as shown in Equation (1):
t 10 = A 1 e b × E c s
Based on the JK drop weight test data and Equation (1), the impact crushing parameters A and b can be obtained by fitting, and parameter A × b is used as an index of the impact crushing resistance of ore. The relationship between the JK drop weight test parameters and ore hardness grade is shown in Table 1 [37].
The standard JK drop weight test adopted the single-particle impact crushing test, and the particle size was limited to the range of −63.0 + 13.2 mm. The test was divided into five particle sizes (−63.0 + 50.5 mm, −45.0 + 37.5 mm, −31.5 + 26.5 mm, −22.4 + 19.0 mm, −15.4 + 13.2 mm). This means that the impact crushing characteristic parameters of ore measured by the standard JK drop weight test are only applicable to the impact crushing research of coarse-grained materials. However, according to the ore crushing principle, the particle size will affect the crushing results so the test results can not be directly used in the study of the crushing characteristics of fine-grained materials. In order to more comprehensively study the impact resistance characteristics of materials, the particle size of the standard JK drop weight test samples was expanded to the fine-grained level in this test. The JK drop weight test was carried out with two particle sizes of −63.0 + 13.2 mm and −13.2 + 4.75 mm, respectively. For the particle size of −13.2 + 4.75 mm, due to the small mass of the single particle, the test will cause large errors. Therefore, the multi-particle impact crushing test was adopted. In order to meet the minimum height limit of the drop weight, it was weighed and calculated that the minimum number of particles required for each of the three particle sizes of three minerals to pass the multi-particle impact crushing test is 2 (−11.2 + 9.5mm), 4 (−8.0 + 6.7mm), and 6 (−5.6 + 4.75 mm), respectively.
He Mao et al. [38], through the comparative study of the test results of single-particle impact crushing and multi-particle impact crushing, verified the rationality and feasibility of the tests. The specific experimental design is shown in Table 2. A photograph of the JK drop weight equipment is shown in Figure 2.

2.2.2. Batch Grinding Tests to Study Abrasion Behavior of Mineral Ores

The model of the test equipment is Φ240 × 90 ball mill (Figure 3). Based on the grinding principle proposed by Chen Bingchen [8], for the test mill, the mill speed when the innermost medium is in the descending motion is n = 12.43 r/min. When the rotating speed n of the mill is less than 12.43 r/min, the medium in the mill is in the cascading state. When 12.43 r/min < n < 91.5 r/min, the medium in the mill is in the dropping state. When n = 91.5 r/min, the outermost medium in the mill is in a centrifugal state, that is, the critical speed of the mill.
In this test, the frequency regulator was used to adjust the rotational rate of the mill to 13% of the critical speed so that the grinding medium was in the cascading state. Therefore, in the whole grinding process, the ore is only affected by abrasion. When the grinding concentration was 70% and the filling rate was 35%, we took five bags of prepared grinding materials for each particle size and carried out batch grinding tests with grinding times of 1 min, 2 min, 4 min, 6 min, and 8 min. The specific testing conditions are shown in Table 3.

2.2.3. Batch Grinding Tests to Study the Coexistence of Impact and Abrasion Behavior of Mineral Ores

The grinding operation is a process that converts electric energy into the energy of the medium in the mill and acts on the material particles to make the material particle size smaller. When calculating the energy of the medium to the material particles at the cascading point, the average energy generated by the medium at the cascading point can be calculated through the centroid layer of the medium. The motion trajectory of the medium is shown in Figure 4, and the points of Ac and Bc in Figure 3 stand for the motion trajectory of the centroid layer of the medium in the ball mill.
When the medium reaches the falling point at the speed v, the energy acting on the particles can be divided into two parts: One part is along the tangential direction of the falling point, causing the material to be rubbed. The other part is along the normal direction of the falling point, causing the material to be impacted. By calculating the normal partial velocity v1 and tangential partial velocity v2, we can know the proportion of impact energy and abrasion energy of the material particles. Based on the above analysis, the kinetic energy of a unit medium (i.e., a single medium with mass m) at the falling point, i.e., the throwing crushing energy E, can be deduced and calculated, and the equation is outlined below:
E = 1 2 m g R 1 2 + R 2 2 2 ψ 2 1 + k 2 2 9 4 ψ 4 1 + k 2
where ψ is the rotational rate; R1 is the radius of the outermost medium, and its size is the difference between the mill radius and the medium radius; and R2 is the radius of the innermost medium, k = R2/R1.
The mill rotates for one cycle, and the average rotation cycle of the grinding medium is 1 k 2 φ . It can be deduced that when the grinding time is t, the theoretical calculation equation of crushing energy per unit mass of material in the mill is as follows in Equation (3).
E p l = 1 2 M 1 M 2 1 k 2 φ v t g R 1 2 + R 2 2 2 ψ 2 1 + k 2 2 9 4 ψ 4 1 + k 2
where v is the speed of the mill; t is the grinding time; g is the gravitational acceleration; ψ is the rotational rate; φ is the filling rate; M1 is the mass of the iron ball; and M2 is the mass of the material.
Under the conditions that the grinding medium d = 25 mm, the grinding concentration is 70%, the grinding time is 4 min, and the medium filling rate is 35%, the grinding test was carried out by adjusting the rotational rate of the mill to 13%, 28%, 43%, 58%, and 73% through the frequency converter. The specific testing conditions are shown in Table 4.

2.2.4. Calculation Model of Grinding Dynamics

The establishment of the grinding kinetic model draws lessons from the principle of kinetic modeling in the chemical reaction process [39], as shown below.
d W d t = k W
Integrating Equation (4) yields the following equation.
W = W 0 exp k t
The first-order grinding dynamics calculation model is described in Equation (4), although in actual production, the determination of grinding qualified products is usually based on the fine-grained or cumulative yield under the screen [40,41]. Therefore, the grinding dynamics calculation model can be transformed into a fine-grained grinding dynamics model, as shown below.
ln 1 X 1 X 0 = k t
where X = 1 − W, X0 = 1 − W0. Equation (6) can be transformed into a linear relationship as follows:
y = k t + b

2.2.5. The Technology Roadmap

The common constituent minerals of metallic ore (chalcopyrite and sphalerite) and the gangue mineral (calcite) were selected as the research subjects. An investigation was conducted to analyze the mechanisms and the interrelationship between impact and abrasion action during the grinding process of the minerals. This establishes a theoretical foundation for subsequent studies on grinding tests involving mineral mixtures and complex ores. The technology roadmap is shown in Figure 5.

3. Results and Discussion

3.1. Impact Resistance of Mineral Ores in JK Drop Weight Test

The impact crushing products of three mineral ores under the conditions of different particle sizes and different specific Ecs were screened and analyzed, and the under-screen accumulation curve of impact crushing products was drawn with semi-logarithmic coordinates. The values of JK drop weight impact crushing parameters A and b were obtained by Origin Software fitting.

3.1.1. JK Drop Weight Test Results of Calcite

The particle size characteristic curve of the impact crushing products of calcite samples with different particle sizes under the conditions of different specific Ecs is shown in Figure 6.
As can be seen from Figure 7, compared with the +13.2 mm particle size, the fitting curve of −13.2 mm particle size Ecs-t10 deviates significantly downward. It can be seen from Table 1 and Table 5 that the impact crushing resistance of calcite with the −63.0 + 13.2mm particle size belongs to the “extremely soft” grade, the impact crushing resistance of −13.2 + 4.75 mm particle size belongs to the “soft” grade, and the impact crushing resistance of −63.0 + 4.75 mm overall material belongs to the “extremely soft” grade. This shows that the particle size has a great impact on the impact crushing capacity of calcite. Therefore, when comparing the hardness and impact crushing capacity resistance of mineral ores by the JK drop weight test method, the particle size of the material must be limited to the same range.

3.1.2. JK Drop Weight Test Results of Chalcopyrite

The particle size characteristic curve of impact crushing products of chalcopyrite samples with different particle sizes under the conditions of different Ecs is shown in Figure 8.
It can be seen from Figure 8 that for chalcopyrite, the particle size distribution characteristic curve of the −63.0 + 50.5 mm particle size fraction is very similar under the conditions of an Ecs of 0.40 kWh/t and 0.25 kWh/t. Especially when the particle size of the product is less than 3.35 mm, the two curves almost coincide. This shows that under the Ecs of 0.40 kWh/t and 0.25 kWh/t, the fine particle size of crushed products is basically the same. It can also be seen from Figure 8 that the product particle size distribution curve of each particle size under the condition of 0.25 kWh/t deviates far from the particle size distribution curve at 1.00 kWh/t and 2.50 kWh/t, indicating that the impact crushing effect of chalcopyrite varies greatly under different values of Ecs.
According to the above test results, using Origin Software for fitting regression analysis, the values of impact crushing parameters A and b of crushing products in the +13.2 mm particle size range, the −13.2 mm particle size range, and full particle size range are obtained, respectively. The fitting curve is shown in Figure 9 and the fitting results are shown in Table 6.
It can be seen from Figure 9 that the fitting curve of the +13.2 mm particle size is shifted upward compared with the −13.2 mm particle size. According to Table 6 and Table 1, all three size classes for chalcopyrite belong to the ”soft” grade. It shows that the influence of particle size on the impact crushing resistance ability of chalcopyrite is smaller than that of calcite.

3.1.3. JK Drop Weight Test Results of Sphalerite

The particle size characteristic curve of impact crushing products of sphalerite samples with different particle sizes under the conditions of different Ecs is shown in Figure 10.
It can be seen from Figure 10 that the particle size distribution curve of sphalerite crushing products is similar to that of calcite and chalcopyrite. The trend of the particle size distribution characteristic curves of the comminuted products is basically the same under the conditions of the three Ecs values for each particle size fraction. This shows that the particle size distribution of crushing products is closely related to the initial particle size and Ecs of the ore.
According to the above 24 groups of sphalerite test results, combined with the corresponding Ecs, the fitting regression analysis is carried out by using Origin Software to obtain the values of impact crushing parameters A and b of sphalerite in the particle size range of +13.2 mm, −13.2 mm and the whole particle size range. The fitting curve is shown in Figure 11 and the fitting results are shown in Table 7.
It can be seen from Figure 11 that the −13.2 mm particle size fitting curve is located below the +13.2 mm particle size fitting curve. It can be seen from Table 1 and Table 7 that all three size classes for sphalerite belong to the ”soft” grade, indicating that the impact of particle size on the impact crushing resistance of sphalerite is similar to that of chalcopyrite, both smaller than that of calcite.

3.1.4. Analysis of JK Drop Weight Test Results

By summarizing the impact crushing parameters obtained from the JK drop weight test of three mineral ores with different particle sizes, we can further obtain the relationship between the characterization value of the impact crushing resistance ability of three mineral ores and particle size, as shown in Figure 12.
It can be seen from Figure 12 that the A value of the impact crushing resistance of mineral ores obtained by using the JK drop weight test results is related to the ore category and ore particle size. First of all, as long as the particle size range is the same, the order of the A × b value of the three mineral ores is the same. Moreover, this phenomenon is very consistent with the Mohs hardness results of the three mineral ores. The Mohs hardness value of calcite is 3, that of sphalerite is 3~4, and that of chalcopyrite is 3~4. Therefore, the A × b value obtained from the JK drop weight test results can characterize the hardness of mineral ores and is more accurate. Secondly, comparing the A × b values of −63.0 + 13.2 mm and −13.2 + 4.75 mm, it can be seen that the A × b values of the three mineral ores decrease significantly with the decrease in ore particle size, indicating that the crushing resistance of the ores is increasing. Among them, the A × b value of calcite decreases in the largest proportion, indicating that the smaller the hardness of the mineral ore, the greater the impact of the particle size on the crushing ability.
In addition, in the JK drop weight test method, because the characteristic particle size value (t10) of impact crushing test products can represent the crushing degree of mineral ores and the particle size distribution of products, the t10 value can be used to reflect the impact crushing resistance of mineral ores to a certain extent. The greater the t10 value, the more significant the crushing effect. When the Ecs is 2.50 kwh/t, 1.00 kwh/t, and 0.25 kwh/t, the change in t10 in the impact crushing products of different particle sizes of the three mineral ores is shown in Figure 13.
It can be seen from Figure 13 that under different Ecs conditions, the value of t10 in the crushing products of the three mineral ores as a whole decreases with the decrease in the initial ore particle size. This shows that with the decrease in ore particle size, its impact crushing resistance increases. Among them, the decrease in the t10 value of calcite is the most obvious, indicating that the impact crushing resistance of calcite is most affected by particle size. This result is consistent with the hardness law of ores reflected by the A × b value of the impact crushing parameter obtained by the JK drop weight test.

3.2. Test Results and Analysis of Abrasion Resistance of Mineral Ores

By changing the factors of ore type, ore particle size, and the grinding time, the grinding test under the condition of a cascading state was carried out to study the particle size characteristics of grinding products and the characteristics of abrasion behavior. The formula for calculating the breakage rate of materials is shown in Equation (8).
Breakage rate = Mass   of   particles   of   specified   particle   sizes   of   sample   before   grinding Mass   of   particles   of   specified   particle   sizes   of   sample   after   grinding Mass   of   particles   of   specified   particle   sizes   of   sample   before   grinding

3.2.1. Effect of Grinding Time on Breakage Rate

The variation in breakage rate of the three mineral ores with grinding time is shown in Figure 14.
As can be seen from Figure 14, with the increase in grinding time, the breakage rates of the three mineral ores are increasing, and the growth rate of the breakage rate within 4~6 min is slower than that within 1~4 min. At the same time, it can also be seen from Figure 14 that for the three mineral ores, the breakage rate of fine-grained mineral ores is the highest, and the growth rate is more obvious. However, the breakage rate and growth rate of coarse-grained mineral ores are in the middle of the three particle sizes.
The reason for the above phenomenon may be that under the same quality, with the decrease in ore particle size, the specific surface area of the ores increases and the surface energy of the ore particles is also greater. When the particle size of the grinding ores is −2.36 + 1.70 mm, compared with −3.35 + 2.36 mm, the abrasion damage of the ore particles cannot overcome the surface energy of the particles so the breakage rate is the lowest. When the particle size of the grinding ore is −1.70 + 1.18 mm, the specific surface area of the ore increases obviously, the effective area of contact between the particle and the cylinder wall of the mill and the grinding medium is large, and the abrasion damage of the particle can overcome the surface energy of the particle so its breakage rate is the highest. Therefore, the particle breakage rate and its growth rate based on the feed particle size are not completely positively correlated with the feed particle size.
The variation in breakage rate of the three mineral ores under different particle sizes with grinding time is shown in Figure 15.
It can be seen from Figure 15 that the breakage rate of the three mineral ores under different particle sizes changes with the grinding time. Under any grinding time, the breakage rate of calcite is greater than that of chalcopyrite and sphalerite. The relationship between the three is as follows: calcite > sphalerite > chalcopyrite. It can also be seen from Figure 15 that the change in calcite breakage rate with grinding time increases more obviously, and the growth rate of sphalerite is relatively the slowest. The growth relationship of the three is as follows: calcite > chalcopyrite > sphalerite.
It can be seen from Figure 14 and Figure 15 that the particle size and hardness of the ores have a great impact on the grinding effect. The cross influence of the two makes the grinding mechanism more complex.

3.2.2. Effect of Grinding Time on Particle Size Characteristics of Products

The influence of grinding time on the particle size distribution characteristics of products was investigated, and the t10 value of grinding products was analyzed as the characteristic particle size. According to the test results, the t10 value results of the grinding products of the three mineral ores are shown in Figure 16.
As can be seen from Figure 16, with the increase in grinding time, the t10 values of the grinding products of the three mineral ores are increasing, and there is a positive correlation with the grinding time. At the same time, it can be seen that the t10 value of grinding products of fine-grained mineral ores increases more obviously with the increase in grinding time and the slope of the curve increases more significantly than that of coarse-grained mineral ores. This result is consistent with the change trend of the breakage rate in Section 3.2.1.
The variation in the t10 value of the grinding products of three mineral ores under different particle sizes with grinding time is shown in Figure 17.
It can be seen from Figure 17 that under the conditions of different grinding particle sizes, the t10 values of the grinding products of the three mineral ores are positively correlated with the grinding time. The distance between the t10 curves of the three mineral ores is relatively close, and there is no obvious difference with the change in grinding time. At the same time, it can be seen that only under the abrasion action, the difference in the particle size thinning speed of the three mineral products is not obvious, indicating that the abrasion action has no significant effect on the product thinning speed. In addition, comparing Figure 15 and Figure 17, it can be seen that when the grinding capacity and speed are characterized by breakage rate, under the conditions of the three grinding particle sizes, calcite has the best grinding effect, sphalerite has the second best, and chalcopyrite has the worst, which is consistent with the hardness order of the three mineral ores. However, when the t10 value is used to characterize the grinding ability and speed, the conclusion is different and there is no obvious consistency. This shows that the selection of the grinding effect characterization index of grinding is very worthy of attention and research.

3.2.3. First-Order Grinding Dynamic Model

According to Equations (6) and (7), the first-order grinding dynamics fitting is carried out for the grinding test results under different conditions. The fitting results are shown in Table 8 and Figure 18.
It can be seen from Table 8 and Figure 18 that the particle size distribution characteristics of the products of the three mineral ores under the action of separate grinding can be well-fitted by using the first-order grinding kinetic model with the change in grinding time. It shows that the dynamic model of material ores in the mill can be deduced and calculated by Equations (6) and (7) when the mill is in the cascading state. It can also be seen from Figure 18 that the slope of the fitting line increases with the decrease in the grinding particle size of the three mineral ores. It shows that the total surface area of fine particles is larger, and the effective area in contact with the cylinder wall and medium is larger in the grinding process so its disappearance speed is faster. This is consistent with the previous analysis in Section 3.2.1 and Section 3.2.2.
Figure 19 depicts the comparison of the grinding kinetics fitting results of the particle size distribution characteristics of grinding products of the three mineral ores under the condition of the same feed particle size fraction.
It can be seen from Figure 19 that, except for the −3.35 + 2.36 mm particle size fraction of sphalerite, the fitting straight-line slope of calcite is greater than that of chalcopyrite and sphalerite under other particle sizes. The slope difference in the fitting curve between chalcopyrite and sphalerite is small. In the same case, the grinding effect of calcite is more obvious, which is the same as the previous analysis results.

3.3. Experimental Results and Analysis of Grinding Characteristics of Mineral Ores with the Coexistence of Impact and Abrasion

By changing the mineral ore type, mill speed, and other factors, the grinding test under the dropping state is carried out. The test results are as follows.

3.3.1. Results and Analysis of Calcite Grinding Test

The test results of the calcite grinding time of 4 min under different rotational rates are shown in Figure 20 and Figure 21. In Figure 20, the throwing-specific crushing energy Epl of the grinding medium is calculated according to Equation (3). The value of Ecj1, Ecj2, and Ecj3 in Figure 21 is the impact-specific crushing energy calculated by deducting the t10 value of the grinding product from the t10 value of the thrown grinding product, and based on the values of the impact crushing parameters A and b, three particle sizes of calcite (−63.0 + 13.2 mm, −13.2 + 4.75 mm, and −63.0 + 4.75 mm) are obtained from Section 3.1, and finally from Equation (1). In the following analysis of grinding test results of chalcopyrite and sphalerite, the calculation methods of these parameters are the same.
It can be seen from Figure 20 and Figure 21 that with the increase in mill rotational rate, the throwing-specific crushing energy, impact-specific crushing energy, and breakage rate of the unit mass calcite show a positive correlation and increasing relationship. This is because with the increase in mill speed, the grinding medium has higher energy, and the calcite particles are subject to greater crushing energy so they are destroyed more thoroughly, and the breakage rate increases. When the rotating speed of the mill reaches 58%, the breakage rate of calcite decreases significantly, indicating that the crushing degree of calcite tends to be stable at this time so the breakage rate decreases. Comparing the impact-specific crushing energy Ecj1, Ecj2, and Ecj3 in Figure 21, it can be seen that the impact-specific crushing energy obtained by selecting the impact crushing parameters of different particle sizes is quite different. The proportion of the impact-specific crushing energy Ecj1, Ecj2, and Ecj of calcite in the throwing-specific crushing energy Epl during the throwing grinding process is 10.1%~15.11%, 26.0%~41.67%, and 13.3%~19.48%, respectively. The impact-specific crushing energy Ecj1, Ecj2 of the coarse and fine feeding particle sizes are very different, and the impact-specific crushing energy Ecj3 of the whole particle size range is closer to the coarse particle size. This shows that the impact-specific crushing energy calculated from the fine-grained impact crushing parameters accounts for a larger proportion of the throwing-specific crushing energy. Therefore, for calcite, the influence of particle size can not be simply ignored.

3.3.2. Results and Analysis of Chalcopyrite Grinding Test

The test results of chalcopyrite grinding time of 4 min under different rotational rates are shown in Figure 22 and Figure 23.
It can be seen from Figure 22 and Figure 23 that, like calcite, with the increase in the mill rotational rate, the throwing-specific crushing energy, impact-specific crushing energy, and breakage rate of chalcopyrite per unit mass in the mill also show a positive correlation and increasing relationship. However, with the increasing rotational rate, the breakage rate of chalcopyrite does not decrease significantly like calcite. It shows that the hardness of chalcopyrite is higher than that of calcite, and chalcopyrite is more difficult to break, which is consistent with the conclusion of the JK drop weight test in Section 3.1. Comparing Ecj1, Ecj2, and Ecj3 in Figure 23, it can be seen that the proportion of impact-specific crushing energy Ecj1, Ecj2, and Ecj3 of chalcopyrite particles in throwing-specific crushing energy Epl during the throwing grinding process is 8.12%~18.14%, 12.12%~26.87%, and 9.36%~20.76%, respectively. This also shows that for chalcopyrite, the proportion of impact-specific crushing energy calculated by fine-grained impact crushing parameters in throwing-specific crushing energy is larger but this difference is not obvious compared with calcite. It shows that there is a particle size effect when calculating the impact-specific crushing energy of mineral ores, and the greater the hardness of the ore, the smaller the particle size effect.

3.3.3. Results and Analysis of Sphalerite Grinding Test

The test results of the sphalerite grinding time of 4 min under different rotational rates are shown in Figure 24 and Figure 25.
It can be seen from Figure 24 and Figure 25 that when the rotational rate reaches 58%, the growth rate of sphalerite breakage rate decreases but it is not as obvious as the calcite breakage rate, indicating that the crushing degree of sphalerite has not stabilized at this time. It shows that the hardness of sphalerite is higher than that of calcite and lower than that of chalcopyrite, which is consistent with the conclusion of the JK drop weight test in Section 3.1. In the process of throwing and grinding, the proportion of impact-specific crushing energy Ecj1, Ecj2, and Ecj3 of sphalerite particles in throwing-specific crushing energy Epl is 10.53%~20.81%, 16.50%~31.83%, and 12.52%~24.04%, respectively. Again, it shows that the impact-specific crushing energy of fine-grained minerals accounts for a larger proportion of the throwing-specific crushing energy but the difference in sphalerite is larger than that for chalcopyrite, and there is no obvious calcite, which is consistent with their hardness.

3.3.4. Comparison of Grinding Test Results of Three Mineral Ores

According to the analysis contents in Section 3.3.1, Section 3.3.2 and Section 3.3.3, the breakage rate and particle size characteristic value t10 of the grinding products of calcite, chalcopyrite, and sphalerite under different mill rotational rates are compared. The results are shown in Figure 26 and Figure 27.
It can be seen from Figure 26 that the breakage rates of the three mineral ores are positively correlated with the mill rotational rate, with an increasing trend. At the same rotational speed, the relationship between the breakage rates of the three mineral ores is as follows: calcite > sphalerite > chalcopyrite. With the continuous increase in the rotational rate, the calcite breakage rate curve slows down earliest, and the breakage rate approaches the equilibrium earliest, indicating that the calcite particles are broken the earliest and are easier to break under the same conditions. On the contrary, the chalcopyrite breakage rate curve becomes gentle at the latest, and the breakage rate continues to maintain a large slope. It shows that chalcopyrite particles are broken late, the particles are not easy to break, and the hardness is the largest. The relationship between the breakage rate of the three mineral ores shows that the hardness relationship of the three mineral ores is chalcopyrite > sphalerite > calcite, which is consistent with the conclusion of the JK drop weight test in Section 3.1.
It can be seen from Figure 27 that the particle size characteristic value t10 of the three mineral ores throwing grinding products is consistent with the change trend of mill rotational rate and breakage rate. At the same rotational speed, the order of t10 values of the three mineral ores is calcite > sphalerite > chalcopyrite. The t10 value of calcite t10 is the first to approach equilibrium with the continuous increase in rotational rate. It shows that under the same conditions, the calcite particles are easier to be broken, and are the earliest to break. On the contrary, the chalcopyrite t10 curve becomes gentle at the latest, and the t10 value continues to maintain a large slope, indicating that chalcopyrite particles are not easily broken, particle breakage occurs later, and the hardness is the largest. The change trend of the t10 curve of the three mineral ores shows that the hardness relationship of the three mineral ores is chalcopyrite > sphalerite > calcite, which is consistent with the previous conclusion.

4. Conclusions

(1) The impact crushing parameters of the three mineral ores and the corresponding hardness grade of the ores are related to the particle size. The smaller the particle size of the mineral ores, the smaller the value of the A × b of the material ores. This shows that there is a “hardening effect” of particle size reduction in the evaluation of impact crushing resistance and hardness grade of mineral ores according to the JK drop weight test method, and the smaller the hardness of mineral ores, the greater the influence of the particle size. Therefore, comparing the impact crushing capacity of different ores with the results of the JK drop weight test must be strictly limited to the same particle size;
(2) Whether according to the standard particle size range or expanded to a finer particle size range, the order of impact crushing resistance of the three mineral ores obtained by the JK drop weight test is consistent with the characterization results of ore Mohs hardness. Under the same particle size conditions, the values of A × b of the three mineral ores are as follows: calcite > sphalerite > chalcopyrite. Therefore, it can be considered that chalcopyrite has the strongest impact crushing resistance, sphalerite is the second strongest, and calcite is the weakest. This shows that it is more excellent and reasonable to characterize the hardness of materials by the value of impact crushing resistance parameter A × b of the JK drop weight test;
(3) In the grinding process when the grinding medium is in the cascading state, the breakage rate and product particle size characteristic value t10 of the three mineral ores are positively correlated with the increase in grinding time. The breakage rate and t10 value of mineral ores are related to the hardness and grinding particle size of mineral ores but the influence of ore hardness is not consistent. The first-order linear model can better fit the grinding kinetics in the cascading state, and its kinetic parameters are related to ore hardness and feed particle size;
(4) By establishing a new method of back calculating the actual impact crushing energy of the medium on the ore under the dropping state, it is proved that the medium impact-specific crushing energy of the ore in the composite grinding process under the dropping state is related to the particle size of the grinding feed and the hardness of the ore. The greater the hardness of the ore, the smaller the effect of particle size on the impact-specific crushing energy;
(5) In the composite grinding process when the grinding medium is in the dropping state, the breakage rate and t10 value of the three mineral ores show a positive correlation growth trend with the increase in the mill rotational rate, and they are first fast and then slow. The breakage rate of the three mineral ores is closely related to the hardness of the ores themselves. The greater the hardness, the smaller the breakage rate of the ore, reflecting the influence of ore hardness, which is consistent with the conclusion of the JK drop weight test. The t10 value is more suitable to characterize the composite grinding effect in the dropping state but is not suitable in the cascading state;
(6) This research method has shown good application effects on three minerals—calcite, sphalerite, and chalcopyrite—and valuable conclusions have been drawn, indicating that the method used in this study is feasible and effective. Thus, this research method can also be extended to other industries that carry out comminution to further study the breakage mechanism and characteristics of various materials.

Author Contributions

Conceptualization, J.Y. and D.W.; Data curation, Y.L. and P.Z. and R.G.; Formal analysis, H.L. and P.Z.; Funding acquisition, S.M.; Investigation, Y.L. and J.Y.; Methodology, J.Y. and D.W.; Project administration, J.Y. and S.M.; Validation, Y.L. and J.Y.; Writing—original draft, Y.L. and J.Y. and R.G.; Writing—review and editing, J.Y. and D.W. All authors have read and agreed to the published version of the manuscript.

Funding

This research was funded by the National Natural Science Foundation of China (No. 52274258; No. 51874105).

Data Availability Statement

The data presented in this study are available on request from the corresponding author due to privacy reasons.

Conflicts of Interest

The authors declare no conflicts of interest.

References

  1. Park, J.; Kim, K. Use of drilling performance to improve rock-breakage efficiencies: A part of mine-to-mill optimization studies in a hard-rock mine. Int. J. Min. Sci. Technol. 2020, 30, 179–188. [Google Scholar] [CrossRef]
  2. Wang, Z.W.; Liu, Q.S. Failure criterion for soft rocks considering intermediate principal stress. Int. J. Min. Sci. Technol. 2021, 31, 565–575. [Google Scholar] [CrossRef]
  3. Camalan, M. Correlating common breakage modes with impact breakage and ball milling of cement clinker and chromite. Int. Int. J. Min. Sci. Technol. 2020, 30, 901–908. [Google Scholar] [CrossRef]
  4. Tomach, P. The Influence of the Grinding Media Diameter on Grinding Efficiency in a Vibratory Ball Mill. Materials 2024, 17, 2924. [Google Scholar] [CrossRef]
  5. Kumar, A.; Sahu, R.; Tripathy, S.K. Energy-Efficient Advanced Ultrafine Grinding of Particles Using Stirred Mills—A Review. Energies 2023, 16, 5277. [Google Scholar] [CrossRef]
  6. Petrakis, E. Effect of Size-Distribution Environment on Breakage Parameters Using Closed-Cycle Grinding Tests. Materials 2023, 16, 7687. [Google Scholar] [CrossRef]
  7. Gao, P.; Zhou, W.T.; Han, Y.X.; Li, Y.J.; Ren, W.L. Enhancing the capacity of large-scale ball mill through process and equipment optimization: An industrial test verification. Adv. Powder Technol. 2020, 31, 2079–2091. [Google Scholar] [CrossRef]
  8. Chen, B.C. Grinding Principle; Metallurgical Industry Press: Beijing, China, 1989. (In Chinese) [Google Scholar]
  9. Curry, J.A.; Ismay, M.J.L.; Jameson, G.J. Mine operating costs and the potential impacts of energy and grinding. Miner. Eng. 2014, 56, 70–80. [Google Scholar] [CrossRef]
  10. Yu, J.W.; Qin, Y.H.; Gao, P.; Han, Y.X.; Li, Y.J. An innovative approach for determining the grinding media system of ball mill based on grinding kinetics and linear superposition principle. Powder Technol. 2021, 378, 172–181. [Google Scholar] [CrossRef]
  11. Ma, S.; Li, H.; Shuai, Z.; Yang, J.; Xu, W.; Deng, X. Research on Grinding Characteristics and Comparison of Particle-Size-Composition Prediction of Rich and Poor Ores. Minerals 2022, 12, 1354. [Google Scholar] [CrossRef]
  12. Liu, J.; Long, H.; Corin, K.C.; O’Connor, C.T.A. Study of the effect of grinding environment on the flotation of two copper sulphide ores. Miner. Eng. 2018, 122, 339–345. [Google Scholar] [CrossRef]
  13. Rabieh, A.; Eksteen, J.; Albijanic, B. Galvanic interaction of grinding media with arsenopyrite and pyrite and its effect on gold cyanide leaching. Miner. Eng. 2018, 116, 46–55. [Google Scholar] [CrossRef]
  14. Xiao, X.; Zhang, G.W.; Feng, Q.M.; Xiao, S.X.; Huang, L.L.; Zhao, X.; Li, Z.Q. The liberation effect of magnetite fine ground by vertical stirred mill and ball mill. Miner. Eng. 2012, 34, 63–69. [Google Scholar] [CrossRef]
  15. Ma, S.; Li, H.; Yang, X.; Xu, W.; Deng, X.; Yang, J. Study on Impact Crushing Characteristics of Minerals Based on Drop Weight Tests. Minerals 2023, 13, 632. [Google Scholar] [CrossRef]
  16. Henckens, M.L.C.M.; Van Ierland, E.C.; Driessen, P.P.J.; Worrell, E. Mineral Resources: Geological Scarcity, Market Price Trends, and Future Generations. Resour. Policy 2016, 49, 102–111. [Google Scholar] [CrossRef]
  17. Gorman, M.R.; Dzombak, D.A. A Review of Sustainable Mining and Resource Management: Transitioning from the Life Cycle of the Mine to the Life Cycle of the Mineral. Resour. Conserv. Recycl. 2018, 137, 281–291. [Google Scholar] [CrossRef]
  18. Chen, Y.M.; Li, H.; Feng, D.X.; Tong, X.; Hu, S.X.; Yang, F.; Wang, G.C. A Recipe of Surfactant for the Flotation of Fine Cas-siterite Particles. Miner. Eng. 2021, 160, 106658. [Google Scholar] [CrossRef]
  19. Huang, K.Q.; Xiao, C.H.; Wu, Q.M. Application of Accurate Ball-Load-Addition Method in Grinding Production of some Tailings. Adv. Mater. Res. Int. J. 2014, 962, 771–774. [Google Scholar] [CrossRef]
  20. Kotake, N.; Kuboki, M.; Kiya, S.; Kanda, Y. Influence of Dry and Wet Grinding Conditions on Fineness and Shape of Particle Size Distribution of Product in a Ball Mil. Adv. Powder Technol. 2011, 22, 86–924. [Google Scholar] [CrossRef]
  21. Peng, Y.; Grano, S. Effect of Iron Contamination from Grinding Media on the Flotation of Sulphide Minerals of Different Particle Size. Int. J. Miner. Process. 2010, 97, 1–6. [Google Scholar] [CrossRef]
  22. Woywadt, C. Grinding Process Optimization-Featuring Case Studies and Operating Results of the Modular Vertical Roller Mill. In Proceedings of the IEEE-IAS/PCA Cement Industry Technical Conference, Calgary, AB, Canada, 21–25 May 2017. [Google Scholar]
  23. Hfels, C.; Dambach, R.; Kwade, A. Geometry Influence on Optimized Operation of a Dry Agitator Bead Mill. Miner. Eng. 2021, 171, 107050. [Google Scholar] [CrossRef]
  24. Santosh, T.; Soni, R.K.; Eswaraiah, C.; Rao, D.S.; Venugopal, R. Optimization of Stirred Mill Parameters for Fine Grinding of Pge Bearing Chromite Ore. Part. Sci. Technol. 2020, 39, 663–675. [Google Scholar]
  25. Guo, W.; Han, Y.X.; Gao, P.; Li, Y.J.; Tang, Z.D. A study of the grinding of magnetite/limestone mixture in a stirred mill by the attainable region method. Powder Technol. 2021, 389, 40–47. [Google Scholar] [CrossRef]
  26. Aleksandrova, T.; Nikolaeva, N.; Afanasova, A.; Romashev, A.; Kuznetsov, V. Selective Disintegration Justification Based on the Mineralogical and Technological Features of the Polymetallic Ores. Minerals 2021, 11, 851. [Google Scholar] [CrossRef]
  27. Yang, J.L.; Shuai, Z.C.; Zhou, W.T.; Ma, S.J. Grinding Optimization of Cassiterite-polymetallic Sulfide Ore. Minerals 2019, 9, 134. [Google Scholar] [CrossRef]
  28. Pyza, B.; Lmoa, B.; Lmza, B.; Wgza, B.; Htf, C. MLA-based sphalerite flotation optimization: Two-stage roughing. Powder Technol. 2019, 343, 586–594. [Google Scholar]
  29. Mingwei, G.; Eric, F. Prediction of product size distributions for a stirred ball mill. Powder Technol. 1995, 84, 101–106. [Google Scholar]
  30. Yu, S.; Wu, C.Y.; Adams, M.J.; Reynolds, G.; Gururajan, B.; Gargiuli, J.; Leadbeater, T.; Roberts, R.; Parker, D.J. The use of positron emission particle tracking (PEPT) to study milling of roll-compacted microcrystalline cellulose ribbons. Powder Technol. 2015, 285, 4–79. [Google Scholar] [CrossRef]
  31. Venkataraman, K.S.; Narayanan, K.S. Energetics of collision between grinding media in ball mills and mechanochemical effects. Powder Technol. 1998, 96, 190–201. [Google Scholar] [CrossRef]
  32. Reinhold, A.; Schorsch, S.; Mazzotti, M.; Briesen, H. Modeling and measurement of abraded particles. Powder Technol. 2015, 217, 134–140. [Google Scholar] [CrossRef]
  33. Duan, X.X. Selective Grinding and Its Application; Metallurgical Industry Press: Beijing, China, 1991. [Google Scholar]
  34. Zeng, S.Q.; Zhang, X.L.; Cao, S.M. Overview of Bauxite Selective Dissociation in China. Adv. Mater. Res. 2013, 634, 3705–3709. [Google Scholar] [CrossRef]
  35. Petrakis, E.; Karmali, V.; Komnitsas, K. Factors affecting nickel upgrade during selective grinding of low-grade limonitic laterites. Miner. Process. Extr. Metall. 2018, 130, 192–201. [Google Scholar] [CrossRef]
  36. Ni, C.; Zhou, S.Q.; Gao, J.X.; Bu, X.G.; Chen, Y.R.; Alheshibri, M.; Xie, G.Y.; Li, B. Selective comminution and grinding mechanisms of spent carbon anode from aluminum electrolysis using ball and rod mills. Physicochem. Probl. Miner. Process. 2022, 58, 145667. [Google Scholar] [CrossRef]
  37. JK Tech. JkSimMet User Manual—Steady State Mineral Processing Simulator; JK Tech Pty Ltd.: Brisbane, Australia, 2003. [Google Scholar]
  38. He, M.; Liu, J.Y. Experimental study on impact crushing of ore particles with particle size less than 13.2 mm. Min. Metall. 2015, 24, 5–10. [Google Scholar]
  39. Austin, L.G.; Luckie, P.T. Methods for Determination of Breakage Distribution Parameters. Powder Technol. 1972, 5, 215–222. [Google Scholar] [CrossRef]
  40. Yang, J.L.; Zhou, W.T.; Ma, S.J. Optimization of parameters affecting grinding rate of cassiterite polymetallic sulfide ore by response surface method. Min. Res. Dev. 2016, 36, 68–72. (In Chinese) [Google Scholar]
  41. Ilankoon, I.M.S.K.; Tang, Y.; Ghorbani, Y.; Northey, S.; Yellishetty, M.; Deng, X.; McBride, D. The current state and future directions of percolation leaching in the Chinese mining industry: Challenges and opportunities. Miner. Eng. 2018, 125, 206–222. [Google Scholar] [CrossRef]
Figure 1. The photos of samples: (a) calcite; (b) chalcopyrite; (c) sphalerite.
Minerals 15 00407 g001
Figure 2. JK drop weight test equipment: (a) drop weight machine body diagram; (b) drop weight machine operation settings.
Minerals 15 00407 g002
Figure 3. The equipment of Φ240 × 90 ball mill.
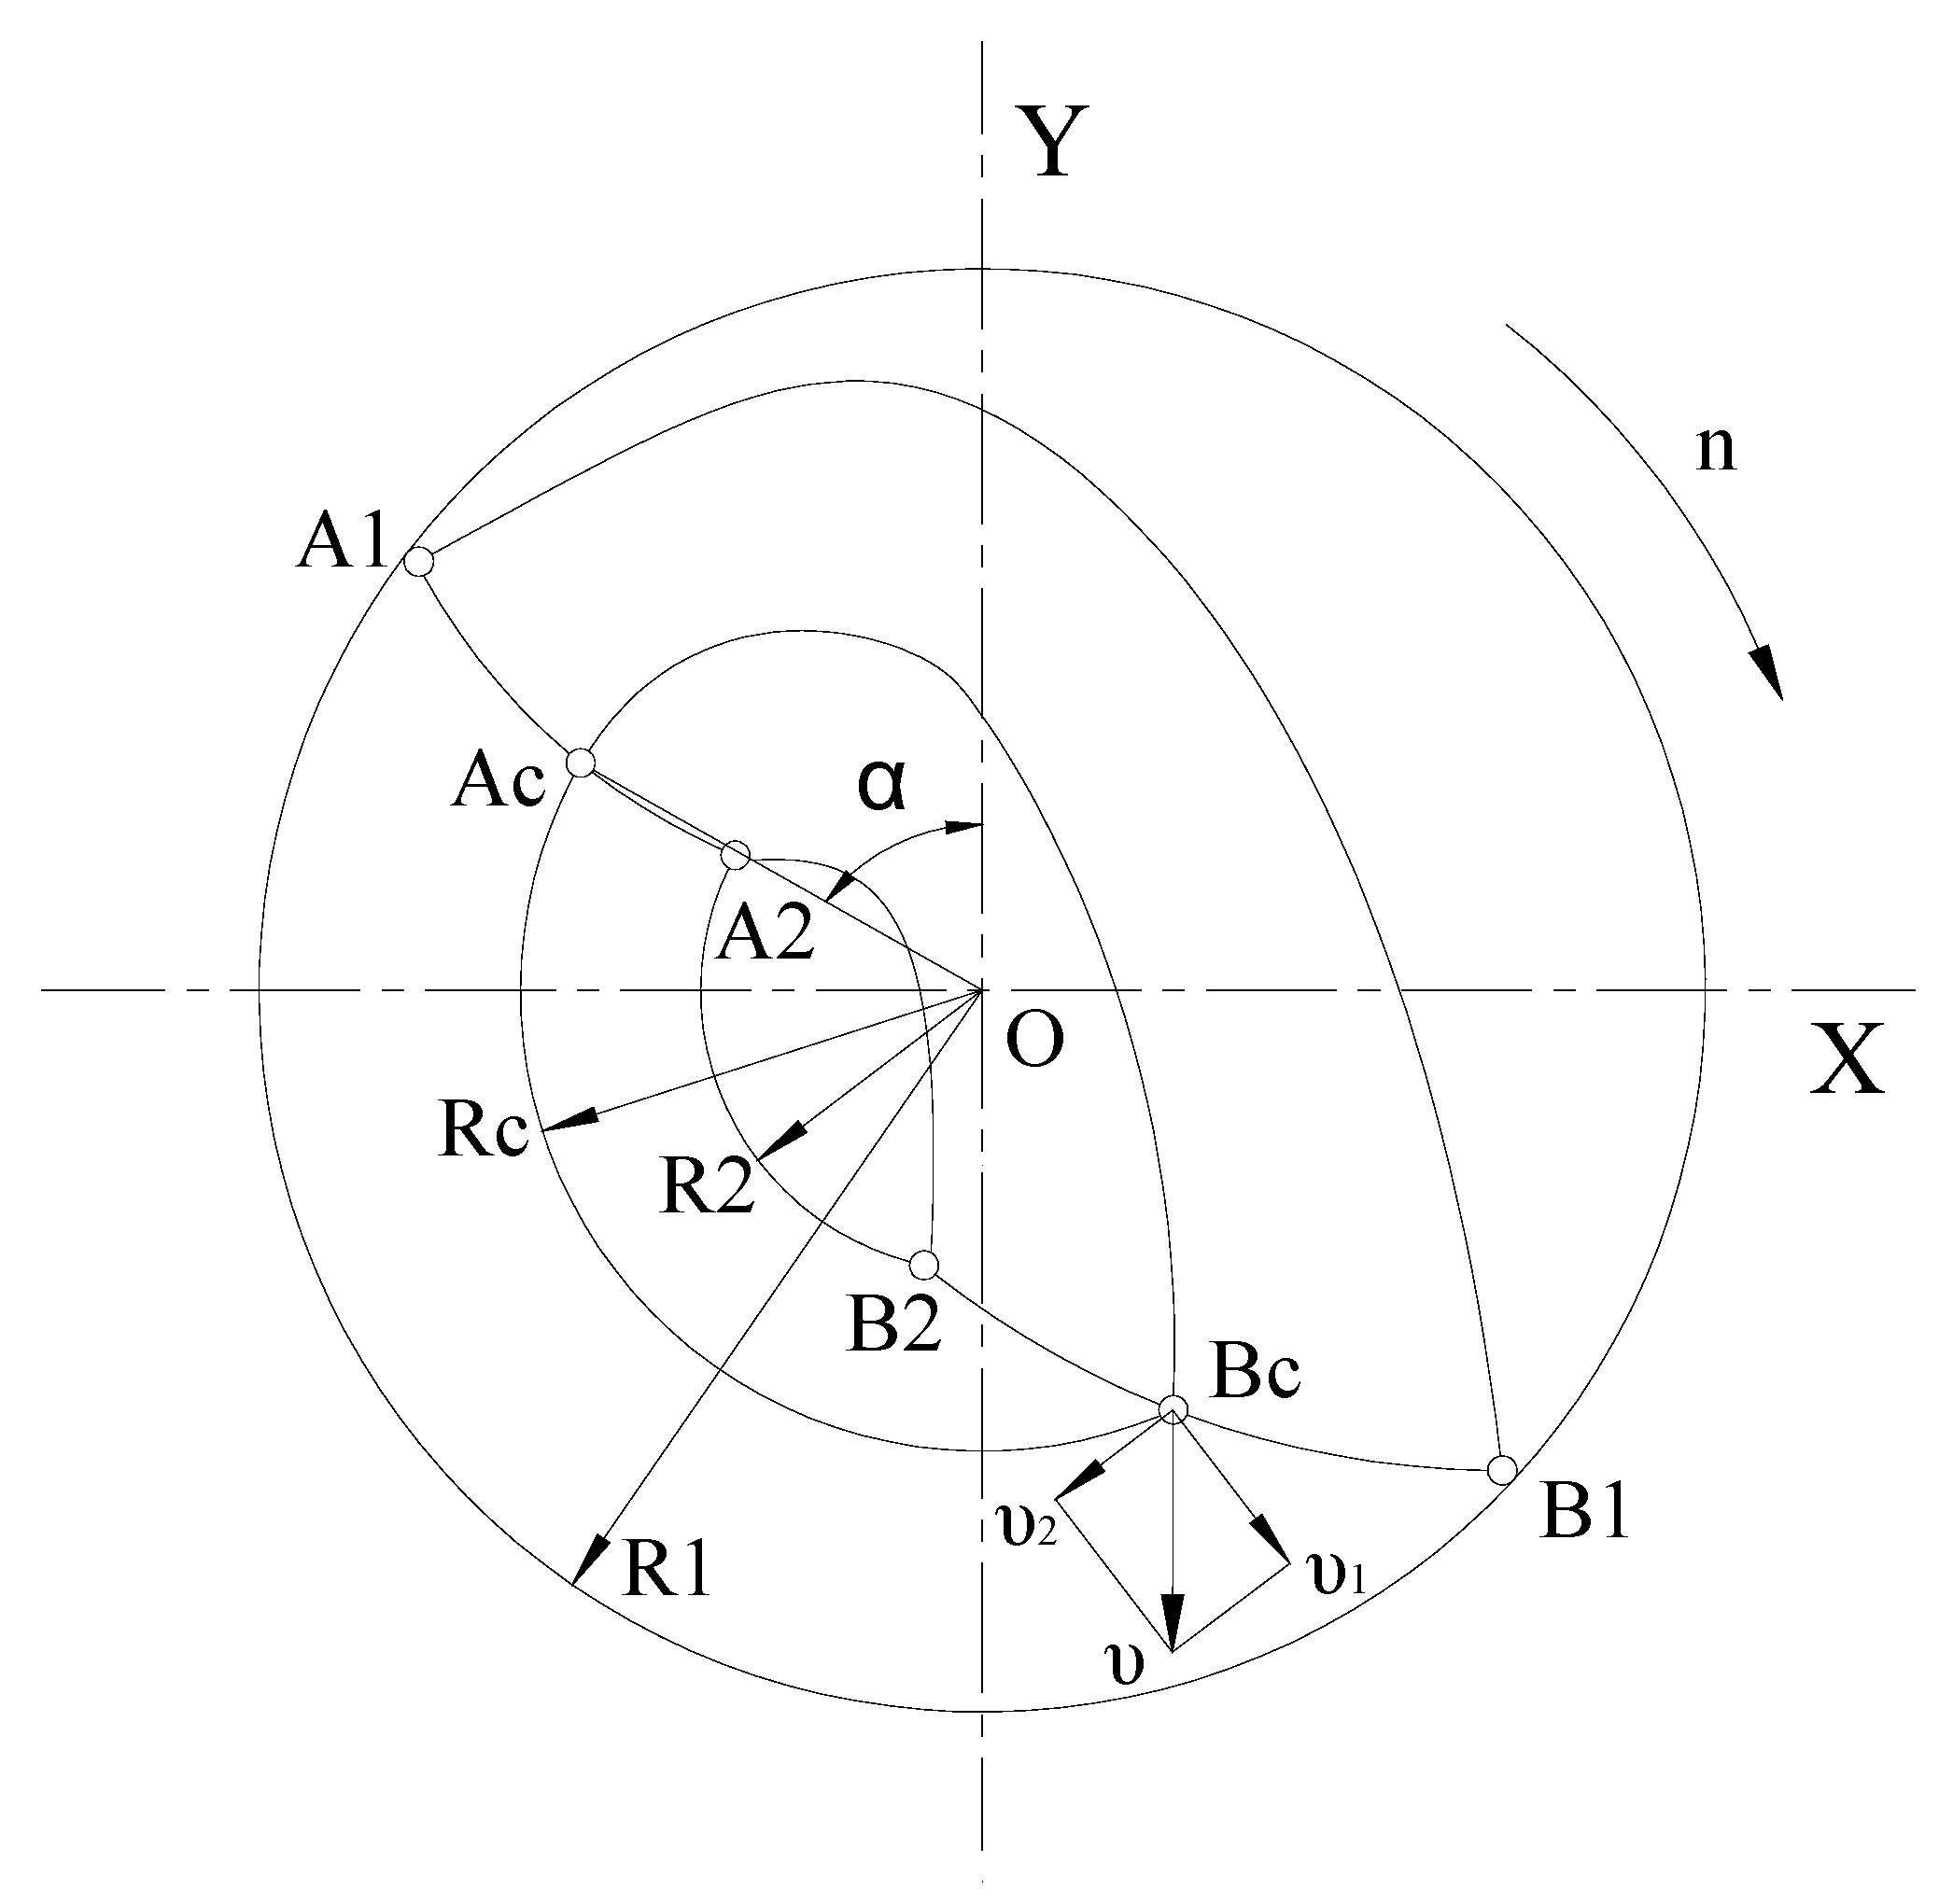
Minerals 15 00407 g003
Figure 4. The motion trajectory of the medium.
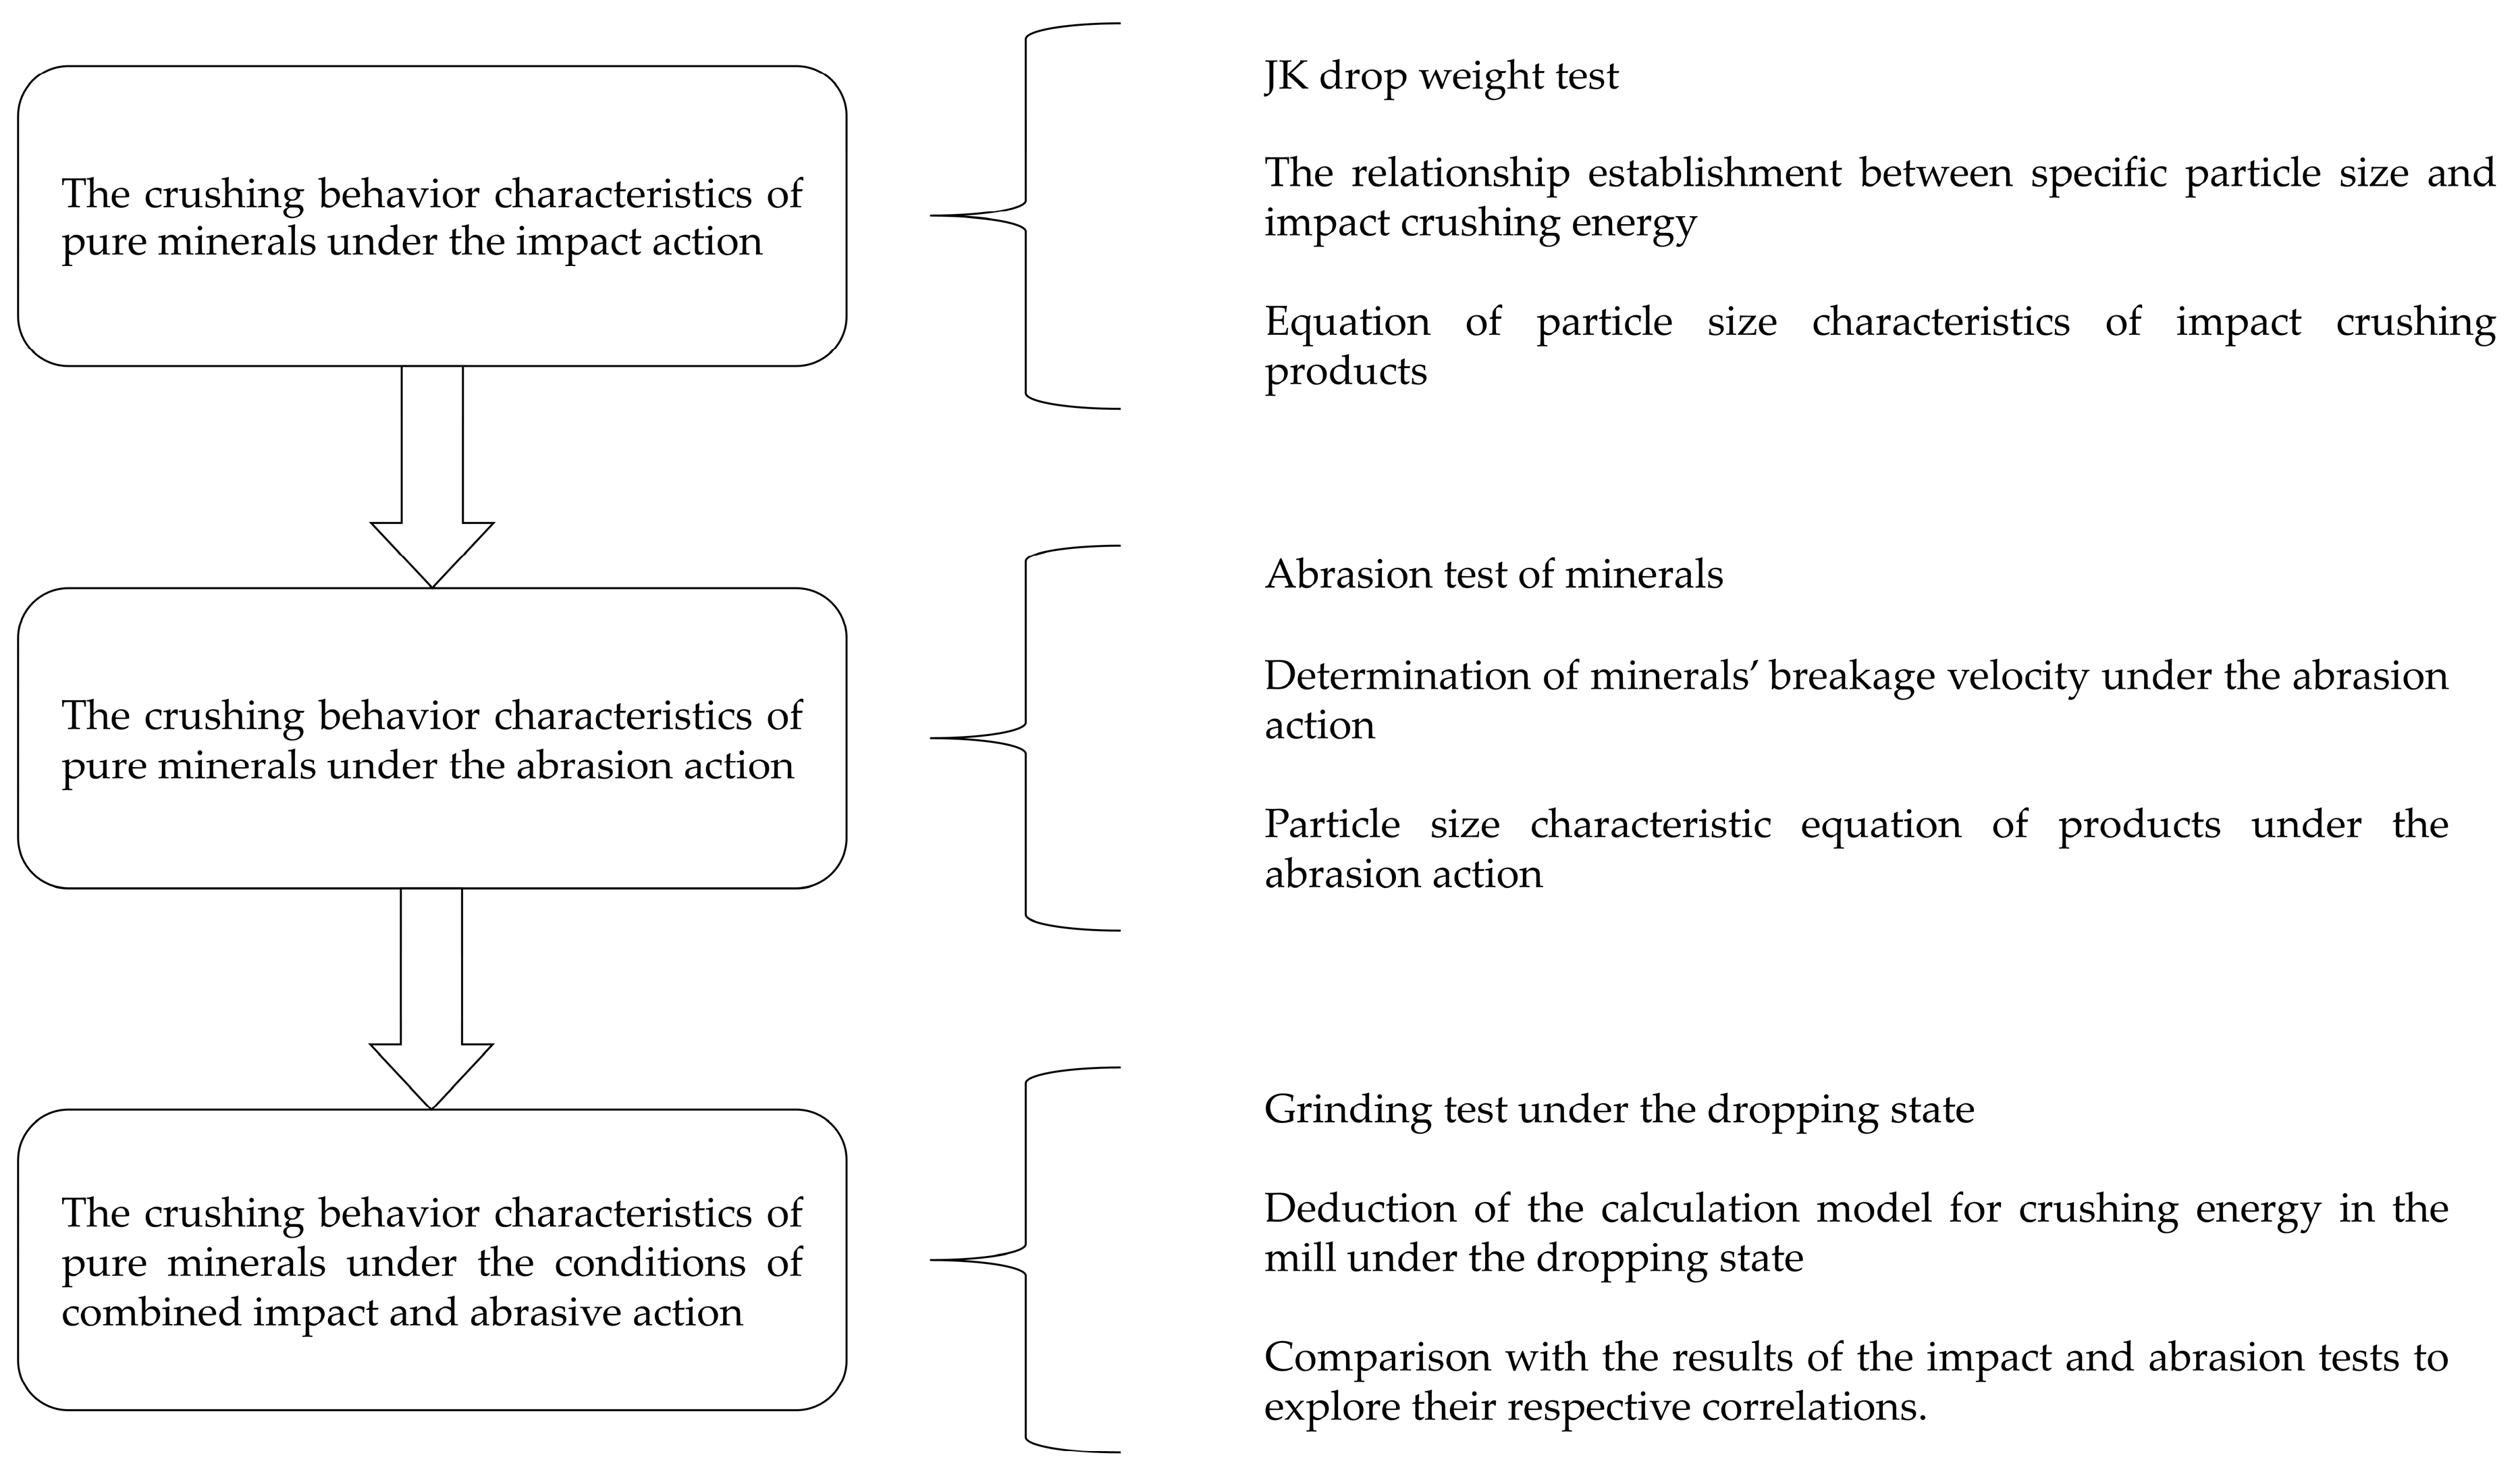
Minerals 15 00407 g004
Figure 5. Technology roadmap for this paper.
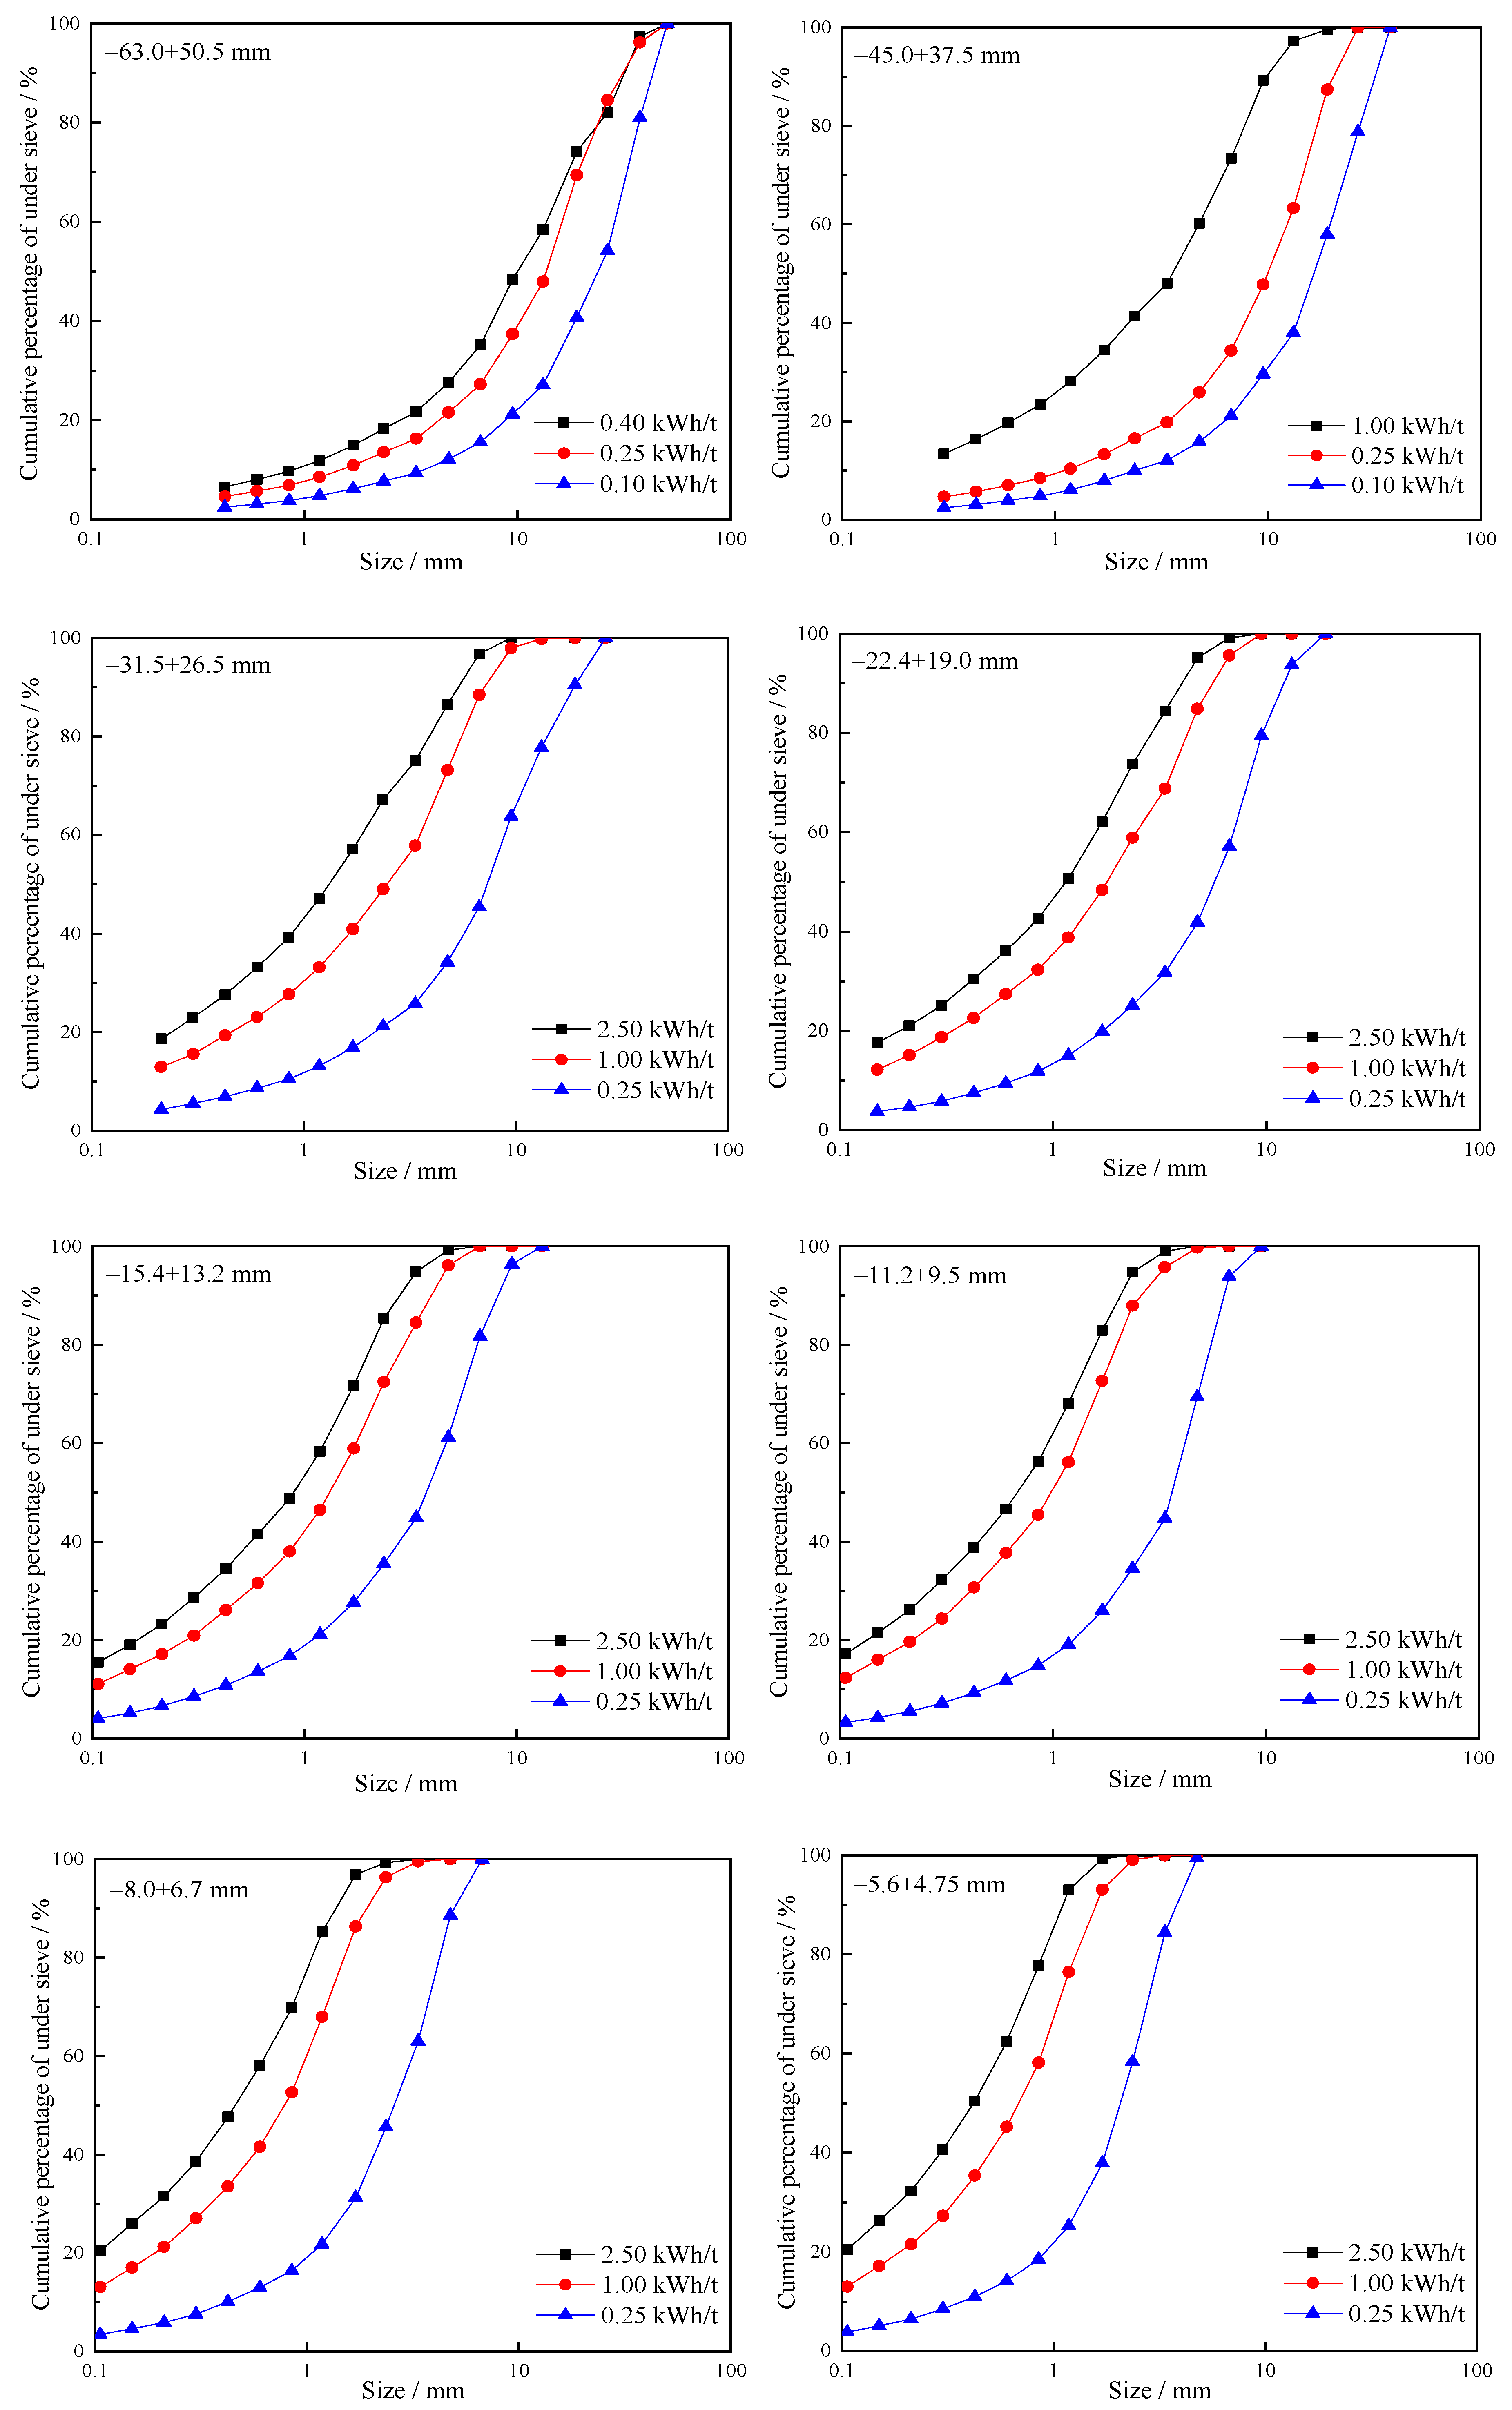
Minerals 15 00407 g005
Figure 6. Particle size distribution curve of impact crushing products under each particle size of calcite.
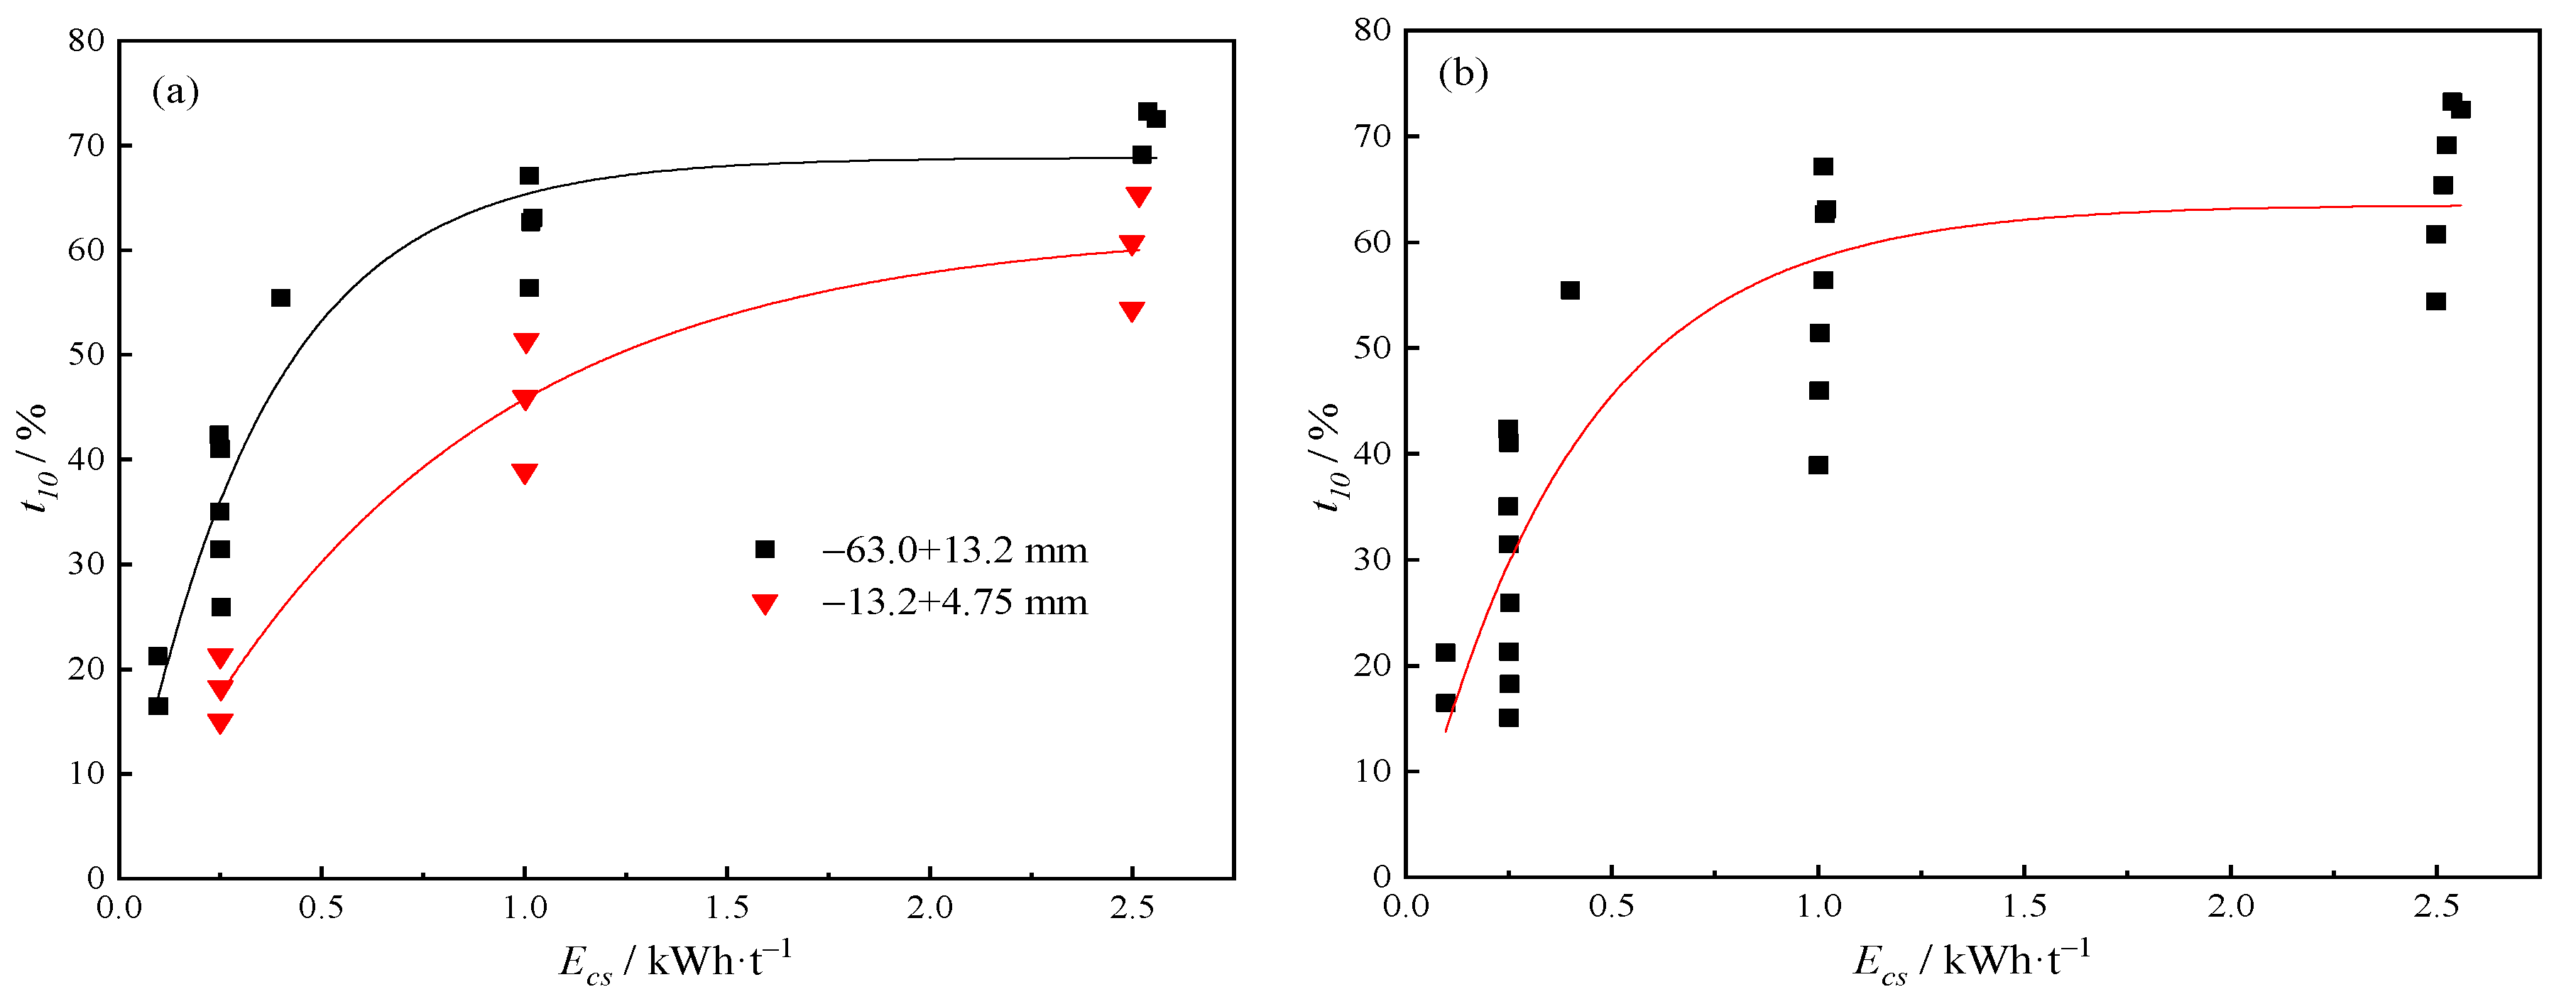
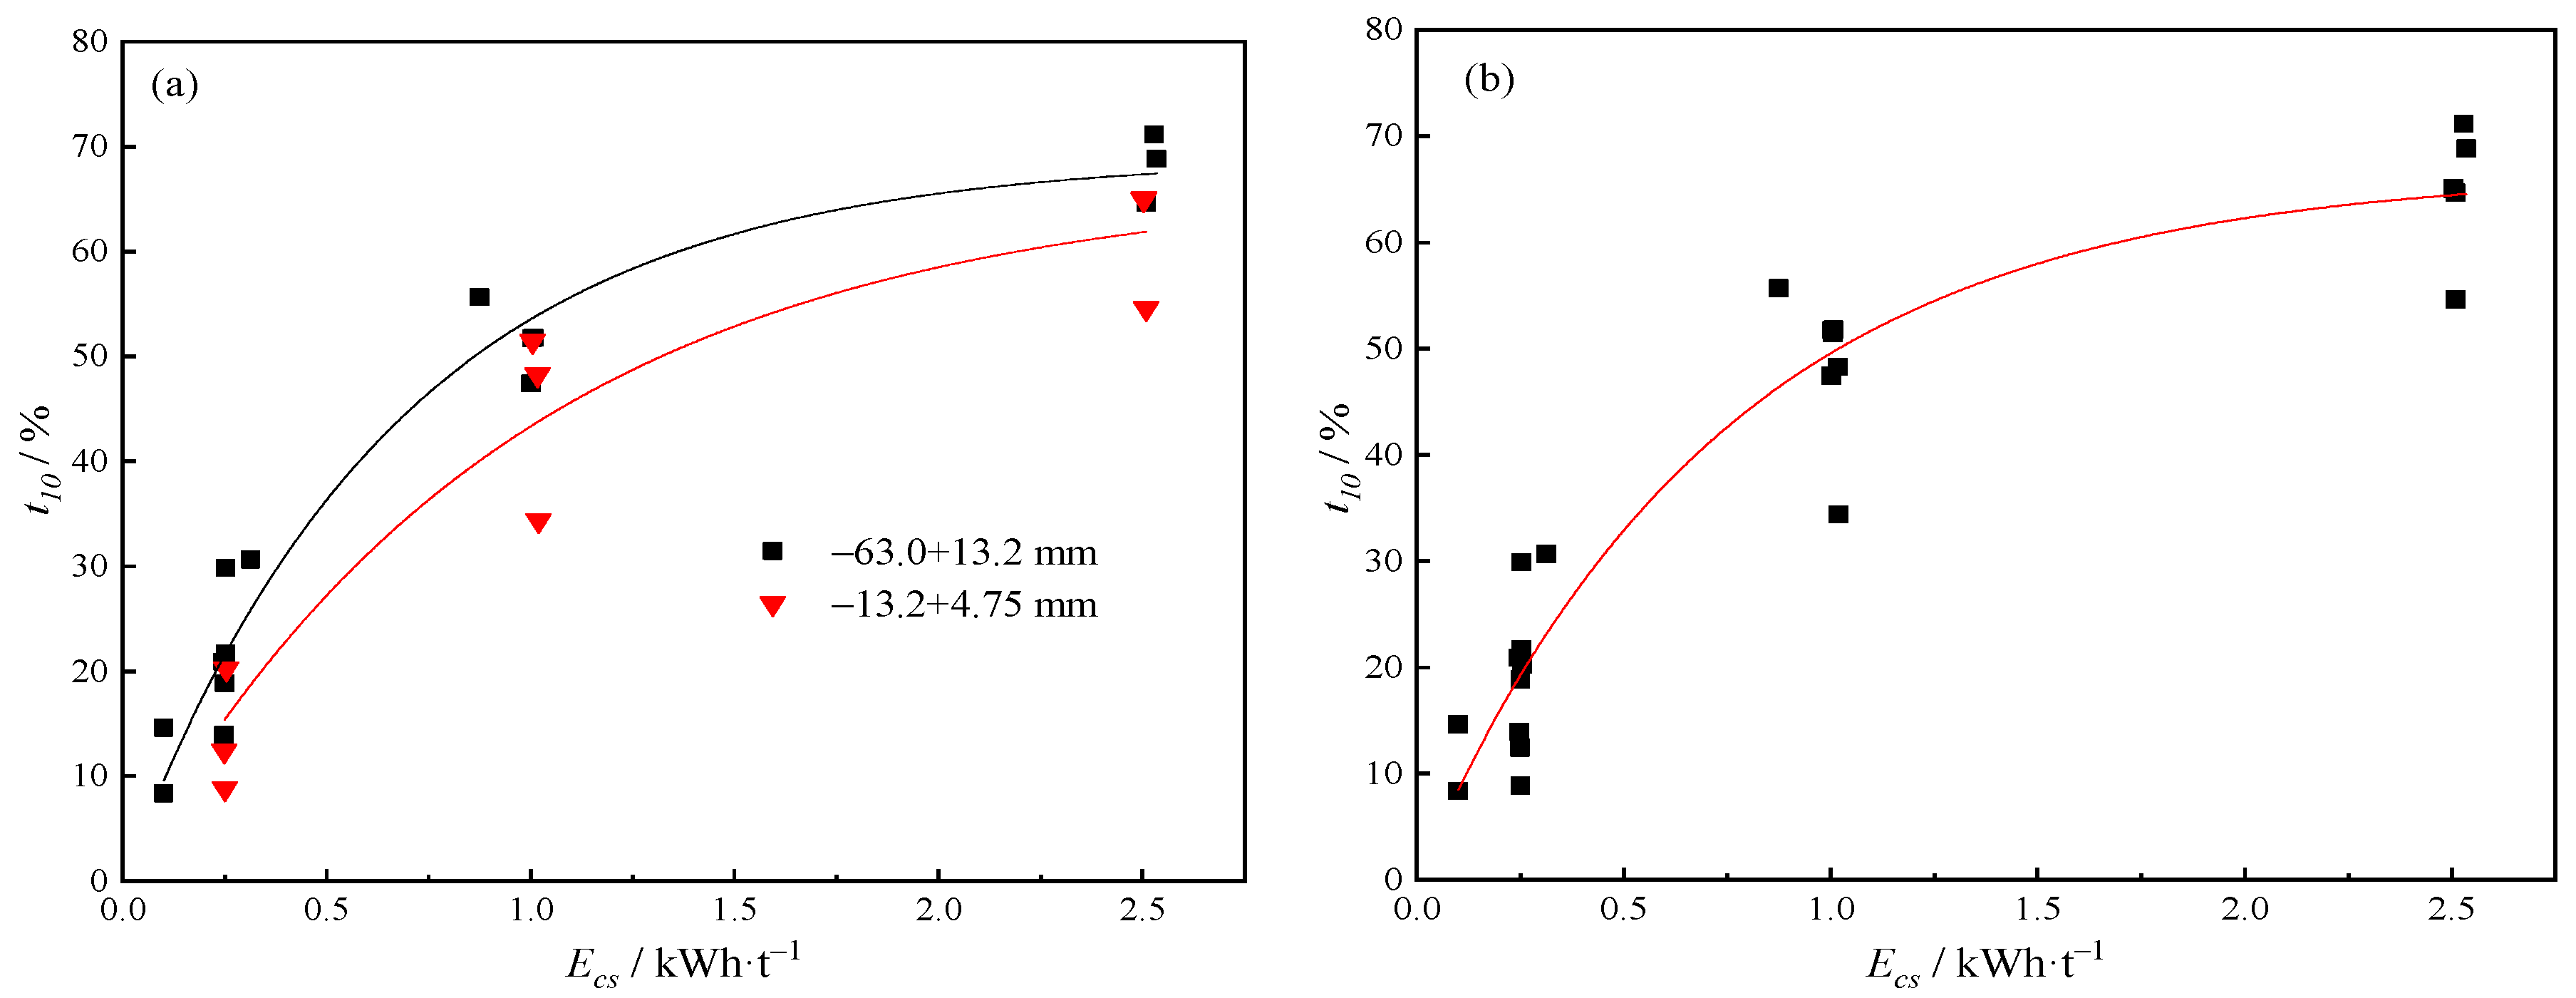
Minerals 15 00407 g006
Figure 7. Ecs-t10 relationship curve of calcite impact comminution tests: (a) comparison of two grain-level Ecs-t10; (b) full size range Ecs-t10 relationship.
Minerals 15 00407 g007
Figure 8. Particle size distribution curve of impact crushing products under each particle size of chalcopyrite.
Minerals 15 00407 g008
Figure 9. Ecs-t10 relationship curve of chalcopyrite impact comminution tests: (a) comparison of two grain-level Ecs-t10; (b) full size range Ecs-t10 relationship.
Minerals 15 00407 g009
Figure 10. Particle size distribution curve of impact crushing products under each particle size of sphalerite.
Minerals 15 00407 g010
Figure 11. Ecs-t10 relationship curve of sphalerite impact comminution tests: (a) comparison of two grain-level Ecs-t10; (b) full size range Ecs-t10 relationship.
Minerals 15 00407 g011
Figure 12. Comparison of A × b values of three mineral ores under different particle sizes.
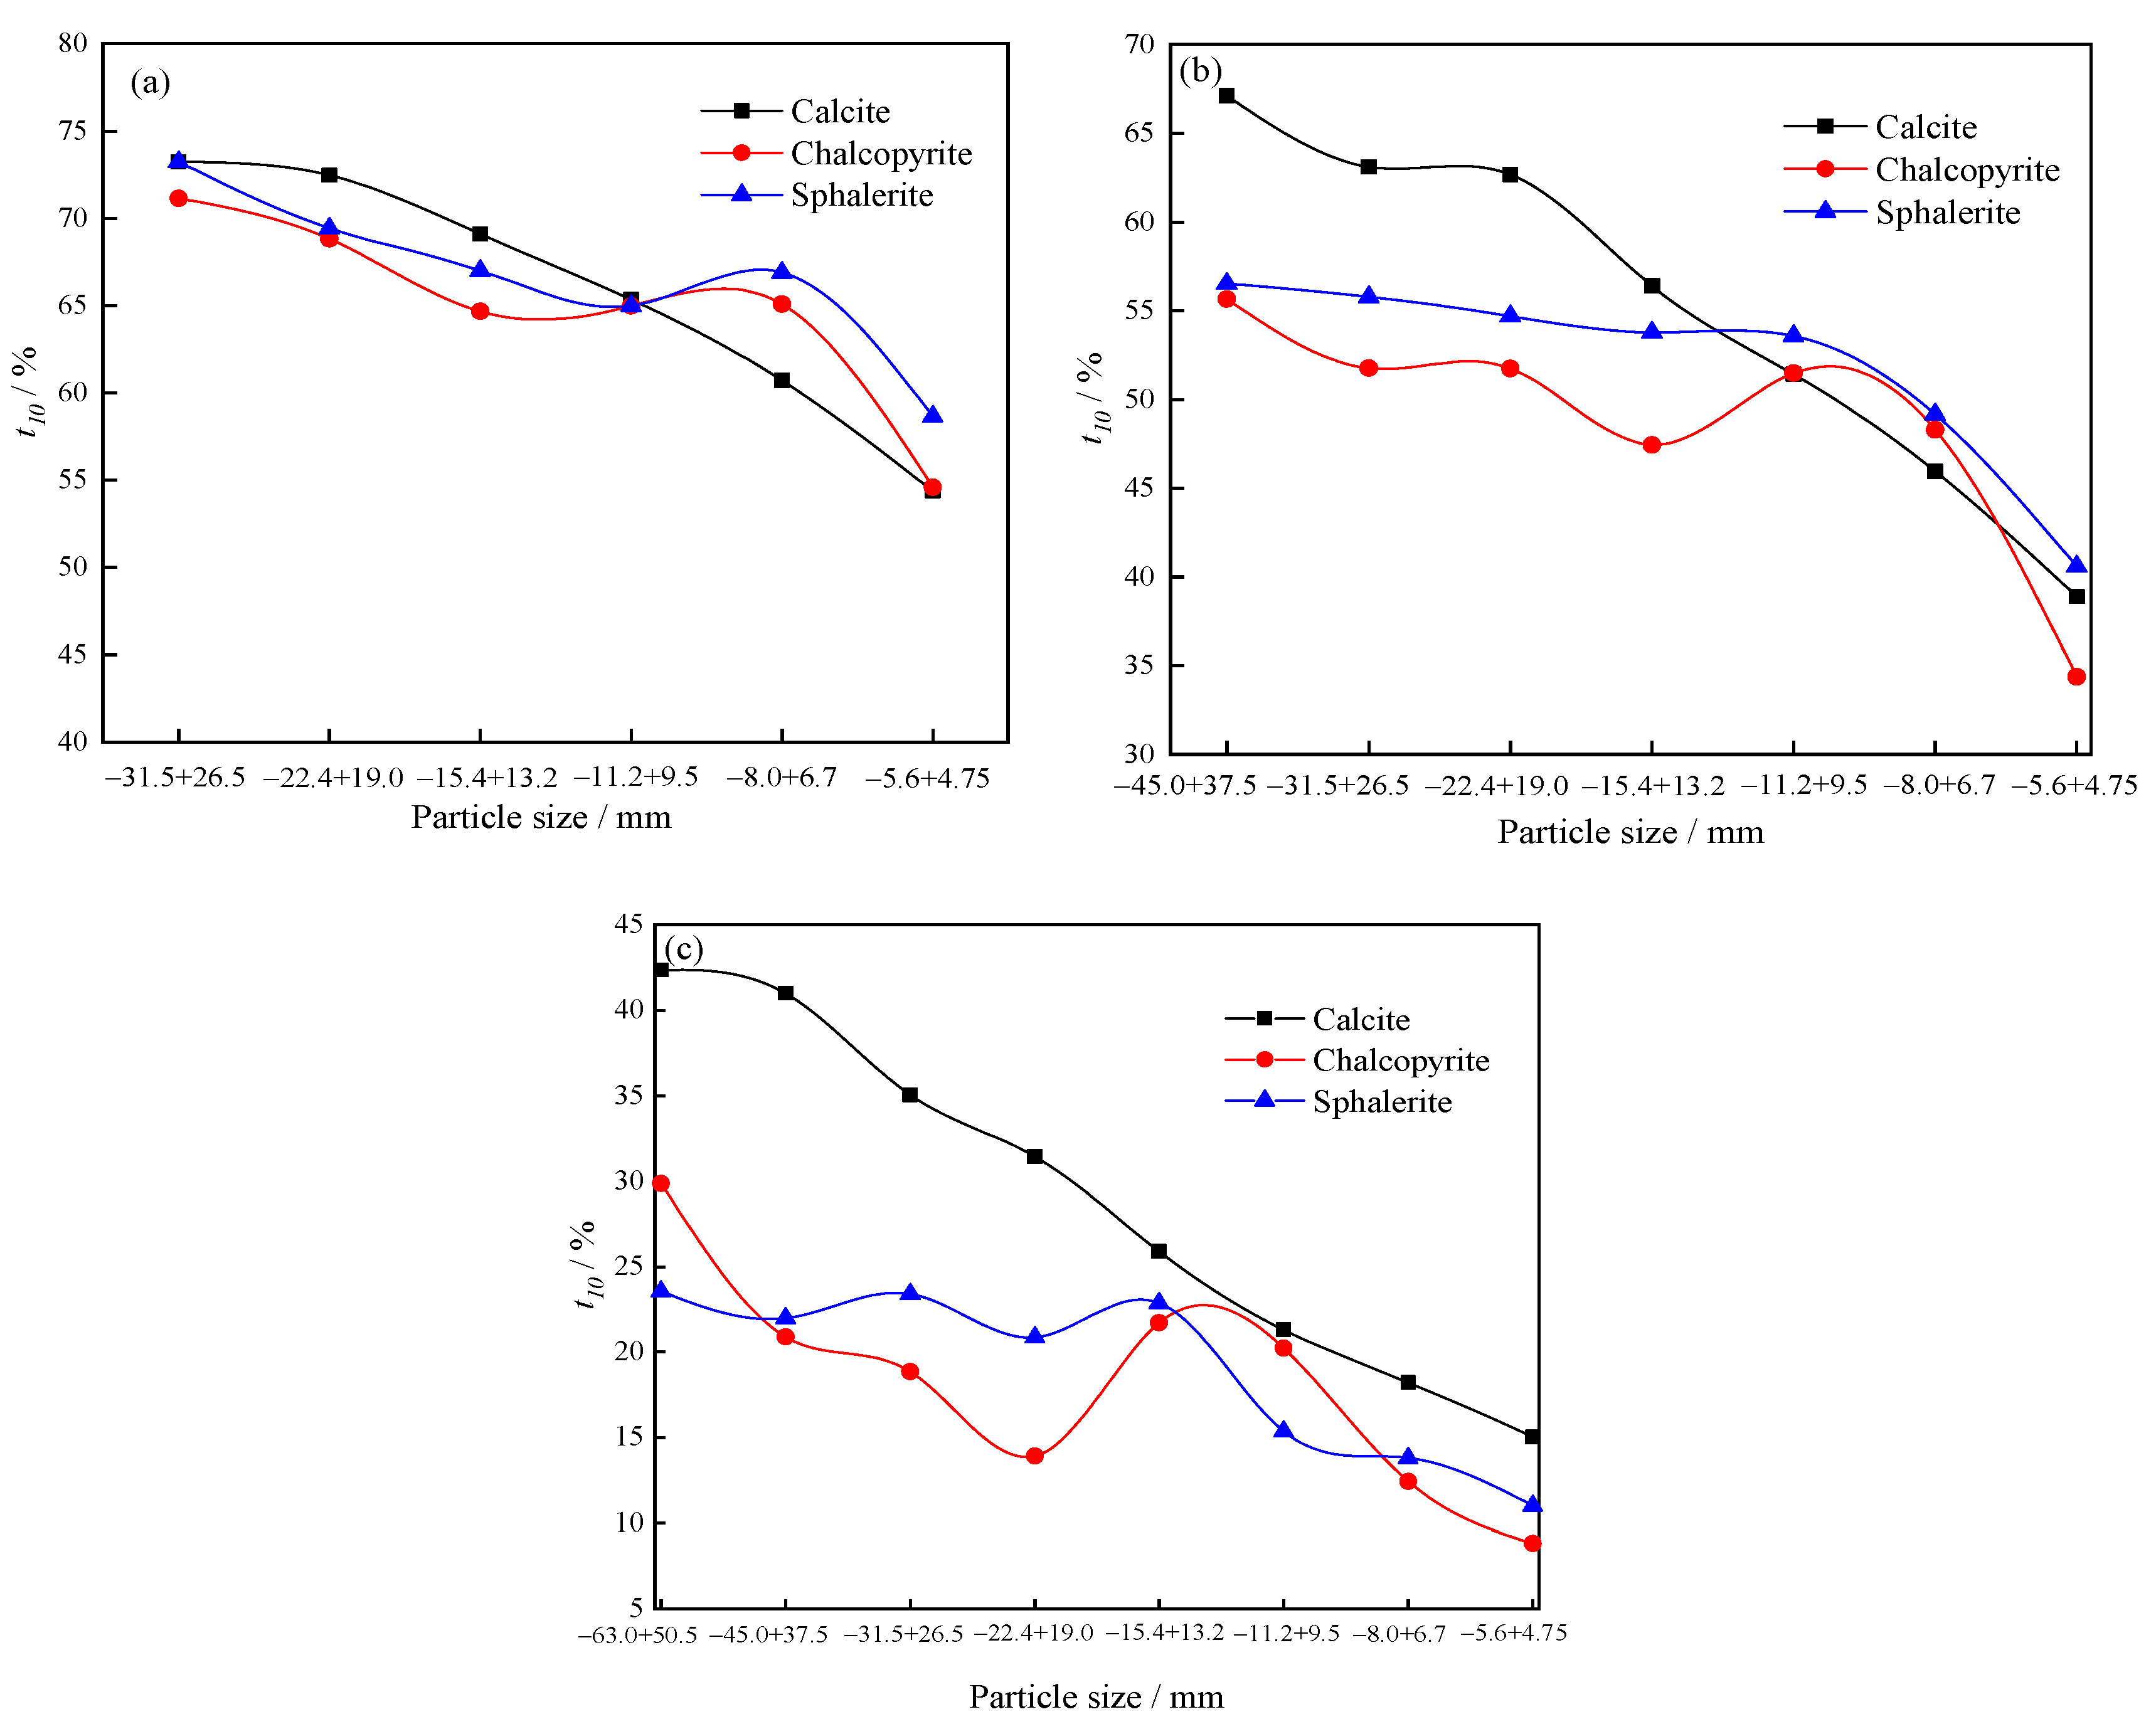
Minerals 15 00407 g012
Figure 13. Variation diagram of t10 in impact crushing products with different particle sizes: (a) Ecs = 2.50 kWh/t; (b) Ecs = 1.0 kWh/t; (c) Ecs = 0.25 kWh/t.
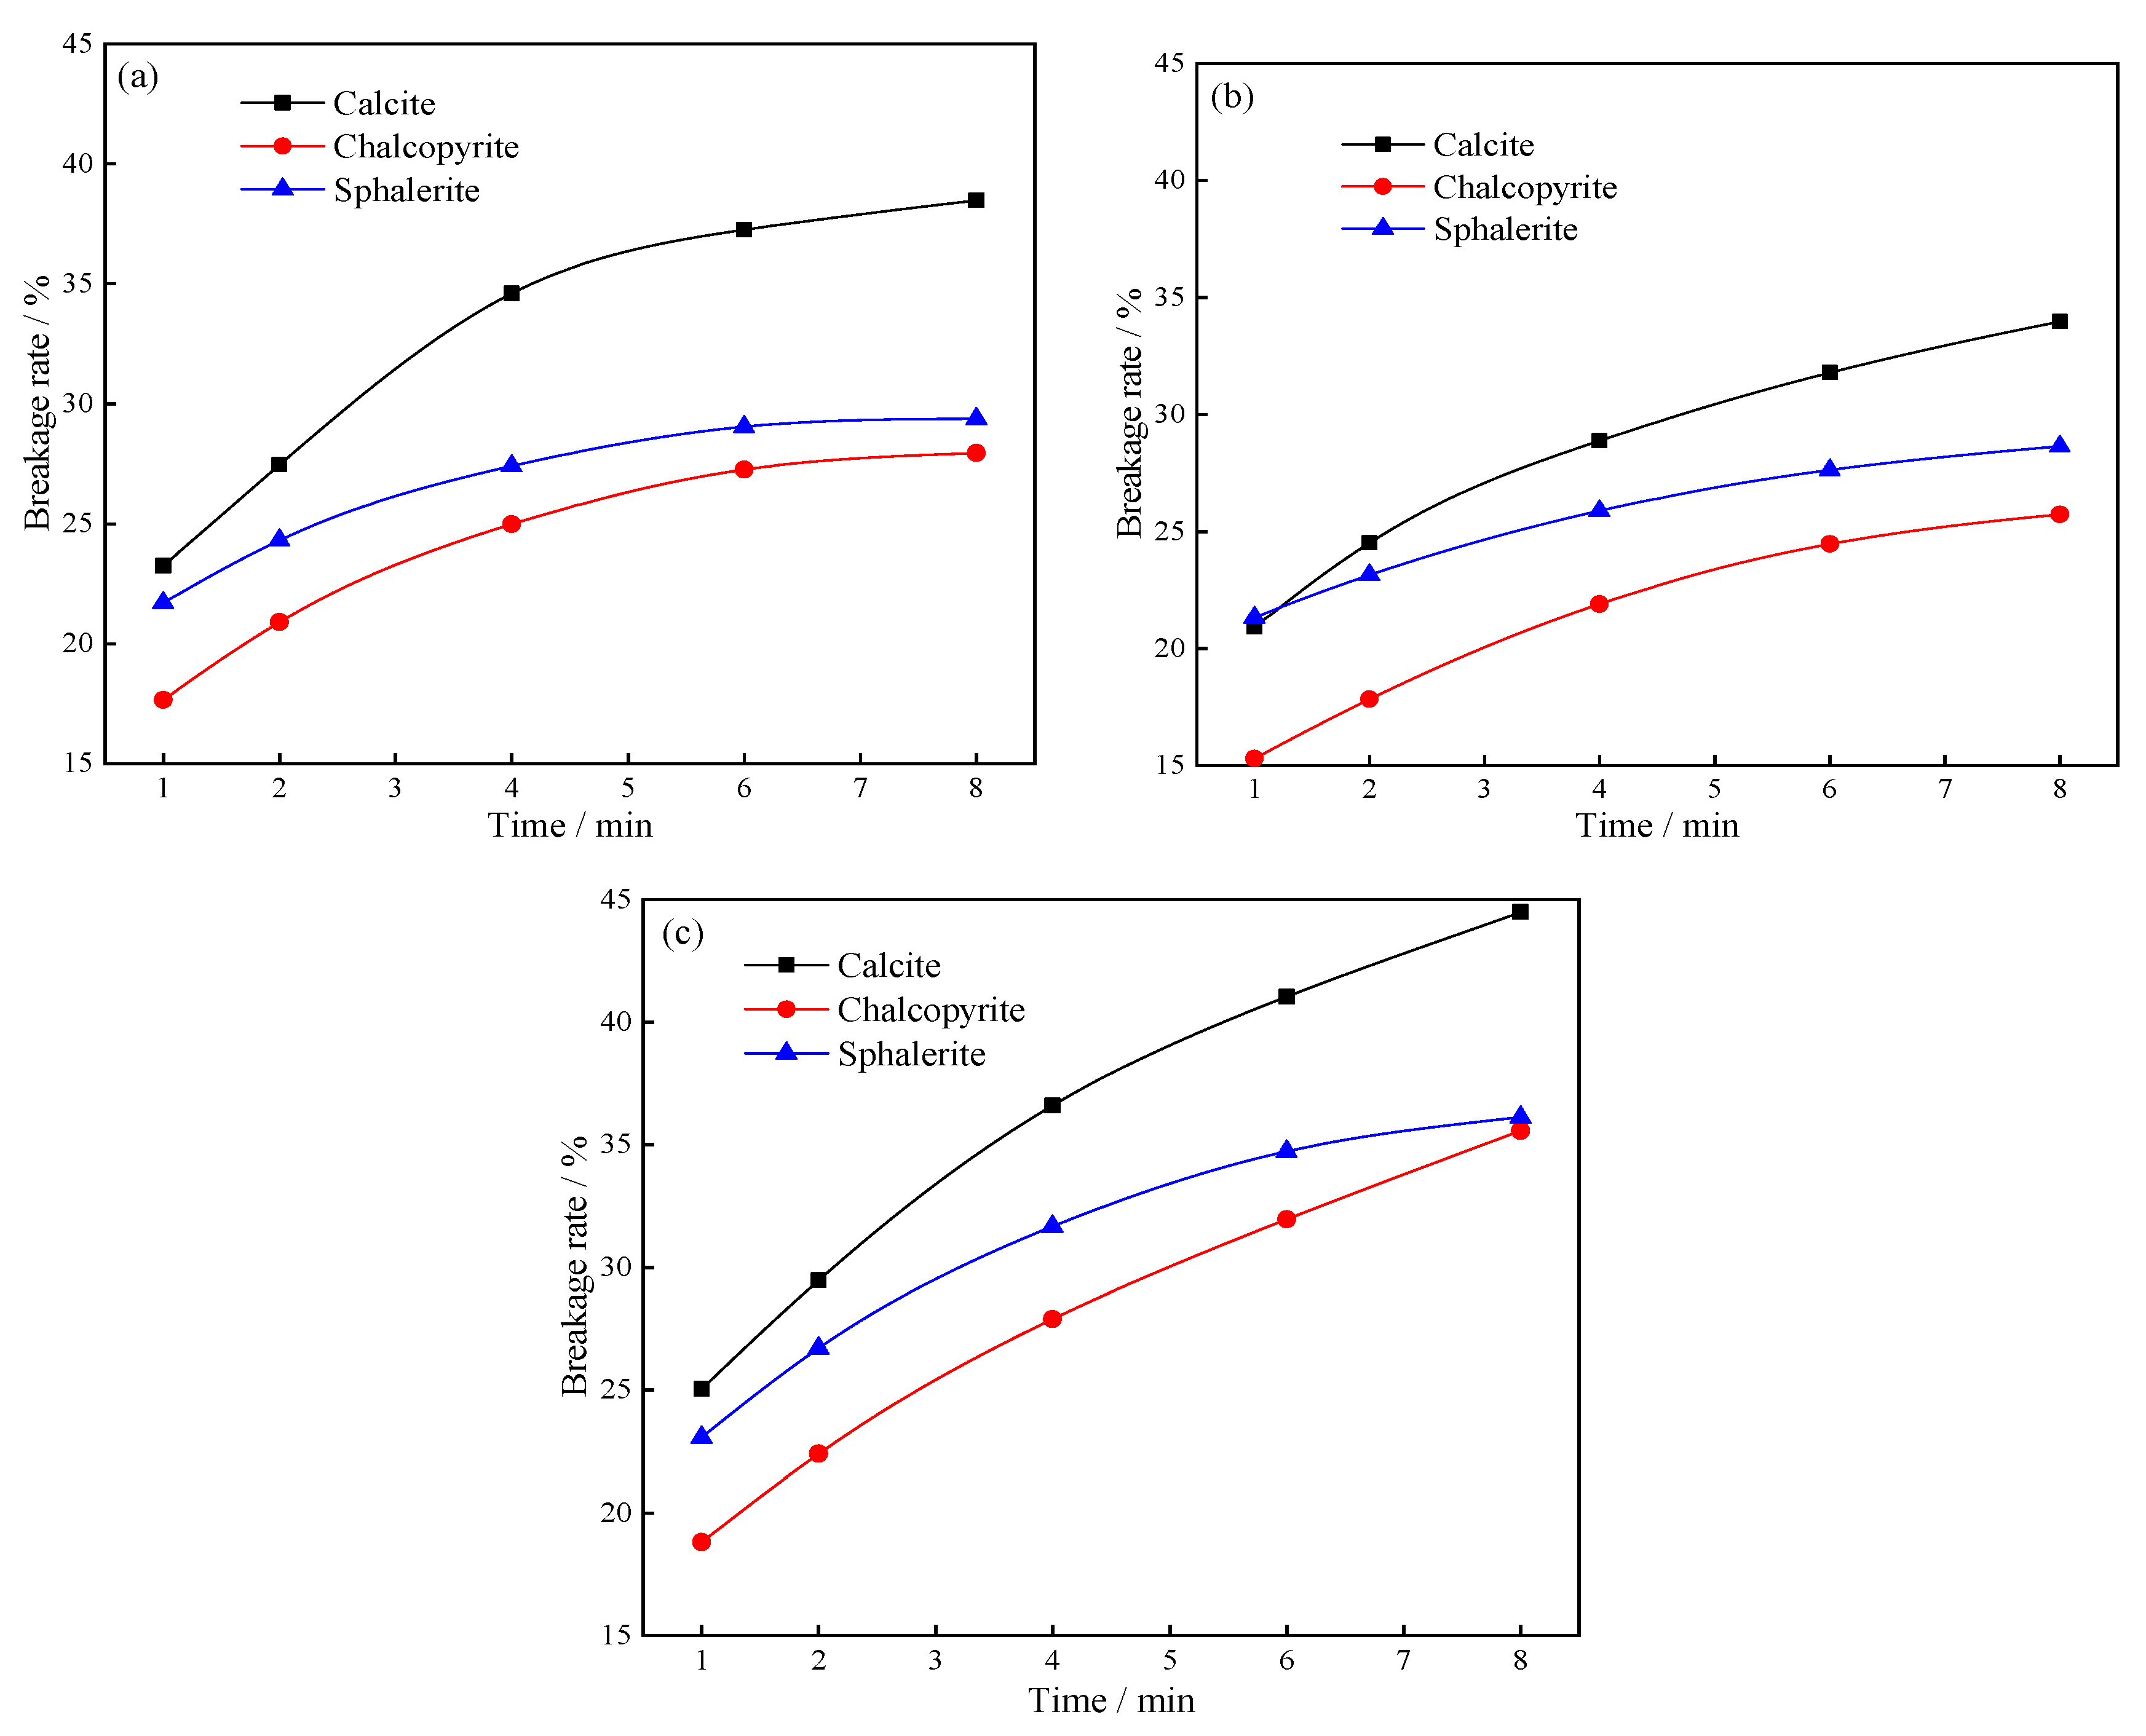
Minerals 15 00407 g013
Figure 14. Effect of grinding time on the breakage rate of three mineral ores: (a) calcite; (b) chalcopyrite; (c) sphalerite.
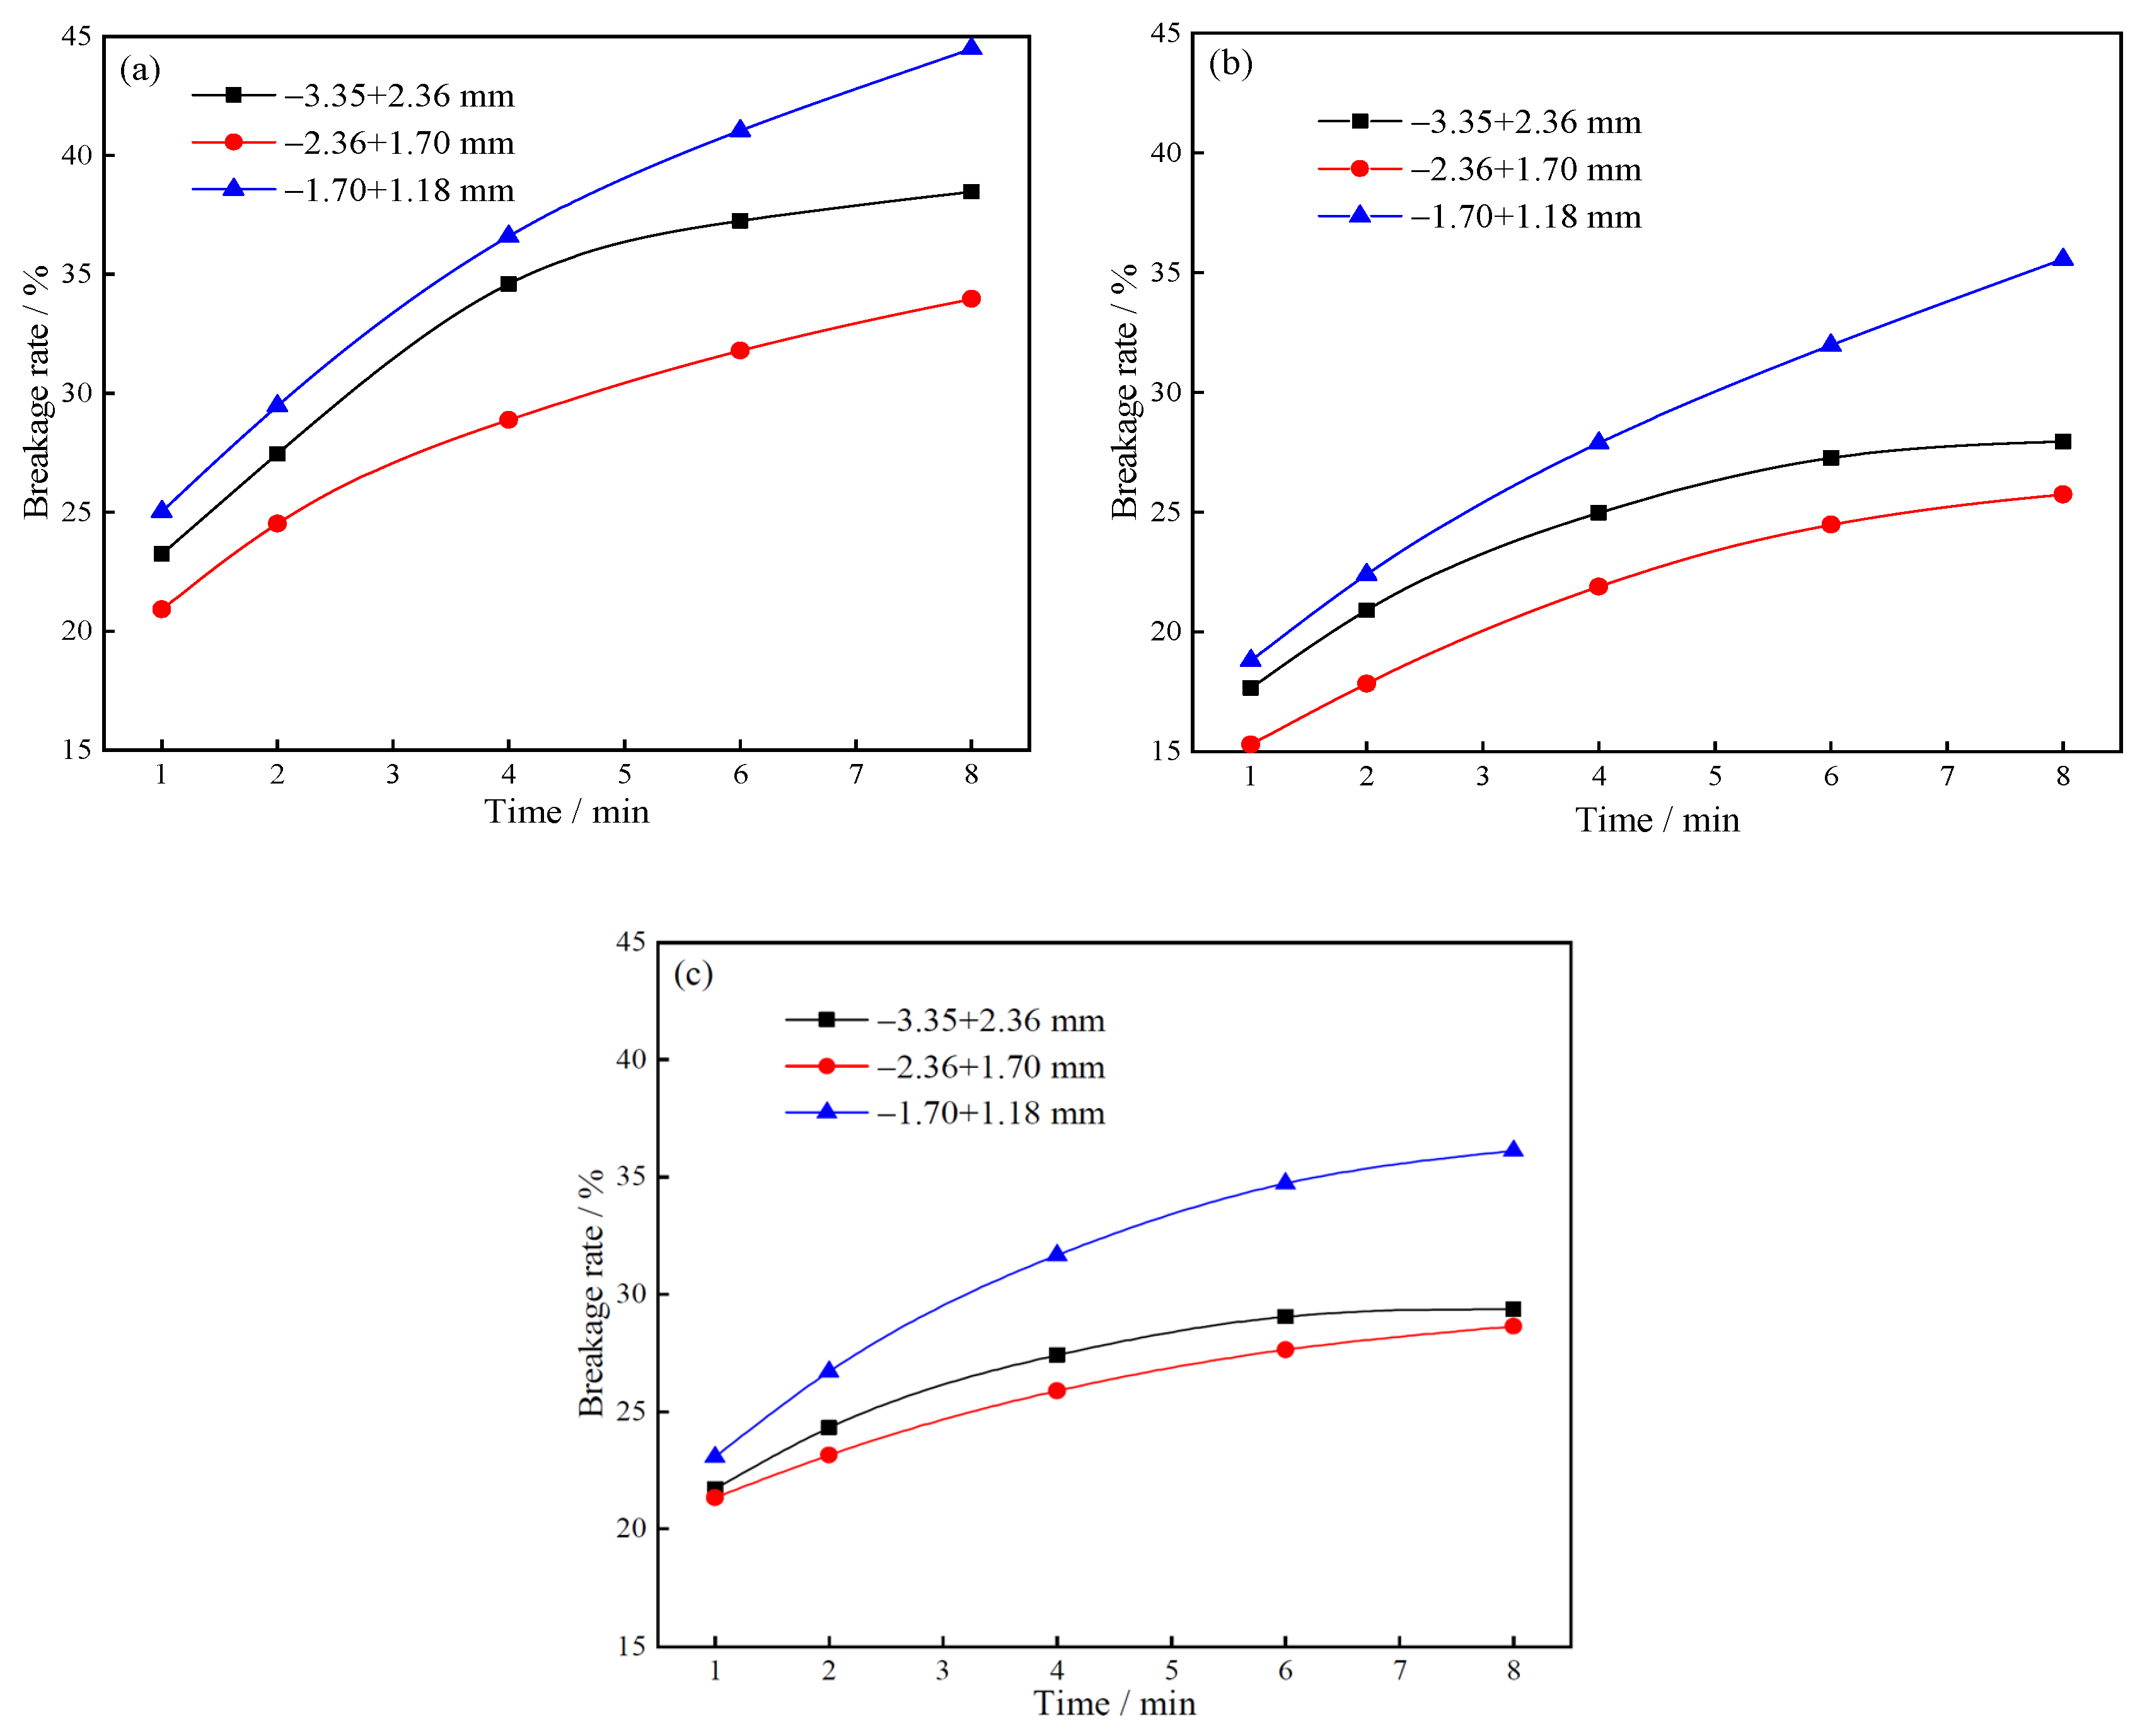
Minerals 15 00407 g014
Figure 15. Effect of grinding time on the breakage rate of different particle sizes: (a) −3.35 + 2.36 mm; (b) −2.36 + 1.70 mm; (c) −1.70 + 1.18 mm.
Minerals 15 00407 g015
Figure 16. Effect of grinding time on t10 of three mineral ores grinding products: (a) calcite; (b) chalcopyrite; (c) sphalerite.
Minerals 15 00407 g016
Figure 17. Effect of grinding time on the t10 crushed products of different particle sizes: (a) −3.35 + 2.36 mm; (b) −2.36 + 1.70 mm; (c) −1.70 + 1.18 mm.
Minerals 15 00407 g017
Figure 18. Kinetic fitting of grinding products of three mineral ores: (a) calcite; (b) chalcopyrite; (c) sphalerite.
Minerals 15 00407 g018
Figure 19. Kinetic fitting of grinding products with different particle sizes: (a) −3.35 + 2.36 mm; (b) −2.36 + 1.70 mm; (c) −1.70 + 1.18 mm.
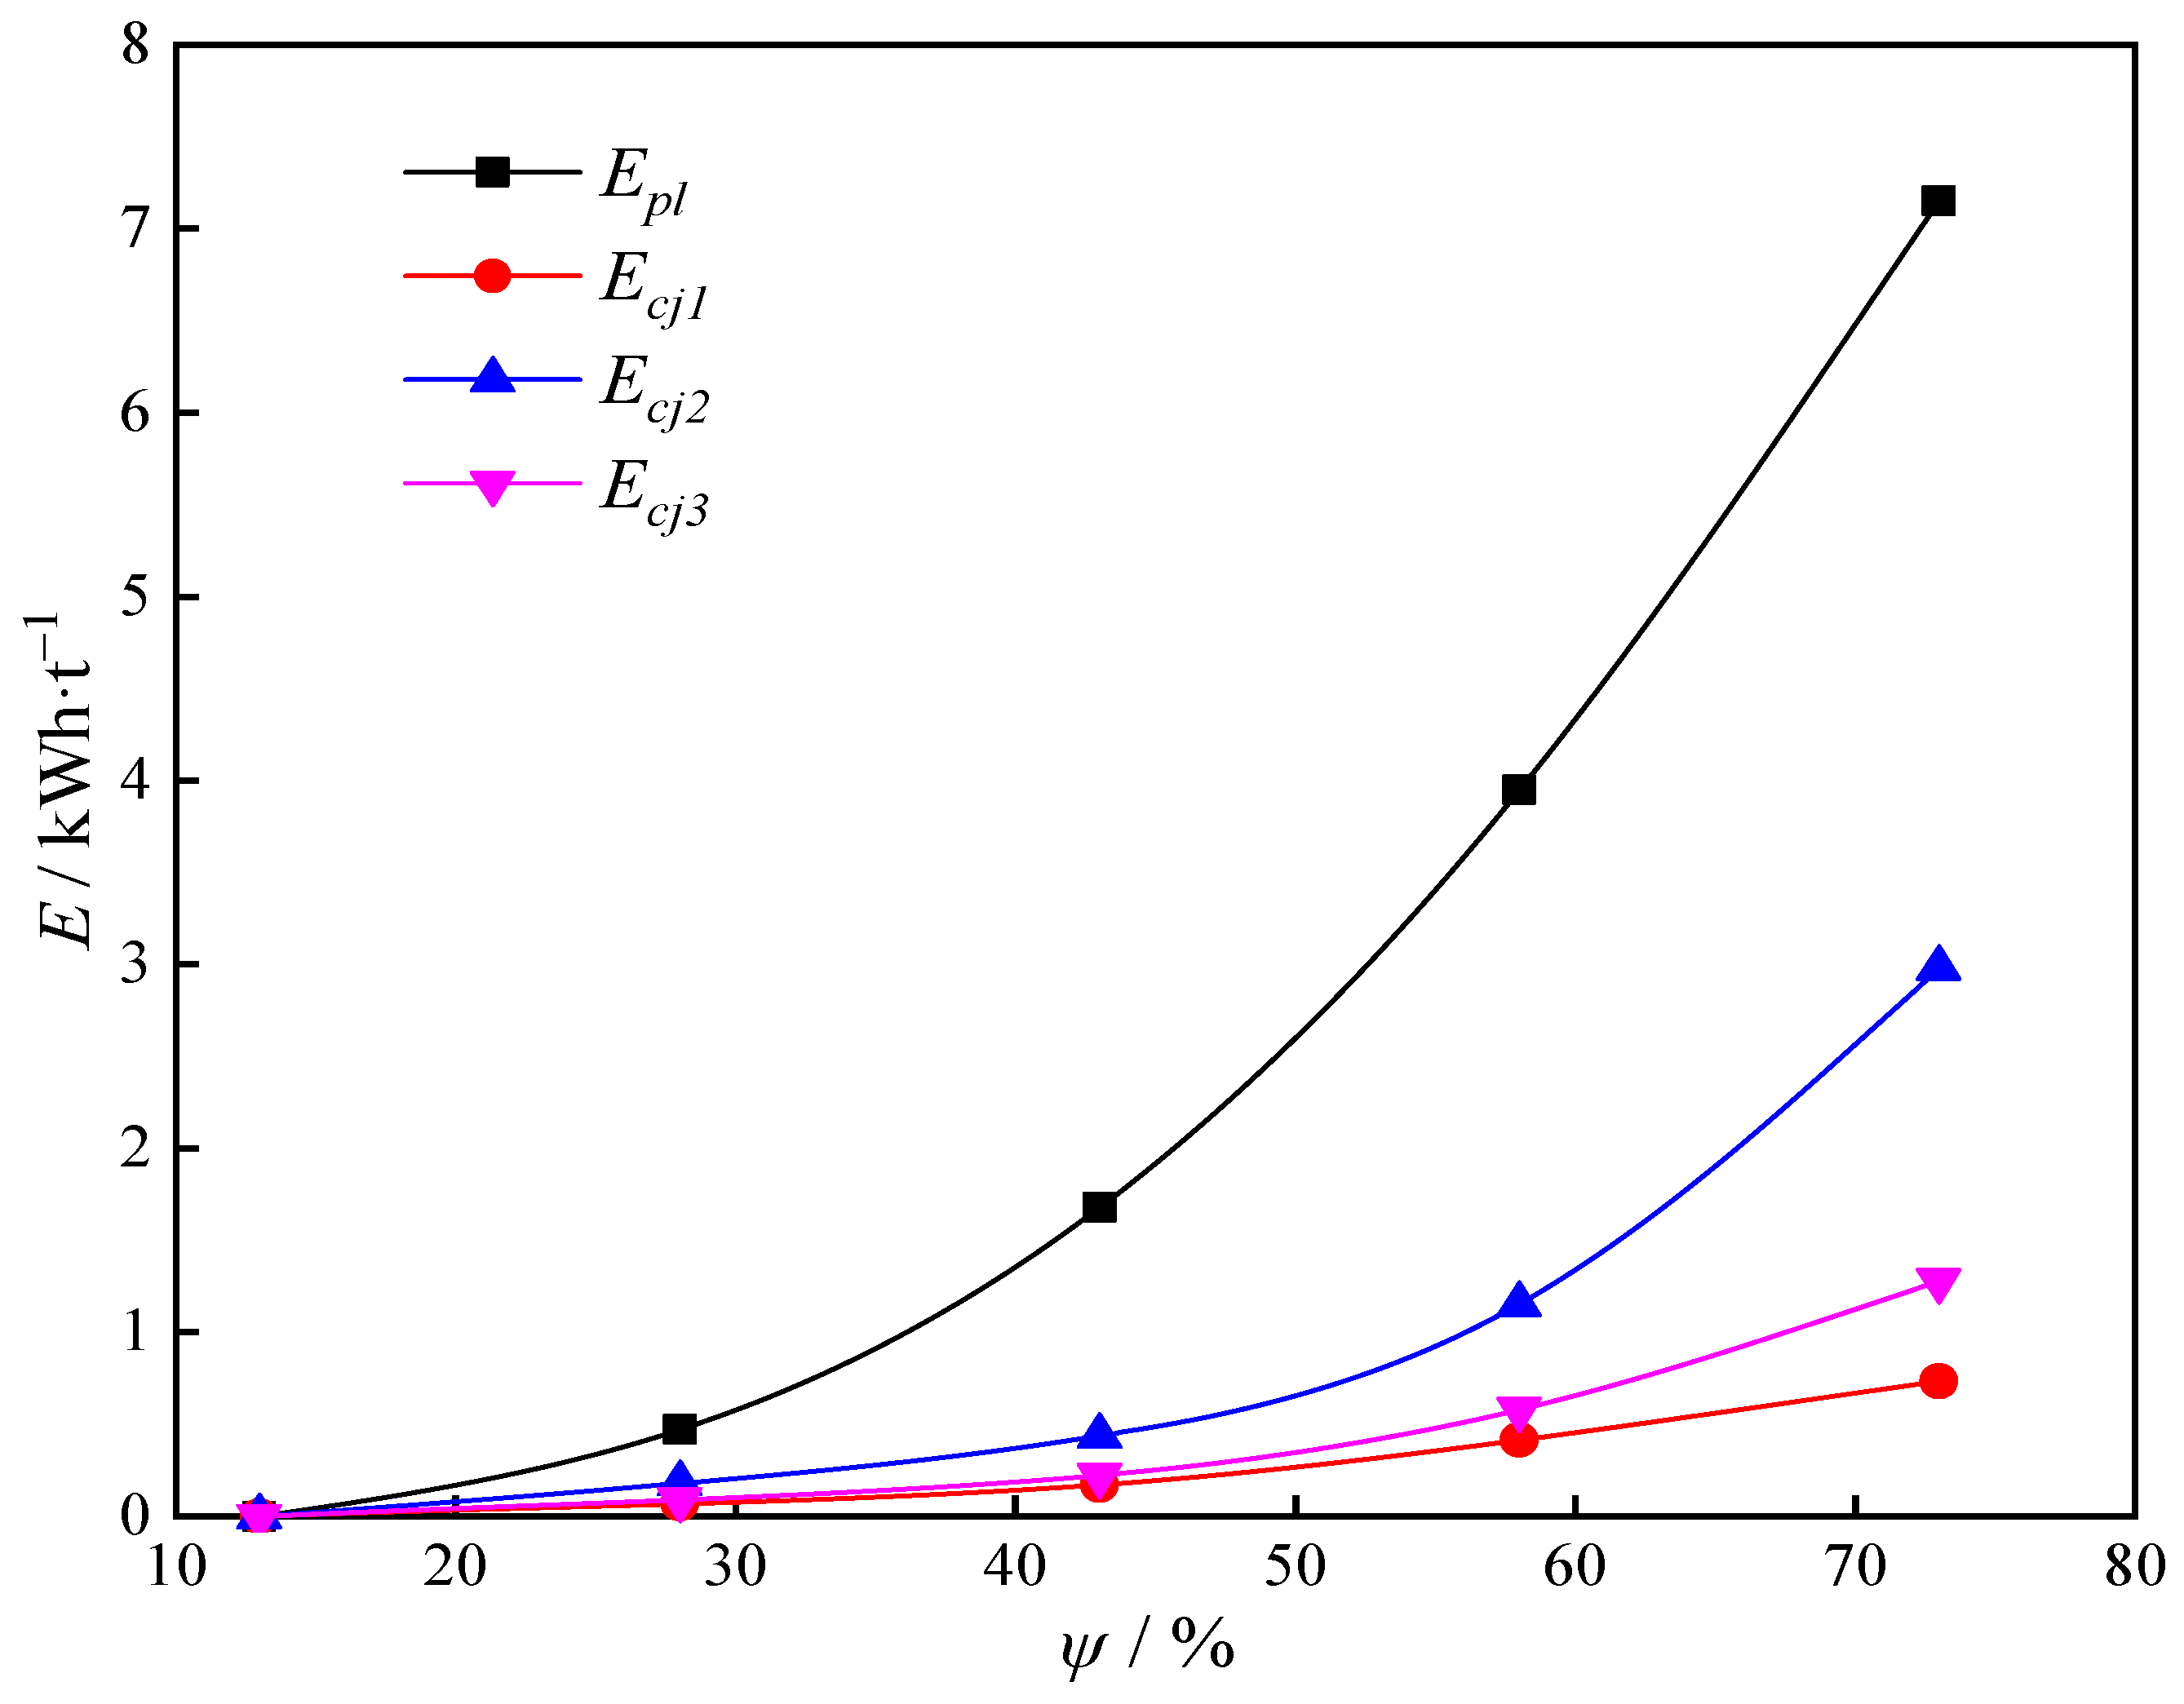
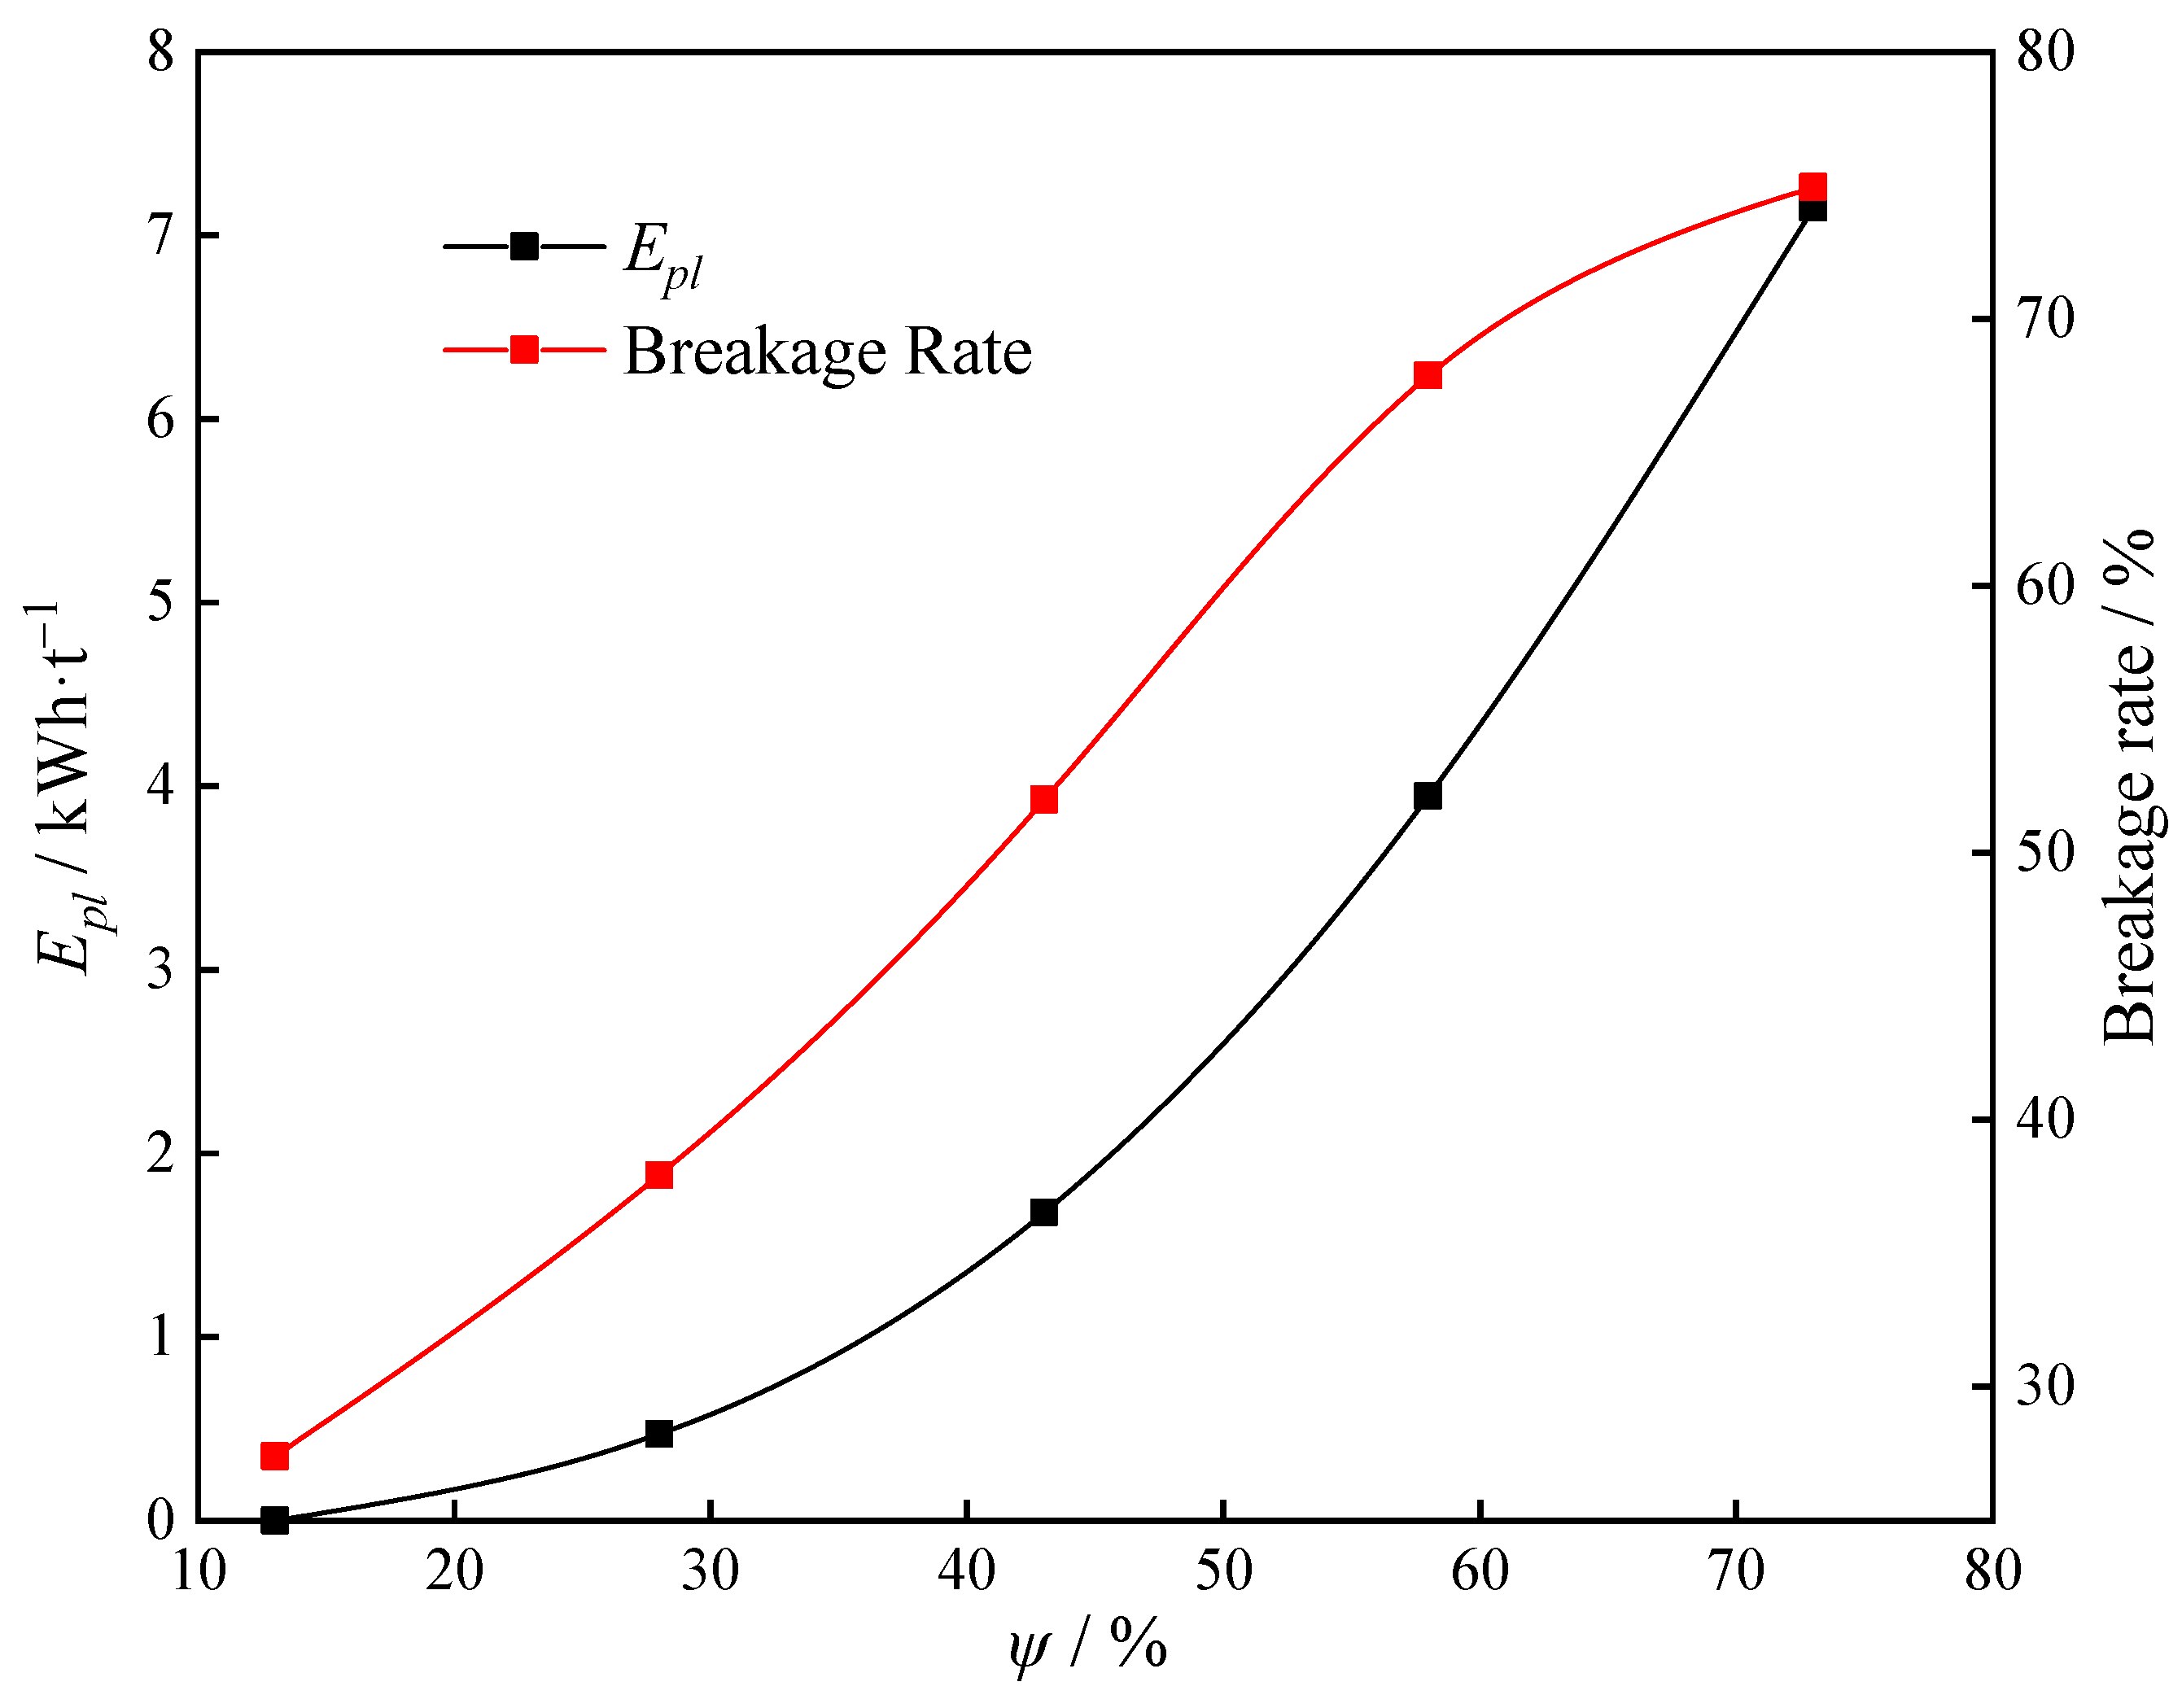
Minerals 15 00407 g019
Figure 20. The throwing-specific energy and breakage rate of calcite under different rotational rates.
Minerals 15 00407 g020
Figure 21. Effects of different rotational rates on the throwing-specific energy and impact-specific energy of calcite.
Minerals 15 00407 g021
Figure 22. The throwing-specific energy and breakage rate of chalcopyrite under different rotational rates.
Minerals 15 00407 g022
Figure 23. Effects of different rotational rates on the throwing-specific energy and impact-specific energy of chalcopyrite.
Minerals 15 00407 g023
Figure 24. The throwing-specific energy and breakage rate of sphalerite under different rotational rates.
Minerals 15 00407 g024
Figure 25. Effects of different rotational rates on the throwing-specific energy and impact-specific energy of sphalerite.
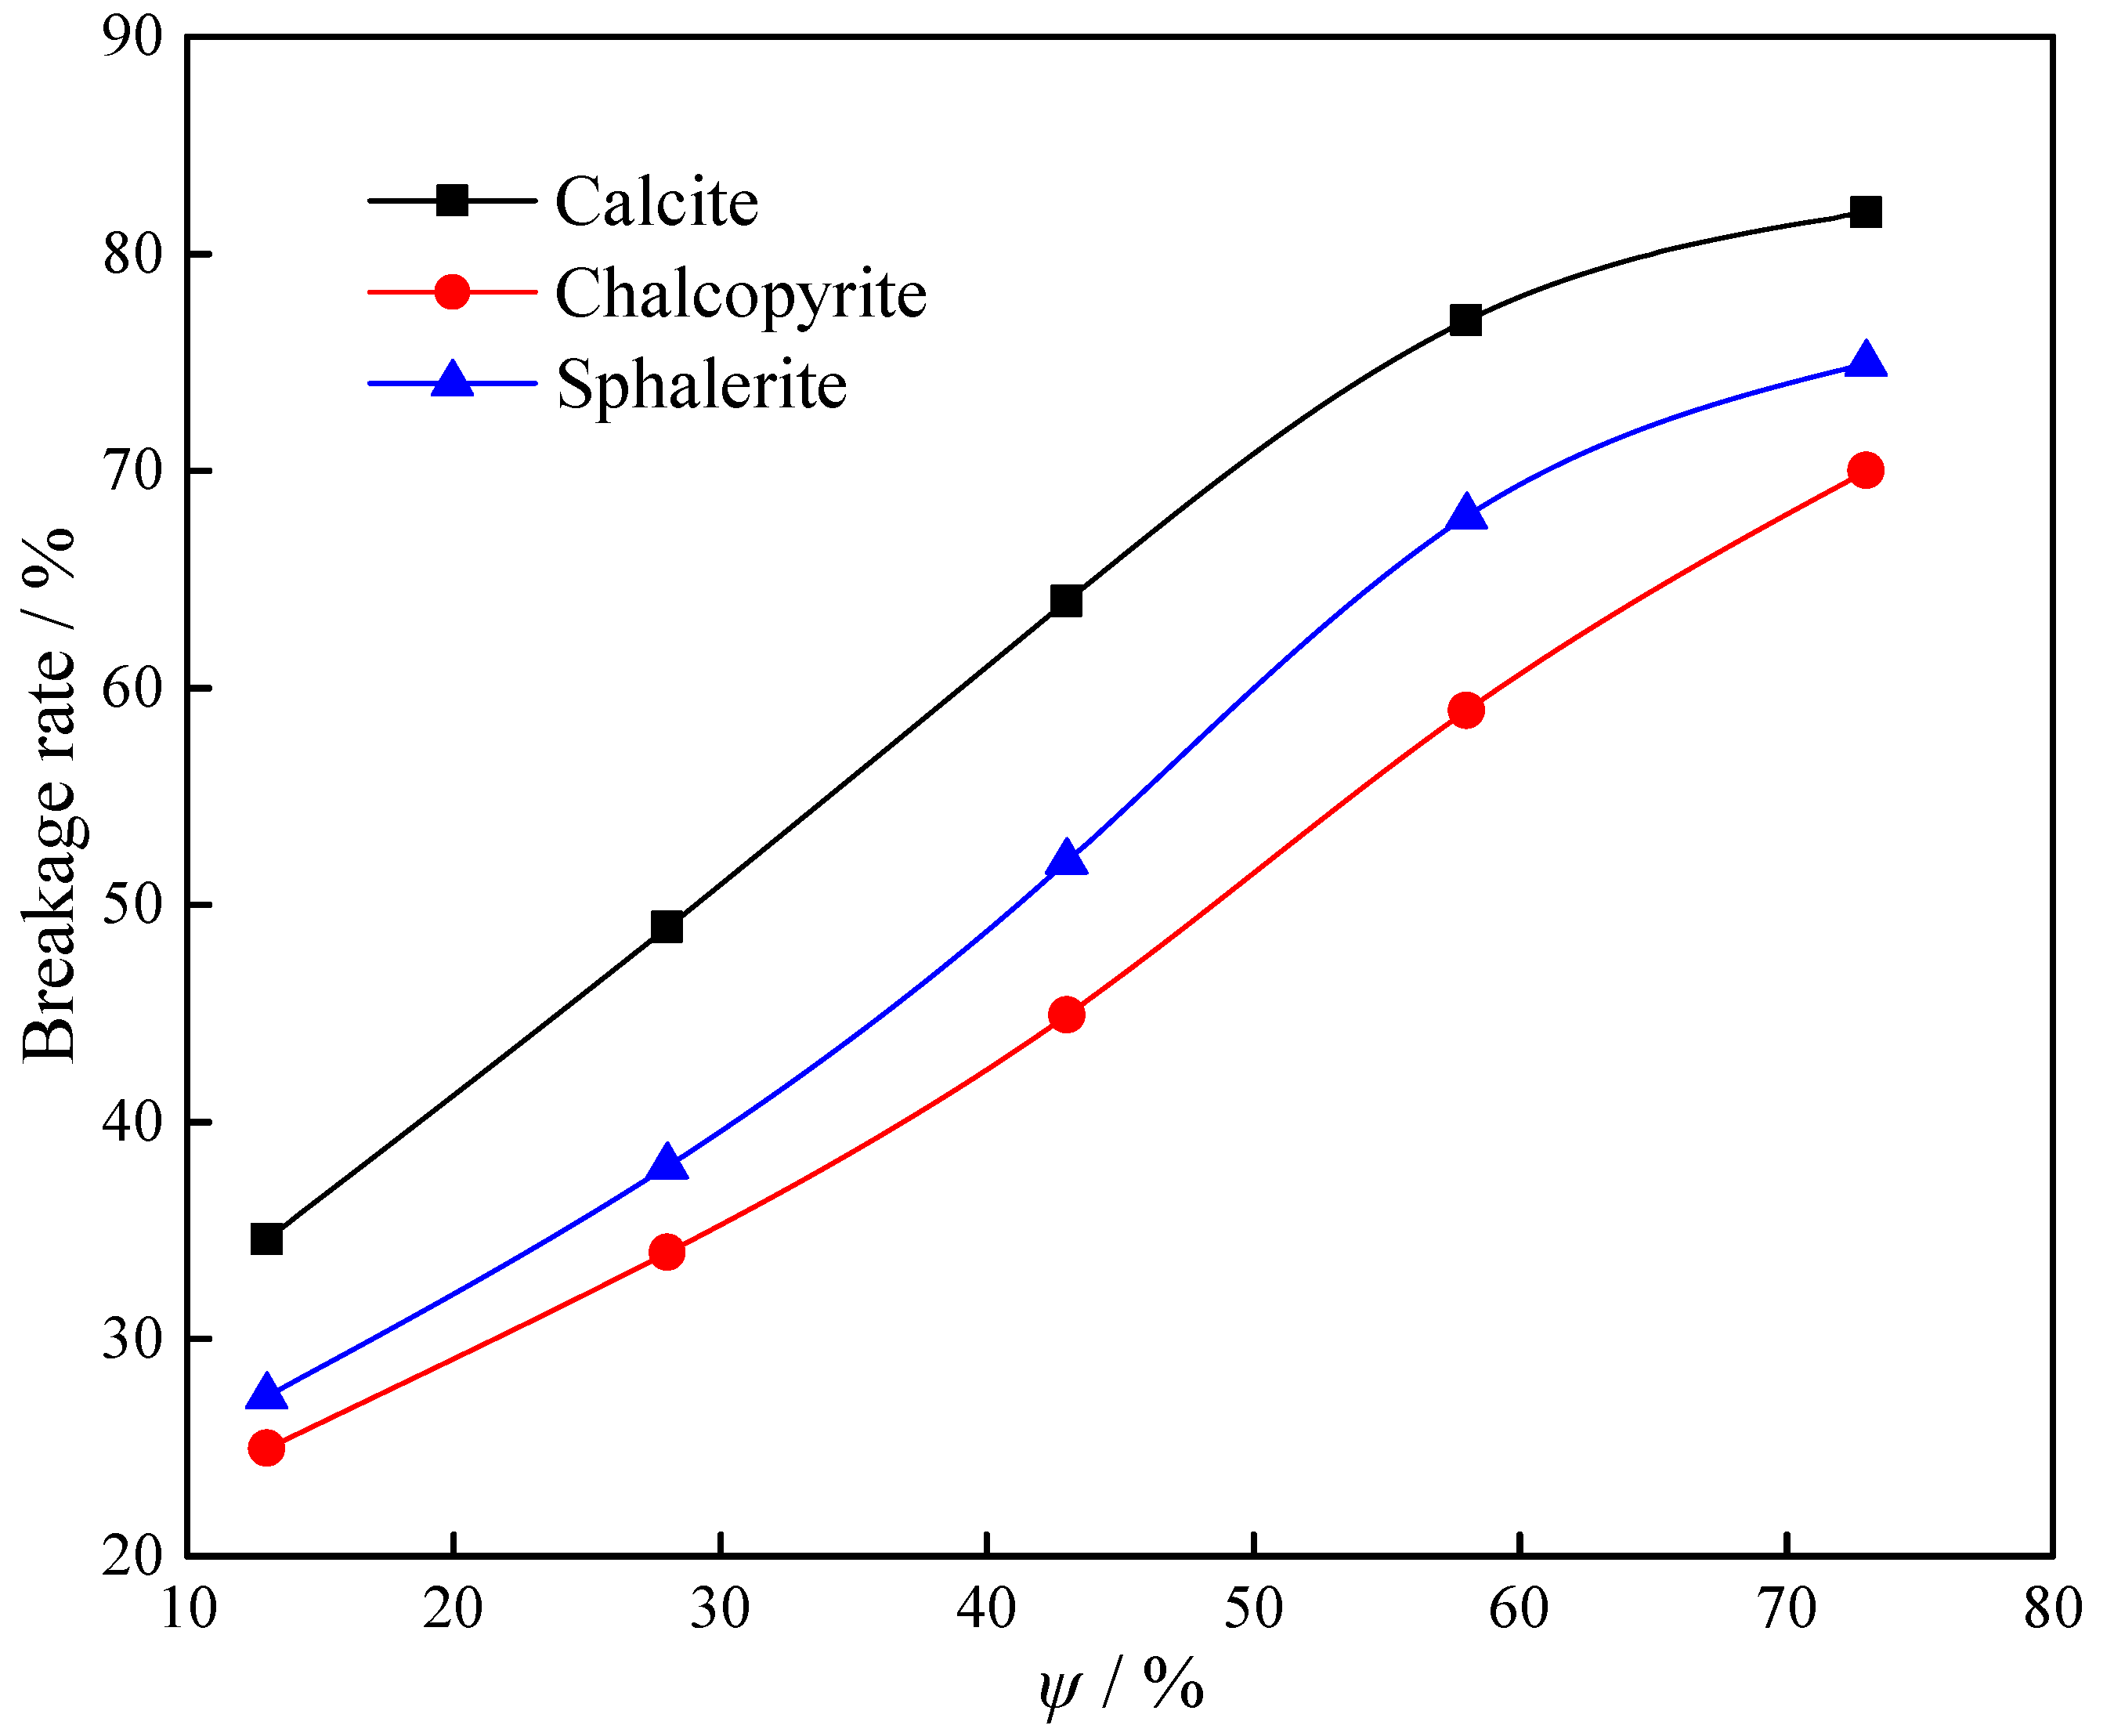
Minerals 15 00407 g025
Figure 26. Variation in three mineral ores’ breakage rates with grinding time.
Minerals 15 00407 g026
Figure 27. Variation in t10 grinding products of three mineral ores with grinding time.
Minerals 15 00407 g027
Table 1. Classification of ore resistance to impact breakage based on A x b parameter.
Class of HardnessExtremely SoftSoftMedium SoftMediumMedium HardHardExtremely Hard
A × b>12767~12756~6743~5638~4330~38<30
Table 2. Design of drop weight test.
Particle Size/mmCalciteChalcopyriteSphalerite
Ecs/(kWh/t)Number of Particles per GroupNumber of Particles per CycleEcs/(kWh/t)Number of Particles per GroupNumber of Particles per CycleEcs/(kWh/t)Number Of Particles per GroupNumber of Particles per Cycle
−63.0 + 50.50.41510.41510.4151
0.251510.251510.25151
0.11510.11510.1151
−45.0 + 37.51.02011.02011.0201
0.252010.252010.25201
0.12010.12010.1201
−31.5 + 26.52.53012.53012.5301
1.03011.03011.0301
0.253010.253010.25301
−22.4 + 19.02.53012.53012.5301
1.03011.03011.0301
0.253010.253010.25301
−15.4 + 13.22.53012.53012.5301
1.03011.03011.0301
0.253010.253010.25301
−11.2 + 9.52.56022.56022.5602
1.06021.06021.0602
0.256020.256020.25602
−8.0 + 6.72.512042.512042.51204
1.012041.012041.01204
0.2512040.2512040.251204
−5.6 + 4.752.518062.518062.51806
1.018061.018061.01806
0.2518060.2518060.251806
Table 3. Specific testing conditions to study abrasion behavior.
Rotational RateSlurry Solid ConcentrationFilling RateGrinding Times
13% of the critical speed70% w/w35%1, 2, 4, 6, and 8 min
Table 4. Specific testing conditions to study the coexistence of impact and abrasion behavior.
Rotational RateSlurry Solid ConcentrationGrinding ConcentrationFilling RateGrinding Time
13%, 28%, 43%, 58%, and 73% of the critical speed70% w/w70%35%4 min
Table 5. Fitting results of calcite crushing parameters.
Particle Size/mmABA × bFitting Equation
−63.0 + 13.268.862.97204.51t10 = 68.86 × (1 − exp(−2.97ECS))
−13.2 + 4.7562.221.3382.75t10 = 62.22 × (1 − exp(−1.33ECS))
−63.0 + 4.7563.562.52160.17t10 = 63.56 × (1 − exp(−2.52ECS))
Table 6. Fitting results of chalcopyrite crushing parameters.
Particle Size/mmAbA × bFitting Equation
−63.0 + 13.268.991.50103.49t10 = 68.99 × (1 − exp(−1.50ECS))
−13.2 + 4.7566.671.0570.00t10 = 66.67 × (1 − exp(−1.05ECS))
−63.0 + 4.7566.641.3690.63t10 = 66.64 × (1 − exp(−1.36ECS))
Table 7. Fitting results of sphalerite crushing parameters.
Particle Size/mmAbA × bFitting Equation
−63.0 + 13.270.511.62114.23t10 = 70.51 × (1 − exp(−1.62ECS))
−13.2 + 4.7568.671.0974.85t10 = 68.67 × (1 − exp(−1.09ECS))
−63.0 + 4.7568.371.4599.14t10 = 68.37 × (1 − exp(−1.45ECS))
Table 8. Fitting results of grinding dynamics.
Feed Particle SizeMineral SpeciesFitting EquationGoodness of Fit (R2)
−3.35 + 2.36 mmCalcitey = 0.01427 + 0.00211x0.986
Chalcopyritey = 0.02069 + 0.00177x0.995
Sphaleritey = 0.00523 + 0.00431x0.996
−2.36 + 1.70 mmCalcitey = 0.01024 + 0.00365x0.998
Chalcopyritey = 0.0123 + 0.00299x0.997
Sphaleritey = 0.01863 + 0.00254x0.993
−1.70 + 1.18 mmCalcitey = 0.01559 + 0.00435x0.990
Chalcopyritey = 0.01792 + 0.0038x0.993
Sphaleritey = 0.02841 + 0.00356x0.998
Disclaimer/Publisher’s Note: The statements, opinions and data contained in all publications are solely those of the individual author(s) and contributor(s) and not of MDPI and/or the editor(s). MDPI and/or the editor(s) disclaim responsibility for any injury to people or property resulting from any ideas, methods, instructions or products referred to in the content.

