Article

Reservoir Characterization and Genetic Analysis Based on Shale Lithofacies Classification: A Case Study of the Paleogene Shahejie Formation, East China

1
School of Earth Sciences and Resources, China University of Geosciences, Beijing 100083, China
2
School of Ocean Sciences, China University of Geosciences, Beijing 100083, China
*
Author to whom correspondence should be addressed.
Minerals 2025, 15(4), 406; https://doi.org/10.3390/min15040406
Submission received: 3 March 2025 / Revised: 8 April 2025 / Accepted: 10 April 2025 / Published: 12 April 2025
(This article belongs to the Section Mineral Exploration Methods and Applications)

Abstract

:
The quality of shale oil reservoirs is a major factor determining shale oil production capacity. Research on shale oil reservoirs has primarily focused on lithology. However, there has been little research on lithofacies classification. Moreover, there is still a lack of research on potential reservoir differences between different lithofacies and their controlling factors. In this context, the present study aims to classify the lithofacies of shale oil reservoirs in the Paleogene Shahejie Formation of the Jiyang Depression using different methods, including rock core and thin section observations, scanning electron microscopy (SEM) analysis, and X-ray diffraction (XRD). In addition, the characteristics and genesis of the high-quality shale oil reservoirs were studied using three-dimensional micro-CT scanning, low-pressure nitrogen adsorption, high-pressure mercury injection, and core physical property testing. The results showed better physical properties of combined shale and lenticular crystal limestone (C1), continuous parallel planar calcareous mudstone and uncontinuous laminate mudstone (C2), and continuous parallel planar calcareous mudstone and laminate mudstone (C3) compared with those of the other lithofacies; C1 exhibited the best physical properties. These three combined lithofacies consisted mainly of interconnected pores with medium and large pore throats, as well as fractures; the pore size mainly ranged from nanometers to micrometers. The high-quality reservoir conditions in combined lithofacies are the result of both basic sedimentary lithofacies and diagenetic history. The results of the current study provide new ideas and a useful reference for future related studies on mud shale reservoirs.

1. Introduction

With advancements in drilling and fracturing technology, shale oil, an unconventional oil and gas resource, has become a significant alternative energy source [1,2]. Shales are fine-grained sedimentary rocks with complex mineral compositions, textures, and structural features, often represented by distinct differences in lithofacies [3]. Many research examples have shown that the pore throat systems and properties of shale reservoirs are largely dependent on lithofacies [4,5,6]. However, studies on characterizing pore structures for different lithofacies are still rare. This significantly hinders the development of shale reservoir theory and oil and gas exploration.
Reservoir quality is a key indicator of shale oil production capacity, which is important for shale oil/gas exploration and development [7,8,9,10]. Previous shale reservoir characterization studies focused particularly on technical and methodological aspects, especially testing and characterization techniques, including nitrogen adsorption [5], carbon dioxide adsorption, nuclear magnetic resonance, and neutron scattering. In addition, several effective characterization methods have been employed to characterize the complexity and heterogeneity of shale pore structures, such as fractal theory and fractal dimensions, providing a comprehensive understanding of shale reservoirs [11,12,13,14]. However, there are still inconsistencies in the results related to the genesis of pore structures in shale reservoirs. This is mainly because many related studies have rarely considered the initial lithofacies classification and genesis at different levels of shale reservoirs in terms of pore structure characterization. In terms of the study of lithofacies of shale reservoirs, a large number of scholars have conducted beneficial exploration and development of the division of lithofacies and lithofacies association in lacustrine shale reservoirs [15,16,17]. Most scholars have agreed that the mineral composition, sedimentary texture, and organic carbon content are the core basis for the division of lithofacies, especially sedimentary textures such as laminae and stratifications, which are crucial for the characterization of lithofacies differences [18,19]. Meanwhile, lacustrine shale lithofacies with sandstone or carbonate interlayers can be divided into different lithofacies associations according to the vertical overlapping relationship between shale rocks and interlayer types. The division of lithofacies associations is of great significance to reveal the sedimentary genetic environment and diagenetic evolution process [20,21]. Therefore, reservoir characterization based on lithofacies classification is essential to explain the causes of pore throat structure variations in shale reservoirs and to identify the primary controlling factors governing the formation of high-quality reservoirs.
In reservoir studies, physical properties are important parameters to reflect reservoir quality. Porosity and permeability are often used to describe the difference in reservoir quality in conventional reservoirs [22]. For shale reservoirs, numerous studies have demonstrated that complex mineral composition and diverse sedimentary structures are the key factors directly influencing shale reservoir quality [23,24]. An increase in quartz and feldspar content facilitates the development of felsic bands and the formation of reservoir spaces, including intergranular pores and feldspar dissolution pores [25]. Carbonate minerals in shale promote the development of intercrystalline pores, which can also improve the formation of fractures in the reservoir [26]. Similarly, an increase in clay mineral content is beneficial the preservation of organic matter [27]. Thus, a significant number of microscopic matrix pores are formed in shale reservoirs, while the presence of sedimentary structures further amplifies the complexity of the pore structure. Currently, the characteristics and distribution of pore structures in shale have become critical indicators for assessing reservoir and evaluating the exploration and development potential of shale reservoirs [28,29]. Furthermore, studies on complex pore structures and hydrocarbon occurrence in shale have revealed that pore composition and size distribution vary significantly across different lithofacies types [28]. This variation is attributed to the fact that the mineral composition and sedimentary structure differences are controlled by the sedimentary environment, hydrodynamic conditions, paleoclimate changes, and diagenesis, which are the same factors governing shale lithofacies [30,31]. Therefore, it is essential to investigate the genesis of high-quality reservoirs by integrating the formation conditions of favorable lithofacies with the correlation between pore structure and lithofacies. However, most previous studies have considered lithofacies only as a single factor in shale reservoir formation, which limits a comprehensive understanding of reservoir quality. The study of shale oil reservoirs is of great significance for shale oil exploration and development. These reservoirs exhibit complex pore structures and wettability variations, resulting in highly complex oil migration behavior within nanopores systems [7,32].
The Bohai Bay Basin in China hosts abundant organic-rich shales within its Paleogene sediments, positioning it as one of the most promising regions for shale oil exploration and development [33,34]. In recent years, extensive research has been conducted to characterize shale reservoirs in the Jiyang Depression of the Bohai Bay Basin; however, most studies have been based on different lithological classifications [13,35,36,37]. These studies often incorporate reservoir spaces at multiple scales into single and simplistic rock models, resulting in ambiguous explanation for the differences in the genesis of reservoir physical properties. With the introduction of the shale lithofacies concept, numerous studies on lithofacies have been carried out in the Jiyang Depression in recent years [16,38,39,40,41]. Most scholars agree that significant differences in the initial lithofacies are the primary factor driving differences in pore types and structures of shale reservoirs. Nevertheless, inconsistencies in lithofacies division schemes persist due to different division criteria. Additionally, research on reservoir characterizations based on lithofacies identification and classification remains limited, and comparative analysis of reservoir differences between different lithofacies and their controlling factors are still lacking. In this context, this study focuses on characterizing reservoirs of different shale lithofacies of the Shahejie Formation in the Jiyang Depression by integrating lithofacies and lithofacies classification with a suite of advanced analytical techniques, including scanning electron microscopy (SEM), X-ray diffraction (XRD) analysis, micro-CT, high-pressure mercury intrusion, and nitrogen adsorption. In addition, this study further discusses potential variations in reservoir space types and quality across different lithofacies, providing insights into the genetic analysis of high-quality reservoirs. The findings of this study offer a valuable foundation for future genetic analysis and evaluations of high-quality shale reservoirs.

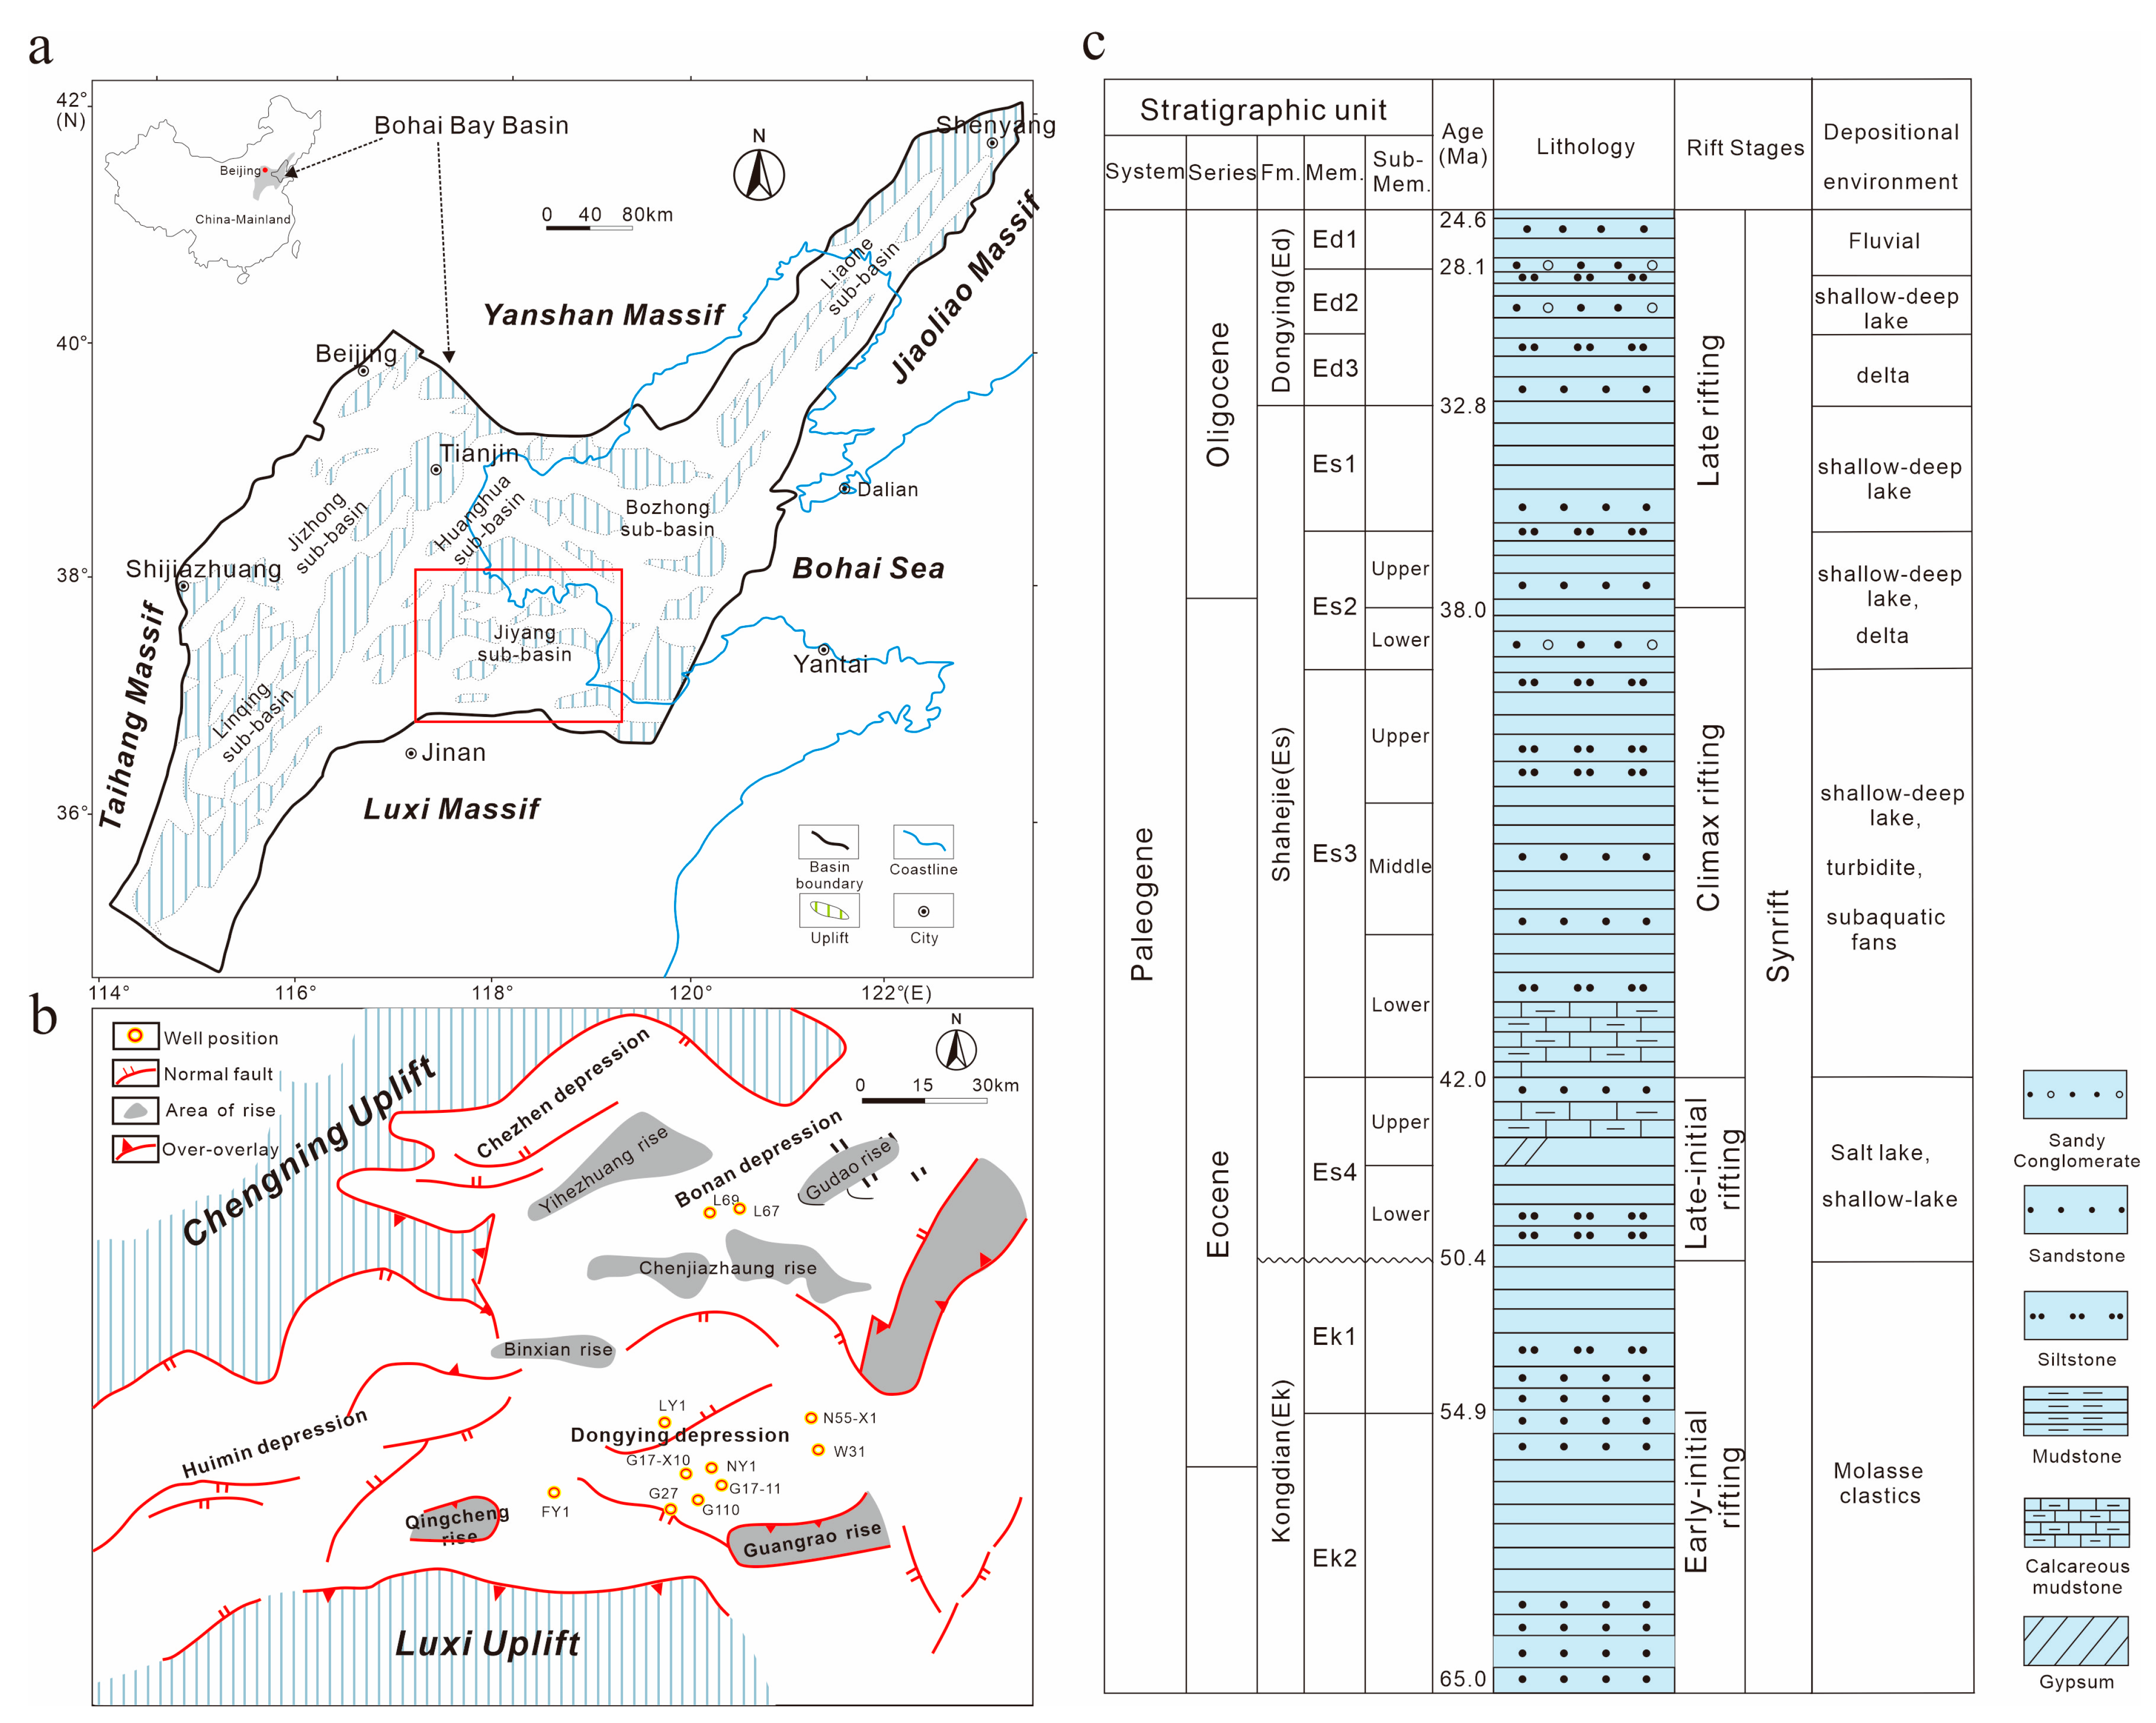
2. Geological Setting

The Jiyang Depression is a major depression in the southeastern part of the Bohai Bay Basin in East China. It is bordered by the Tan-Lu Fault Zone, Chengning Anticline, and Luxi Uplift to the east, northwest, and south, respectively. This depression forms a rifting and wrenching complex basin of the Mesozoic and Cenozoic on the basement of the North China Plate [37,42]. The Jiyang Depression is composed mainly of several uplifts between the Chezhen, Zhanhua, Huimin, and Dongying sags, covering a total area of about 2.5 × 10⁴ km2, of which the Dongying Sag covers the largest area of about 6000 km2 [43]. These sag structures are manifested mainly as half-graben basins with north-dipping and south-overlapping characteristics (Figure 1a,b).
The basement of the Jiyang Depression is composed of the Oligocene, Eocene, and Paleocene series, including the sedimentary Kongdian, Shahejie, and Dongying formations. This research region has been in a lake-deltaic environment since the Pleogene, where sandstone, mudstone, and shale are the main lithological classes, accompanied by small proportions of gypsum and carbonate rocks, with a total thickness of approximately 3000 m. On the other hand, the thickness ranges of the Neogene and Paleogene layers are about 700–1000 m and 1000–2100 m, respectively [44,45,46]. The organic-rich mud shales in the Jiyang Depression are distributed mainly in the Shahejie Formation, which can be classified into four members from the upper to the lower parts (Es4, Es3, Es2, and Es1). The lower Es3 and upper Es4 members are the main shale oil reservoirs, exhibiting abundant organic-rich mud shale resources as well as high amounts of laminated carbonate rocks, mainly occurring in the form of interbedded mud shales [47].
The Shahejie and underlying Kongdian formations are in unconformity contact, indicating an angular unconformity relationship. On the other hand, these formations are in conformity contact with the Dongying Formation. The upper parts of the Kongdian and Dongying formations consist mainly of large mudstone and sandy mudstone formations, respectively. The lower part of the Es4 member consists of interbedded mudstone, dolomitic mudstone, and argillaceous limestone, while the upper part of the Es4 member consists of interbedded mudstone, limestone, and argillaceous limestone deposited in semideep lake, coastal shallow lake, and saline water environments [48,49]. The Es3 member is divided into three submembers, of which the lower subzone is composed mainly of dark gray mudstone, lime mudstone, and marl limestone, with interbedded carbonate rocks. This segment represents the sedimentary environment of the deep lake, semideep lake, and saline to semisaline water facies (Figure 1c) [49].

3. Data Collection and Methodology

The data used in this study were divided into two parts, namely data collection and measurement. The actual measurement data included rock core observations and sample testing at 11 drilling wells (L67, L69, FY1, GX27, G110, G17-11, G17-X10, N55-X1, W31, NY1, and LY1) in the Jiyang Depression (Figure 1b). The rock cores were analyzed using several techniques, including microscopy (N55-1, FY1, L69, NY1, LY1, N55-X1), scanning electron microscopy (N55-X1, GX27, L67, L69, G110, FY1, W31), and micro-CT (L69). The sample testing included mainly low-pressure nitrogen adsorption (G17-X10, G17-11), high-pressure mercury intrusion experiments (FY1), and XRD (L67, L69, G110). Core testing porosity, permeability, total organic carbon (TOC), and XRD from four drilling wells, namely FY1, NY1, L69, and N55-X1, were supplied by the Shengli Oilfield Research Institute of China Petroleum and Chemical Corporation (Shangdong, China).

3.1. Core Observation

Core observation included mainly core observation in the core library, microscopic thin section observation, and argon ion polishing field emission scanning electron microscopy (SEM). Argon ion polishing and field emission scanning electron microscopy can be used to identify nanomicron scale pores and fractures. The samples were pretreated using the argon ion polishing technique prior to the SEM observations to improve the resolution of the microscope images. The pretreatment was carried out at the Key Laboratory of Unconventional Oil and Gas Geology of the China Geological Survey using a Buehler Auto-metTM 300 (Lake Bluff, IL, USA) fully automatic polishing instrument. The argon ion polishing samples were prepared using a Leica EM TIC 3X (Wetzlar, Germany) triple-ion beam cutting instrument.
Field emission scanning electron microscopy was employed in this study to assess the structure, composition, and pore structure and distribution of the shale oil reservoirs. The analyses were conducted at the SEM laboratory of the China University of Geosciences (Beijing, China). The composition of the target area was analyzed using an energy dispersive spectrometer (EDS). In total, 15 samples from seven wells (L69, L67, N55-X1, FY1, GX27, G110, and W31) were analyzed using the SEM technique (Table 1).

3.2. X-Ray Diffraction (XRD)

In this study, X-ray diffraction analysis was conducted at the Beijing Research Institute of Uranium Geology using the Panalytical X’Pert PRO X-ray diffractometer (Malvern, UK). The analysis was conducted based on the SY/T5163-2018 standard analysis method for clay and nonclay minerals of sedimentary rocks. The XRD method was employed to analyze the mineral composition types of the Shahejie Formation in the Jiyang Depression. The samples used in this study were derived from the rock core library samples of Sinopec Shengli Oilfield. A total of 37 samples from three drilling wells (L67, L69, and G110) were analyzed. The same sample can exhibit different testing positions in the XRD analysis, of which location 1 and 2 represent the bright and dark-colored bands of the sample, respectively (Table 2). In addition, a total of 1062 samples from three wells, including 214, 49, and 799 samples from L69, NY1, and FY1, respectively, were further analyzed using XRD.

3.3. Three-Dimensional Micro-CT Scanning (Micro-CT)

Three-dimensional micro-CT was conducted at Nanjing Hongchuang Geological Exploration Technology Service Co., Ltd. (Nanjing, China). The micro-CT uses mainly cone beam X-rays to penetrate rock samples. A large amount of attenuated X-ray signals was obtained by rotating samples through 360 degrees. The object fault images can be obtained following the reconstruction of an algorithm. In this study, two rock samples, namely L69-CT1 and L69-CT2, were collected from the L69 well at depths of 3062.2 and 3026.5 m, respectively. The rock samples were processed into an approximate cuboid of approximately 10 × 10 ×15 cm before further analysis.

3.4. Low-Pressure Nitrogen Adsorption

Low-pressure nitrogen adsorption is the most commonly used and reliable method for determining the specific surface area and pore size distribution. A total of 12 samples from two wells (G17-X10 and G17-11) were considered in the low-pressure nitrogen adsorption test. The low-pressure nitrogen adsorption experiment was conducted in this study using quantum instruments from the United States in the laboratory of China University of Petroleum (Beijing, China). Before the experiment, the sample was ground and sieved through 40–80 mesh (198–350 μm) and then subjected to gradually increased pressure at a temperature of 77.3 K until reaching the saturated vapor pressure of nitrogen and then gradually decreased. The amount of nitrogen adsorbed was measured at different relative pressures (P/P0) to determine the nitrogen adsorption/desorption isotherm. The specific surface area, pore volume, and pore size distribution corresponding to the adsorption capacity were calculated using existing experimental models and formulas. Specific surface areas have been commonly used to characterize pores with diameters lower than 50 nm, representing the total surface area per unit mass of the material skeleton [50]. The nitrogen-adsorption-based specific surface areas measured in this study correspond to the sums of the connected pore areas to the outer and inner surfaces of the particles that gas molecules can reach [51]. The nitrogen-adsorption-based specific surface area was calculated using the Brunauer–Emmett–Teller (BET) method, while the pore volume and pore size distributions were obtained using the Barrette–Joyner–Halenda (BJH) method [51].

3.5. High Pressure Mercury Intrusion Test

In total, 10 samples from the FY1 well were subjected to the high-pressure mercury intrusion test to determine pore volume. The high-pressure mercury intrusion test was conducted in the laboratory of Northeast Petroleum University using a Micromeritics Auto Pore IV 9520 (Norcross, GA, USA), with pressure and pore throat radius ranges of 10,000–61,000 psia and 3 nm–100 µm, respectively. The test was carried out according to the petroleum and natural gas industry standards of the People’s Republic of China, namely the Core Sampling and Analysis Methods (SY/T 5336-2006) and Rock Capillary Pressure Measurement (SY/T 5346-2005) [52,53]. Ten samples were pretreated at the early stage of the experiment. They were cut into 1 cm long cubes at the Institute of Geology and Geophysics, Chinese Academy of Sciences. The 10 samples were first oven-dried at 60 °C for over 48 h before the mercury intrusion test and then cooled in a dryer at a temperature relative humidity of 23 °C and less than 10%, respectively. The total pore volume and pore throat diameter distribution of the sample were obtained based on the physical constants of mercury.

4. Results

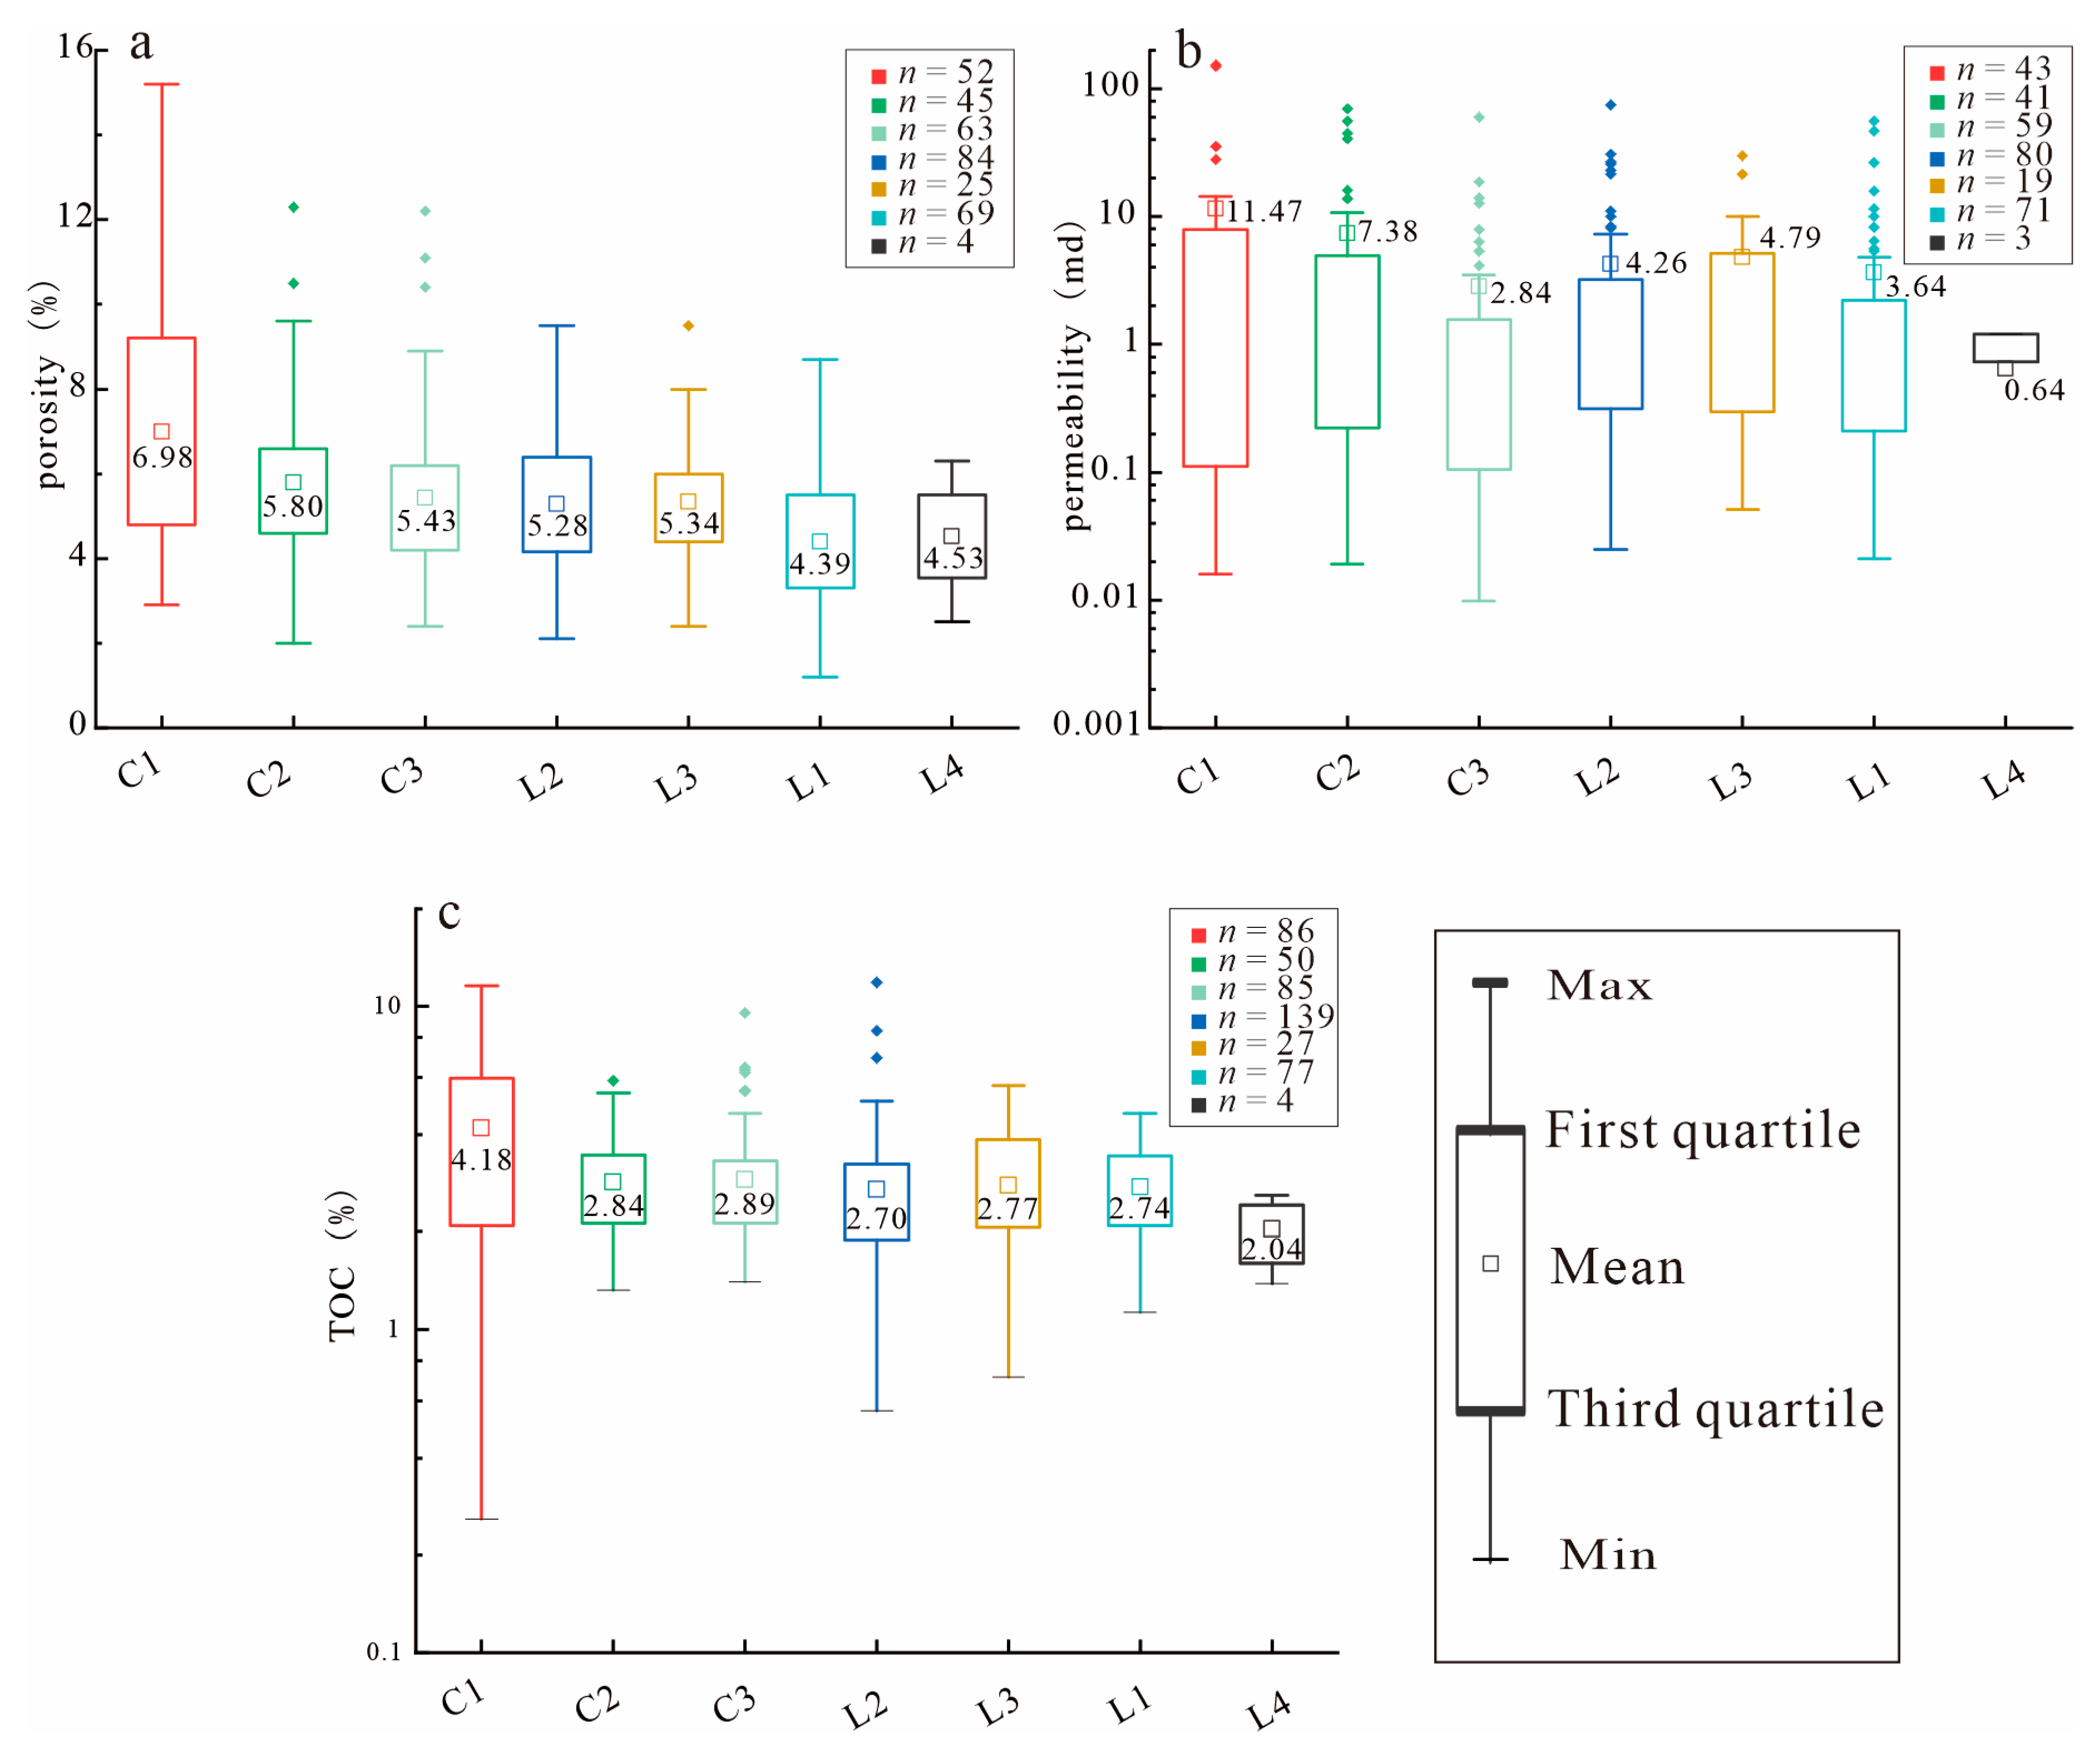
4.1. Reservoir Physical Properties

In this study, the core test porosity, permeability, and TOC data of the Shengli Oilfield were collected. The core test porosity data were derived from 342 samples from the main target layer (the lower of Es3 and upper Es4 members) of four wells, namely FY1, NY1, N55-X1, and L69. The distribution of porosity ranged from 1.20% to 15.20%; the mean was 5.45%, and the median is 5.10%. The permeability data were determined using 316 sample data from four wells, namely FY1, NY1, N55-X1, and L69. The distribution of permeability was from 0.01 md to 153.00 md; the mean was 5.25 md, and the median was 0.73 md. The TOC data were derived from 468 core tests from four wells, namely FY1, NY1, N55-X1, and L69. The distribution of TOC was from 0.26 to 11.83; the mean was 3.03, and the median was 2.53 (Table 3). These data were used in this research to assess the physical properties of the reservoir in the study area.

4.2. Lithofacies Classification Results

The lithofacies classification was carried out based on the core observation, XRD composition results, and microscope and SEM-based observations.

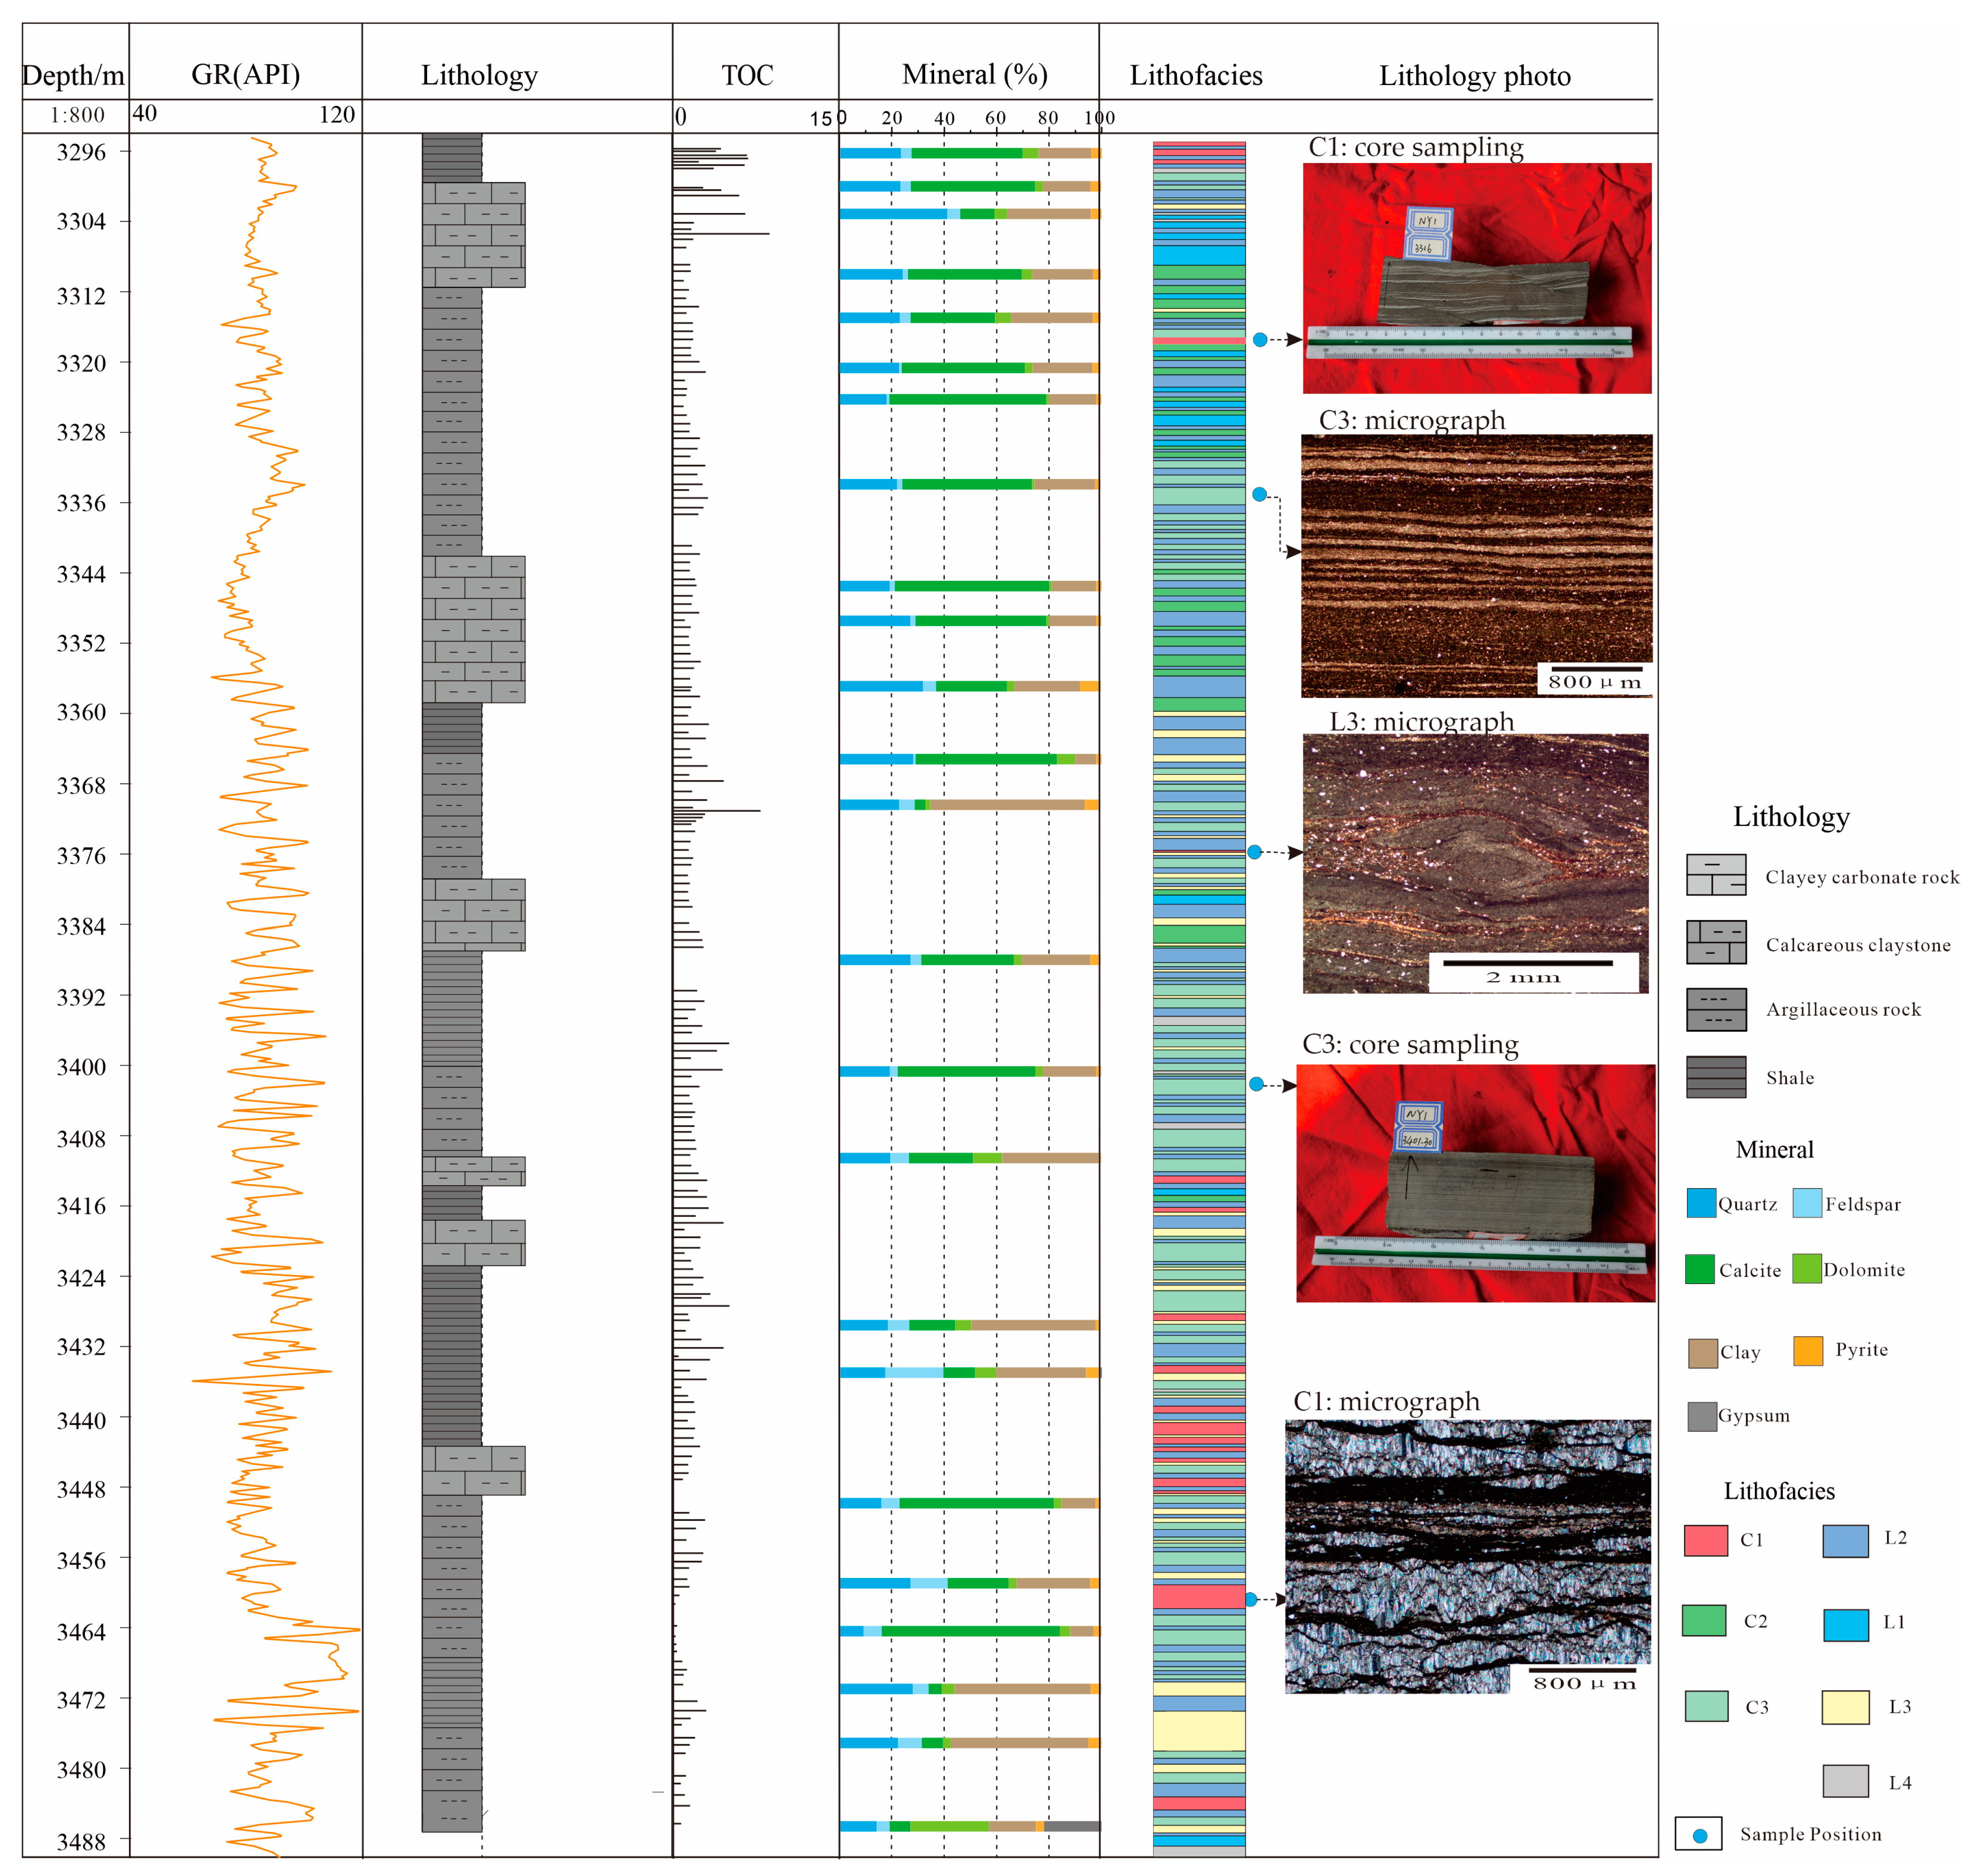
4.2.1. XRD Analysis Results

A trigonometric diagram was drawn in this study using the three-end elements of felsic (quartz + feldspar), carbonate (calcite, dolomite, aragonite), and clay minerals determined based on the collected CRD data from the three wells [15,54,55,56]. The felsic, carbonate, and clay mineral content ranges at the FY1 well were 2%–82%, 3%–95%, and 2%–62%, with average contents of 28.14, 47.38, and 21.09%, respectively (Figure 2a). The felsic, carbonate, and clay mineral content ranges at the L69 well were 3%–47%, 12%–93%, and 2%–48%, with average contents of 19.5, 57.65, and 18.89%, respectively (Figure 2b). The felsic, carbonate, and clay mineral content ranges at the NY1 well were 11%–52%, 5%–76%, and 4%–59%, with average contents of 27.14, 45.08, and 24.06%, respectively (Figure 2c).
According to the XRD results, the felsic (quartz + feldspar), carbonate (calcite, dolomite, and aragonite), and clay mineral contents in the 37 samples ranged from 5.7% to 22.8%, 25.5% to 81.8%, and 11.4% to 51.7%, with average contents of 11.19, 65.69, and 23.12%, respectively (Table 2 and Figure 2d). Overall, the majority of the collected rock samples from the study area belonged to mixed fine-grained sedimentary rocks, while others corresponded to carbonate rocks. In fact, it is challenging to assess shale oil reservoirs solely based on their lithological characteristics.

4.2.2. Lithofacies Classification

Lithofacies refer to rocks or rock combinations in specific sedimentary environments, which can indicate sedimentary processes and environments [57]. Since 2015, the concept of lithofacies has been introduced in studies on shale oil reservoirs. Liu et al. (2022) classified the Paleogene shale in the Jiyang Depression into 16 lithofacies of three main classes (striated, laminated, and massive) based on rock compositions, sedimentary structures, and organic matter abundance [33]. The Shahejie Formation consists mainly of six lithofacies, including organic-rich laminated muddy limestone, organic-rich laminated calcareous mudstone, organic-rich layered muddy limestone, organic-rich layered calcareous mudstone, organic-containing layered calcareous mudstone, and organic-containing blocky calcareous mudstone. Bai (2019) classified the shale oil reservoir of the Shahejie Formation in the Jiyang Depression into five key lithofacies based on core observation and thin section identifications according to the sedimentary environment conditions, including lithology, rock structure, and mineral crystal morphology (Table 4) [17]. These lithofacies are thin lens-shaped grain limestone (LF1), laminated mudstone limestone (LF2), thick block-shaped calcareous mudstone (LF3), block-shaped calcareous mudstone (LF4), and black shale (LF5).
In this study, we referred to the lithofacies classification scheme proposed by Bai (2019) and Liu (2022) to identify the main lithofacies in the study area [17,33]. In addition, we considered the interbedding of black shale, lens-shaped crystalline limestone, laminated calcareous mudstone, and mudstone limestone at the centimeter scale in the Jiyang Depression, as well as the coring from four wells in the entire section of the Jiyang Depression, along with core description, thin-section analysis, XRD results, and organic carbon content analysis. The structure and composition of rocks were characterized across different scales, ranging from macroscopic to microscopic. In total, eight lithofacies were identified, including calcareous mudstone lithofacies, muddy limestone lithofacies, two mudstone lithofacies types, and shale lithofacies. The target layer (the lower Es3 and upper Es4 members) in this study area was basically deprived of pure shale lithofacies. Compared with previous lithofacies classification schemes, this lithofacies classification further refines the structural characteristics of the lithofacies (Table 4).
(1)
Combined shale and lenticular crystal limestone lithofacies (C1).
C1 was composed mainly of two lithofacies, namely the black shale and crystal limestone lithofacies. In this study, the coring revealed interbedded shale with thin or slightly longer lens-shaped white carbonate interlayers (Figure 3a). In addition, microscopic petrographic observations revealed that the carbonate interlayers consisted of large and bright crystalline calcite, with single or multiple discontinuous lenses of calcite particles. The grain calcite had fibrous or granular forms (Figure 3b), suggesting the occurrence of a deep lake sedimentary environment [16,17].
(2)
Combination of continuous parallel planar calcareous claystone and uncontinuous laminate mudstone lithofacies (C2)
C2 consisted mainly of calcareous claystone and laminated micrite. However, the continuity of the laminated micrite was relatively poor, showing discontinuous or lens-shaped structures interbedded with calcareous mudstone (Figure 3c). Microscopically, micrite with lens-like distribution was observed (Figure 3d). Therefore, this combined lithofacies might have developed primarily under a semideep lake environment [16,17].
(3)
Combination of continuous parallel planar calcareous claystone and laminate micrite lithofacies (C3)
The C3 lithofacies consisted primarily of calcareous claystone and laminated carbonate layers, of which the laminated carbonate consisted mainly of micrite calcite. Core observation revealed two distinct lithological boundaries with light- and dark-colored laminated micrite and calcareous claystone, respectively (Figure 3e). Microscopically, the laminated carbonate exhibited a microcrystalline structure (Figure 3f). These results suggested that the combined lithofacies type was developed primarily in a semideep lake environment [16,17].
Furthermore, the continuous parallel planar argillaceous limestone (L1) (Figure 3h), continuous parallel planar calcareous claystone (L2) (Figure 3e), and continuous parallel planar argillaceous rock (L3) (Figure 3g) lithofacies were not identified in the collected cores and microphotos. The lithology was initially assessed based on the differences in mineral composition to identify the main lithofacies (L1, L2, L3). A massive argillaceous rock lithofacies (L4) (Figure 3i) was identified in the core photo. Based on the aforementioned lithofacies identification scheme, detailed core observations were conducted for four cored wells from the study area at the Shengli Oilfield Core Repository. The lithofacies classification of cored intervals was performed by integrating logging curve (GR) analysis, TOC content, XRD data, and microscopic photographs (Figure 4).
The sedimentary environment of the Shahejie Formation, especially the Es3 member in the Jiyang Depression, is characterized primarily by deep lake to semideep lake settings (Table 4). The microenvironments of mud shale deposition in this area are relatively insensitive to changes in lake level. Previous studies have generally suggested that lithofacies C1 was formed in a deep lake environment, while C2 and C3 were deposited in semideep lake environments [16,17].

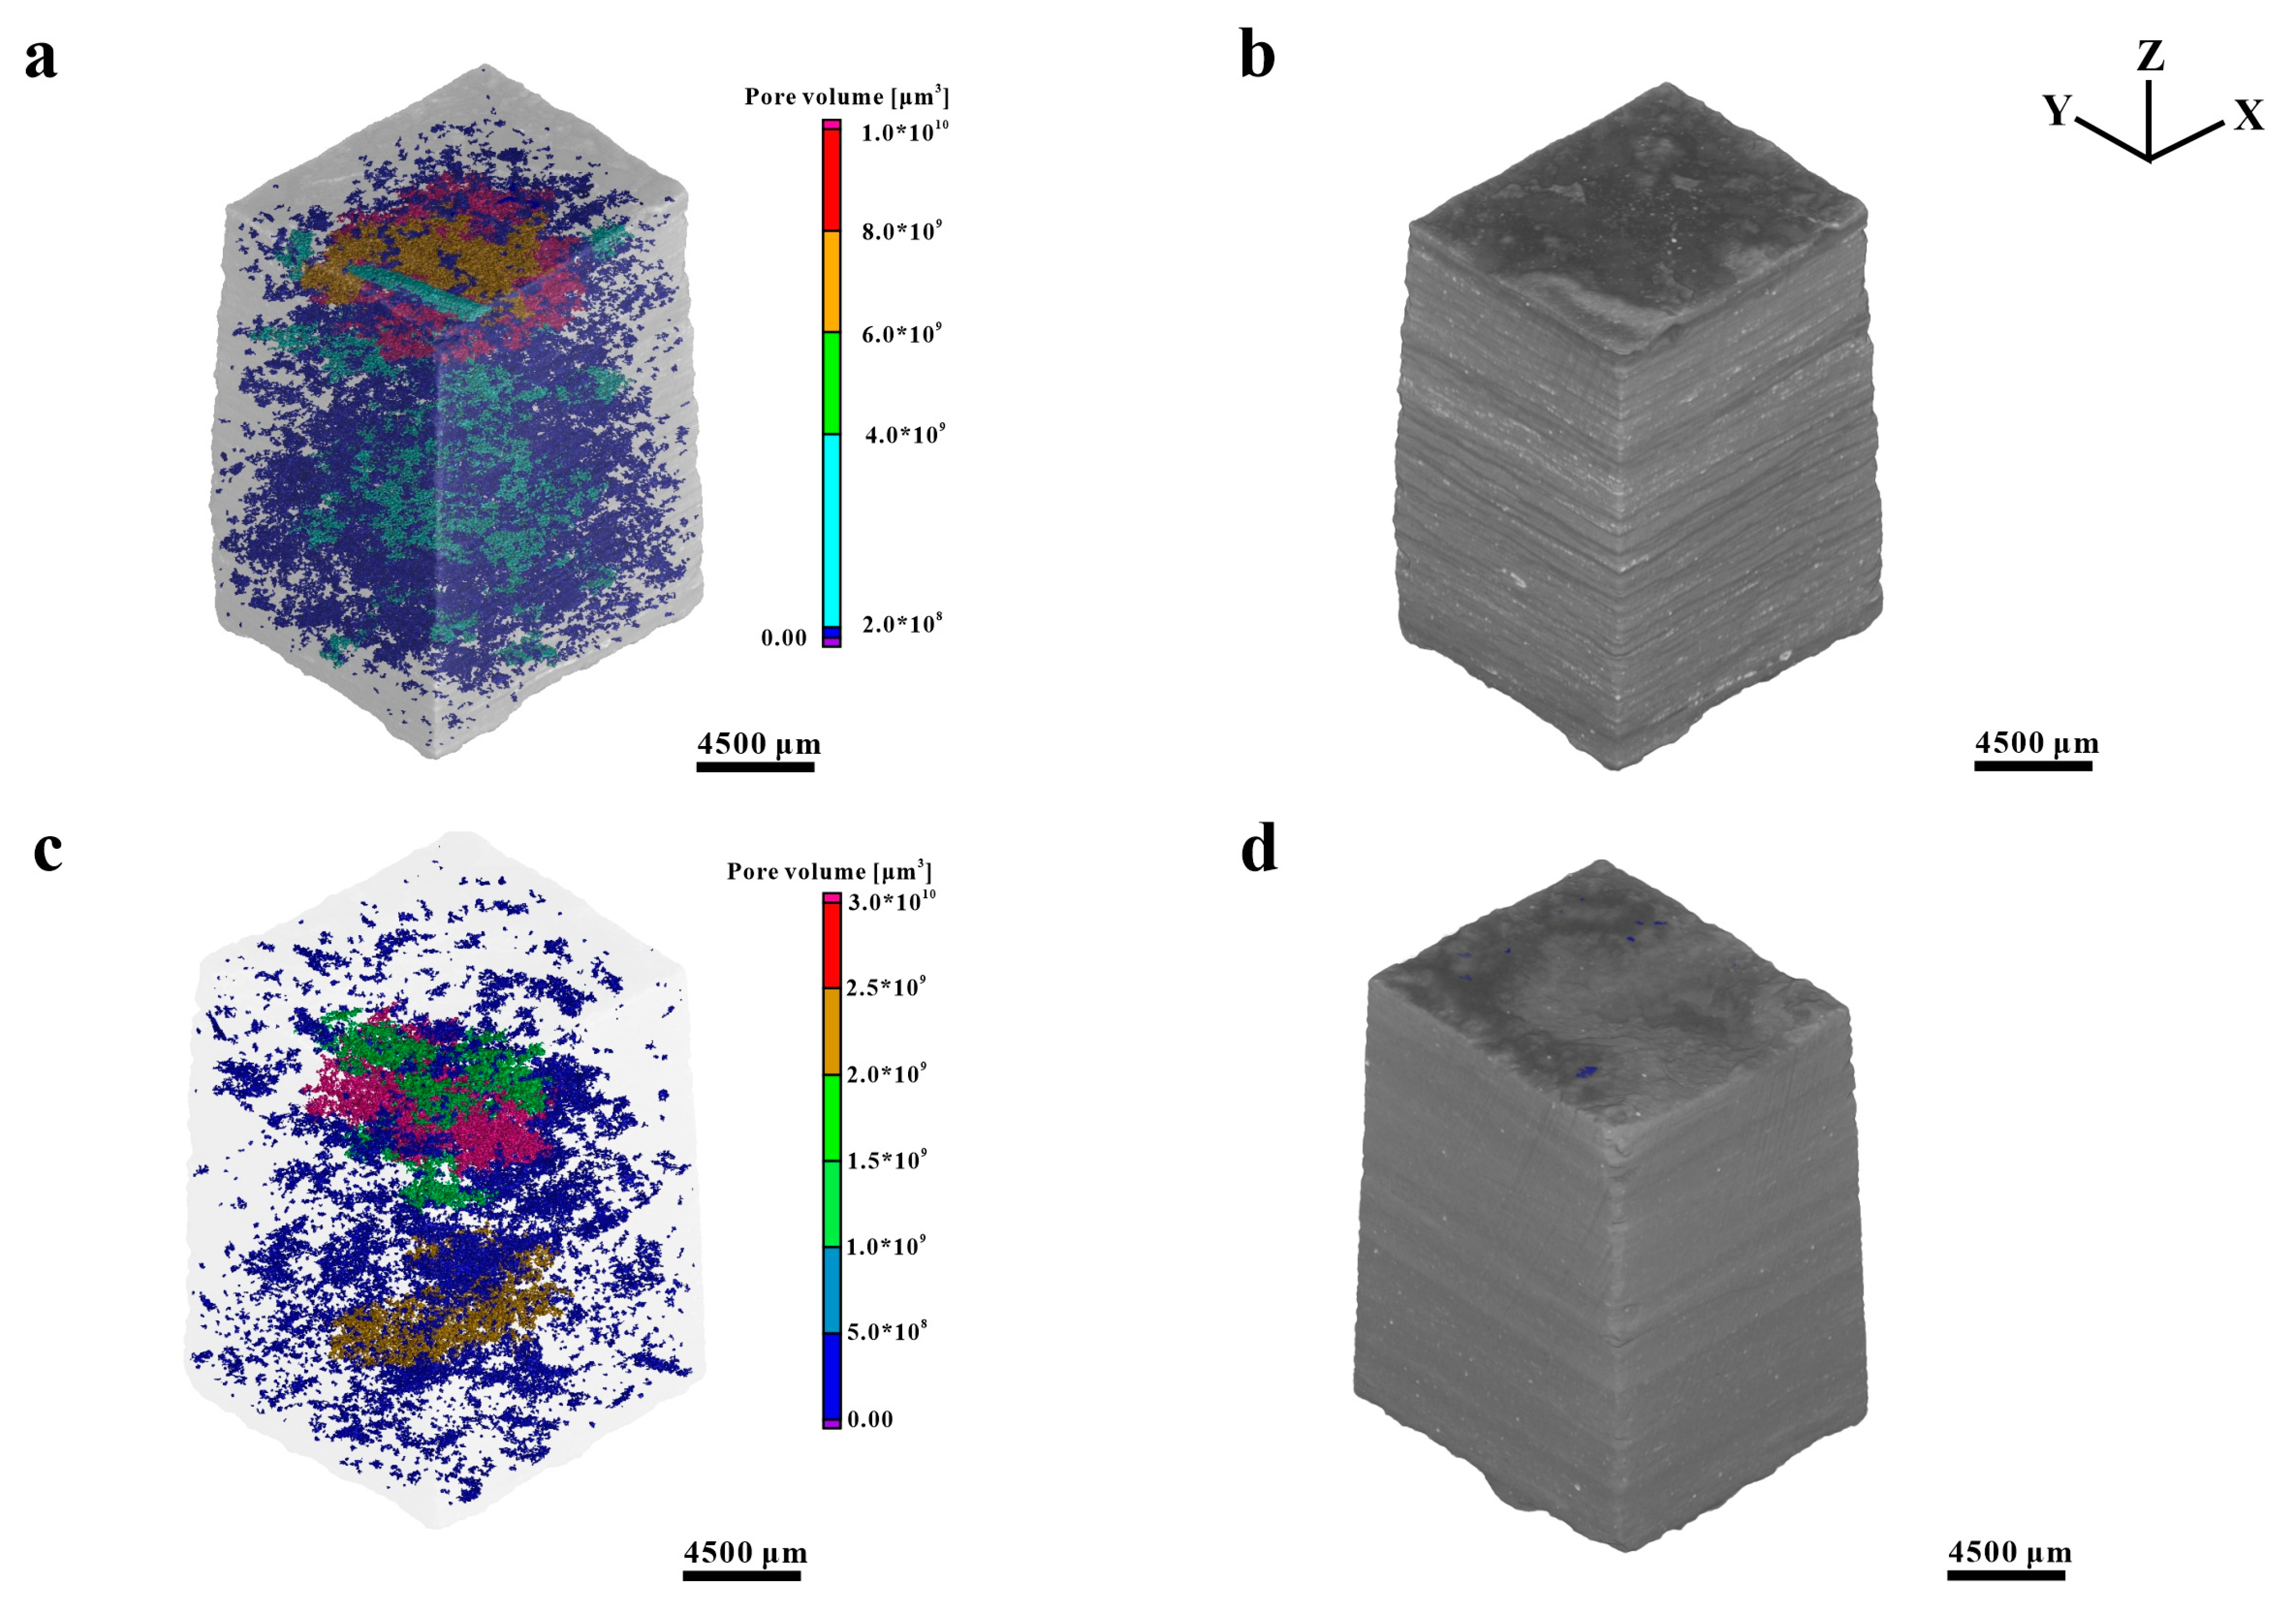
4.2.3. Three-Dimensional Micro CT Scanning (Micro-CT)

The micro-CT scan results (Figure 5) showed obvious layers in Sample L69-CT1 (C1), with parallel and interactive distributions of bright and dark substances. However, the layer of Sample L69-CT2 (C2) was relatively less distinguishable than those in Sample 1. In addition, the luster of the bright substance in Sample 2 was darker, while the particle sizes were smaller when compared with those in Sample 1. The 3D micro-CT results showed a higher porosity in Sample 1 than in Sample 2.

4.3. Pore Types

According to the genesis, the fractures could be classified into structural and diagenetic fractures. In addition, the pores could be classified into three different types based on the position between the pores and particles, namely intergranular (pores between mineral particles), intragranular (pores developed within mineral particles), and organic pores (pores within or at the edges of organic matter–mineral complexes) [4,58,59,60,61]. Fractures and pores could be observed clearly by argon ion polishing field emission scanning electron microscopy. The observed structural fractures were mostly found in the laminated lithofacies, consisting mainly of interlayer fractures parallel to the bedding, while some fractures were filled with quartz, calcite, and organic matter. Most of the structural fractures extended on a large scale, ranging from tens to hundreds of micrometers and, consequently, forming microfractures (Figure 6a). Numerous microfractures could be observed in the micrite laminas, which were often filled with clay minerals or organic matter, indicating the dehydration of clay minerals (Figure 6b) and contraction of organic matter (Figure 6c,h). The intergranular pores were developed mainly in the mudstone lamina (Figure 6d,e), showing relatively large sizes. The internal pores of pyrite aggregates (Figure 6f) and dissolution pores (Figure 6g) were the main intragranular pores in the study area. Organic-matter-associated pores in the study area were mainly organic-matter-related shrinkage pores (fractures), which were developed mainly at the edges of organic-matter-associated particles, forming pores and fractures in contact with surrounding minerals (Figure 6i–l). Meanwhile, the organic-matter-related internal pores were developed.

4.4. Pore Throat Distribution Characteristics

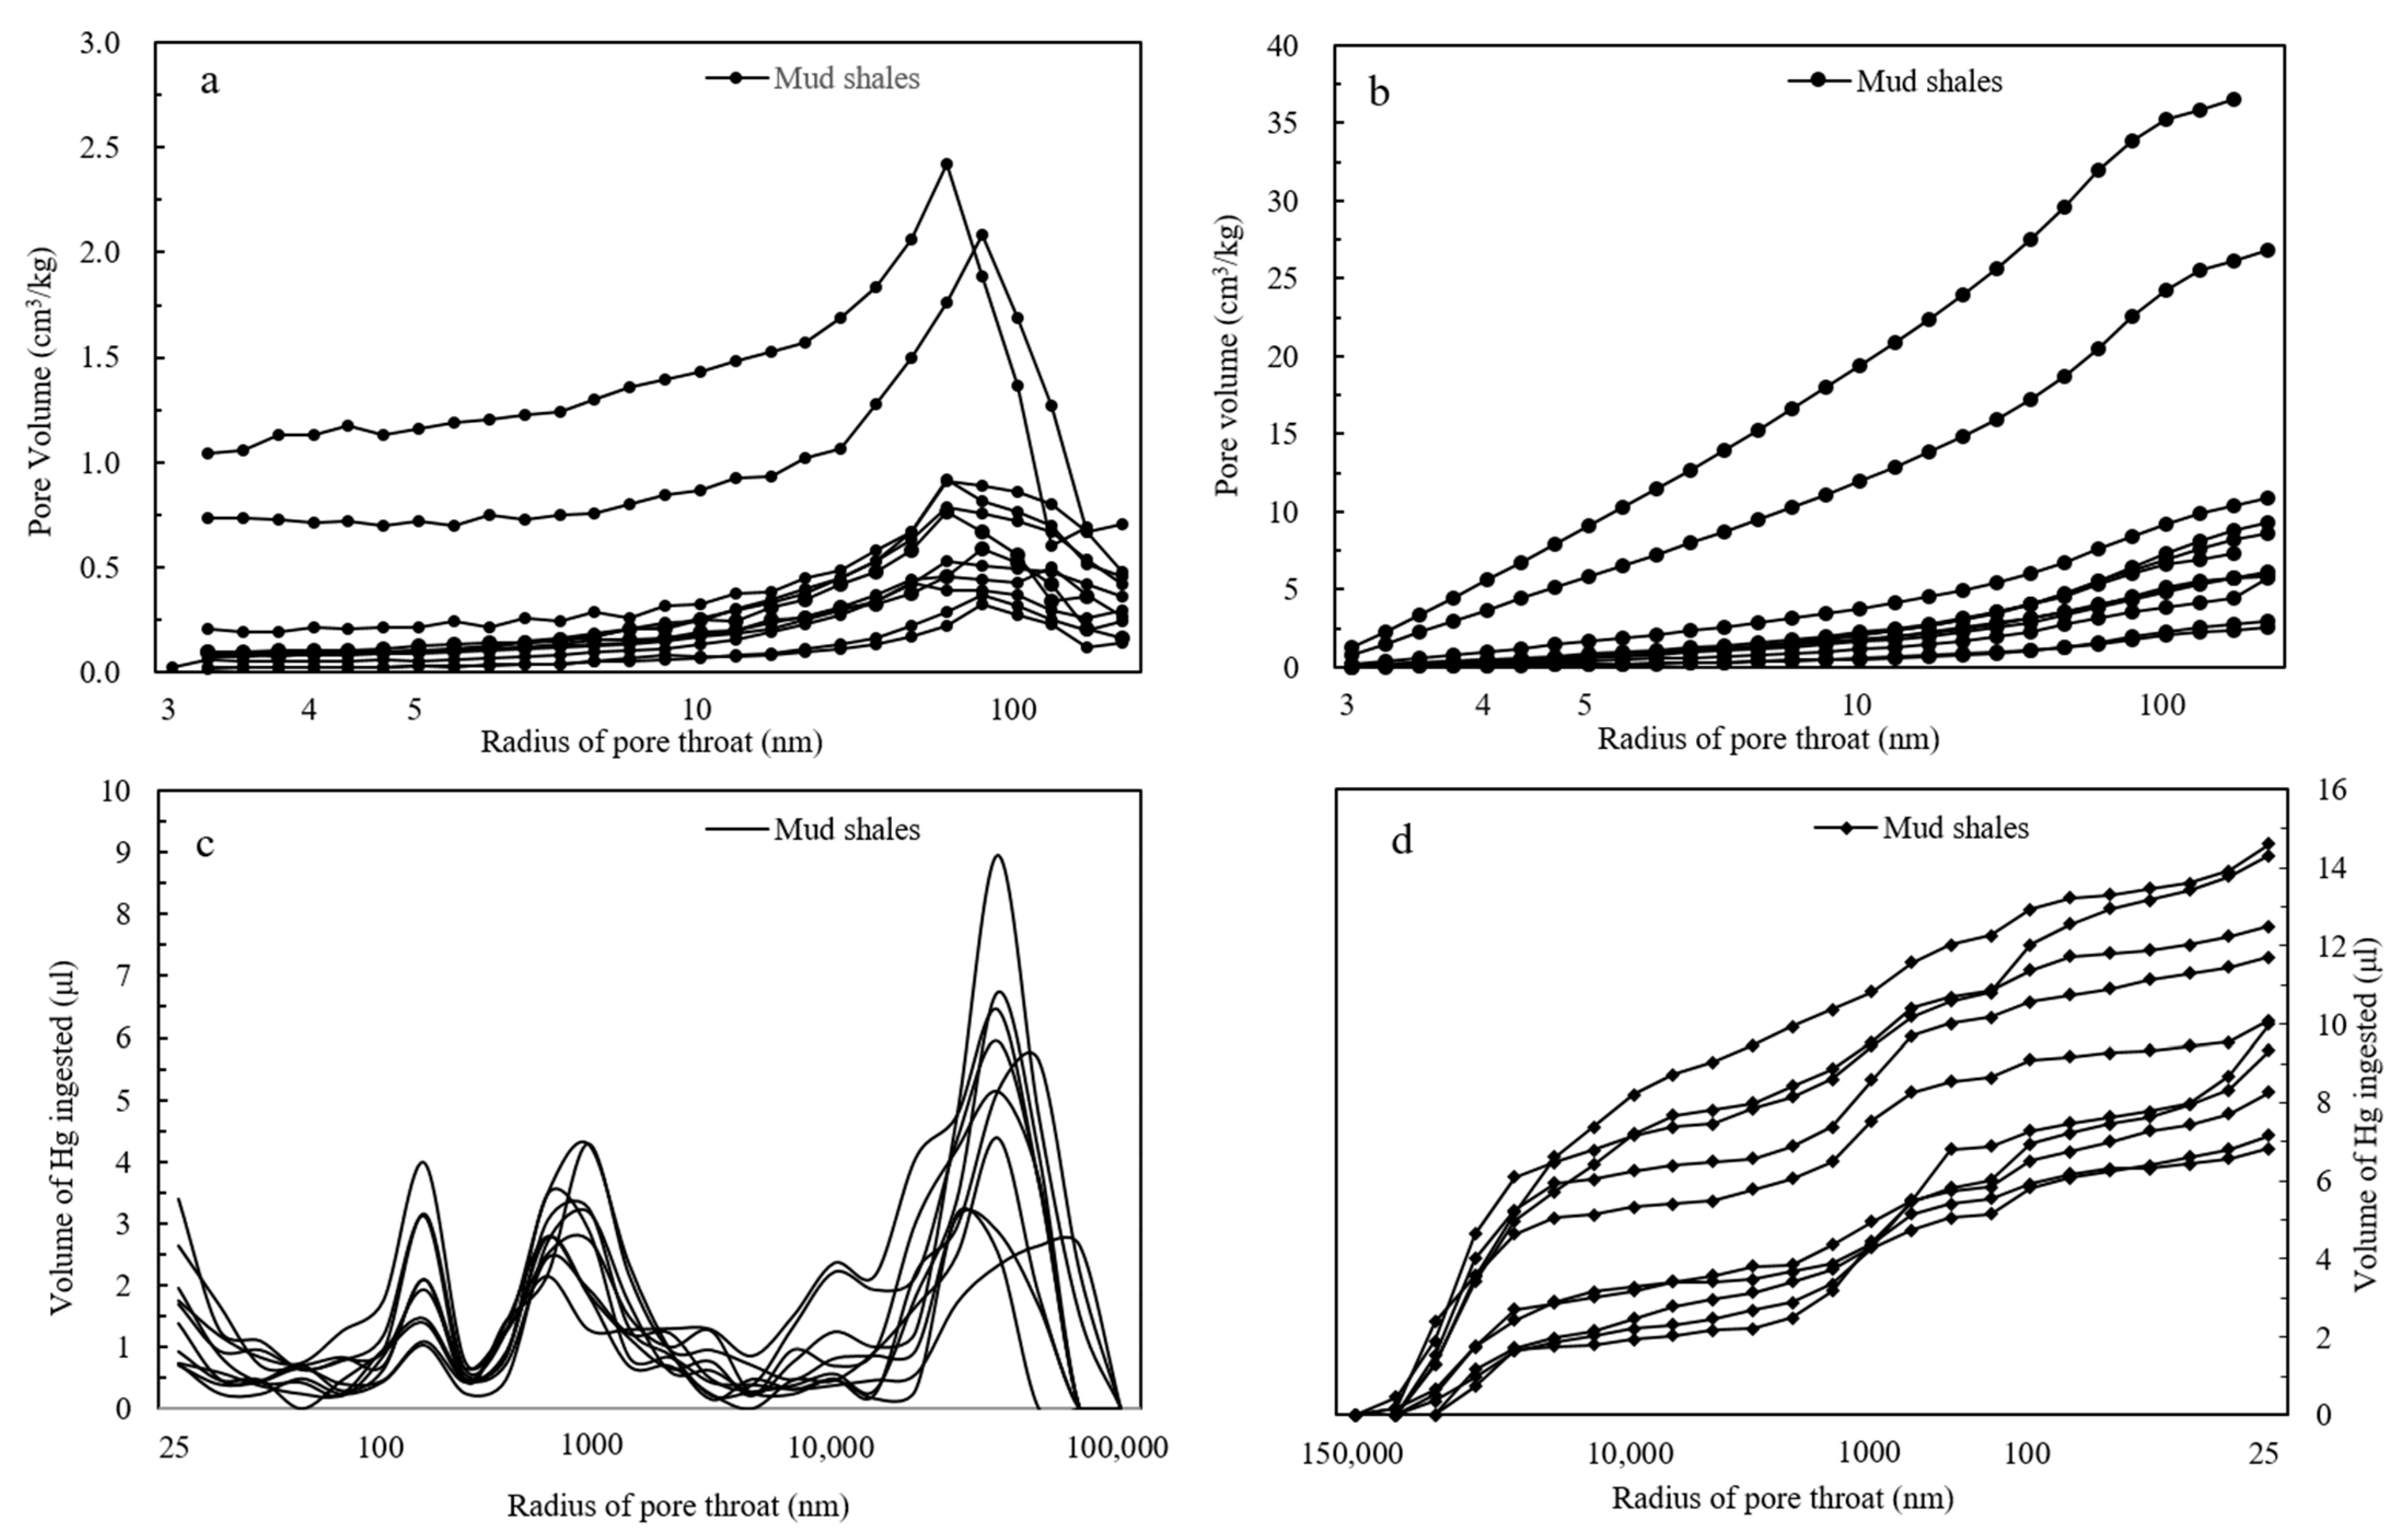
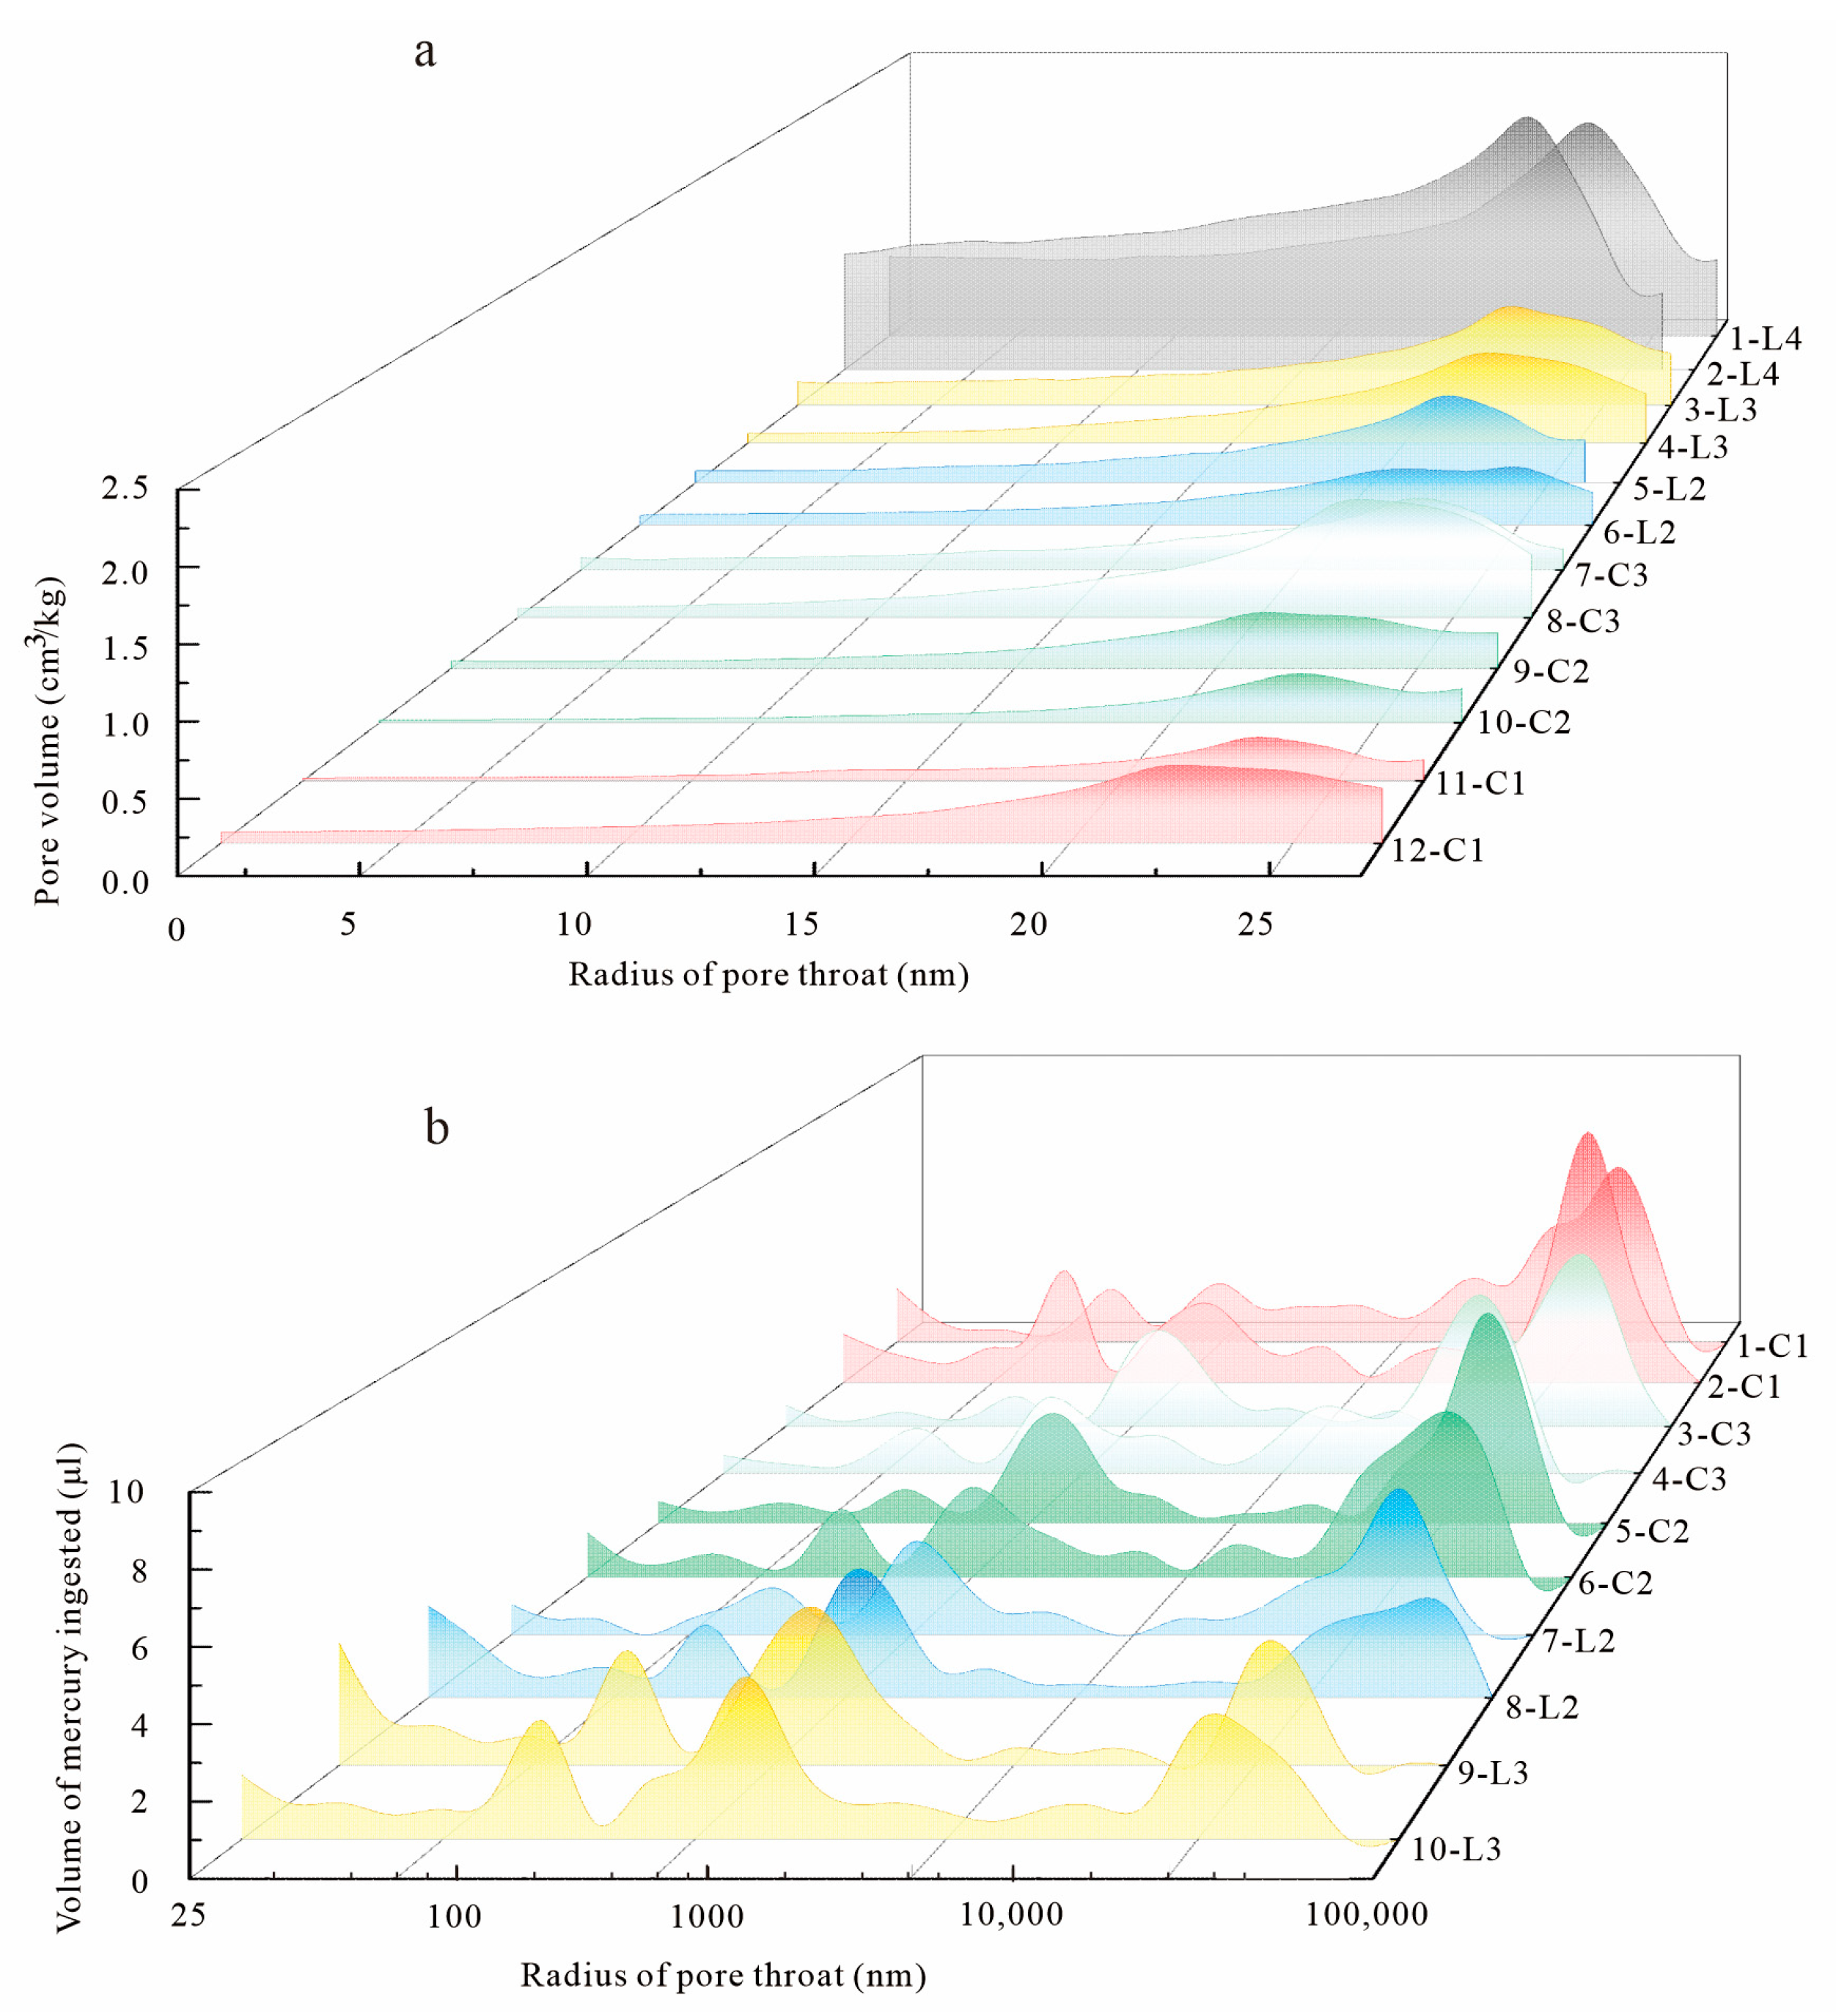
4.4.1. Results of Low-Pressure Nitrogen Adsorption

According to the nitrogen adsorption experiment results, eight and four samples from the G17-X10 and G17-11 wells, respectively, showed a pore size range of 3–180 nm. The pore volume for a single pore ranged from 0 to 2.5 cm3/kg (Figure 7a); pore radii with relatively large adsorption volume for single pores were concentrated mainly in pores smaller than 50 nm; the cumulative pore volume for a single sample ranged from 1 to 37 cm3/kg (Table 5, Figure 7b).

4.4.2. Results of High-Pressure Mercury Intrusion Experiment

The high-pressure mercury intrusion test data of the 10 samples from the Fanye 1 well showed a pore size range of 25–150,000 nm. The distribution of pores showed three-peak distributions, with pore size ranges of 50–500 nm, 500–5000 nm, and over 5000 nm. The range of volume of Hg ingested for a single pore was 0–9 μL (Figure 7c), and the range of cumulative volume of Hg ingested was 7.17–14.6 μL (Table 6, Figure 7d).

5. Discussion

5.1. Differences in Physical Properties of Different Lithofacies

The porosity and permeability of shale oil reservoirs are key indicators of reservoir quality. In this study, there were great differences in the porosity and horizontal permeability within the reservoir from different lithofacies, showing high heterogeneity characteristics.
Porosity represents the percentage of pore to rock volumes and is one of the fundamental parameters used to characterize reservoir spaces. In this study, the porosity characteristics of 342 core samples from four wells (L69, FY1, NY1, LY1) were classified and statistically analyzed based on the lithofacies classification (Figure 8a). Samples from lithofacies combinations showed relatively high average porosity values. Among them, 52 C1 samples exhibited the highest values, reaching 6.98%, followed by the C2, C3, L2, L1, L3, and L4 samples, with average porosity values of 5.8, 5.43, 5.28, 4.39, 5.34, and 4.53%, respectively. In addition, 3D-CT scan results showed higher porosity of the crystalline layer than the micrite layer (Figure 5a,c). The average porosity values of five main lithofacies and combinations were calculated based on the high-pressure mercury intrusion-based porosity values of 10 samples from the FY1 well (Table 6). In fact, C1 showed the highest average porosity values, reaching 4.35%, followed by C3, C2, L3, and L2, with average porosity values of 3.38, 3.31, 3.03, and 2.75%, respectively. The mercury-based porosity values of these lithofacies were higher than those of the other lithofacies.
The horizontal permeability data of 316 core samples from the four wells (L69, FY1, NY1, LY1) were classified and statistically analyzed according to the different lithofacies (Figure 8b). Among them, the 43 samples of C1 had the highest average horizontal permeability value of 11.47 millidarcy (md), and the maximum value was 153 md. In addition, the C2 samples showed an average horizontal permeability value of 7.38, with a maximum value of 70 md, followed by L3, L2, L1, C3, and L4, with average permeability values of 4.8, 4.26, 3.64, 2.84, and 0.64 md, respectively.
Based on physical property analyses, it was evident that the average porosity and horizontal permeability values of the three combined lithofacies were higher than those of the other lithofacies and that C1 had comparatively better physical properties.
Organic matter contents play a controlling role in shale oil reservoirs. Although mud shale possesses self-generation and self-storage capabilities, produced oil and gas can migrate over short distances or be stored in situ. Therefore, the hydrocarbon generation capacity of mud shale reservoirs can affect oil and gas reserves. The hydrocarbon generation potential of mud shales is microscopically and macroscopically related to organic matter abundance and mud shale scales, respectively [62,63]. Organic matter abundance can be represented by the TOC content, which is the most commonly used indicator. According to the collected data from the target layers of four wells in the Shengli Oilfield (FY1, NY1, G17-X10, and L69) and the lithofacies classification (Figure 8c), 86 samples of C1 showed the highest average TOC contents, reaching 4.18, whereas the average TOC contents in C2, C3, L2, L1, L3, and L4 were 2.84, 2.89, 2.7, 2.74, 2.77, and 2.04, respectively. Therefore, C1 exhibited a substantially higher average TOC content than the other lithofacies.
Although the porosity ranges obtained from different testing methods were not entirely consistent between the different measurement methods (core testing, horizontal permeability, and mercury intrusion experiments), the overall porosity and permeability of C1, C2, and C3 outperformed those of the other lithofacies; C1 had the most optimal porosity and permeability. Additionally, these three combined lithofacies exhibited relatively high organic matter abundance. These three combined lithofacies consisted of interbedded micrite or high brittle mineral layers that coexisted with clay minerals (Figure 3a,c,e).
The obtained results showed relatively scattered spatial distributions of porosity, permeability, and organic matter contents in each lithofacies, especially for the permeability values. Therefore, analyzing shale oil reservoirs based solely on core data is insufficient, making it necessary to conduct further comprehensive investigations on the microstructural porosity characteristics of the reservoir in this area.

5.2. Reservoir Pore Characteristics and Genesis Under the Lithofacies Constraints

The measured porosity and permeability of the rocks can represent the quality of the reservoir only to a certain extent because of the high heterogeneity of the shale oil reservoirs. To further evaluate the quality of the reservoir in the study area, it was necessary to investigate the pore characteristics. Hence, we further explored the reservoir space and pore structure characteristics in this study.
The pore structures of shale oil reservoirs have multiscale characteristics, from nanoscale pores to micrometer-sized fractures. The connectivity and reservoir properties of different pore types can vary significantly [64,65]. In this study, the pore structures were characterized using low-pressure nitrogen adsorption and high-pressure mercury intrusion. The nitrogen adsorption and high-pressure mercury intrusion techniques characterized mainly pores with sizes below 50 nm (Figure 9a) and in the 50–100,000 nm range (Figure 9b), respectively.
The nitrogen-adsorption-based pore size mainly ranged from 0 to 30 nm. The L4 pore volume was comparatively well developed within this pore range, followed by L2 and L3. However, a poor combination of the three lithofacies (C1, C3, C2) was observed. In summary, the L4 pore volume was substantially better than that of the remaining lithofacies within the 0–30 nm range (Figure 9).
According to nitrogen adsorption analysis of the different rock phases, the main pore size of L4 was in the range of 0–100 nm, while the pore sizes of the combined lithofacies and other layered rock phases were greater than 100 nm. On the other hand, the high-pressure mercury intrusion experiments revealed developed pores with a size range of 25–100,000 nm. The intersection curve between the mercury-intrusion-based pore sizes and volumes showed a three-peak distribution, with pore size ranges of 50–500 nm, 500–5000 nm, and over 5000 nm. The single mercury-intrusion-based pore volume exhibited a sharp increase to the maximum value with the pore radius of C1 increasing to over 5000 nm. The single mercury-intrusion-based volumes of C3 and C2 substantially increased within pore size ranges of 500–5000 nm and >5000 nm. In fact, the highest single mercury-intrusion-based volume was observed at pore sizes greater than 5000 nm. The highest single mercury-intrusion-based volumes of L2 were observed mainly in the pore size ranges of 500–5000 nm and over 5000 nm, as well as in the 50–500 nm range to some extent, whereas the highest single mercury-intrusion-based volumes of L3 were observed in the pore size range of 500–5000 nm.
Building upon existing classification schemes [59] and incorporating experimental results from our study area, we adopt the following pore size categories: micropores (<50 nm), small pores (50-500 nm), mesopores (500-5000 nm), and macropores (>5000 nm). The above-mentioned classification scheme and high-pressure mercury intrusion data of 10 samples from the Fanye 1 well were used to determine the corresponding pore volume proportions (Figure 10). The statistical results showed that C1 mainly developed macropore throats, while C3 and C2 mainly developed macro- and mesopore throats. These three combined lithofacies exhibited mainly intergranular pores, diagenetic microfractures, and structural microfractures (Figure 6), with free oil in fractures and larger pores, demonstrating their great contributions to shale oil production [39]. The layered lithofacies (e.g., L2 and L3) were characterized by large, medium, and small-sized pore throats, with developed intergranular pores, organic-matter-associated pores, diagenetic microfractures, and structural microfractures (Figure 6). L4 was characterized by a small porosity range. The microscopic characterization revealed the great contribution of the block mudstone pores to micropores smaller than 50 nm, including pyrite- and clay-mineral-aggregate-related pores. These were scattered and characterized by low permeability values (Figure 6).
The difference scales of the pore structures demonstrated the capacity of the main combined lithofacies (C1, C3, C2) to connect the reservoir space with nanoscale pores and microscale fractures. In addition, shale oil is enriched mainly in pores and microfractures with sizes higher than 50 nm. Shale oil reservoir pores can be classified based on their size characteristics [60]. According to the relationship between the pore volume and pore size distribution depicted by nitrogen adsorption, the pore size below 200 nm can be measured by low-temperature nitrogen adsorption experiments, and the characterization of pore size between 2 and 50 nm is relatively reliable. The pore size distribution of the shale samples in this study was below 100 nm, with a peak mainly below 50 nm. Meanwhile, the relationship between the adsorption pore volume and pore size distribution derived from high-pressure mercury intrusion indicated that the intersection curve between the mercury-intrusion-based pore sizes and volumes showed a three-peak distribution, with pore size ranges of 50–500 nm, 500–5000 nm, and over 5000 nm. These pores could be observed under a scanning electron microscope (SEM).
In this study, we classified the main reservoir pores into four categories based on previous classification schemes and the actual mercury-intrusion-based pore size results. These categories were micropores (<50 nm), small pores (50–500 nm), mesopores (500–5000 nm), and macropores (>5000 nm). The main pore types with pore sizes below 50 nm were the intraparticle pores of pyrite aggregates and clay mineral aggregates, including intercrystalline pores and mineral interior dissolved pores within pyrite aggregates as well as intraparticle pores of clay mineral aggregates. All these pores were related to the contents of clay minerals, pyrite, and felsic minerals. Pores within clay mineral aggregates with sizes less than 50 nm were observed (Figure 11a), and the pore sizes of intraparticle pores in pyrite were mainly in the range of 100–300 nm (Figure 11b). According to SEM observations, the intraparticle pores of pyrite aggregate sand dissolution pores and the internal dissolution pores of particles were the main pore types in the study area. The main pore types of micropore throat (50–500 nm) were calcite intergranular pores and intergranular micropores; pores ranging from 100 to 400 nm were observed (Figure 11c,d). The intergranular pores were developed mainly in the mudstone lamina, showing relatively large sizes with high porosity and good connectivity, thereby providing relatively sufficient reservoir spaces and migration channels for shale oil formation and flow. The intragranular pores were developed within mineral particles (e.g., pyrite and clay mineral aggregates), forming dissolution and fossil cavity pores. These pore types can be scattered in the minerals and characterized by relatively poor connectivity. The main types of mesopores (500–5000 nm) were intergranular macropores and diagenetic microfractures. The intergranular pores were developed mainly in the mudstone lamina. Microfractures were formed through dehydration of clay minerals (Figure 11e) and contraction of organic matter (Figure 11f). The macropore throats (>5000 nm) were composed mainly of structural microcracks (Figure 11g) and bedding microcracks (Figure 11h). The observed structural fractures were mostly found in the laminated lithofacies, consisting mainly of interlayer fractures parallel to the bedding, while some fractures were filled with quartz, calcite, and organic matter. Most of the structural fractures extended on a large scale, ranging from tens to hundreds of micrometers and, consequently, forming microfractures.

5.3. Genesis of High-Quality Shale Oil Reservoirs

The comparison analysis of the physical properties and pore characteristics of the reservoirs under the lithofacies constraint revealed high-quality shale oil reserves in the Shahejie Formation of the Jiyang Depression, concentrated mainly in the three combined lithofacies (C1, C2, and C3), of which C1 showed the highest shale oil quality in the study area. Previous related studies have highlighted the great contribution of initial rock differences to reservoir heterogeneity. However, further investigations are required to comprehensively investigate the reservoir evolution process and the main factors leading to relatively good reservoir properties of these combined lithofacies (Figure 12).
Differences in lithology can reflect potential differences in sedimentary conditions. Numerous scholars have discussed in detail the sedimentary environment (C2 and C3) of interbedded combined lithofacies of micrite limestone and calcareous mudstone (or mudstone), highlighting that this type of combined lithofacies is the result of rich-clay and biochemical depositions under periodic lake level fluctuations [16,66,67]. The biochemical depositions were driven by dead organisms entering the deep oxygen-depleted environment for sedimentation, which highlights the lack of obvious density stratification under wet and cold environmental conditions [68,69]. In this study, spherical particles (Figure 6i,j), rod-shaped bacteria (Figure 6k), and algal fossils (Figure 6l) were observed in micrite layers.
Considering the differences in the initial sedimentary microenvironment, the sedimentation rate of micrite calcite may exhibit spatial variations. The weak hydrodynamic conditions and seasonal stratification of water controlled by environmental factors can promote the development of laminated structures, improving the pore conditions of initial rocks when compared with those in other lithofacies, such as the original pores along the surface between the contact surface of the micrite calcite and clay matrix (Figure 12b). The longitudinal heterogeneity of the reservoir was characterized in this study using the 3D micro-CT method (Figure 5c). The C1 type was characterized by organic-matter-rich clay deposits formed under a deep-water background at the sedimentary stage [38]. Although the organic matter content was high at the early diagenetic stage (A1), the initial pore conditions were not advantageous compared with the other lithofacies, while the precipitated pyrite contributed few intragranular pores (Figure 12a) [45,70]. Subsequently, all of the lithofacies types were affected mainly by compaction at the early diagenetic stage (A2), resulting in a high porosity reduction rate.
Organic matter begins to expel hydrocarbons at the middle diagenetic stage, the A1 stage. Organic matter in claystone is more prone to decomposition because of its high content in this mudrock type, resulting in the formation of organic-matter-associated pores in all combined lithofacies (C2, C3, and C1). However, these pores are mainly nanoscaled micropores, exhibiting few positive effects on reservoir quality. In addition, potential foliations can gradually form, leading to the transformation of deep water depositional claystone to shales and consequently greatly improving the shale storage conditions. Fluid migration can be relatively smooth in the overpressure area because of the influence of regional overpressures at the intermediate A2 stage. At this time, the micrite layers in the combined micrite limestone lithofacies (C2 and C3) become prone to local dissolution, forming brine and enhancing the storage conditions for this lithofacies type. Diagenetic microfractures and contraction fractures can promote the entry of calcium (Ca2+) and bicarbonate (HCO3) from the brine into the shale bedding fractures, resulting in calcite precipitation. This process can greatly reduce the storage performance of shales, even though some pores may retain shale formation due to the potential occurrence of incomplete filling and the presence of intergranular pores during the grain calcite precipitation process (Figure 12c,d). However, it can increase the complexity of the pore structures in the combined shale lithofacies (C1) to some extent [38]. Therefore, the high-quality reservoir conditions in the combined lithofacies were the result of both basic sedimentary lithofacies and diagenetic history.

6. Conclusions

  • The physical properties of the combined lithofacies (C1, C2, and C3) were superior to those of other lithofacies, with C1 exhibiting the most favorable physical properties. The high porosity, permeability, and TOC of these lithofacies provide optimal conditions for shale oil enrichment. These three combined lithofacies consist of interlayers of shale/claystone and other highly brittle mineral layers.
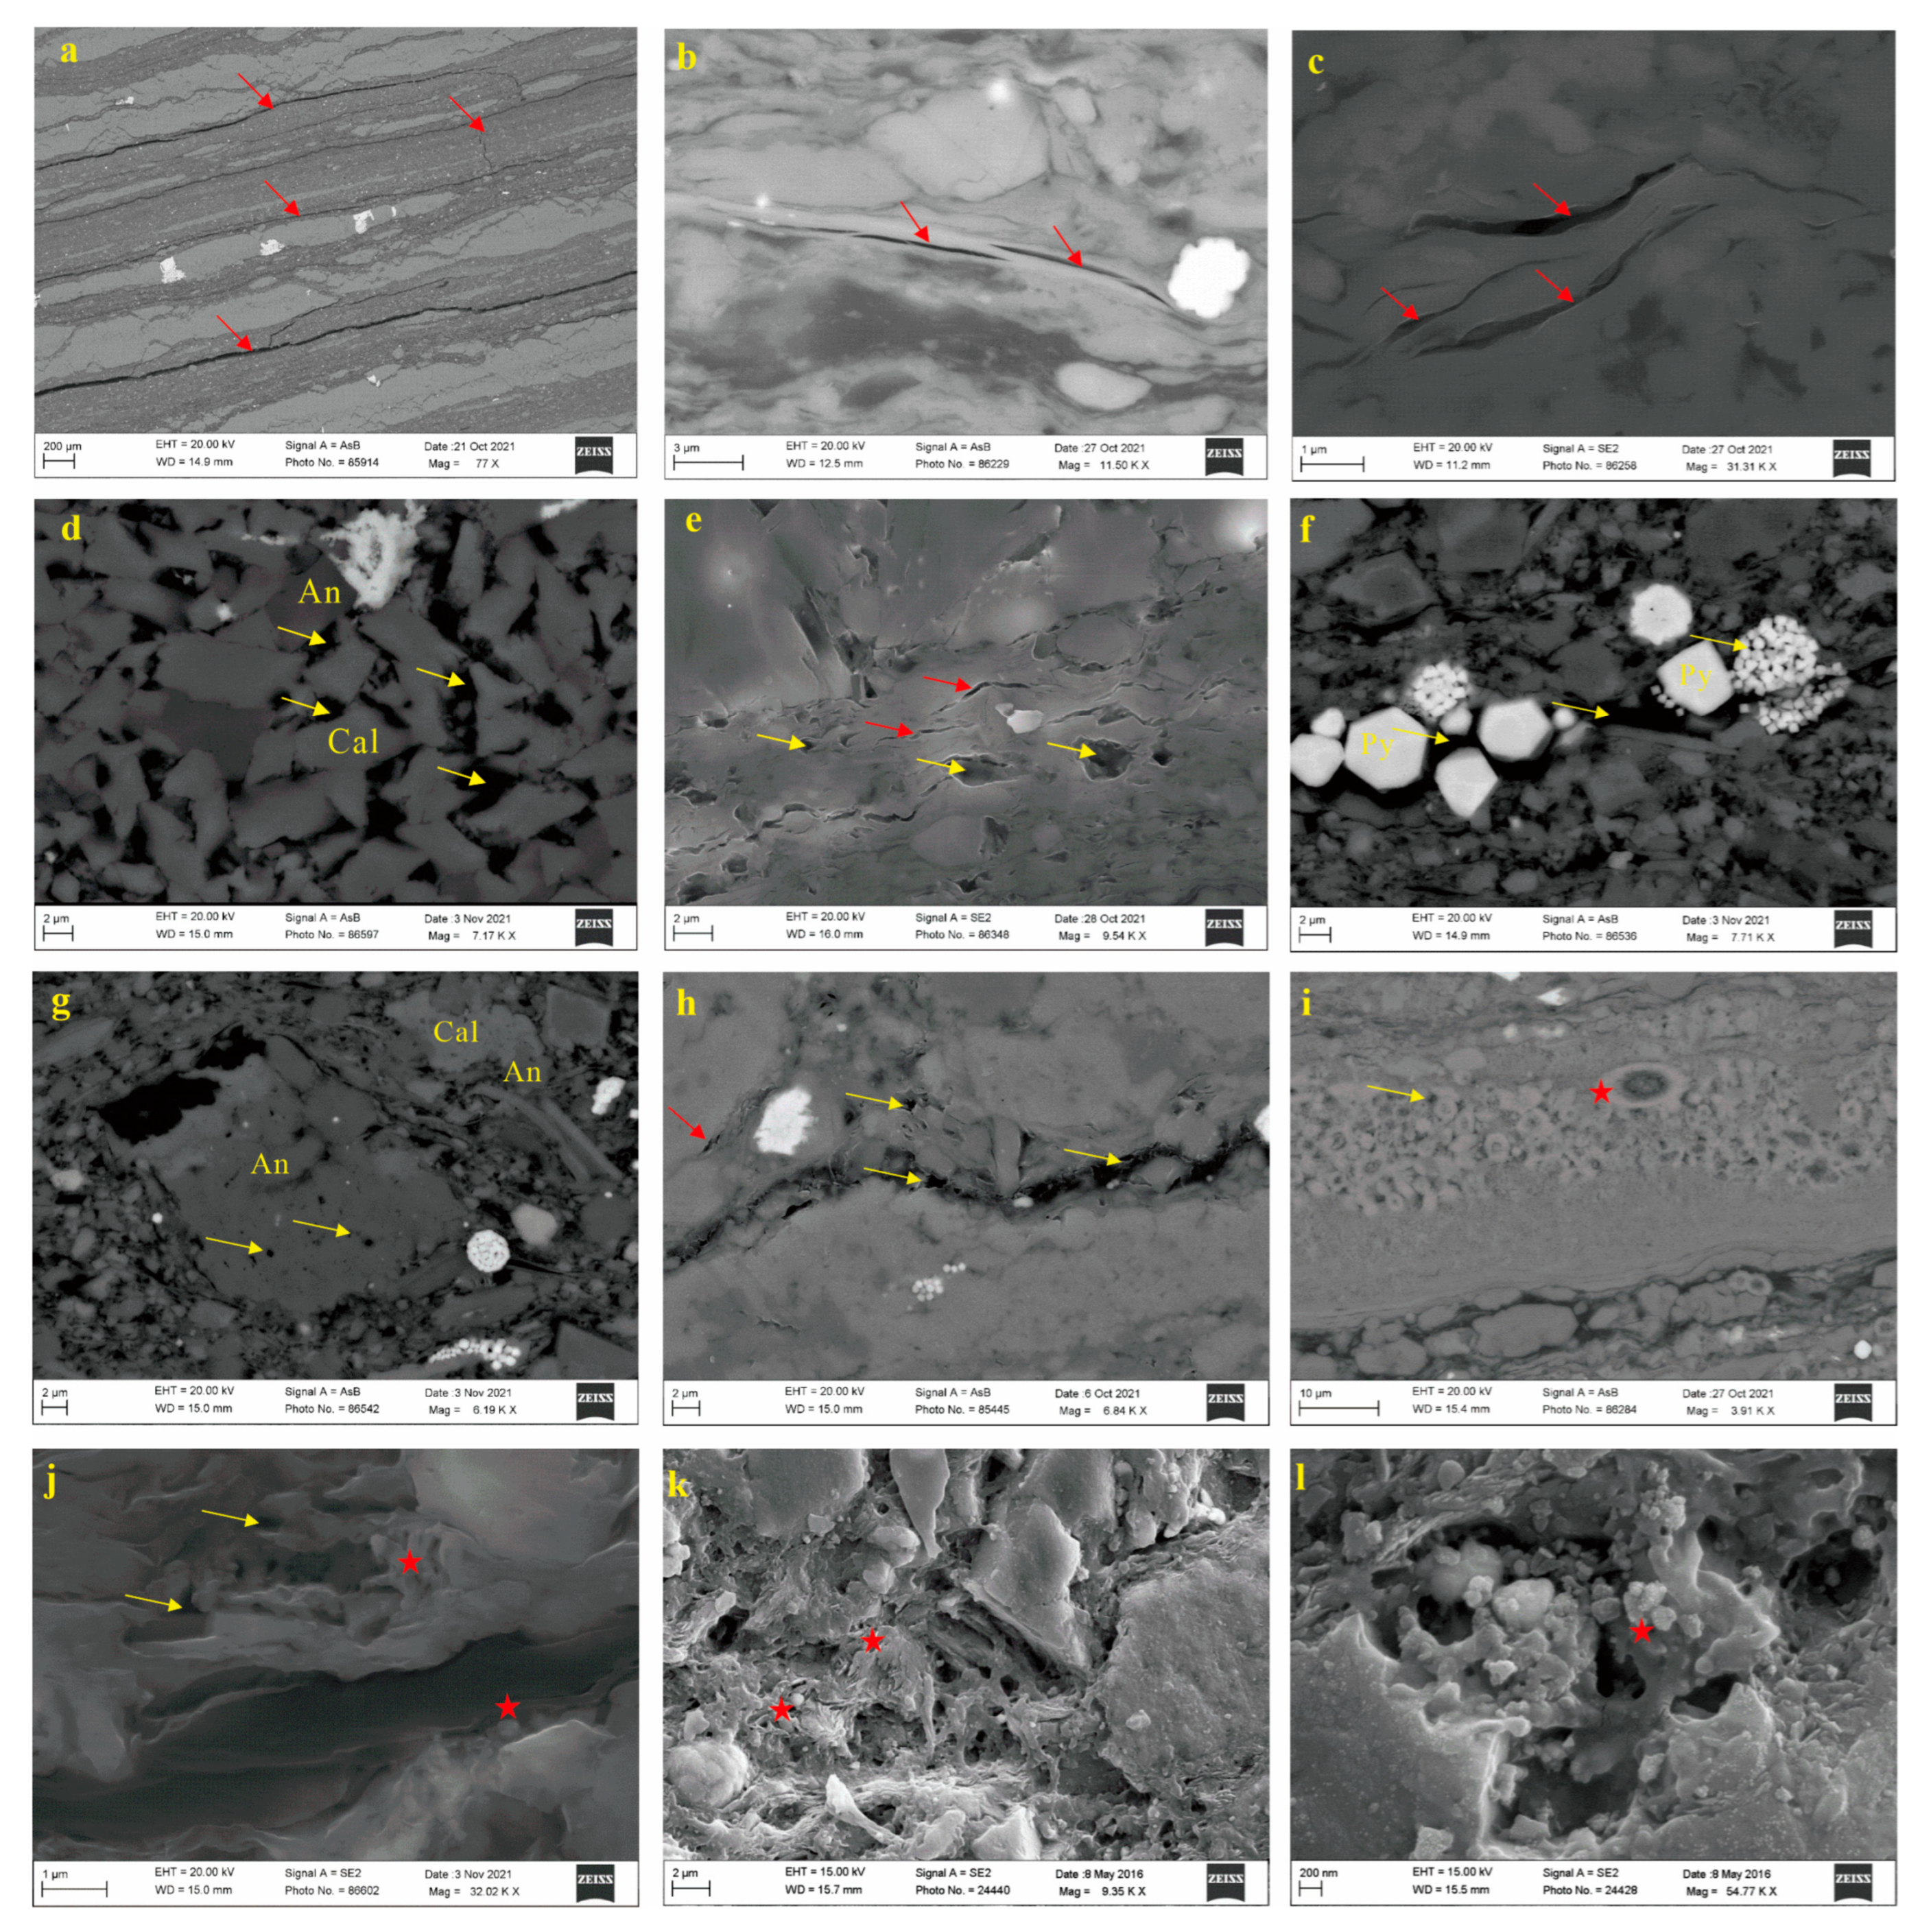
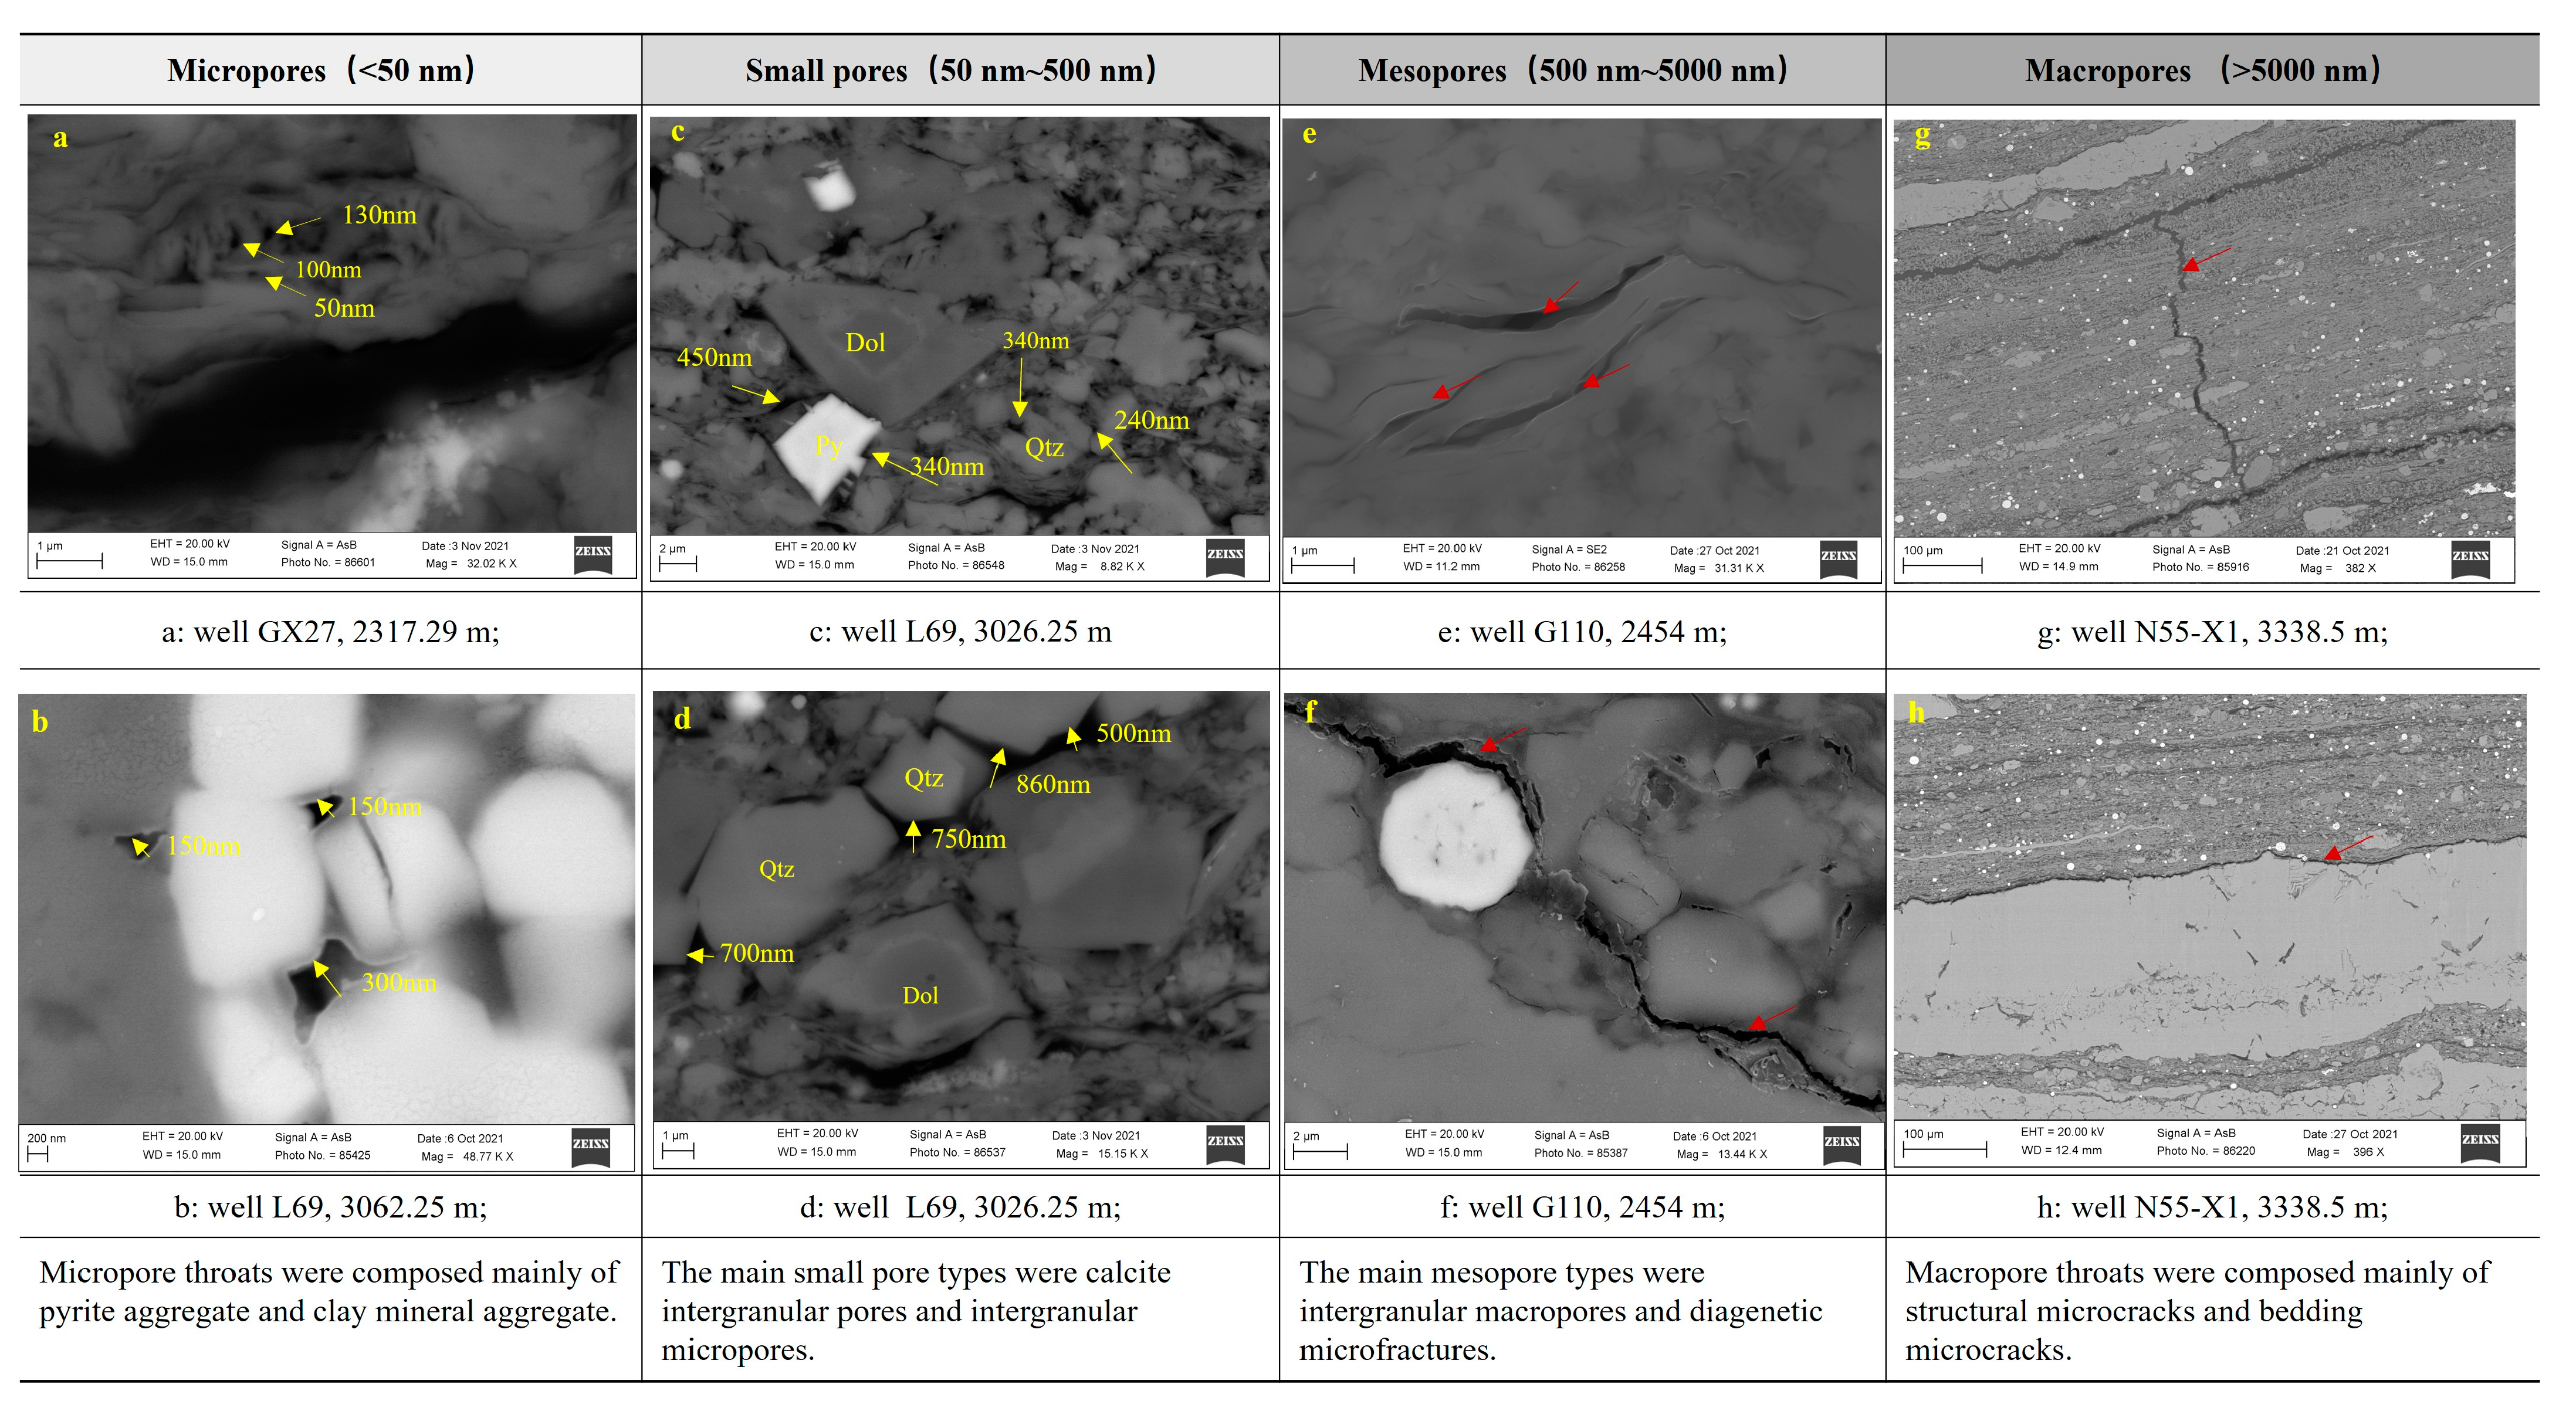
  • In this study, reservoir pores were classified into four categories: (i) micropores (<50 nm), predominantly associated with pyrite aggregates and clay mineral aggregates; (ii) small pores (50–500 nm), mainly comprising calcite intergranular pores and intergranular micropores; (iii) mesopores (500–5000 nm), dominated by intergranular macropores and diagenetic microfractures; and (iv) macropores (>5000 nm), consisting primarily of structural microcracks and bedding microcracks. The primary lithofacies (C1, C2, C3) exhibited medium to large pore throats and fractures, the development of which was controlled by mineral composition. These features serve as crucial reservoir spaces and migration pathways for shale oil. SEM observations revealed the spatial distribution and connectivity of these pores, demonstrating that microfractures and intergranular pores play a significant role in both oil storage and flow.
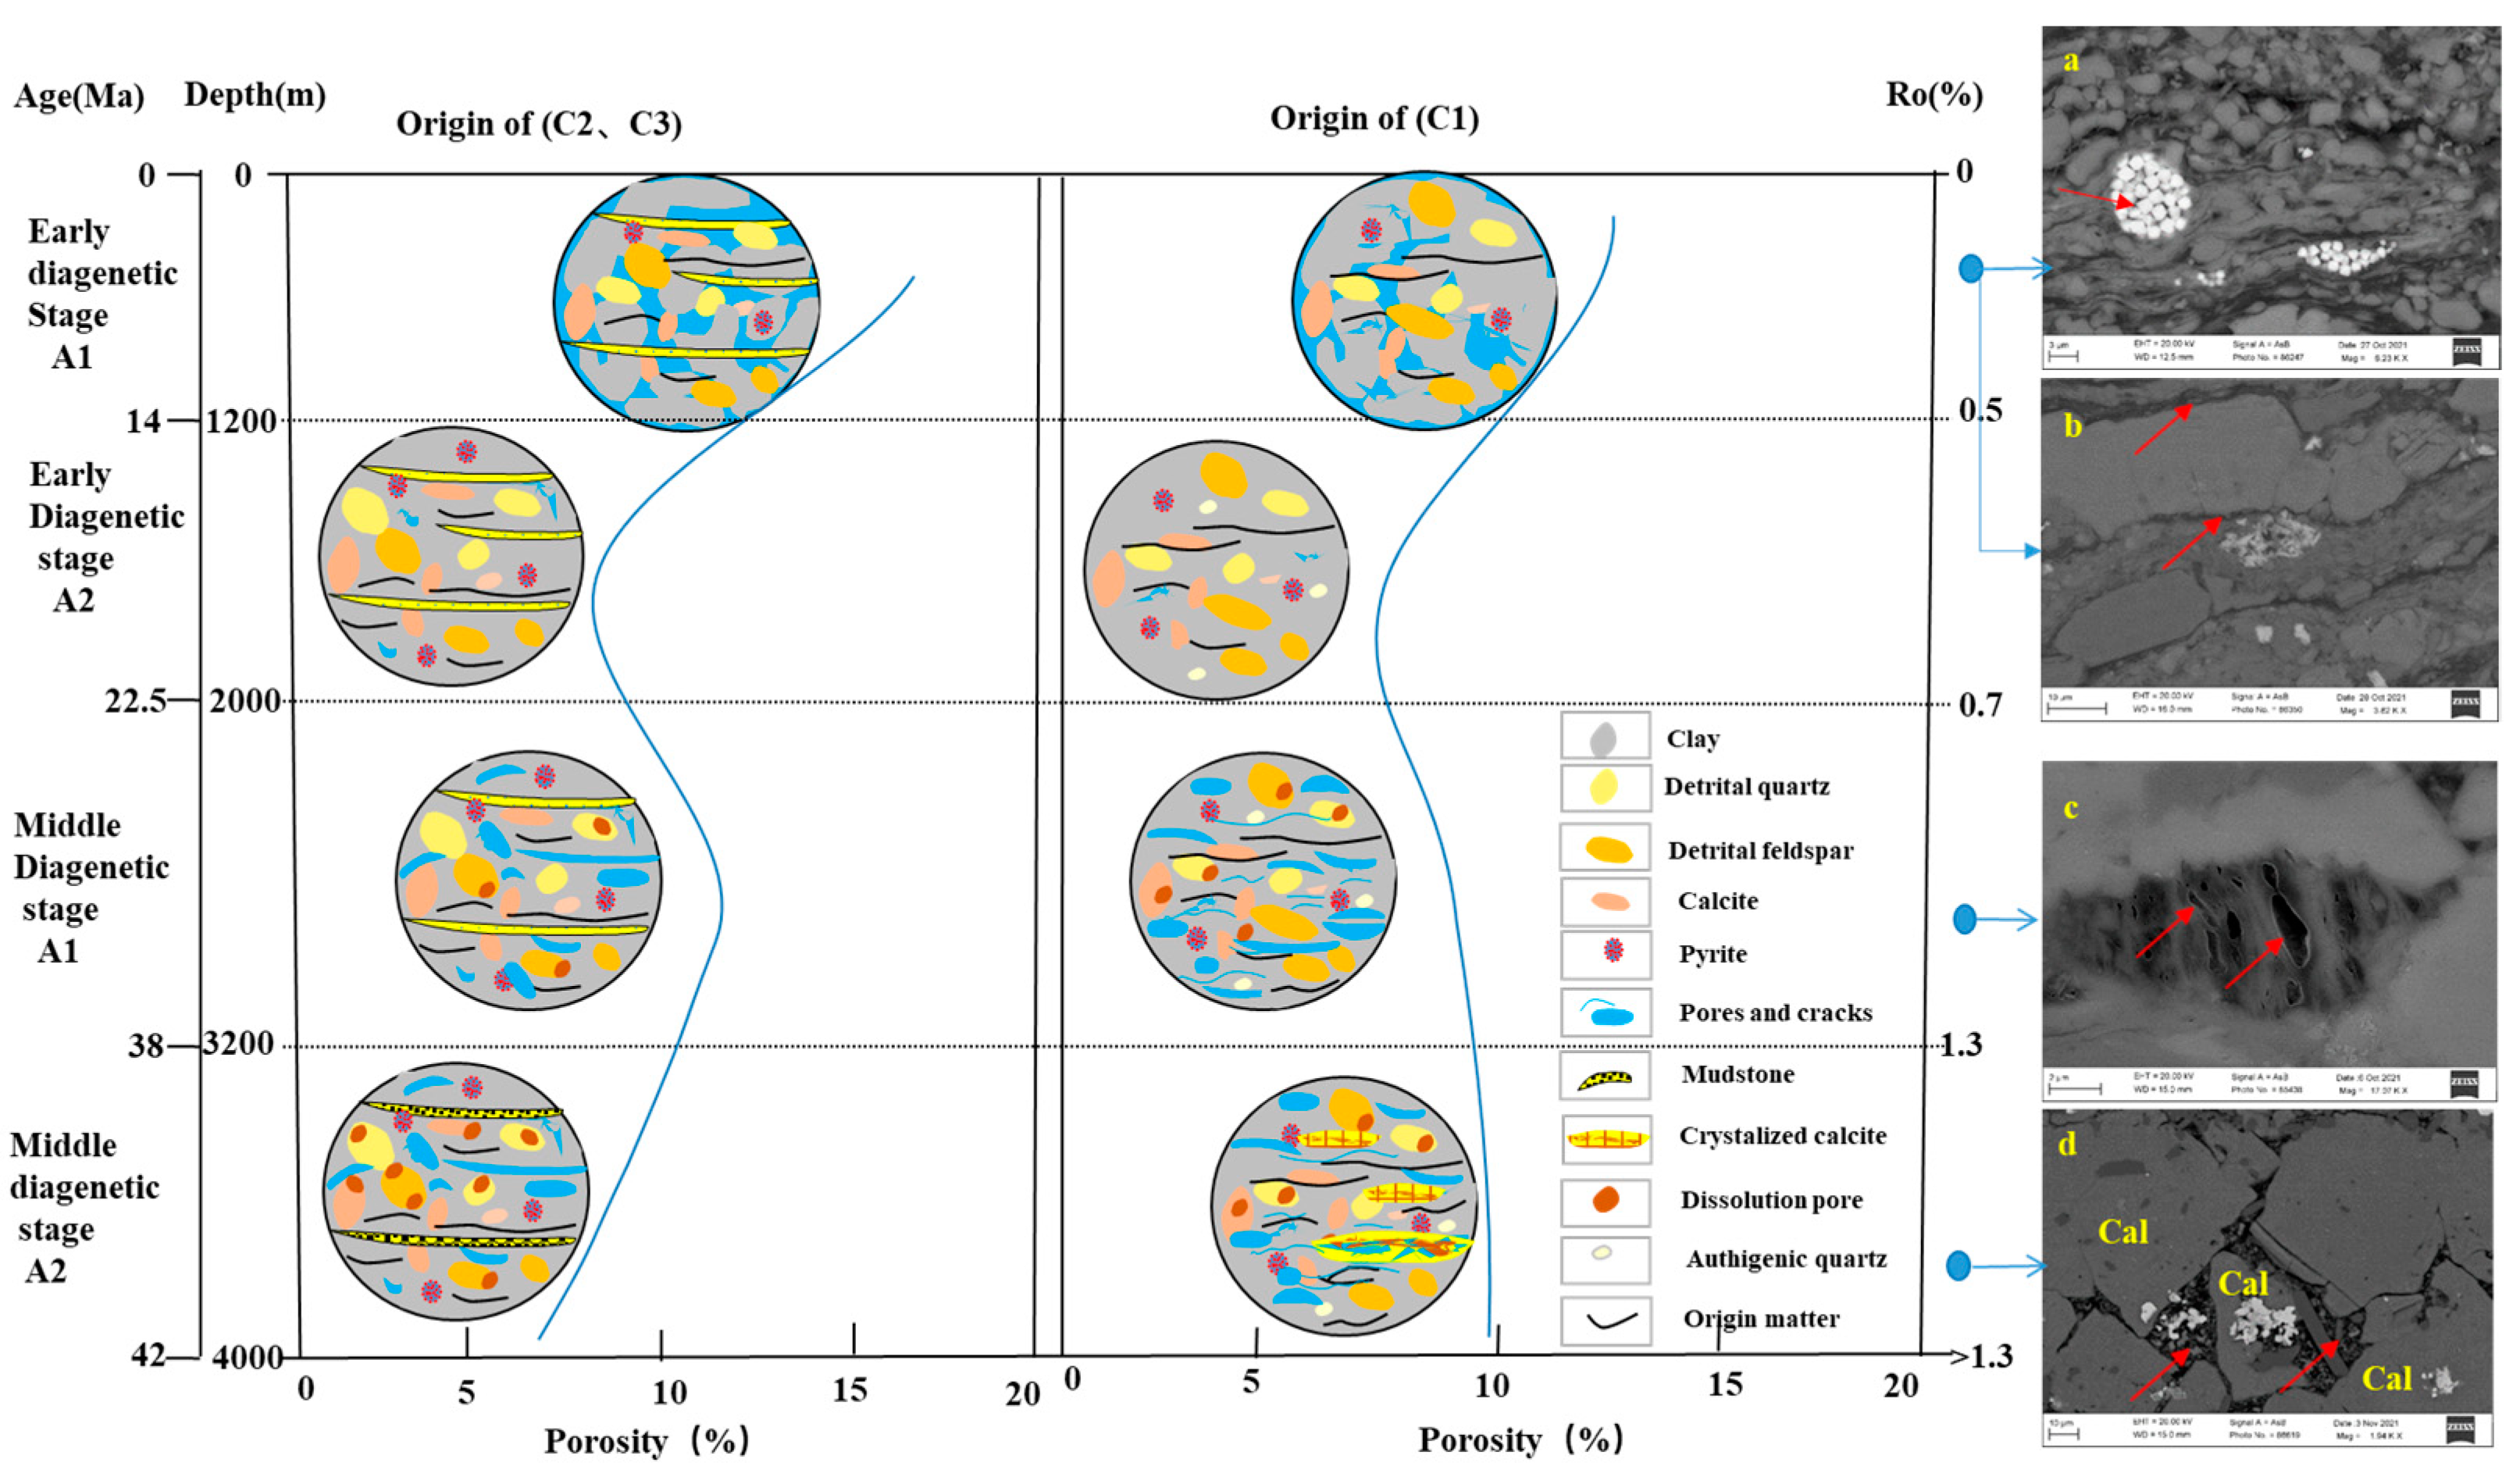
  • The formation of micrite (C2 and C3) was attributed primarily to favorable sedimentary conditions during the diagenetic stage. In contrast, C1 lithofacies formation was associated with overpressure, the formation of interlayer bedding, and the incomplete filling of grain calcite. The high-quality reservoir conditions in the combined lithofacies were the result of basic sedimentary lithofacies and diagenetic history.
This study presents a detailed characterization and genetic analysis of high-quality shale oil reservoirs in the Shahejie Formation of the Jiyang Depression based on lithofacies classification. The results demonstrate that lithofacies classification serves as a crucial tool for understanding shale oil reservoir characteristics and optimizing development strategies. However, the relationship between lithofacies and sedimentary microenvironments remains insufficiently studied, representing a key focus of our future research.

Author Contributions

Y.F.: conceptualization, methodology, formal analysis, writing—original draft, writing—review and editing, visualization. Z.R.: conceptualization, writing—review and editing, supervision. B.Y.: conceptualization, writing—review and editing, supervision, project administration. G.H.: methodology. C.B.: project administration. Q.C.: visualization. All authors have read and agreed to the published version of the manuscript.

Funding

This study was supported by the National Natural Science Foundation of China (Grants 42272136, 42102162 and 42302177).

Data Availability Statement

The data presented in this study are available upon request from the corresponding author. The data are not publicly available due to the confidentiality of the project.

Acknowledgments

We thank the Geological Scientific Research Institute of China Sinopec Shengli Oilfield Company for sample and data access; Ruixiang Chen and Siqi Chen for sample collection assistance and petrological observation; and the Resources Exploration Laboratory of China University of Geosciences Beijing for experimental support.

Conflicts of Interest

The authors declare no conflict of interest.

References

  1. Jiao, F.; Zou, C.; Yang, Z. Geological Theory and Exploration & Development Practice of Hydrocarbon Accumulation Inside Continental Source Kitchens. Pet. Explor. Dev. 2020, 6, 1067–1078. [Google Scholar] [CrossRef]
  2. Zou, C.; Yang, Z.; Zhu, R.; Zhang, G.; Hou, L.; Wu, S.; Tao, S.; Yuan, X.; Dong, D.; Wang, Y. Progress in China’s Unconventional oil & Gas Exploration and Development and Theoretical Technology. Acta Geol. Sin. 2015, 89, 938–971. [Google Scholar] [CrossRef]
  3. Long, S.; Peng, Y.; Lu, J. Identification and Applications of Micro to Macroscale Shale Lithofacies. J. Nanosci. Nanotechnol. 2021, 21, 659–669. [Google Scholar] [CrossRef]
  4. Su, S.; Cheng, C.; Jiang, Z.; Shan, X.; Makeen, Y.M.; Gao, Z.; Zhu, R.; Lawal, M.; Ayinla, H.A. Microscopic pore structure and connectivity of lacustrine shale of the Shahejie Formation, Zhanhua Sag, Bohai Bay Basin. Geoenergy Sci. Eng. 2023, 226, 211800. [Google Scholar] [CrossRef]
  5. Yu, B. Particularity of shale gas reservoir and its evaluation. Earth Sci. Front. 2012, 19, 252–258. [Google Scholar]
  6. Zhang, P.; Lu, S.; Li, J.; Wang, J.; Zhang, J.; Chen, G.; Huang, H.; Zhi, Q.; Yin, Y. Microscopic characteristics of pore-fracture system in lacustrine shale from Dongying Sag, Bohai Bay Basin, China: Evidence from scanning electron microscopy. Mar. Pet. Geol. 2023, 150, 106156. [Google Scholar] [CrossRef]
  7. Lu, S.; Xue, H.; Wang, M.; Xiao, D.; Huang, W.; Li, J.; Xie, L.; Tian, S.; Wang, S.; Li, J.; et al. Several key issues and research trends in evaluation of shale oil. Acta Pet. Sin. 2016, 37, 1309–1322. [Google Scholar] [CrossRef]
  8. Saraji, S.; Piri, M. The representative sample size in shale oil rocks and nano-scale characterization of transport properties. Int. J. Coal Geol. 2015, 146, 42–54. [Google Scholar] [CrossRef]
  9. Song, M.; Liu, H.; Wang, Y.; Liu, Y. Enrichment rules and exploration practices of Paleogene shale oil in Jiyang Depression, Bohai Bay Basin, China. Pet. Explor. Dev. 2020, 47, 225–235. [Google Scholar] [CrossRef]
  10. Zou, C.; Ma, F.; Pan, S.; Zhang, X.; Wu, S.; Fu, G.; Wang, H.W.; Yang, Z. Formation and distribution of global shale oil potential and the developments of continental shale oil theory and technology in China. Earth Sci. Front. 2023, 30, 128–142. [Google Scholar] [CrossRef]
  11. Lai, J.; Wang, G.; Pang, X.; Fan, X.; Zhou, Z.; Si, Z.; Xie, W.; Qin, Z. Effect of Pore Structure on Reservoir Quality and Oiliness in Paleogene Dongying Formation Sandstones in Nanpu Sag, Bohai Bay Basin, Eastern China. Energy Fuels 2018, 32, 9220–9232. [Google Scholar] [CrossRef]
  12. Li, J.; Li, H.; Jiang, W.; Cai, M.; He, J.; Wang, Q.; Li, D. Shale pore characteristics and their impact on the gas-bearing properties of the Longmaxi Formation in the Luzhou area. Sci. Rep. 2024, 14, 16896. [Google Scholar] [CrossRef] [PubMed]
  13. Ning, F. The main control factors of shale oil enrichment in Jiyang depression. Acta Pet. Sin. 2015, 36, 905–914. [Google Scholar] [CrossRef]
  14. Wu, H.; Du, Z.; Ji, Y.; Cao, H.; Meng, L.; Liu, H.; Ma, J. Diagenetic controls on pore structure variations in fan deltaic sandstones of the Eocene Shahejie Formation, Bohai Bay Basin, China: Implications for reservoir quality and oiliness heterogeneities. Geol. J. 2023, 58, 3191–3219. [Google Scholar] [CrossRef]
  15. Lazar, O.R.; Bohacs, K.M.; Macquaker, J.H.S.; Schieber, J.; Demko, T.M. Capturing Key Attributes of Fine-Grained Sedimentary Rocks in Outcrops, Cores, and Thin Sections: Nomenclature and Description Guidelines. J. Sediment Res. 2015, 85, 230–246. [Google Scholar] [CrossRef]
  16. Liu, H.; Yu, B.; Xie, Z.; Han, S.; Shen, Z.; Bai, C. Characteristics and implications of micro-lithofacies in lacustrine-basin organic-rich shale: A case study of Jiyang depression in Bohai Bay Basin. Acta Pet. Sin. 2018, 39, 16. [Google Scholar]
  17. Bai, C. The Genesis of Laminar Carbonates from Jiyang Sub-Basin and Their Implicate for Shale Oil Accumulation. Ph.D. Thesis, China University of Geosciences (Beijing), Beijing, China, 2019. [Google Scholar]
  18. Zhan, X.; Yang, W.; Feng, Q.; Zhan, Z.; Wei, S.; Zhang, Y.; Kang, H.; Cheng, T.; Zhao, H.; Cai, W. Genetically linked litho- and organo-facies in meter-scale cycles of lacustrine deposits within the Permian Lucaogou Formation in the Bogda Mountains, Northwest China: Implications for paleoenvironment and organic matter origin. Geoenergy Sci. Eng. 2024, 240, 213087. [Google Scholar] [CrossRef]
  19. Wu, X.; Xu, H.; Zhou, H.; Wang, L.; Jiang, P.; Wu, H. Improving lithofacies prediction in lacustrine shale by combining deep learning and well log curve morphology in Sanzhao Sag, Songliao Basin, China. Comput. Geosci. 2024, 193, 105735. [Google Scholar] [CrossRef]
  20. Wang, L.; Li, X.; Chen, Y.N.; Guo, W.; Pei, X.; Luo, C.; Tian, C.; Zhang, J.; Qi, N.; He, W.; et al. Identification and Application of Favorable Lithofacies Associations in the Transitional Facies of the Permian Longtan Formation in Central and Southern Sichuan Basin. Minerals 2025, 15, 198. [Google Scholar] [CrossRef]
  21. Wang, L.; Liu, B.; Bai, L.; Ma, L.; Yu, Z.; Huo, Q.; Taylor, K.G. Differential mineral diagenetic evolution of lacustrine shale: Implications for CO2 storage. Int. J. Coal Geol. 2024, 295, 104629. [Google Scholar] [CrossRef]
  22. He, T.; Zhou, Y.; Li, Y.; Xie, H.; Shang, Y.; Chen, T.; Zhang, Z. Research on the microscopic pore-throat structure and reservoir quality of tight sandstone using fractal dimensions. Sci. Rep. 2024, 14, 22825. [Google Scholar] [CrossRef] [PubMed]
  23. Wan, J.; Yu, Z.; Yuan, Y.; Huang, W.; Dong, Z.; Rezaee, R. Lithofacies classification and reservoir property of lacustrine shale, the Cretaceous Qingshankou formation, Songliao basin, northeast China. Mar. Pet. Geol. 2025, 173, 107262. [Google Scholar] [CrossRef]
  24. Liu, Y.; Wei, J.; Lin, J.; Yang, Y.; Ma, W.; Li, J.; Zhao, P.; Zeng, Q.; Wu, J. Research on the Shale Reservoir Sensitivity by Using the Mineral Analysis Method. ACS Omega 2024, 9, 20196–20205. [Google Scholar] [CrossRef] [PubMed]
  25. Li, H.; Li, S.; Tang, D.; Li, X. Source reservoir configuration and geological geochemical control of coal and shale. Sci. Rep. 2025, 15, 5753. [Google Scholar] [CrossRef]
  26. Rao, Q.; He, Z.; Dong, T.; Wang, W.; Wang, X.; Rao, L.; Wang, T.; Huang, L. Pore and fracture characteristics and diagenetic evolution mechanisms of low-maturity lacustrine shales from the Paleogene Shahejie Formation in the Jiyang Depression, Bohai Bay Basin, Eastern China. Mar. Pet. Geol. 2024, 170, 107154. [Google Scholar] [CrossRef]
  27. Zhao, T.; Xu, S.; Hao, F. Differential adsorption of clay minerals: Implications for organic matter enrichment. Earth Sci. Rev. 2023, 246, 104598. [Google Scholar] [CrossRef]
  28. Iqbal, M.A.; Rezaee, R.; Smith, G.; Ekundayo, J.M. Shale lithofacies controls on porosity and pore structure: An example from Ordovician Goldwyer Formation, Canning Basin, Western Australia. J. Nat. Gas Sci. Eng. 2021, 89, 103888. [Google Scholar] [CrossRef]
  29. Qu, Y.; Ouyang, S.; Gao, J.; Shi, J.; Wu, Y.; Cheng, Y.; Zhou, Z.; Lyu, Z.; Sun, W.; Wu, H. Pore Space Characteristics and Migration Changes in Hydrocarbons in Shale Reservoir. Fractal Fract. 2024, 8, 588. [Google Scholar] [CrossRef]
  30. Wang, X.; Zhu, X.; Lai, J.; Lin, X.; Wang, X.; Du, Y.; Huang, C.; Zhu, Y. Paleoenvironmental reconstruction and organic matter accumulation of the paleogene shahejie oil shale in the Zhanhua Sag, Bohai Bay Basin, Eastern China. Pet. Sci. 2024, 21, 1552–1568. [Google Scholar] [CrossRef]
  31. Fan, X.; Lu, Y.; Liu, Z.; Lu, Y.; Zhang, J.; Deng, K.; Zhou, T.; Tai, H.; Li, L. Lacustrine shale lithofacies and depositional environment in the paleocene second member of the funing formation, Subei basin, China: Insights into shale oil development prospects. Mar. Pet. Geol. 2024, 164, 106849. [Google Scholar] [CrossRef]
  32. Wang, L.; Golfier, F.; Tinet, A.J.; Chen, W.; Vuik, C. An efficient adaptive implicit scheme with equivalent continuum approach for two-phase flow in fractured vuggy porous media. Adv. Water Resour. 2022, 163, 104186. [Google Scholar] [CrossRef]
  33. Zhang, J.; Lin, L.; Li, Y.; Tang, X.; Zhu, L.; Xing, Y.; Jiang, S.; Jing, T.; Yang, S. Classification and evaluation of shale oil. Earth Sci. Front. 2012, 19, 322–331. [Google Scholar]
  34. Ji, Y. Petroleum Reservoir Geology; China University of Petroleum Press: Dongying, China, 2016. [Google Scholar]
  35. Nie, H.; Zhang, P.; Bian, R.; Wu, X.; Zhai, C. Characteristics of continental shale oil enrichment in China. Earth Sci. Front. 2016, 23, 55–62. [Google Scholar] [CrossRef]
  36. Song, G.; Xu, X.; Li, Z.; Wang, X. Factors controlling oil production from Paleogene shale in Jiyang depression. Oil Gas Geol. 2015, 36, 463–471. [Google Scholar] [CrossRef]
  37. Bai, C.; Yu, B.; Liu, H.; Xie, Z.; Han, S.; Zhang, L.; Ye, R.; Ge, J. The genesis and evolution of carbonate minerals in shale oil formations from Dongying depression, Bohai Bay Basin, China. Int. J. Coal Geol. 2018, 189, 8–26. [Google Scholar] [CrossRef]
  38. Li, B.; Pang, X.; Dong, Y.; Peng, J.; Gao, P.; Wu, H.; Huang, C.; Shao, X. Lithofacies and pore characterization in an argillaceous-siliceous-calcareous shale system: A case study of the Shahejie Formation in Nanpu Sag, Bohai Bay Basin, China. J. Pet. Sci. Eng. 2019, 173, 804–819. [Google Scholar] [CrossRef]
  39. Wang, H.; Yang, R.; Zhang, F.; Zhang, B. Research status and trends in the characterization of organic matter rich shale lithology. Geol. Sci. Technol. Inf. 2018, 37, 141–148. [Google Scholar] [CrossRef]
  40. Wang, W.; Liu, H.; Li, J. Paleogene shale fabric and typical lithofacies reservoir characteristics in Dongying Sag. Pet. Geol. Recovery Effic. 2024, 31, 1–16. [Google Scholar] [CrossRef]
  41. Wang, Y.; Zhao, X.; Gao, B. Characteristics of Structural Evolution in Jiyang Depression. J. Chengdu Univ. Technol. 2002, 29, 181–187. [Google Scholar]
  42. Wang, M.; Ma, R.; Li, J.; Lu, S.; Li, C.; Guo, Z.; Li, Z. Occurrence mechanism of lacustrine shale oil in the Paleogene Shahejie Formation of Jiyang Depression, Bohai Bay Basin, China. Pet. Explor. Dev. 2019, 46, 789–802. [Google Scholar] [CrossRef]
  43. Guo, X.; He, S.; Liu, K.; Song, G.; Wang, X.; Shi, Z. Oil generation as the dominant overpressure mechanism in the Cenozoic Dongying depression, Bohai Bay Basin, China. Am. Assoc. Pet. Geol. Bull. 2010, 12, 1859–1881. [Google Scholar] [CrossRef]
  44. Wang, M.; Chen, Y.; Bain, W.M.; Song, G.; Liu, K.; Zhou, Z.; Steele-MacInnis, M. Direct evidence for fluid overpressure during hydrocarbon generation and expulsion from organic-rich shales. Geology 2020, 48, 374–378. [Google Scholar] [CrossRef]
  45. Wei, W.; Lu, Y.; Ma, Y.; Zhang, J.; Song, H.; Chen, L.; Liu, H.; Zhang, S. Nitrogen isotopes as paleoenvironmental proxies in marginal-marine shales, Bohai Bay Basin, NE China. Sediment Geol. 2021, 421, 105963. [Google Scholar] [CrossRef]
  46. Zhang, S.; Liu, H.; Song, G.; Wang, Y.; Chen, S.; Zhang, S. Genesis and Control factors of Shale Oil Reserving Space in Dongying Depression. Acta Pet. Sin. 2016, 37, 1495–1507, 1527. [Google Scholar] [CrossRef]
  47. Liu, C.; Xia, B. Relationship between cenozoic tectonic evolution and play in Jiyang depression. Nat. Gas Geosci. 2007, 18, 209–214. [Google Scholar] [CrossRef]
  48. Wu, M.; Yuan, S. Geological Research and Exploration Practice in Shengli Oil Region; Petroleum University Press: Dongying, China, 1992. [Google Scholar]
  49. Zhao, Z. Principle of Adsorption Application; Chemical Industry Press: Beijing, China, 2005. [Google Scholar]
  50. Sun, M. Characteristics of Pore Structure and Its Constrainson Gas Accumulation and Migration in Marine Shaleof South China; China University of Geosciences (Beijing): Beijing, China, 2017. [Google Scholar]
  51. Cao, Y.; Jin, Z.; Zhu, R.; Liu, K. Pore systems and their correlation with oil enrichment in various lithofacies of saline lacustrine shale strata. Int. J. Coal Geol. 2024, 282, 104444. [Google Scholar] [CrossRef]
  52. SY/T 5336-2006; Petroleum and Natural Gas Industry Standards of the People’s Republic of China: Core Sampling and Analysis Methods. National Energy Administration: Beijing, China, 2006.
  53. SY/T 5346-2005; Petroleum and Natural Gas Industry Standards of the People’s Republic of China: Methods for Measurement of Rock Permeability under Overburden Pressure. National Energy Administration: Beijing, China, 2005.
  54. Peng, J.; Zeng, Y.; Yang, Y.; Yu, L.; Xu, T. Discussion on classification and naming scheme of fine-grained sedimentary rocks. Pet. Explor. Dev. 2022, 49, 106–115. [Google Scholar] [CrossRef]
  55. Zhu, X. Sedimentary Petrology; Petroleum Industry Press: Beijing, China, 2008. [Google Scholar]
  56. Loucks, R.G.; Ruppel, S.C. Mississippian Barnett Shale: Lithofacies and depositional setting of a deep-water shale-gas succession in the Fort Worth Basin, Texas. Am. Assoc. Pet. Geol. Bull. 2007, 91, 579–601. [Google Scholar] [CrossRef]
  57. Jiao, K.; Yao, S.; Liu, C.; Gao, Y.; Wu, H.; Li, M.; Tang, Z. The characterization and quantitative analysis of nanopores in unconventional gas reservoirs utilizing FESEM–FIB and image processing: An example from the lower Silurian Longmaxi Shale, upper Yangtze region, China. Int. J. Coal Geol. 2014, 128–129, 1–11. [Google Scholar] [CrossRef]
  58. Loucks, R.G.; Reed, R.M.; Ruppel, S.C.; Hammes, U. Spectrum of pore types and networks in mudrocks and a descriptive classification for matrix-related mudrock pores. Am. Assoc. Pet. Geol. Bull. 2012, 96, 1071–1098. [Google Scholar] [CrossRef]
  59. Lu, S.; Li, J.; Zhang, P.; Xue, H.; Wang, G.; Zhang, J.; Liu, H.; Li, Z. Classification of microscopic pore-throats and the grading evaluation on shale oil reservoirs. Pet. Explor. Dev. 2018, 45, 436–444. [Google Scholar] [CrossRef]
  60. Slatt, R.M.; O’Brien, N.R. Pore types in the Barnett and Woodford gas shales: Contribution to understanding gas storage and migration pathways in fine-grained rocks. Am. Assoc. Pet. Geol. Bull. 2011, 95, 2017–2030. [Google Scholar] [CrossRef]
  61. Jiang, Z.; Zhang, W.; Liang, C.; Wang, Y.; Liu, H.; Chen, X. Characteristics and evaluation elements of shale oil reservoirs. Acta Pet. Sin. 2014, 35, 184–196. [Google Scholar]
  62. Lu, S.; Zhang, M. Oil and Gas Geochemistry; Petroleum Industry Press: Beijing, China, 2017. [Google Scholar]
  63. Liu, L.; Min, L.; Sun, Z.; Pei, L.; Gu, H. Pore structure and percolation characteristics in shale oil reservoir of Jiyang Depression. Pet. Geol. Recovery Effic. 2021, 28, 106–114. [Google Scholar] [CrossRef]
  64. Wang, R.; Hu, Z.H.; Dong, L.; Gao, B.; Sun, C.; Yang, T.; Wang, G.; Yin, S. Advancement and trends of shale gas reservoir characterization and evaluation. Oil Gas J. 2021, 42, 54–65. [Google Scholar] [CrossRef]
  65. Suess, E. Interaction of organic compounds with calcium carbonate-II. Organo-carbonate association in Recent sediments. Geochim. Cosmochim. Acta 1973, 37, 2435–2447. [Google Scholar] [CrossRef]
  66. Zhao, W.; Zhu, R.; Hu, S.; Hou, L.; Wu, S. Accumulation contribution differences between lacustrine organic-rich shales and mudstones and their significance in shale oil evaluation. Pet. Explor. Dev. 2020, 47, 1079–1089. [Google Scholar] [CrossRef]
  67. Liu, L.; Zhu, N. Pollen-based Reconstructions of the Ek1 and the Lower Part of Es4 of the Paleogene Vegetation and Climatic Characteristics in Dongying Depression. Sustain. Dev. Nat. Resour. 2013, 616–618 Pt 1–3, 1557–1560. [Google Scholar] [CrossRef]
  68. Zolitschka, B.; Negendank, J.F.W. High-resolution records from European Lakes. Quat. Sci. Rev. 1999, 18, 885–888. [Google Scholar] [CrossRef]
  69. Zhang, S.; Liu, H.; Wang, M.; Fu, A.; Bao, Y.; Wang, W.; Teng, J.; Fang, Z. Pore evolution of shale oil reservoirs in Dongying sag. Acta Pet. Sin. 2018, 39, 754–766. [Google Scholar] [CrossRef]
  70. Zhang, S.; Liu, H.; Wang, Y.; Zhang, S.; Zhang, K.; Wang, M.; Wang, Y.; Fu, A.; Bao, Y. Diagenetic event of Paleogene shale and its influence on development characteristics of shale pore space in Dongying Sag. Pet. Geol. Recovery Effic. 2019, 26, 109–118. [Google Scholar] [CrossRef]
Figure 1. Structural and stratigraphic characteristics of the study area. (a) The location of the Bohai Bay Basin. (b) Locations of sampling wells and simplified structural framework in the Jiyang Depression. (c) Stratum in the study area. Es3—third member of the Shahejie Formation, Es4—fourth member of the Shahejie Formation. The red box outlines indicates the main target stratum [44].
Minerals 15 00406 g001
Figure 2. Distribution characteristics of main mineral components, felsic (quartz + feldspar), carbonate (calcite, dolomite, aragonite), and clay minerals: (a) well FY1; (b) well L69; (c) well NY1; (d) 37 test samples. In this study, the XRD and TOC data of the Shengli Oilfield were collected. The XRD data and TOC data were derived from four wells, namely FY1, NY1, N55-X1, and L69.
Minerals 15 00406 g002
Figure 3. Core and microscope photos. Core sampling (a) and micrograph (b) of well N55-X1, 3338.5 m; core and microscope photos. Core sampling (c) and micrograph (d) of well N55-X1, 3429.9 m; core and microscope photos. Core sampling (e) and micrograph (f) of well FY1, 3377.05 m; core and microscope photos. Core sampling (gi) of wells N55-X1, 3089.54 m; L69, 2940.6 m; and FY1, 3378.75 m, respectively. Yellow arrows indicate carbonate interlayers; pentagrams show discontinuous lenses.
Minerals 15 00406 g003
Figure 4. Well: NY1 composite columnar section based on lithofacies classification.
Minerals 15 00406 g004
Figure 5. Pore volume distribution under three-dimensional micrometer CT. Pore volume distribution (a) and three-dimensional photographs (b) of well L69, 3062.2 m; pore volume distribution (c) and three-dimensional photographs (d) of well L69, 3026.5 m.
Minerals 15 00406 g005
Figure 6. Characteristics of pore and fractures under scanning microscope. (a) Well N55-X1, 3338.5 m, structural fractures; (b) well N55-X1, 3338.5 m, shrinkage fractures formed by dehydration of clay minerals; (c) well G110, 2454 m, microfractures formed by shrinkage of organic matter; (d) well GX27, 2317.29 m, intergranular pores; (e) well N55-X1, 3509.55 m, intergranular pores and dissolution pores in the muddy layer; (f) well L69, 3026.25 m, intragranular pores in pyrite; (g) well L69, 3026.25 m, dissolution pores in anorthite; (h) well L69, 3062.2 m, pores and microfractures formed by organic matter shrinkage; (i) well G110, 2454 m, pores formed by organic matter shrinkage (the pentagram shows biological fossils); (j) well GX27, 2317.29 m, pores formed by organic matter shrinkage (pentagrams show biological spherical particles); (k) well FY1, 3377.05 m, pores formed by organic matter shrinkage (pentagrams show rod-shaped bacteria); (l) well FY1, 3377.05 m, pores formed by organic matter shrinkage (pentagram shows biological spherical particles). Red arrows indicate fractures, yellow arrows indicate pores, Cal—calcite, An—anorthite, Py—pyrite.
Minerals 15 00406 g006
Figure 7. (a) Relationship between radius of pore throat and pore volume based on low-pressure nitrogen adsorption (single pore); (b) relationship between radius of pore throat and pore volume based on low-pressure nitrogen adsorption (cumulated pores); (c) relationship between Radius of pore throat and pore volume based on the high-pressure mercury intrusion test (single pore); (d) relationship between radius of pore throat and pore volume based on the high-pressure mercury intrusion test (cumulated pores).
Minerals 15 00406 g007
Figure 8. (a) Porosity distribution of different lithofacies. (b) Permeability distribution of different lithofacies. (c) TOC distribution of different lithofacies.
Minerals 15 00406 g008
Figure 9. Comparison of pore volume distributions in different lithofacies. (a) Pore volume vs pore size (nitrogen adsorption method). (b) Volume of mercury ingested vs pore size (mercury injection method).
Minerals 15 00406 g009
Figure 10. The proportion of pore types of different lithofacies ((ae): C1, C3, C2, L2, L3).
Minerals 15 00406 g010
Figure 11. Pore characteristics at different scales. (a) Clay mineral aggregates. (b) Pyrite intragranular pores. (c) Calcite intergranular pores. (d) Calcite intergranular pores. (e) Clay mineral dehydration cracks. (f) Organic matter shrinkage cracks. (g) Structural microcracks. (h) Bedding microcracks. Red arrows indicate cracks, yellow arrows indicate pores.
Minerals 15 00406 g011
Figure 12. Genetic evolution model of composite lithofacies. (a) Pores in pyrite aggregates. (b) Pores between mud crystals and clay. (c) Organic pores. (d) Intergranular pores. Red arrows indicate pores, blue arrows indicate pores formation stage.
Minerals 15 00406 g012
Table 1. Sample information for SEM.
SampleWellDepthMemberLithofacies
1L693136.05Es4L2
2L693041.55Es3L2
3L673140.5Es4C3
4G1102453.4Es4C3
5L693066.6Es3C3
6L693081.65Es3C3
7W312492.4Es3C3
8N55-X13338.5Es3C2
9G1102454Es4C2
10N55-X13509.55Es4C2
11FY13418.35Es4C1
12L693026.25Es3C1
13L693062.2Es3C1
14N55-X13581.8Es4C1
15GX272317.29Es4C1
Table 2. The results of X-ray diffraction.
SampleDepth (m)LocationMineral (%)
FelsicCarbonate MineralsPyriteGypsumClay Minerals
QuartzFeldsparPlagioclaseCalciteDolomiteAragonite
L67-1-23a3140.5019.9 60.47.0 4.1 18.6
L67-1-23b3140.50211.1 56.411.2 3.90.317.1
L67-1-24a3146.2618.8 61.59.5 4.2 16.0
L67-1-24b3146.26210.0 61.28.7 4.1 16.0
L67-1-25a3158.85110.2 62.68.0 3.4 15.8
L67-1-25b3158.85211.3 61.17.8 3.4 16.4
L67-1-46a3159.7619.3 63.9/ 2.6 24.2
L67-1-46b3133.36220.7 11.414.7 6.4 46.8
L67-1-373060.60 13.9 43.813.6 3.4124.3
L67-1-473060.60 9.7 69.24.8 16.3
L69-1-27a3081.6517.4 68.19.5 3.0 12.0
L69-1-27b3081.6529.6 61.47.8 3.9 17.3
L69-1-30a3096.9517.0 68.510.4 2.7 11.4
L69-1-30b2911.1528.4 62.38.9 3.2 17.2
L69-1-312948.35 5.7 71.56.9 2.8 13.1
L69-1-393061.70 15.0 2.937.26.4 4.0 34.5
L69-1-403061.70 12.3 34.45.3 3.2 44.8
L69-1-44a3041.55110.7 60.76.0 4.2 18.4
L69-1-44b3041.55218.3 223.29.5 5.8 41.2
L69-1-483057.30 9.6 66.4 5.3 18.7
L69-1-493058.70 7.8 71.9 3.4 16.9
L69-1-503062.00 9.1 75.5 2.0 13.4
L69-1-513061.00 6.6 77.4 2.6 13.4
L69-1-523078.00 5.7 73.6 5.0 15.7
L69-1-533048.70 7.8 67.83.6 5.0 15.8
L69-1-533048.70 13.9 19.216.2 6.1 44.6
G110-1-102444.20 8.8 47.525.8 1.7 16.2
G110-1-12a2446.5019.7 54.98.2 2.7 24.5
G110-1-12b2446.5029.5 48.68.7 7.9 25.3
G110-1-132447.20 7.82.1 1.6 63.78.9 15.9
G110-1-142452.20 5.8 64.815.0 2.0 12.4
G110-1-15a2452.50114.8 7.4 44.212.8 20.8
G110-1-15b2452.50215.8 5.35.420.0 4.8 48.7
G110-1-162453.40 8.4 62.113.1 16.4
G110-1-332444.80 18.2 4.67.611.5 6.4 51.7
G110-1-342447.85 11.5 3.335.811.6 5.4 32.4
G110-1-352449.80 10.5 3.136.514.9 3.8 31.2
Note: Location 1 and 2 represent the bright and dark-colored bands of the sample.
Table 3. The results of porosity, permeability, and TOC.
NameMin25%MeanMedian75%Max
Porosity (n = 342, %)1.20 4.00 5.45 5.10 6.50 15.20
Permeability (n = 316, md)0.01 0.22 5.26 0.73 3.07 153.00
TOC (n = 468)0.26 2.04 3.03 2.53 3.50 11.83
Table 4. The comparison between the lithofacies division in this study and those before.
CategoryNumberLithofacies [17] Lithofacies Code
[17]
LithofaciesLithofacies Code
(This Paper)
DescriptionSedimentary Environment
Lithofacies combination1Thin, lens-shaped grain limestoneLF1Combination lithofacies of shale and lenticular crystal limestoneC1Shale and carbonate minerals are interbedded, and carbonate mineral crystals are thick, bright, and distributed in a thin, lens-like or slightly thin, long, lens-like patterndeep lake
2Laminated mudstone limestoneLF2Combination lithofacies of continuous parallel planar calcareous mudstone and uncontinuous laminate mudstone C2Carbonate mineral crystals are small and composed mainly of mud crystals, with continuous distribution of laminatessemideep lake environment
3 Combination lithofacies of continuous parallel planar calcareous mudstone and continuous laminate mudstoneC3Compared with C2, continuous layered structures have developedsemideep lake environment
Argillaceous limestone4 Continuous parallel planar argillaceous limestoneL1Compared with L2, there are differences in compositionshallow lake
Calcareous mudstone5Thick, block-shaped calcareous mudstoneLF3Continuous parallel planar calcareous mudstoneL2Gray mudstone with continuous distribution of laminatesdeep lake
Mudstone6Block-shaped calcareous mudstone LF4Continuous parallel planar argillaceous rockL3Compared with L4, continuous layered structures have developeddeep lake
7Massive argillaceous rockL4Massive mudstone, composed mainly of clay mineralsdeep lake
Shale8ShaleLF5ShaleL5The color is mostly dark and has a good page structure formed by the directional arrangement of clay mineralsdeep lake
Table 5. Results of the nitrogen adsorption experiment.
WellDepthLithofaciesSampleMaximum Pore Throat Radius (nm)Average Pore Throat Radius (nm)Surface Area, m2/gPore Volume
(Cumulative), cm3/kg
G17-X103224.4L41180.82.97127.20627
G17-113275.85L42181.03.14941.61537
G17-113168.60L33209.42.9756.75211
G17-113282.70L34264.93.1463.1429
G17-X103152.50L25216.53.1403.3817
G17-113166.00L26197.62.9763.0176
G17-X103168.70C37186.73.1362.6646
G17-X103221.34C38182.33.3223.2069
G17-X103171.64C29200.33.7161.5444
G17-X103168.09C210221.83.7180.843
G17-X103176.60C111199.72.9760.8593
G17-X103203.25C112227.63.1482.4730.006
Table 6. Results of the mercury injection test.
WellSampleDepth (m)LithofaciesMemberPorosity (%)Average Porosity (%)Maximum Mercury
Saturation (%)
Pore Volume (Cumulative) (μL)Average Pore Throat Radius (nm)
FY113201.49C1Es34.174.3535.0114.6018,500
FY123180.34C1Es34.5329.6114.3219,250
FY133267.51C3Es43.243.3834.8511.2929,030
FY143090.74C3Es33.5235.5312.5019,920
FY153135.06C2Es33.183.3136.9311.7121,710
FY163257.37C2Es43.4528.7910.3519,120
FY173120.85L2Es32.442.7527.996.8317,330
FY183098.26L2Es33.0624.667.5220,610
FY193367.33L3Es43.193.0329.239.326784
FY1103376.44L3Es42.8818.587.175399
Disclaimer/Publisher’s Note: The statements, opinions and data contained in all publications are solely those of the individual author(s) and contributor(s) and not of MDPI and/or the editor(s). MDPI and/or the editor(s) disclaim responsibility for any injury to people or property resulting from any ideas, methods, instructions or products referred to in the content.

