Abstract
A novel artificial intelligence (AI) application was proposed in the current study to predict CTF’s compressive strength (CS). The database contained six input parameters: the age of curing for specimens (AS), cement–sand ratio (C/S), maintenance temperature (T), additives (EA), additive type (AT), additive concentration (AC), and one output parameter: CS. Then, adaptive boosting (AdaBoost) was applied to existing AI and soft computing techniques, using AdaBoost, random forest (RF), SVM, and ANN. Data were arbitrarily separated into training (70%) and test (30%) sets. Results confirm that AdaBoost and RF have the best prediction accuracy, with a correlation coefficient (R2) of 0.957 between these sets for AdaBoost. Using Python 3.9 (64-bit), IDLE (Python 3.9 64-bit), and PyQt5 to achieve the machine learning model computation and software function interface development, the application of this software can quickly predict the strength property of CTF specimens, which saves time and costs efficiently for backfill researchers and developing new eco-efficient components.
1. Introduction
Mining with backfill [1] is frequently implemented by most mines due to its significant advantages of effective control of surface subsidence [2], adaptability to the mining conditions of the ore body [3], and high recovery rate [4]. To achieve the ‘double carbon’ goal, low and zero carbon technologies will be a priority in every sector [5]. The regions with high energy consumption businesses like iron–steel, metal, cement, and chemical will face the same challenges [6]. New carbon peaking and carbon neutrality materials (e.g., buildings [7], steel [8], cement [9], and backfill [10,11] have emerged and recently become an issue of many scientific works. With the concept of resource use of solid waste gaining popularity, fill materials made by mixing additives into tailings [12] and filling them into tunneling [13], underground spaces [14], and mined-out hollow areas can not only absorb a large amount of surface tailings but also run backing for nearby rocks’ stability in underground mines [15]. Scholars have explored the mechanical features and stability of external additives such as polypropylene [16], glass [17], steel [18], nano-cellulose [19] and carbon nanotubes [20] fibers, and 3D printing reinforcement [21] and found that the strength of cemented tail fill (CTF) is closely linked to their cure time [22], cements/tails ratio [23], curing temperature [24], and additive type [25,26] and also analyzed the extreme difference and variance of compressive/tensile strengths and slump of polypropylene/glass fibers and slag and obtained the degree of influence of the three factors of polypropylene fiber, glass fiber, and slag on CTB’s tensile strengths and slump consistencies.
Jeon et al. [27] explored the strength of cement mortar having diverse lengths of polypropylene fibers and water–cement ratios as a function of curing time. It was pointed out that polypropylene fiber reinforcement was mainly in the form of staggering, bridging, drawing, and strength features of cement-based materials. Li et al. [28] inspected the impact of diverse fiber forms (steel, polypropylene, and cellulose) on concrete’s strength, and results revealed that adding fiber to specimens builds further strength gains. Xiao et al. [29] inspected the strength features of a slag-filled body having an increased amount of slag-based tailings; the additive of steel tailings slag and cement clinker can improve the slurry fluidity. Steel slag and clinker [30] do not react with the hydration products in the composite material system but only influence the rate/degree of hydration by changing the hydration environment of each other. Nano-cellulose [31] inhibits the growth of cracks on a nanoscale, improving composites’ micro-structure and strength. Gwon et al. [32] scrutinized the impacts of microfiber cellulose nanocrystals and fibers on the strength features of cement composites [33]. Carbon nanotubes [34] doped into cemented materials are better bonded with the matrix and cover a ‘linking function’ to develop strength and toughness between the matrix, while carbon nanotubes can also play a ‘small size effect’ to effectively fill the pores of the mortar and influencing cement-based materials’ microscopic morphology and strength properties. Khan et al. [35] applied carbon nanotubes to cement stone, which accelerated the hydration of cement and improved its macro-mechanical properties. Three-dimensional printing has the advantages of shortening the construction cycle, reducing construction costs, and improving security compared to outdated construction methods [36,37]. Zhang et al. [38] improved 3D printing construction characteristics, optimizing the design in terms of material fluidity, setting time, and compressive/flexural strengths to enhance early strength and overall mechanical features of cemented products.
Compressive strength is one of the key indicators of CTF and is directly related to its structural safety [39]. To ensure quality and safety in practical projects, constant adjustments and trial tests are required, which can result in the loss of large amounts of raw materials and are time-consuming and costly to certify CTF’s structural safety. Thus, it is vital to make quick and true predictions of CTF’s strengths [40,41,42,43]. At present, numerous scholars [44,45] have carried out a lot of research on the guesstimate of compressive strength of cementitious materials including CTF. Considering the BP and RBF neural network theory, Li and Peng [46] predicted the strength of ordinary concrete, and relative fault between forecast and real results was no more than 6%. Chen et al. [47] suggested a concrete estimation model of CPSO-LSSVM. For concrete strength categories, the model’s average prediction precision was above 95%. Recent studies [48,49,50] indicated that the strength property of cemented products with fly ash and slag is well guessed by a strength prediction model using neural networks. Fan et al. [51] practiced the SVM procedure for concrete’s strength estimation. Liu et al. [52] adopted a BP-based algorithm to form a strength prediction model by calculating weights of each index and specifying the key elements affecting concrete’s strength. Several studies [53,54] also considered eight factors to create a BP ANN model to envisage CS values of 7-day and 28-day cured cementitious products such as concrete and mortar.
In this paper, we construct a comprehensive dataset encompassing multiple features (e.g., curing age, cement–sand ratio, curing temperature, additive type, additive concentration) based on 2107 experimental data points. This dataset forms a solid foundation for model training and validation, significantly enhancing the model’s generalization ability and prediction accuracy. We not only utilized a single machine learning model but also compared the performance of several models (e.g., AdaBoost, random forest, support vector machines, artificial neural networks) to identify the optimal algorithm. By comparing the outcomes with lab studies, we provide a theoretical basis for the software application of strength prediction for filling bodies and developed a Python-based intelligent prediction system. This system offers fast and accurate predictions for CTF specimen, with simple operation, low computational cost, excellent scalability, and the potential for secondary development. It provides innovative insights into strength prediction for backfill in mining companies. Additionally, to address the gap between laboratory research and practical engineering applications, we highlight challenges faced by hydraulic backfill (a mixture of classified tailings and binder) in real-world applications. It is prone to sedimentation and stratification, leading to significant variations in solid percentages and drainage quality. In contrast, paste backfill, due to its higher solids content and more homogeneous mixing properties, does not face the same issues. For engineering verification of additive performance, over-mixing is identified as a key factor causing performance variations. We recommend implementing a “two-stage dosing” process for flocculating additives to optimize their performance in practical engineering scenarios. These improvements make the paper more comprehensive and scientifically robust, enhancing its relevance for practical engineering applications.
2. Materials and Methods
2.1. Experimentation and Data Acquisition
2.1.1. Techniques
The tails sand fills predicted in this paper consists of five main components: cement [55], mixing water [56], tailings [57], additive [58], and admixture [59]. All these main ingredients are vital for any backfill mixtures since they strongly affect their strength performance and material characteristics [60]. According to common Portland cement (GB 175-2007), a 50 mm × 100 mm cylindrical specimen was made and left to cure up to 28 days under the conditions having 21 °C temperature and 95% relative humidity. Pressure was applied using a universal testing machine [HYW-500], manufactured by [Jinan Zhonglu Chang Testing Machine Manufacturing Co.], located in [Jinan], [China], according to GB50107-2010 ‘Standard for Inspection and Evaluation of Concrete Strength’ until a backfilling specimen was destructed. The measured compressive strength value of CTF specimens was recorded. All strength data were processed and evaluated for further interpreting the results.
2.1.2. Data Acquisition
A database of trials was created by saving 2107 data based on existing literature and team experiments. During data aggregation, the worth of each parameter was checked and the correlation between them was determined. The database consisted of six input factors: age of maintenance of specimen (AS), cement–sand ratio (C/S), maintenance temperature (T), additives (EA), additive type (AT), additive concentration (AC), and one output parameter: CS. Input/output variables were standardized by normalizing them. Min–max normalization method was used to normalize the data. This method scales all eigenvalues to the interval [0, 1] with the following formula:
For example, for the normalization of the conservation age, the conservation age in the database is in the range of 3 d–112 d, and the min–max normalization method is used. The exact stages are below:
- ➀
- Determine the minimum and maximum values of conservation age: min (AS) = 3 days, max (AS) = 112 days.
- ➁
- Data AS i normalized for each conservation age:
With this normalization, the conservation age data are uniformly scaled to the [0, 1] interval, making the feature have the same scale as the other features, which facilitates the model’s training and prediction. The normalized data can make the model converge faster and reduce the training time. Via the standardization process, the model can more precisely capture patterns and relationships in the data, thus improving the prediction accuracy. Values were arbitrarily divided into train (70%) and test (30%) sets by using the Python Sklearn machine learning library.
2.2. ML Techniques
2.2.1. ANN Model
The artificial neural network model (Figure 1) consists of six artificial neurons, and each group of neurons is linked together by connection weights and receives input signals from the neurons connected to it and processes them. ANN mainly contains an input layer, a hidden layer, and an output layer. Data computed by one neuron are used as input to the next neuron until the last neuron is passed. An activation function can introduce a nonlinear factor (Bias) in the neural network, which is used to adjust the activation threshold of a neuron. It acts similarly to the interception in a linear equation (e.g., b in y = wx + b), allowing the model to fit the data more flexibly. ANN is habitually used for modeling, and the process is like this: (1) govern input/output variables and construct a database; (2) regulate the structure of the network; (3) determine network model parameters; (4) train network and obtain the model; (5) simulate and test the network model.
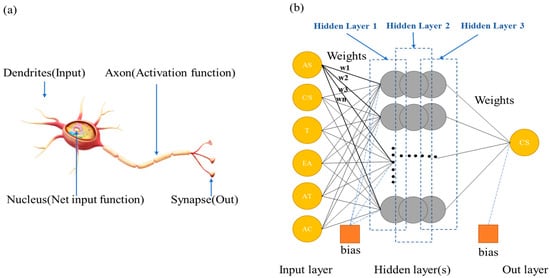
Figure 1.
ANN model construction process: (a) Schematic diagram of the physiological structure of a neuron, and (b) schematic diagram of the mathematical model of a neuron.
2.2.2. AdaBoost Model
The adaptive boosting (AdaBoost) algorithm is one of a series of algorithms based on the boosting integrated learning algorithm, which has a strong learning efficiency and is not prone to over-fitting and can be trained continuously to improve learning ability [61]. Long short-term memory neural network (LSTM), categorical regression tree (CART), and autoregressive integral sliding average model (ARIMA) as individual learners of AdaBoost integrated model are chosen in this study.
LSTM is a modified periodic neural network having long-term memory function, which answers tricky gradient disappearances/explosions during long sequences’ training. ARIMA is a classical mathematical analysis model dealing with time-series data, which has good prediction ability in traffic flow with strong smoothness; CART is a tree construction algorithm, which deals with continuous type variables by binary cut, i.e., Eigenvalues greater than a given value go to the left subtree or right subtree until the result is obtained. The AdaBoost algorithm process is as follows:
- (1)
- Given a dataset with a total number of samples N: , is sample feature, is sample label, .
- (2)
- Initialization of weights on the training sample dataset:where is value of weight of the initial feature data, i = 1, 2,…, N.
- (3)
- Train the individual learner hm with the training set Dm of the weight distribution according to the set of m iterations, m = 1, 2,…, M, M being the total number of iterations.
- (4)
- Calculate the error rate em for the individual learner hm:where is weight j of itch feature data after m iterations, and I is the learning result of the individual learner hm on the sample data .
- (5)
- Calculate the weight of the current individual learner hm based on the error rate αm:
- (6)
- Update the weight distribution of the training set Dm+1:where Zm is the normative factor.
- (7)
- Repeat steps (3) to (6) for M iterations to build the final strong learner G(x):
2.2.3. RF Model
The classification tree is governed by random forest (RF) theory [62]. Each decision tree in this model randomly selects features to split the attributes of internal nodes. In this case, the final output is the result of the integrated decision tree in the randomly generated forest. The ultimate forecast for the regression process is created by using mean outputs of decision trees and is shown below:
where, is a collective random forest model; is a solitary decision tree model; Y is a target or output factor; k is a sum of decision tree being formed in RF.
Random forest algorithm has the following main advantages in dealing with regression hitches: (i) It covers good generality capability and effectively prevents over-fitting phenomenon; (ii) it does not need to set up a functional form and fits complex nonlinear relationships more accurately; (iii) the model runs faster and uses parallel computing; (iv) it can obtain the importance of factors.
2.2.4. SVM Model
Considered as a supervised learning approach, support vector machine (SVM) [63] is dependent on risk reduction theory and numerical learning model VC dimension, which can obtain better generalization ability by learning with fewer samples and error-free identification samples. SVM performs linear regression by mapping Φ to a higher dimensional feature space. Therefore, for the dataset Y = {(xi, yi)}, the regression can be estimated using the following equation [64,65]:
The regression problem becomes an optimization problem:
where b is a constant, c is a fine parameter, is a damage role, and w is a slope of hyperplane:
where are the Lagrange multiplier:
The expression could be acquired from the above:
For low-dimensional spatial data, the regression expression is:
where is a kernel role.
The Sklearn toolkit in the Python language was used, and precise stages are below:
- (1)
- In the normalization process, in the process of SVR fitting, the input quantities often cover diverse scales and their units. This will influence the outcomes of data investigation, and to abolish the effect of magnitude, the data will be normalized [66], as could be apparently grasped in Equation (14).
- (2)
- Selecting kernel function, after testing it, finally selects the Gaussian radial basis kernel function. The training and test sample data are consistent with the regression tree model dataset.
- (3)
- Parameter selection, the value of the penalty parameter C, can largely determine the performance of the algorithm; the main role of the kernel function parameter gamma is to control the number of dimensions of feature space, affecting the complexity of the distribution of train specimen data in a high-dimensional feature universe. This study uses the grid search method to select C and gamma; the CS prediction selected C = 60, gamma = 0.01.
3. Results and Discussion
3.1. ML Prediction Outcomes
3.1.1. ANN
The overall response and reliability of the ANN model is high, with an error distribution of 97.5% of the data below 0.25 MPa and a maximum error of approximately 1.17 MPa (Figure 2).
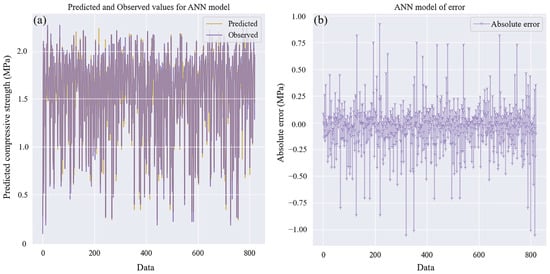
Figure 2.
Anticipated and real values of ANN model: (a) Comparison and (b) absolute error.
3.1.2. AdaBoost
The AdaBoost integrated model has the highest agreement between predicted and actual values, with 97.5% of data having a fault underneath 0. Predicted standards in the graph are nearly real ones, indicating that the model generalizes well. The model can provide reliable prediction results. Overall, the model established by the study has the best grade of accuracy (Figure 3).
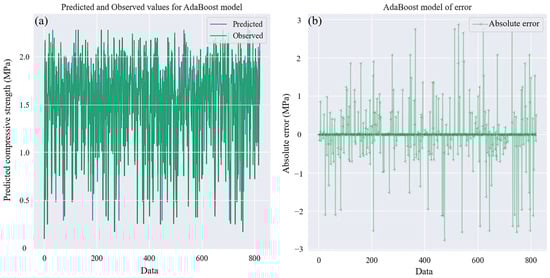
Figure 3.
Anticipated and real values of AdaBoost model: (a) Comparison and (b) absolute error.
3.1.3. RF
The RF model has the lowest fit, and it is clear from the graph that its prediction (prediction) is close to the actual rate; the designating model has a fully learned decision pattern through the training set. The traditional RF algorithm has a small number of data points in the test set that deviate significantly from the centerline, which is more evident in the case of RF. In terms of error distribution, 91% of the model’s compressive strength prediction errors were below 1 MPa. The smallest and largest errors were 0 MPa and 3.24 MPa, respectively (Figure 4).
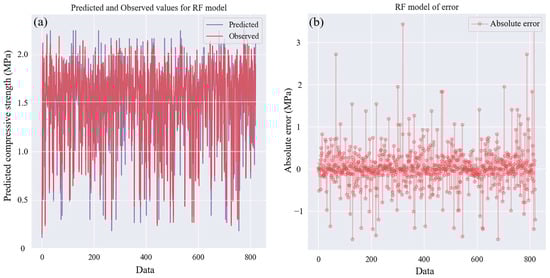
Figure 4.
Anticipated and real values of RF model: (a) Comparison and (b) absolute error.
3.1.4. SVM
Figure 5 shows that the SVM model fit and the mean deviation performed well. Most of the differences between the model training and test data predictions are small, with errors in strength not exceeding 0.5 MPa, with the smallest and largest errors being 0 MPa and 2.4 MPa, respectively. After considering all subsets and evaluation metrics, predicted/actual standards of the ML model were in good contract and showed good predictive performance. The ANN/SVM models performed best as a function of maximum data error, with maximum errors of 1.17 MPa and 2.41 MPa for strength, respectively; however, the RF model had a higher variance between training and test data predictions than the other models. For error delivery of the ML models, AdaBoost, ANN, and SVM models performed better, with the error distribution of compressive strength at 0, 0.25 and 0.5 MPa, respectively, which also indicated that the AdaBoost, ANN, and SVM machine learning models were able to envisage the strength property of CTF specimens. The AdaBoost model outperforms the other models and may have a more stable simulation prediction capability.
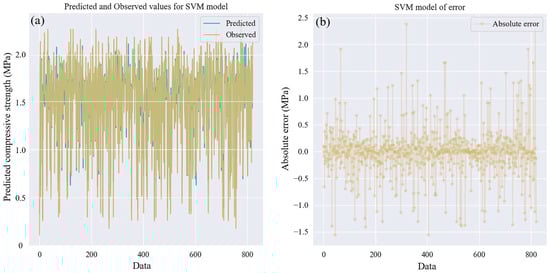
Figure 5.
Anticipated and real values of SVM model: (a) Comparison and (b) absolute error.
3.2. Performance Evaluation of Different ML Models
3.2.1. Determination Factor R2
The real and anticipated values of four regression models used in the experiments, including AdaBoost, ANN, SVM, and RF models, were compared and the corresponding three-dimensional error distributions were calculated because of the predicted and actual results as shown in Figure 6, Figure 7, Figure 8 and Figure 9. For AdaBoost, the fault between the anticipated and real standards is almost equal to 0. As can be apparently seen, the fault between ANN and SVM anticipated and tested standards is smaller between ±0.25 MPa and ±0.5 MPa. The top forecast precision of AdaBoost, ANN, and SVM models specifies that the slighter the error, the greater the expectation precision. Figure 6, Figure 7, Figure 8 and Figure 9 visualize the degree to which model forecast values depart from measured (diagonal) ones. All four machine learning models demonstrate a direct link between forecast and tested values.
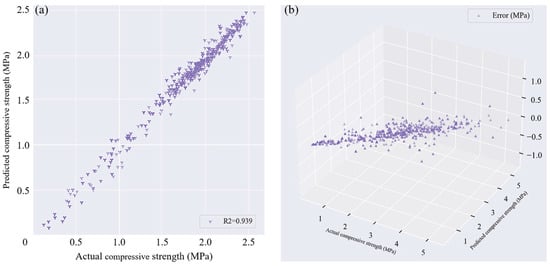
Figure 6.
ANN model: (a) Regression and (b) error distribution.
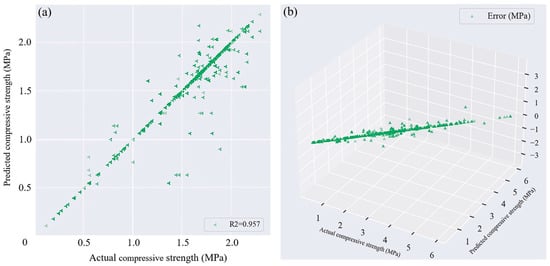
Figure 7.
AdaBoost model: (a) Regression and (b) error distribution.
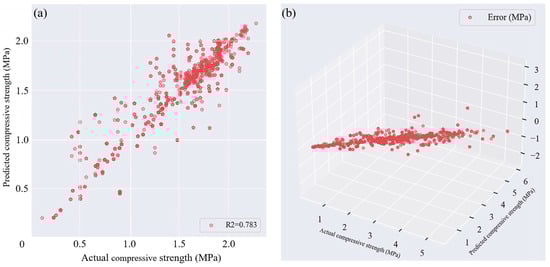
Figure 8.
RF model: (a) Regression and (b) error distribution.
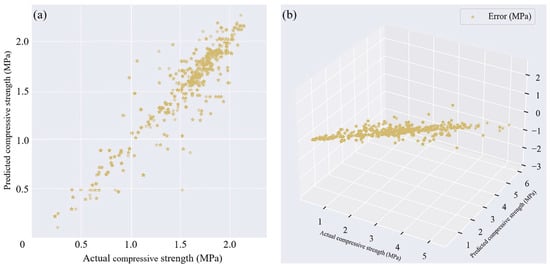
Figure 9.
SVM model: (a) Regression and (b) error distribution.
For AdaBoost, the scatter almost coincided with the ideal y = x in the plot (i.e., the predicted value equals the tested value), while for the RF model, there was a little dispersion. For the various ML models evaluated (AdaBoost, ANN, SVM, and RF), AdaBoost achieved excellent performance (R2 = 0.957), followed by ANN (R2 = 0.939); RF and SVM also achieved acceptable performance with R2 of 0.783 and 0.851, respectively; larger R2 values show that the machine learning model for target prediction yielded a strong correlation and the greater the precision of ML model prediction. In summary, the AdaBoost model predicted compressive strength with very high accuracy.
3.2.2. MAE, MSE, and RMSE
To determine the forecast performance of machine learning replicas and their degree of merit, this paper employs MAE, RMSE, and MSE as assessment indexes of model forecast effect [67,68,69]. The slighter the standard value, the more accurate the model is. MSE can eliminate the influence of the factor scale and evaluate the deviation more objectively. RMSE reflects the deviation of the model forecast results from true value, and the slighter the standard value, the more stable the model is:
where denotes forecast strength; denotes true strength; n denotes specimen number.
Figure 10 shows MAE comparison of diverse models. One could notice that AdaBoost has a low MAE value of 0.189 MPa and 0.081 MPa for both testing and training sets when CTF’s strengths are estimated. The MAE values for train/test sets in ANN, SVM, and RF are anticipated. Therefore, MAEs of the training set were 0.339, 0.505, and 0.467 MPa for the ANN model, SVM model, and RF model, respectively, while MAEs of the testing set were 0.591, 0.782, and 0.780 MPa.
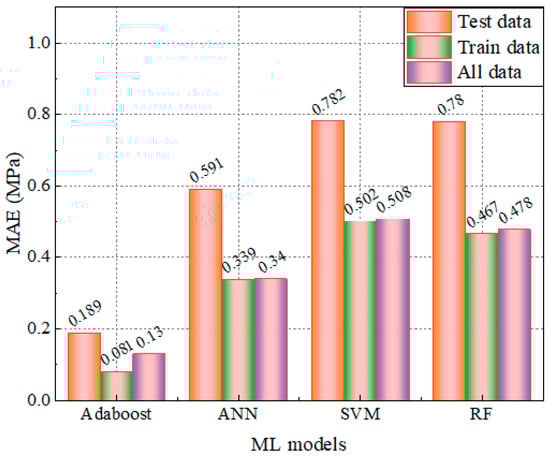
Figure 10.
MAE value of different ML models.
Figure 11 shows the MSEs for AdaBoost, ANN, SVM, and RF. Quantitative outcomes of final model performance are: 0.13 MPa for AdaBoost, 0.27 MPa for ANN, 0.875 MPa for SVM, and 0.733 MPa for RF. The nearer the RMSE is close to 0, the more statistically perfect the observations are. Figure 11 directs a comparison of the estimation outcomes of diverse models like RMSE. AdaBoost has the bottom-most MSE and RMSE and the utmost prediction accuracy. This indicates that the AdaBoost model has the best performance.
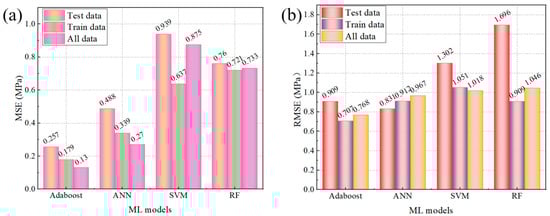
Figure 11.
MSE and RMSE value of different ML models: (a) MSE and (b) RMSE.
Figure 12 reveals representative estimation outcomes for diverse ML models. Note that AdaBoost covers the top forecast standards: R2 = 0.957, RMSE = 0.768 MPa, MAE = 0.13 MPa, MSE = 0.13 MPa, and MAE = 2.09 MPa. The performance evaluation is ranked as: RF < SVM < ANN < AdaBoost. Compared to RF, SVM, and ANN, the estimation efficiency of the AdaBoost model is enhanced by 22.2%, 19.5%, and 1.9%, respectively. Overall, the estimation accuracy of AdaBoost is pointedly upper than that of others, which can predict the variation pattern of CTF strength accurately and reduce the prediction error.
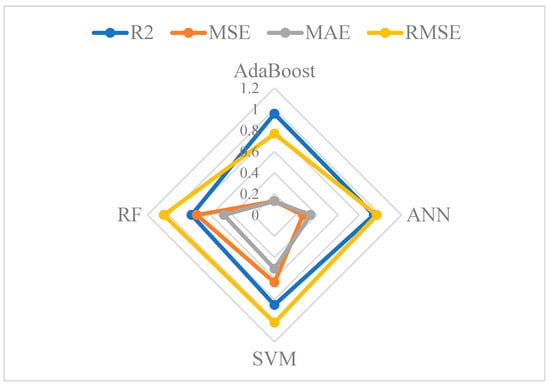
Figure 12.
Radar chart of performance indicators for each best model category.
3.3. Database Based Analysis of CS Parameters for Cement Mortars
3.3.1. Correlation Analysis
Figure 13a–c demonstrate the heat maps gained using the correlation coefficients of Pearson, Kendall, and Spearman, respectively. The greater the correlation coefficient value, the sturdier the link between two factors. By inspecting the link between input variables and CS, the influence of each input on outcomes could be acquired easily.
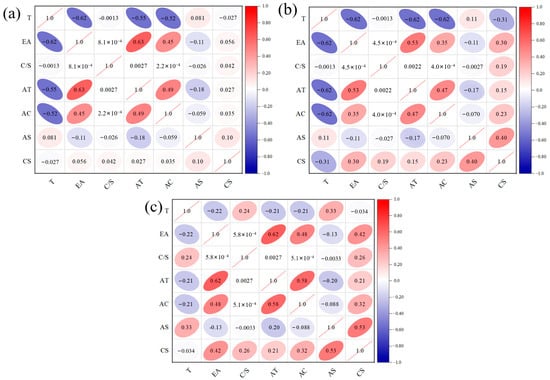
Figure 13.
Heat map of correlation matrix of input variables: (a) Pearson; (b) Kendall; (c) Spearman.
Outcomes show that curing age (AS) has the solidest link with the strength property of CS, tailed by cement–tailings ratio, additive concentration (AC), extra additives (EA), curing temperature (T), and additive type (AT). Nevertheless, the correlation coefficient of Pearson can represent a linear link between inputs and outputs. It does not offer a complete analysis of the link between different variables. Therefore, a characteristic significance examination is required to inspect the impact of numerous input factors on CS’s strength property.
3.3.2. Feature Importance Analysis
Figure 14 reveals the influence of each input’s characteristic value to model predicted CS in percentage terms. As can be seen clearly from Figure 14, AS can significantly influence the CS of CTF specimens, with the largest contribution (50.5%). Additive type (AT) has the least influence on the CS of CTF specimens, with the smallest contribution (6.1%). The above outcomes are in good agreement with the literature, which also confirms the high accuracy of the findings. To further analyses, the degree of effect of each parameter on importance of each eigenvector was ranked. Figure 14 also reveals that for the influence of CTF CS AS > C/S > AC > EA > T > AT, the parameter having the most significant impact on strength property is AS. Variable weight coefficient of AS is beyond 0.5, while the rest of the variables have less influence on strength property. Variable weight coefficients were below 0.15. An in-depth understanding of the physical significance of model predictions, as well as the key influencing factors, is critical in engineering applications, especially in the field of cemented tailings fill for underground mining. Investigations have demonstrated that CTF’s strength gradually increases with age (AS). Mining companies often strive to optimize costs in their operations, and the cementing materials used in cemented fill (e.g., cement, slag/cement, etc., i.e., C/S) are not only costly, but also have the second highest impact on the strength properties of fill. Therefore, by focusing on and predicting the C/S parameters prior to filling operations, it is possible to warrant that the fill’s strength encounters desired conditions while simultaneously effectively lowering the fill’s cost. Accurate prediction of fill strength is extremely valuable because of challenges, time, and resources involved in conducting parametric studies in the actual field environment.
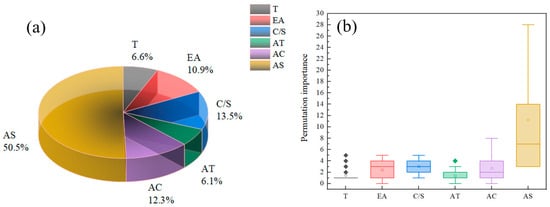
Figure 14.
Feature importance of variables: (a) Part of characteristic contribution and (b) permutation importance. (In a box plot, the diamonds usually represent outliers in the data. Outliers are those data points that deviate significantly from other data points in the data set; the straight line in the middle of the box represents the mean; and the small square within the box represents the mean of the data set, which is the median of all data points).
3.4. Luzhong Mining Filling Practical Prediction Application
The bottom and top 5 m of the second-step quarry are filled with CTB with ash/sand ratio of 1:4, and the middle 40 m is filled with CTB with ash/sand ratio of 1:10. According to the results of relevant experimental research on the filling materials of the Gangli deposit, to ensure that the fill’s strength meets the supplies of mining, design takes concentration of the filling material as 60%, and there are three working conditions of the filling system with ash/sand ratios, namely, 1:4 (material 1, CTF’s strength ≥ 3.0 MPa), 1:6 (material 2, CTF’s strength ≥ 2.0 MPa), and 1:10 (material 3, CTF’s strength ≥ 0.5 MPa), which are predicted to be in line with reality), and the predictions are realistic.
3.5. Development of an Intelligent System for Predicting CTF’s Strength
The software adopted in the present investigation uses Python 3.9 (64-bit), IDLE (Python 3.9 64-bit), PyQt5.15, Numpy1.20.2, and Matplotlib3.4.1 libraries. The NumPy library and Matplotlib library are used to implement models such as SVM, RF, AdaBoost, and ANN. The software interface and file management are implemented through the PyQt5 function library, as shown in Figure 15.
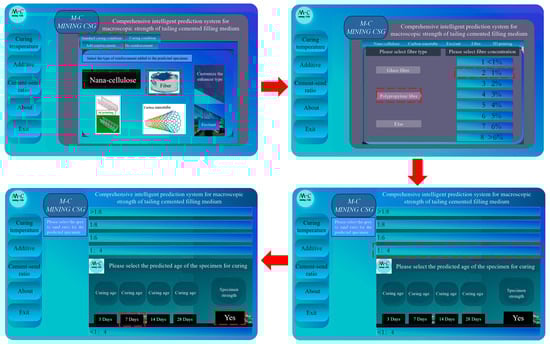
Figure 15.
The App designer interface: Operation flow.
In terms of secondary development, to facilitate the improvement of algorithms and the expansion of software functions, software uses a “signal slot” mechanism to connect the interface with the calculation and visualization modules, which is a loosely coupled mechanism to facilitate secondary development. The “signal slot” mechanism can be used to load data processing interpretation methods into the software to increase the functionality of the software; it is also possible to write subsequent improved algorithms directly into the software calculation module to replace the current algorithm, at the same time, due to the SVM, RF, and AdaBoost models. The computational modules for SVM, RF, AdaBoost, and ANN models can be packaged and used right for subsequent development on other software platforms. This reduces the difficulty of software development by focusing only on algorithm code during secondary development. The software is developed with relevant input/output interfaces. The software can be applied to quickly, easily, and accurately envisage the macroscopic strength of CTF specimens [70,71,72,73] and can be used as a reference for scholars, engineers, and others involved in the strength estimation of cemented materials [74,75,76] for use in mining engineering and developing new eco-efficient compositions.
4. Conclusions
For the advantages and disadvantages of various types of intelligent models in the estimation of CTF strengths, this paper establishes multiple prediction models for strength efficiency of CTFs’ considered data collected from the same batch at the laboratory, and uses AdaBoost, ANN, SVM, and RF under several conditions such as AS, C/T, AT, T, EA, and AC of specimens, respectively, for cement mortar strength prediction. By comparing the experimental results, the optimal algorithm AdaBoost model was selected to estimate the strength of filling with high precision (R2 = 0.957). Key inferences are below:
- Performance evaluation ranked: RF model < SVM model < ANN model < AdaBoost model, with the AdaBoost model outperforming the other models in envisaging CS’s strength.
- Parameter/sensitivity analysis showed that curing age (AS) was the most strongly correlated with the compressive strength of CS, followed by C/T, additive concentration (AC), extra additive (EA), curing temperature (T), and additive type (AT). The parameter with the major effect on strength property was AS, with variable weight coefficients above 0.5 for AS.
- The proposed system for intelligent forecasting of the macroscopic strength of media for CTF specimens is simple to implement, very cheap to calculate, and representative.
Author Contributions
Methodology, H.C.; investigation, A.W., S.C.; data curation, A.W., E.Y.; writing—original draft preparation, A.W.; writing—review and editing, H.C., E.Y., S.C.; supervision, H.C., E.Y., S.C.; funding acquisition, H.C. All authors have read and agreed to the published version of the manuscript.
Funding
This work was supported by the National Key R&D Program of China (Grant No. 2022YFC2905004).
Data Availability Statement
The software “Intelligent Predictive Media Macro Strength System for Tailings Cementing and Filling V1.0” supporting the results reported in this study has been registered with the copyright number 2023SR0282344. The software is protected under the full rights of the copyright law. The authors are Cao Shuai, Wang AiAi, Huang Zhiqiang, Li Jiajian, Zhao Ziyue, Qin Hao, Zou Shengxian, Li Xihao.
Acknowledgments
We would like to thank Zhu, F.-H. and Chen, K. -W. for their valuable suggestions and support during the research process. We also appreciate the assistance provided by University of Science and Technology Beijing in the data collection phase.
Conflicts of Interest
The authors declare no conflict of interest.
References
- Liu, X.; Zhang, X.; Wang, L.; Qu, F.; Shao, A.; Zhao, L.; He, J. Research progress and prospects of intelligent technology in underground mining of hard rock mines. Green Smart Min. Eng. 2024, 1, 12–26. [Google Scholar] [CrossRef]
- Liu, H.; Zhang, J.; Li, B.; Zhou, N.; Xiao, X.; Li, M.; Zhu, C. Environmental behavior of construction and demolition waste as recycled aggregates for backfilling in mines: Leaching toxicity and surface subsidence studies. J. Hazard Mater. 2020, 389, 121870. [Google Scholar] [CrossRef] [PubMed]
- Xia, K.; Chen, C.; Liu, X.; Liu, X.; Yuan, J.; Dang, S. Assessing the stability of high-level pillars in deeply-buried metal mines stabilized using cemented backfill. Int. J. Rock Mech. Min. Sci. 2023, 170, 105489. [Google Scholar] [CrossRef]
- Saedi, A.; Jamshidi-Zanjani, A.; Mohseni, M.; Darban, A.K. Mechanical activation for sulfidic tailings treatment by tailings: Environmental aspects and cement consumption reduction. Case Stud. Constr. Mater. 2023, 19, e02632. [Google Scholar] [CrossRef]
- Laing, T.; Pinto, A.-N. Artisanal and small-scale mining and the low-carbon transition: Challenges and opportunities. Environ. Sci. Policy 2023, 149, 103563. [Google Scholar] [CrossRef]
- Li, D.; Guan, X.; Tang, T.; Zhao, L.; Tong, W.; Wang, Z. The clean energy development path and sustainable development of the ecological environment driven by big data for mining projects. J. Environ. Manag. 2023, 348, 119426. [Google Scholar] [CrossRef]
- Dong, H.; Zhang, L. Transition towards carbon neutrality: Forecasting Hong Kong’s buildings carbon footprint by 2050 using a machine learning approach. Sustain. Prod. Consum. 2023, 35, 633–642. [Google Scholar] [CrossRef]
- Wang, X.; Yu, B.; An, R.; Sun, F.; Xu, S. An integrated analysis of China’s iron and steel industry towards carbon neutrality. Appl. Energy 2022, 322, 119453. [Google Scholar] [CrossRef]
- Dávila, J.-G.; Sacchi, R.; Pizzol, M. Preconditions for achieving carbon neutrality in cement production through CCUS. J. Clean. Prod. 2023, 425, 138935. [Google Scholar] [CrossRef]
- Zhao, Y.; Qiu, J.; Zhang, S.; Guo, Z.; Wu, P.; Sun, X.; Gu, X. Low carbon binder modified by calcined quarry dust for cemented paste backfill and the associated environmental assessments. J. Environ. Manag. 2021, 300, 113760. [Google Scholar] [CrossRef]
- Chen, Q.; Zhu, L.; Wang, Y.; Chen, J.; Qi, C.-C. The carbon uptake and mechanical property of cemented paste backfill carbonation curing for low concentration of CO2. Sci. Total Environ. 2022, 852, 158516. [Google Scholar] [CrossRef] [PubMed]
- Ayeni, I.S.; Lim, N.H.A.S.; Samad, M. Engineering properties of natural fibre-reinforced one-part geopolymer concrete. Constr. Build. Mater. 2024, 456, 139161. [Google Scholar] [CrossRef]
- Zhang, J.-X.; Zhang, N.; Zhou, A.; Shen, S.-L. Numerical evaluation of segmental tunnel lining with voids in outside backfill. Undergr. Space 2022, 7, 786–797. [Google Scholar] [CrossRef]
- Xue, G.-L.; Yilmaz, E.; Wang, Y. Progress and prospects of mining with backfill in metal mines in China. Int. J. Miner. Metall. Mater. 2023, 30, 1455–1473. [Google Scholar] [CrossRef]
- Zhang, C.; Wang, J.; Song, W.-D.; Fu, J. Effect of waste glass powder on pore structure, mechanical properties and microstructure of cemented tailings backfill. Constr. Build. Mater. 2023, 365, 130062. [Google Scholar] [CrossRef]
- Zou, L.; Xing, J.; Xiang, J.; Zhao, Y.; Zhang, Q.; Qiu, J. Mechanical behavior and microscopic mechanism of synergistically enhanced cemented ultra-fine tailings backfill with polypropylene fiber and silica fume. Constr. Build. Mater. 2024, 443, 137668. [Google Scholar] [CrossRef]
- Zhu, D.; Huang, N.; Li, W.; Li, J.; Wu, X. Effect of different fibers and fiber contents on the mechanical properties and failure behavior of early age cemented lithium feldspar tailings backfill. Dev. Built Environ. 2024, 19, 100495. [Google Scholar] [CrossRef]
- Liu, L.; Lei, M.; Hu, Z.; Za, X.; Shi, C.; Li, S.; Yang, Z. A robust mix design method for steel fiber reinforced self-compacting concrete. J. Build. Eng. 2023, 76, 107336. [Google Scholar] [CrossRef]
- Wang, A.-A.; Cao, S.; Yilmaz, E. Quantitative analysis of pore characteristics of nanocellulose reinforced cementitious tailings fills using 3D reconstruction of CT images. J. Mater. Res. Technol. 2023, 26, 1428–1444. [Google Scholar] [CrossRef]
- Zhang, H.; Kou, J.; Sun, C.; Wang, P.; Lin, J.; Li, J.; Jiang, Y. Optimization of cemented paste backfill with carbon nanotubes as a sustainable treatment for lead-containing tailings. Powder Technol. 2023, 415, 118152. [Google Scholar] [CrossRef]
- Hu, L.; Zheng, B.; Zhu, D.; Yang, Z.; Huang, N. Enhancing bending performance of cemented lithium feldspar tailings backfill with 3D printing polymer lattices: Effects of unit shapes and materials. Case Stud. Constr. Mater. 2025, 22, e04463. [Google Scholar] [CrossRef]
- Pan, H.; Xiao, Q.; Huang, N.; Xiao, A.; Zhu, D. Effect of alkaline rice straw fibers content and curing ages on static mechanical properties of cemented lithium mica tailings backfill. Case Stud. Constr. Mater. 2024, 21, e03450. [Google Scholar] [CrossRef]
- Hu, Y.; Li, K.; Zhang, B.; Han, B. Strength investigation and prediction of superfine tailings cemented paste backfill based on experiments and intelligent methods. Materials 2023, 16, 3995. [Google Scholar] [CrossRef] [PubMed]
- Gao, R.; Wang, W.; Xiong, X.; Li, J.; Xu, C. Effect of curing temperature on the mechanical properties and pore structure of cemented backfill materials with waste rock-tailings. Constr. Build. Mater. 2023, 409, 133850. [Google Scholar] [CrossRef]
- Guo, Z.; Qiu, J.; Kirichek, A.; Zhou, H.; Liu, C.; Yang, L. Recycling waste tyre polymer for production of fibre reinforced cemented tailings backfill in green mining. Sci. Total Environ. 2024, 908, 168320. [Google Scholar] [CrossRef] [PubMed]
- Wang, L.; He, T.; Zhou, Y.; Tang, S.; Tan, J.; Liu, Z.; Su, J. The influence of fiber type and length on the cracking resistance, durability and pore structure of face slab concrete. Constr. Build. Mater. 2021, 282, 122706. [Google Scholar] [CrossRef]
- Jeon, K.; Jeon, C.; Choi, W. Effect of mixing ratio on fire resistance of cement mortar with polypropylene fiber and polymer. Case Stud. Constr. Mater. 2023, 19, e02503. [Google Scholar] [CrossRef]
- Li, J.-J.; Cao, S.; Song, W.-D. Distribution development of pore/crack expansion and particle structure of cemented solid-waste composites based on CT and 3D reconstruction techniques. Constr. Build. Mater. 2023, 376, 130966. [Google Scholar] [CrossRef]
- Xiao, B.; Wen, Z.; Miao, S.; Gao, Q. Utilization of steel slag for cemented tailings backfill: Hydration, strength, pore structure, and cost analysis. Case Stud. Constr. Mater. 2021, 15, e00621. [Google Scholar] [CrossRef]
- Zhang, M.; Li, K.; Ni, W.; Zhang, S.; Liu, Z.; Wang, K.; Wei, X.; Yu, Y. Preparation of mine backfilling from steel slag-based non-clinker combined with ultra-fine tailing. Constr. Build. Mater. 2022, 320, 126248. [Google Scholar] [CrossRef]
- Wang, A.-A.; Cao, S.; Yilmaz, E. Influence of types and contents of nano cellulose materials as reinforcement on stability performance of cementitious tailings backfill. Constr. Build. Mater. 2022, 344, 128179. [Google Scholar] [CrossRef]
- Gwon, S.; Ahn, E.; Shin, M.; Kim, J.-Y.; Kim, G. Assessment of internal curing of cellulose microfibers-incorporated cement composites using destructive and nondestructive methods. Constr. Build. Mater. 2022, 352, 129004. [Google Scholar] [CrossRef]
- Zhang, Q.; Qiu, J.; Jiang, H.; Kong, X.; Guo, Z.; Xiang, J.; Sun, X. Effect of hydroxypropyl methyl cellulose on coarse tailings cemented backfill: Rheology, stability, strength and microstructure. Constr. Build. Mater. 2024, 425, 136042. [Google Scholar] [CrossRef]
- Nasir, M.; Aziz, M.-A.; Zubair, M.; Manzar, M.-S.; Ashraf, N.; Mu’azu, N.-D.; Al-Harthi, M.-A. Recent review on synthesis, evaluation, and SWOT analysis of nanostructured cellulose in construction applications. J. Build. Eng. 2022, 46, 103747. [Google Scholar] [CrossRef]
- Khan, S.; Ashraf, S.; Ali, S.; Khan, K. Experimental investigations on the mechanical properties and damage detection of carbon nanotubes modified crumb rubber concrete. J. Build. Eng. 2023, 75, 106937. [Google Scholar] [CrossRef]
- Tang, C.; Liu, J.; Qiao, J.; Wei, Y.; Shi, C.; Hao, W. The preparation and axial compressive properties of 3D-printed polymer lattice-reinforced cementitious composite columns. J. Build. Eng. 2024, 97, 110770. [Google Scholar] [CrossRef]
- Xu, Y.; Wan, Z.; Šavija, B. Elevating mechanical performance of cementitious composites with surface-modified 3D-Printed polymeric reinforcements. Dev. Built Environ. 2024, 19, 100522. [Google Scholar] [CrossRef]
- Zhang, J.; Tian, W.; Liu, Y. Three-dimensional reconstruction and material mechanical properties study of concrete-like transparent physical models based on 3D printing technology. J. Water Resour. Archit. Eng. 2022, 20, 85–90. [Google Scholar]
- Xue, G.-L.; Yilmaz, E.; Feng, G.; Cao, S. Bending behavior and failure mode of cemented tailings backfill composites incorporating different fibers for sustainable construction. Constr. Build. Mater. 2021, 289, 123163. [Google Scholar] [CrossRef]
- Hu, Y.; Li, K.; Zhang, B.; Han, B. Strength investigation of the cemented paste backfill in alpine regions using lab experiments and machine learning. Constr. Build. Mater. 2022, 323, 126583. [Google Scholar] [CrossRef]
- Wang, A.-A.; Cao, S.; Yilmaz, E. Effect of height to diameter ratio on dynamic characteristics of cemented tailings backfills with fiber reinforcement through impact loading. Constr. Build. Mater. 2022, 322, 126448. [Google Scholar] [CrossRef]
- Yin, S.; Yan, Z.; Chen, X.; Yan, R.; Chen, D.; Chen, J. Mechanical properties of cemented tailings and waste-rock backfill (CTWB) materials: Laboratory tests and deep learning modeling. Constr. Build. Mater. 2023, 369, 130610. [Google Scholar] [CrossRef]
- Xin, L. Meso-scale modeling of the influence of waste rock content on mechanical behavior of cemented tailings backfill. Constr. Build. Mater. 2021, 307, 124473. [Google Scholar] [CrossRef]
- Zhang, B.; Li, K.; Zhang, S.; Hu, Y.; Han, B. Strength prediction and application of cemented paste backfill based on machine learning and strength correction. Heliyon 2022, 8, e10338. [Google Scholar] [CrossRef] [PubMed]
- Khuram, R.; Fatima, R.; Zunaira, N.; Fahad, K.-A.; Idrees, Z.; Minkwan, J. Machine learning and multicriteria analysis for prediction of compressive strength and sustainability of cementitious materials. Case Stud. Constr. Mater. 2024, 21, e04080. [Google Scholar]
- Li, H.; Peng, T. Prediction of compressive strength of concrete based on BP and RBF neural network. J. Wuhan Univ. Technol. 2009, 31, 33–36. [Google Scholar]
- Chen, H.; Deng, T.; Du, T.; Chen, B.; Skibniewski, M.-J.; Zhang, L. An RF and LSSVM–NSGA-II method for the multi-objective optimization of high-performance concrete durability. Cem. Concr. Compos. 2022, 129, 104446. [Google Scholar] [CrossRef]
- Du, K.; Liu, M.; Zhou, J.; Khandelwal, M. Investigating the slurry fluidity and strength characteristics of cemented backfill and strength prediction models by developing hybrid GA-SVR and PSO-SVR. Min. Metall. Explor. 2022, 39, 433–452. [Google Scholar] [CrossRef]
- Wang, Z.; Kou, Y.; Wang, Z.; Wu, Z.; Guo, J. Random Forest slurry pressure loss model based on loop experiment. Minerals 2022, 12, 447. [Google Scholar] [CrossRef]
- Qi, C.-C.; Chen, Q.-S.; Fourie, A.; Zhang, Q. An intelligent modelling framework for mechanical properties of cemented paste backfill. Miner. Eng. 2018, 123, 16–27. [Google Scholar] [CrossRef]
- Fan, C.; Zheng, Y.; Wang, S.; Ma, J. Prediction of bond strength of reinforced concrete structures based on feature selection and GWO-SVR model. Constr. Build. Mater. 2023, 400, 132602. [Google Scholar] [CrossRef]
- Liu, Q.; Sun, P.; Fu, X.; Zhang, J.; Yang, H.; Gao, H.; Li, Y. Comparative analysis of BP neural network and RBF neural network in seismic performance evaluation of pier columns. Mech. Syst. Signal Process. 2020, 141, 106707. [Google Scholar] [CrossRef]
- Wang, K.; Ren, J.; Yan, J.; Wu, X.; Dang, F. Research on a concrete compressive strength prediction method based on the random forest and LCSSA-improved BP neural network. J. Build. Eng. 2023, 76, 107150. [Google Scholar] [CrossRef]
- Wang, P.; Dong, B.; Zhang, Y. Evaluation and characteristic analysis of compressive strength and resistivity of EG cement conductive mortar based upon hybrid-BP neural network. Constr. Build. Mater. 2023, 394, 132203. [Google Scholar] [CrossRef]
- Peng, Y.; Unluer, C. Development of alternative cementitious binders for 3D printing applications: A critical review of progress, advantages and challenges. Compos. Part B Eng. 2023, 252, 110492. [Google Scholar] [CrossRef]
- Fang, K.; Ren, L.; Jiang, H.-Q. Development of Mode I and Mode II fracture toughness of cemented paste backfill: Experimental results of the effect of mix proportion, temperature and chemistry of the pore water. Eng. Fract. Mech. 2021, 258, 108096. [Google Scholar] [CrossRef]
- Koohestani, B.; Mokhtari, P.; Yilmaz, E.; Mahdipour, F.; Darban, A.-K. Geopolymerization mechanism of binder-free mine tailings by sodium silicate. Constr. Build. Mater. 2021, 268, 121217. [Google Scholar] [CrossRef]
- Ngo, Q.-T.; Ngo, C.-T.; Nguyen, Q.-H.; Nguyen, H.-N.; Nguyen, L.-Q.; Nguyen, K.-Q.; Tran, V.-Q. Data-driven approach in investigating and predicting unconfined compressive strength of cemented paste backfill. Mater. Today Commun. 2023, 37, 107065. [Google Scholar] [CrossRef]
- Li, B.; Yan, H.; Zhang, J.; Zhou, N. Compaction property prediction of mixed gangue backfill materials using hybrid intelligence models: A new approach. Constr. Build. Mater. 2020, 247, 118633. [Google Scholar] [CrossRef]
- Zhang, H.; Cao, S.; Yilmaz, E. Influence of 3D-printed polymer structures on dynamic splitting and crack propagation behavior of cementitious tailings backfill. Constr. Build. Mater. 2022, 343, 128137. [Google Scholar] [CrossRef]
- Xie, C.; Nguyen, H.; Bui, X.-N.; Choi, Y.; Zhou, J.; Nguyen-Trang, T. Predicting rock size distribution in mine blasting using various novel soft computing models based on meta-heuristics and machine learning algorithms. Geosci. Front. 2021, 12, 101108. [Google Scholar] [CrossRef]
- Liu, Y.; Cao, Y.; Wang, L.; Chen, Z.-S.; Qin, Y. Prediction of the durability of high-performance concrete using an integrated RF-LSSVM model. Constr. Build. Mater. 2022, 356, 129232. [Google Scholar] [CrossRef]
- Arachchilage, C.-B.; Fan, C.; Zhao, J.; Huang, G.; Liu, W.-V. A machine learning model to predict unconfined compressive strength of alkali-activated slag-based cemented paste backfill. J. Rock Mech. Geotech. Eng. 2023, 15, 2803–2815. [Google Scholar] [CrossRef]
- Wang, H.; Li, N.; Zhang, Y. Prediction model for the flexural load-carrying capacity of bionic fiber-reinforced composite sandwich panels based on the BP neural network. Compos. Part B Eng. 2019, 175, 107043. [Google Scholar]
- Zhou, J.; Fang, C.; Yang, L. Study on the pull-out performance of vertical inclination shear connectors between steel-concrete composite beams and precast slabs. J. Build. Eng. 2021, 41, 102540. [Google Scholar]
- Saurabh, D.; Deepak, G.; Mainak, M. Extreme learning machine to foretell the deflection in plain cement, steel-reinforced, and bamboo-reinforced concrete beams. Emerg. Mater. Res. 2025, 14, 12–27. [Google Scholar]
- Wang, W.; Lu, Y. Analysis of the mean absolute error (MAE) and the root mean square error (RMSE) in assessing rounding model. IOP Conf. Ser. Mater. Sci. Eng. 2018, 324, 012049. [Google Scholar] [CrossRef]
- Hodson, T.O. Root mean square error (RMSE) or mean absolute error (MAE): When to use them or not. Geosci. Model Dev. Discuss. 2022, 15, 5481–5487. [Google Scholar] [CrossRef]
- Yang, L.; Jia, H.; Wu, A. Particle Aggregation and Breakage Kinetics in Cemented Paste Backfill. Int. J. Miner. Metall. Mater. 2023, 220, 172–186. [Google Scholar] [CrossRef]
- Min, C.; Xiong, S.; Shi, Y.; Liu, Z.; Lu, X. Early-age compressive strength prediction of cemented phosphogypsum backfill using lab experiments and ensemble learning models. Case Stud. Constr. Mater. 2023, 18, e02107. [Google Scholar] [CrossRef]
- Li, E.; Zhou, J.; Shi, X.; Armaghani, D.J.; Yu, Z.; Chen, X.; Huang, P. Developing a hybrid model of salp swarm algorithm-based support vector machine to predict the strength of fiber-reinforced cemented paste backfill. Eng. Comput. 2021, 37, 3519–3540. [Google Scholar] [CrossRef]
- Lv, Z.; Jiang, A.; Liang, B. Development of eco-efficiency concrete containing diatomite and iron ore tailings: Mechanical properties and strength prediction using deep learning. Constr. Build. Mater. 2022, 327, 126930. [Google Scholar] [CrossRef]
- Zhang, X.; Li, J.; Pang, S.; Zhu, K.; Su, L.; Liu, J.; Zhang, X. Mechanical properties and interface microscopic characterisation of fibre-reinforced slag-fly ash geopolymer agglutinated iron tailings filling materials. Mater. Today Commun. 2023, 36, 106650. [Google Scholar] [CrossRef]
- Salami, A.; Iqbal, M.; Abdulraheem, A.; Jalal, F.-E.; Alimi, W.; Jamal, A.; Tafsirojjaman, T.; Liu, Y.; Bardhan, A. Estimating compressive strength of lightweight foamed concrete using neural, genetic and ensemble machine learning approaches. Cem. Concr. Compos. 2022, 133, 104721. [Google Scholar] [CrossRef]
- Ni, H.; Wang, J. Prediction of compressive strength of concrete by neural networks. Cem. Concr. Res. 2000, 30, 1245–1250. [Google Scholar] [CrossRef]
- Hu, Y.; Li, K.; Zhang, B.; Han, B. Investigation of the strength of concrete-like material with waste rock and aeolian sand as aggregate by machine learning. J. Comput. Des. Eng. 2022, 9, 2134–2150. [Google Scholar] [CrossRef]
Disclaimer/Publisher’s Note: The statements, opinions and data contained in all publications are solely those of the individual author(s) and contributor(s) and not of MDPI and/or the editor(s). MDPI and/or the editor(s) disclaim responsibility for any injury to people or property resulting from any ideas, methods, instructions or products referred to in the content. |
© 2025 by the authors. Licensee MDPI, Basel, Switzerland. This article is an open access article distributed under the terms and conditions of the Creative Commons Attribution (CC BY) license (https://creativecommons.org/licenses/by/4.0/).