Article

Development and Optimization of Bentonite-Based Slurry Sealing Material

1
School of Safety Science and Engineering, Anhui University of Science and Technology, Huainan 232001, China
2
Jincheng Institute of Energy Engineering Technology, Anhui University of Science and Technology, Huainan 232001, China
3
Anhui Panshi Mining Technology Co., Ltd., Huainan 232001, China
*
Authors to whom correspondence should be addressed.
Minerals 2025, 15(4), 385; https://doi.org/10.3390/min15040385
Submission received: 25 January 2025 / Revised: 2 April 2025 / Accepted: 3 April 2025 / Published: 5 April 2025
(This article belongs to the Section Clays and Engineered Mineral Materials)

Abstract

:
Gas extraction from coal seams can significantly mitigate gas accidents and improve resource utilization. The effectiveness of borehole sealing directly determines the concentration and efficiency of gas drainage. In recent years, liquid-phase sealing materials, represented by non-solidifying pastes, gel-based materials, and inorganic retarders, have gradually become a research hotspot. Compared to the traditional solid sealing materials such as cement-based or organic polymers, liquid-phase sealing materials can effectively seal secondary fractures caused by mining vibration through grout replenishment. However, the influence of each component in liquid-phase non-solidified materials on sealing properties such as fluidity, water retention, and permeability remains unclear. To address these issues, a novel liquid-phase non-solidified hole sealing material was developed using bentonite as the base material, sodium dodecyl benzene sulfonate as the dispersant, and sodium carboxymethyl cellulose as the thickener. Initially, single-factor experiments were applied to investigate the effects of material ratios on the fluidity, water retention, and permeability. Subsequently, orthogonal experimental design and response surface methodology were used to establish nonlinear quadratic regression models relating these properties to water–bentonite ratio, dispersant content, and thickener content. The results indicated that an optimal water–bentonite ratio enhances both fluidity and permeability, while dispersants improve water retention and permeability and thickeners primarily boost water retention. Finally, the optimized composition was determined as a water–bentonite ratio of 4.41:1, a dispersant content of 0.38%, and a thickener content of 0.108%. We believe that the developed slurry materials will maintain excellent sealing performance through the entire gas extraction period.

1. Introduction

China’s abundant coal resources combined with sustained high demand have driven the rapid expansion of coal mining activities to greater depths, progressing at a rate of 10–15 m per year [1]. Consequently, gas-related challenges in deep coal mining have intensified [2,3]. Gas extraction is the most critical technology for gas control in coal mines, and the airtightness of boreholes plays a pivotal role in determining both the concentration and efficiency of gas extraction [4].
Traditionally, borehole sealing materials in coal mines have primarily consisted of cement-based or organic polymer materials. These materials rapidly solidify within boreholes and effectively seal off the gas at the initial stage. Zhang et al. [5] developed a sealing reinforcement material based on ordinary Portland cement, increasing gas drainage concentration by 2.48 times compared to conventional expansive materials. Chen et al. [6] mechanically modified a material system of polylactide polyol–polyether polyol 4110–isocyanate. Compared with traditional polyurethane, the new material extended the effective consolidation distance in the coal seam by an average of 40%. However, despite their initial effectiveness, these sealing materials tend to degrade over time. As gas extraction progresses, the borehole is affected by stress conditions, including extraction-induced pressure relief, mining-induced vibrations, and mine pressure fluctuations, which compromise sealing performance. These conditions lead to the formation of new fractures around the hole, resulting in gas leakage in gas extraction boreholes, rapid decline in gas extraction concentration, and significant constraints on gas extraction efficiency [7,8]. To address these challenges, numerous scholars have conducted extensive experiments and research focusing on liquid-phase non-solidified sealing materials [9,10,11]. Bentonite has been widely examined because of its resistance to gas permeability, good fluidity and filling, and thermal stability. Bentonite is rich in reserves and low in cost, and has been widely used in many non-coal mine fields. In order to study the ability of bentonite in the disposal of radioactive waste under different salt solution concentrations, He et al. [12] carried out water retention tests on compacted bentonite with different salt content under closed conditions. In terms of geosynthetic clay liners, Muhammad et al. [13] developed a high-water-retention material using polymerized bentonite, which effectively improved the performance of bentonite in corrosive environments. In order to improve soil properties, Albadri et al. [14] analyzed the impact of water retention capacity of bentonite on soil carrying capacity by assessing soil water characteristic curves of different proportions of bentonite. In the field of gas extraction and sealing, there are relatively few studies on bentonite. Moreover, the unique environmental characteristics of gas extraction boreholes present new requirements for bentonite. In 2024, Zhao et al. [15] developed a novel liquid-phase sealing material for gas extraction boreholes, utilizing sodium-based bentonite as the base material through a mechanochemical modification process. This material exhibits long-term dehydration resistance, maintains a fluid state, and demonstrates strong permeability, suspension stability, and gel transition capabilities. During a two-month engineering observation period, the gas concentration in boreholes sealed with this material showed a significant improvement of 27.76% compared to those sealed with traditional materials.
However, the influence of each component in liquid-phase non-solidified sealing materials on the properties of slurry materials has not been fully elucidated. The performance characteristics of slurry materials are often derived from the interaction between multiple components, rather than the isolated effects of a single component. In addition, to obtain statistically significant experimental data within a limited number of experiments, orthogonal experimental design is a widely accepted scientific and efficient experimental scheme. Based on orthogonal experimental data and response surface analysis, the interaction effects among various components on material properties were quantitatively characterized, thereby enabling the determination of the optimal material ratios. Guo et al. [16,17] and Xue et al. [18] studied the influence of the interaction between the water–cement ratio and the dosage of each admixture on the compressive strength of a new sealing material. They designed an orthogonal test with Design-Expert software to draw the response surface of the material performance, and finally realized optimization of the material parameters. Mao et al. [19] used fly ash, nanosilica, and triethanolamine to prepare cement-based sealing materials. Based on these three materials, a quadratic polynomial regression model of yield stress was established by the response surface method. Finally, the optimal ratio of the three components was determined to be 5.8% fly ash, 3.6% nanosilica, and 0.044% triethanolamine.
Therefore, to address the limitations of existing liquid-phase non-solidified sealing materials, we developed a novel sealing material with high fluidity, strong water retention, and ability to penetrate cracks. This material employs sodium bentonite as the primary material, sodium dodecyl benzene sulfonate as the dispersant, and sodium carboxymethyl cellulose as the thickener. In this study, the influence of each component on the properties of materials was analyzed by single-factor experiments. Subsequently, an orthogonal experiment was designed. A response surface model of the influence of the interaction between different components on the material properties was constructed through the experimental data, and the optimal ratio of each component of the material was finally obtained. This research provides valuable insights for the further development and application of liquid-phase sealing materials.

2. Material and Experiment

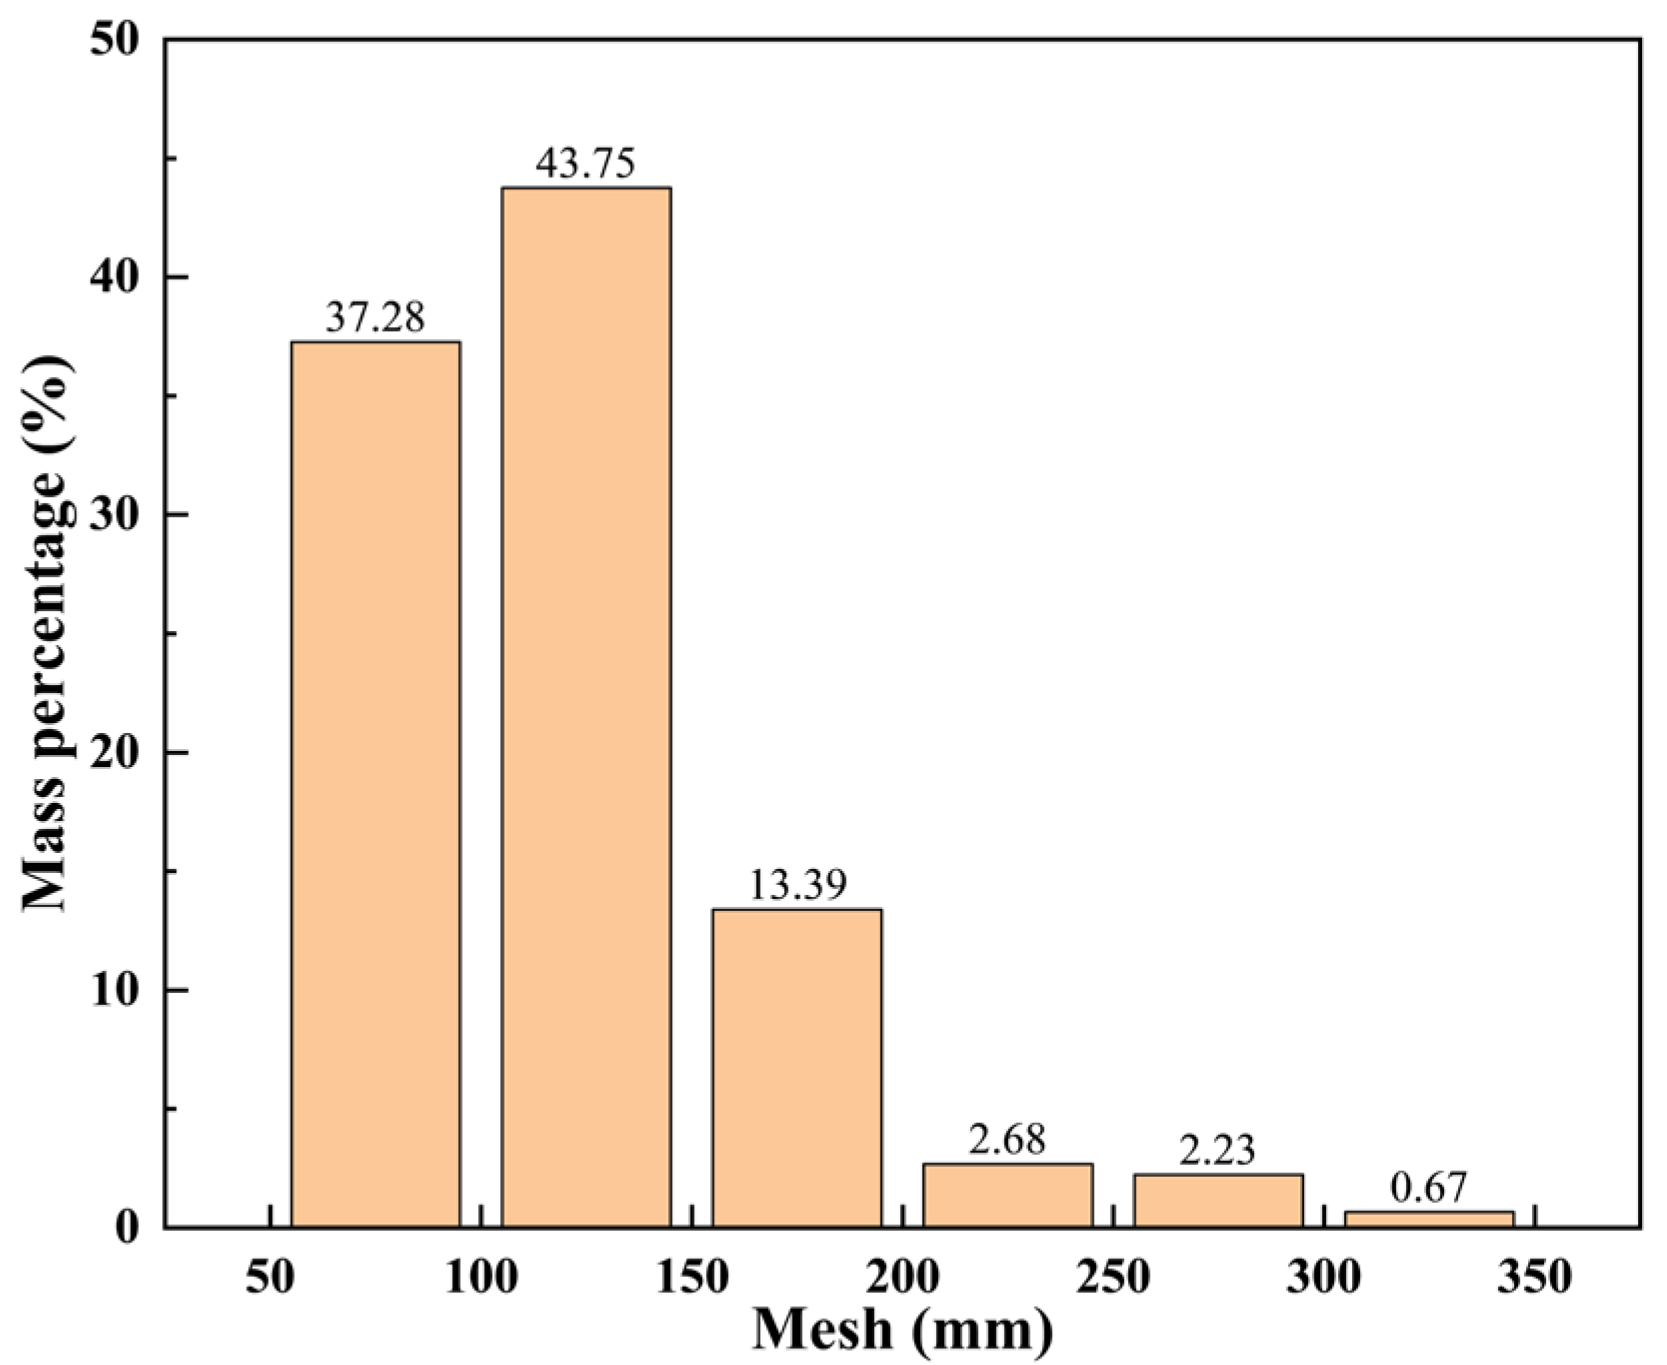
2.1. Material Composition

(1)
Sodium Bentonite
As the base of the newly developed slurry material, sodium bentonite (Nax(H2O)4(Al2-xMg0.83)Si4O10(OH)2) is primarily composed of montmorillonite minerals. Its chemical composition is mainly layered silicates, which feature large interlayer spaces capable of adsorbing significant amounts of water [20]. When bentonite comes into contact with water, water molecules enter the interlayer of silicate and interact with the surface of silicate minerals through both physical and chemical adsorption, endowing bentonite with strong water retention capacity [21]. In addition, when the grouting operation is in the stirring or vibration state, the bentonite slurry exhibits low-viscosity fluidity, while once the grouting stops in the static state, the viscosity rises rapidly, forming a stable closed layer. The particle size curve of sodium bentonite used in this experiment is shown below. It can be seen in Figure 1 that the pore size of most of the sodium bentonite is less than 100 mesh.
(2)
Sodium dodecyl benzene sulfonate
According to the electric double-layer theory, water molecules form a water film under the influence of electric field forces. However, in addition to the electric field force, interparticle water adsorption is also affected by gravity, leading to water redistribution and the agglomeration of bentonite particles. Due to the higher density of bentonite particles compared to water, they settle under gravity after mixing. When the viscosity of the bentonite slurry is low, the particles settle more quickly, resulting in a more pronounced stratification and phase separation between the water phase and the bentonite particle phase. Sodium dodecyl benzene sulfonate(C18H29NaO3S) is a commonly used anionic dispersant that is composed of a long dodecyl chain and a negatively charged benzene sulfonate group. When dissolved in water, its ionized anion part will adsorb onto the positively charged edge of the montmorillonite sheet. This disrupts the three-dimensional structure formed by the electrostatic attraction between the negatively charged sheet and the positively charged edge, resulting in better dispersion of bentonite particles. Compared with traditional single-polar dispersants, it is more conducive to promoting the dispersion of bentonite particles. In addition, SDBS can be fully adsorbed onto particle surfaces at a lower concentration and form a stable electric double layer, thereby effectively reducing the mutual attraction between the bentonite particles and preventing agglomeration.
(3)
Sodium carboxymethyl cellulose
After the bentonite is mixed with water, the slurry formed is affected by factors such as density difference and liquid viscosity. Under the long-term static state, the bentonite particles are prone to sedimentation, resulting in the stratification of bentonite and water [22]. Sodium carboxymethyl cellulose ([C6H7O2(OH)2OCH2COONa]n) is used as a thickener in the formulated slurry (see Appendix A for more details). The carboxyl and hydroxyl groups within its molecular structure interact with water molecules to form a hydrogen bond network and hydration layer [23], which enhances the solution’s viscosity, thereby promoting thorough mixing of the slurry materials and water. In addition, compared with other thickeners, sodium carboxymethyl cellulose can maintain stable physical and chemical properties in a wide pH range with a relatively mild thickening effect [24], which will not have a large negative impact on the fluidity of the slurry, and is easy to control the material index effect.

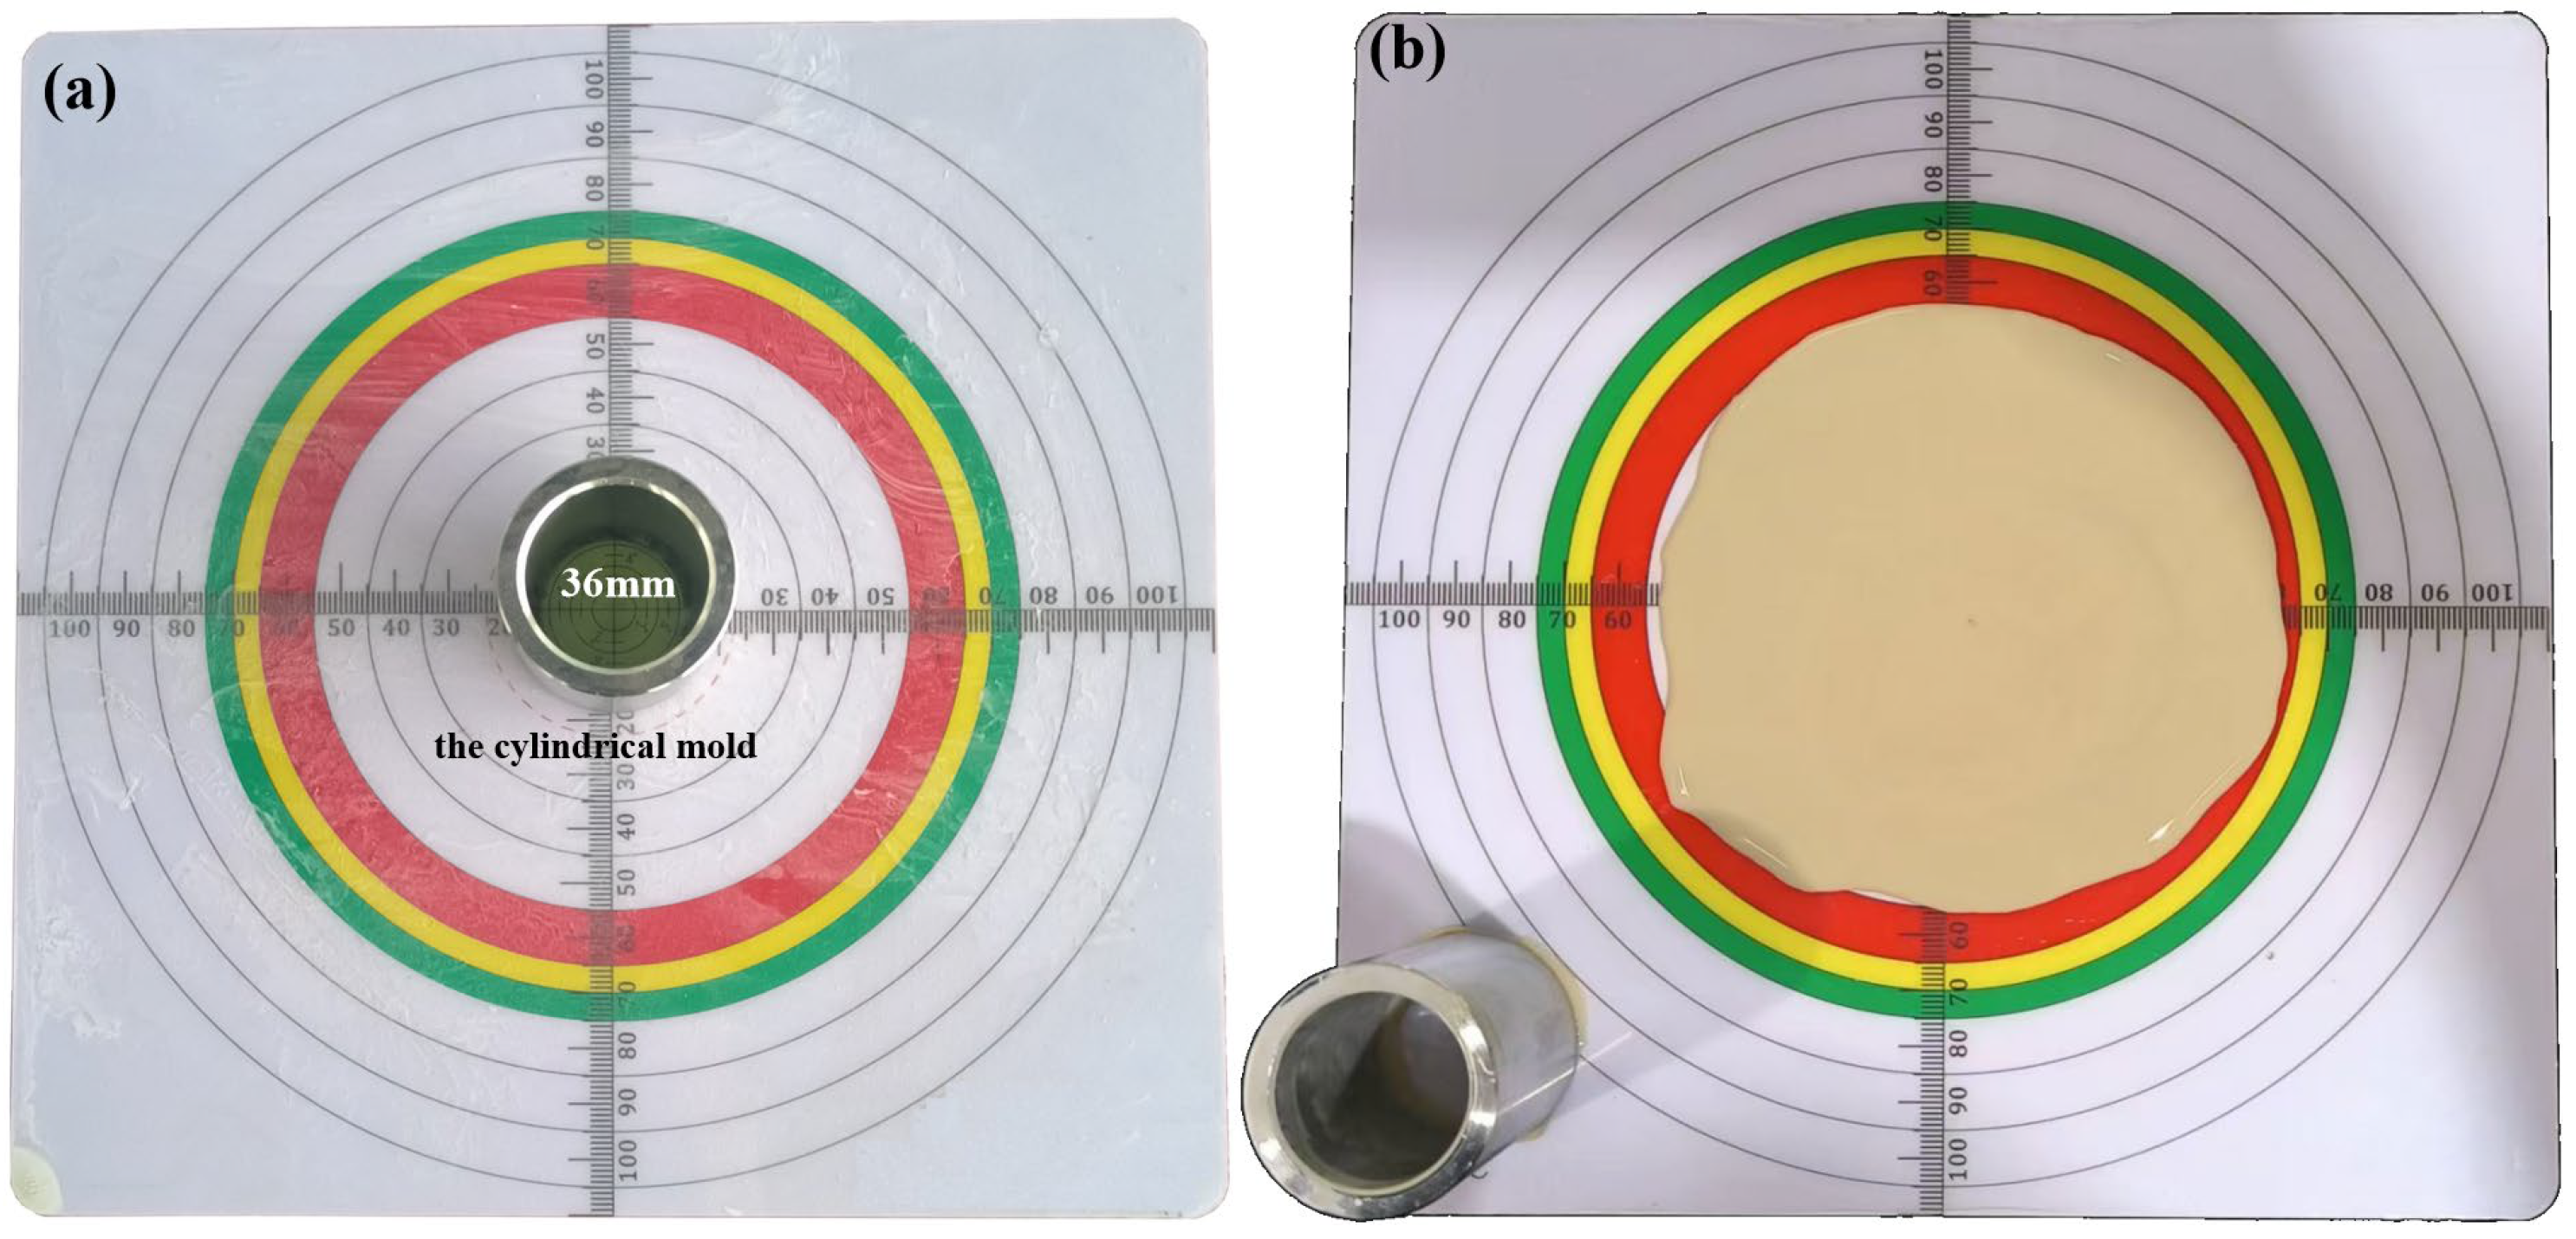
2.2. Experimental Scheme of Slurry Sealing Material

The material needs to be injected into the borehole to form an effective closed layer. Slurry with high fluidity can smoothly flow into the fine cracks to ensure that the sealing area is fully and evenly filled. Insufficient fluidity may result in the slurry failing to fully infiltrate the fractures, resulting in an unsatisfactory sealing effect. The fluidity of the sealing material was evaluated according to the fluidity measurement method specified in the “Gypsum-based self-leveling mortar” standard (JC/T 1023-2021) [25]. The well-mixed slurry was poured into a cylindrical mold, which was then swiftly lifted after leveling the surface. The cylindrical mold had a height of 60 mm and an inner diameter of 36 mm. Once the slurry had stopped flowing, the diameters in two perpendicular directions were measured and the average value was taken. To ensure the accurate measurement of slurry fluidity under low-fluidity conditions and to minimize experimental errors caused by wall adhesion, we decided to use a cylindrical mold instead of a conical mold for fluidity testing.
Water retention reflects the material’s ability to remain stable over time under dry or high-temperature conditions. High water retention performance ensures that the slurry can maintain a strong sealing ability during long-term use to prevent water loss and gas penetration [26]. The water retention of the material was primarily assessed by measuring the mass loss of the slurry under constant temperature conditions. The prepared slurry was placed in a constant-temperature drying chamber for heating. To accelerate the water loss rate of the material without causing the water to boil due to the high temperature, resulting in boiling water loss, the experimental temperature was set to 50 °C [11]. It is impossible to accurately evaluate the water retention capacity of the material in order to avoid the loss of a large amount of free water in the slurry within a short duration. Considering that the water loss rate of the material typically stabilizes over time, 8 h was selected as the experimental time setting after assessment. This time length can effectively reduce test time, enhances the experimental efficiency, and ensures the accuracy and reliability of the experimental results. After 8 h of constant temperature curing, the mass change of the material before and after curing was measured using a high-precision balance. The method for calculating water retention is presented in Equation (1) [11]:
M i = M 8 M 0 × 100 %
where Mi is the water retention of the sealing material (dimensionless), M8 is the mass of the sealing material after 8 h of constant temperature curing (g), and M0 is the mass of the sealing material at the initial moment (g).
Permeability is used to evaluate the sealing effectiveness of materials to fine cracks in gas extraction boreholes. The material’s permeability of the material was evaluated by measuring the mass loss of the slurry as it passes through the sieve [11]. To detect the plugging effect of slurry materials in cracks at different crack scales, a 150-mesh sieve with a pore size of 0.1 mm was selected, as it represented the critical point between macroscopic and microscopic cracks in coal seams. Typically, 1 h is sufficient for the material to penetrate the sieve and reach a steady state. If the measurement duration is too short, it may not fully reflect the permeability characteristics of the material. At the same time, too long a duration may make the test process affected by external factors such as temperature fluctuations, leading to unstable results. The slurry, prepared according to the predefined ratio, was poured into a 150-mesh sieve and left to stand at room temperature for 1 h. Subsequently, the mass difference of the slurry before and after passing through the sieve was measured. The permeability calculation formula is provided in Equation (2) [11]:
C = V 1 V 0 × 100 %
where C is the permeability of sealing material (dimensionless), V1 is the mass of the sealing material after 1 h (g), and V0 is the mass of the slurry material at the initial time (g).

3. Single-Factor Impact Analysis

In the single-factor experiments, we wanted to investigate the influence of a specific variable on the performance of the sealing material, with other variables set to fixed values. Based on the results of numerous preliminary exploratory experiments conducted earlier, the single-factor test parameters were set, as presented in Table 1. Among these parameters, the water–bentonite ratio refers to the mass ratio of water to bentonite. The calculation method for the dispersant and thickener content are identical to that of water–bentonite ratio. The optimal value of admixture content was determined based on the fluidity, water retention, and permeability of the material.

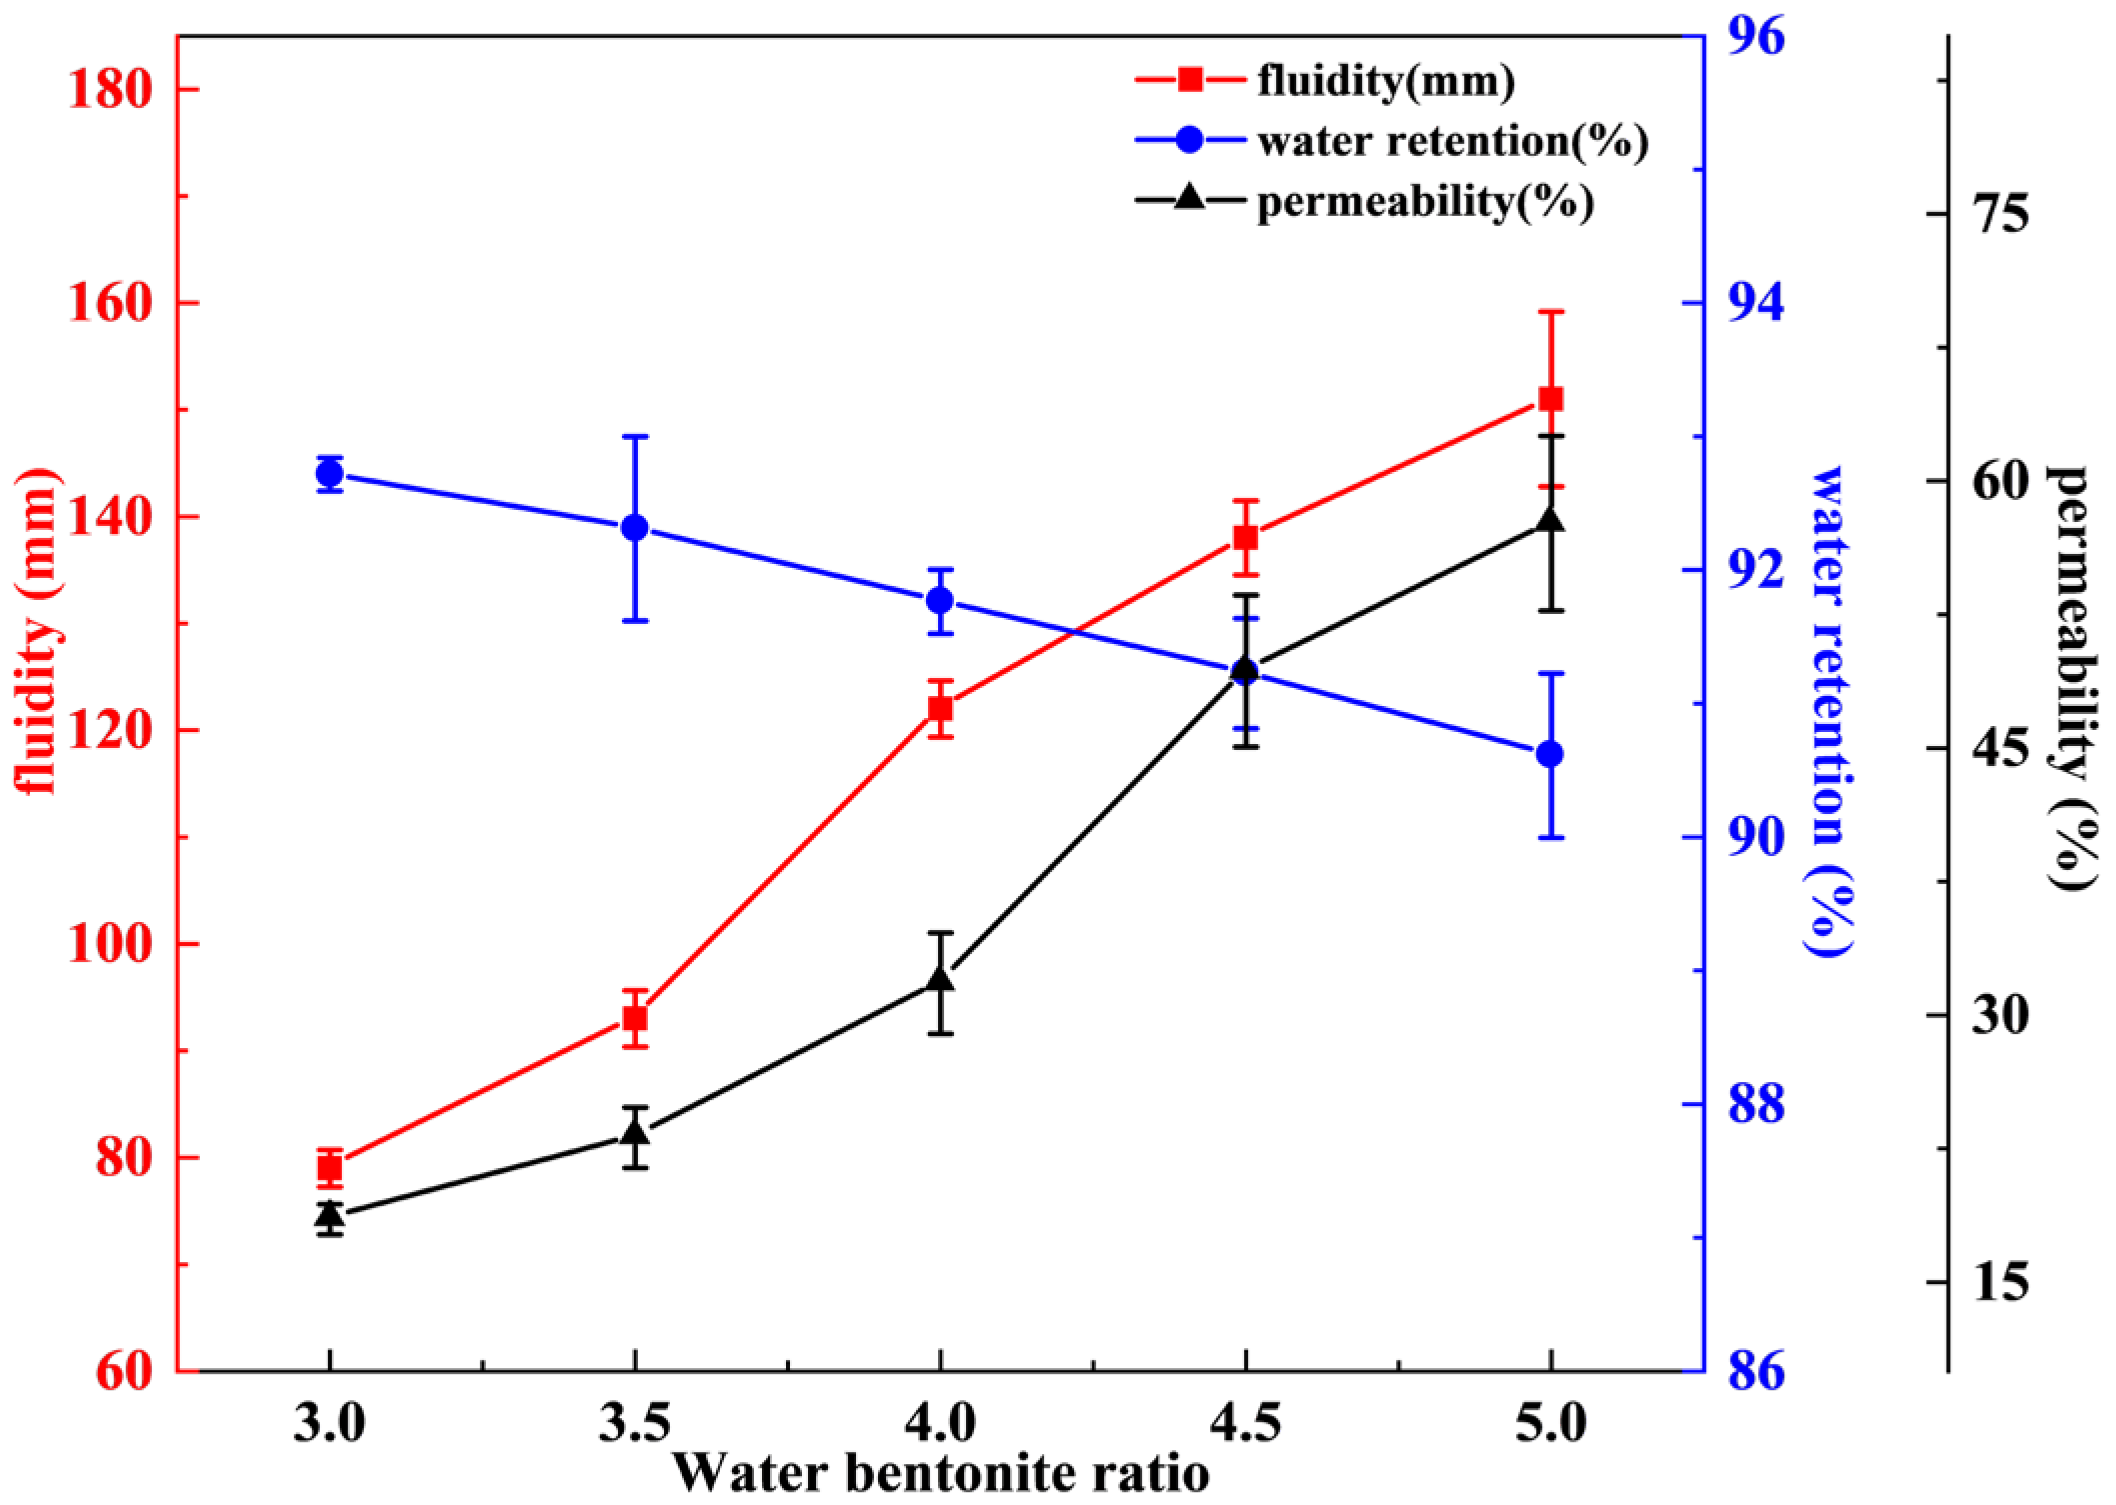
3.1. Effect of Water–Bentonite Ratio on Performance of Sealing Material

In this study, the fluidity, water retention, and permeability of slurry materials under different water–bentonite ratios were first tested. As shown in Figure 2, the fluidity of the material slurry increases linearly with the increase in the water–bentonite ratio. The standard deviations of the fluidity test results are 1.7–8.1 mm, which indicates that the test error is low and the repeatability is good. When the water–bentonite ratio is 3:1, the fluidity of the material is only 79 mm. However, as the ratio increases to 5:1, the fluidity rises to 128 mm. This is because as the ratio of water to bentonite increases, the proportion of free water in the slurry increases while the proportion of bound water adsorbed on the silicate surface decreases, leading to an enhancement in slurry fluidity. A negative correlation was observed between the water–bentonite ratio and the water retention of the material, and the standard deviation of the water retention test results of the material was between 0.13% and 0.7%. For the slurry with a 5:1 ratio, the mass decreased significantly, dropping by 9.36% after 8 h. This phenomenon occurs because as the ratio of water to bentonite increases, the ability of bentonite particles to adsorb water is limited and the proportion of free water increases. In the slurry, the interaction between bound water and bentonite particles is stronger, requiring more heat for evaporation, whereas free water is more susceptible to temperature changes and evaporates. This is attributed to the higher proportion of free water in the slurry, which is more susceptible to temperature-induced loss. With an increase in the water–bentonite ratio, the permeability of the material also increases, and the standard deviation of the permeability test results is 0.8%–4.9%, which is within the acceptable range. When the water–bentonite ratio is reduced to 3:1, the permeability of the material is only 15.83% and the diffusion radius of the slurry in the coal fracture around the borehole is limited. In contrast, when the water–bentonite ratio is 5:1, the permeability reaches 57.63%, making the slurry prone to loss during the sealing process. Based on engineering experience [27,28], slurry with a fluidity below 90 mm exhibits issues of “slow slurring and immobility”, while slurry with a permeability higher than 50% cannot be retained in a borehole for a long time. Therefore, in subsequent experiments, the water–bentonite ratio of the slurry was maintained between 3.5 and 4.5.

3.2. Effect of Dispersant Content on Performance of Sealing Material

In these experiments, five levels of dispersant content were selected: 0% (control group), 0.5%, 1%, 1.5%, and 2%. As shown in Figure 3, when the water–bentonite ratio is 4:1, the fluidity of the sealing material shows a decreasing trend with increasing dispersant content, and the standard deviation is 2.6–5 mm. When the dispersant content reaches 2%, the fluidity decreases to 101 mm, which is 84.17% of that in the control group. This is because when sodium dodecyl benzene sulfonate participates in the hydration reaction of bentonite, its anionic part interacts with cations on the surface of bentonite, forming a spatial barrier between bentonite particles, and the hydrophobic part reduces the hydration layer on the surface of bentonite particles, thereby enhancing interparticle adsorption. The particles continuously aggregate through intermolecular forces and hydrophilic–hydrophobic interactions, forming a more compact structure. This structure restricts the free flow of particles, thereby reducing in slurry fluidity. Regarding water retention, the water loss rate of the control group was 10.09%, whereas it decreased to 8.72% when the dispersant content was 2%. The standard deviation of the water retention test results was less than 1.5%, and the repeatability was good. As the dispersant content increased, more water in the slurry participated in the hydration reaction of bentonite, reducing the proportion of free water in the slurry and subsequently minimizing the volatilization of water. In addition, the dispersant content was positively correlated with the material’s permeability, suggesting that the introduction of dispersant helped to improve the permeability of the material. The standard deviation of permeability test data was 0.9%–2%. Specifically, when the dispersant content is 2%, the permeability of the material increases to 41.76%, which is 31.4% higher than that of the control group, improving its effectiveness in sealing borehole cracks. Therefore, in subsequent experiments, the dispersant content was maintained within the range of 0% to 2%.

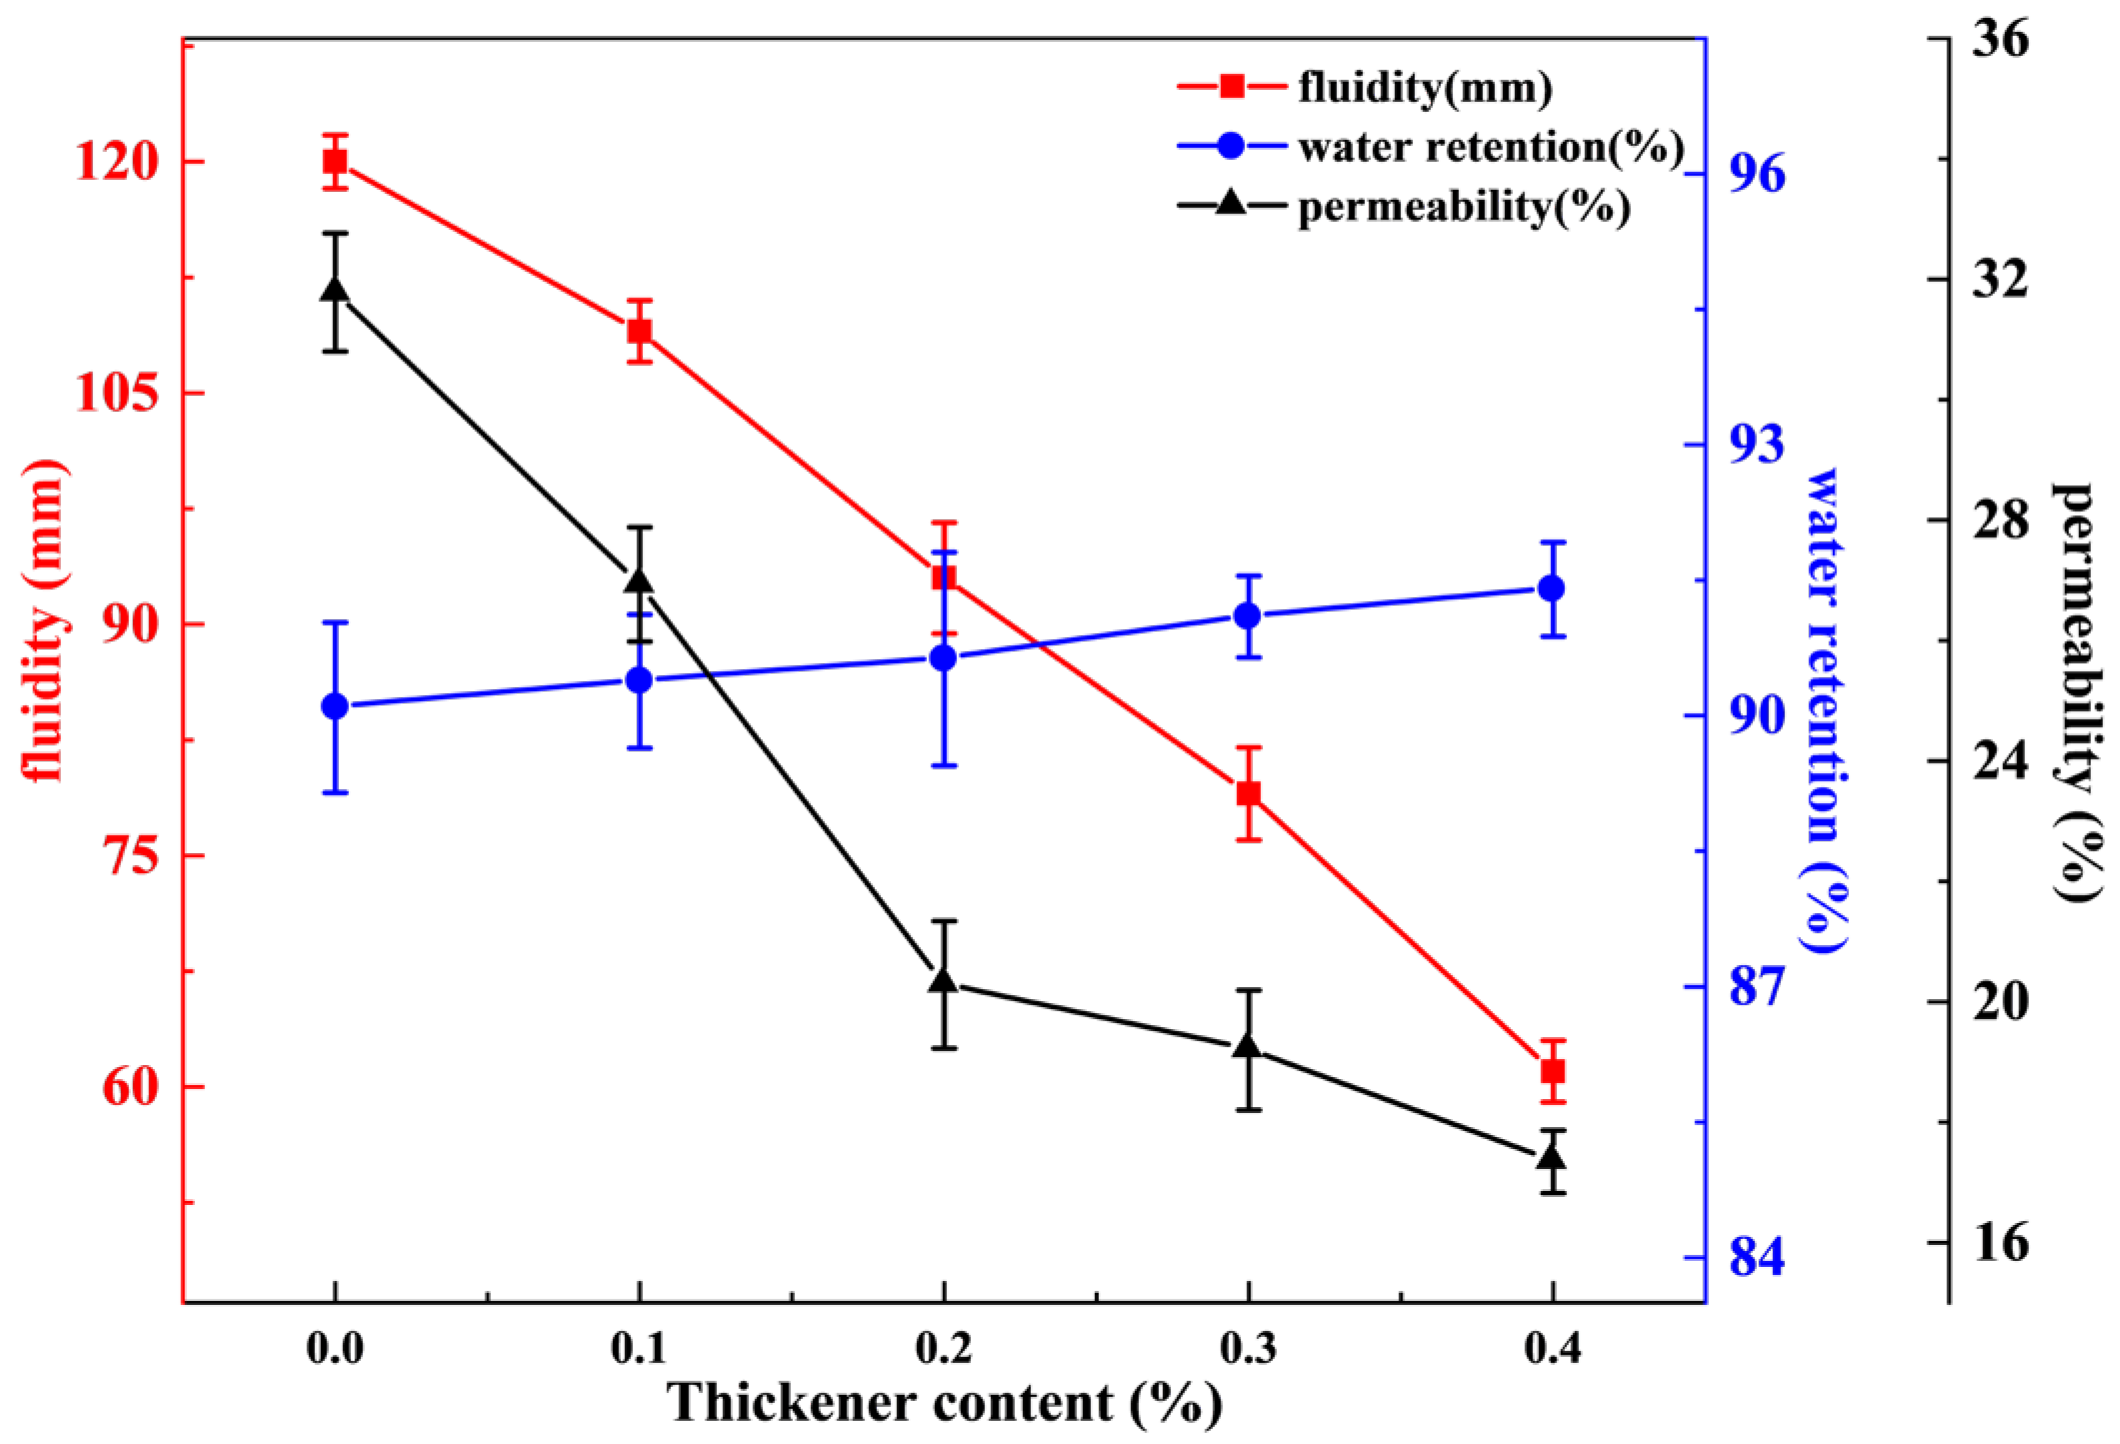
3.3. Effect of Thickener Content on Performance of Sealing Material

Five thickener content levels (0%, 0.1%, 0.2%, 0.3%, 0.4%) were tested in these experiments. As shown in Figure 4, the standard deviation of the fluidity test data is between 1.7 and 3.6 mm and that of the water retention and permeability test results less than 1.1%. At a water–bentonite ratio of 4:1, the fluidity of the slurry decreases with the increase in thickener content. At a thickener content of 0.4%, the fluidity is 61 mm, which is 50.83% of the control group. Additionally, water retention improves as the thickener content increases. The highest water retention is observed at a thickener content of 0.4%, with the slurry maintaining 91.46% of its mass after 8 h of curing. This is attributed to the enhanced interaction between hydrophilic molecules and bentonite surface, making it more difficult for water molecules to escape from the composite system of bentonite and sodium carboxymethyl cellulose. A negative correlation is observed between thickener content and material permeability. When the content of thickener is 0.4%, the material permeability is only 17.34%. By adding sodium carboxymethyl cellulose, the viscosity and emulsification effect of the slurry material are enhanced, fundamentally inhibiting the bleeding phenomenon. Due to the significant differences in the effects of thickener content on fluidity, water retention, and permeability under different water–bentonite ratios, the thickener content still needed to be set to 0% to 0.4% in subsequent orthogonal tests to ensure the applicability and accuracy of the experimental results in reflecting changes in material properties.
The single-factor experiments provided initial insights into the effects of each component. Building on these results, an orthogonal experimental design was developed to further explore the interactions among variables.

4. Slurry Sealing Material Ratio Optimization and Results

4.1. Experimental Design of Response Surface Analysis

Based on the impact of the single-factor method on each component of the material, the optimum dosage range for each factor was determined: water–bentonite ratio 3.5–4.5, dispersant content 0%–2%, and thickener content 0%–0.4%. However, it is important to note that the results of single-factor experiments do not account for the interactions between multiple factors. Therefore, it is still necessary to explore the influence mechanisms among various factors through orthogonal experiments and find the optimal material ratio. The steps of the parameter optimization process were as follows.
(1)
According to the single-factor experimental results, the appropriate range of parameters was selected.
(2)
Using Design-Expert software, 17 groups of three-factor experiments were designed.
(3)
The model with the least deviation and best fitting effect was selected.
(4)
The response surface was drawn according to the model with the best fitting effect. This was used to predict and optimize the response value, analyze the interaction between any two factors, and obtain the interaction law.
(5)
For further analysis of the experimental results, use Design-Expert software to optimize the experimental program, select five groups of recommended experimental programs, and verify the recommended schemes in terms of the optimal group allocation ratio.
In the orthogonal test, water–bentonite ratio (A), dispersant content (B) and thickener content (C) were selected as the three main factors for testing combinations. The slurry fluidity, water retention, and permeability index were used as the response values. The Box–Behnken design, a commonly used method in the Response Surface Design module of Design-Expert software, was applied to design a three-factor, three-level experiment. A total of 17 groups of experiments were carried out. The range of each factor in the test was designed as shown in Table 2, and the test results of each group are shown in Table 3.

4.2. Orthogonal Experimental Results and Response Surface Analysis

4.2.1. Response Surface Analysis of Fluidity

(1)
Establishment of the model
In order to obtain the optimal ratio of the three materials, we used the response surface analysis method to model the results of 17 groups of orthogonal experiments. The water–bentonite ratio, dispersant, and thickener content were used as the input of the model and fluidity was used as the response value of the model. The data of the orthogonal experiment (Table 3) were input into Design-Expert, and the degree of fit of different models to the experimental data was obtained. The fitting results are shown in Table 4.
In the process of selecting a response surface model, the coefficient of determination (R2) and its adjusted value are critical indicators. The R2 value quantifies how well a model explains the overall variation in the response variable. The closer this value is to 1, the better the model fits the data, indicating that it explains a larger proportion of the variation in the response variable. Conversely, adjusted R2 accounts for the potential overfitting that may arise with an increasing number of independent variables. Therefore, for models with varying numbers of independent variables, adjusted R2 provides a more accurate reflection of the model’s quality of fit. The R2 value of the quadratic equation is 0.9940, with an adjusted coefficient of determination of 0.9864, both of which are higher than those of the other models (Table 4). Therefore, the quadratic equation model was selected for the fitting analysis.
(2)
Factor variance results
In the analysis of the response surface quadratic model and variance results, parameters F and p are key indicators. The F parameter is commonly used to explain the relationship between changes in various factors and the overall variation. The larger the F, the greater the proportion of the factor’s influence on the overall variation, which makes it more likely to be statistically significant. However, the F value itself does not directly indicate the significance of the factor: it merely provides a basis for assessing significance. The p parameter is used to evaluate the significance of the model or individual factors. A smaller p indicates a higher likelihood that the factor has a significant impact on the response variable.
From the ANOVA results (Table 5), it can be seen that the significance of each factor follows the order: A (water–bentonite ratio) > C (thickener content) > B (dispersant content). Among the interaction effects of different factors, the order is: AC (water–bentonite ratio, thickener content) > BC (dispersant content, thickener content) > AB (water–bentonite ratio, dispersant content). Specifically, the significance of factors A and C is less than 0.0001, indicating that these factors are highly significant, while the significance of factor B is less than 0.005, indicating that this factor is significant as well. Among the interaction effects, the interactions between AC and BC are the most significant, which suggests that the individual factors have a high degree of influence and reliability.
(3)
Response surface analysis
In the response surface analysis method, the three-dimensional response surface illustrates the variation pattern of the response in the form of a three-dimensional plot by depicting the trend of the response value in relation to two main independent variables. Researchers can determine the range of optimal process parameters by observing the shape of the surface (such as peaks, valleys, flat regions, etc.). This allows for the identification of the optimal solution or the maximum or minimum point of the response value, providing a theoretical foundation for the optimization of complex systems [29].
Figure 5 illustrates the effect of two-factor interactions on the fluidity results. When the water–bentonite ratio remains constant, the fluidity shows little variation with changes in the dispersant content. In contrast, Figure 5b shows a significant change in fluidity as the water–bentonite ratio varies. At this point, the response surface is the steepest, and the fluidity is highest when the thickener content is at its minimum and the water–bentonite ratio is at its maximum. This suggests that the combined effect of the water–bentonite ratio and thickener content on slurry fluidity is more significant. The response surface for the dispersant content and thickener content interaction is relatively flat, indicating that the interaction between the water–bentonite ratio and dispersant content has a weaker effect on slurry fluidity. It can be seen that the interaction between the water–bentonite ratio and thickener content has the greatest impact on slurry viscosity, with the fluidity’s three-dimensional response surface varying between 75 mm and 160 mm, which is significantly higher than that of the other response surfaces.

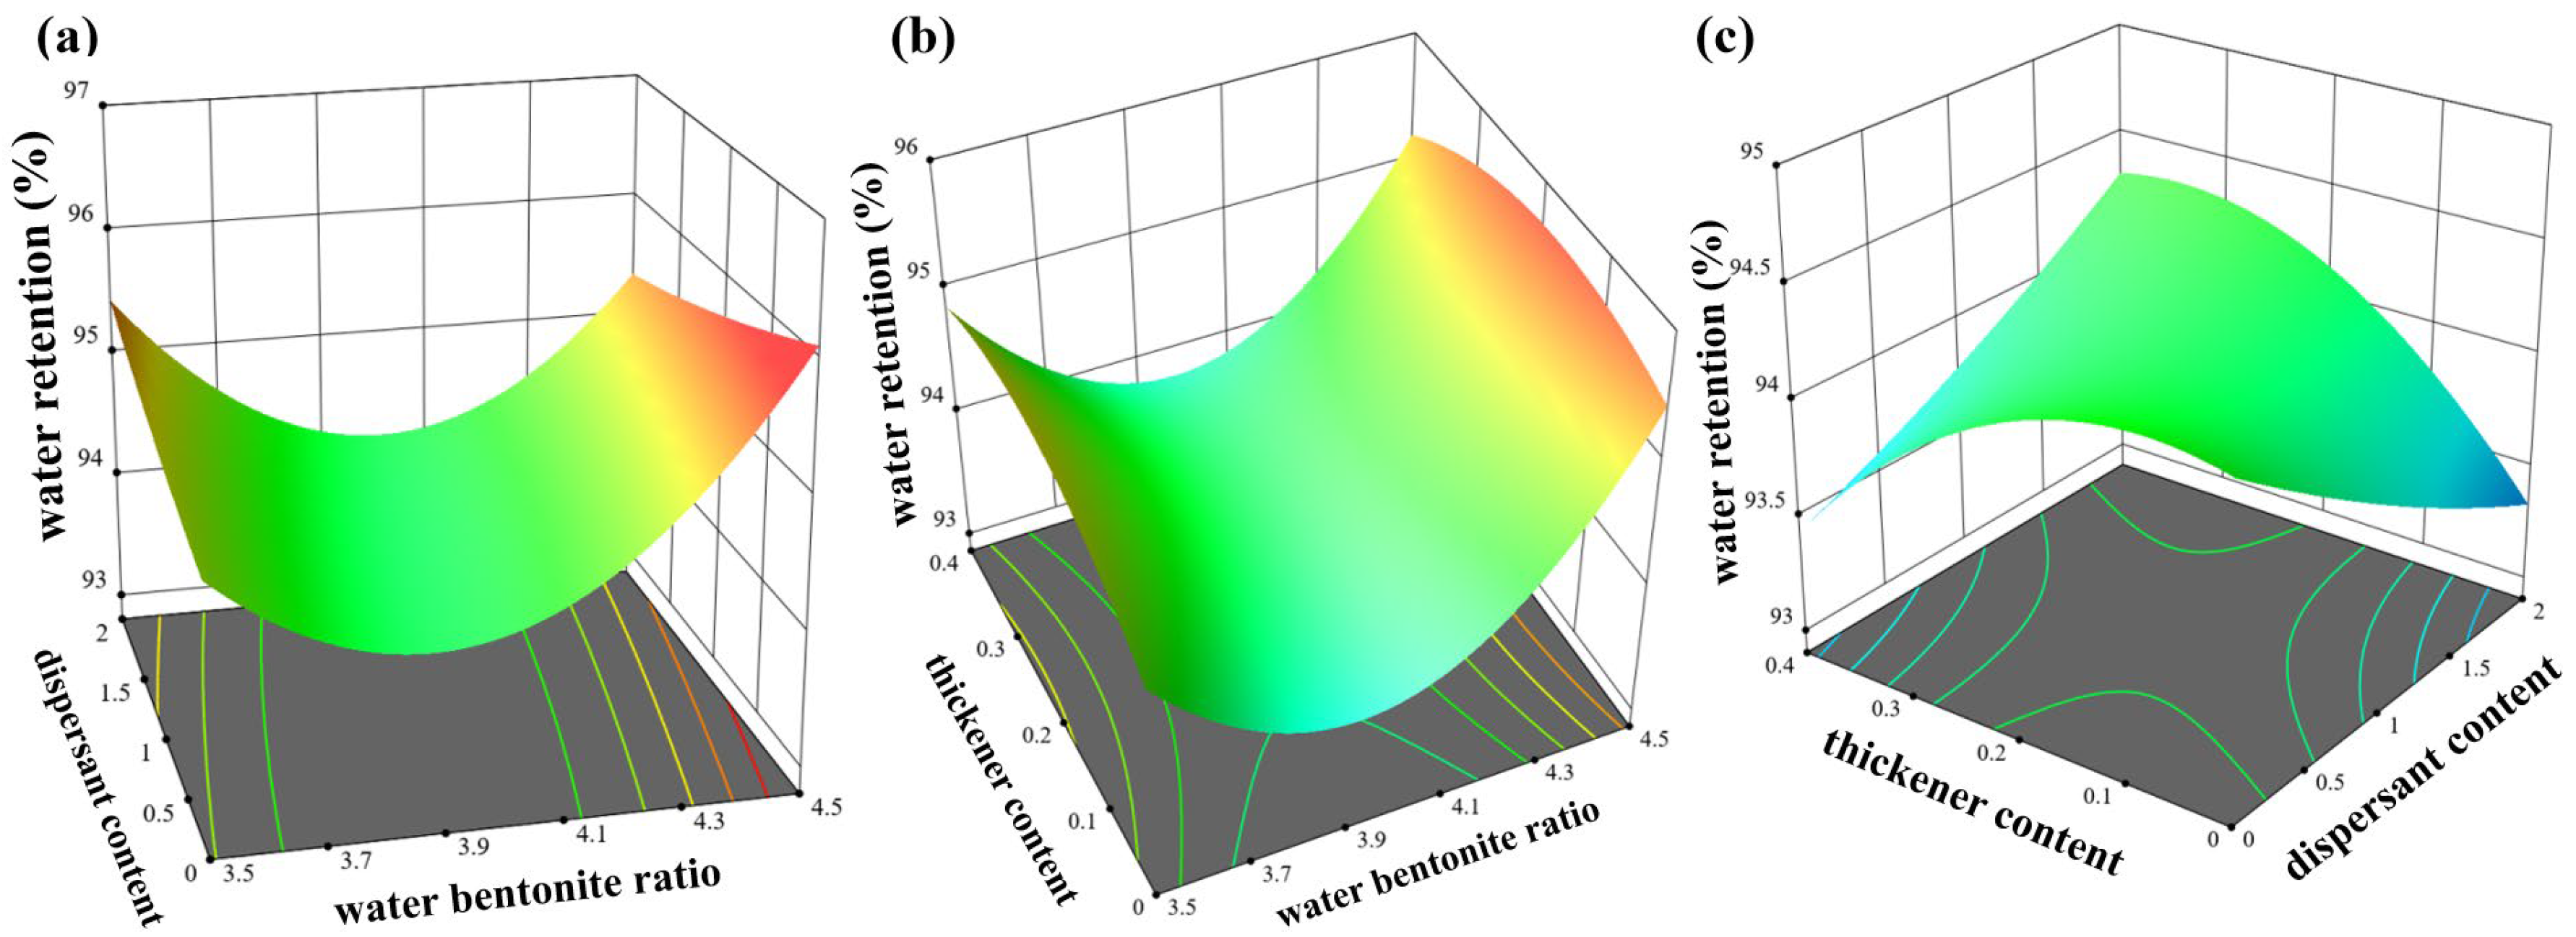
4.2.2. Response Surface Analysis of Water Retention

(1)
Establishment of the model
As shown in Table 6, the coefficient of determination R2 and the adjusted R2 of the quadratic equation are the highest among the various models, indicating a significant relationship between the response value and the factors. Therefore, the quadratic equation model was selected for fitting.
(2)
Factor variance results
As shown in Table 7, parameter F of the model is 3.95, and the p is 0.0419, indicating a high degree of fit between the model and the data. The order of the significance of influence of each factor is A (water–bentonite ratio) > B (dispersant content) > C (thickener content), and the order of the significance of influence of each factor is BC (dispersant content, thickener content) > AB (water–bentonite ratio, dispersant content) > AC (water–bentonite ratio, thickener content). The p value of factor A is 0.1343, indicating that the index is significant. The interaction of BC was the most significant, and the interaction of AC was the least significant.
(3)
Response surface analysis
Figure 6 shows the effect of two-factor interaction on water retention. It can be seen in Figure 6a that a higher water–bentonite ratio improves water retention, and the floating range of the response surface is 94–97 mm, which is higher than other two-factor response surfaces. Additionally, the change in water retention is most pronounced under the interaction between the water–bentonite ratio and thickener content. When both the water–bentonite ratio and thickener content are high, the response surface becomes steeper, indicating that a higher water–bentonite ratio and thickener content are advantageous for improving water retention. When the content of dispersant and thickener increases at the same time, the water retention can be maintained at about 95%, but it is still gentler than other response surfaces, that is, the interaction between dispersant content and thickener content is poor, and the effect on the water retention of the material is not clear. On the whole, a high water–bentonite ratio improves the water retention of slurry materials, and the content of dispersant and thickener should be controlled at the same time.

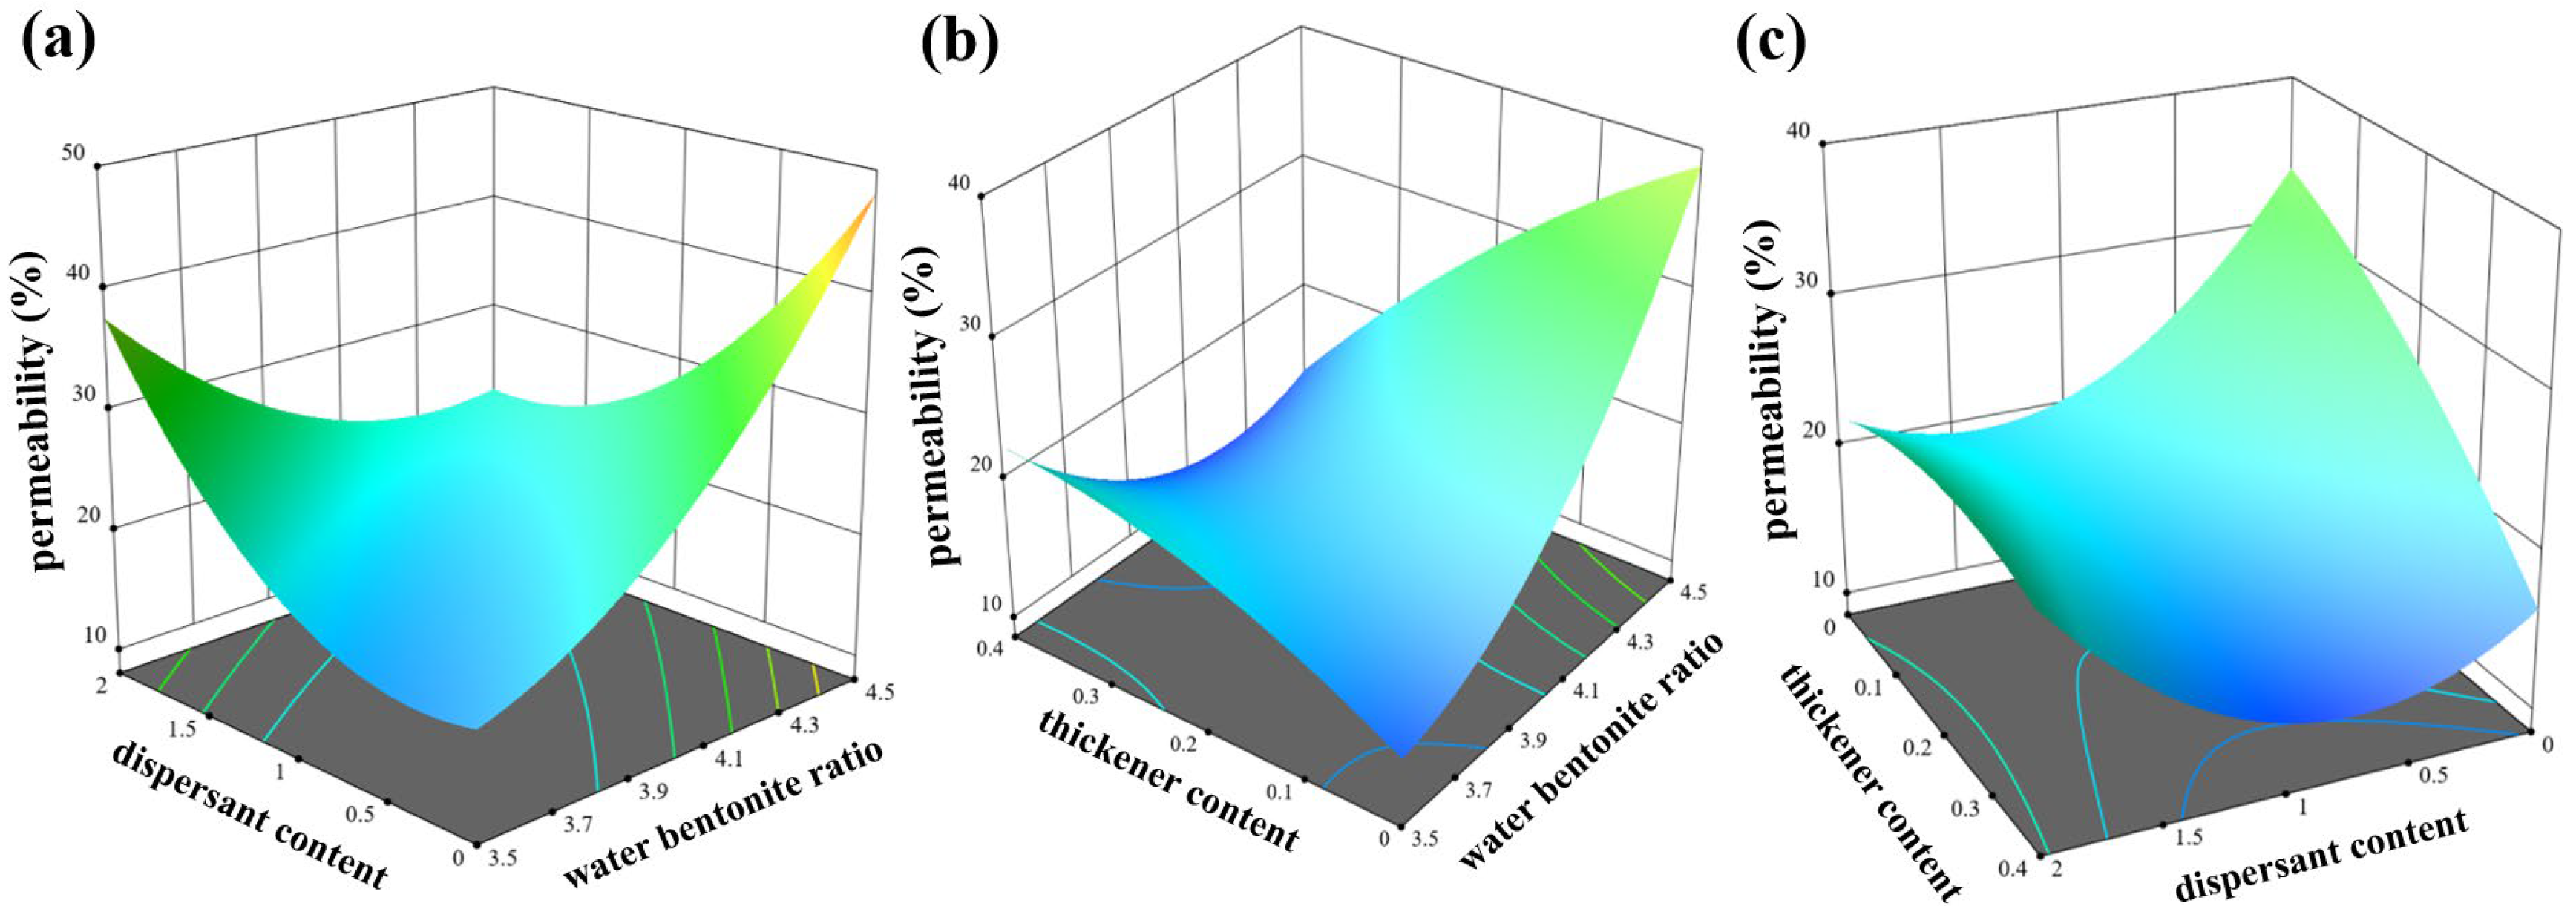
4.2.3. Response Surface Analysis of Permeability

(1)
Establishment of the model
It can be seen in Table 8 that the R2 value of the cubic equation model is slightly higher than that of the quadratic equation model, but its adjusted R2 is lower than that of the quadratic equation, indicating that the explanatory power of the cubic equation model is relatively weaker and requires further optimization. Therefore, the quadratic equation model was selected to fit the experimental data.
(2)
Factor variance results
It can be seen in Table 9 that the F of the model is 5.61 and the p is 0.0166, indicating that the model fits the data well and the experimental error is small. From the test of significance, the order of the significance of influence of each factor is A (water–bentonite ratio) > C (thickener content) > B (dispersant content) and the interaction of factors AB (water–bentonite ratio, dispersant) > AC (water–bentonite ratio, thickener content) > BC (dispersant content, thickener content). The p of factor A is 0.0791, indicating that the index is significant. The interaction of AB is the most significant, and the interaction of AC is the least significant.
(3)
Response surface analysis
The effect of the two-factor interaction on material permeability is shown in Figure 7. The interaction between the water–bentonite ratio and dispersant has a significant impact on the material’s permeability. The floating range of the response surface is 10%–50%, which is notably higher than that of the other response surfaces. When the water–bentonite ratio is large and the dispersant content is low, the permeability of the material is significantly improved. The response surface of the water–bentonite ratio and thickener content is saddle-shaped. When the water–bentonite ratio increases and the thickener content decreases, the permeability of the material improves significantly. The fluctuation in the response surface for the interaction between the water–bentonite ratio and thickener content is greater than that of the dispersant content and thickener content. This indicates that the interaction between the water–bentonite ratio and dispersant content has a more pronounced effect on permeability than the interaction between dispersant content and thickener content. The response surface for dispersant and thickener content is relatively flat, suggesting a minimal impact on material permeability. To enhance the material’s permeability, it is recommended to increase the water–bentonite ratio and reduce the dosages of dispersant and thickener.

4.3. Optimization and Analysis of Experimental Results

The test scheme was optimized by Design-Expert software (version 13), and five groups of test schemes recommended by the software were selected to prepare the sealing material slurry. The fluidity, water retention, and permeability of the material slurry obtained from the tests were compared with those of the recommended test schemes, as shown in Table 10.
As can be seen in Table 10, the fluidity and water retention of the five groups of materials from strongest to weakest are 5# > 3# > 1# > 2# > 4# and permeability 5# > 4# > 3# > 1# > 2#. Overall, the performance of group 5# best meets the sealing requirements. Specifically, when the water–bentonite ratio of the sealing material is 4.41:1, the dispersant content is 0.38%, and the thickener content is 0.108%, all performance indicators reach their optimal levels.

5. Conclusions

We developed a novel liquid-phase non-setting borehole sealing material. This new slurry sealing material, with good fluidity, excellent water retention, and significant permeability, was formulated using bentonite as the base material, sodium dodecyl benzene sulfonate as the dispersing agent, and sodium carboxymethyl cellulose as the thickener. We have summarized several key insights below.
  • In the single-factor experiment, as the water–bentonite ratio increased from 3:1 to 5:0, the fluidity of the sealing material increased from 79 to 151 mm, the permeability increased from 18.5% to 57.6%, and the water retention decreased from 92.7% to 90.6%. With the increase in dispersant content, the water retention of the sealing material increased from 89.9% to 91.4% and the permeability increased from 31.8% to 41.8%, but the fluidity decreased from 120 mm to 101 mm. On the contrary, with the increase in thickener content, the water retention increased from 90.4% to 91.4%, the fluidity decreased from 109 mm to 61 mm, and the permeability decreased from 27% to 17.3%.
  • A nonlinear quadratic regression model for fluidity, water retention, and permeability concerning the three factors of water–bentonite ratio, dispersant, and thickener was developed using the response surface methodology of response surface class design methods. The interaction between the water–bentonite ratio and thickener had the most pronounced effect on fluidity, ranging from 75 mm to 160 mm. The interaction between dispersant and thickener had the most significant impact on water retention, ranging from 93.3% to 94.5%. The interaction between water–bentonite ratio and dispersant had the most substantial influence on permeability, ranging from 15% to 46%.
  • The response surface analysis indicated that the deviation between the experimental results and the predicted values for the optimized ratio of the new slurry sealing material was less than 0.81%. The optimal composition is a water–bentonite ratio of 4.41:1, dispersant content of 0.38%, and thickener content of 0.108%. Under this composition, the material exhibits fluidity of 134 mm, water retention of 96.12%, and permeability of 41.45%.

Author Contributions

Conceptualization, Q.Z. and C.X.; methodology, C.X.; software, C.X.; validation, C.X., H.Z. and T.Q.; formal analysis, T.Q.; investigation, C.X.; resources, Q.Z.; data curation, Q.Z.; writing—original draft preparation, C.X.; writing—review and editing, Q.Z. and Z.S.; visualization, C.X.; supervision, H.Z. and Z.S.; project administration, H.Z.; funding acquisition, H.Z. All authors have read and agreed to the published version of the manuscript.

Funding

This research was funded by the National Natural Science Foundation of China (52204192), the Anhui Provincial Excellent scientific Research and Innovation Team Project for Universities (2022AH010051), and the Scientific Research Foundation for High-level Talents of Anhui University of Science and Technology (2024yjrc142).

Data Availability Statement

The raw data supporting the conclusions of this article will be made available by the authors on request.

Acknowledgments

We thank the assistant editor and anonymous referees for their very useful reviews that have helped us to write a better manuscript.

Conflicts of Interest

Hui Zuo is an employee of Anhui Panshi Technology Co., Ltd. The paper reflects the views of the scientists and not the company.

Appendix A

As shown in Figure A1, the fluidity of the slurry is neither beyond the green area nor less than the red area, indicating that the fluidity is sufficient to ensure the slurry can fully flow in the borehole while not being excessive enough to cause significant slurry loss into fractures, thereby maintaining the stability of the sealing effect.
Figure A1. Test of material fluidity. (a) Schematic diagram of cylindrical mold dimension labeling. (b) Fluidity test result diagram. The yellow slurry is the developed sealing material, and the metal in the lower-left corner is a circular mold.
Minerals 15 00385 g0a1

References

  1. Zhao, W.; Zhao, D.; Wang, K.; Fan, L.; Zhao, Z.; Dong, H.; Shu, L. Will greenhouse gas emissions increase with mining depth in coal mines? An analysis of gas occurrence under varying in-situ stress conditions. Sci. Total. Environ. 2024, 945, 173957. [Google Scholar] [CrossRef]
  2. Li, M.; Cheng, X. Identification and Prediction of Thermodynamic Disasters During Deep Coal Mining. Int. J. Heat Technol. 2022, 40, 6. [Google Scholar] [CrossRef]
  3. Zhang, J.; Lin, H.; Li, S.; Yang, E.; Ding, Y.; Bai, Y.; Zhou, Y. Accurate gas extraction (AGE) under the dual-carbon background: Green low-carbon development pathway and prospect. J. Clean. Prod. 2022, 377, 134372. [Google Scholar] [CrossRef]
  4. Gao, J.; Guan, C.; Zhang, B.; Li, K. Decreasing methane emissions from China’s coal mining with rebounded coal production. Environ. Res. Lett. 2021, 16, 124037. [Google Scholar] [CrossRef]
  5. Zhang, C.; Cheng, R.-H.; Liu, C.; Xue, J.-H.; Liu, H.; Jin, G.-H.; Chang, J.; Yan, J.; Zeng, X.-Z.; Wang, X.-L. Experimental study on strengthening and sealing materials and their application in coal mines. Adv. Mater. Sci. Eng. 2020, 2020, 6025452. [Google Scholar] [CrossRef]
  6. Chen, Y.; Li, A.; Yang, D.; Liu, T.; Li, X.; Tang, J.; Jiang, C. Study on the Interaction between Low-Viscosity High-Permeability Pregrouting Sealing Material and Coal and Its Application. Adv. Polym. Technol. 2020, 2020, 1217285. [Google Scholar] [CrossRef]
  7. Zhang, Y.; Zou, Q.; Guo, L. Air-leakage Model and sealing technique with sealing–isolation integration for gas-drainage boreholes in coal mines. Process Saf. Environ. Prot. 2020, 140, 258–272. [Google Scholar] [CrossRef]
  8. Wang, Z.; Sun, Y.; Wang, Y.; Zhang, J.; Sun, Z. A coupled model of air leakage in gas drainage and an active support sealing method for improving drainage performance. Fuel 2019, 237, 1217–1227. [Google Scholar] [CrossRef]
  9. Hong, Z.; Zuo, J.; Li, Z.; Xu, L. Characterization and field application of a novel dual-liquid gas leakage material: Mechanical properties and microscopic hydration mechanism. PLoS ONE 2023, 18, e0284140. [Google Scholar] [CrossRef]
  10. Yu, S.; Su, X.; Song, J.; Wang, Q.; You, Z. The hole sealing technology of solid–Liquid Materials with three pluggings and two injections for gas extraction hole in the coal mine. ACS Omega 2022, 7, 43847–43855. [Google Scholar] [CrossRef]
  11. Cheng, J.; Fu, Q.; Wang, Y.; Ma, Z.; Ran, D.; Sheng, S.; Ma, Y. Development of non-coagulable grout long-term sealing material for gas drainage. Inorg. Chem. Commun. 2023, 154, 110882. [Google Scholar] [CrossRef]
  12. He, Y.; Zhang, K.N.; Wu, D.Y. Experimental and modeling study of soil water retention curves of compacted bentonite considering salt solution effects. Geofluids 2019, 1, 4508603. [Google Scholar] [CrossRef]
  13. Khan, M.K.; Di Emidio, G.; Adam, B. Water retention curves of untreated and hyper clay geosynthetic clay liners. Environ. Geotech. 2022, 11, 90–101. [Google Scholar] [CrossRef]
  14. Albadri, W.M.; Alhani, I.J.; Shaia, H.A.; Sabri, M.M.S.; Lim, S.M.; Jabbar, M.S.; Mohammed, M.S. Investigating the hydro-mechanical behaviour of unsaturated sand-bentonite mixtures using suction-controlled triaxial test. Case Stud. Constr. Mater. 2023, 18, e01953. [Google Scholar] [CrossRef]
  15. Zhao, J.; Cheng, J. Research on interface modification and long-term sealing properties of bentonite-based sealing materials. Coal Eng. 2024, 56, 157–164. (In Chinese) [Google Scholar]
  16. Guo, X.; Xue, S.; Zheng, C.; Li, Y. Experimental research on performance of new gas drainage borehole sealing material with high fluidity. Adv. Mater. Sci. Eng. 2021, 2021, 6645425. [Google Scholar] [CrossRef]
  17. Guo, X.; Xue, S.; Li, Y.; Zheng, C.; Yang, G. Fluidity influencing factors analysis and ratio optimization of new sealing materials based on response surface method. Geofluids 2021, 2021, 5538302. [Google Scholar] [CrossRef]
  18. Xue, S.; Guo, X.; Zheng, C.; Li, Y.; Zheng, X. Response Surface Method for Strength Analysis and Proportion Optimization of New Type Sealing Materials. Geofluids 2021, 2021, 8769809. [Google Scholar] [CrossRef]
  19. Mao, J.; Guanhua, N.; Yuhang, X.; Hui, W.; Zhao, L.; Zhenyang, W. Modeling and optimization of mechanical properties of drilling sealing materials based on response surface method. J. Clean. Prod. 2022, 377, 134452. [Google Scholar] [CrossRef]
  20. Zhou, J.; Sun, Q. Sodium alginate/modified bentonite composite bead adsorptive removal of norfloxacin: Static and dynamic adsorption. Polymers 2022, 14, 3984. [Google Scholar] [CrossRef]
  21. Cheng, J.; Ma, Z.; Wang, Y.; Fu, Q.; Ran, D.; Ma, Y.; Yang, C.; Hu, X.; Chu, T. Performance and application of new inorganic retarding sealing material suitable for multi-scale fractures. Heliyon 2023, 9, e16603. [Google Scholar] [CrossRef] [PubMed]
  22. Wang, Z.; Wei, W. Analysis of the main sealing methods of gas drainage borehole in coal mine. Coal Sci. Technol. 2014, 42, 31–34. (In Chinese) [Google Scholar] [CrossRef]
  23. Goncharuk, V.V.; Dubrvina, L.V.; Makarova, E.V. Conservation of Water in Gel and Dispersed Structurally Stable Composites. J. Water Chem. Technol. 2018, 40, 46–50. [Google Scholar] [CrossRef]
  24. Boylu, F.; Ateşok, G.; Dincer, H. The effect of carboxymethyl cellulose (CMC) on the stability of coal-water slurries. Fuel 2015, 84, 315–319. [Google Scholar] [CrossRef]
  25. JC/T 1023-2007; Gypsum Based Self-Leveling Floor Compound. Building Material Net: Beijing, China, 2007.
  26. Cheng, J.; Ran, D.; Fu, Q.; Lu, W.; Sheng, S.; Ma, Z.; Fediuk, R.; Liu, J. Solid-liquid particle flow sealing mucus (PFSM) in enhancing coalbed methane (CBM) recovery: Multiple-perspectives analysis and mechanism insights. Constr. Build. Mater. 2024, 435, 136670. [Google Scholar] [CrossRef]
  27. Zhang, H.; Li, Y.; Yao, B.; Mian, W. Time-dependent viscosity diffusion model of cement mortar grouting for gas drainage borehole sealing. Coal Sci. Technol. 2020, 48, 52–59. (In Chinese) [Google Scholar] [CrossRef]
  28. Gao, Z. Application of Secondary Grouting Sealing Technology to Improve Gas Extraction Efficiency. Coal Technol. 2017, 36, 141–143. (In Chinese) [Google Scholar] [CrossRef]
  29. Hamza, H.; Eterigho-Ikelegbe, O.; Jibril, A.; Bada, S.O. Application of the response surface methodology to optimise the leaching process and recovery of rare earth elements from discard and run of mine coal. Minerals 2022, 12, 938. [Google Scholar] [CrossRef]
Figure 1. Particle size distribution of sodium bentonite by sieve analysis.
Minerals 15 00385 g001
Figure 2. Influence of water–bentonite ratio on slurry sealing material.
Minerals 15 00385 g002
Figure 3. Influence of dispersant content on slurry sealing material.
Minerals 15 00385 g003
Figure 4. Influence of thickener content on slurry sealing material.
Minerals 15 00385 g004
Figure 5. Effects of interaction between different factors on the fluidity of slurry sealing materials. (a) Water–bentonite ratio and dispersant content. (b) Water–bentonite ratio and thickener content. (c) Dispersant content and thickener content.
Minerals 15 00385 g005
Figure 6. Effects of interaction between different factors on the water retention of slurry sealing materials. (a) Water–bentonite ratio and dispersant content. (b) Water–bentonite ratio and thickener content. (c) Dispersant content and thickener content.
Minerals 15 00385 g006
Figure 7. Effects of interaction between different factors on the permeability of slurry sealing materials. (a) Water–bentonite ratio and dispersant content. (b) Water–bentonite ratio and thickener content. (c) Dispersant content and thickener content.
Minerals 15 00385 g007
Table 1. Single-factor experimental design.
ExperimentWater–Bentonite RatioDispersant Content (%)Thickener Content (%)
13.000
23.500
34.000
44.500
55.000
64.000
74.00.50
84.01.00
94.01.50
104.020
114.000
124.000.1
134.000.2
144.000.3
154.000.4
Table 2. Value range of each factor in orthogonal experiment.
Experimental GroupValue Range of Each Factor (%)
Water–Bentonite RatioDispersant ContentThickener Content
1–173.5–4.50–20–0.4
Table 3. Orthogonal experimental factor parameters and results.
ExperimentInfluencing Factor
Experimental Ratio (Water–Bentonite Ratio: Dispersant Content: Thickener Content)Fluidity (mm)Water Retention (%)Permeability (%)
13.5:0:0.275 ± 2.6594.64 ± 0.3317.71 ± 0.58
24.5:0:0.2129 ± 2.0095.76 ± 0.2153.03 ± 0.99
33.5:2:0.280 ± 1.7395.82 ± 0.5433.07 ± 0.33
44.5:2:0.2115 ± 2.6595.56 ± 0.6321.84 ± 0.92
53.5:1:091 ± 2.6594.65 ± 0.311.64 ± 0.52
64.5:1:0163 ± 2.6595.7 ± 0.4933.12 ± 1.07
73.5:1:0.488 ± 1.0094.66 ± 0.0928.59 ± 0.58
84.5:1:0.4110 ± 1.7395.16 ± 0.5115.38 ± 0.12
94.0:0:0124 ± 2.0094.44 ± 0.9034.82 ± 0.73
104.0:2:099 ± 1.7392.91 ± 0.2728.8 ± 1.06
114.0:0:0.480 ± 1.7393.88 ± 1.459.98 ± 0.94
124.0:2:0.494 ± 2.0094.21 ± 0.2122.81 ± 0.72
134.0:1:0.293 ± 2.6593.47 ± 0.7916.61 ± 0.78
144.0:1:0.297 ± 2.6593.82 ± 0.8920.35 ± 0.78
154.0:1:0.2100 ± 2.0094.39 ± 0.9318.78 ± 1.14
164.0:1:0.295 ± 1.0094.51 ± 0.6418.1 ± 0.91
174.0:1:0.299 ± 2.0094.55 ± 1.5620.02 ± 0.84
Table 4. Multimodel comprehensive statistical analysis of fluidity.
Sequential p-ValueAdjusted R2Predicted R2Suggested
Linear0.78160.7312No
2FI0.92000.8719No
Quadratic0.99400.9864Yes
Cubic0.96480.9792No
Table 5. Quadratic model of fluidity response surface and analysis of variance (ANOVA) results.
SourceSum of SquaresMean SquareFp
Model6255695.1129.6<0.0001
A37413741697.4<0.0001
B50509.3200.0185
C11281128210.3<0.0001
AB90.2590.2516.820.0046
AC40040074.57<0.0001
BC380.3380.370.89<0.0001
Table 6. Multimodel comprehensive statistical analysis of water retention.
Sequential p-ValueAdjusted R2Predicted R2Suggested
Linear0.0684−0.1470No
2FI0.1999−0.2800No
Quadratic0.93540.8240Yes
Cubic0.81480.6592No
Table 7. Quadratic model of water retention response surface and ANOVA results.
SourceSum of SquaresMean SquareFp
Model9.01 × 10−41.00 × 10−43.9500.0419
A7.26 × 10−57.26 × 10−52.8700.1343
B6.05 × 10−76.05 × 10−70.0240.8816
C5.51 × 10−75.51 × 10−70.0220.8869
AB4.76 × 10−54.76 × 10−51.8800.2128
AC7.56 × 10−67.56 × 10−60.3000.6018
BC8.65 × 10−58.65 × 10−53.4100.1072
Table 8. Multimodel comprehensive statistical analysis of permeability.
Sequential p-ValueAdjusted R2Predicted R2Suggested
Linear0.1492−0.0471No
2FI0.67130.4741No
Quadratic0.98810.8715Yes
Cubic0.98490.7295No
Table 9. Quadratic model of permeability response surface and ANOVA results.
SourceSum of SquaresMean SquareFp
Model0.16000.01705.610.0166
A0.01300.01304.220.0791
B0.01020.01020.330.5845
C0.01200.01204.020.0848
AB0.05400.054017.440.0042
AC0.03000.03009.690.017
BC0.00880.08882.860.1347
Table 10. Optimized ratio and result verification.
NumberExperimental Optimization RatioFluidity (mm)Water Retention (%)Permeability (%)
Water–Bentonite RatioDispersant Content
(%)
Thickener Content
(%)
PredictedExperimentalPredictedExperimentalPredictedExperimental
1#4.150.290.039126.3112294.5294.1334.0734.24
2#4.381.040.19117.8511595.0894.5124.9725.12
3#4.470.650.16131.4613295.7294.7735.6135.62
4#4.390.130.25113.6710995.2994.0935.9136.45
5#4.410.380.108135.0913495.5496.1241.1341.45
Disclaimer/Publisher’s Note: The statements, opinions and data contained in all publications are solely those of the individual author(s) and contributor(s) and not of MDPI and/or the editor(s). MDPI and/or the editor(s) disclaim responsibility for any injury to people or property resulting from any ideas, methods, instructions or products referred to in the content.

