Article

Study of Sulfide Ore from the Perspective of the Hierarchical Oxidation and Asymmetric Corrosion Mechanism of Minerals: (I) Chalcopyrite

by
Runqing Liu
1,
Yacong Wu
1,
Changtao Wang
2,3,*,
Yuehua Hu
1,
Xian Xie
2,3,
Wei Sun
1 and
Xiong Tong
2,3
1
School of Minerals Processing and Bioengineering, Central South University, Changsha 410083, China
2
Faculty of Land Resource Engineering, Kunming University of Science and Technology, Kunming 650093, China
3
National & Regional Engineering Research Center for Green Comprehensive Utilization of Gangue Resources from Metal Mine, Kunming 650093, China
*
Author to whom correspondence should be addressed.
Minerals 2025, 15(4), 384; https://doi.org/10.3390/min15040384
Submission received: 9 March 2025 / Revised: 28 March 2025 / Accepted: 1 April 2025 / Published: 5 April 2025
(This article belongs to the Special Issue Harnessing Surface Chemistry for Enhanced Mineral Recovery)

Abstract

:
It is known that sulfide minerals are affected by the pulp oxygen content during flotation, while few studies have been conducted on the specific oxidation and kinetic processes. This study adopted DO, ICP, XPS and SEM-EDS measurements to reveal the oxidation–corrosion characteristics of chalcopyrite systematically because they dominate the surface properties and flotation behavior of minerals. The results confirm the hierarchical oxidation–asymmetric corrosion characteristics of chalcopyrite firstly. More precisely, the ore-forming elements Fe and Cu are prone to corrosion under acidic conditions while S is to corrosion under alkaline conditions, and pulp aeration could further enlarge their difference of corrosion rate. Owing to their asymmetric corrosion characteristics, a “metal-deficient and S-rich” layer and a “metal-rich and S-deficient” layer are generated under acidic and alkaline conditions, correspondingly. Surface etching further revealed that the hierarchical oxidation process of Cu, Fe and S sites are Cu(I)-S → Cu(II)-O, Fe(III)-S → Fe(III)-O → sulfate and S2−→ S22−→ Sn2−→ SO42−. Moreover, the oxidation–corrosion of chalcopyrite was non-uniform, and the micro-zone of oxidation and corrosion were greatly overlapping. Finally, the hierarchical oxidation and asymmetric corrosion model was established to further promote the understanding of the oxidation–corrosion process and its impact on surface properties.

1. Introduction

Flotation is the most important method for enriching and extracting chalcopyrite from sulfide ore, while the selective separation of chalcopyrite from other minerals is technically challenging. A flotation depressant is a commonly used reagent which can selectively adsorb on the minerals’ surface to increase the hydrophilicity of the mineral [1]. Levie [2] used guar gum (GG) as a selective chalcopyrite flocculant and polyethylene oxide (PEO) as a silica depressant to enhance the recovery of chalcopyrite. Another study investigated that the oxidative properties and flotation behavior are associated with the separation of chalcopyrite and pyrrhotite using sodium periodate (NaIO4) [3]. However, traditional depressants are associated with environmental pollution and high operational costs [4].
As we all known, sulfide minerals are affected by the pulp oxygen content during flotation [5]. Oxygen is highly involved in the flotation process by changing the electrical properties of the mineral surface [6,7]. Based on the significant difference in surface oxidation rates of different sulfide minerals, the sulfide mixtures were selectively oxidized to an oxide/sulfide system, thereby achieving selective separation of sulfide minerals without flotation depressants [8]. Oxygen is a green oxidant that is abundant in the air, and pulp aeration is able to apply the oxygen in the air to mineral flotation [9]. Forson et al. adopted pulp aeration to oxidize and inhibit arsenopyrite flotation successfully [10]; Qin et al. facilitated the flotation of refractory marmatite through pulp aeration [11], which demonstrates the feasibility of pulp aeration. The floatability of molybdenite is significantly reduced after the oxidation–corrosion treatment by hydroxyl radicals (•OH), whereas the floatability of scheelite is significantly improved after the oxidation–corrosion treatment in a sodium carbonate system [12,13]. The inevitable oxidation and release is attributed to the hydroxyl radical (OH) [14]. Oxidation is usually accompanied by corrosion, which can have a significant impact on the flotation behavior of minerals [15]. Specifically, the selective oxidation–corrosion of active sites of mineral lattice affects their flotation behavior [16]. Wang et al. [17] proposed that the oxidation–corrosion of the Fe site can promote the flotation of pyrite, whereas the oxidation–corrosion of the S site depresses its flotation. The oxidation–corrosion of sulfide minerals is a multi-component and multi-phase transition reaction, and the S and Fe sites in different oxidation–corrosion processes exhibit different hydrophobicity and solubility, which have a significant effect on the flotation behavior of minerals [18,19].
Although oxygen plays a complex role in the flotation of sulfide minerals, few studies have been made on the specific oxidation and kinetic processes; most researches have focused on the effect of oxygen on flotation performance, with more attention paid to the formation of oxidation products [20,21,22]. However, in addition to oxidation products, we have found that oxidation kinetics, flotation electrochemistry, etc., all have a great influence on sulfide flotation [23,24]. Different degrees of oxidation will cause different changes in floatability. Hayes et al. suggested that the mild oxidation–corrosion of galena has little effect on surface properties and floatability, while moderate oxidation–corrosion can generate sulfur elements and promote flotation, whereas strong oxidation–corrosion can generate hydrophilic oxidation products and inhibit flotation [25,26]. The difference in oxidation–corrosion rates among different minerals affects their sorting indices. Owusu et al. put forward that the oxidation–corrosion rate of pyrite is greater than that of chalcopyrite; hence, the separation efficiency of pyrite is higher [27]. The degrees of oxidation also depend on the minerals’ properties, as oxidation was stronger on arsenopyrite than on chalcopyrite, and the products not only reduced the hydrophobicity of the arsenopyrite surface but also caused adsorption [28]. The results of the electrochemical gold oxidation test show that the presence of galena could increase the gold oxidation kinetics due to a reduction in dissolved oxygen (DO) in pulp [29]. The oxidation kinetics model was built with the surface chemical reaction as the rate controlling step. And it can investigate the kinetics of pyrite oxidation by hydrogen peroxide in hydrochloric acid solutions [30].
There are still few studies on the oxidation–corrosion characteristics of sulfide minerals. Therefore, this study aims to construct an oxidation–corrosion model by integrating electrochemistry and kinetics. In the present study, the influence of pulp aeration on the surface properties of chalcopyrite was systematically studied through the analysis of oxygen consumption rate, corrosion kinetics of mineralization sites, surface component changes, and micro area oxidation–corrosion characteristics, and further revealed the hierarchical oxidation-asymmetric corrosion mechanism of chalcopyrite.

2. Materials and Methods

2.1. Materials

High-purity chalcopyrite was purchased from Yunnan Province, China. Some bulk samples were hand picked for ICP, XPS and SEM-EDS analysis, whereas the rest were crushed using a laboratory jaw crusher and porcelain ball mill. Mineral particles of −74 + 38 µm fraction were separated through standard sieves and used in DO tests. Finer powders of −10 µm were utilized for XRD and XPS measurements. To prevent oxidation, all prepared samples were vacuum-packed in bags, and they were stored in the low-temperature (−2 °C) environment of the refrigerator. The XRD spectra of the chalcopyrite sample are shown in Figure 1. The results of chemical element analysis show that the Cu, Fe and S contents of chalcopyrite were 32.95%, 29.96% and 34.15%, respectively, and other impurities are mainly quartz. The theoretical Cu content of chalcopyrite is 34.56%, So its purity can be calculated to be 95.34%.

2.2. Dissolved Oxygen (DO) Experiments

DO experiments were conducted to explore the oxygen-consumption characteristics of the oxidation behavior of chalcopyrite. A 50.00 mL buffer solution (pH 9.18) was injected into a conical flask, and then 0.50 g of −74 + 38 µm fraction chalcopyrite particles were weighed and added. Finally, a DO meter (JPB-607A) manufactured by Shanghai INESA Scientific Instrument Co., Ltd. (Shanghai, China) was utilized to monitor the changed DO caused by chalcopyrite oxidation. This experiment was performed in a sealed device to prevent external oxygen from entering the test system. Each test was measured three times and the average was reported as the final value.

2.3. Inductively Coupled Plasma Spectroscopy (ICP) Detection

ICP–optical emission spectrometry (OES; Spectro blue, Kleve, Germany) was utilized to measure the contents of elements in the pulp, which was further used to calculate the specific corrosion rate of mineral-forming elements and analyze the effect of pulp pH and pulp aeration on surface oxidation and corrosion. The rectangular chalcopyrite flakes were polished and washed, and their side lengths and roughness were measured. After placing it in a 50.00 mL pH buffer solution to oxidize for 30 min, pulp aeration was conducted if necessary; three measurements were averaged to ensure data reliability. Finally, the contents of dissolved elements in the pulp were measured, and the specific corrosion rate of individual elements calculated according to Equation (1):
v = C × V A × t
where ν is the specific corrosion rate of a certain element (10−6 mol·m−2s−1), C is the concentration of certain element in the pulp (mol/L), V is the volume of pulp (L) and A and t are to the surface area of chalcopyrite sample (m2) and the corrosion time (s), respectively.

2.4. X-Ray Photoelectron Spectroscopy (XPS) Measurements

To investigate the effect of oxidation–corrosion on the surface chemical circumstance of chalcopyrite, a K-Alpha 1063 spectrometer (Thermos Scientific Co., Waltham, MA, USA) was utilized to obtain XPS data, the results were fitted and analyzed by Thermo Avantage 5.96. About 0.5 g of mineral particles was placed in a 40 mL flotation tank and then treated under different pH and pulp aeration conditions; then, the treated mineral powders were dehydrated immediately in a vacuum freeze-drying device to prevent secondary oxidation. The measurement parameters of the monochromatic Al Ka X-ray source were 12 kV and 6 mA, respectively.
For surface etching, the bulk chalcopyrite was cut and polished to obtain regular blocks of 10 mm × 10 mm × 5 mm; then, it was treated under different oxidation conditions and dried with nitrogen. Once the bulk sample was placed in a vacuum chamber, the etching mode was used to obtain depth surface information. A single atom was used as an ion source to bombard and etch the sample surface, and each layer was analyzed to acquire depth profile information for different oxidation stages. The etching time was 5 s per session, and the etching depth was about 1 nm. The equipment used was an ESCALAB250Xi manufactured by Thermo Fisher Scientific (Waltham, MA, USA).

2.5. Scanning Electron Microscopy (SEM) Experiments

Chalcopyrite flakes were first polished and washed to obtain a smooth, uniform and clean surface. After placing them in a sealed conical flask, they were oxidized in buffer solution for 30 min. A SEM system (FEI Quanta FEG 650, Hillsboro, OR, USA) coupled with an energy-dispersive X-ray spectroscopy (EDS) instrument (Jeol JSM-5910LV, Musashino, Japan) was used to reveal the evolution characteristics of morphology and element distribution of micro area of chalcopyrite during oxidation–corrosion.

3. Results and Discussion

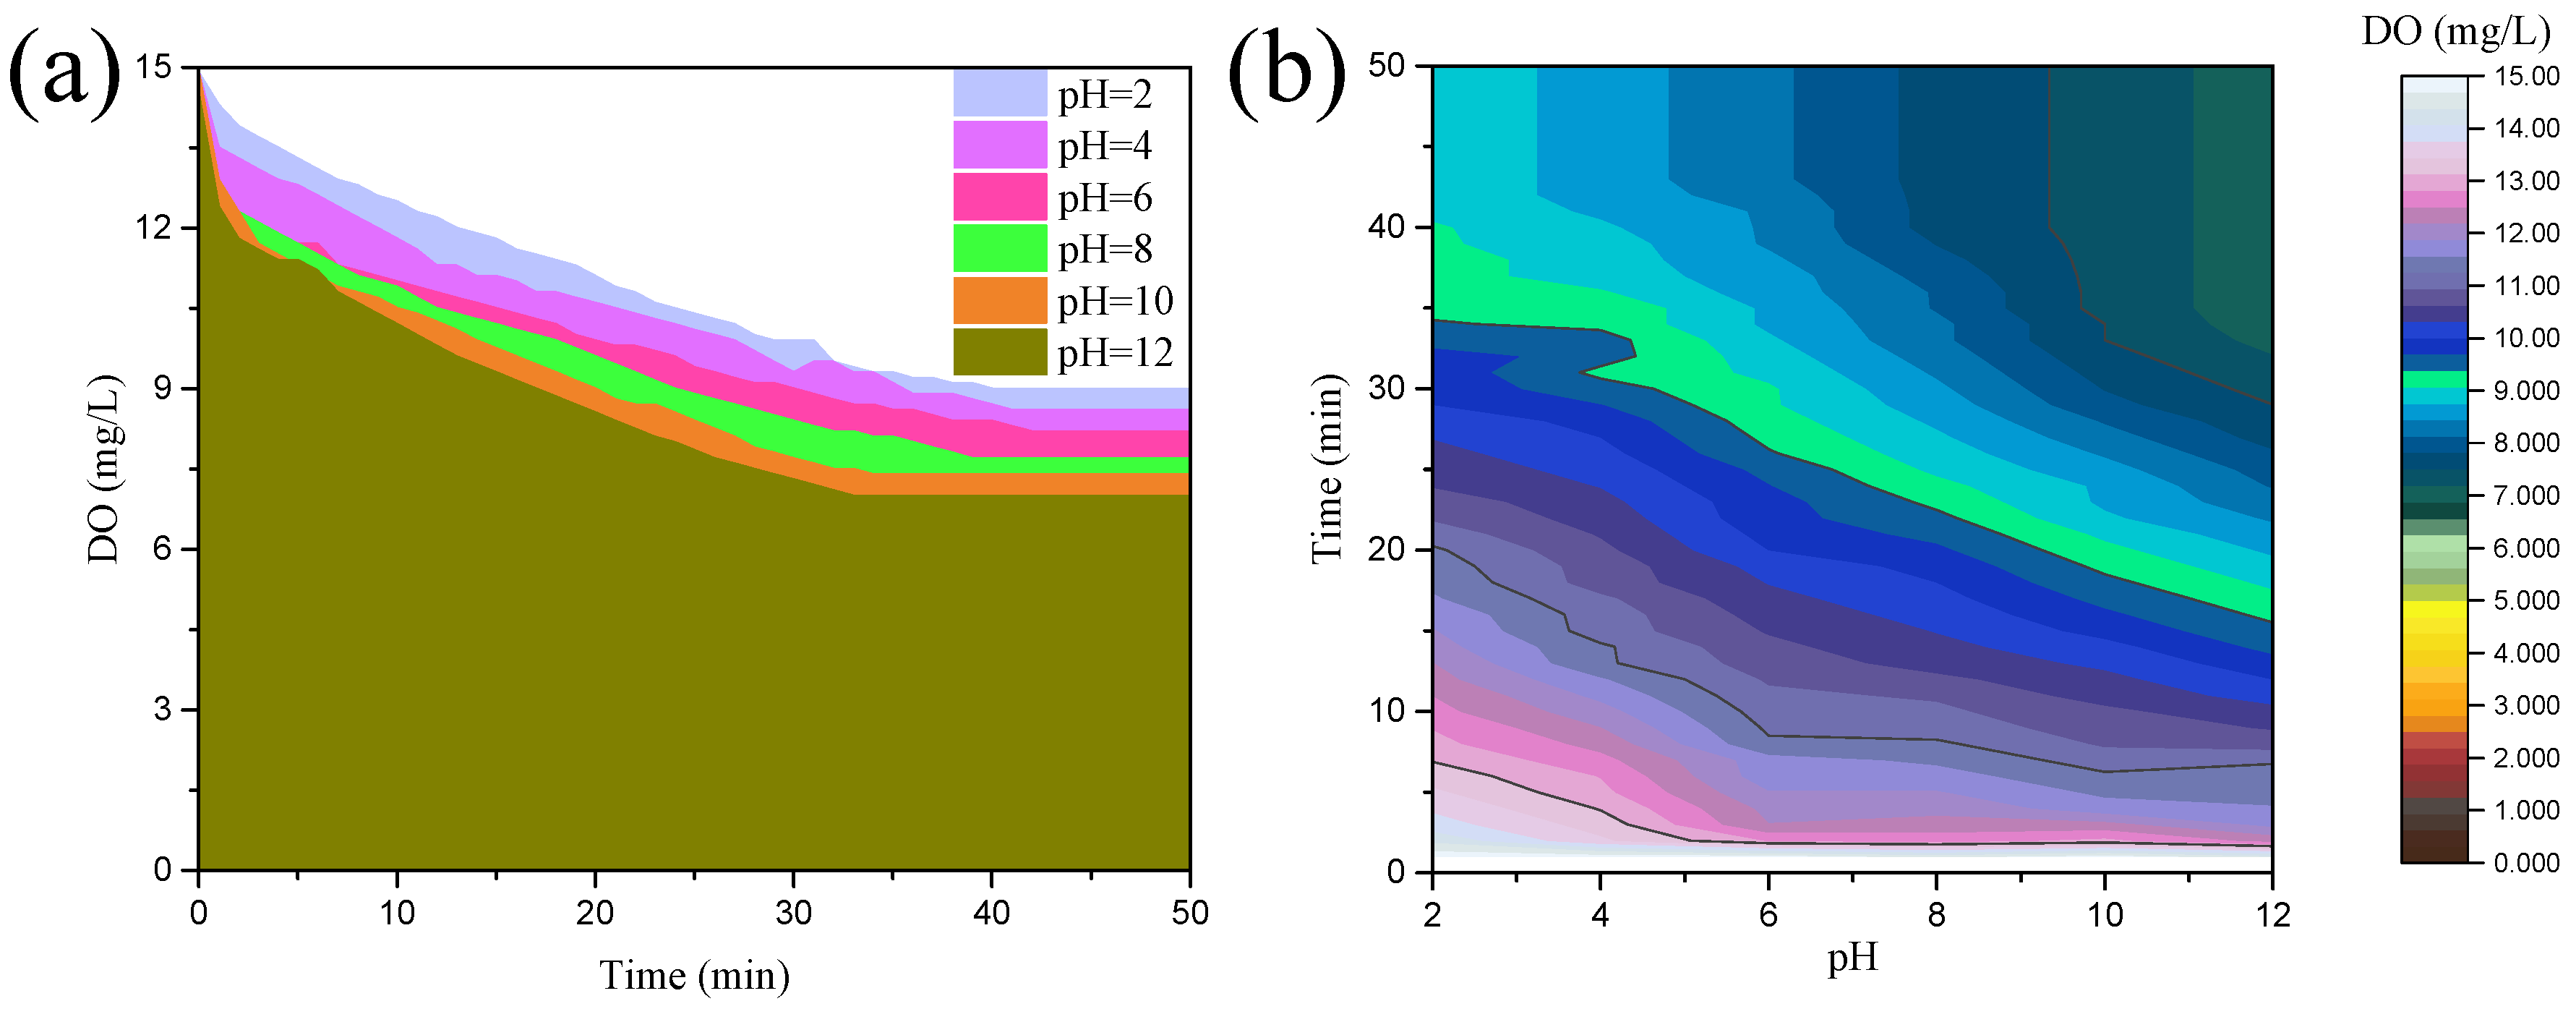
3.1. Characteristics of Oxygen Consumption of Oxidation–Corrosion

Figure 2 depicts the results of DO measurements, which illustrate the oxygen consumption behavior of chalcopyrite. Originally, the DO content in the pulp was 15.00 mg/L; then, it decreased as the oxidation–corrosion of chalcopyrite progressed, and it remained unchanged until the endpoint of the oxidation–corrosion reaction was reached. The final DO content decreased gradually with increased pulp pH; it was 9.03 mg/L at pH 2.0 and dropped to 7.74 and 7.03 mg/L at pH 8.0 and 12.0, respectively. The oxidation–corrosion reaction reached equilibrium earlier under higher pH conditions, and the time to reach equilibrium was 40.0 min at pH ≤ 8.0, whereas it was shortened to 30.0 min at pH 12.0. As more DO was consumed, the speed of its consumption increased, meaning the oxidation–corrosion was more intense. Hence, chalcopyrite was more prone to oxidation–corrosion under strong alkaline conditions.

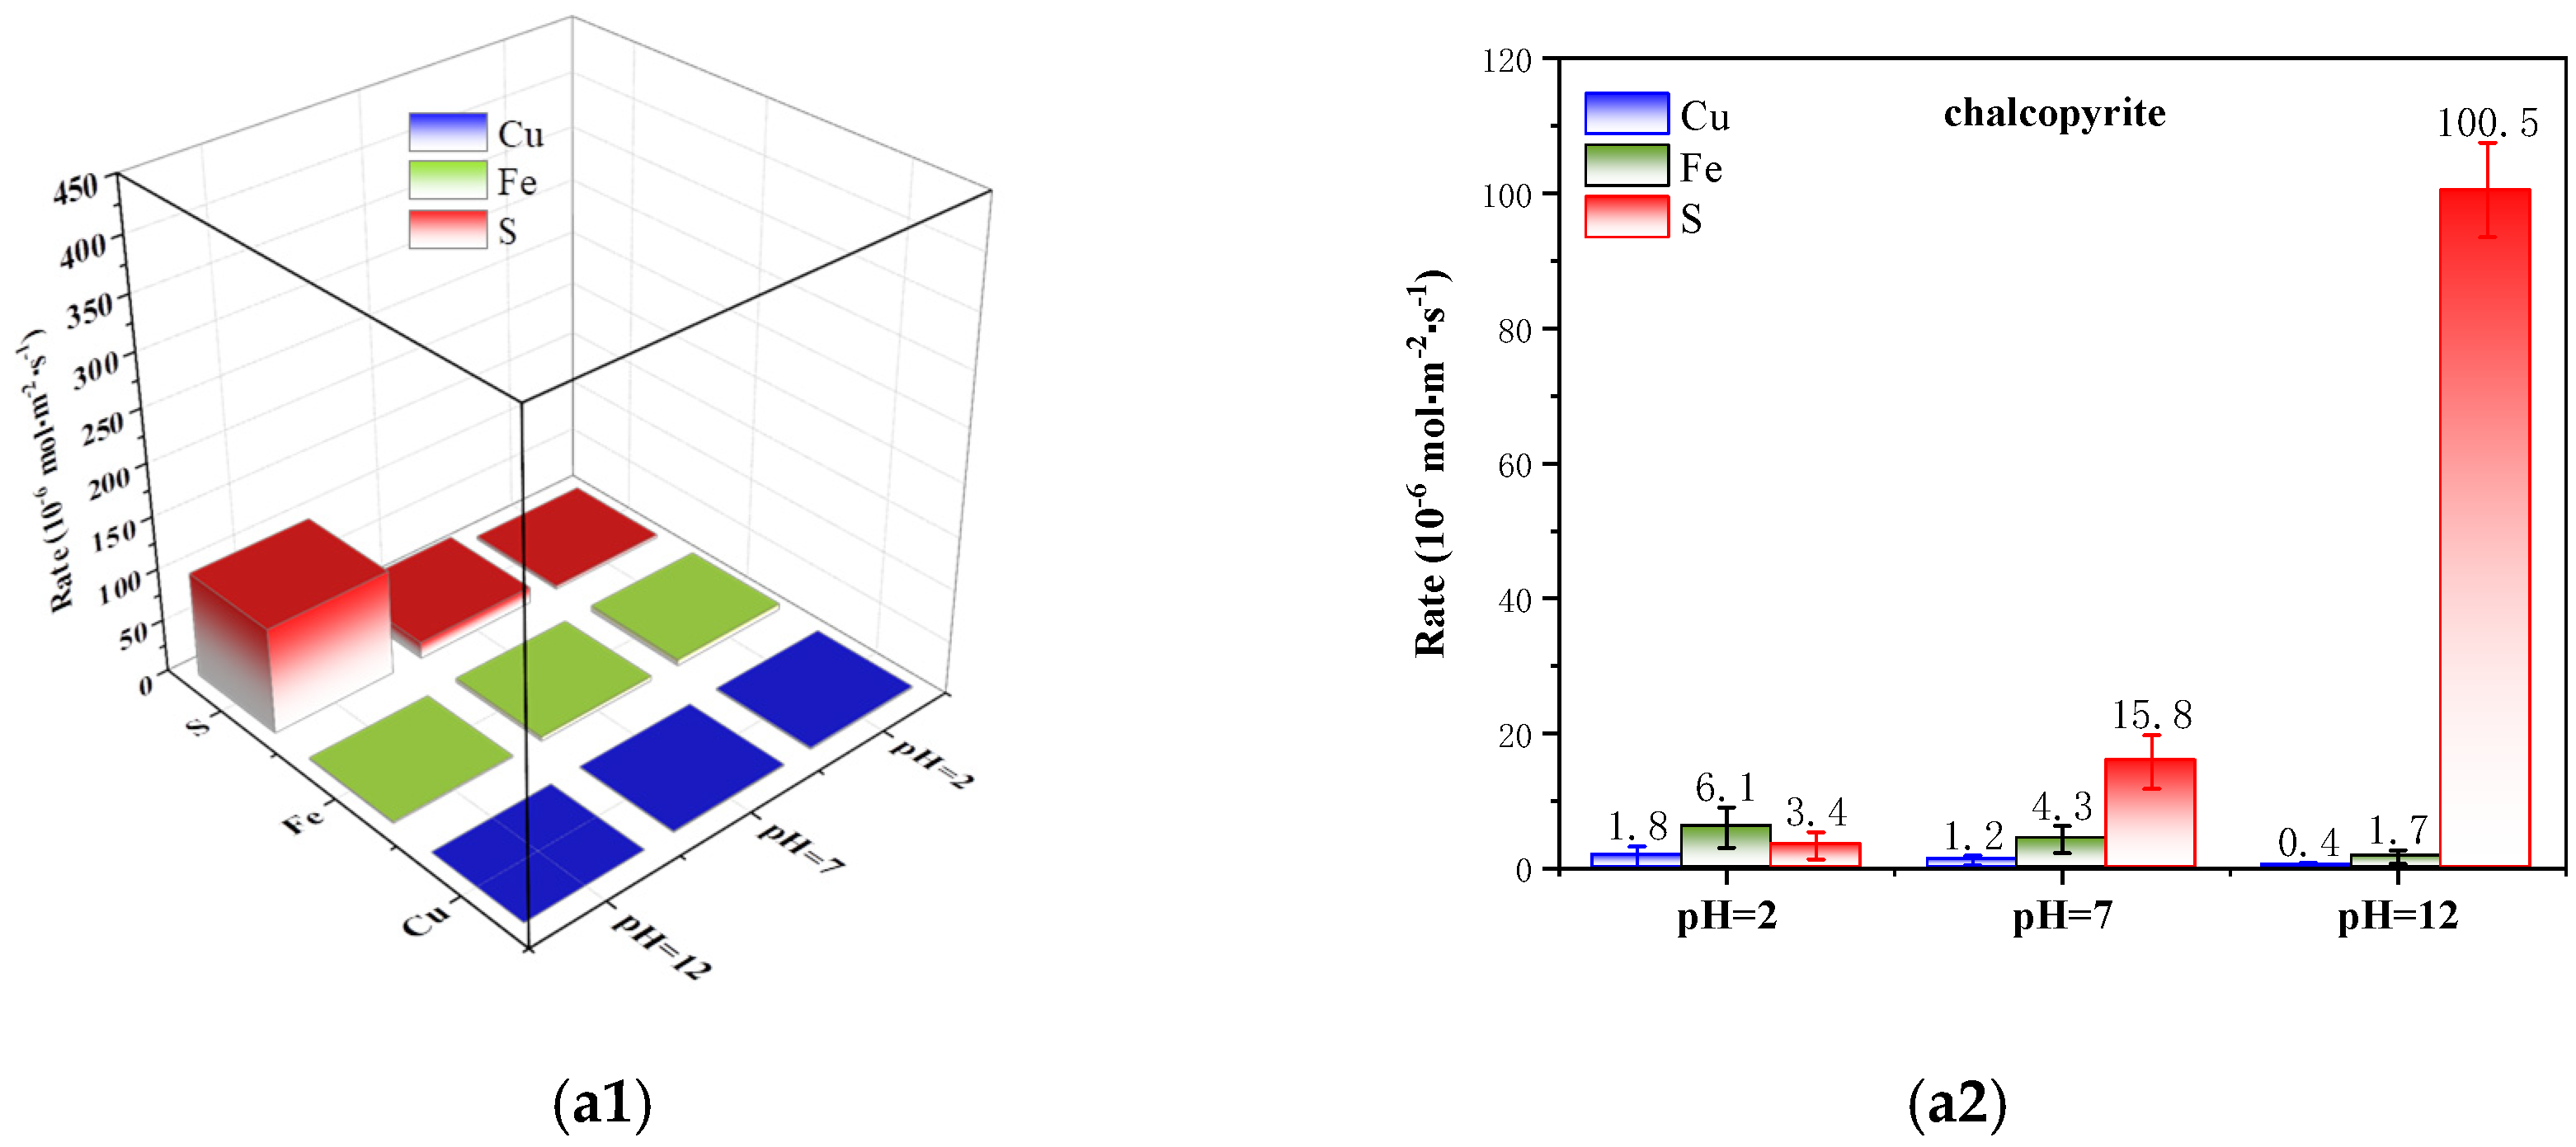
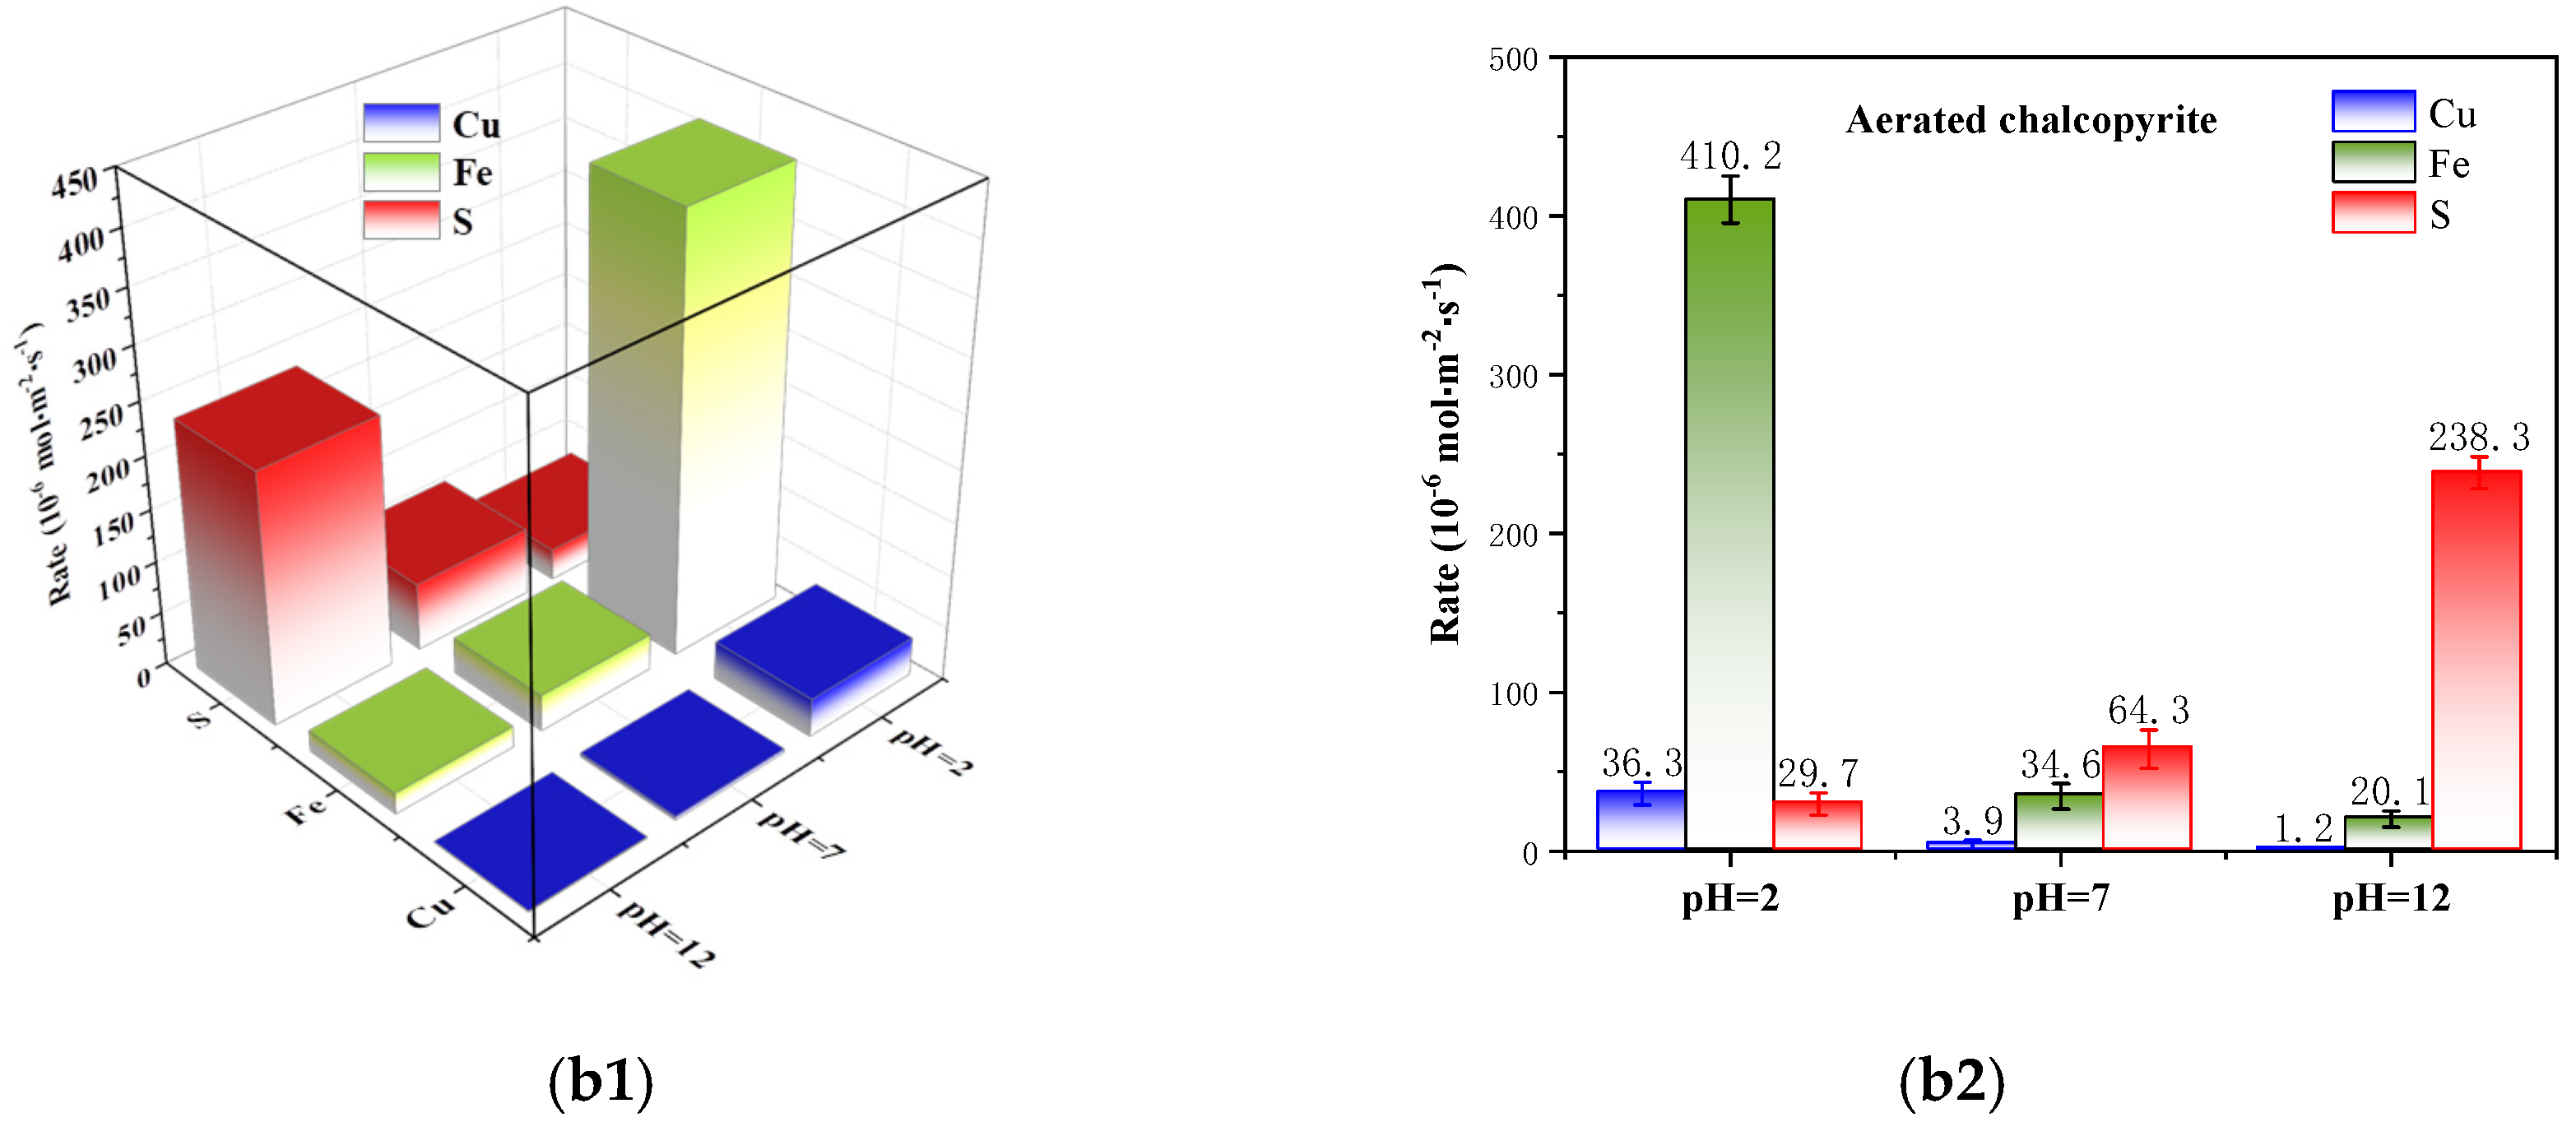
3.2. Kinetics Analysis of Corrosion

Figure 3 shows the specific corrosion rates of Cu, Fe and S of chalcopyrite under different pH and pulp-aeration conditions. Without the treatment of pulp aeration, the corrosion of Cu, Fe and S was slow, and it showed different variation trends under different pH conditions, as depicted in Figure 3(a1,a2). For example, the specific corrosion rates of Cu, Fe and S were 1.8 × 10⁻⁶, 6.1 × 10⁻⁶ and 3.4 × 10⁻⁶ mol·m−2s−1 at pH 2.0, respectively. Among them, the specific corrosion rate of Fe was the fastest, followed by S, and Cu was the hardest to dissolve. With increased pulp pH, the specific corrosion rate of metal elements Cu and Fe decreased, whereas that of the non-metal element S increased gradually. Up to pH 12.0, the specific corrosion rates of Cu and Fe decreased to 0.4 × 10⁻⁶ and 1.7 × 10⁻⁶ mol·m−2s−1, respectively, whereas that of S increased to 100.5 × 10⁻⁶ mol·m−2s−1, respectively. Therefore, the corrosion rates of the mineral-forming elements Cu, Fe and S of chalcopyrite differed, exhibiting asymmetric corrosion characteristics.
Figure 3(b1,b2) shows the specific corrosion rates of Cu, Fe and S under the condition of pulp aeration. They had similar asymmetric corrosion characteristics compared with the non-aeration system. In detail, Cu and Fe dissolved more easily under acidic conditions than alkaline conditions, but S was more prone to corrosion under alkaline conditions. For example, the specific corrosion rates of Cu and Fe were 36.3 × 10⁻⁶ mol·m−2s−1 and 410.2 × 10⁻⁶ mol·m−2s−1 at pH 2.0, respectively, and they peaked within the tested pH conditions. Conversely, the peak value of the specific corrosion rate of S was 238.3 × 10⁻⁶ mol·m−2s−1, but it occurred at pH 12.0. Additionally, pulp aeration was favorable to promote the corrosion of Cu, Fe and S and further enlarge their asymmetric corrosion characteristics. At pH 2.0, the specific corrosion rate of Cu and Fe increased from 1.8 × 10⁻⁶ and 6.1 × 10⁻⁶ mol·m−2s−1 to 36.3 × 10⁻⁶ and 410.2 × 10⁻⁶ mol·m−2s−1, respectively, after pulp aeration. However, that of S only increased from 3.4 × 10⁻⁶ mol·m−2s−1 to 29.7 × 10⁻⁶ mol·m−2s−1. The specific corrosion rates of Cu and Fe were increased after pulp aeration at pH 12.0, but still remained at a low rate of 1.2 and 20.1, while that of S selectively increased from 100.5 × 10⁻⁶ mol·m−2s−1 to 238.3 × 10⁻⁶ mol·m−2s−1.
Herein, the surface corrosion of chalcopyrite was significantly affected by pulp aeration, and it tended to generate a “metal-deficient and S-rich” layer under acidic conditions and a “metal-rich and S-deficient” layer under alkaline conditions owing to its asymmetric corrosion characteristics.

3.3. Effect of Oxidation Conditions on the Composition of Surface Components

The characteristics of DO consumption and asymmetric surface corrosion revealed that pulp pH and aeration conditions affected the surface oxidation–corrosion of chalcopyrite, which would further change its surface composition and flotation behavior. Accordingly, XPS measurements were conducted to uncover the surface oxidation–corrosion behavior of chalcopyrite at the atomic scale.
Table 1 shows the element content and related atomic ratios of chalcopyrite treated under different oxidation conditions. When the DO was 0.00 mg/L, the atomic contents of Cu, Fe, S and O were 17.80%, 16.60%, 29.50% and 36.10% at pH 2.0, and the ratio of Fe/S and Cu/S was 0.56 and 0.60, respectively. As pH increased to 12.0, the content of O increased to 40.70%, whereas that of S dropped to 22.50%. Owing to the selective corrosion of S, the ratio of Fe/S and Cu/S increased to 0.80 and 0.84. Therefore, chalcopyrite more easily oxidized under alkaline conditions, and strong alkaline conditions selectively facilitated the corrosion of S, thereby contributing to the formation of a “metal-rich and S deficient” layer.
The composition variation of surface element was closely affected by pulp-aeration conditions. At pH 2.0, the content of Fe decreased from 16.60% to 13.95% with increased DO from 0.00 to 22.50 mg/L. Meanwhile, that of S and Cu increased slightly, causing the ratio of Fe/S to drop from 0.56 to 0.45, whereas that of Cu/S increased from 0.60 to 0.67, causing the surface to become deficient in Fe but rich in Cu and S. These findings indicated that pulp aeration can selectively promote the corrosion of Fe under acidic conditions. With increased pH to 12.0, the strong aeration condition caused the content of S to drop from 22.50% to 12.30%, whereas that of Fe and O increased significantly. Moreover, the ratio of Fe/S and Cu/S increased from 0.80 and 0.84 to 1.94 and 1.17, respectively. Therefore, pulp serration was a powerful method of strengthening the surface oxidation and asymmetric corrosion of chalcopyrite. It selectively promoted the corrosion of Fe under acidic conditions and promoted the corrosion of S under alkaline conditions, making the surface of chalcopyrite Fe deficient and S deficient, respectively.

3.3.1. High-Resolution Spectrum Analysis of Cu 2p

The high-resolution narrow spectrum of Cu 2p was recorded under different oxidation conditions, and the oxidation characteristics of Cu sites are plotted in Figure 4, while the relative contents are listed in Table 2. The signal of Cu 2p was divided into two peaks, and the major peak located at 930.9 eV was attributed to Cu(I)-S, which originated from the chalcopyrite crystal lattice [31,32,33]. The minor peak which appeared at 932.5 eV was represented as Cu(II)-O, which resulted from the oxidation of Cu sites [34,35,36]. More Cu(II)-O corresponded with the deeper oxidation of Cu sites. Under the non-pulp-aeration system, the content of Cu(I)-S was 83.33% at pH 2.0, which dropped to 81.30% and 75.76% at pH 7.0 and 12.0, whereas that of Cu(II)-O increased from 16.67% to 24.24%. Thus, the pH affected the oxidation of surface Cu sites, and high alkaline conditions favored the generation of Cu(II)-O. In contrast to pulp pH, the impact of pulp aeration on the oxidation of Cu sites was small. For example, at pH 12.0, the content of Cu(II)-O was 24.24%, 24.78% and 23.66% when the aeration flow was 0.00, 20.00 and 100.00 mL/min, respectively. These almost unchanged Cu compositions demonstrated that the Cu sites were stable enough under the pulp-aeration system. Overall, given that the Cu sites on chalcopyrite had sufficient stability, the oxidation-aiding effect by pulp pH and aeration were weak, and Cu(I)-S was the dominant component of Cu sites.

3.3.2. High-Resolution Spectrum Analysis of Fe 2p

The Fe 2p signal of chalcopyrite under different oxidation conditions is recorded in Figure 5, and the relative content of Fe compositions is listed in Table 3. According to the literature, the Fe 2p spectrum was fitted with Fe(III)-S, Fe(III)-O and sulfate at 707.2, 710.3 and 712.2 eV, respectively [37,38,39,40]. Among them, Fe(III)-S represented the crystal lattice of chalcopyrite, whereas Fe(III)-O and sulfate were the products of surface oxidation. Thus, the contents of Fe(III)-O and sulfate were positively correlated with the oxidation of Fe sites. From the perspective of pulp pH, the content of native Fe(III)-S decreased with increased pH, whereas that of Fe(III)-O and sulfate increased gradually. In particular, the content of Fe(III)-S decreased from 20.21% to 13.87% as pH increased from 2.0 to 12.0, whereas the content of Fe(III)-O increased from 53.19% to 55.80%, and that of sulfate increased from 26.60% to 30.32%. Simultaneously, pulp aeration can strengthen the oxidation of Fe sites. With increased DO from 0.00 mg/L to 22.50 mg/L, the content of Fe(III)-S dropped from 21.76% to 14.66%, whereas that of sulfate increased from 19.41% to 32.98%. Compared with Cu sites, the native Fe(III)-S accounted for only around 20%, and the oxidation products of Fe(III)-O and sulfate dominated the surface after oxidation. This finding indicated that Fe sites were more active and more easily oxidized than Cu sites.

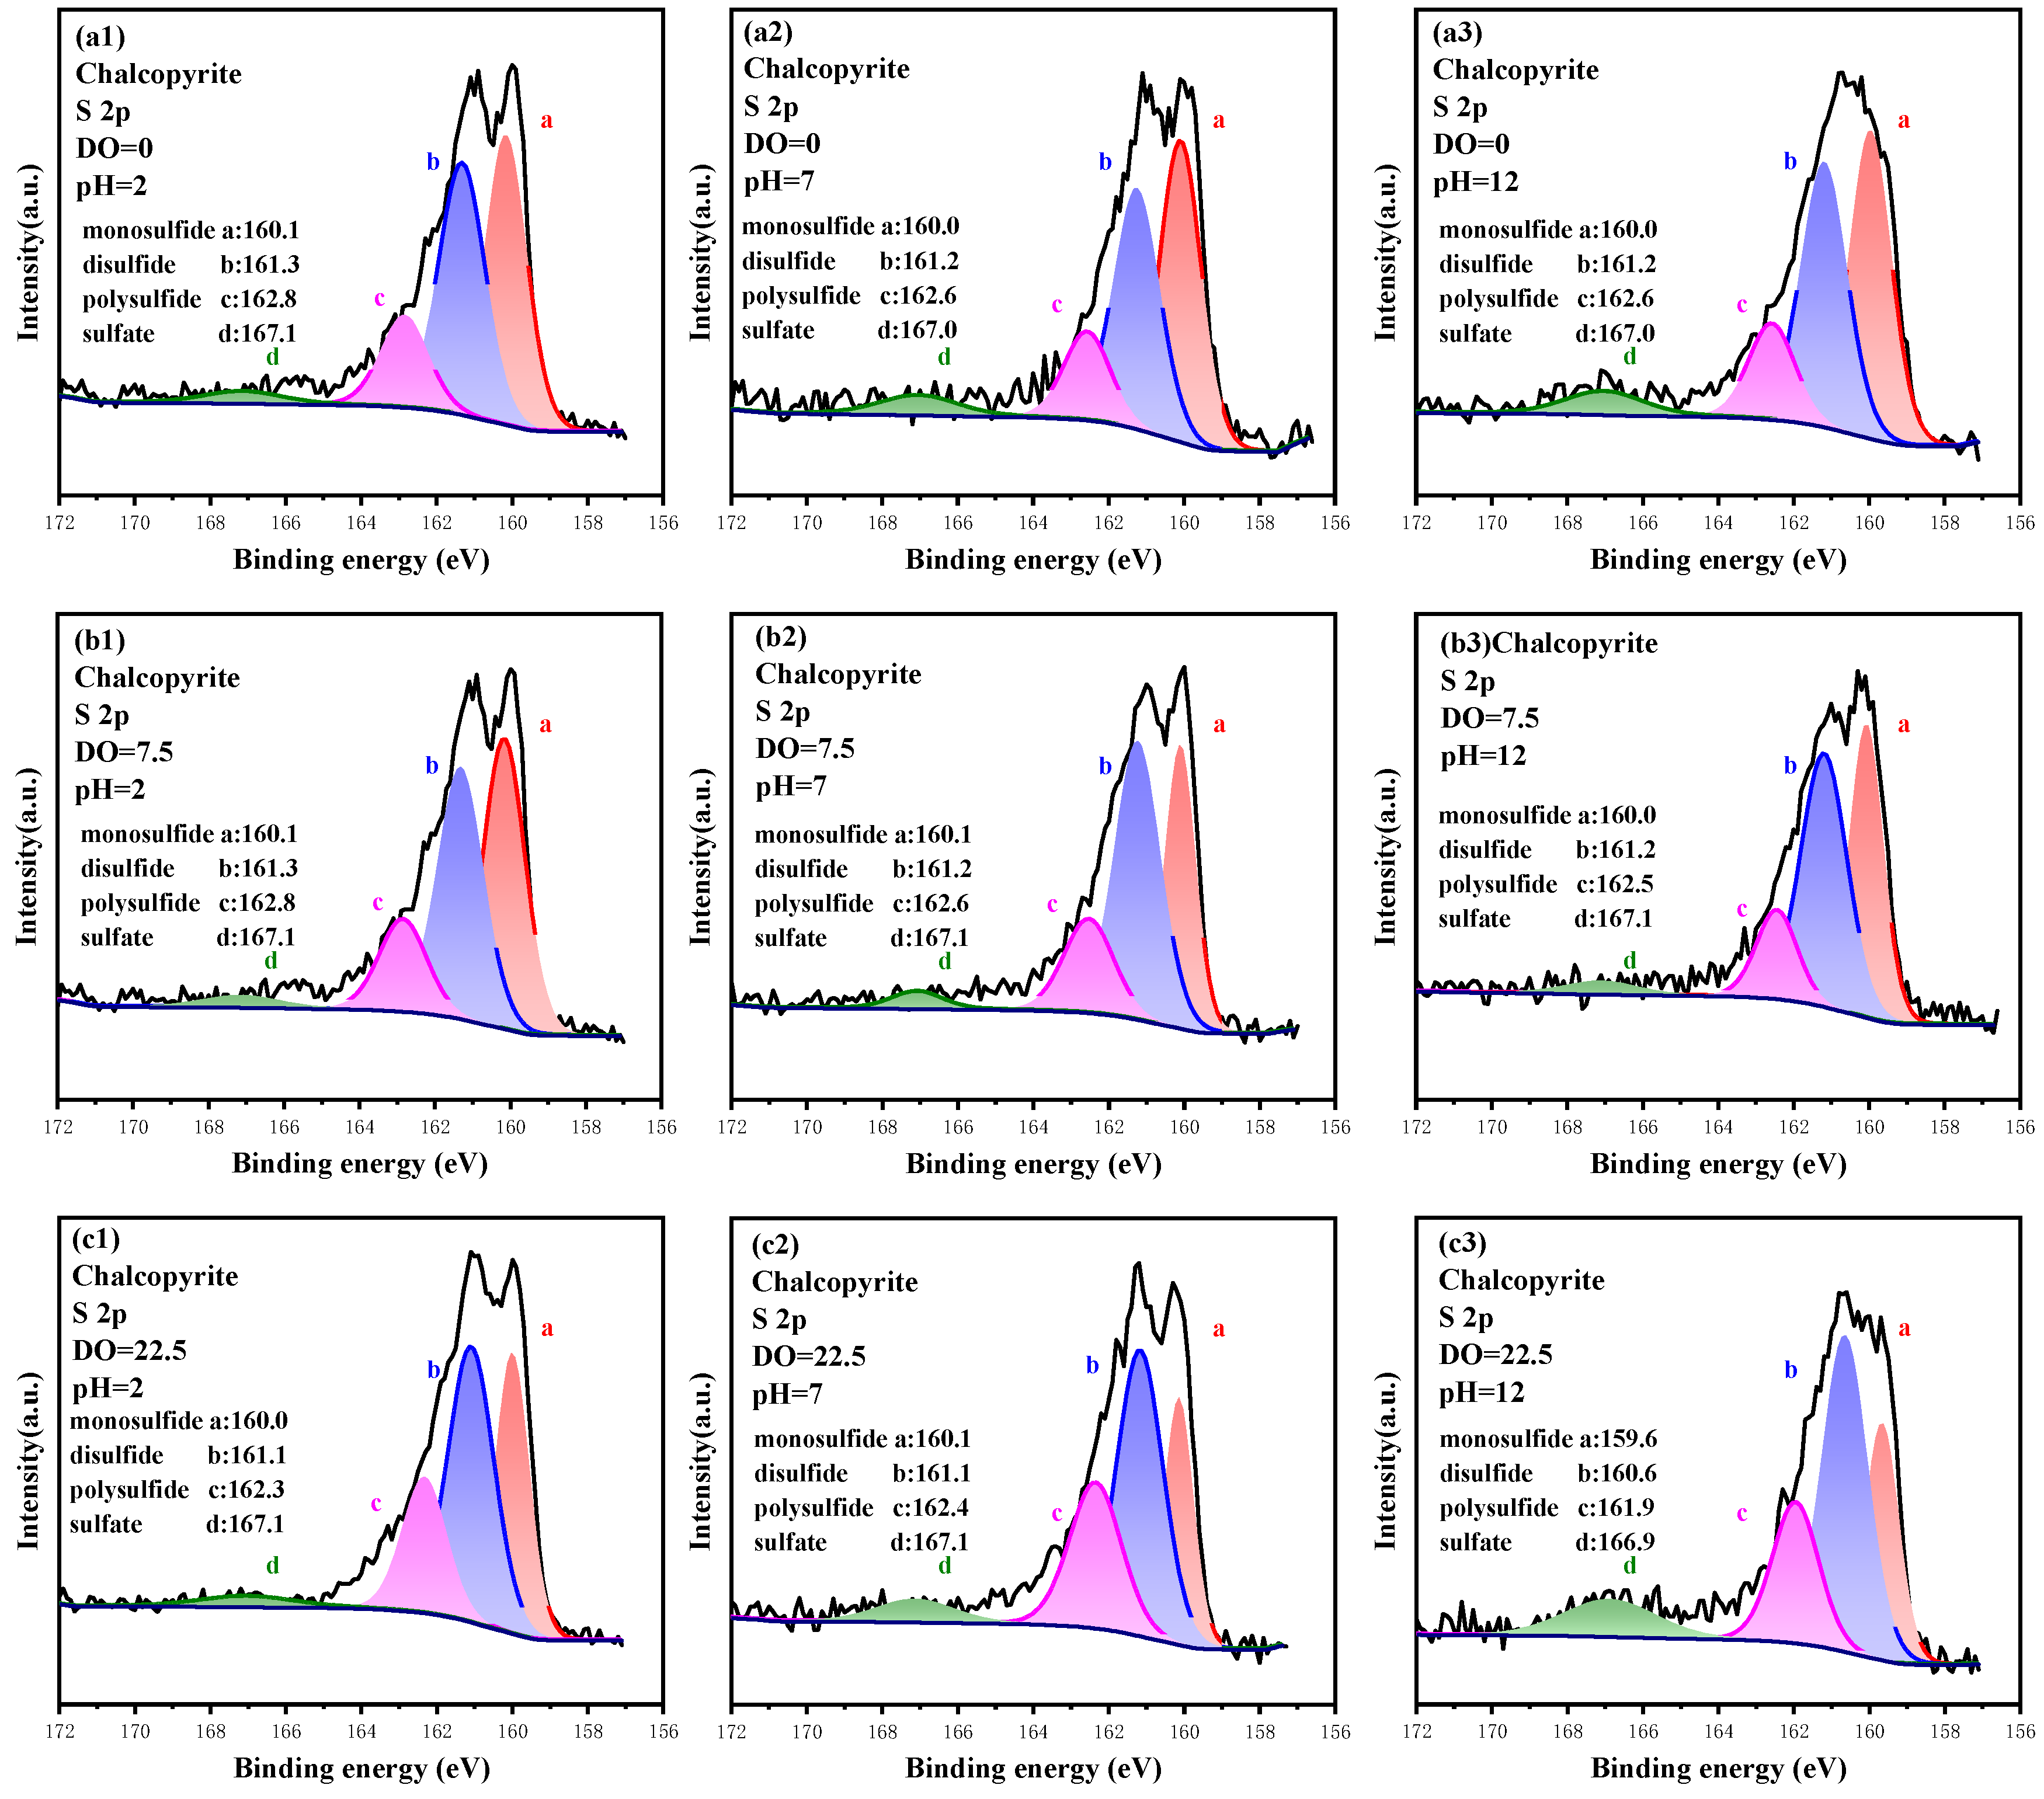
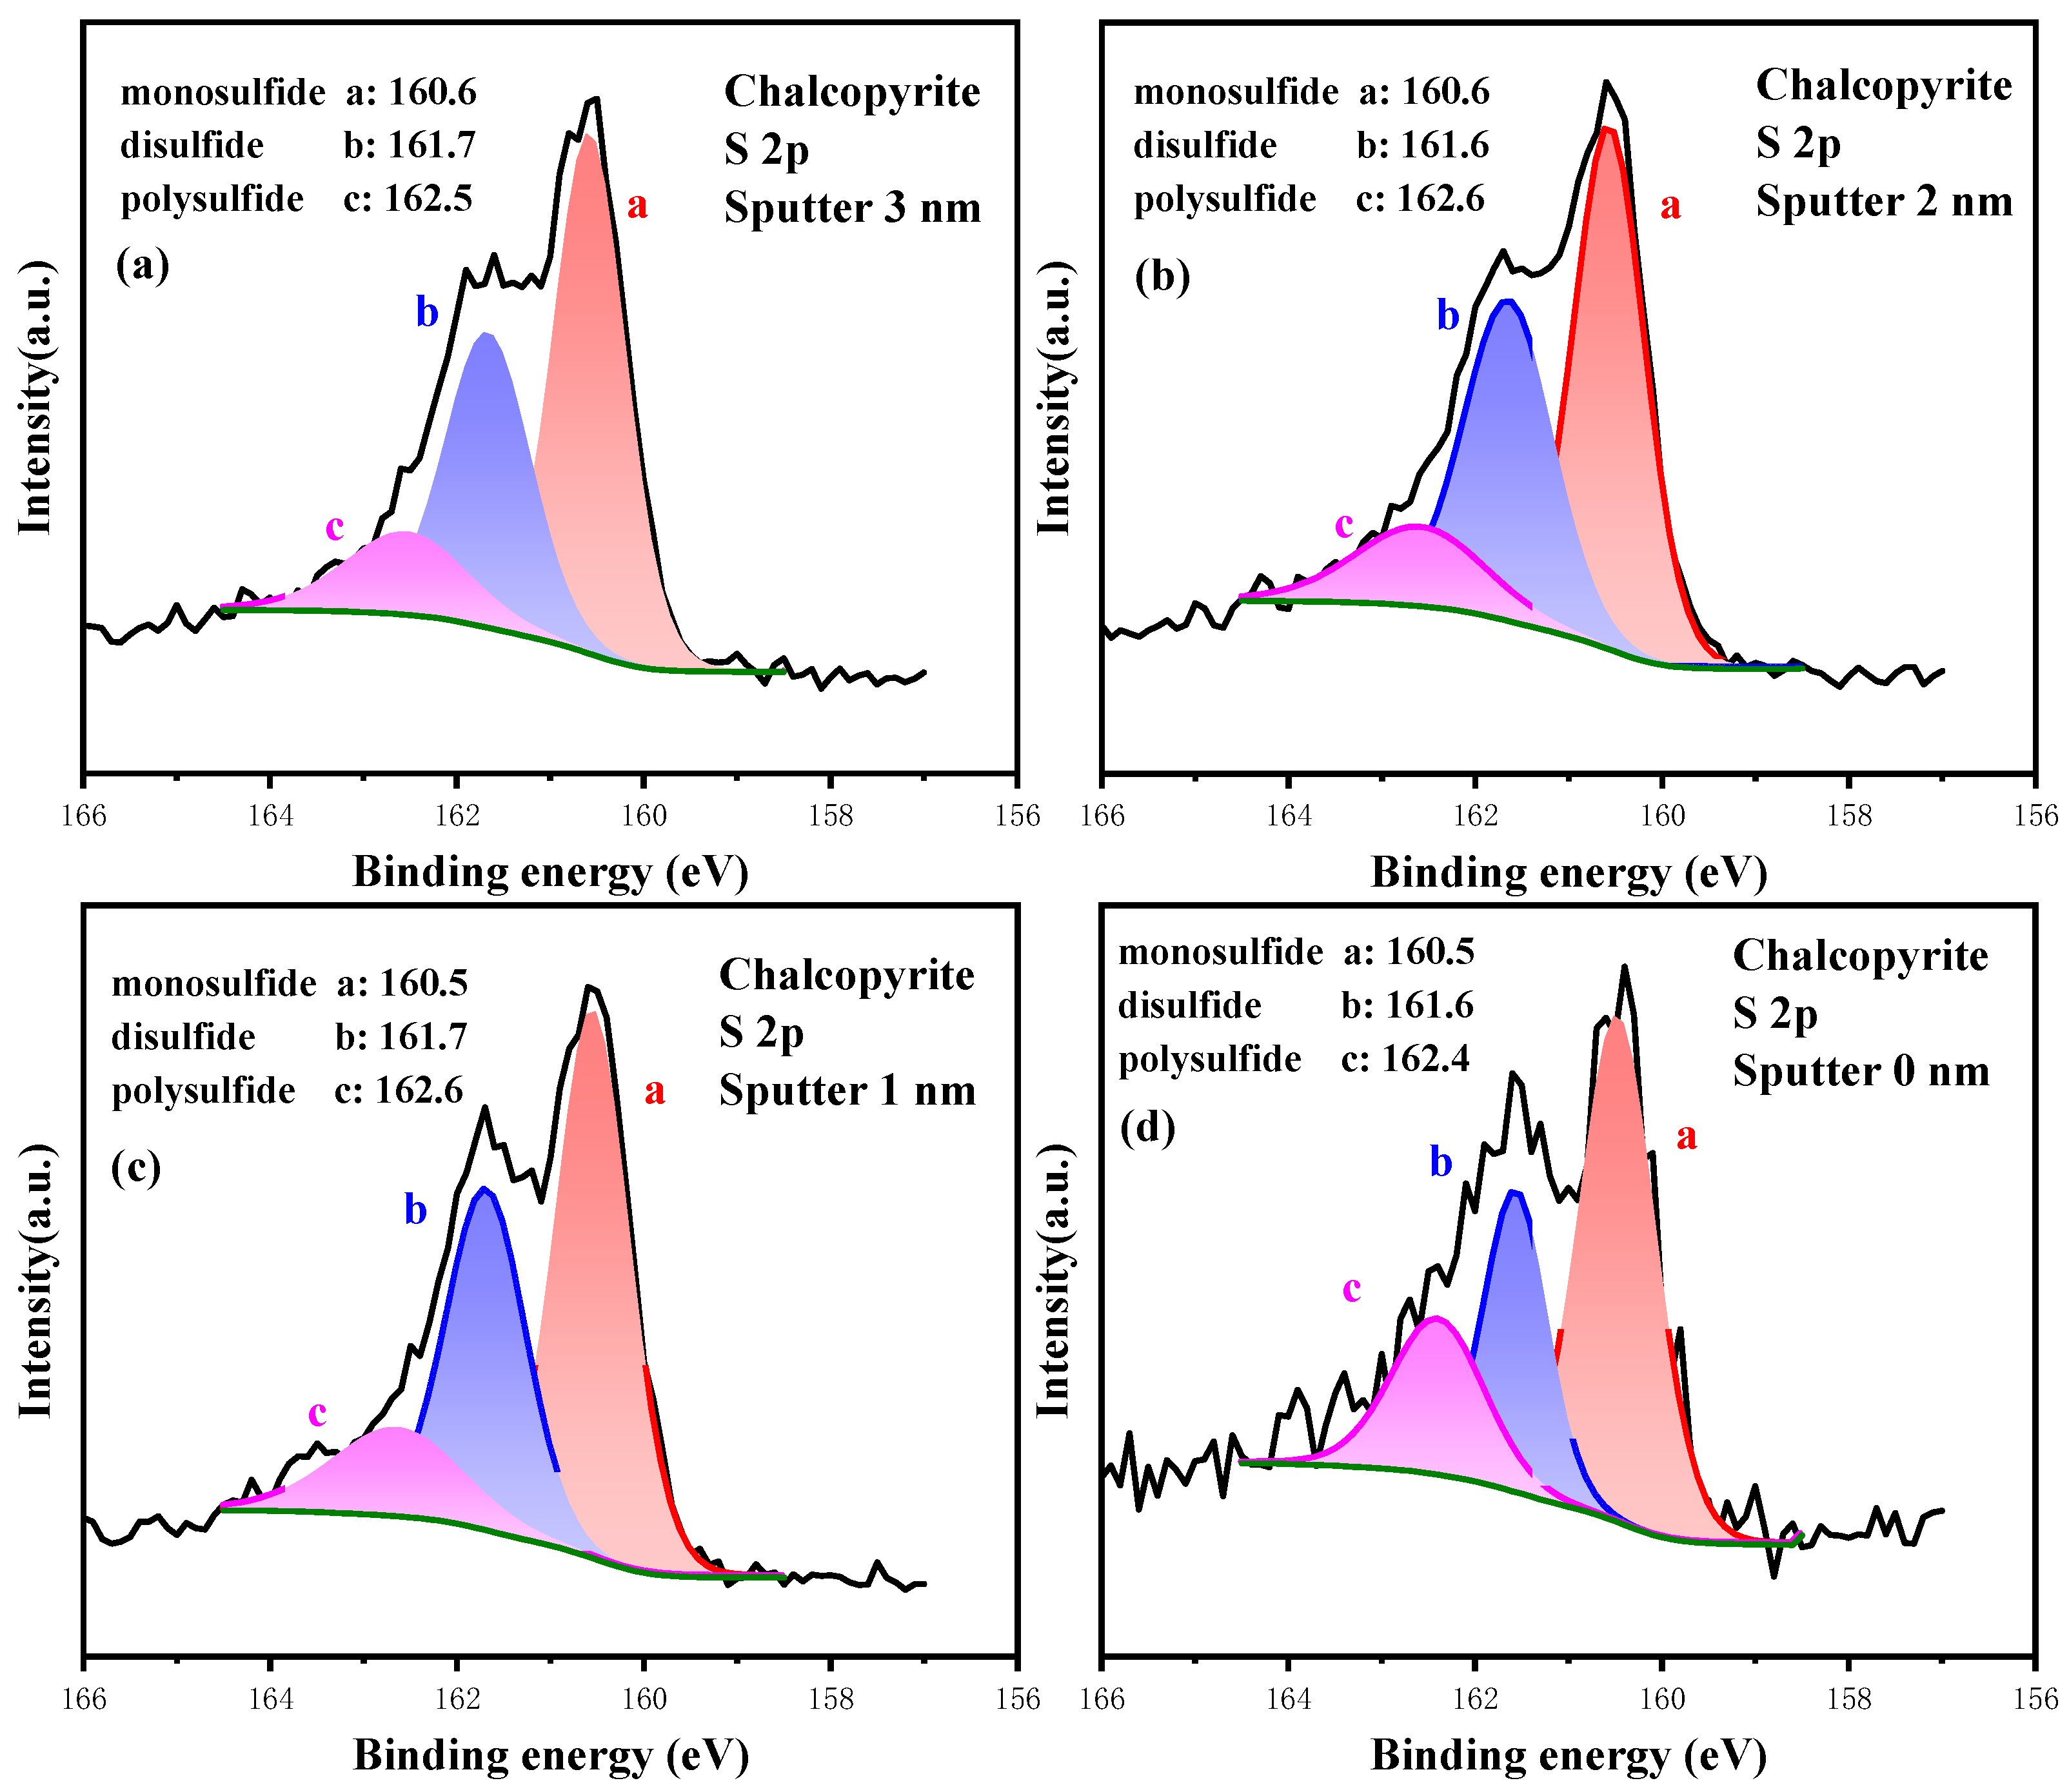
3.3.3. High-Resolution Spectrum Analysis of S 2p

The S 2p spectrum was analyzed to reveal the oxidation characteristics and compositions of S sites under different pulp pH and aeration conditions. The spectrum is plotted in Figure 6, and the relative contents are listed in Table 4. The S 2p XPS spectra of chalcopyrite were divided into four chemical states, and the peak at binding energy of 160.0 eV was attributed to monosulfide (S2−), whereas the characteristic peak at 161.2 eV was ascribed to disulfide (S22−) [41,42]. The fitting peaks at 162.6 and 167.0 eV corresponded with polysulfides (Sn2−) and sulfates (SO42−), respectively [43]. Among them, S2− originated from the lattice of chalcopyrite itself, S22− and Sn2− was the product of weak oxidation, whereas SO42− was generated from strong oxidation. These species did not belong to the raw crystal lattice of chalcopyrite; they originated from the fractured S-Fe/S-Cu bond that further regenerated S-S and S-O bonds. The occurrence of high valence of polysulfides (Sn2−) and sulfates (SO42−) indicated that the surface of chalcopyrite was oxidized. When the DO was 0.00 mg/L, the content of each S 2p component was almost unchanged under various pH conditions, but they changed obviously at higher DO conditions. Under the weak pulp-aeration condition (DO = 7.50 mg/L), the total content of S2− and S22− dropped from 82.01% to 77.59% as pH increased from 2.0 to 12.0. Meanwhile, the total content of Sn2− and SO42− increased from 17.99% to 22.41% before dropping to 67.46% and increasing to 32.54% at pH 12.0 under stronger aeration conditions (DO = 22.50 mg/L). Thus, the oxidation-aiding effect of pH on S oxidation was closely related to pulp aeration, and S can be dramatically oxidized under strong alkaline conditions with the support of pulp aeration.
Likewise, the promoting effect of pulp aeration on S site oxidation was closely related to pH conditions. Under strong pulp aeration condition (DO = 22.50 mg/L), the content of S2− was 32.47% at pH 2.0, and it further dropped to 24.44% and 20.07% at pH 7.0 and 12.0, respectively. Moreover, the content of S22− increased from 43.29% to 47.39% as pH increased from 2.0 to 12.0, whereas that of Sn2− and SO42− increased from 20.78% and 3.46% to 23.85% and 8.69%, respectively. S is a multivalent element, and its oxidation reaction conforms to the principle of minimum energy; thus, 1 or 2 electrons can be gained or lost in each step of oxidation reaction. In the chalcopyrite lattice, the S2− was −2 valence, and the final oxidation product of SO42− was +6 valence. The complete oxidation of S caused it to lose eight electrons, which required multiple steps. Therefore, S2− was not completely converted into SO42−, but the contents of various oxidation products increased.

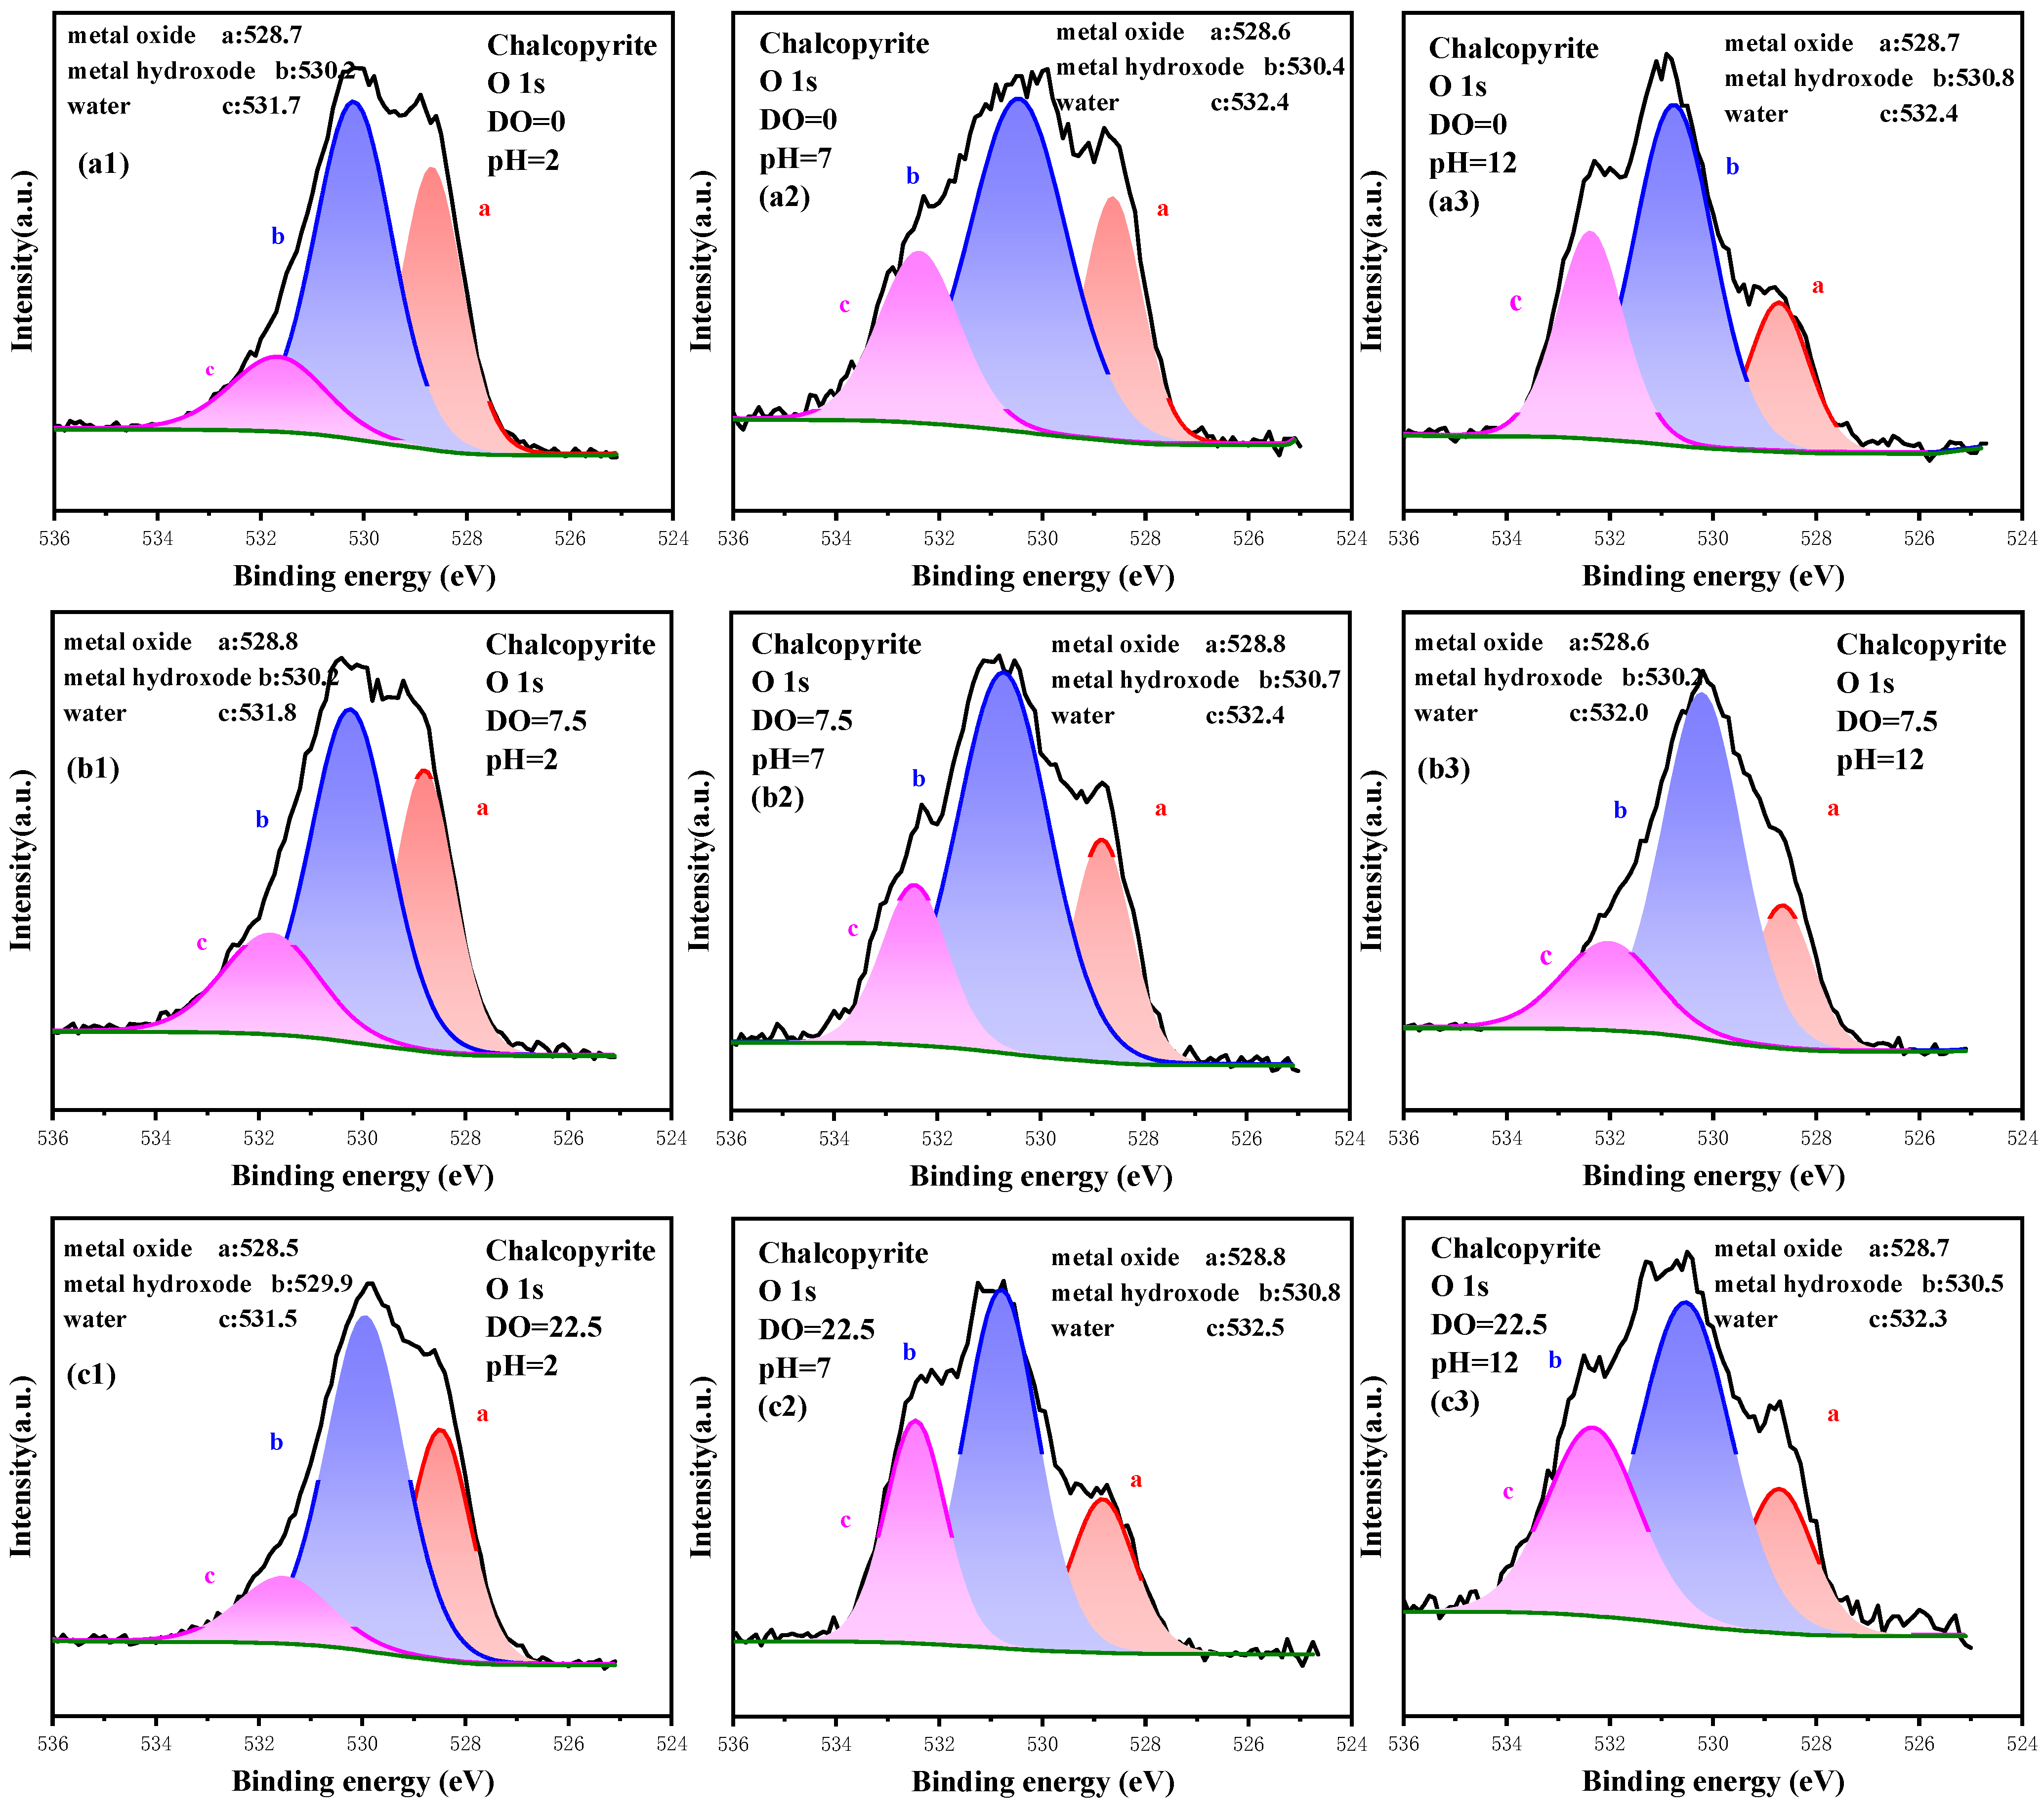
3.3.4. High-Resolution Spectrum Analysis of O 1s

The high-resolution spectrum of O 1s was recorded and analyzed, and the signal was fitted and is plotted in Figure 7. The content of O components is listed in Table 5. The O 1s spectrum was fitted with Me-O, Me-OH and H2O at 528.6, 530.5 and 532.2 eV, respectively [44,45,46,47,48]. Me-O and Me-OH were the products of surface oxidation of metal sites, and they can determine the degree of oxidation. H2O was the adsorbed water during preparation and measurement. From the perspective of pH, the content of Me-O decreased with increased pH, whereas that of Me-OH increased. For example, the content of Me-O and Me-OH was 29.71% and 57.14%, respectively, under the condition of DO 22.50 mg/L and pH 2.0, and the ratio of Me-OH/Me-O was 1.92. With increased pH, the content of Me-O decreased whereas that of Me-OH increased, and the ratio of Me-OH/Me-O increased to 3.08 at pH 7.0. It can further increase to 3.71 at pH 12.0. Herein, the high alkaline condition was favorable to the hydroxylation of metal sites. From the perspective of pulp aeration, the content of Me-O decreased with increased DO, whereas that of Me-OH increased. Taking pH 7.0 as an example, the content of Me-O and Me-OH was 23.94% and 53.19%, respectively, without pulp aeration, and the ratio of Me-OH/Me-O was 2.22. As the DO increased to 7.50 mg/L, the content of Me-O and Me-OH was 22.16% and 59.88%, respectively, whereas the ratio of Me-OH/Me-O increased to 2.70. At a higher DO of 22.50 mg/L, the content of Me-O further dropped to 19.25, and that of Me-OH was 59.45%, resulting in an increased ratio of Me-OH/Me-O to 3.08. This finding indicated that the hydroxylation of metal sites was further enhanced. Therefore, increasing pulp aeration and pH also affected the strengthening surface metal–site hydroxylation.

3.4. Analysis of Hierarchical Oxidation Process of Mineral-Forming Elements

Figure 8 depicts the variation in surface elements at different etching depths. At the etching depth of 3.0 nm, the content of Cu, Fe and S was 22.40%, 23.70% and 41.70%, in line with the ratio of the CuFeS2 lattice (1:1:2). Meanwhile, the content of O was only 12.20%, illustrating that chalcopyrite was almost un-oxidized at this depth. With decreased etching depth to 2.0 nm, the content of Cu, Fe and S was the same as that at 3.0 nm, demonstrating that chalcopyrite was not oxidized at this layer. However, at 1.0 nm etching depth, the content of O increased to 16.50% and that of S decreased to 37.60% owing to surface oxidation. At the outset layer of chalcopyrite, the content of Cu and Fe dropped slightly, but that of S dropped to 23.10% and O increased to 40.20%. Overall, the degree of oxidation gradually increased from the innermost layer to the outermost, and S was gradually lost as surface oxidation increased, exhibiting significant S-removing features.

3.4.1. Analysis of the Oxidation Process of Cu Sites

The high-resolution spectrum of Cu 2p at different etching depths is plotted in Figure 9, and the relative content of Cu 2p composition is listed in Table 6. Clearly, Cu(I)-S was the predominant component of Cu 2p at 3.0 nm etching depth, and its content was 92.50%, whereas that of Cu(II)-O was 7.50%. As the etching depth became shallower and surface oxidation increased, the content of Cu(I)-S and Cu(II)-O varied slightly. However, the conversion of Cu(I)-S into Cu(II)-O was still observed, indicating that the Cu site was stable and its oxidation process originated from Cu(I)-S to Cu(II)-O.

3.4.2. Analysis of the Oxidation Process of Fe Sites

The high-resolution spectrum of Fe 2p at different etching depths is plotted in Figure 10, and the relative content of Fe 2p composition is listed in Table 7. At 3.0 nm etching depth, the Fe sites primarily existed in the form of sulfide Fe(III)-S, and their content was 73.63%. Meanwhile, the existence of the oxidation products Fe(III)-O and sulfate was weak, and their contents were 24.26% and 2.21%, respectively. As the etching depth became shallower and surface oxidation was enhanced, the content of Fe(III)-S decreased gradually, whereas that of Fe(III)-O and sulfate increased. Specifically, the content of Fe(III)-S severely dropped to 22.44% on the outermost layer, but that of Fe(III)-O increased to 51.37% and that of sulfate increased to 26.19%. Ultimately, the dominant components on chalcopyrite surface changed from metal sulfides to metal oxides and sulfates. Compared with Cu sites, the Fe sites on chalcopyrite surface were more prone to oxidization. Their gradual oxidation involved conversion from Fe(III)-S with lower binding energy into Fe(III)-O with higher binding energy, followed by sulfate with the highest binding energy.

3.4.3. Analysis of the Oxidation Process of S Sites

The high-resolution spectrum of S 2p at different etching depths is plotted in Figure 11, and the relative content of S 2p composition is listed in Table 8. At the deepest layer (etching 3.0 nm), the S sites primarily existed in the form of S2− with low valence, followed by S22− and Sn2−. Their contents were 51.81%, 34.72% and 13.47%, respectively. At 2.0 and 1.0 nm etching depths, the contents of S components were almost unchanged. However, the S sites on the outmost layer were severely oxidized, and the content of S2− dropped to 37.00%, those of S22− and Sn2− increased to 41.68% and 21.32%, respectively, and no sulfate was observed. Sn2− further oxidized and generated sulfate (SO42−), but the S atom in the SO42− group bonded with the four O atoms; thus, its interaction with Fe sites belonging to mineral lattice was weak. Hence, the deep-oxidation product SO42− is more easily transformed from solid to liquid phase, resulting in the disappearance of sulfate on the outmost layer. In conclusion, the hierarchical oxidation process of S was from the initial phase S2− to S22−, whereas S22− was further oxidized into Sn2− and finally generated SO42−.

3.4.4. Analysis of the Oxidation Process of O Sites

The high-resolution spectrum of O 1s at different etching depths is plotted in Figure 12, and the relative content of S 2p composition is listed in Table 9. The content of Me-O was 39.50% on the innermost layer (3.0 nm etching), which was the highest within the test layers, whereas the content of Me-OH was only 33.50%, and the ratio of Me-OH/Me-O was 0.85. On the shallower layer, more Me-OH was measured, and the content of Me-O decreased gradually. For example, at 1.0 nm etching depth, the content of Me-O decreased to 33.74%, whereas that of Me-OH increased to 47.14%. On the outmost layer, the content of Me-O further dropped to 23.35%, but that of Me-OH increased to 61.28%, and the ratio of Me-OH/Me-O rose to 2.62. Hence, surface oxidation facilitated the conversion of Me-O into Me-OH and exhibited the hydroxylation characteristics of metal sites.

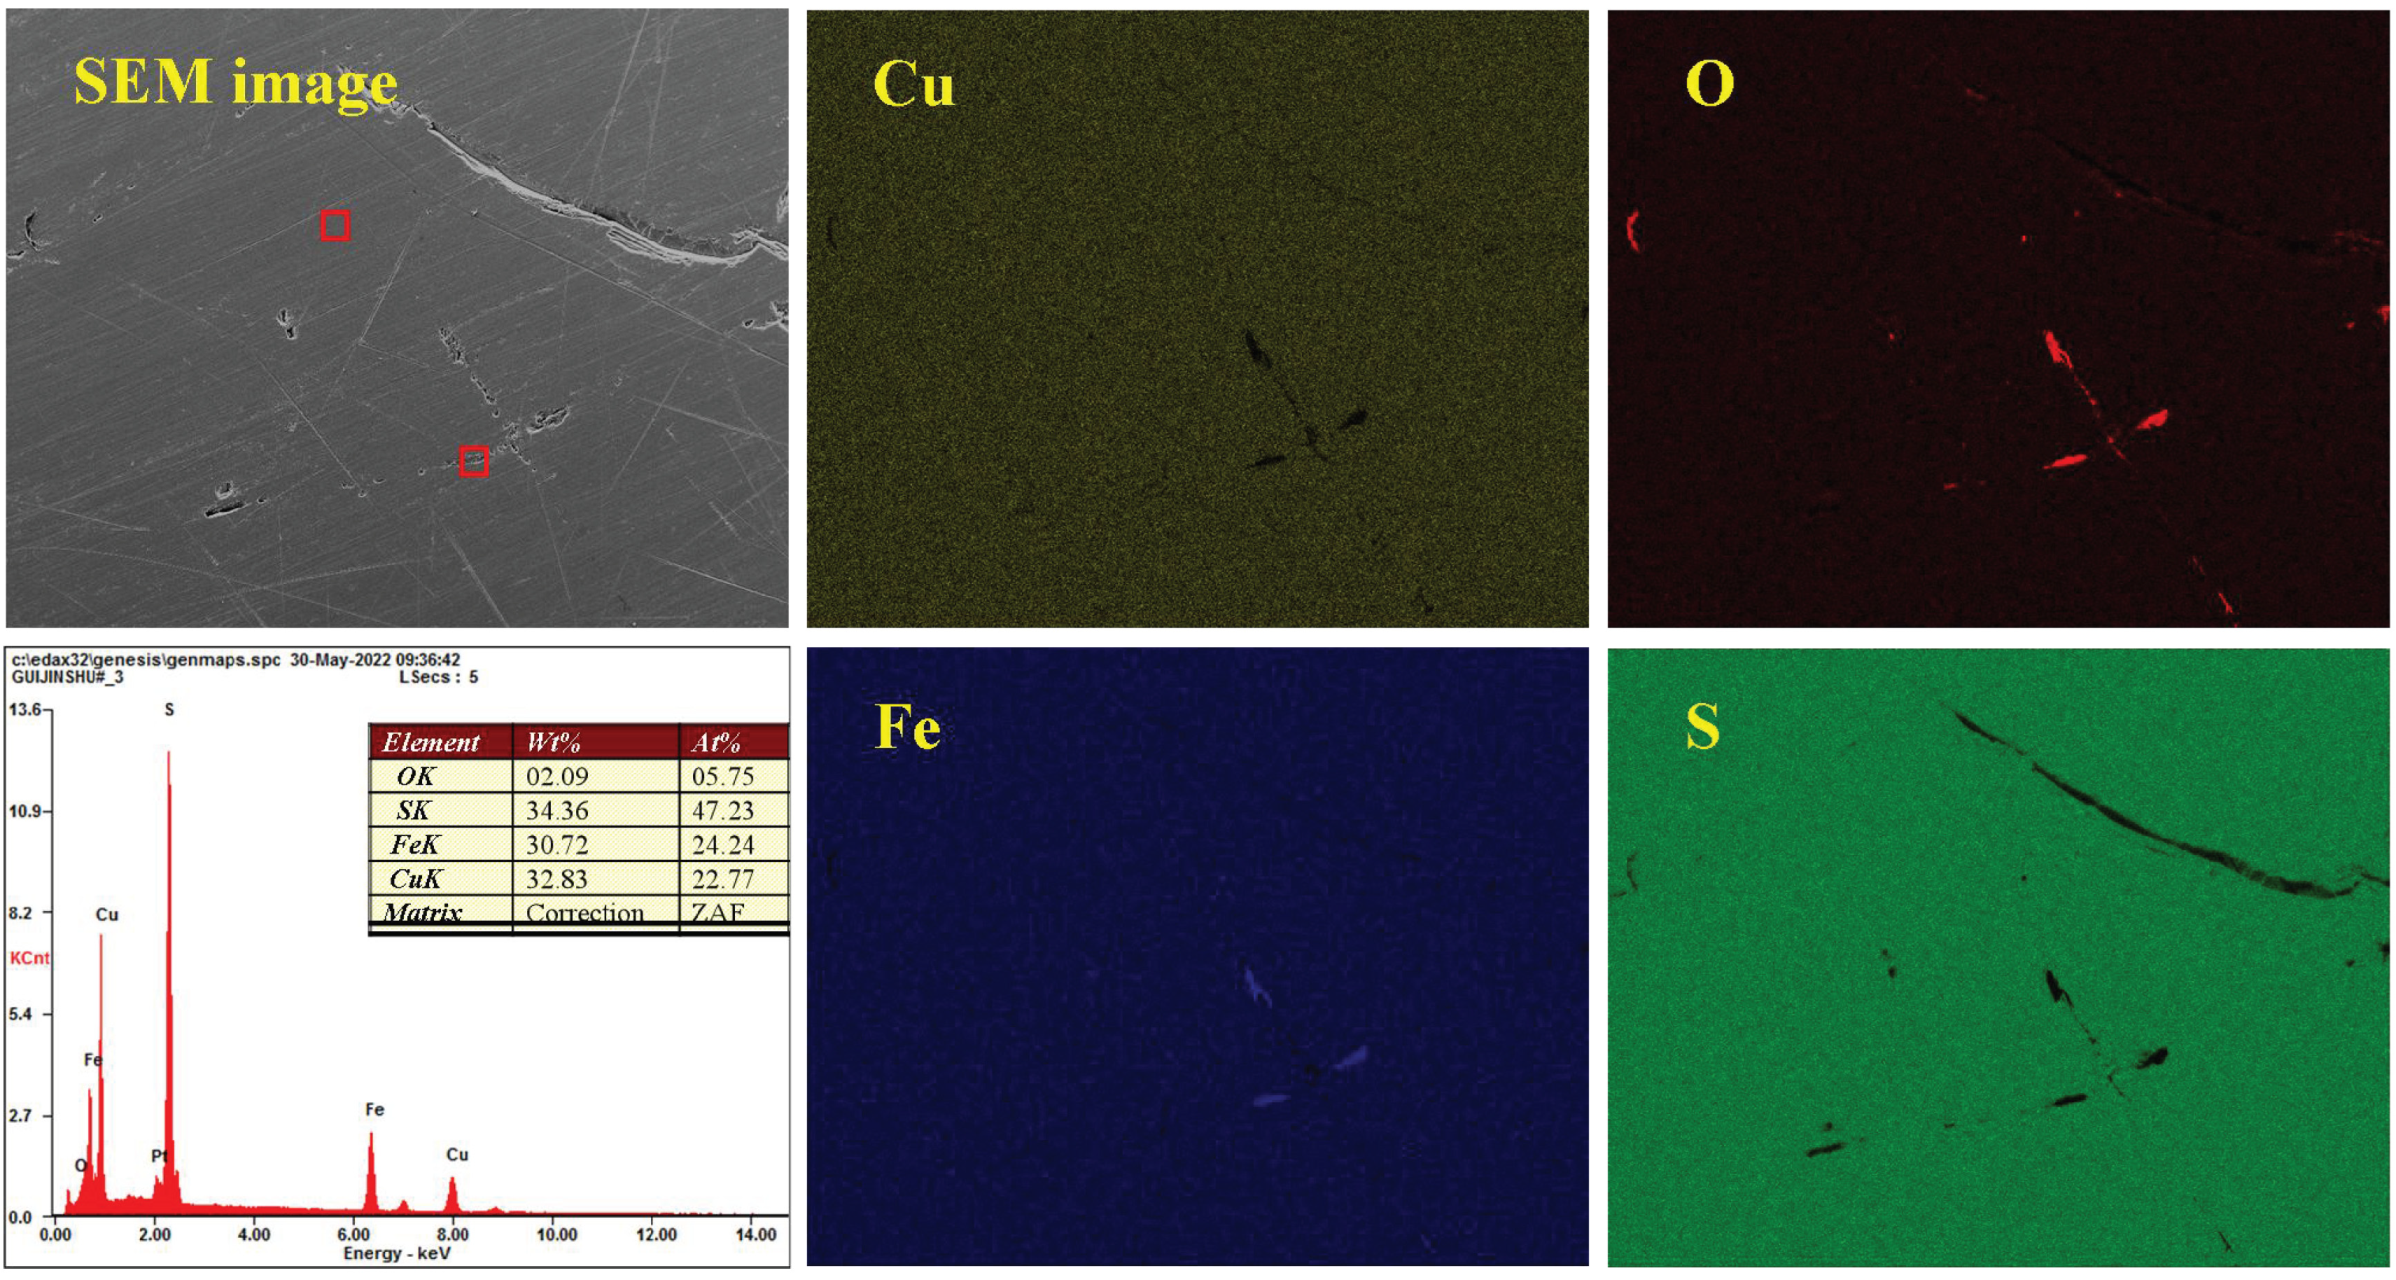
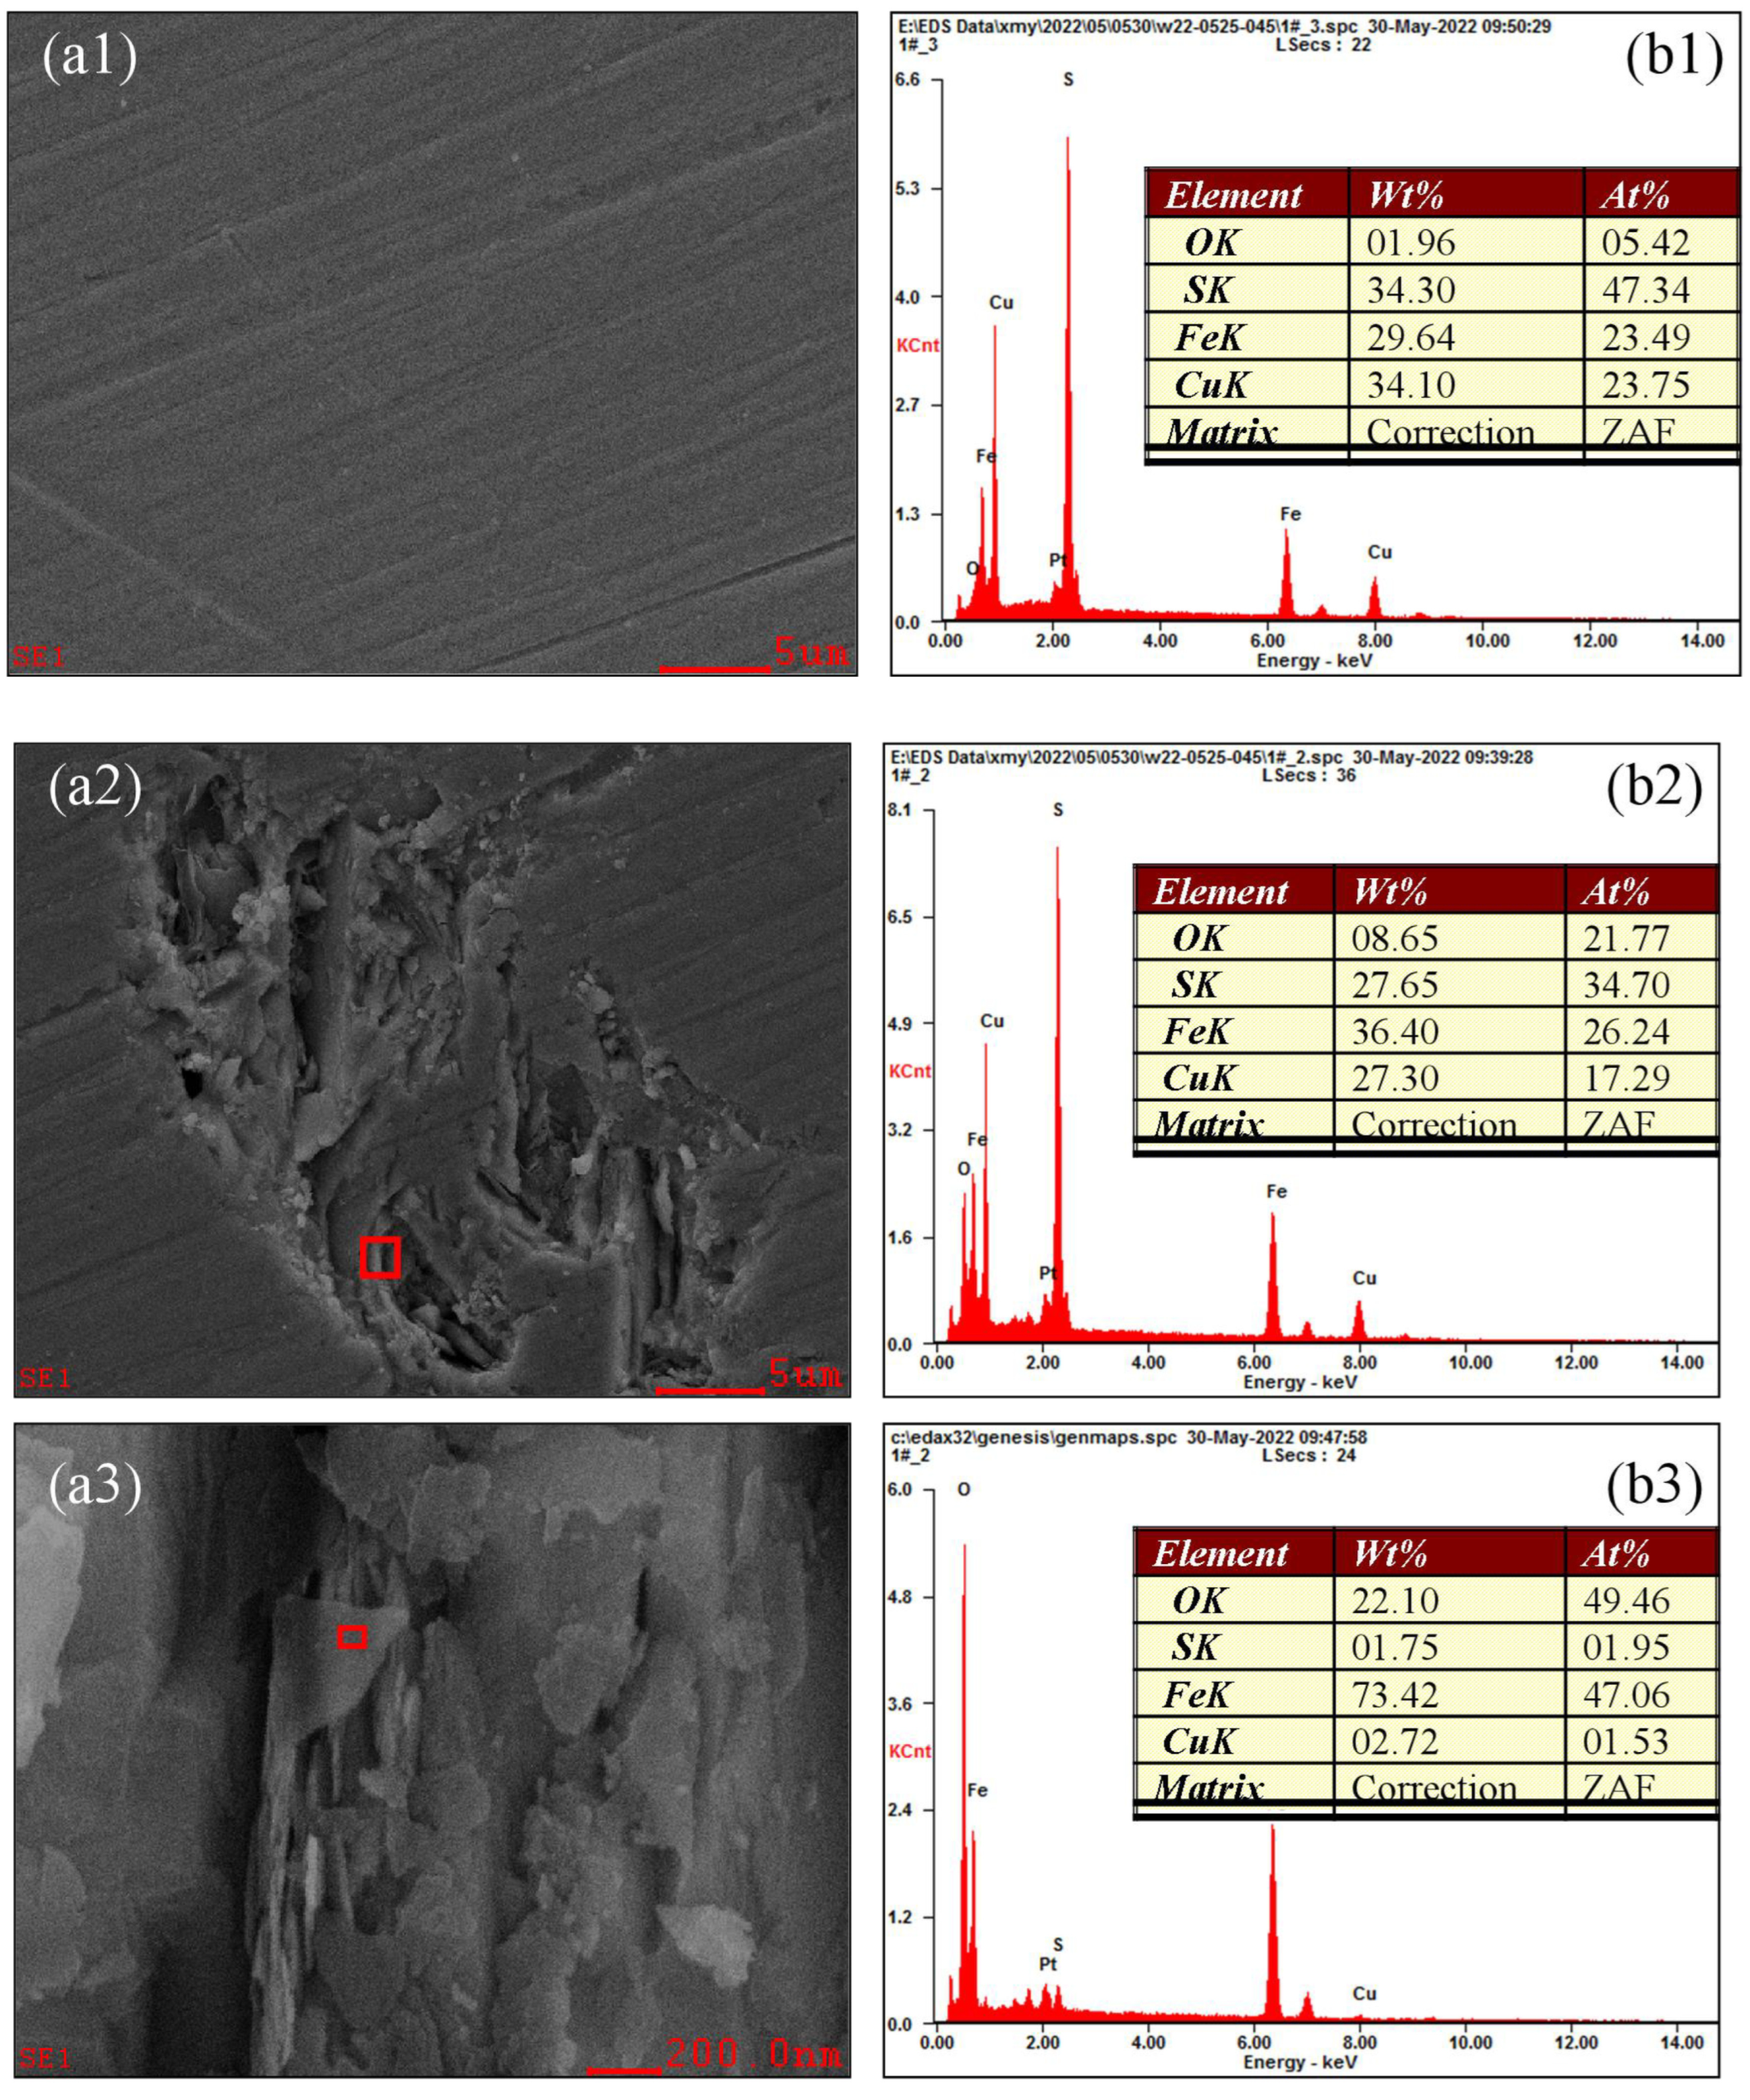
3.5. Analysis of the Oxidation–Corrosion Characteristics of Micro-Area

With the surface oxidation and corrosion of chalcopyrite microregions, the surface morphology and elemental composition were altered simultaneously. The degree of oxidation was negatively correlated with the oxidation stage, meaning that a deeper degree of oxidation on the mineral surface corresponded with a later oxidation stage. SEM and EDS analyses were utilized to obtain the micro-area morphology and element composition of chalcopyrite at different oxidation stages from macro- to microscale gradually. The results reveal the evolution law of oxidation–corrosion under acidic, moderate and alkaline conditions.

3.5.1. Micro-Area Oxidation–Corrosion Characteristics Under Acidic Condition

Figure 13 depicts the surface morphology and element composition of chalcopyrite magnified 100× after oxidation at pH 2.0. Approximately, the micro-surface was smooth and flat, and the contents of Cu, Fe and S were 22.60%, 22.84% and 50.98%, respectively, in accordance with the ratio of 1:1:2. Meanwhile, O was present in trace amounts and its content was only 3.58%, indicating weak oxidation of the macroscopic surface. Additionally, the distribution of O was uneven and obviously O-rich regions existed, indicating non-uniform oxidation–corrosion of chalcopyrite.
Figure 14 shows the oxidation morphology and EDX spectra of various microregions of chalcopyrite at pH 2.0. A point (A) in the weakly oxidized region (Figure 13) was selected and magnified 3000×, and the results are depicted in Figure 14(a1,b1). The micro-surface of the weakly oxidized area was smooth and uniform, and the composition of Cu, Fe and S elements basically conformed to the ideal ratio of 1:1:2. Moreover, the content of O was just 2.13%, confirming weak surface oxidation. A point (B) in the strongly oxidized region (Figure 13) was then selected and magnified to 3000×, and the results are plotted in Figure 14(a2,b2). A large gully was observed, its inside depth varied and outside surface was uneven, confirming strong corrosion. Furthermore, the contents of Cu and S decreased to 20.78% and 45.29%, respectively, the contents of Fe remained unchanged at 20.10%, whereas that of O increased to 13.83%, indicating strong oxidation. Figure 14(a3,b3) shows the morphology and elemental content of the microscopic surface of a point (C) in Figure 14(a2) under 50,000× magnification. Compared to Figure 14(a2) under 3000× magnification, the contents of Cu, Fe and S further dropped to 17.62%, 20.10% and 40.37%, respectively, and that of O increased to 21.91%, demonstrating strong surface oxidation. From the perspective of surface morphology, the flat surface disappeared, but the rod-shaped or block-shaped particles were randomly distributed and filled the image. Additionally, the connection area between these particles and chalcopyrite substrate was very small, exhibiting obvious corrosion phenomena. In the traditional view, the strongly oxidized area is always covered by an oxide film. However, no raised oxide film was observed; it collapsed into the surface interior owing to corrosion. The corrosion phenomenon intensified as the oxidation degree increased. Therefore, the oxidation micro-zone and the corrosion micro-zone greatly overlapped, indicating that surface oxidation was positively correlated with surface corrosion.

3.5.2. Micro-Area Oxidation–Corrosion Characteristics Under Moderate Condition

Figure 15 depicts the surface morphology and element composition of chalcopyrite magnified 100× after oxidation at pH 7.0. The microsurface was basically smooth and flat despite a few holes and stripes, and the contents of Cu, Fe and S were 23.69%, 24.20% and 47.95%, respectively, in accordance with the ratio of 1:1:2. Meanwhile, element O was detected at only 4.15% content, indicating weak oxidation of the macroscopic surface. Furthermore, the distribution of O was uneven, and it was concentrated in some areas and formed dots and strips. This finding indicated that the oxidation–corrosion of chalcopyrite was non-uniform.
Figure 16 shows the oxidation morphology and EDX spectra of various microregions of chalcopyrite at pH 7.0. A point (A) in the weakly oxidized region (Figure 15) was selected and magnified to 3000×, and the results are depicted in Figure 16(a1,b1). The microsurface of the weakly oxidized area was smooth and uniform, and the content of O was 2.13%, confirming weak surface oxidation. Meanwhile, a point (B) in the strongly oxidized region (Figure 15) was selected and magnified 3000×. In Figure 16(a2,b2), a huge ravine ruined through the entire image, the edges and interior of the gully were undulating and uneven, causing high roughness and obvious surface corrosion. Meanwhile, the content of O was as high as 16.33%, whereas those of Cu, Fe and S dropped. This finding indicated that the oxidation degree of this microarea was stronger. Figure 16(a3,b3) shows the morphology and elemental content of the microscopic surface of point (C) in Figure 14(a2) under 50,000× magnification. Compared with Figure 16(a2) under 3000× magnification, the contents of Cu, Fe and S further dropped to 21.16%, 19.29% and 39.48%, and that of O increased to 20.06%, demonstrating strong surface oxidation. From the perspective of surface morphology, this micro-area was filled with numerous tightly packed sheet-like scales, showing a cracking phenomenon. The scales were large or small and had a low thickness and significant corrosion characteristics. Therefore, a higher oxidation degree corresponded with a more obvious corrosion phenomenon in the area. The oxidation micro-zone and the corrosion micro-zone greatly overlapped; that is, surface corrosion became more significant with increased surface oxidation. Oxidation and corrosion jointly affected the surface morphology and elemental composition of chalcopyrite.

3.5.3. Micro-Area Oxidation–Corrosion Characteristics Under Alkaline Condition

Figure 17 depicts the surface morphology and element composition of chalcopyrite magnified 100× after oxidation at pH 12.0. The micro-surface was smooth and flat, and the contents of Cu, Fe and S were 22.77%, 24.24% and 47.23%, respectively, in accordance with the ratio of 1:1:2. Compared with acidic and moderate conditions, the content of O was the highest under alkaline conditions, reaching 5.75% and illustrating the deepest surface oxidation. From the perspective of element distribution, O was still concentrated in some parts of the regions rather than being evenly distributed, which further demonstrated the non-uniformity of surface oxidation. Particularly, the O-concentrated regions were S-deficient, and these regions overlapped with the Fe-concentrated ones, indicating that the corrosion and loss of S was faster than Fe, etc. The oxidation–corrosion of chalcopyrite exhibited the asymmetric characteristics of mineral-forming elements under alkaline conditions.
Figure 18 shows the oxidation morphology and EDX spectra of various microregions of chalcopyrite at pH 12.0. A point (A) in the weakly oxidized region (Figure 17) was selected and magnified to 3000×, and the results are depicted in Figure 18(a1,b1). The contents of Cu, Fe, S and O in this microarea were 23.75%, 23.49%, 47.34% and 5.42%, respectively, similar to the macroarea. Meanwhile, the surface morphology was uniform and flat, indicating a weak surface oxidation. A point (B) in the strongly oxidized region (Figure 17) was selected and magnified 3000×, and its detection results of surface morphology and element composition are plotted in Figure 18(a2,b2). In this area, the content of O increased to 21.77%, indicating a stronger surface oxidation. Furthermore, the content of Fe remained at around 26.24%, whereas that of S sharply dropped to 34.70%, causing the ratio of S/Fe to be far less than the ideal value of 1:2, demonstrating the selective corrosion of S. This high oxidation area was not covered by an oxide film but rather collapsed into the surface and contained many small grooves of varying depths and shapes. This finding indicated significant corrosion. Figure 18(a3,b3) shows the morphology and elemental content of the microscopic surface of a point (C) in Figure 18(a2) under 50,000× magnification. Compared with Figure 18(a2) under 3000× magnification, the content of O further increased to 49.46%, illustrating enhanced surface oxidation. The content of Fe was 47.06%, but that of S was just 1.95%, indicating that the asymmetric corrosion of S was more significant. From a morphological perspective, the microarea exhibited strong “peeling and delamination”. One end had part of the mineral surface connected to the mineral substrate, whereas the other end was raised and separated from the substrate. Part of the mineral surface was directly separated from the substrate and scattered in flakes on the outermost layer of the mineral. From the perspective of elemental composition, these flakes were primarily iron oxides. Analysis suggested that after the asymmetric corrosion of S, the relatively excess Fe can coordinate only with oxygen or hydroxide ions in the solution to form metal oxides or hydroxides. Therefore, as the degree of oxidation increased, surface corrosion became more significant. The asymmetric corrosion of S under alkaline conditions helped generate metal oxides and hydroxides, in turn affecting surface morphology and material composition.

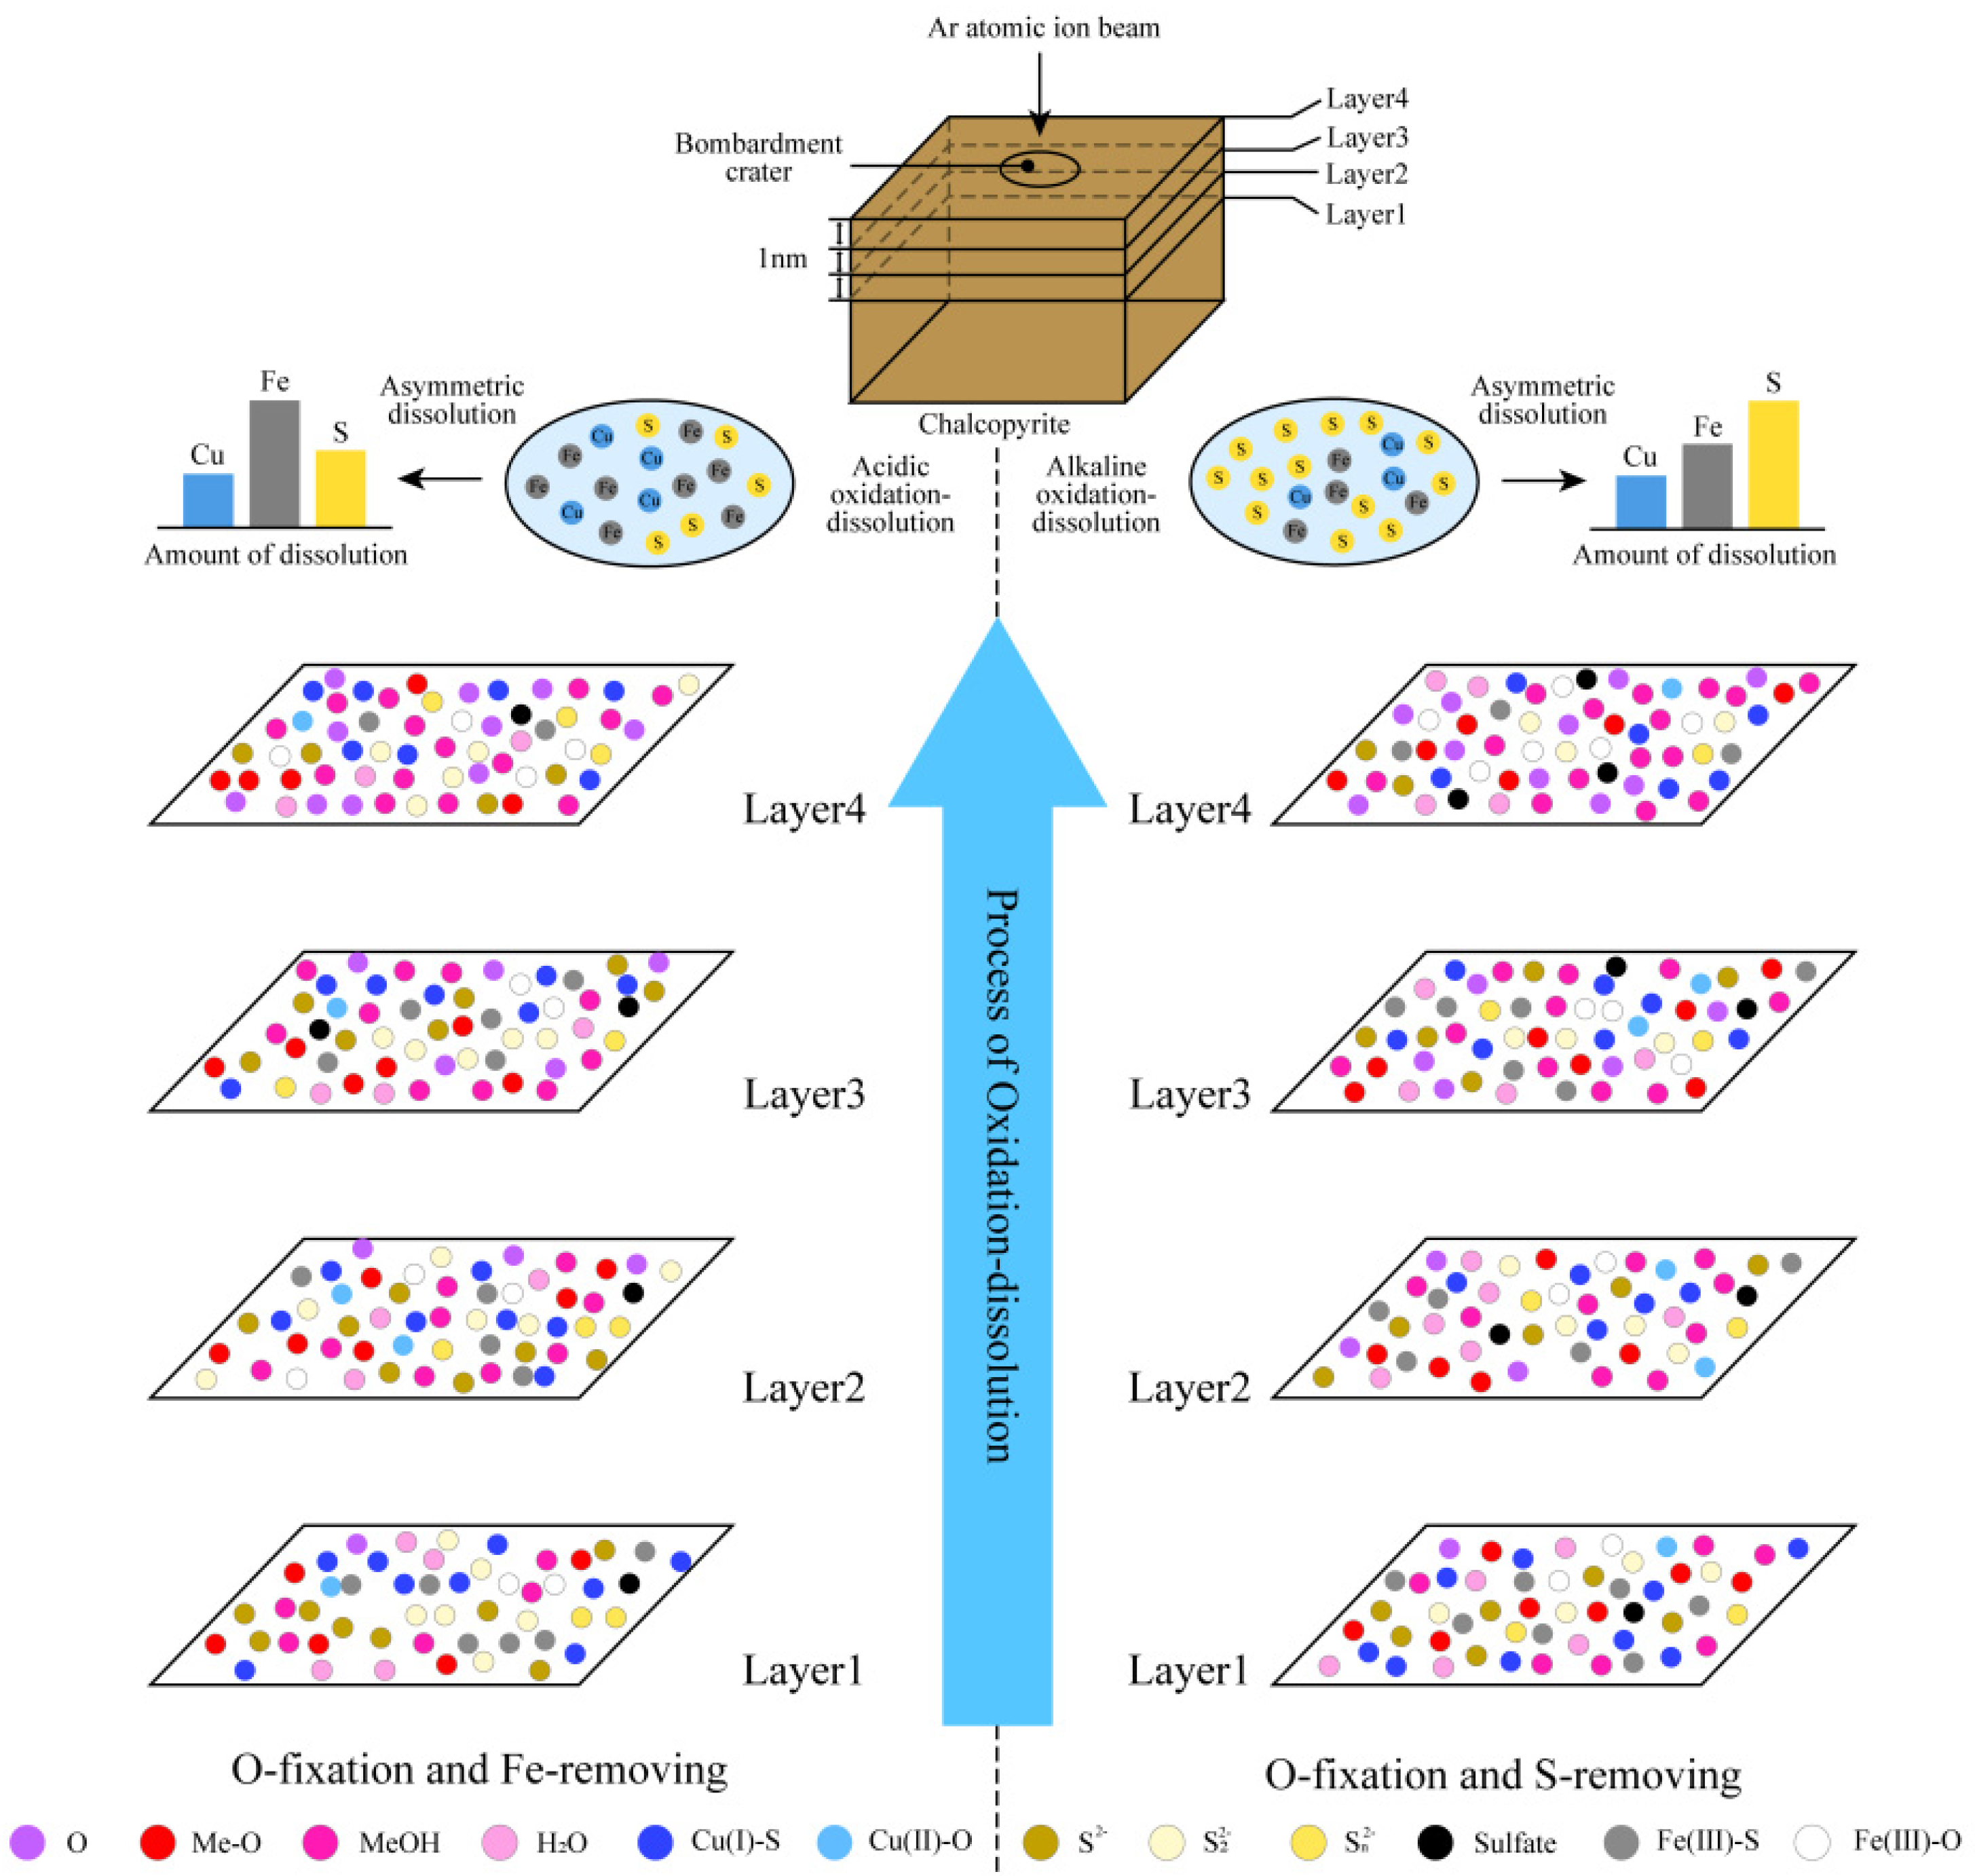
4. Hierarchical Oxidation–Asymmetric Corrosion Model of Chalcopyrite

In traditional research on chalcopyrite oxidation, the focus is given to the final oxidation products. No attention is paid to the oxidation process and material conversion law, as well as to the step-by-step changes in element valence and composition during oxidation. Hence, a systematic understanding and summary of the asymmetric corrosion law of metal sites and non-metal sites accompanied by the oxidation are lacking. Through independent research and by summarizing previous reports, we established a hierarchical oxidation–asymmetric corrosion model of chalcopyrite in Figure 19. The role and function of pulp aeration in the oxidation–corrosion of chalcopyrite was emphasized.
Combined with the above analysis, we concluded that the ore-forming elements Cu, Fe and S in chalcopyrite possessed oxidation characteristics, and a significant number of electrons were lost during oxidation from the sulfide form in the lower chemical state to the metal oxide/hydroxide and sulfate in the higher chemical state. This process cannot be completed in one step and underwent hierarchical oxidation. Additionally, oxidation was accompanied by the asymmetric corrosion of mineral-forming elements and the fixation of O elements in solution, which was a complex oxidation–corrosion and material-exchange system. According to different oxidation–corrosion degrees, oxidation–corrosion was divided into several different stages, and the hierarchical oxidation–asymmetric corrosion model of the critical active layer of sulfide minerals was constructed.

4.1. Hierarchical Oxidation–Asymmetric Corrosion Model Under Alkaline Condition

First-order oxidation–corrosion reaction:
B u l k C u + F e 3 + ( S 2 ) 2 + O 2 B u l k C u + F e 3 + ( S 2 2 ) 2 + B u l k C u + F e 3 + ( O 2 ) 2 + S x O y 2
Second-order oxidation–corrosion reaction:
B u l k C u + F e 3 + ( S 2 2 ) 2 + O 2 B u l k C u + F e 3 + ( S n 2 ) 2 + B u l k C u + F e 3 + ( O 2 ) 2 + S x O y 2
Third-order oxidation–corrosion reaction:
B u l k C u + F e 3 + ( S n 2 ) 2 + O 2 B u l k C u + F e 3 + ( O 2 ) 2 + S x O y 2
Fourth-order oxidation–corrosion reaction:
B u l k C u + F e 3 + ( O 2 ) 2 + O 2 B u l k C u 2 + O 2 + B u l k ( F e 3 + ) 2 ( O 2 ) 3
Fifth-order hydroxylation reaction:
B u l k ( F e 3 + ) 2 ( O 2 ) 3 + O H B u l k F e 3 + O 2 ( O 2 H + )
Under alkaline conditions, the oxidation of chalcopyrite is predominantly promoted by oxygen. Due to the Cu site being relatively stable and the Fe site having reached its highest valence, the early oxidation is mainly dominated by S site. Thus, the valence of Cu and Fe sites remains unchanged while that of the S site increases in the first-order oxidation and corrosion reaction. The S site in the chalcopyrite lattice underwent mild oxidation, and S 2 is oxidized into S 2 2 ; therefore, the B u l k C u + F e 3 + ( S 2 2 ) 2 is formed. Meanwhile, O atoms are fixed on chalcopyrite surfaces and generate B u l k C u + F e 3 + ( O 2 ) 2 . Moreover, some S atoms dissolve from the chalcopyrite surface due to the substitution of O atoms, and they enter the solution in the form of SxOy2−. Among them, S x O y 2 refers to oxygenated sulfides, including elemental sulfur S 0 , tetrasulfate S 4 O 6 2 , thiosulfate S 2 O 3 2 , sulfite S O 3 2 , sulfate S O 4 2 and so on [49,50,51]. Pulp aeration can increase the content of DO in the pulp, promote the reaction and enhance the selective corrosion of S. In the second-order oxidation and corrosion reaction, the S22− is further oxidized into Sn2−, while B u l k C u + F e 3 + ( S 2 2 ) 2 and SxOy2− are formed at the same time. In the third-order oxidation and corrosion reaction, the Sn2− is further oxidized and dissolved and the metal sulfide is completely transferred into metal oxide B u l k C u + F e 3 + ( O 2 ) 2 . In the fourth-order deep oxidation–corrosion reaction, the Cu site with +1 valence is oxidized into +2 valence, and the B u l k C u 2 + O 2 and B u l k ( F e 3 + ) 2 ( O 2 ) 3 are generated. Finally, the metal oxides are hydroxylated, and B u l k F e 3 + O 2 ( O 2 H + ) is formed in the fifth-order hydroxylation reaction. Overall, the oxidation–corrosion of chalcopyrite under alkaline condition is accompanied by significant desulfurization characteristics, making the mineral surface “S-deficiency and metal-rich”. Meanwhile, the content of hydrophilic metal oxides and hydroxides increases significantly, which will depress the flotation of chalcopyrite.

4.2. Hierarchical Oxidation–Asymmetric Corrosion Model Under Acidic Condition

First-order oxidation–corrosion reaction:
B u l k C u + F e 3 + ( S 2 ) 2 + O 2 + H + B u l k ( C u + ) 3 F e 3 + ( S 2 2 ) 3 + F e 3 + + H 2 O
Second-order oxidation–corrosion reaction:
B u l k ( C u + ) 3 F e 3 + ( S 2 2 ) 3 + O 2 + H + B u l k ( C u + ) 5 F e 3 + ( S n 2 ) 3 + F e 3 + + H 2 O
Third-order oxidation–corrosion reaction:
B u l k ( C u + ) 5 F e 3 + ( S n 2 ) 3 + O 2 B u l k ( C u + ) 9 F e 3 + ( S x O y 2 ) 4 + F e 3 + + H 2 O
Under acidic conditions, the oxidation–corrosion of chalcopyrite is mainly dominated by the oxidation of S atoms and the corrosion of Fe atoms. In the first-order oxidation–corrosion reaction, the valence of Cu site remains unchanged, while the S2− is oxidized into S22−, and generates B u l k ( C u + ) 3 F e 3 + ( S 2 2 ) 3 . Because the atomic ratio of Fe/S decreases in the newly formed oxidation products, part of Fe3+ is dissolved into solution to maintain material balance, and thus promote the formation of a “Fe-deficiency and S-rich” non-equilibrium layer. In the second-order oxidation–corrosion reaction, the Fe site in B u l k ( C u + ) 3 F e 3 + ( S 2 2 ) 3 continuously selectively dissolves into the solution in the form of F e 3 + , resulting in a further decreased Fe/S ratio. At the same time, the S site further oxidizes into the linear polymer S n 2 , which re-coordinated to form the linear highly polymerized iron sulfide B u l k ( C u + ) 5 F e 3 + ( S n 2 ) 3 . Owing to the poor stability of the linear highly polymerized iron sulfide B u l k ( C u + ) 5 F e 3 + ( S n 2 ) 3 , F e 3 + is further dissolved, whereas S n 2 is further oxidized to form the oxygenated sulfide S x O y 2 , and the oxygenated sulfate B u l k ( C u + ) 9 F e 3 + ( S x O y ) 4 is formed in the third-order oxidation–corrosion reaction.

5. Conclusions

Pyrrhotite-rich type copper sulfide ore encounters the challenge of Cu-S separation during flotation separation, while surface oxidation and corrosion are the significant methods to regulate the surface properties and promote the selective concentration of target minerals. Herein, systematically uncovering the oxidation–corrosion characteristics and mechanisms of chalcopyrite, pyrite and pyrrhotite is crucial for enhancing the selective separation of pyrrhotite-rich type copper sulfide ore. This article first selects chalcopyrite to study its oxidation–corrosion mechanism, and the hierarchical oxidation-asymmetric corrosion model is established. The main findings can be summarized as follows:
(1)
The DO detection results demonstrate that chalcopyrite possessed various DO consumption characteristics under various pH conditions; more specifically, its oxygen consumption rate and degree are enhanced with the increased pulp pH. Therefore, chalcopyrite is more prone to oxidation–corrosion under alkaline conditions.
(2)
The ICP measurements indicated that the specific corrosion rates of Cu, Fe and S are asymmetric, and they are affected by pulp pH and aeration conditions. The elements of Cu and Fe are prone to corrosion under acidic conditions while S is prior to corrosion under alkaline conditions. Moreover, pulp aeration can selectively accelerate the specific corrosion rate of Fe and S under acidic and alkaline conditions, respectively, thus further promoting the asymmetric corrosion of mineral-forming elements.
(3)
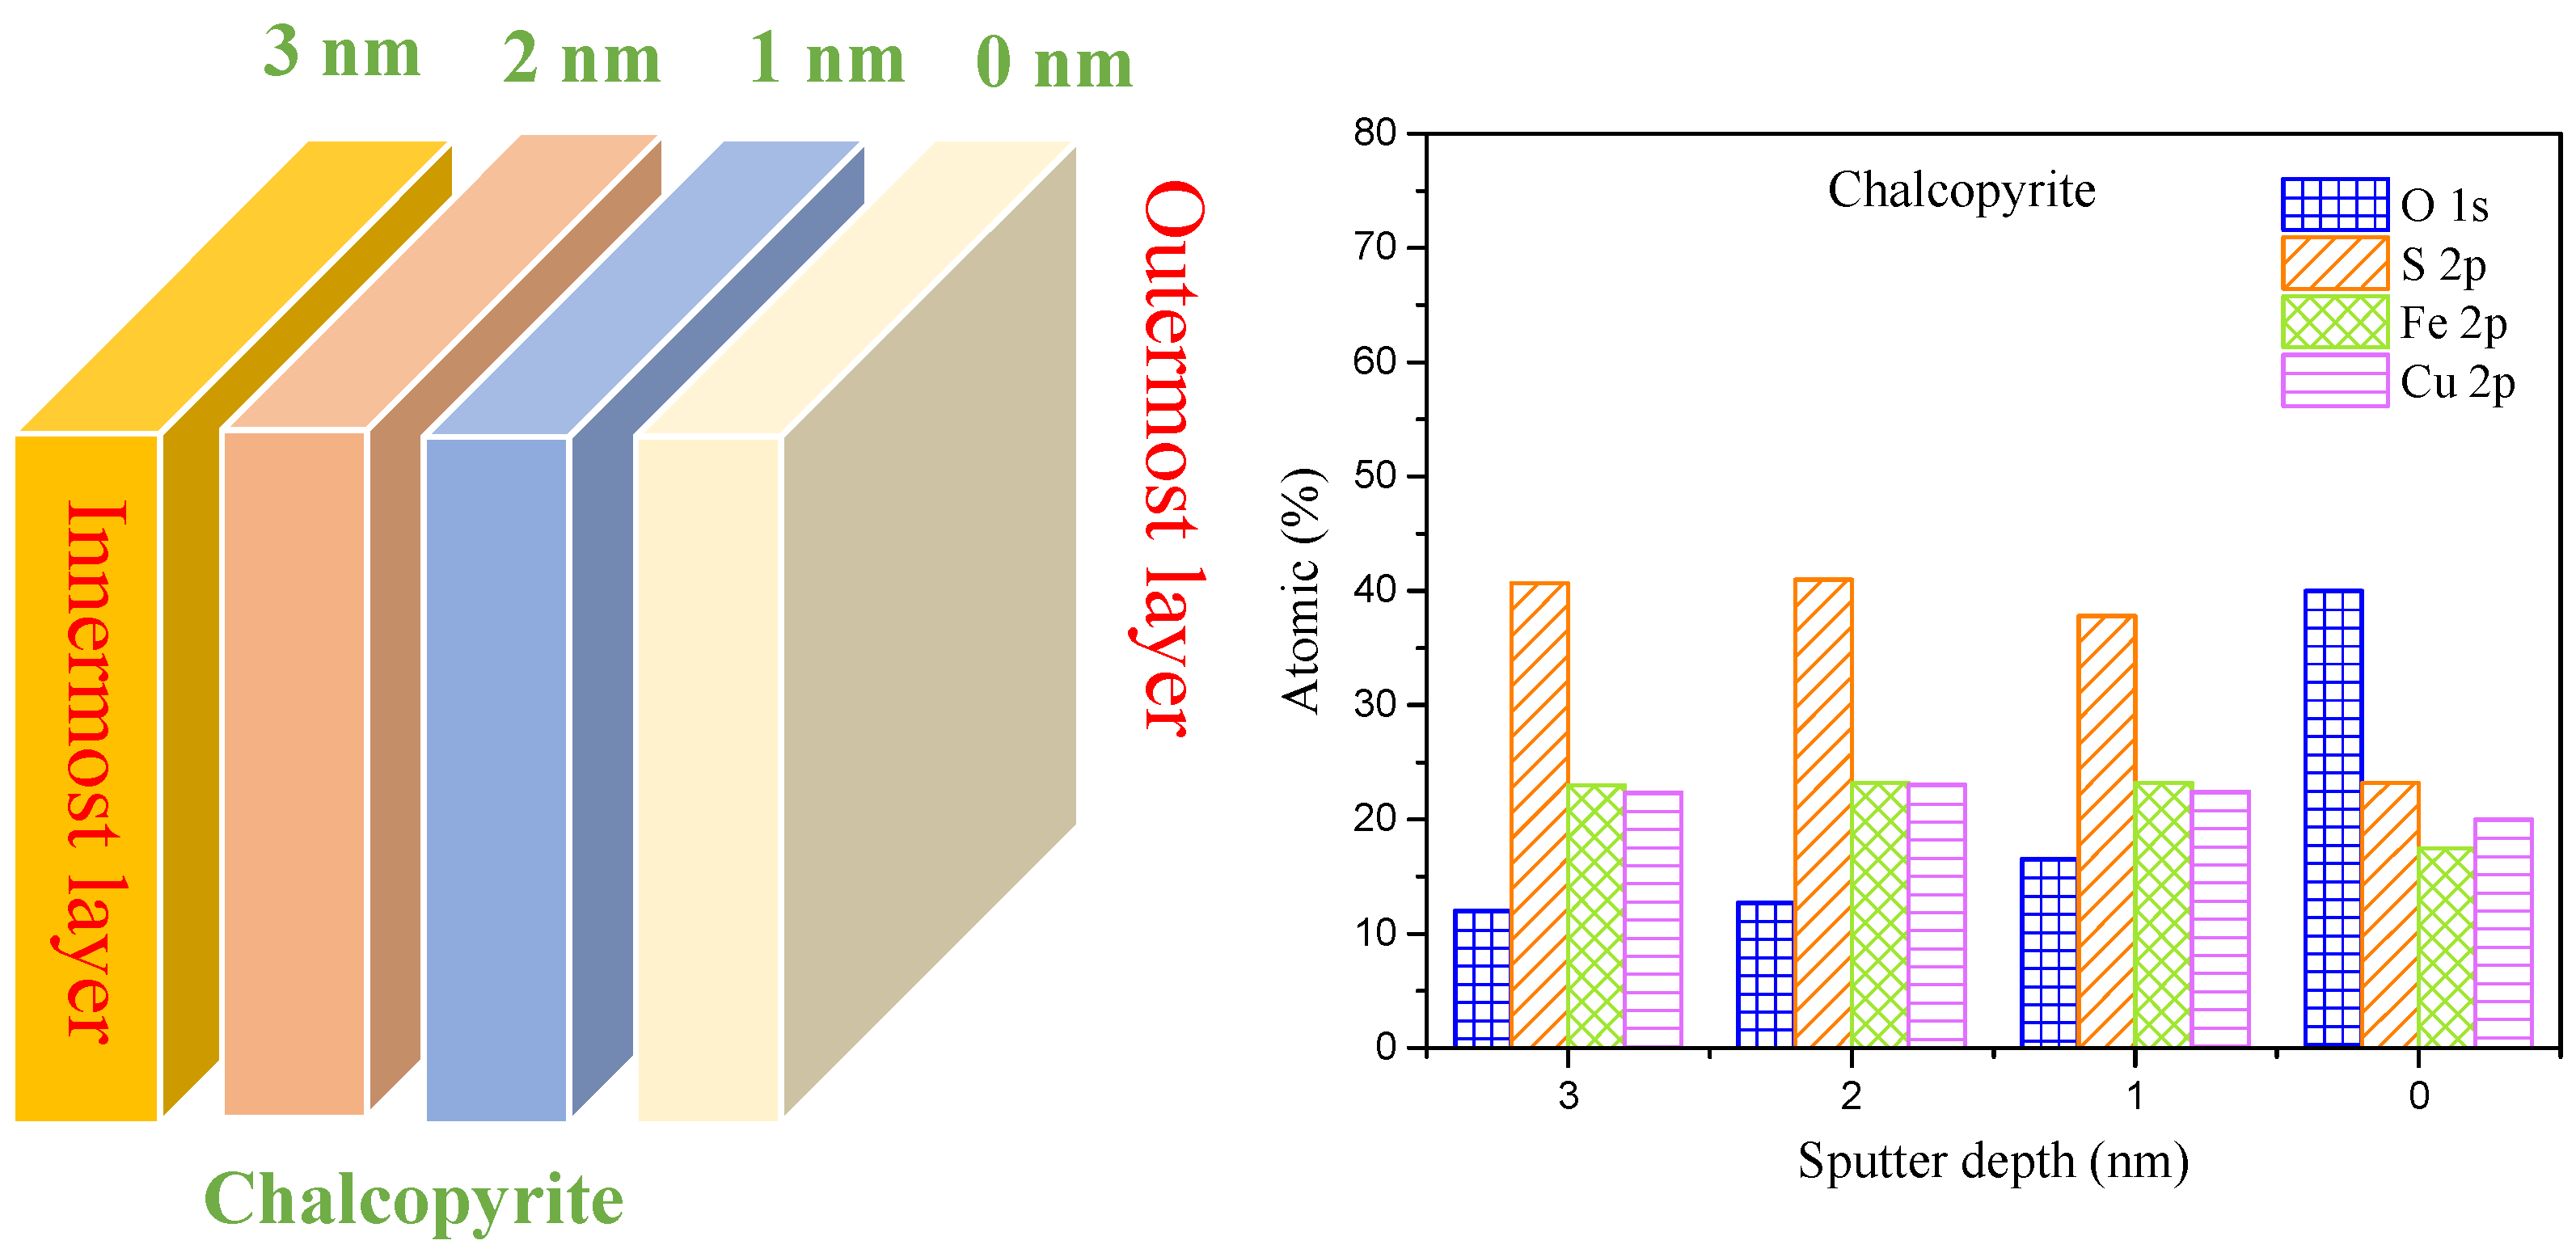
The XPS measurements confirmed that the asymmetric corrosion of Cu, Fe and S contributed to the generation of non-equilibrium layers, meaning the selective corrosion of Fe promoted the formation of the “metal-deficient and S-rich” layer, while the selective corrosion of S promoted the formation of the “S-deficient and metal-rich” layer. Otherwise, surface oxidation could be strengthened via increasing pH or pulp aeration intensity, but the strengthening effect of the latter is smaller than that of the former.
(4)
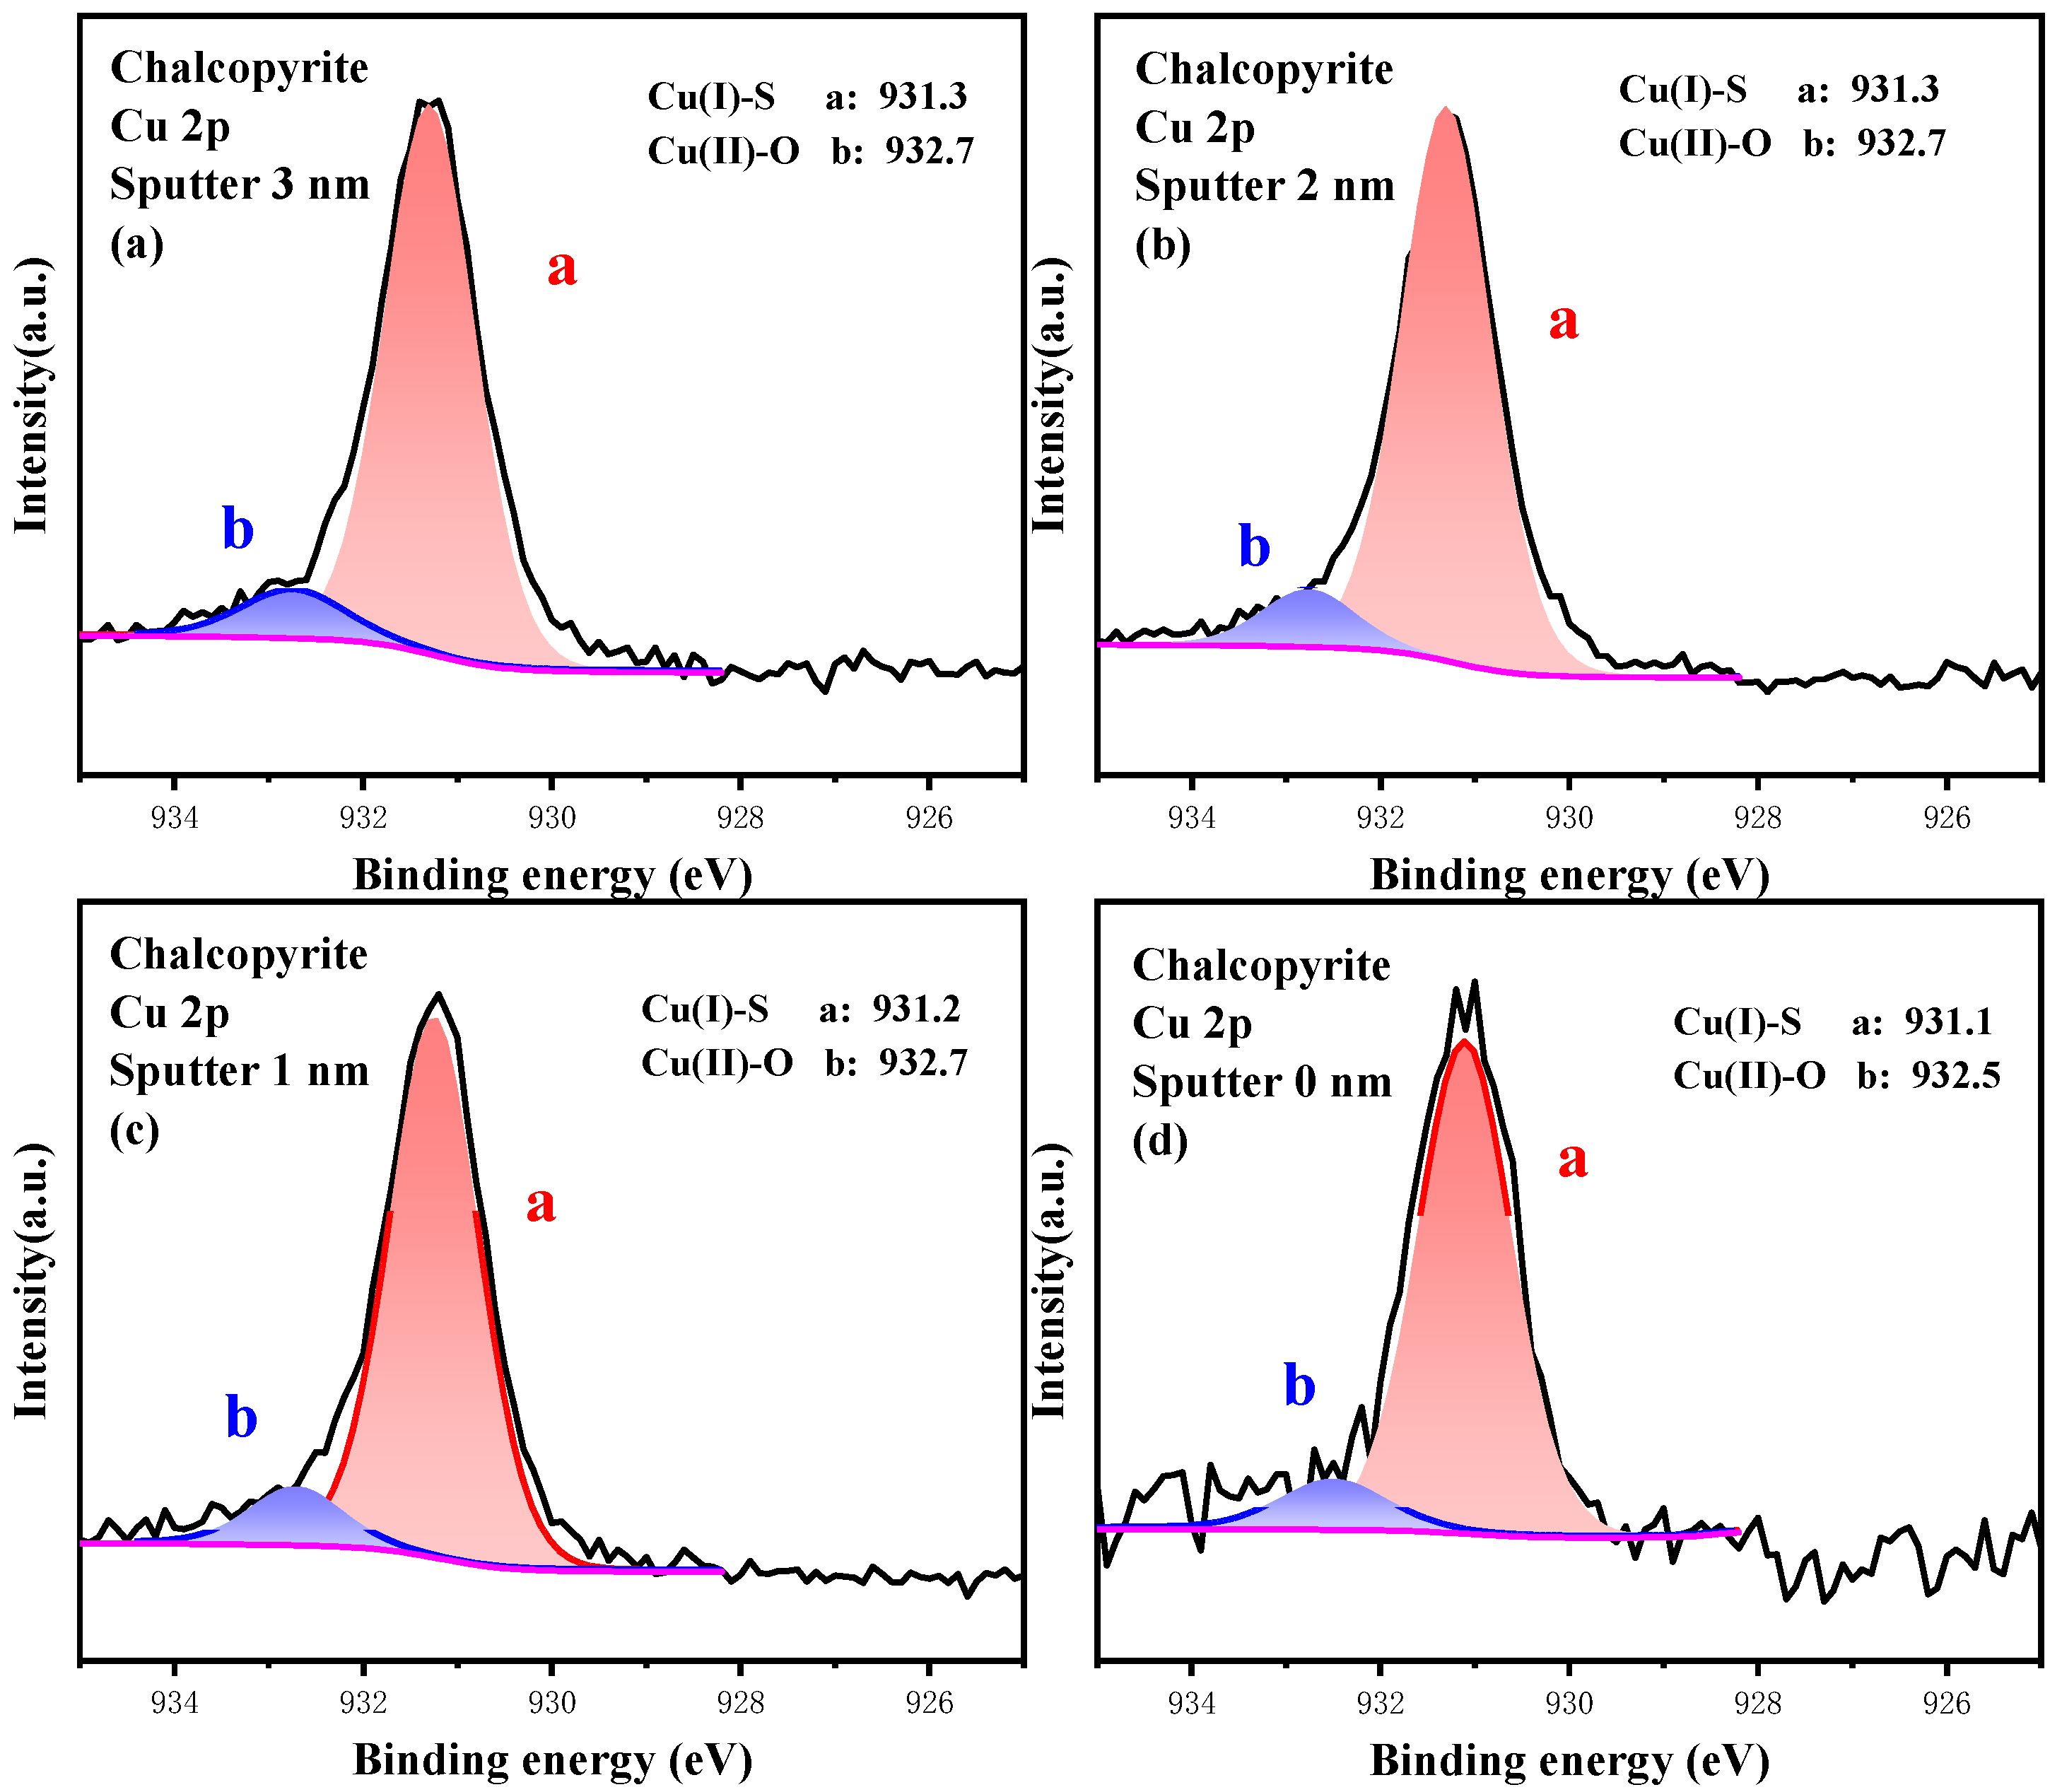
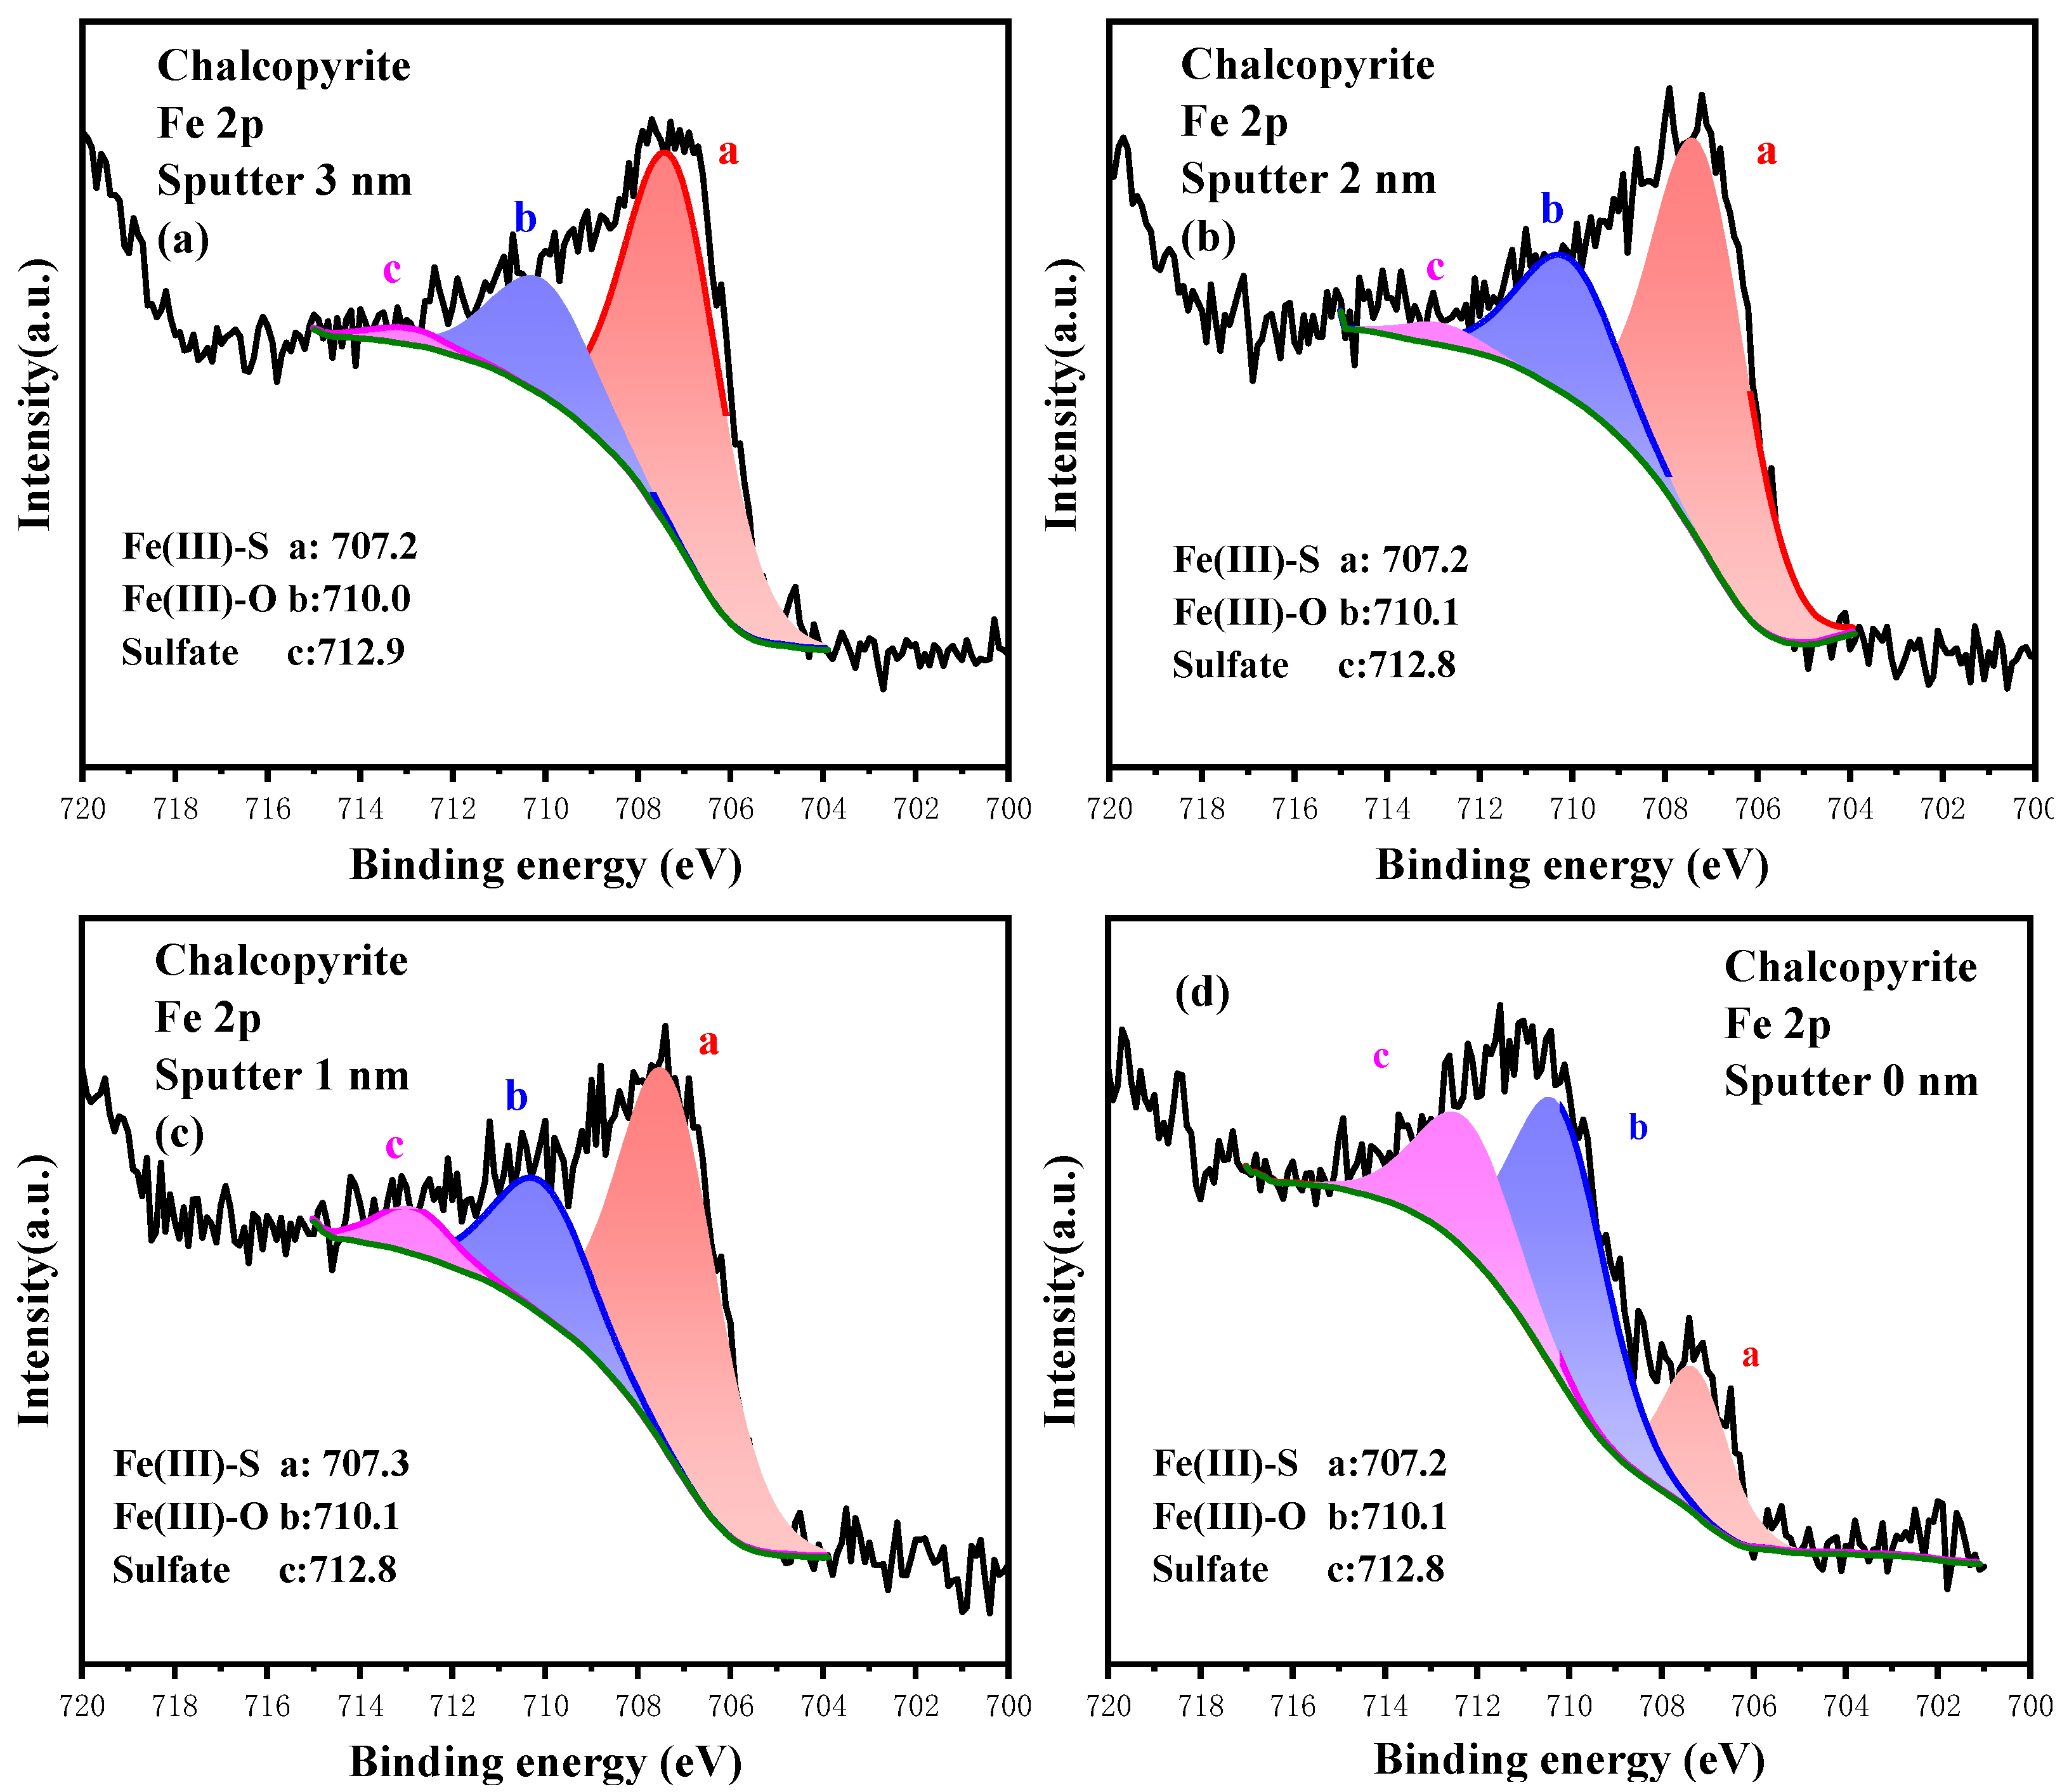
Surface etching results indicate that the oxidation of Cu, Fe and S sites is a multi-component and multi-phase transition reaction, and the hierarchical oxidation process of Cu, Fe and S sites are Cu(I)-S → Cu(II)-O, Fe(III)-S → Fe(III)-O → sulfate and S2−→ S22−→ Sn2−→ SO42−.
(5)
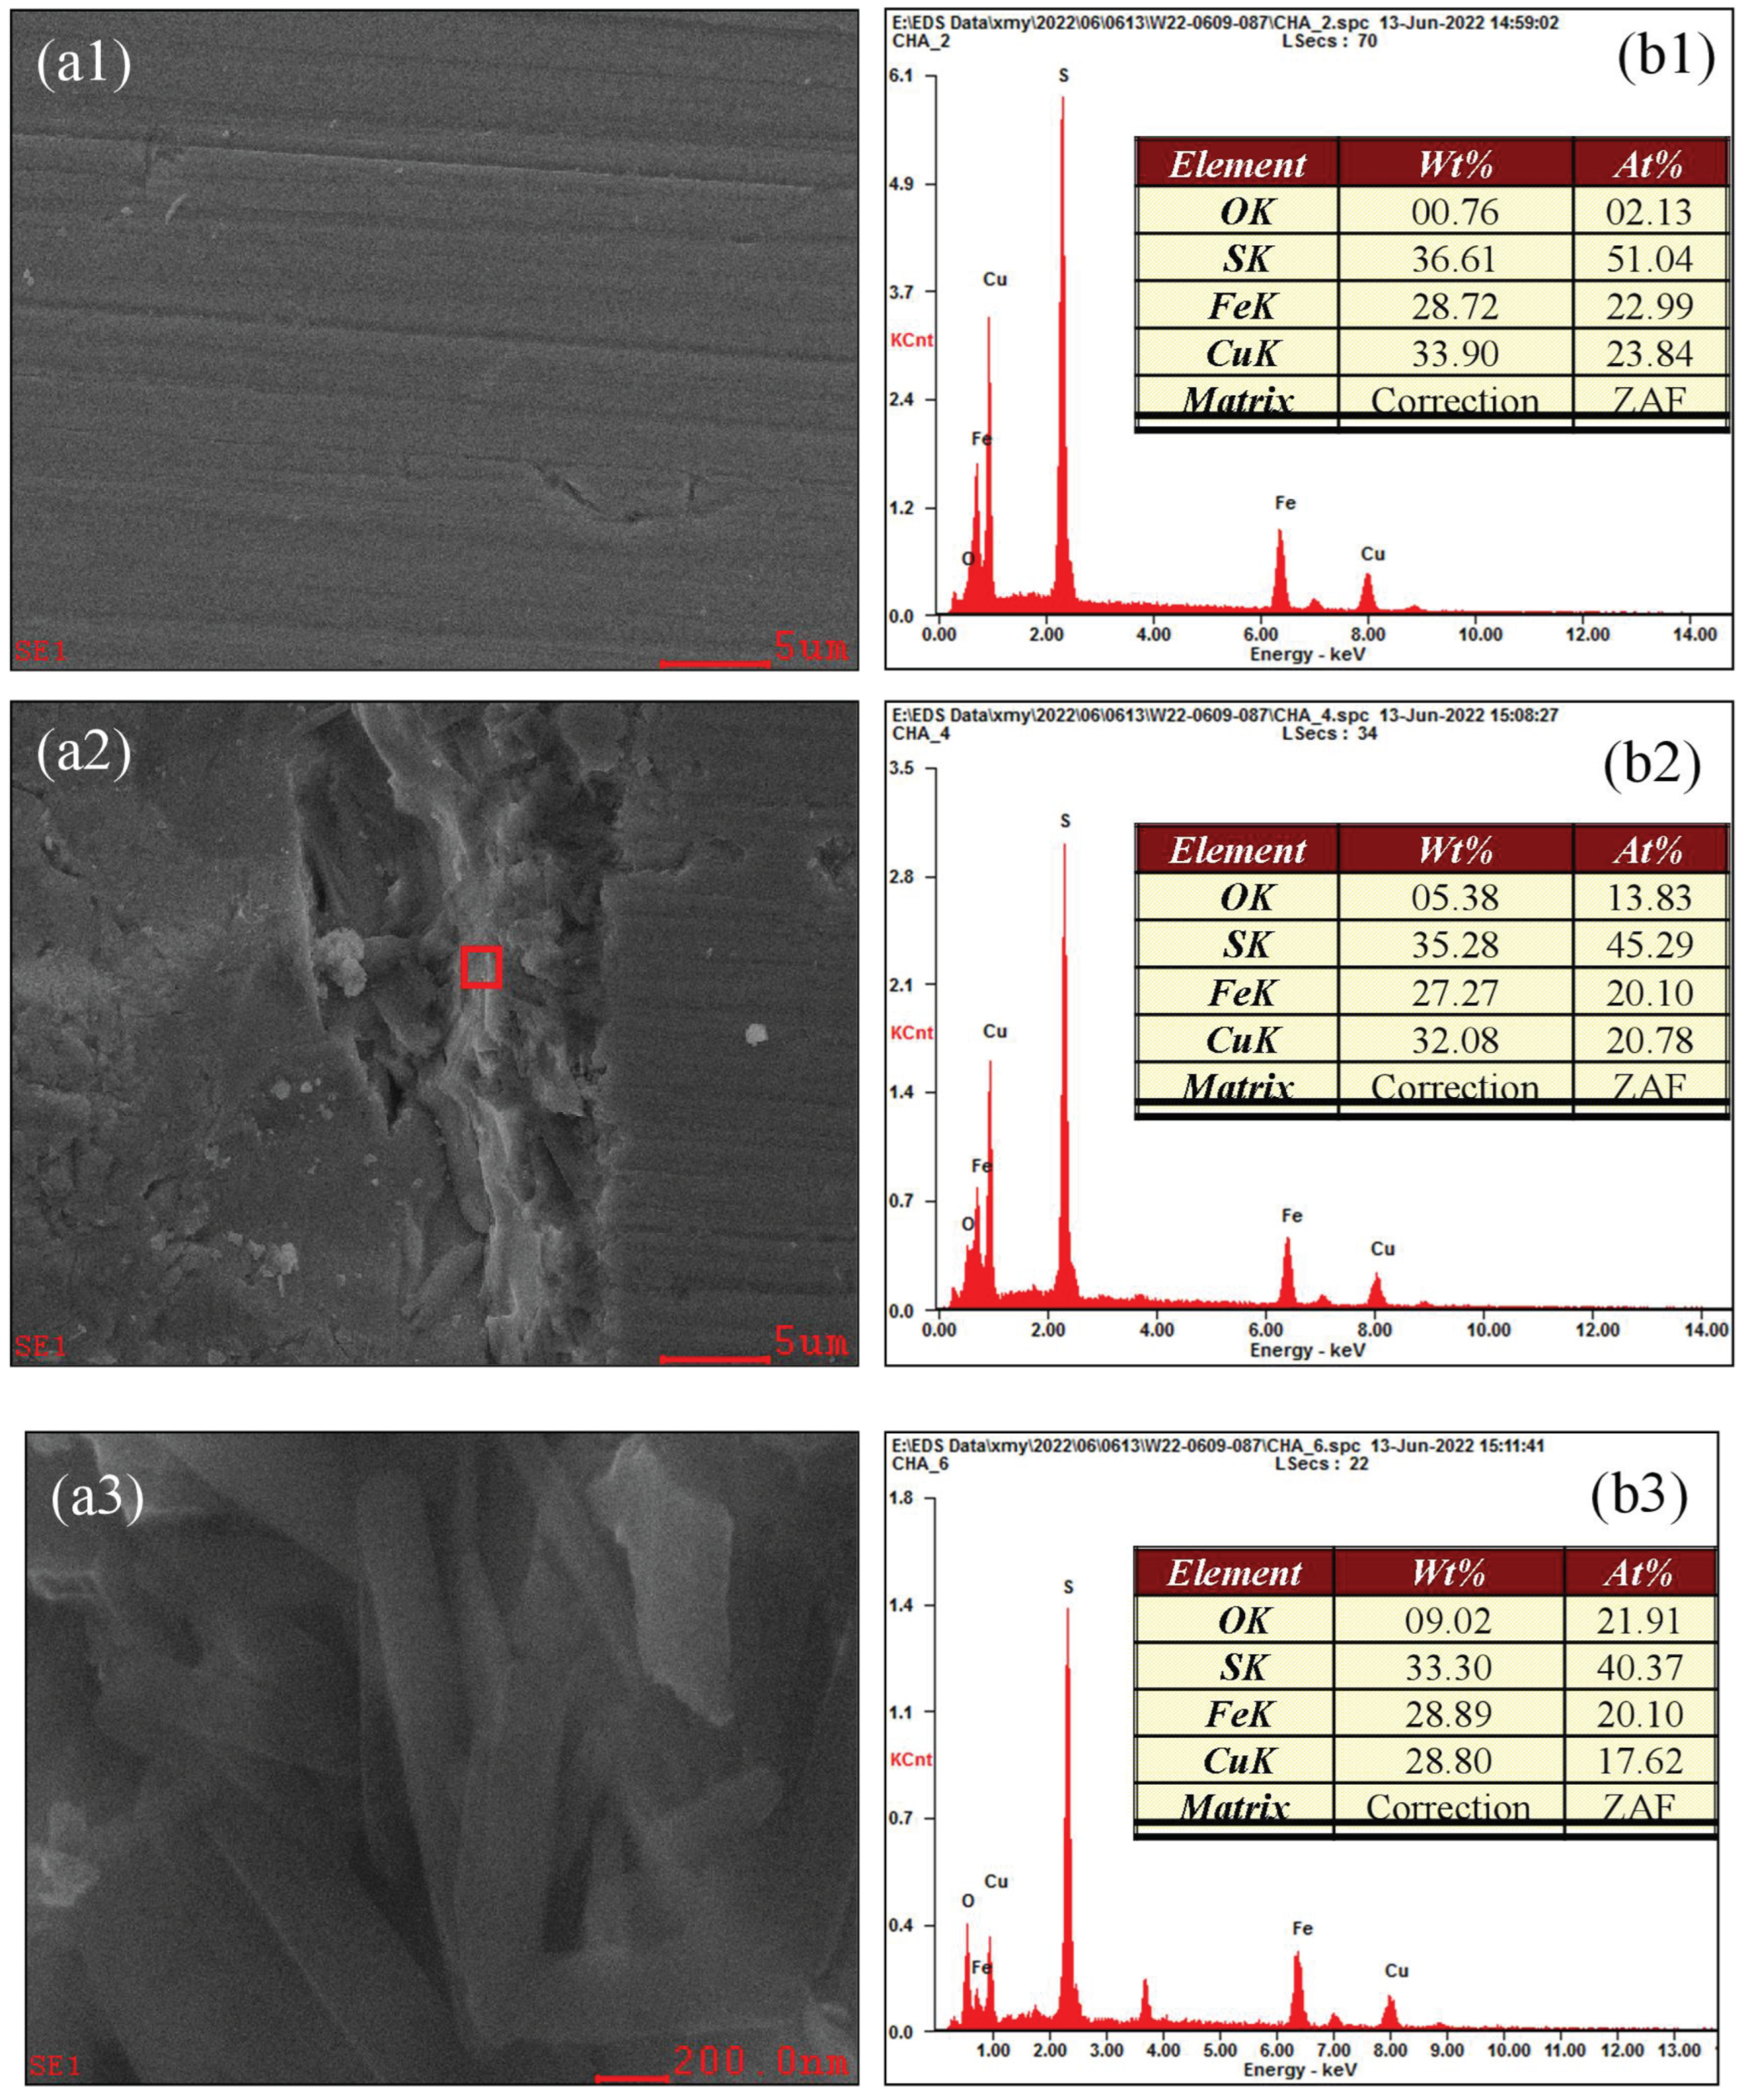
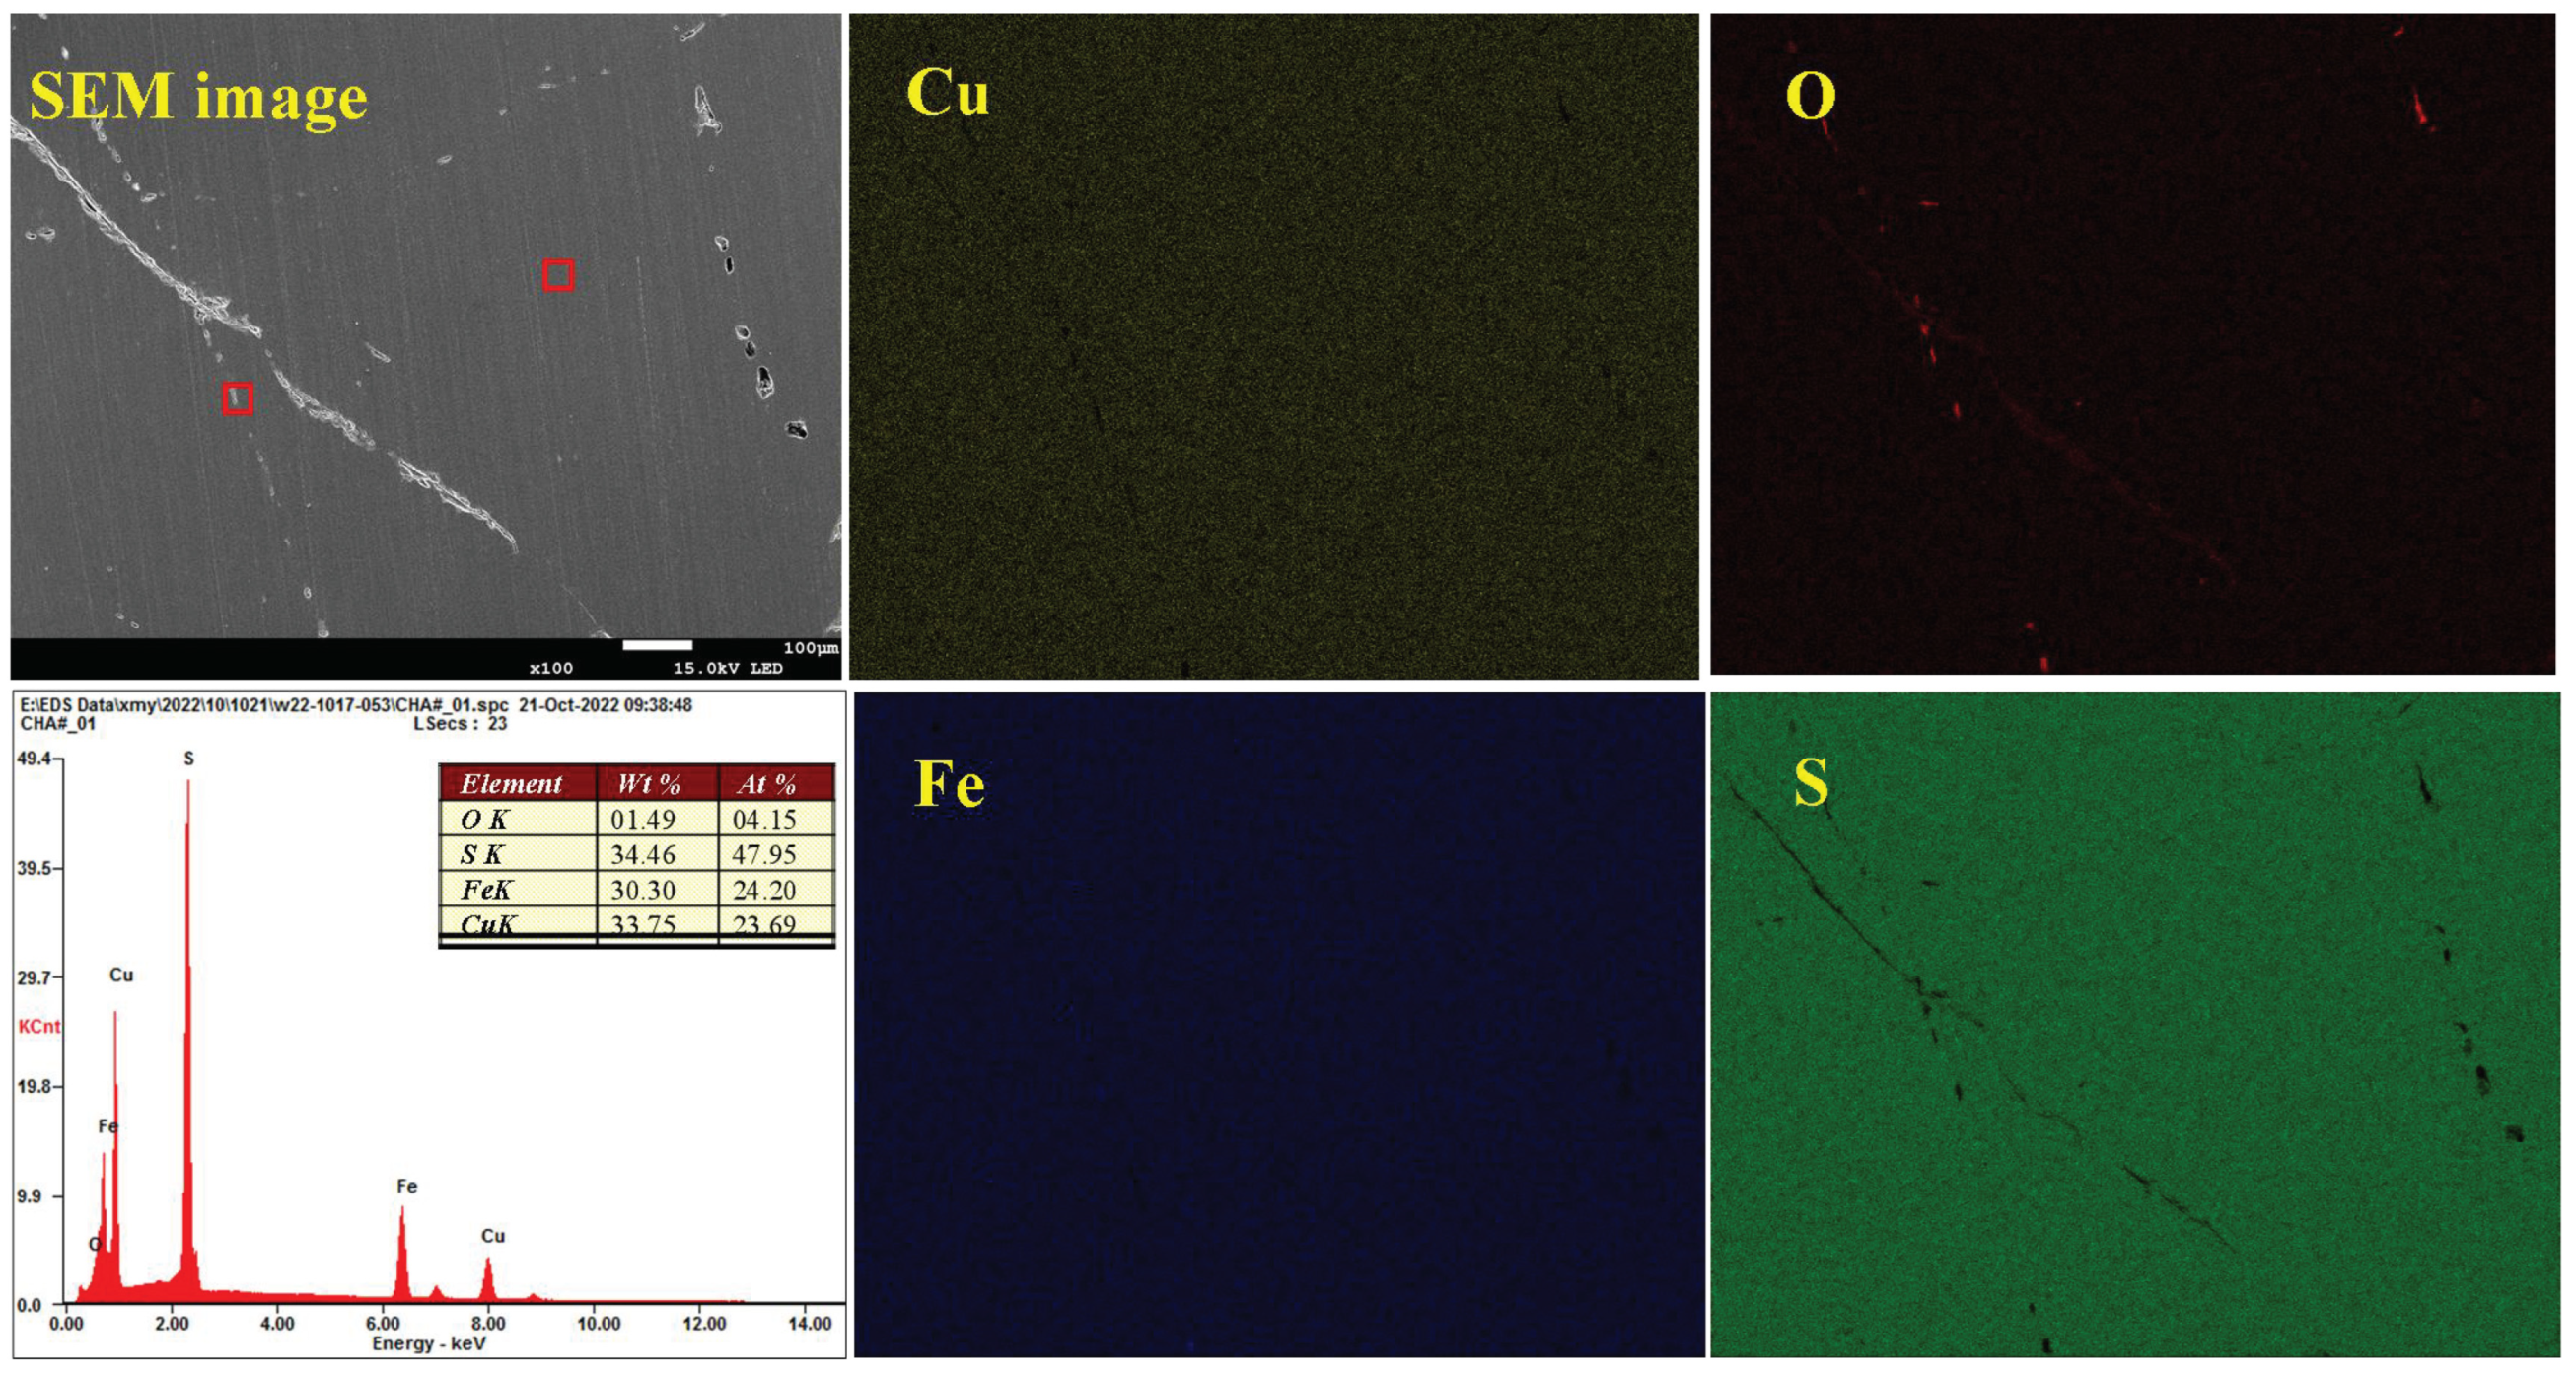
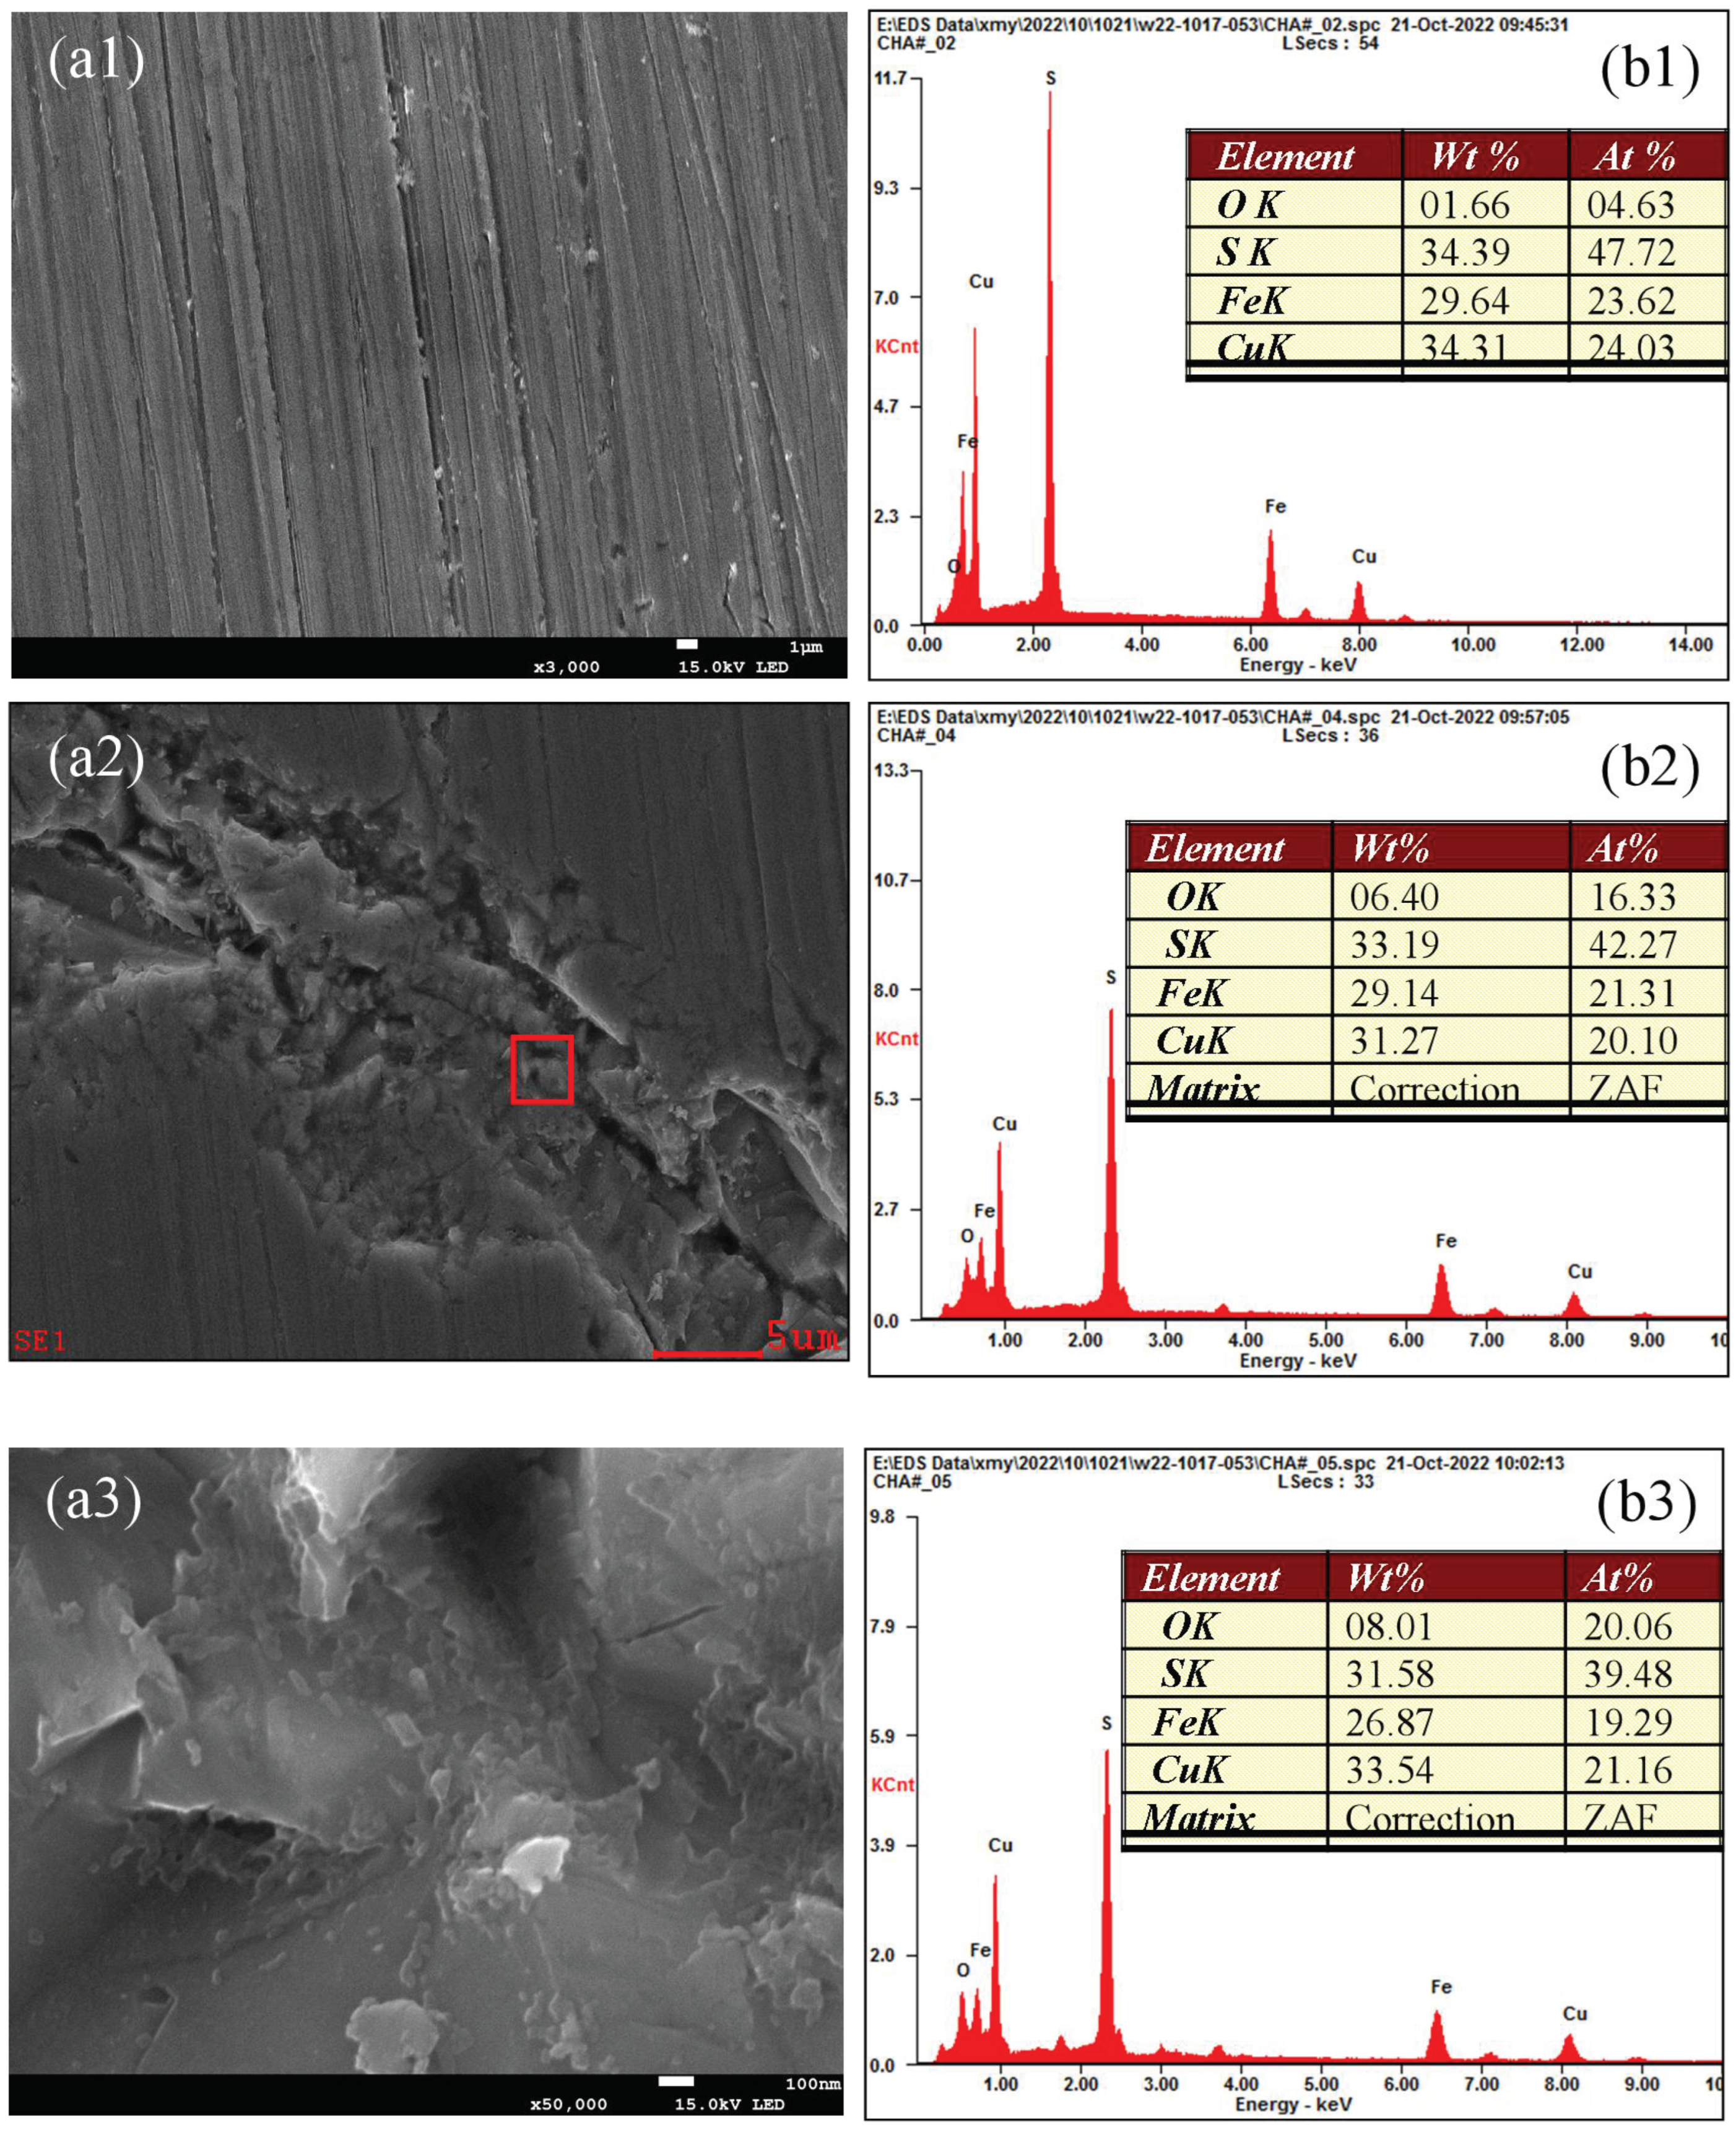
The SEM-EDS results further prove that the surface oxidation–corrosion of chalcopyrite is uneven, while significant corrosion occurs in strongly oxidized areas, demonstrating that surface oxidation occurs accompanied with corrosion and they promote each other.
(6)
The hierarchical oxidation-asymmetric corrosion model of chalcopyrite is firstly proposed and established in this study.

Author Contributions

Methodology, C.W., Y.H., X.X., W.S. and X.T.; formal analysis, Y.W., R.L., C.W. and X.T.; investigation, R.L., Y.W., Y.H., X.X. and W.S.; resources, Y.H. and X.X.; writing—original draft preparation, Y.W. and C.W.; writing—review and editing, Y.W.; visualization, C.W.; supervision, X.T.; funding acquisition, R.L. and W.S. All authors have read and agreed to the published version of the manuscript.

Funding

The authors acknowledge financial support from the National Natural Science Foundation of China (Grant Nos. 52404287; Nos. 52174272); the Fundamental Research Funds for the Central Universities of Central South University (Grant Nos. 2024ZZTS0653); the Open Found of Key Laboratory of Nonferrous Metal Reinforced Metallurgy New Technology(Grant Nos. YSQH-ZD-24010); the Yunnan Fundamental Research Projects (No. 202501CF070161).

Data Availability Statement

Data are contained within the article.

Conflicts of Interest

The authors declare no conflict of interest.

References

  1. Dong, L.; Cui, Y.; Qiao, L.; Lan, S.; Zheng, Q.; Shen, P.; Liu, D. A critical review on the flotation of calcium-containing minerals. Sep. Purif. Technol. 2025, 360, 131082. [Google Scholar] [CrossRef]
  2. Mweene, L.; Chipili, C.; Munganyinka, J.P.; Khanal, G.P.; Sankaran, S.; Kim, H.; Filippov, L. Experimental, benchmarks and theoretical investigations into the complexation of chalcopyrite and silica with guar gum and beneficiation of a siliceous copper ore using polyethylene oxide as a silica depressant. Miner. Eng. 2024, 216, 108874. [Google Scholar] [CrossRef]
  3. Zheng, Q.; Dong, L.; Shen, P.; Liu, D. A novel oxidation reagent scheme to realize efficient flotation separation of chalcopyrite and pyrrhotite. Appl. Surf. Sci. 2025, 693, 162794. [Google Scholar] [CrossRef]
  4. Sun, X.; Huang, L.; Wu, D.; Tong, X.; Yang, S.; Hu, B. The selective depression effect of dextrin on pyrite during the Zn–Fe sulfides flotation under low alkaline conditions. Colloids Surf. A Physicochem. Eng. Asp. 2022, 650, 129573. [Google Scholar] [CrossRef]
  5. Abraitis, P.K.; Pattrick, R.A.D.; Vaughan, D.J. Variations in the compositional, textural and electrical properties of natural pyrite: A review. Int. J. Miner. Process. 2004, 74, 41–59. [Google Scholar] [CrossRef]
  6. Owusu, C.; Addai-Mensah, J.; Fornasiero, D.; Zanin, M. Estimating the electrochemical reactivity of pyrite ores-their impact on pulp chemistry and chalcopyrite flotation behaviour. Adv. Powder Technol. 2013, 24, 801–809. [Google Scholar] [CrossRef]
  7. Chimonyo, W.; Corin, K.C.; Wiese, J.G.; O’Connor, C.T. Redox potential control during flotation of a sulphide mineral ore. Miner. Eng. 2017, 110, 57–64. [Google Scholar] [CrossRef]
  8. Ran, J.; Qiu, X.; Hu, Z.; Liu, Q.; Song, B.; Yao, Y. Enhance flotation separation of arsenopyrite and pyrite by low-temperature oxygen plasma surface modification. Appl. Surf. Sci. 2019, 480, 1136–1146. [Google Scholar] [CrossRef]
  9. Zhang, L.; Peng, W.; Wang, W.; Cao, Y.; Qi, M.; Huang, Y. A green method for selective separation of molybdenite and pyrite via electrochemical oxidation pretreatment-flotation and its mechanism. Colloids Surf. A Physicochem. Eng. Asp. 2024, 687, 133508. [Google Scholar] [CrossRef]
  10. Forson, P.; Zanin, M.; Skinner, W.; Asamoah, R. Differential flotation of pyrite and Arsenopyrite: Effect of pulp aeration and the critical importance of collector concentration. Miner. Eng. 2022, 178, 107421. [Google Scholar] [CrossRef]
  11. Li, H.; Yang, C.; Qin, W.; Tian, Z.; Wu, C.; Wei, Q.; Jiao, F. In situ Raman investigation of dissolved constituent and its evolution in pulp during Zn-S selective flotation with two-step pulp regulation. Miner. Eng. 2023, 192, 107994. [Google Scholar]
  12. Lei, D.; Wu, Z.; Zhang, Y.; Zhang, Y.; Zhang, J.; Xue, J.; Peng, X.; Wang, Y. New insight into the inevitable oxidation-dissolution behavior of MoS2 at humid environments: Unexpected persistent generation of hydroxyl radicals. Sep. Purif. Technol. 2024, 332, 125800. [Google Scholar] [CrossRef]
  13. Kuang, J.; Zou, Z.; Huang, Z.; Liu, P.; Yuan, W.; Zhu, L. Surface dissolution of scheelite under different regulators and its effect on flotation behavior. Miner. Eng. 2021, 164, 106811. [Google Scholar] [CrossRef]
  14. Zhang, H.Y.; Cao, Q.B.; Yan, Y.; Zou, H.; Huang, X.G.; Liu, D.W. Flotation separation of galena and chalcopyrite by using hydroxyl radicals from an Fe2+/NaClO system as depressants. Appl. Surf. Sci. 2025, 686, 162128. [Google Scholar] [CrossRef]
  15. Zhu, H.Y.; Ke, B.L.; Lei, L.; Wan, J.H.; Feng, H.Y.; Yao, L.Y. Insight into the effect of ultrasonic treatment on surface properties and flotation behavior of chalcopyrite after galvanic corrosion of grinding media and chalcopyrite. Mater. Today Commun. 2024, 41, 110745. [Google Scholar] [CrossRef]
  16. Zheng, H.; Zhang, G.; Li, C.; Li, B.; Ye, G. The surface dissolution process of smithsonite and its effect on flotation behaviour. Colloids Surf. A Physicochem. Eng. Asp. 2023, 676, 132118. [Google Scholar] [CrossRef]
  17. Wang, C.; Liu, R.; Zhai, Q.; Dong, W.; Xie, Z.; Sun, W.; Hu, W. Prospects of pulp aeration for the cleaner production of pyrrhotite-rich type copper sulfide ore: Mechanism and application. J. Clean. Prod. 2023, 406, 136921. [Google Scholar] [CrossRef]
  18. Pratt, A.; Muir, I.; Nesbitt, H. X-ray photoelectron and Auger electron spectroscopic studies of pyrrhotite and mechanism of air oxidation. Geochim. Cosmochim. Acta 1994, 58, 827–841. [Google Scholar]
  19. Moses, C.O.; Nordstrom, D.K.; Herman, J.S.; Mills, A.L. Aqueous pyrite oxidation by dissolved oxygen and by ferric iron. Geochim. Cosmochim. Acta 1987, 51, 1561–1571. [Google Scholar]
  20. Jiang, K.; Liu, J.; Wang, Y.; Zhang, D.J.; Han, Y.X. Surface properties and flotation inhibition mechanism of air oxidation on pyrite and arsenopyrite. Appl. Surf. Sci. 2023, 610, 155476. [Google Scholar] [CrossRef]
  21. Goryachev, B.E.; Nikolaev, A.A.; Lyakisheva, L.N. Electrochemistry of galena oxidation as the basis for optimization of agent modes in flotation of polymetallic ores. J. Mining Sci. 2010, 46, 681–689. [Google Scholar] [CrossRef]
  22. Peng, W.J.; Liu, S.G.; Cao, Y.J.; Wang, W.; Lv, S.; Huang, Y.K. A novel approach for selective flotation separation of chalcopyrite and molybdenite—Electrocatalytic oxidation pretreatment and its mechanism. Appl. Surf. Sci. 2022, 597, 153753. [Google Scholar] [CrossRef]
  23. Tolley, W.; Kotlyar, D.; Van Wagoner, R. Fundamental electrochemical studies of sulfide mineral flotation. Miner. Eng. 1996, 9, 603–637. [Google Scholar] [CrossRef]
  24. Pashkevich, D.; Li, R.H.; Kökkiliç, O.; Waters, K.E. Investigations of Monomineralic Flotation of Galena, Sphalerite, and Pyrite at Different Temperatures. Minerals 2023, 13, 615. [Google Scholar] [CrossRef]
  25. Hu, Y.; Wu, M.; Liu, R.; Sun, W. A review on the electrochemistry of galena flotation. Miner. Eng. 2020, 150, 106272. [Google Scholar] [CrossRef]
  26. Hayes, R.A.; Ralston, J. The collectorless flotation and separation of sulphide minerals by Eh control. Int. J. Miner. Process. 1988, 23, 55–84. [Google Scholar] [CrossRef]
  27. Owusu, C.; Fornasiero, D.; Addai-Mensah, J.; Zanin, M. Influence of pulp aeration on the flotation of chalcopyrite with xanthate in chalcopyrite/pyrite mixtures. Int. J. Miner. Process. 2015, 134, 50–57. [Google Scholar] [CrossRef]
  28. Lin, S.; Liu, R.; Bu, Y.; Wang, C.; Wang, L.; Sun, W.; Hu, Y. Oxidative depression of arsenopyrite by using calcium hypochlorite and sodium humate. Minerals 2018, 8, 463. [Google Scholar] [CrossRef]
  29. Kim, R.; Ghahreman, A. The effect of ore mineralogy on the electrochemical gold dissolution behavior in various cyanide and oxygen concentrations; Effect of sulfidic ores containing heavy metals. Hydrometallurgy 2019, 184, 75–87. [Google Scholar] [CrossRef]
  30. Dimitrijevic, M.; Antonijevic, M.M.; Dimitrijevic, V. Investigation of the kinetics of pyrite oxidation by hydrogen peroxide in hydrochloric acid solutions. Miner. Eng. 1999, 12, 165–174. [Google Scholar] [CrossRef]
  31. Luo, Q.; Shi, Q.; Liu, D.; Li, B.; Jin, S. Effect of deep oxidation of chalcopyrite on surface properties and flotation performance. Int. J. Mining Sci. Technol. 2022, 32, 907–914. [Google Scholar] [CrossRef]
  32. Goh, S.W.; Buckley, A.N.; Lamb, R.N.; Rosenberg, R.A.; Moran, D. The oxidation states of copper and iron in mineral sulfides, and the oxides formed on initial exposure of chalcopyrite and bornite to air. Geochim. Cosmochim. Acta 2006, 70, 2210–2228. [Google Scholar]
  33. Pearce, C.; Pattrick, R.; Vaughan, D.; Henderson, C.; Van der Laan, G. Copper oxidation state in chalcopyrite: Mixed Cu d9 and d10 characteristics. Geochim. Cosmochim. Acta 2006, 70, 4635–4642. [Google Scholar]
  34. Kalegowda, Y.; Chan, Y.-L.; Wei, D.-H.; Harmer, S.L. X-PEEM, XPS and ToF-SIMS characterisation of xanthate induced chalcopyrite flotation: Effect of pulp potential. Surf. Sci. 2015, 635, 70–77. [Google Scholar] [CrossRef]
  35. Smart, R.S.C. Surface layers in base metal sulphide flotation. Miner. Eng. 1991, 4, 891–909. [Google Scholar] [CrossRef]
  36. Mielczarski, J.; Cases, J.; Alnot, M.; Ehrhardt, J. XPS characterization of chalcopyrite, tetrahedrite, and tennantite surface products after different conditioning. 2. Amyl xanthate solution at pH 10. Langmuir 1996, 12, 2531–2543. [Google Scholar]
  37. Mycroft, J.R.; Nesbitt, H.W.; Pratt, A.R. X-ray photoelectron and Auger electron spectroscopy of air-oxidized pyrrhotite: Distribution of oxidized species with depth. Geochim. Cosmochim. Acta 1995, 59, 721–733. [Google Scholar]
  38. Sun, W.; Dai, S.; Zhang, H.; Chen, Y.; Yu, X.; Li, P.; Liu, W. Selective flotation of chalcopyrite from galena using a novel collector benzoic diethylcarbamothioic thioanhydride: An experimental and theoretical investigation. J. Mol. Liq. 2022, 365, 120027. [Google Scholar] [CrossRef]
  39. Suyantara, G.P.W.; Semoto, Y.; Miki, H.; Hirajima, T.; Sasaki, K.; Ochi, D.; Aoki, Y.; Berdakh, D.; Ura, K. Effect of sodium metabisulfite and slaked lime on the floatability and surface properties of chalcopyrite. Powder Technol. 2022, 408, 117750. [Google Scholar] [CrossRef]
  40. Capece, F.; Di Castro, V.; Furlani, C.; Mattogno, G.; Fragale, C.; Gargano, M.; Rossi, M. “Copper chromite” catalysts: XPS structure elucidation and correlation with catalytic activity. J. Electron Spectrosc. Relat. Phenom. 1982, 27, 119–128. [Google Scholar]
  41. Nesbitt, H.W.; Muir, I.J. X-ray photoelectron spectroscopic study of a pristine pyrite surface reacted with water vapour and air. Geochim. Cosmochim. Acta 1994, 58, 4667–4679. [Google Scholar] [CrossRef]
  42. Buckley, A.N.; Woods, R. An X-ray photoelectron spectroscopic study of the oxidation of chalcopyrite. Aust. J. Chem. 1984, 37, 2403–2413. [Google Scholar]
  43. Suyantara, G.P.W.; Hirajima, T.; Miki, H.; Sasaki, K.; Yamane, M.; Takida, E.; Kuroiwa, S.; Imaizumi, Y. Selective flotation of chalcopyrite and molybdenite using H2O2 oxidation method with the addition of ferrous sulfate. Miner. Eng. 2018, 122, 312–326. [Google Scholar] [CrossRef]
  44. Zhong, C.; Feng, B.; Zhang, W.; Zhang, L.; Guo, Y.; Wang, T.; Wang, H. The role of sodium alginate in the flotation separation of apatite and dolomite. Powder Technol. 2020, 373, 620–626. [Google Scholar]
  45. Yuan, D.; Cadien, K.; Liu, Q.; Zeng, H. Adsorption characteristics and mechanisms of O-Carboxymethyl chitosan on chalcopyrite and molybdenite. J. Colloid Interface Sci. 2019, 552, 659–670. [Google Scholar] [CrossRef]
  46. Suyantara, G.P.W.; Hirajima, T.; Miki, H.; Sasaki, K.; Kuroiwa, S.; Aoki, Y. Effect of H2O2 and potassium amyl xanthate on separation of enargite and tennantite from chalcopyrite and bornite using flotation. Miner. Eng. 2020, 152, 106371. [Google Scholar] [CrossRef]
  47. Farquhar, M.L.; Wincott, P.L.; Wogelius, R.A.; Vaughan, D.J. Electrochemical oxidation of the chalcopyrite surface: An XPS and AFM study in solution at pH 4. Appl. Surf. Sci. 2003, 218, 34–43. [Google Scholar]
  48. Mielczarski, J.; Cases, J.; Alnot, M.; Ehrhardt, J. XPS characterization of chalcopyrite, tetrahedrite, and tennantite surface products after different conditioning. 1. Aqueous solution at pH 10. Langmuir 1996, 12, 2519–2530. [Google Scholar]
  49. Goldhaber, M.B. Experimental study of metastable sulfur oxyanion formation during pyrite oxidation at pH 6-9 and 30 degrees C. Am. J. Sci. 1983, 283, 193–217. [Google Scholar]
  50. Tu, Z.; Guo, C.; Zhang, T.; Lu, G.; Wan, J.; Liao, C.; Dang, Z. Investigation of intermediate sulfur species during pyrite oxidation in the presence and absence of Acidithiobacillus ferrooxidans. Hydrometallurgy 2017, 167, 58–65. [Google Scholar] [CrossRef]
  51. Xu, Y.; Schoonen, M.A.A. The stability of thiosulfate in the presence of pyrite in low-temperature aqueous solutions. Geochim. Cosmochim. Acta 1995, 59, 4605–4622. [Google Scholar] [CrossRef]
Figure 1. X-ray diffractometer spectra of chalcopyrite.
Minerals 15 00384 g001
Figure 2. Oxygen consumption behavior of chalcopyrite under different pH conditions: (a) line symbol, (b) contour map.
Minerals 15 00384 g002
Figure 3. Kinetic analysis of asymmetric oxidation–corrosion of chalcopyrite (F(aeration) = 100 mL/min): (a1,a2) without aeration and (b1,b2) with aeration (3D bars and column figure).
Minerals 15 00384 g003aMinerals 15 00384 g003b
Figure 4. High-resolution spectrum analysis of Cu 2p on the surface of chalcopyrite under different oxidation conditions.
Minerals 15 00384 g004
Figure 5. High-resolution spectrum analysis of Fe 2p on the surface of chalcopyrite under different oxidation conditions.
Minerals 15 00384 g005
Figure 6. High-resolution spectrum analysis of S 2p on the surface of chalcopyrite under different oxidation conditions.
Minerals 15 00384 g006
Figure 7. High-resolution spectrum analysis of O 1s on the surface of chalcopyrite under different oxidation conditions.
Minerals 15 00384 g007
Figure 8. Analysis of surface element content of chalcopyrite under different etching depths (pH = 9.0, F(aeration) = 100.00 mL/min).
Minerals 15 00384 g008
Figure 9. High-resolution spectrum analysis of Cu 2p on the surface of chalcopyrite under different etching depths.
Minerals 15 00384 g009
Figure 10. High-resolution spectrum analysis of Fe 2p on the surface of chalcopyrite under different etching depths.
Minerals 15 00384 g010
Figure 11. High-resolution spectrum analysis of S 2p on the surface of chalcopyrite under different etching depths.
Minerals 15 00384 g011
Figure 12. High-resolution spectrum analysis of O 1s on the surface of chalcopyrite under different etching depths.
Minerals 15 00384 g012
Figure 13. Distribution of surface elements and EDX spectra of chalcopyrite under acidic conditions.
Minerals 15 00384 g013
Figure 14. Oxidation morphology and EDX spectra of various microregions of chalcopyrite under acidic conditions.
Minerals 15 00384 g014
Figure 15. Distribution of elements and EDX spectra of chalcopyrite under neutral conditions.
Minerals 15 00384 g015
Figure 16. Oxidation morphology and EDX spectra of various microregions of chalcopyrite under neutral conditions.
Minerals 15 00384 g016
Figure 17. Distribution of elements and EDX spectra of chalcopyrite under alkaline conditions.
Minerals 15 00384 g017
Figure 18. Oxidation morphology and EDX spectra of various microregions of chalcopyrite under alkaline conditions.
Minerals 15 00384 g018
Figure 19. Hierarchical oxidation-asymmetric corrosion model of chalcopyrite.
Minerals 15 00384 g019
Table 1. Surface element content of chalcopyrite under different aeration conditions.
Aeration Flow
(mL/min)
DO
(mg/L)
pHAtom Content/%Fe/S
Ratio
Cu/S
Ratio
SOFeCu
0.000.002.029.5036.1016.6017.800.560.60
7.029.8036.2016.9017.100.570.57
12.022.5040.7017.9018.900.800.84
20.007.502.028.0037.7017.5016.800.630.60
7.027.1037.4018.5017.000.680.63
12.019.5041.8620.5018.141.050.93
100.0022.502.031.1334.1513.9520.760.450.67
7.026.3038.3418.2017.160.690.65
12.012.3049.4323.9014.371.941.17
Table 2. Content of Cu components on chalcopyrite surface under different oxidation conditions.
Aeration Flow
(mL/min)
pHContent/%
Cu(I)-SCu(II)-O
0.002.083.3316.67
7.081.3018.70
12.075.7624.24
20.002.084.0315.97
7.081.9718.03
12.075.2224.78
100.002.084.7515.25
7.078.7421.26
12.076.3423.66
Table 3. Content of Fe components on chalcopyrite surface under different oxidation conditions.
DO mg/LpHContent/%
Fe(III)-SFe(III)-OSulfate
7.502.020.2153.1926.60
7.507.016.4054.9128.69
7.5012.013.8755.8030.32
0.007.021.7658.8219.41
7.507.016.4054.9128.69
22.507.014.6652.3632.98
Table 4. Content of S components on chalcopyrite surface under different oxidation conditions.
DO mg/LpHContent/%
Monosulfide (S2−)Disulfide (S22−)Polysulfide (Sn2−)Sulfate (SO42−)
0.002.041.1540.0914.993.76
7.042.5538.3014.045.11
12.041.1839.0913.995.76
7.502.041.8440.1715.062.93
7.038.4241.6616.723.20
12.037.9539.6418.843.57
22.502.032.4743.2920.783.46
7.024.4444.4425.335.78
12.020.0747.3923.858.69
Table 5. Content of O components on chalcopyrite surface under different oxidation conditions.
DO mg/LpHContent/%
Me-OMe-OHH2OMe-OH/Me-O
0.002.034.0352.3613.611.54
7.023.9453.1922.872.22
12.017.9354.3527.723.03
7.502.032.0050.0018.001.56
7.022.1659.8817.962.70
12.017.2852.3630.373.03
22.502.029.7157.1413.141.92
7.019.2559.4821.273.08
12.019.3864.5018.133.71
Table 6. Analysis of Cu 2p composition on chalcopyrite surface at different etching depths.
Sputter Depth (nm)Content/%
Cu(I)-SCu(II)-O
3.092.507.50
2.092.008.00
1.092.008.00
0.092.008.00
Table 7. Analysis of Fe 2p composition on chalcopyrite surface at different etching depths.
Sputter Depth (nm)Content/%
Fe(III)-SFe(III)-OSulfate
3.073.6324.262.21
2.071.4325.712.86
1.063.9930.665.35
0.022.4451.37 26.19
Table 8. Analysis of S 2p composition on chalcopyrite surface at different etching depths.
Sputter Depth (nm)Content/%
Monosulfide (S2−)Disulfide (S22−)Polysulfide (Sn2−)
3.051.8134.7213.47
2.051.3335.1213.55
1.051.2334.3414.43
0.037.0041.6821.32
Table 9. Analysis of O 1s composition on chalcopyrite surface at different etching depths.
Sputter Depth (nm)Content/%
Me-OMe-OHH2O
3.039.5033.5027.00
2.036.4238.5325.05
1.033.7447.1419.12
0.023.3561.2815.37
Disclaimer/Publisher’s Note: The statements, opinions and data contained in all publications are solely those of the individual author(s) and contributor(s) and not of MDPI and/or the editor(s). MDPI and/or the editor(s) disclaim responsibility for any injury to people or property resulting from any ideas, methods, instructions or products referred to in the content.

