Identification of Lithium-Bearing Pegmatite Dikes Based on WorldView-3 Data: A Case Study of the Shaligou Area in Western Altyn

Abstract

1. Introduction
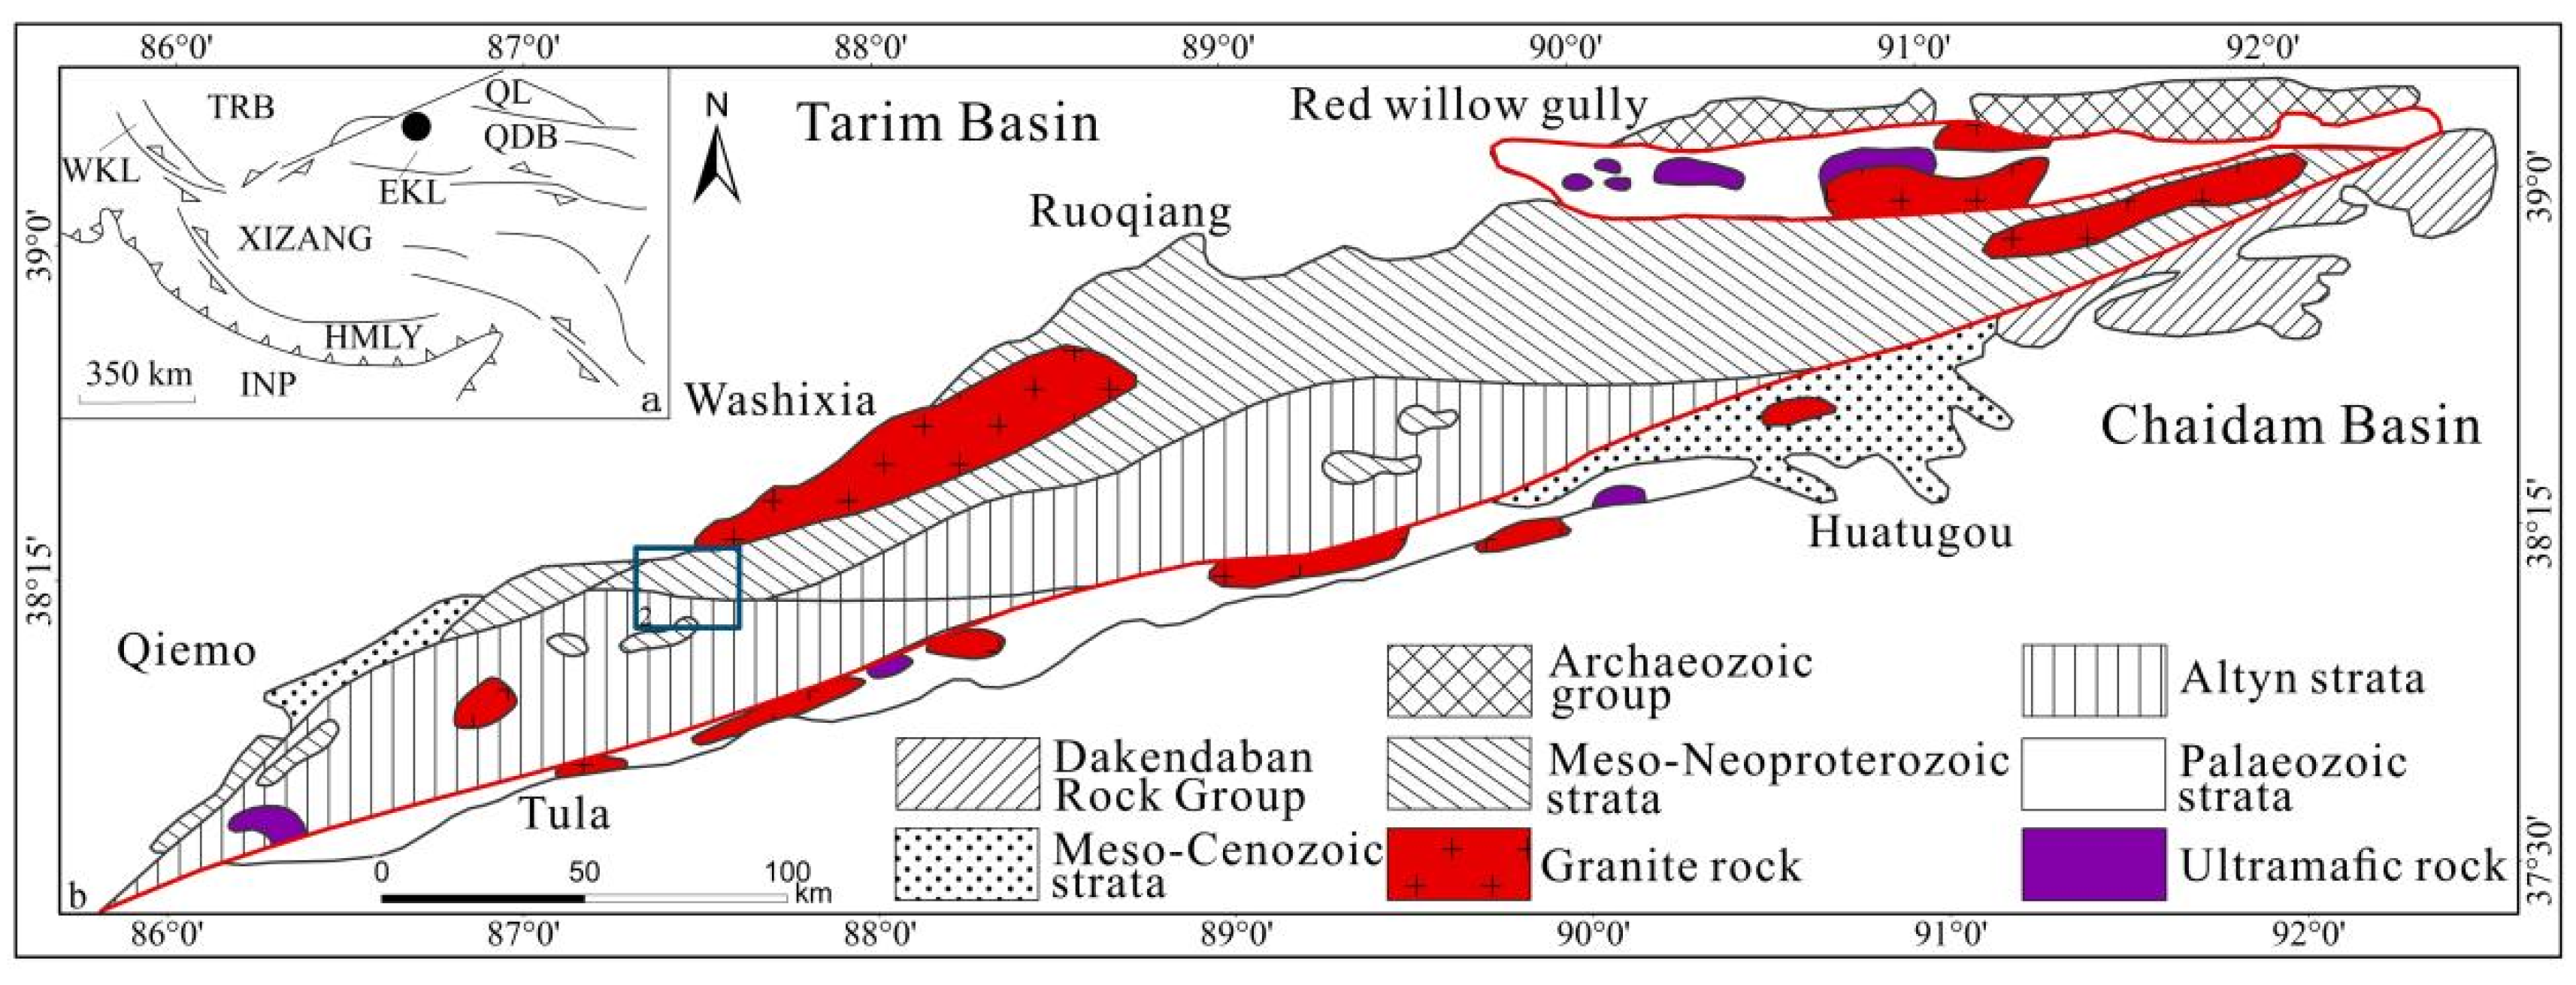
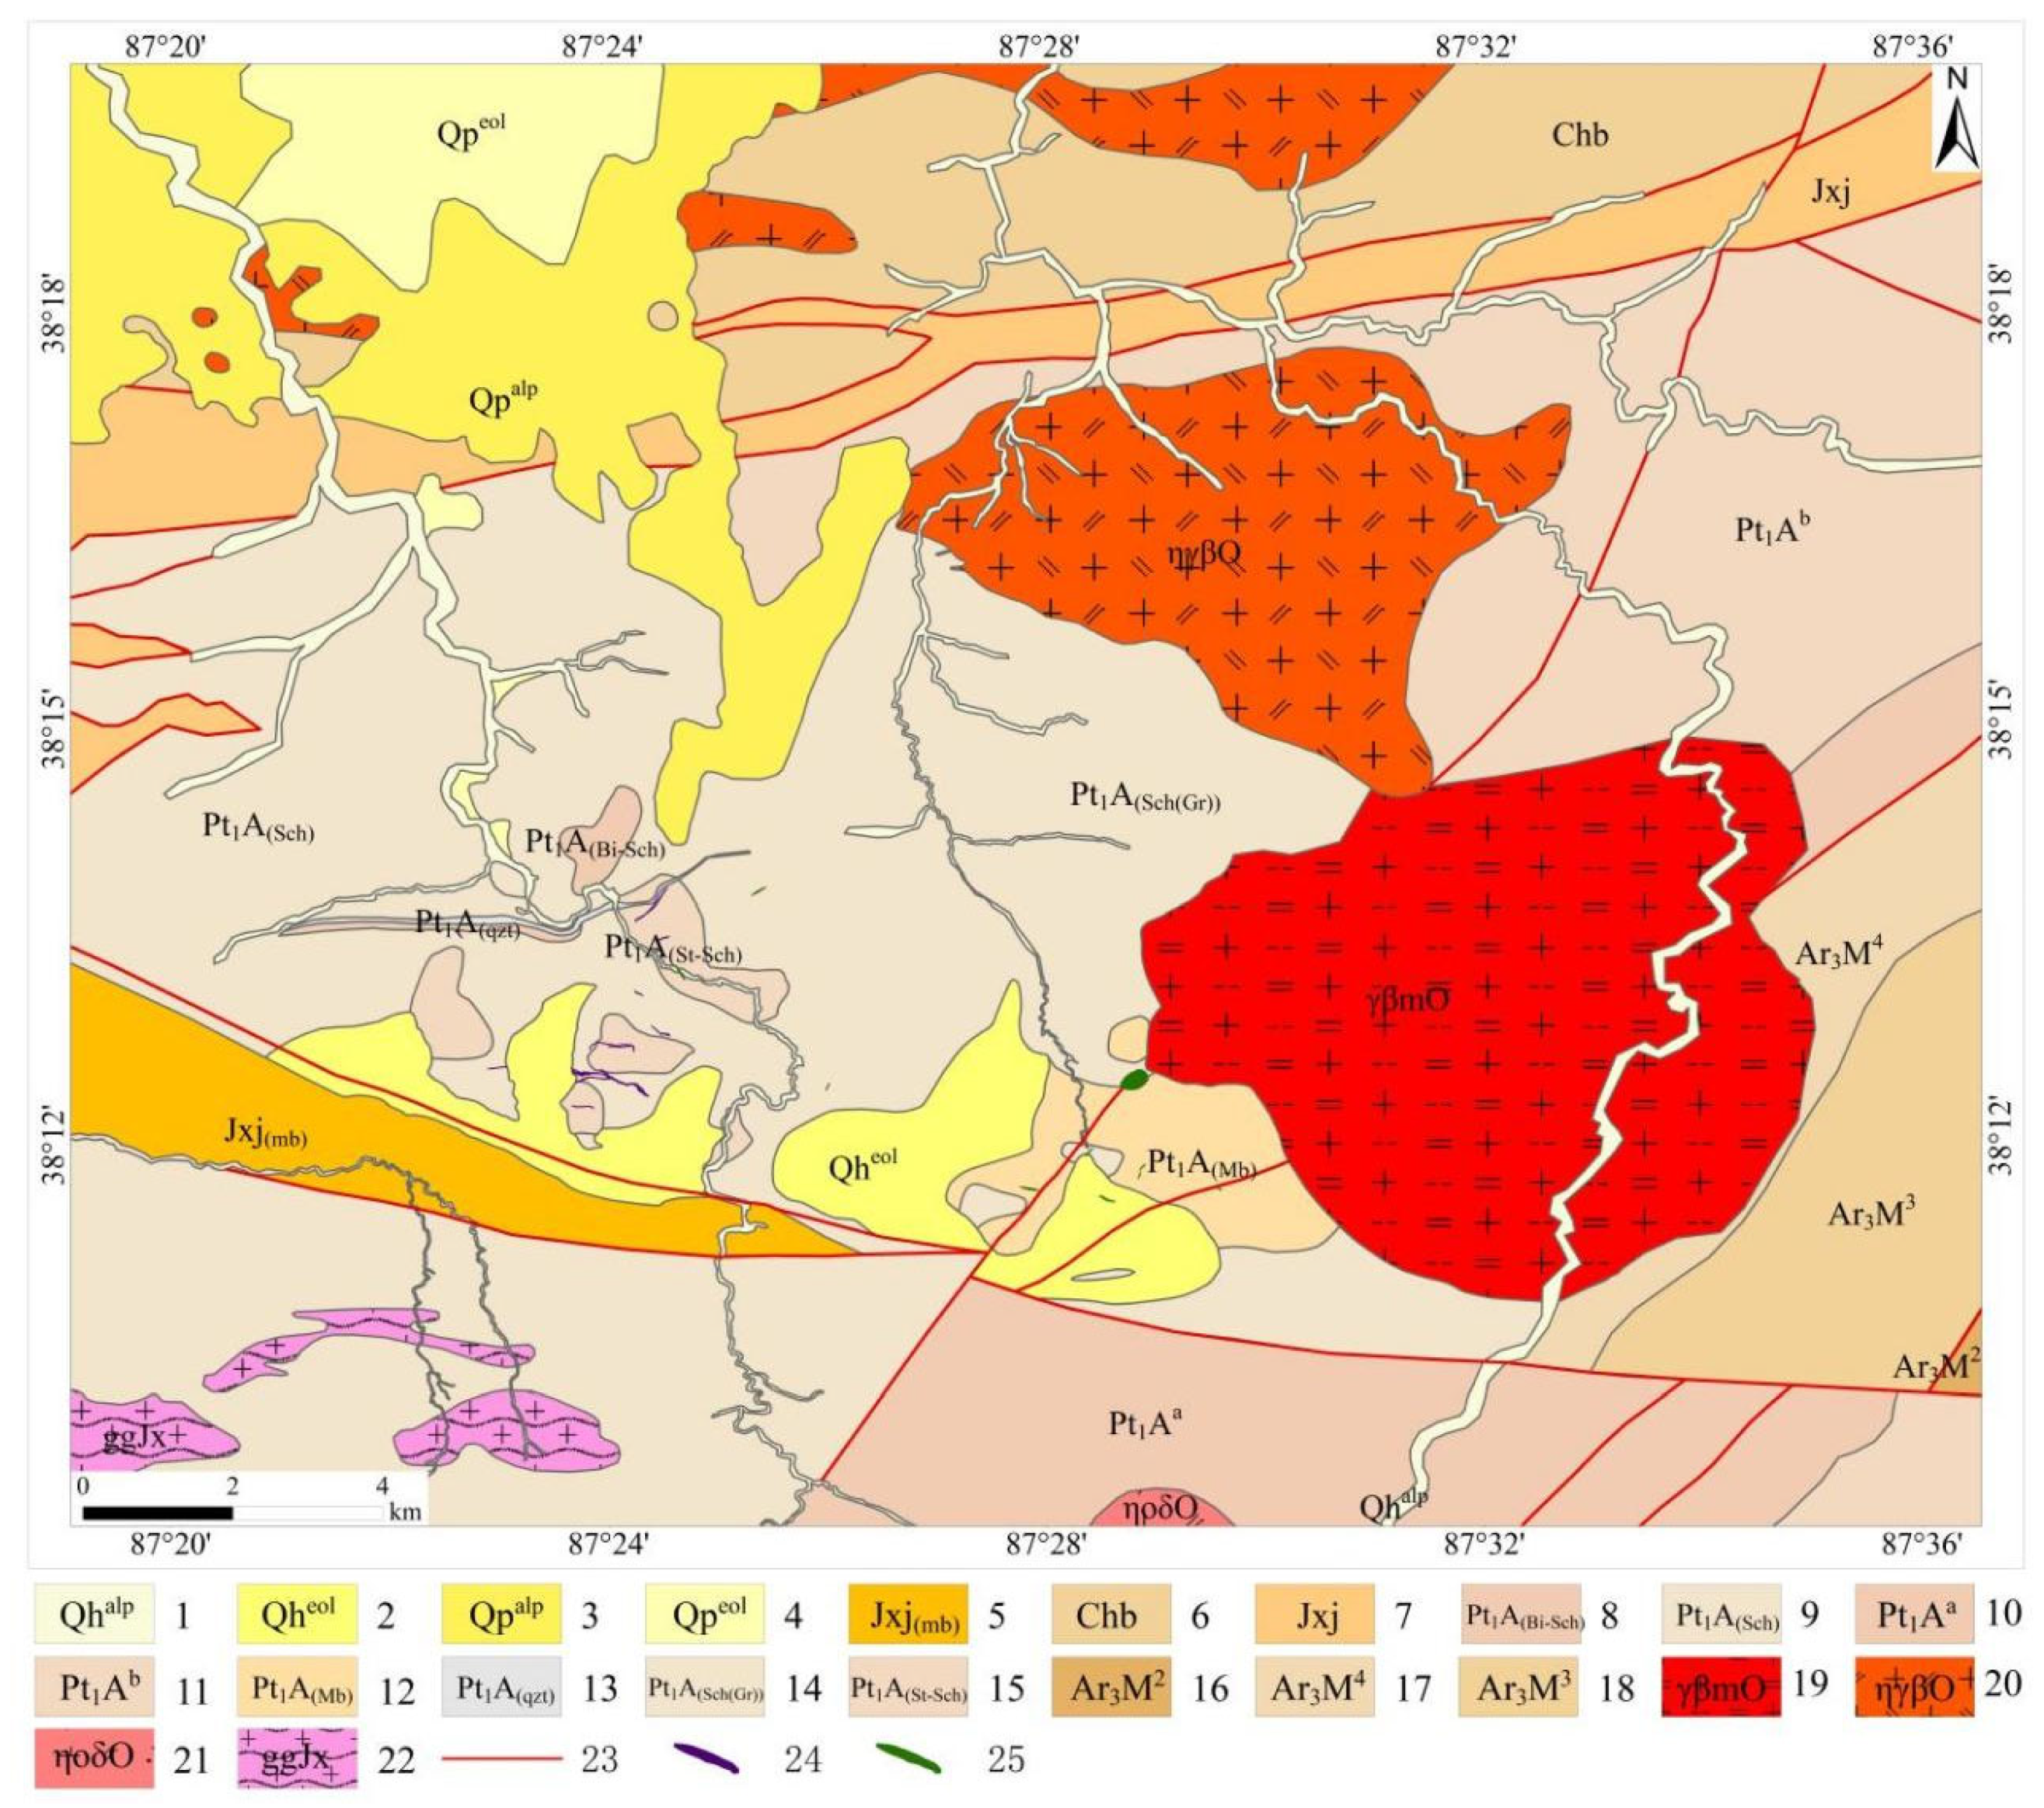
2. Regional Geology
3. Materials and Methods
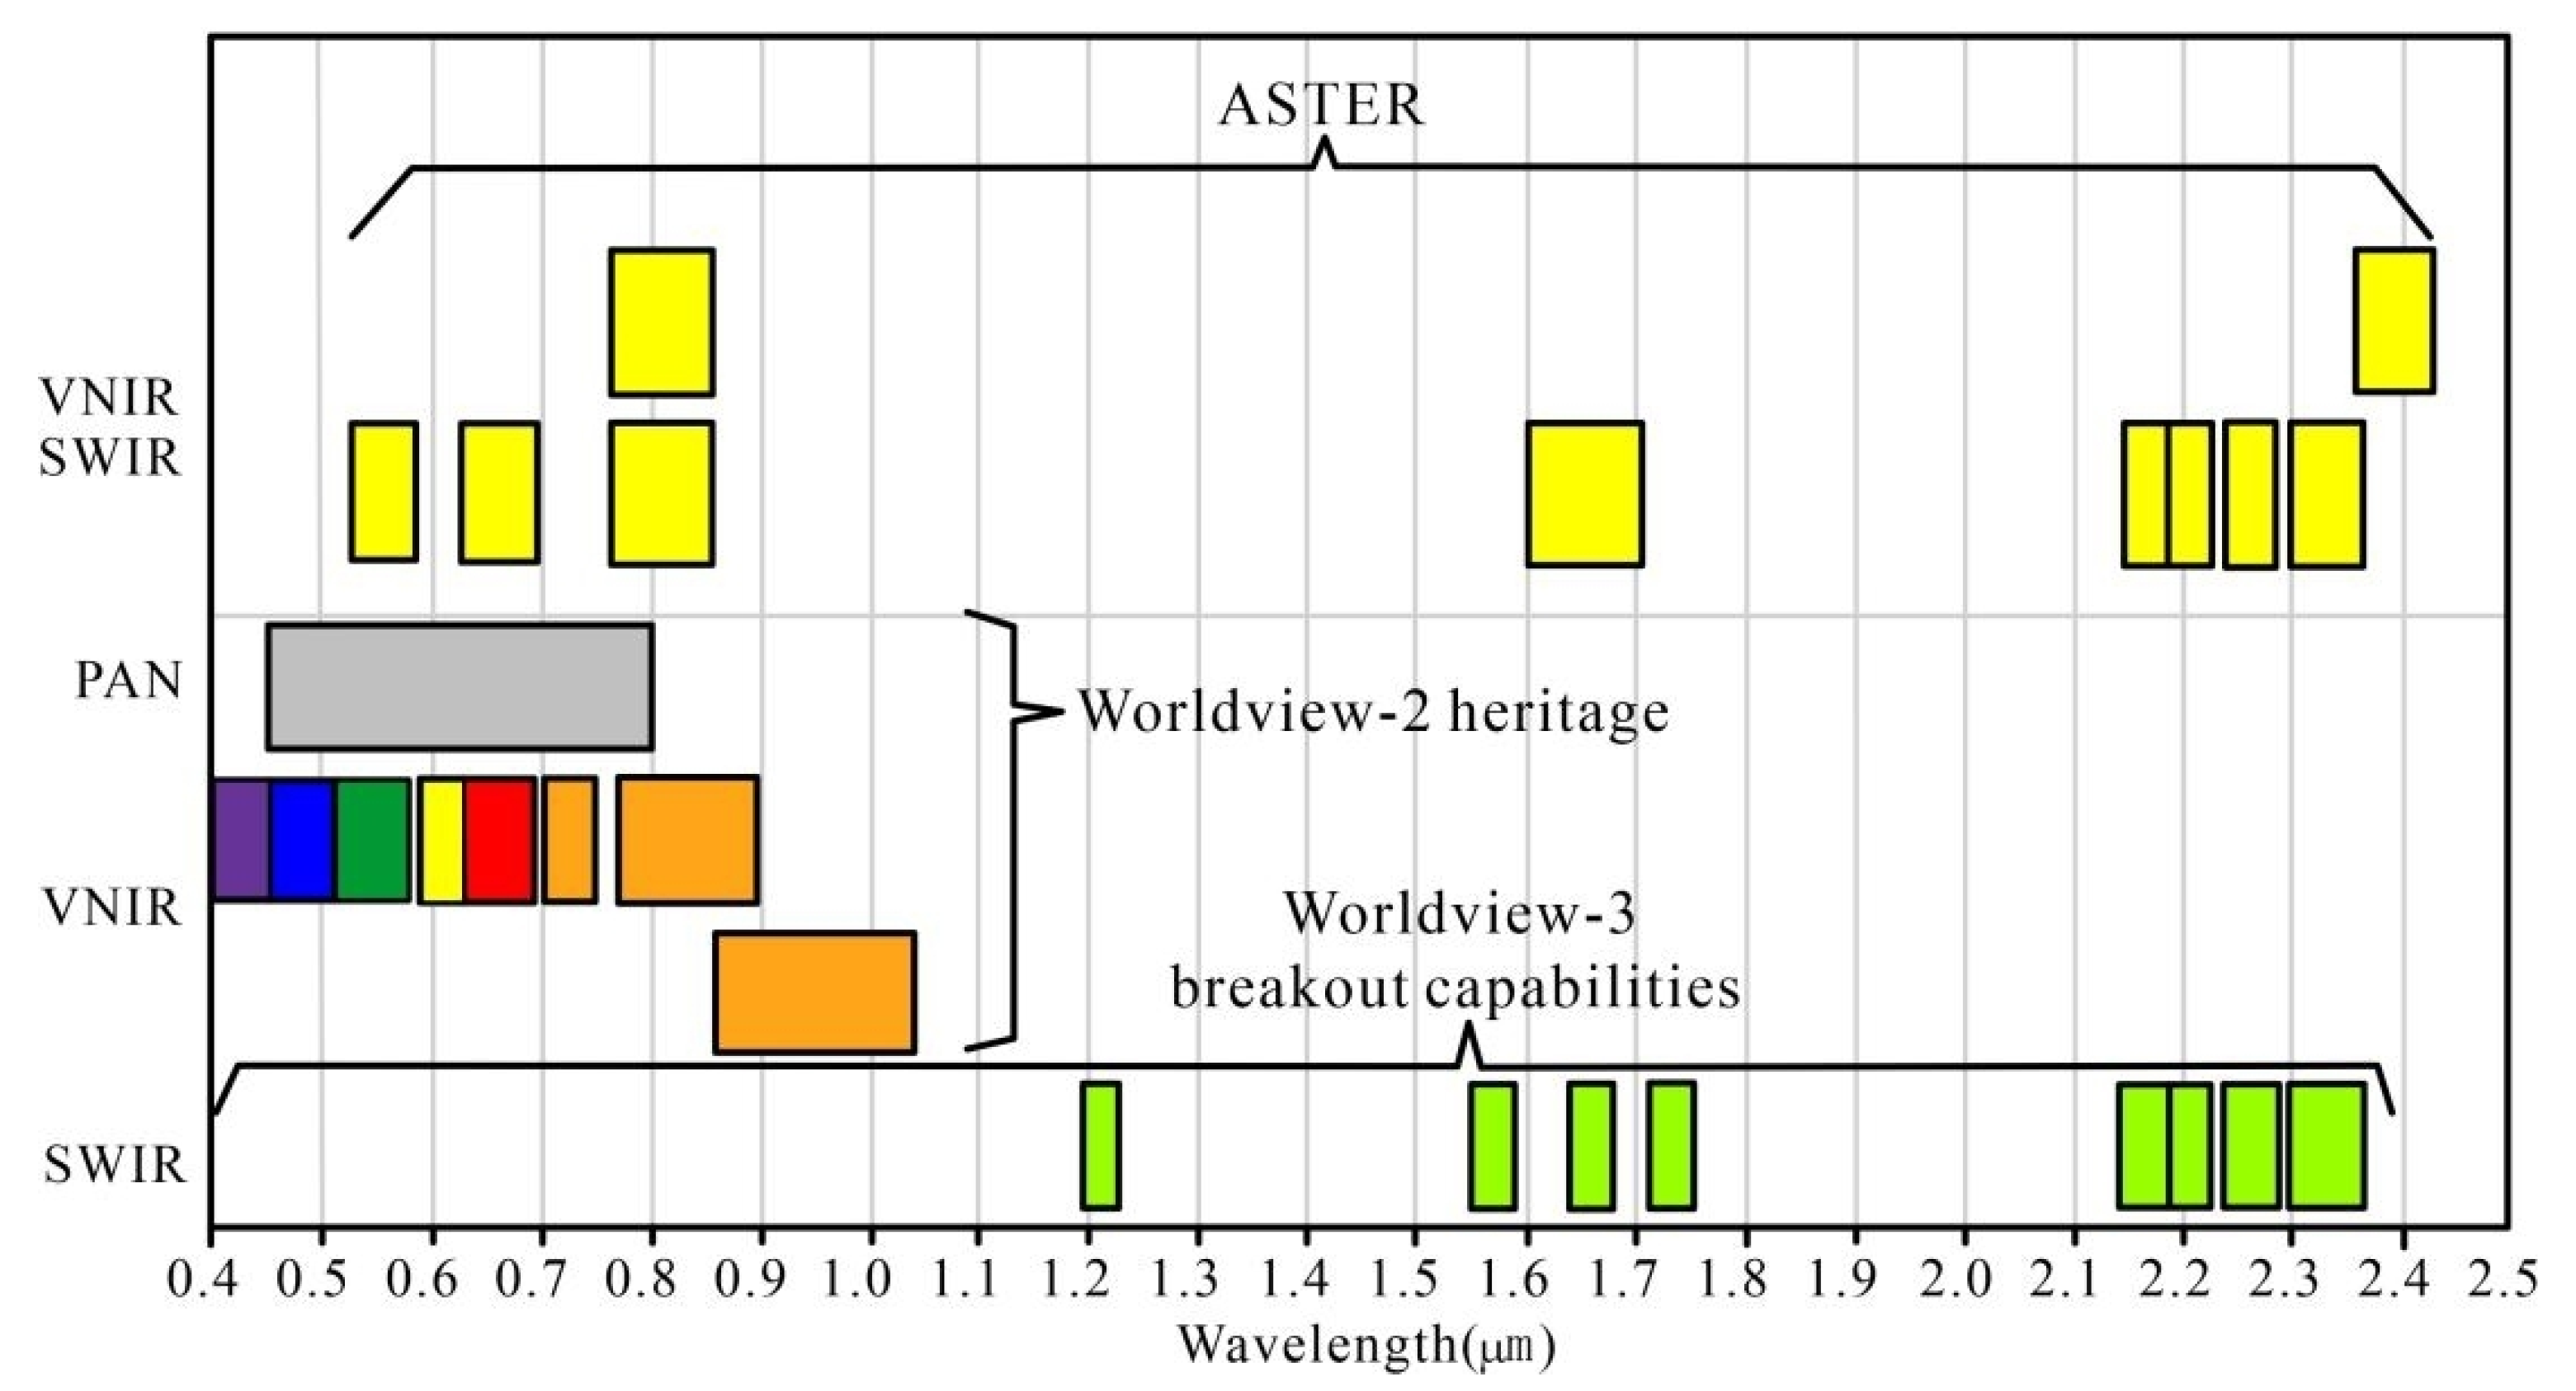
3.1. Remote Sensing Images
3.1.1. Aster
3.1.2. WorldView-3
3.1.3. Image Preprocessing
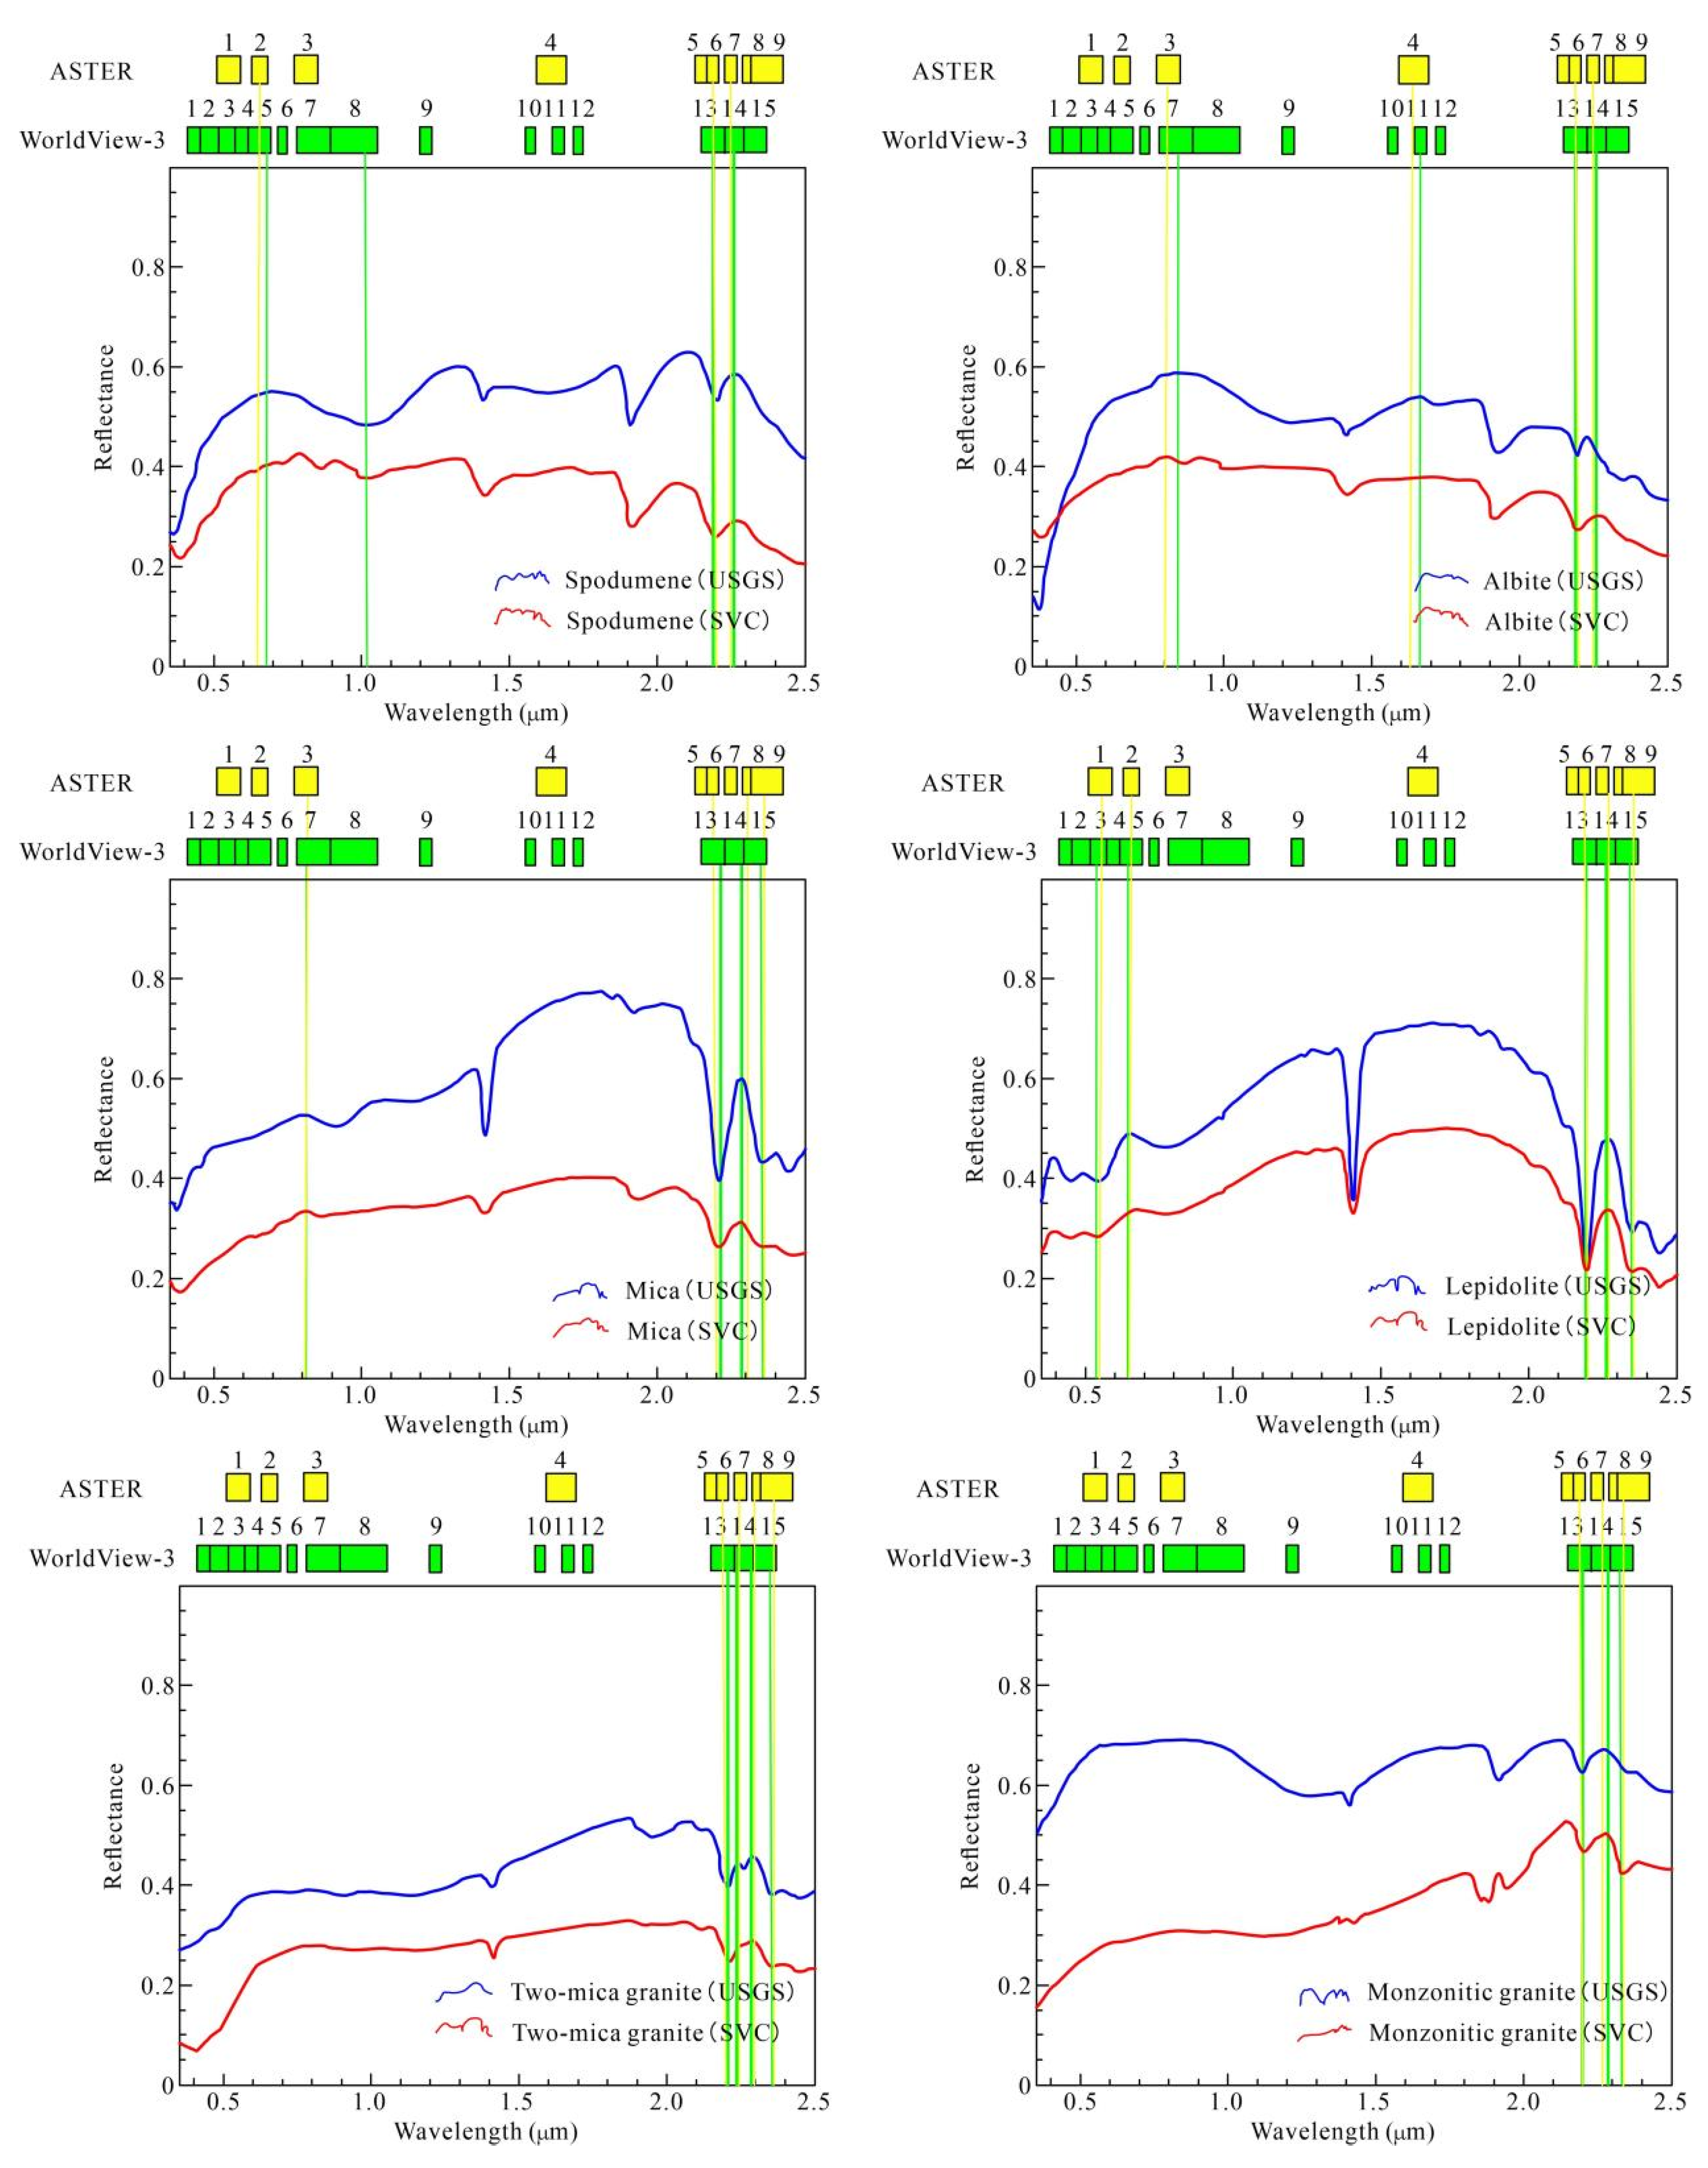
3.2. Spectral Basis
3.3. Methodology
3.3.1. Independent Component Analysis
3.3.2. Mineral Mapping
4. Identification of Li-Bearing Pegmatite Dikes
4.1. Identifying Granitic Rocks
4.2. Identification of Pegmatite Dikes
4.3. Identification of Dike Mineralization
4.3.1. Mapping of Typical Minerals
4.3.2. Analysis of Mineral Potential
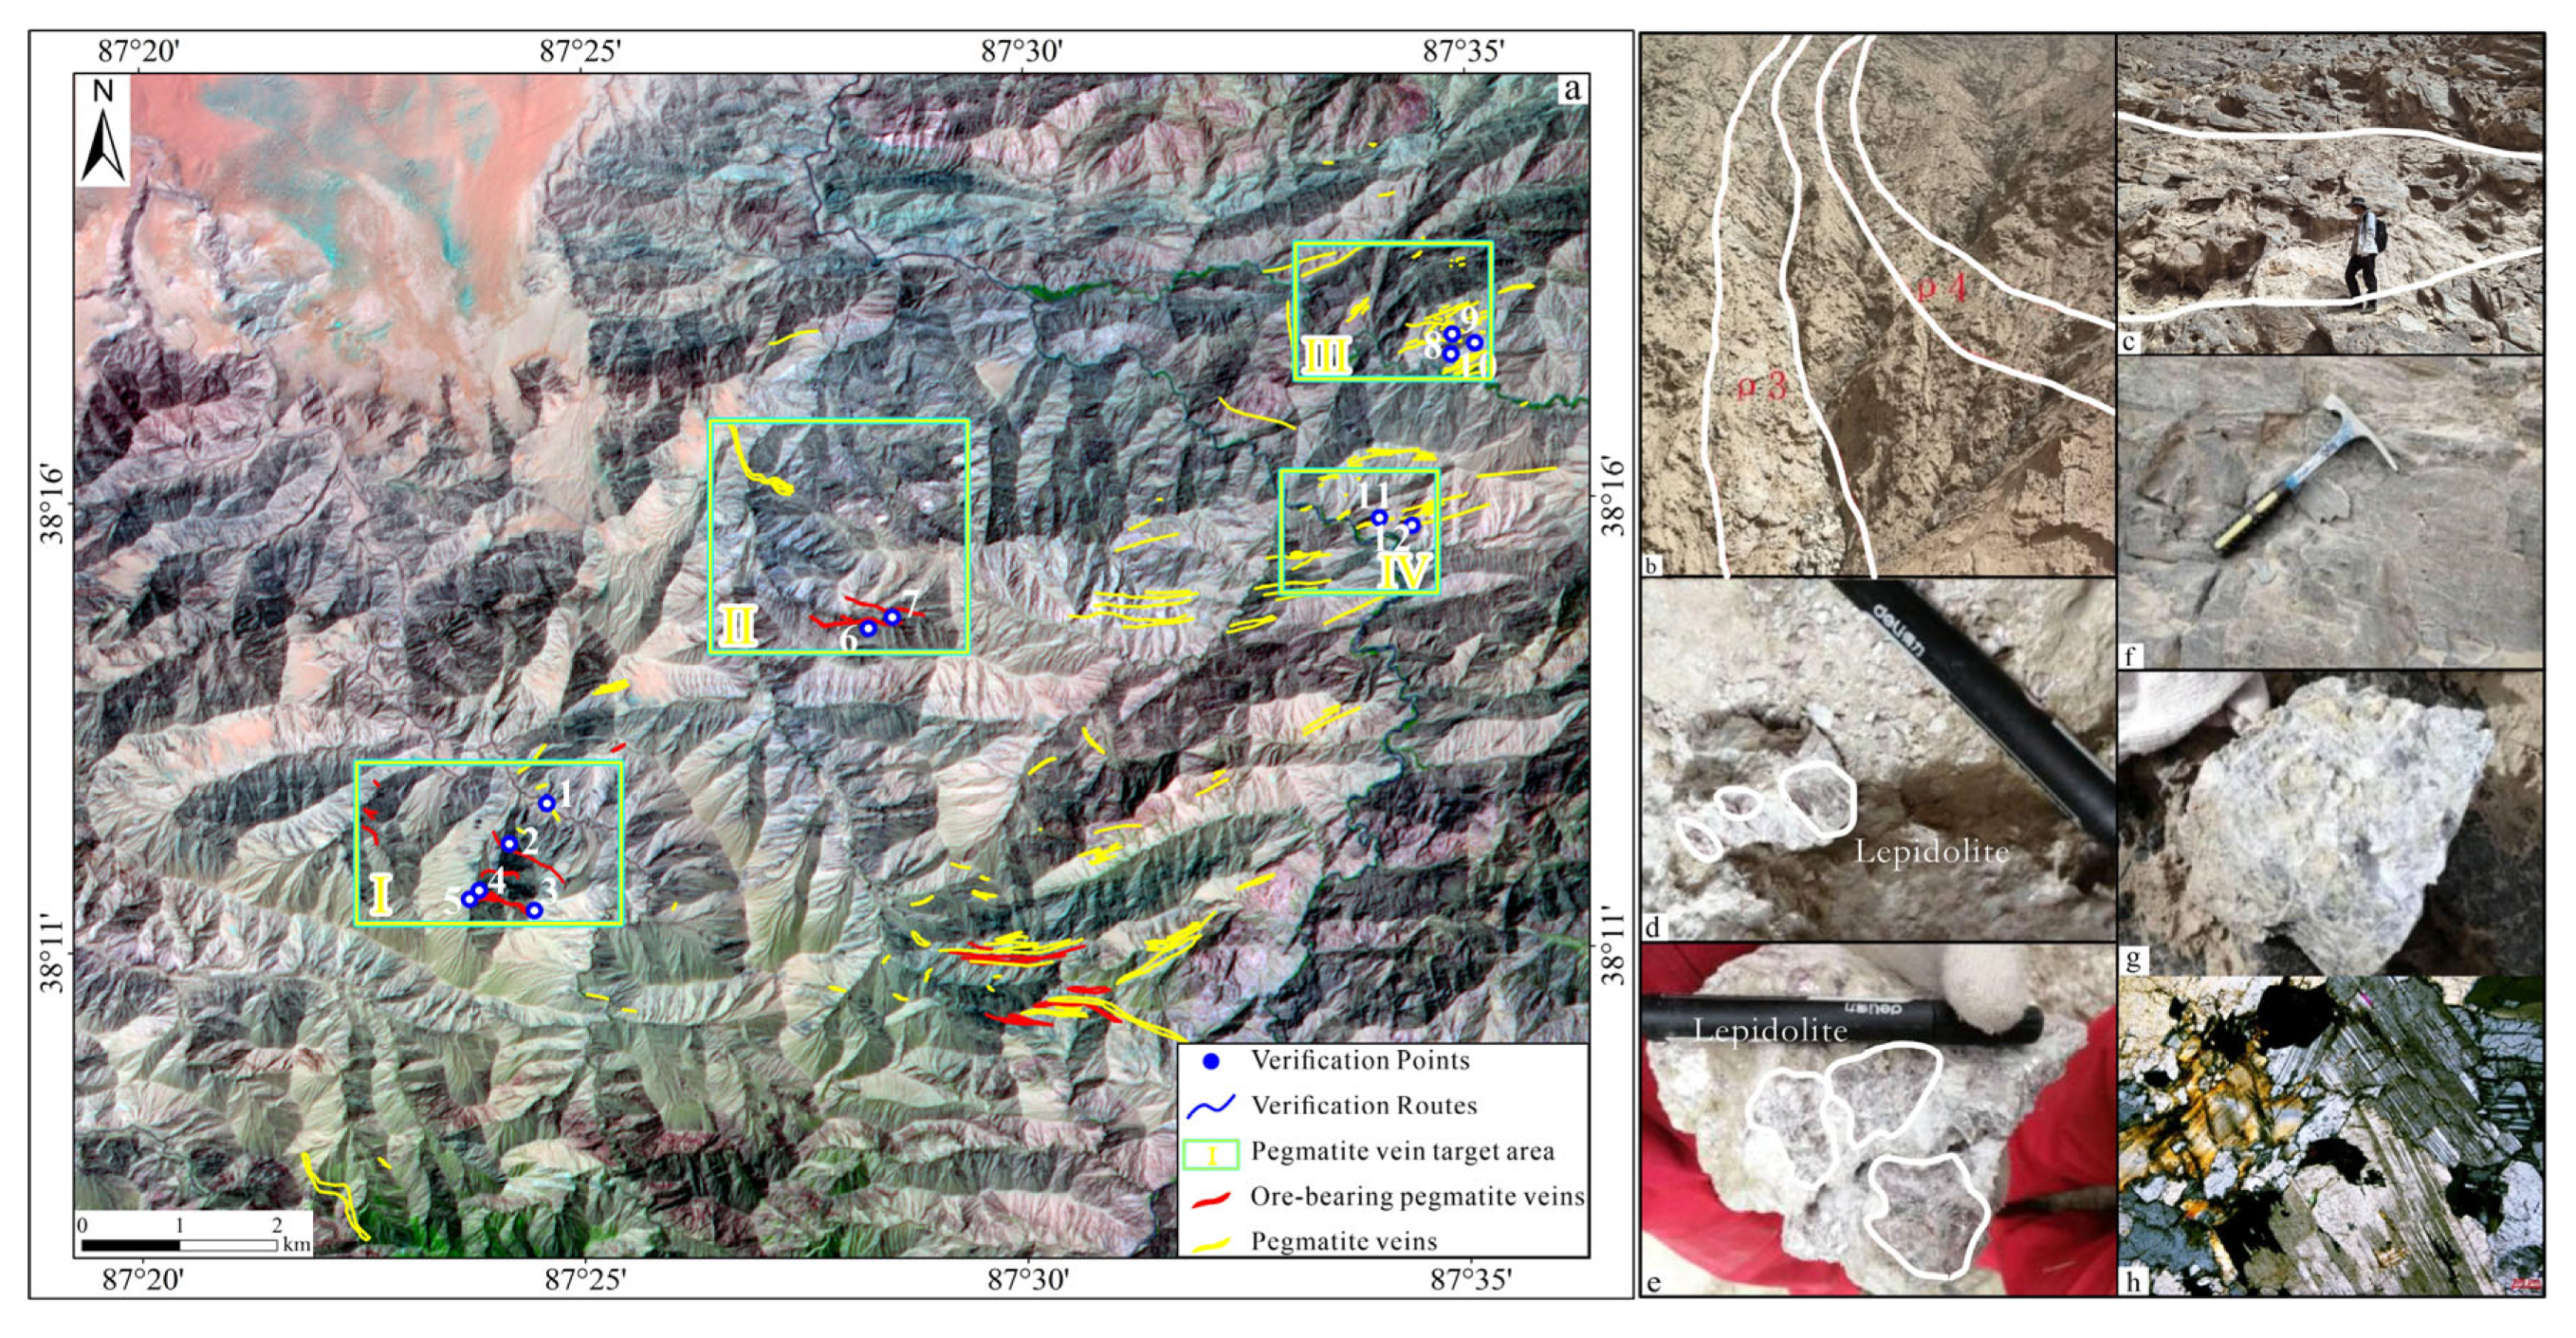
4.4. Field Validation
5. Conclusions
- (1)
- Spectral measurements of samples from the Shaligou area were conducted to create a spectral library for typical rock and mineral types. This library includes minerals and rocks such as spodumene, lepidolite, albite, mica, two-mica granite, and monzonite granite.
- (2)
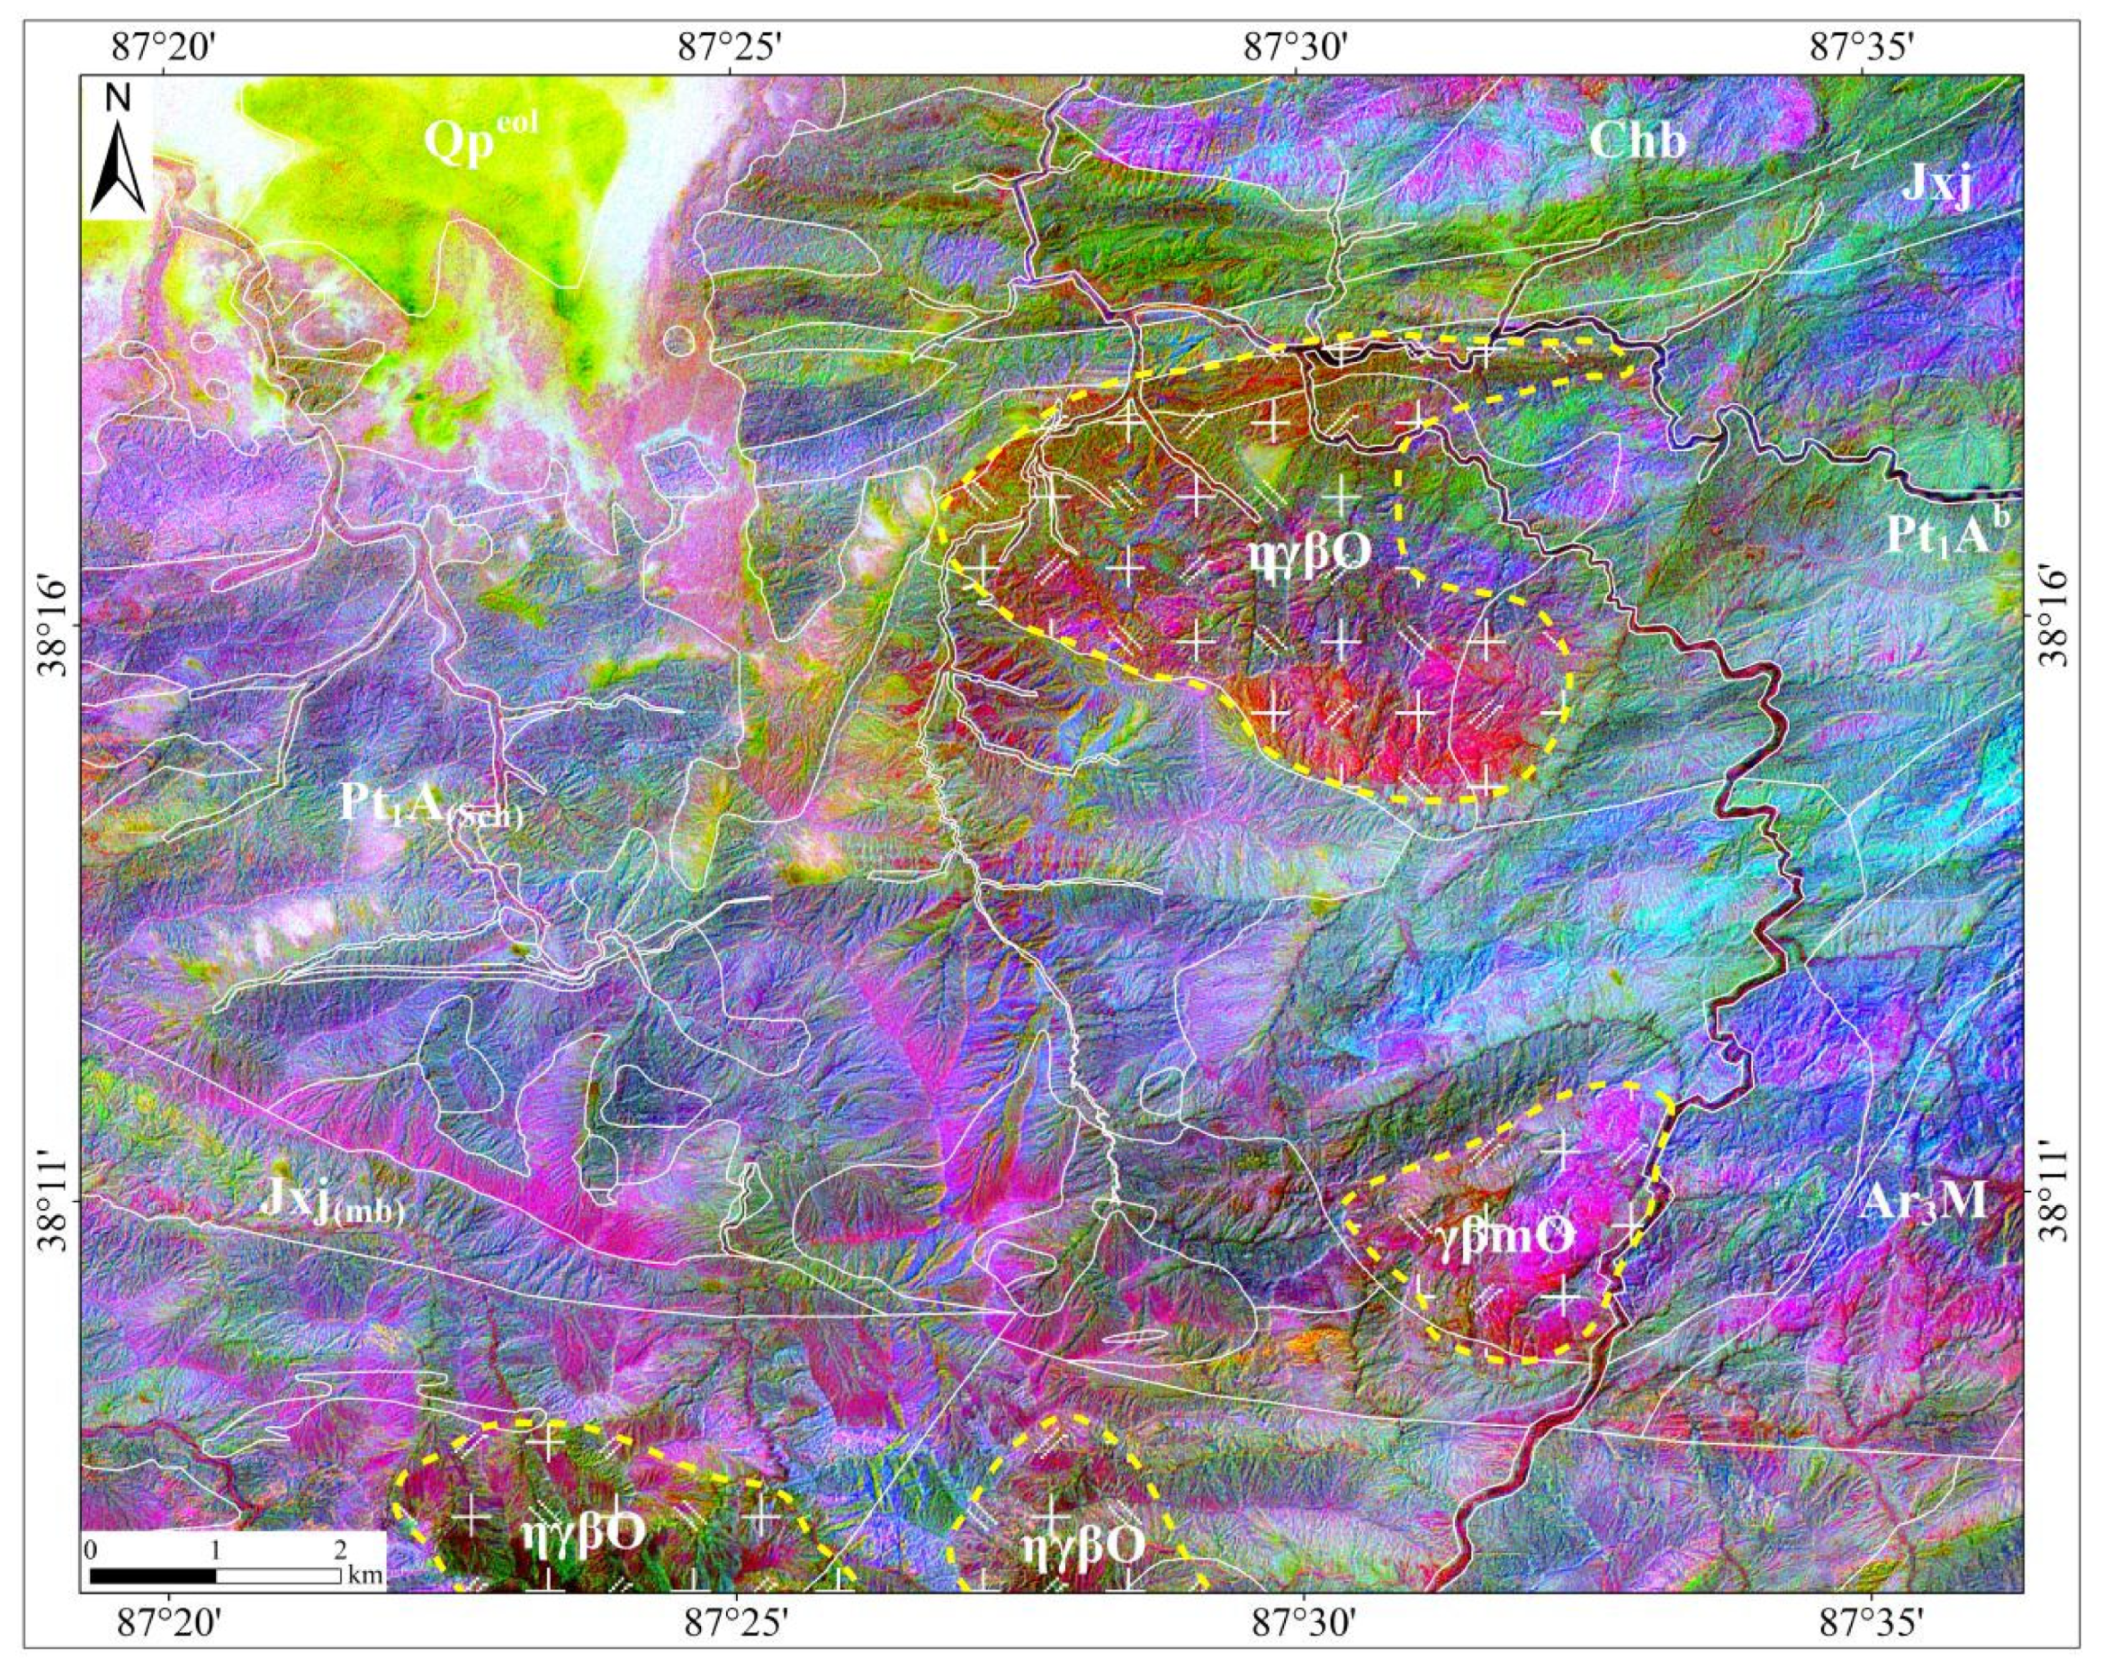
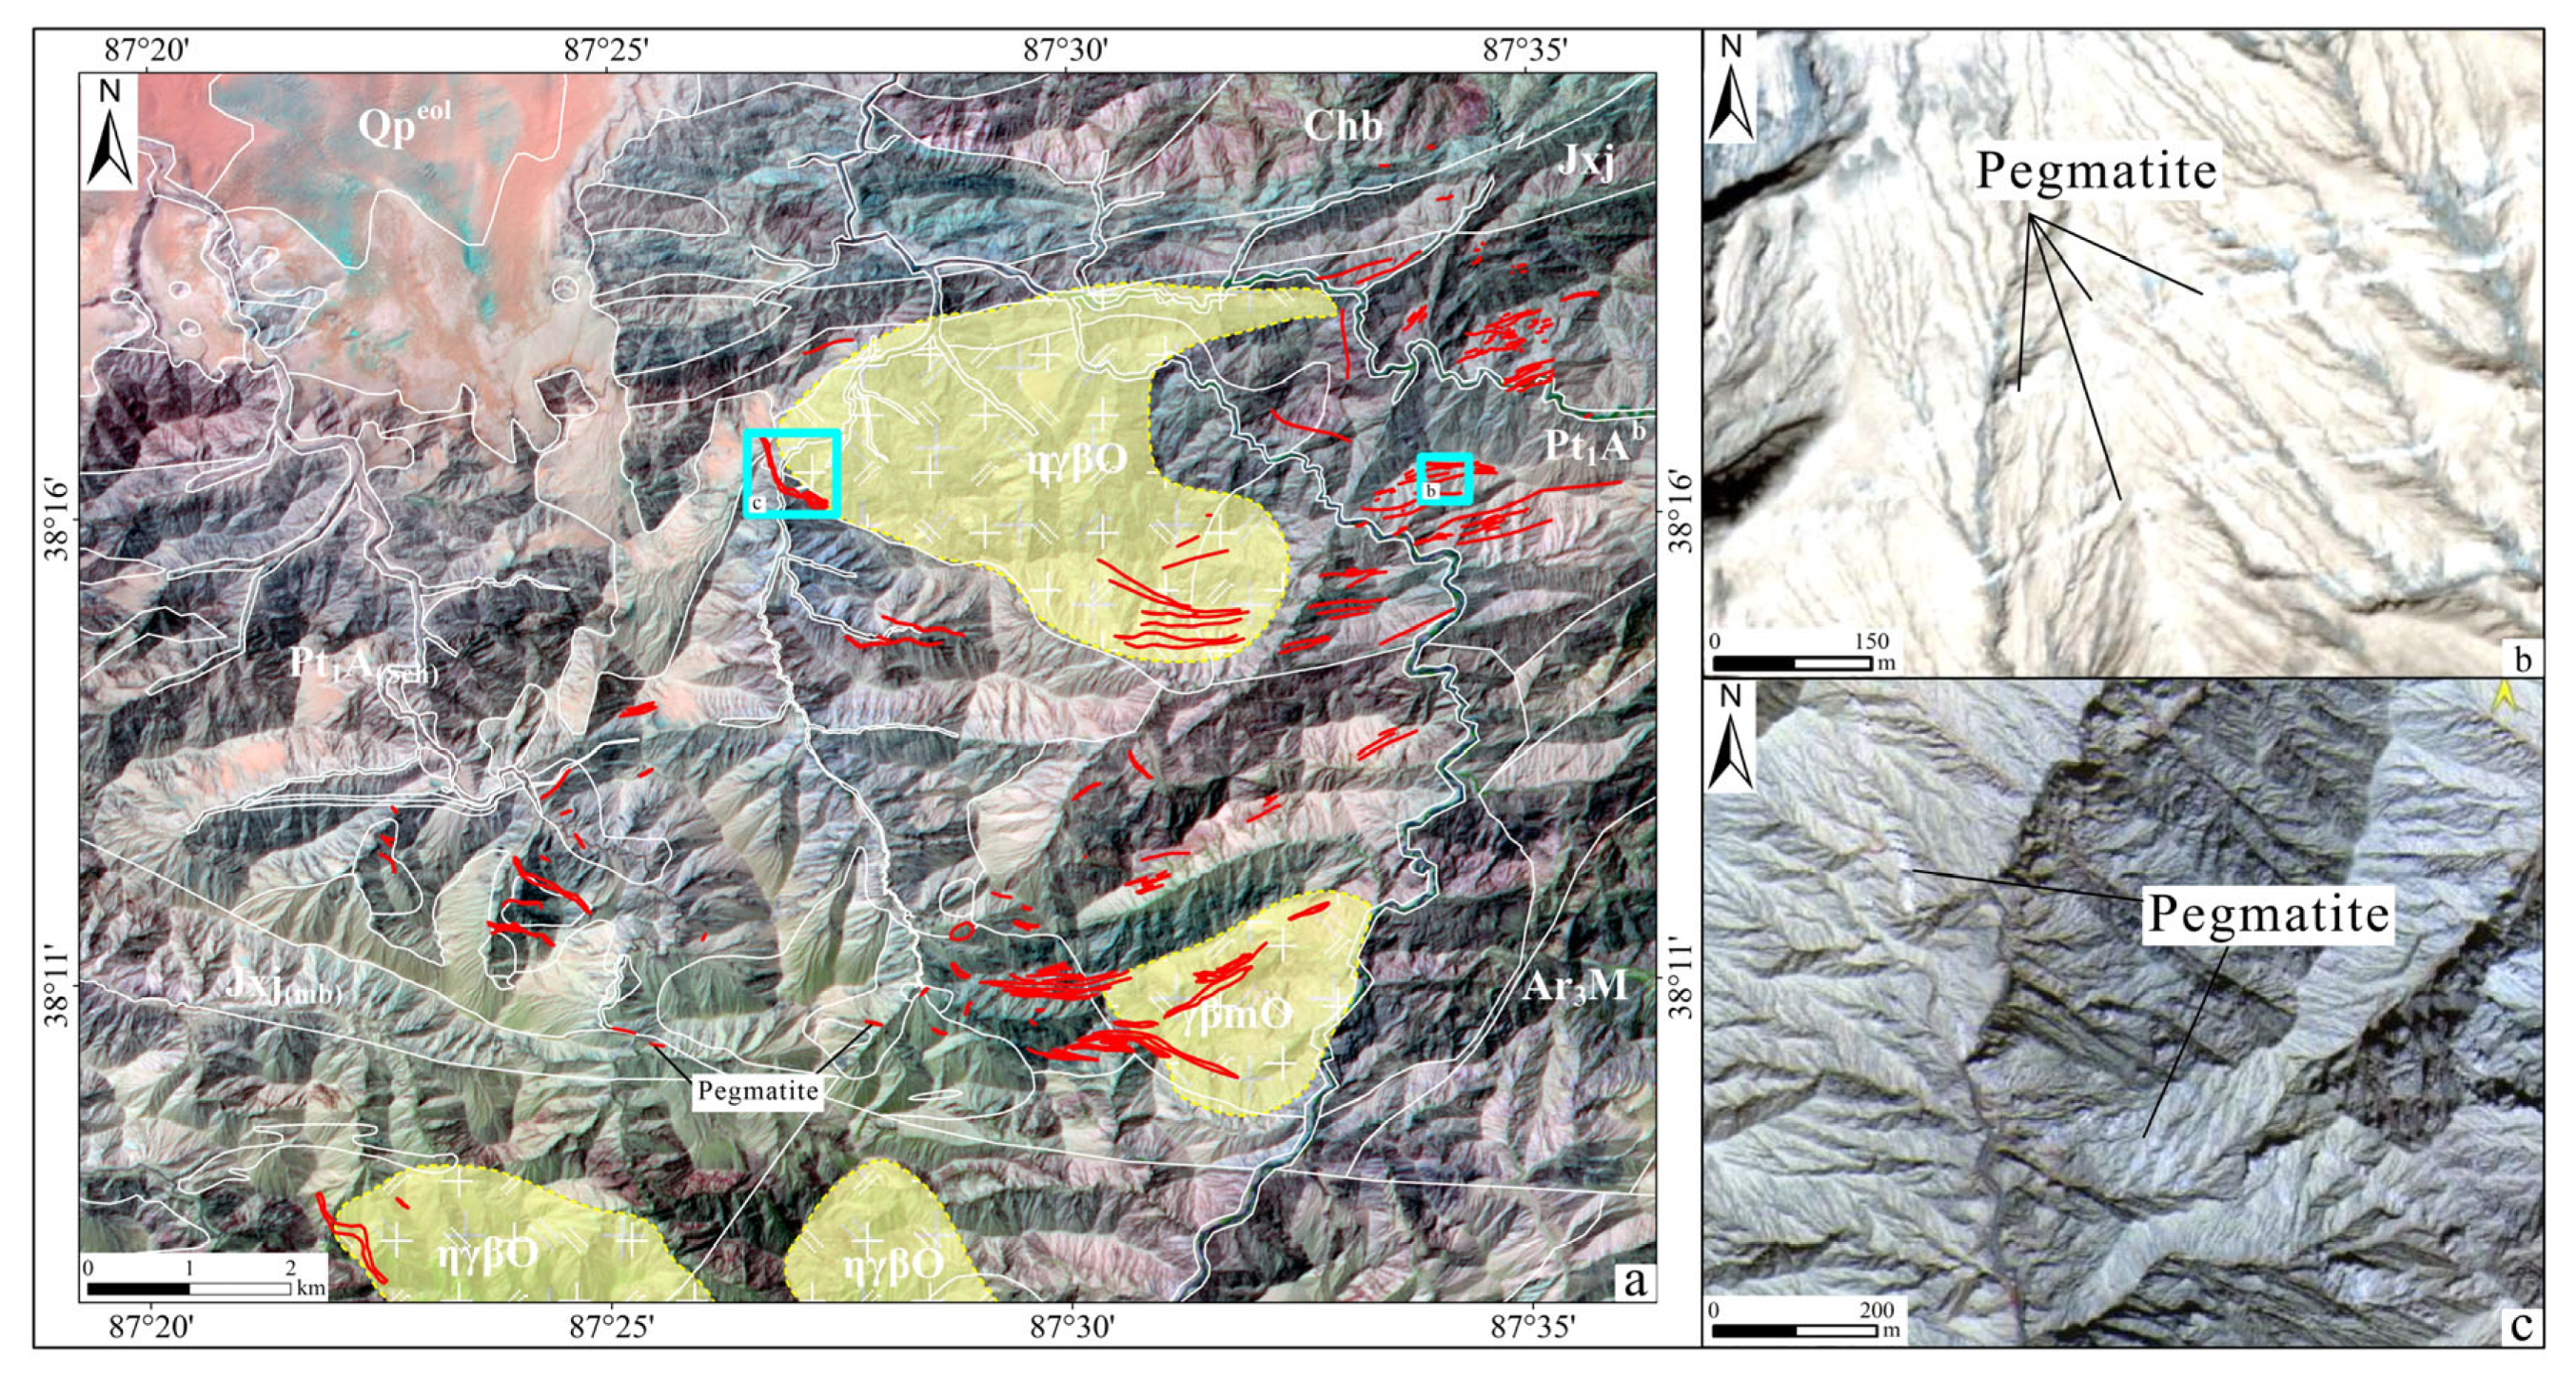
- Identifying the source rock body is essential to exploration of pegmatite-type rare mineral deposits. ASTER imagery, with its unique capabilities in mineral and rock remote sensing interpretation, effectively supports lithological identification. Four granite bodies were identified in the study area: two that correspond closely with the geological map and two new two-mica granite bodies discovered during this research.
- (3)
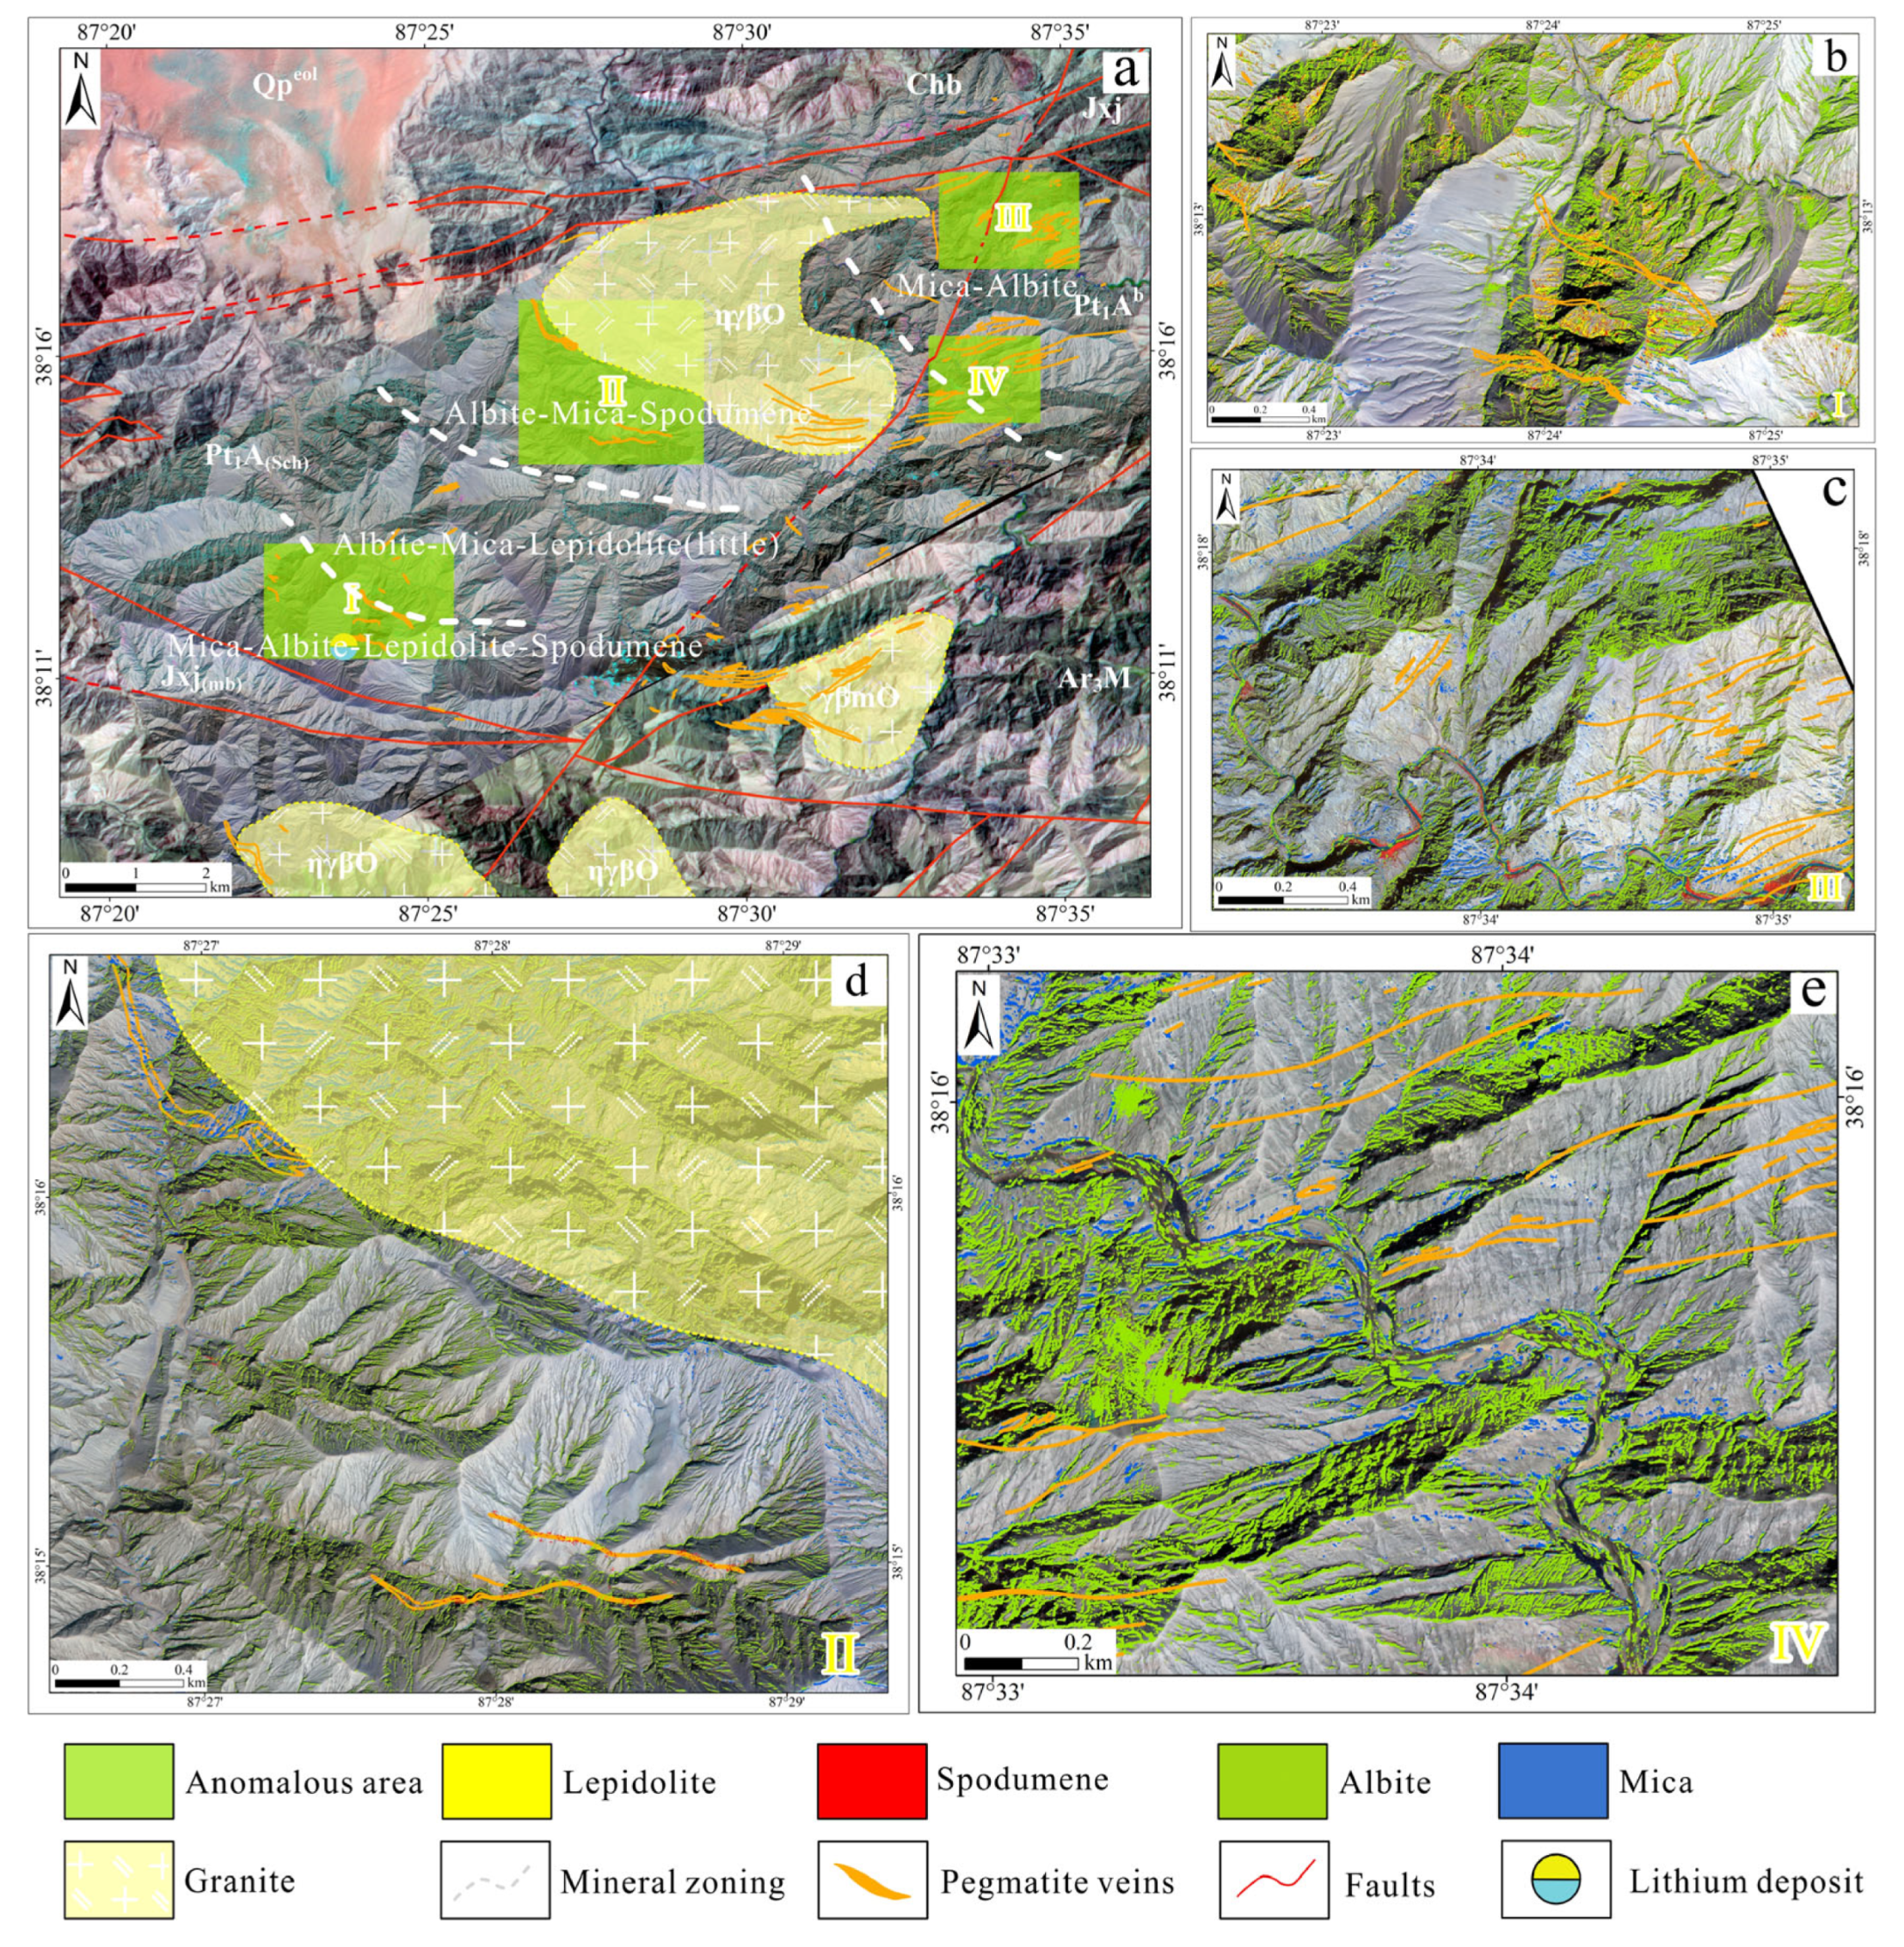
- In the study area, a total of 249 pegmatite dikes was identified. A detailed analysis of the mineral composition and spatial distribution of these dikes revealed the zoning patterns of key minerals such as spodumene, lepidolite, sodium feldspar, and mica. Building on this analysis, a detailed assessment of the mineralization of the pegmatite dikes was conducted, clarifying the mineralization levels and prospectivity across different regions.
- (4)
- This study uncovered the enrichment patterns of minerals in the region. It also provides a valuable reference for future prospecting efforts, helping to prioritize lithium-bearing dikes with higher economic potential.
Author Contributions
Funding
Data Availability Statement
Conflicts of Interest
Abbreviations
| ASTER | Advanced Spaceborne Thermal Emission and Reflection Radiometer |
| SAM | Spectral Angle Mapper |
| ETM+ | Enhanced Thematic Mapper Plus |
| VNIR | Visible and Near-Infrared |
| FLAASH | Fast Line-of-Sight Atmospheric Analysis of Spectral Hypercubes |
| WV3 | WorldView-3 |
| MUL | Multispectral |
| SWIR | Shortwave Infrared |
| PAN | Panchromatic |
| ICA | Independent Component Analysis |
References
- Jiang, Q.; Dai, J.J.; Wang, D.H.; Wang, C.H.; Tian, S.F. Application of optical remote sensing to identifying granite pegmatite lithium deposits. Acta Geol. Sin. 2021, 40, 793–804, (In Chinese with English Abstract). [Google Scholar]
- Xu, X.W.; Li, H.; Shi, F.P.; Yao, F.J.; Chen, J.Z.; Yang, Z.Q.; Hong, T.; Ke, Q. Metallogenic characteristics and prospectingof granitic pegmatite-type rare metal deposits in the Tugeman area, middle part of Altyn Tagh. Acta Petrol. Sin. 2019, 35, 3303–3316, (In Chinese with English Abstract). [Google Scholar]
- Li, C.; Zhang, N.N.; Zhao, T.Y.; Zhang, H.; Chang, J.Y.; Tao, J.T.; Chi, Y.J. Identification and prediction of lithium bearing pegmatite dikes in Dahongliutan ore concentration area in West Kunlun, Xinjiang. Miner. Depos. 2023, 42, 41–54, (In Chinese with English Abstract). [Google Scholar]
- Wang, D.H.; Liu, L.J.; Dai, H.Z.; Liu, S.B.; Hou, J.L.; Wu, X.S. Discussion on particularity and prospecting direction of large and super-large spodumene deposits. Earth Sci. 2017, 42, 2243–2257, (In Chinese with English Abstract). [Google Scholar]
- Cardoso-Fernandes, J.; Teodoro, A.C.; Lima, A.M.C. Potential of Sentinel-2 data in the detection of lithium (Li)-bearing pegmatites: A study case. Earth Resour. Environ. Remote Sens. GIS Appl. 2018, 10790, 201–215. [Google Scholar]
- Gao, Y.; Zhao, X.; Bagas, L.; Wang, Y.; Jin, M.; Zhang, J.; Lu, L.; Yan, Z.; Teng, J. Newly Discovered Ordovician Li-Be Deposits at Tugeman in the Altyn-Tagh Orogen, NW China. Ore Geol. Rev. 2021, 139, 104515. [Google Scholar] [CrossRef]
- Dehnavi, S.; Maghsoudi, Y.; Valadanzoej, M. Using spectrum differentiation and combination for target detection of minerals. Int. J. Appl. Earth Obs. Geoinf. 2017, 55, 9–20. [Google Scholar] [CrossRef]
- Jin, M.S.; Gao, Y.B.; Li, K.; Wang, X.F.; Yang, Z.F.; Zhang, X.Y. Remote sensing prospecting method for pegmatit type rare metal deposit-taking Dahongliutan areain western Kunlun for example. Northwestern Geol. 2019, 52, 222–231, (In Chinese with English Abstract). [Google Scholar]
- Hong, T.; Zhai, M.; Xu, X.; Li, H.; Wu, C.; Ma, Y.; Niu, L.; Ke, Q.; Wang, C. Tourmaline and Quartz in the Igneous and Metamorphic Rocks of the Tashisayi Granitic Batholith, Altyn Tagh, Northwestern China: Geochem. Var. Constraints Metallogenesis. Lithos 2021, 400–401, 106358. [Google Scholar]
- Yamaguchi, Y.; Naito, C. Spectral indices for lithologic discrimination and mapping by using the ASTER SWIR bands. Int. J. Remote Sens. 2003, 24, 4311–4323. [Google Scholar]
- Morsli, Y.; Zerhouni, Y.; Maimouni, S.; Aliko Uss, S.; Kadir, H.; Baroudi, Z. Pegmatite mapping using spectroradiometry and ASTER data (Zenaga, Central Anti-Atlas, Morocco). J. Afr. Earth Sci. 2021, 177, 104153. [Google Scholar] [CrossRef]
- Aguilar, M.A.; del Mar Saldaña, M.; Aguilar, F.J. Assessing geometric accuracy of the orthorectification process from GeoEye-1 and WorldView-2 panchromatic images. Int. J. Appl. Earth Obs. Geoinf. 2013, 21, 427–435. [Google Scholar] [CrossRef]
- Zhang, G.; Zhao, Z.; Zhang, X.; Wu, X.; Zheng, Y.; Feng, L.; Huang, Z. Comprehensive Multi-Source remote sensing data integration for enhanced mineralization alteration extraction and geological structure interpretation in the Lala region of Sichuan Province. Ore Geol. Rev. 2024, 106032. [Google Scholar] [CrossRef]
- Ye, B.; Tian, S.; Ge, J.; Sun, Y. Assessment of WorldView-3 data for lithological mapping. Remote Sens. 2017, 9, 1132. [Google Scholar] [CrossRef]
- Hirai, A.; Tonooka, H.; Iwasaki, A.; Kameyama, S. Effectiveness of worldview-3/swir in mineral discrimination using multispectral image and surrounding hyperspectral image. J. Remote Sens. Soc. Jpn. 2019, 39, 307–314. [Google Scholar]
- Gemusse, U.; Cardoso-Fernandes, J.; Lima, A.; Teodoro, A. Identification of pegmatites zones in Muiane and Naipa (Mozambique) from Sentinel-2 images, using band combinations, band ratios, PCA and supervised classification. Remote Sens. Appl. Soc. Environ. 2023, 32, 101022. [Google Scholar]
- Dong, Y.; Su, W.; Xuan, F.; Li, J.; Yin, F.; Huang, J.; Zeng, Y.; Li, X.; Tao, W. An effective atmospheric correction method for the wide swath of Chinese GF-1 and GF-6 WFV images on lands. Egypt. J. Remote Sens. Space Sci. 2023, 26, 732–746. [Google Scholar] [CrossRef]
- Monisha, M.; Muthukumar, M.; Rajesh, V.J. Application of spectral signature study and geochemical analysis in the characterization of Bhavani Mettupalayam Ultramafic Complex in the Southern Granulite Terrane, India. Geosystems Geoenvironment 2024, 3, 100262. [Google Scholar] [CrossRef]
- Yang, J.; Lee, Y.K.; Chi, J. Spectral unmixing-based Arctic plant species analysis using a spectral library and terrestrial hyperspectral Imagery: A case study in Adventdalen, Svalbard. Int. J. Appl. Earth Obs. Geoinf. 2023, 125, 103583. [Google Scholar] [CrossRef]
- Arun Solomon, A.; Agnes, S.A. Land-Cover Classification with Hyperspectral Remote Sensing Image Using CNN and Spectral Band Selection. Remote Sens. Appl. Soc. Environ. 2023, 31, 100986. [Google Scholar]
- Ali-Bik, M.W.; Gabr, S.S.; Hassan, S.M. Spectral characteristics, petrography and opaque mineralogy of the Oligo-Miocene basalts at Wadi Abu Qada-Wadi Wata area, west-central Sinai, Egypt. J. Egypt. J. Remote Sens. Space Sci. 2022, 25, 529–540. [Google Scholar] [CrossRef]
- Baranwal, E.; Ahmad, S.; Mudassir, S.M. Using new independent component analysis (ICA) based spectral index to extract and map built-ups of India’s sacred district ‘Mathura’. Phys. Chem. Earth 2022, 126, 103118. [Google Scholar] [CrossRef]
- Chen, F.; Guan, Z.; Yang, X.; Cui, W. A novel remote sensing image fusion method based on independent component analysis. Int. J. Remote Sens. 2011, 32, 2745–2763. [Google Scholar] [CrossRef]
- Jia, P.; Chen, C.; Zhang, D.; Sang, Y.; Zhang, L. Semantic segmentation of deep learning remote sensing images based on band combination principle: Application in urban planning and land use. Comput. Commun. 2024, 217, 97–106. [Google Scholar] [CrossRef]
- Harris, J.R.; Ponomarev, P.; Shang, J.; Rogge, D. Noise reduction and best band selection techniques for improving classification results using hyperspectral data: Application to lithological map in Canada’s Arctic. Can. J. Remote Sens. 2006, 32, 341–354. [Google Scholar]
- He, Z.H.; He, B.B. Weight spectral angle mapper (WSAM) method for hyperspectral mineral mapping. Spectrosc. Spectr. Anal. 2010, 31, 2200–2204, (In Chinese with English Abstract). [Google Scholar]
- Osco, L.P.; Wu, Q.; de Lemos, E.L.; Gonçalves, W.N.; Ramos, A.P.M.; Li, J.; Marcato, J. The segment anything model (sam) for remote sensing applications: From zero to one shot. Int. J. Appl. Earth Obs. Geoinf. 2023, 124, 103540. [Google Scholar]
- Ghulam, A.; Amer, R.; Kusky, T.M. Mineral exploration and alteration zone mapping in Eastern Desert of Egypt using ASTER Data. Geospat. Technol. 2010, 1, 196–205. [Google Scholar]
- Hammam, A.; Korin, A.; Herlambang, A.; Al–Ramadan, K.; Koeshidayatullah, A. Integrated multispectral remote sensing approach for high-resolution spectral characterization and automated mapping of carbonate lithofacies. Egypt. J. Remote Sens. Space Sci. 2024, 27, 436–455. [Google Scholar] [CrossRef]
- Courba, S.; Youssef, H.; Jamal, A.; Abdessalam, O.; Mohamed, E.A.; Larbi, B.; Assia, I.; Zineb, A.; Slimane, S.; Lahcen, O.; et al. Litho-structural and hydrothermal alteration mapping for mineral prospection in the Maider basin of Morocco based on remote sensing and field investigations. Remote Sens. Appl. Soc. Environ. 2023, 31, 100980. [Google Scholar] [CrossRef]
- Du, X.C.; Lou, D.B.; Xu, L.G.; Peng, G.X.; Zhang, J.D. Extracting granite pegmatite information based on GF-rithm. Remote Sens. Nat. Resour. 2024, 35, 53–60. [Google Scholar]
- Deveaud, S.; Gumiaux, C.; Gloaguen, E.; Branquet, Y. Spatial statistical analysis applied to rare-element LCT-type pegmatite fields: An original approach to constrain faults-pegmatites-granites relationships. J. Geosci. 2013, 58, 163–182. [Google Scholar]
- Fang, L.; Wang, M.; Li, D.; Pan, J. CPU/GPU near real-time preprocessing for ZY-3 satellite images: Relative radiometric correction, MTF compensation, and geocorrection. ISPRS J. Photogramm. Remote Sens. 2014, 87, 229–240. [Google Scholar]
- Zafaty, O.; Oukassou, M.; Mhamdi, H.S.; Tabuce, R.; Charrière, A. Integrated remote sensing data and field investigations for geological mapping and structural analysis. The case of SW Tichoukt ridge (Middle Atlas, Morocco). J. Afr. Earth Sci. 2023, 198, 104784. [Google Scholar]

| Spectral Region | Band | Spectral Range | Spatial Resolution |
|---|---|---|---|
| Visible-near infrared (VNIR) | 1 | 520–600 nm | 15 m |
| 2 | 630–690 nm | ||
| 3 | 780–860 nm | ||
| Short-wave infrared (SWIR) | 4 | 1600–1700 nm | 30 m |
| 5 | 2150–2190 nm | ||
| 6 | 2190–2230 nm | ||
| 7 | 2240–2290 nm | ||
| 8 | 2300–2370 nm | ||
| 9 | 2360–2430 nm | ||
| Thermal infrared (TIR) | 10 | 8130–8480 nm | 90 m |
| 11 | 8480–8830 nm | ||
| 12 | 8930–9280 nm | ||
| 13 | 10,250–10,950 nm | ||
| 14 | 10,950–11,650 nm |
| Spectral Region | Band | Spectral Range | Spatial Resolution |
|---|---|---|---|
| Multispectral (MUL) | VNIR1 | 400–450 nm | 1.2 m |
| VNIR2 | 450–510 nm | ||
| VNIR3 | 510–580 nm | ||
| VNIR4 | 585–625 nm | ||
| VNIR5 | 630–690 nm | ||
| VNIR6 | 705–745 nm | ||
| VNIR7 | 770–895 nm | ||
| VNIR8 | 860–1040 nm | ||
| Short-wave infrared (SWIR) | SWIR1 | 1195–1225 nm | 3.7 m |
| SWIR2 | 1550–1590 nm | ||
| SWIR3 | 1640–1680 nm | ||
| SWIR4 | 1710–1750 nm | ||
| SWIR5 | 2145–2185 nm | ||
| SWIR6 | 2185–2225 nm | ||
| SWIR7 | 2235–2285 nm | ||
| SWIR8 | 2295–2365 nm | ||
| Panchromatic (PAN) | Pan | 450–800 nm | 0.31 m |
Disclaimer/Publisher’s Note: The statements, opinions and data contained in all publications are solely those of the individual author(s) and contributor(s) and not of MDPI and/or the editor(s). MDPI and/or the editor(s) disclaim responsibility for any injury to people or property resulting from any ideas, methods, instructions or products referred to in the content. |
© 2025 by the authors. Licensee MDPI, Basel, Switzerland. This article is an open access article distributed under the terms and conditions of the Creative Commons Attribution (CC BY) license (https://creativecommons.org/licenses/by/4.0/).
Share and Cite
Zhang, X.; Xia, F.; Xu, S.; Gao, L.; Wang, W.; Du, X.; Chen, C. Identification of Lithium-Bearing Pegmatite Dikes Based on WorldView-3 Data: A Case Study of the Shaligou Area in Western Altyn. Minerals 2025, 15, 377. https://doi.org/10.3390/min15040377
Zhang X, Xia F, Xu S, Gao L, Wang W, Du X, Chen C. Identification of Lithium-Bearing Pegmatite Dikes Based on WorldView-3 Data: A Case Study of the Shaligou Area in Western Altyn. Minerals. 2025; 15(4):377. https://doi.org/10.3390/min15040377
Chicago/Turabian StyleZhang, Xiaoqian, Fang Xia, Shiqi Xu, Lingling Gao, Wei Wang, Xiaofei Du, and Chuan Chen. 2025. "Identification of Lithium-Bearing Pegmatite Dikes Based on WorldView-3 Data: A Case Study of the Shaligou Area in Western Altyn" Minerals 15, no. 4: 377. https://doi.org/10.3390/min15040377
APA StyleZhang, X., Xia, F., Xu, S., Gao, L., Wang, W., Du, X., & Chen, C. (2025). Identification of Lithium-Bearing Pegmatite Dikes Based on WorldView-3 Data: A Case Study of the Shaligou Area in Western Altyn. Minerals, 15(4), 377. https://doi.org/10.3390/min15040377