Abstract
The enrichment of trace metals and other life-essential elements, like phosphorus, in carbonates may be a signature of microbial life. Enrichments of such elements in microbial carbonate facies in the rock record have been attributed to life in previous studies, but the biologic origin of these enrichments is contentious. We experimentally tested the hypothesis that enrichments of life-important trace elements occur in both cells and carbonate minerals that form as a result of cellular photosynthesis for the cyanobacteria Synechococcus PCC 8806. We grew Synechococcus PCC 8806 and measured the trace element concentrations of the cells and the minerals that precipitate with the cells, and we compared the results to abiotically precipitated mineral material from the same growth medium conditions. We found that for all the tested trace elements (B, P, K, Mn, Fe, Co, Cu, and Zn, chosen for their requirements in the growth medium of Synechococcus PCC 8806 and known uses in cellular machinery), nearly all the sample types were enriched relative to the medium concentrations. The dominant pattern for most elements was that cells were the most enriched, followed by biotic minerals, and then abiotic minerals. However, this pattern was complicated by varying concentrations of Mg in the mineral samples because the data were normalized to Mg (Mg was the dominant cation in the solution next to Na). Nonetheless, however the data are normalized, Fe was the most enriched element in the cells and both the biotic and abiotic minerals relative to the medium concentrations. Fe had the largest enrichment factor (E.F.) for all the sample types, with an E.F. of approximately 2800 in the biotic minerals, 1620 in the cells, and 230 in the abiotic minerals. Fe was followed by Zn (E.F. of ~329 in cells, 198 in biotic minerals, and 78 in abiotic minerals), Cu (E.F. of ~424 in cells, 171 in biotic minerals, and 50 in abiotic minerals), Mn (E.F. of ~200 in cells, 95 in biotic minerals, and 53 in abiotic minerals), and P (E.F. of ~149 in cells, 37 in biotic minerals, and 6 in abiotic minerals), suggesting that these elements can be useful as biosignatures when used in combination with other evidence.
1. Introduction
The search for past or present life beyond Earth, as well as the origins of life on Earth, has driven the pursuit of non-ambiguous evidence of life (“biosignatures”). Furthermore, determining whether life ever existed on Mars is a primary objective of Mars sample return, as identified by the Mars Sample Return Campaign Science Group [1]. The chemical patterns and fractionations that result from the presence of life, which can be imparted to minerals and organic molecules, are one possible biosignature. A canonical example of a distinct chemical pattern caused by life is the “Redfield Ratio”, which is the average ratio of carbon, nitrogen, and phosphorus in oceanic phytoplankton (106 C:16 N:1 P) [2,3]. Furthermore, life is typically chemically distinct from its abiotic environment because many of the elements that life requires exist in only trace amounts in their environment. Trace metals and nutrients like phosphorus are widely required for cellular processes but are scarce in most natural waters, and therefore are potentially up to 105 times more concentrated in cells than in their environment (Figure 1; [4]). Cyanobacterial cells are particularly reliant on trace metals because many of the enzymes and enzymatic co-factors in photosynthetic electron transport require metals such as Fe, Cu, and Zn [5].
In addition to the enrichment of trace metals in cells, trace metals may also be enriched in the minerals that form in close association with cells. Minerals can form in association with cells, both because cellular metabolisms can locally increase mineral saturation and because cells can provide nucleation templates for carbonate mineral precipitation. For example, cyanobacteria can cause carbonate mineral precipitation because the reaction of photosynthesis increases pH, thereby increasing the carbonate ion concentration and carbonate mineral saturation state, Ω (e.g., for calcite, , where Ksp is the solubility product of calcite) [6]. The mineral saturation state dictates whether mineral precipitation is favored (Ω > 1) or mineral dissolution is favored (Ω < 1). Cyanobacteria are known to play a role in “whiting” events, which are water column calcium carbonate precipitation events that occur in the photic zone of lakes and oceans [7,8,9,10]. While calcification can have benefits for cyanobacteria, evidence suggests that calcification is largely passive through alkalinization and providing a nucleation template [11]. Some cyanobacteria, like the genus Synechococcus, can promote the precipitation of minerals during whitings via the structural support of extracellular structures called “S-layers” [12,13].
Minerals that form in association with cells can be preserved when microbialites form. Microbialites are lithified aggregates of minerals that form from processes in microbial mats or biofilms. Microbialites may contain higher concentrations of life-important elements like trace metals and phosphorus [14]. When microbialites form, biologically influenced mineralization occurs due to both the increasing of alkalinity from microbial processes and the availability of nucleation for carbonate material on extracellular polymeric substances (EPS) [15]. Microbial mats or biofilms may enrich the hyperlocal environment in trace metals and other nutrients by extracellular sorption onto negatively charged EPS or cell walls such that when carbonate precipitates near the cells it is also enriched in those elements [14]. While trace metal enrichments have been found to be preserved in ancient microbialites, it remains unclear whether these enrichments are specifically because of biology or if the enrichments resulted from early (authigenic) or late (hydrothermal or meteoric) diagenesis [16,17,18].
The average concentrations of trace elements in oceanic phytoplankton have been estimated and measured [4]. Additionally, the distribution coefficients for the partitioning of many trace elements into abiotically formed carbonate minerals in equilibrium conditions have been determined theoretically and tested experimentally e.g., Refs. [19,20]. However, it is yet unclear how or if microbially influenced minerals have unique partitioning due to the biological necessity to concentrate nutrients for cellular processes. We measured the minerals formed in the growth medium with Synechococcus PCC 8806, a species shown to produce calcium carbonate [21], and minerals that form abiotically to test whether partitioning of trace elements into minerals differ between biotic and abiotic mineral formation. We hypothesized that minerals that form from cellular processes will be enriched in trace metals and phosphorus as compared to their abiotic counterparts.
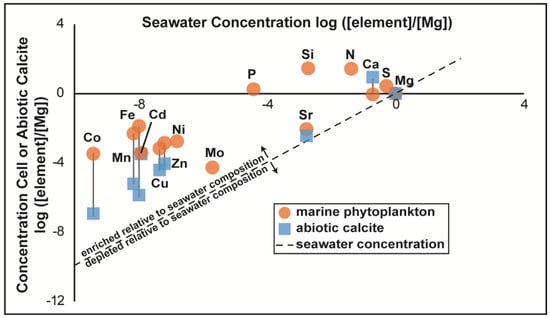
Figure 1.
Element enrichment in cells and minerals relative to seawater. Existing literature data for the concentrations of biologically important elements in marine phytoplankton (data from Ref. [4]) versus abiotically precipitated calcite (data based on distribution coefficients reported in Ref. [21] normalized to Mg).
2. Materials and Methods
2.1. Experimental Set-Up
To simulate microbially influenced carbonate precipitation and abiotic carbonate precipitation, two experimental treatments were made, both with the exact same protocol, except one treatment remained sterile while the other treatment was inoculated with Synechococcus PCC 8806. The pure culture strain of Synechococcus PCC 8806 was obtained from the Pasteur Culture Collection of Cyanobacteria (PCC) from the Institut Pasteur (Paris, France). The medium solution recipe was based on the modified ASN-III recipe recommended by the PCC and used by Ref. [21] for Synechococcus PCC 8806: 427 mM NaCl, 9.8 mM MgCl2·6H2O, 6.7 mM KCl, 8.8 mM NaNO3,14.2 mM MgSO4·7H2O, 3.4 mM CaCl2·2H2O, 0.19 mM Na2CO3, 0.09 mM K2HPO4, 0.015 mM citric acid, 0.015 mM ferric ammonium citrate, 0.0015 mM disodium magnesium EDTA, 10 µg/mL vitamin B12, and trace metal mix A5+Co (composition and concentrations listed below). We also added an additional 2.5 mM of NaHCO3 to increase carbonate alkalinity. A 2000 mL batch of the medium was made and split into six 1000 mL glass bottles, each with 300 mL of the medium. The remaining 200 mL of medium was reserved for later use. We added 0.3 mL of the trace metal mix A5+Co to each bottle. The trace metal mix A5+Co contains 2.86 g/L H3BO3, 0.079 g/L CuSO4·5H2O, 0.049 g/L Co(NO3)2·6H2O, 1.81 g/L MnCl2·4H2O, 0.390 g/L Na2MoO4·2H2O, and 0.222 g/L ZnSO4·7H2O. The composition of this medium most closely resembles that of seawater as opposed to freshwater, although the trace metal concentrations in the medium are two to five orders of magnitude greater than that of average seawater [4]. All six bottles of the medium and an additional bottle with the leftover medium were autoclaved at 121 °C for 1 h. The initial pH of each bottle was 8.05. Then, 10 mL of the medium was sampled to obtain the initial elemental concentrations of the medium post-autoclaving.
Three bottles were inoculated with Synechococcus PCC 8806 and three bottles remained sterile. The three growth bottles were inoculated with 1.5 mL of the mother culture. The entire experiment was run in duplicate so that each bottle had a duplicate bottle (totaling twelve bottles) to review the replicability of the results. All the experimental bottles were organized around a 60 Watt incandescent light with a 12 h on–12 h off cycle for 36 days.
2.2. Sampling the Experiments
During the experiment, two replicates of each treatment type were left untouched, and one was sampled for cells counts and pH measurements. Cell counts were performed on days 4, 8, 16, 24, and 36 of the experiments (Figure S1). The pH was measured at a single timepoint on days 4 and 8 and was measured every 2 h for 24 h on day 32. The pH was measured using pH strips with a ±0.2 pH units sensitivity.
On day 36, the replicate bottles of each treatment that were untouched for the duration of the 36 days (i.e., not used for the cell counts and pH measurements) were sampled for trace and major element concentrations (see Section 2.3 and Section 2.4). For these measurements, the samples were split into “mineral” measurements (both treatments, to measure the elemental concentrations of the solid phases that formed over the course of the experiment), “cell” measurements (growth treatment only, to measure the elemental concentrations of the Synechococcus cells that grew), and “media” measurements (initial samples taken from the solution before being split into treatment bottles; final media samples taken from both treatments). To obtain the medium trace element concentrations, we sampled 1.05 mL of the solution from the treatment bottles (final medium concentrations), and the reserved leftover medium bottle (initial medium concentrations). To obtain the mineral samples, 10 mL of each bottle was sampled. An additional mineral sample was created by adding 800 µL of sterile 1M NaOH to 10 mL of sterile medium with the goal of rapidly precipitating CaCO3 (named the “crashed” mineral sample to describe that the mineral “crashes” out of the solution as pH increases). The samples were centrifuged and the supernatant was discarded. We then added 15% H2O2 buffered to pH 8 to each sample, let them sit for 6 h, centrifuged them and discarded the supernatant, and repeated this step once more. The samples were then rinsed 3× with ultra-pure deionized water and dried. For simplicity, the mineral samples from the sterile treatment are labeled “abiotic mineral” and the mineral samples from the Synechococcus treatment are label “biotic mineral” samples, although we note this is not to assign biogenicity but rather to distinguish which treatment the sample came from. To obtain the cell samples, we centrifuged 10 mL of water from each growth treatment bottle. We then transferred the cell pellets to microcentrifuge tubes prepared with a sucrose gradient to density separate the cells from the solid phases, as described in Ref. [22]. The microcentrifuge tubes were prepared by layering 300 µL of sucrose solutions in order of decreasing concentrations: 50%, 40%, 30%, and 20% (w/v). The tubes were centrifuged at 250× g for 30 min. After centrifuging, the concentrated cells in the upper 300 µL were transferred to new microcentrifuge tubes and rinsed with a 427 mM NaCl solution (same concentration as growth medium) three times and dried.
2.3. Sample Digestion and Dilution for ICP-MS Measurements
Each sample type was digested and diluted in nitric acid to be measured on the Inductively Coupled Plasma-Atomic Emission Spectroscopy (ICP-AES) and Mass Spectrometer (ICP-MS) (Shimadzu Corporation, Kyoto, Japan). The dried samples were weighed in Teflon containers and digested in 2 mL of 8 N HNO3− at 120 °C for 12 h with lids on. Once the samples returned to room temperature, 4 drops of 30% H2O2 were added to each sample. The samples were heated to 110 °C with lids off until fully evaporated (approximately 24 h). Lastly, different volumes of 2% double-distilled HNO3− were added, according to the sample type and expected concentration, for the ICP-MS measurements. For the solid samples (cells and minerals), 3.5 mL were added. For the medium solution samples, 6.5 mL were added. The samples were heated to 105 °C overnight. Once cooled to room temperature, 1 mL was reserved of each sample for the ICP-AES measurements and the rest was measured on ICP-MS. B, Cu, Co, Fe, Mn, Mo, and Zn were measured on a Thermo Fisher Scientific iCAP RQ ICP-MS at the Laboratory for Isotopes and Metals in the Environment (LIME) at Penn State University.
2.4. Sample Digestion and Dilution for ICP-AES Measurements
The samples were further diluted for ICP-AES: 7 mL of 2% double-distilled HNO3− were added to the 1 mL of reserved diluted sample and measured on ICP-AES. Ca, Mg, K, and P were measured on the Thermo Scientific iCAP 7400 ICP-AES (Thermo Fisher Scientific, Waltham, MA, USA) at the Laboratory for Isotopes and Metals in the Environment (LIME) at Penn State University.
2.5. SEM, EDS, and EPMA Sample Preparation and Methods
Samples from each treatment were filtered onto filter paper, fixed in 2.5% glutareldahyde for 30 min, ethanol rinsed in 20, 50, 70, 80, 90, and 100% ethanol, and dried. The filters were mounted on aluminum stubs and coated with 12 nm of carbon before being analyzed. Secondary electron images were taken on a scanning electron microscope (SEM) using a Thermo-Scientific Verios G4 SEM (Thermo Fisher Scientific, Waltham, MA, USA) with a beam accelerating voltage of 5 kV, a beam current of 0.05–0.1 nA, and working distances of 0.05–0.1 mm. Elemental presence/absence was evaluated using energy dispersive X-ray spectroscopy (EDS) (Bruker, Billerica, MA, USA) on the Oxford Instruments X-MaxN detector (Oxford Instruments, Oxfordshire, UK) using an accelerating voltage of 10 kV. Both measurements were taken at the Penn State Materials Characterization Lab.
On the same filters, electron probe microanalysis (EPMA) (JEOL Ltd., Tokyo, Japan) was used to determine elemental abundances. Major element concentrations were measured using a Cameca SXFive Electron Probe Micro-Analyzer (EPMA) (JEOL Ltd., Tokyo, Japan) located in the Materials Characterization Laboratory at Penn State. The instrument has five wavelength dispersive spectrometers and an LaB6 electron source. An accelerating voltage of 15 keV and a beam current of 30 nA were used, and the beam diameter was focused to <1 mm. A pentaerythritol (PET) crystal was used to analyze Ca and P, a lithium fluoride (LLIF) crystal was used to analyze Fe and Mn, a thallium acid phthalate (LTAP) crystal was used to analyze Mg and Si, and two different pseudocrystals were used to analyze O (PC1) and C (PC2). The produced X-ray intensities were subject to a PAP (phi-rho-z) correction, which is an algorithm used to correct for matrix effects of different materials (described in Ref. [23]). After correction, the intensities were converted to concentrations by comparison to carbonate, phosphate, and silicate mineral standards.
2.6. Using PHREEQC to Calculate Mineral Saturation States
The R package PHREEQC and the Pitzer database [24] were used to calculate the mineral saturation states of aragonite, calcite, dolomite, magnesite, and brucite in the medium solution. PHREEQC is an aqueous geochemistry modeling program that can use various ion-association models to model a variety of geochemical features. The Pitzer database was chosen for our modeling in PHREEQC because it performs best in high ionic strength/high salinity solutions [24]. PHREEQC uses ion activities to calculate mineral saturation indices (ex. SIcalcite = , where and are the activities of Ca2+ and CO32− in solution). In PHREEQC, the Pitzer database relies on the Pitzer equations and Pitzer “specific-ion-interaction” model to calculate the ion activity coefficients for the relevant ions [24,25,26].
To model the ion activities and saturation indices, the experimental medium alkalinity, pH, temperature, and dissolved ion concentrations were used as inputs to PHREEQC. The mineral saturation state of each mineral was calculated using the relationship Ω = 10SI.
3. Results
3.1. pH and Carbonate Mineral Saturation
The pH of the Synechococcus treatment medium was time-dependent based on the pseudo-diurnal light cycle. We measured the pH of the growth experiment bottles and the sterile medium bottles every two hours over one 12 h light cycle and one 12 h dark cycle to determine the level of change in one day (Figure 2). The pH strips used have an accuracy of ±0.2 pH units for any pH measurement. The sterile medium pH measurement remained constant at a pH of 8. The growth experiment medium pH increased from 8 to 9.4 over the 12 h light cycle and returned to a pH of 8 over the 12 h dark cycle. At pH = 8, the solution was saturated with respect to calcite, dolomite, and magnesite and undersaturated with respect to aragonite. At pH = 9.4, the solution also became saturated with respect to aragonite (aragonite has a higher solubility constant (Ksp), so it requires a higher concentration of the carbonate ion to reach saturation, Ω > 1 e.g., Ref. [26]). For both pHs, the order of the most saturated to least saturated carbonate minerals in the solution is dolomite > magnesite > calcite > aragonite (Table 1). The saturation state for brucite was also calculated because of the presence of a MgO-OH phase in our samples (Section 3.3 and Section 4.2), but was undersaturated for both pH scenarios (Table 1).
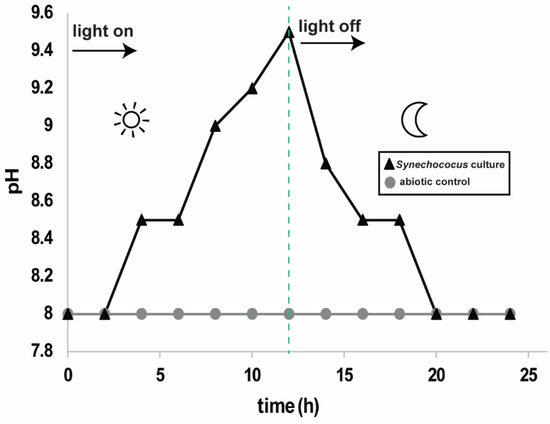
Figure 2.
pH of the Synechococcus culture and of the sterile medium over one 24 h period which contained a 12 h light and 12 dark cycle. The dotted green line represents the time at which the light was switched off.

Table 1.
Saturation states of various minerals modeled using PHREEQC for the low and high end of the pH observed in the Synechococcus culture and elemental concentrations of the initial medium solution based on atomic emission spectroscopy (AES) data for measured elements (Mg, K, Ca, P, Fe) and calculated concentrations for species not measured on the AES (Na, Cl, S, NO3−, HCO3−).
3.2. Trace Element Enrichment Factors from ICP-MS Trace Element Measurements
All the data and enrichment factors are reported for data normalized to the Mg concentration in the sample, and the duplicate bottle data are shown in Figure S2. While the distribution coefficients for the partitioning of elements into calcite are often normalized to Ca (known as Kd), we chose to normalize to a cation that was relevant across all the sample types for which we evaluated enrichments (cells, solution, and mineral phases). We chose Mg because it is the second most abundant cation in our experiment next to Na. Na could not be used for normalization because the use of NaCl solution in the experiment’s sampling process renders the Na concentration of our samples inapplicable.
Synechococcus PCC 8806 cells and associated minerals were enriched above the initial growth medium concentrations for all the trace elements measured except Mo (Figure 3). The minerals precipitated in the abiotic experiments were enriched for all trace metals except Co and Mo. Of all the measured trace elements, Fe had the largest enrichment relative to the initial medium concentrations in the cells, biotic minerals, and abiotic minerals. The biotic minerals had the largest Fe enrichment factor (averaging approximately 2300 times more enriched than the initial medium concentration) (Figure 3; Table 2). The cell’s enrichment factor for Fe was ~2000. The abiotic mineral enrichment factor for Fe was ~300. The cells were more enriched than the biotic and abiotic minerals for B, Cu, Mn, P, and Zn. After Fe, the second most enriched in the cells was Cu, followed by Zn, P, and Mn, respectively, all with enrichment factors >100 (Figure 3; Table 2). In the biotic minerals, following Fe, Zn, Cu, and Mn are the most enriched, respectively, all with enrichment factors >50 (Figure 3; Table 2). For the abiotic minerals, Zn was also the second most enriched after Fe, followed by Mn and Cu, respectively, each with enrichment factors ranging from ~45 to 65. B, Co, and Mo all had enrichment factors < 3 for the cells, biotic minerals, and abiotic minerals.
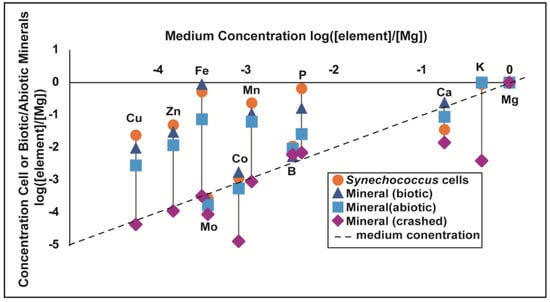
Figure 3.
Data from this study for measured trace and major element concentrations in Synechococcus cells, minerals that precipitated in the Synechococcus pure culture, called “biotic” minerals, minerals that precipitated in the sterile medium, called “abiotic” minerals, and minerals that were rapidly precipitated from medium solution, called “crashed” minerals. All data are normalized to Mg. Medium concentration for each element is the measured concentration after autoclaving initial medium. The dotted line represents where the concentration of the sample matches the concentration of the medium, indicating no enrichment relative to the solution.
Table 2.
Calculated enrichment factors for measured trace and major elements for each sample type. Enrichment factors were calculated by taking the element’s normalized concentration in the sample divided by its normalized concentration in the initial medium concentration; example: (Zn/Mg)cells/(Zn/Mg)media.
We also measured the trace element concentrations of carbonate that was crashed (rapidly precipitated) from the abiotic medium by rapidly increasing pH with NaOH addition (Section 2.2). Of the trace elements measured for the crashed minerals, only B, Fe, and P were enriched relative to the medium concentrations, but the enrichment factors for both were <2. The Mn, Cu, Zn, Mo, Co, Ca, and K concentrations in the crashed precipitates were all depleted relative to the medium concentration.
3.3. Scanning Electron Microscopy and Electron Probe Micro-Analysis
SEM images of the filters from the abiotic and crashed treatment samples showed euhedral to subhedral crystals that averaged 10 µm in length and width (Figure 4). EDS maps of the crashed sample show that the crystals are primarily Ca, C, and O (Figure S3). EPMA data showed similar patterns for the abiotic samples, suggesting the crystals in both cases are likely a CaCO3 mineral with morphologies similar to calcite (Figure 5A). In addition to the crystals, the sterile medium showed a second phase that was present both as a thin layer on the surface of the filter (Figure 4B) and as tabular grains with rosette-like morphology (Figure 4C), and at times appeared to be a thin layer covering the calcium carbonate crystal surface (Figure 4A). EDS mapping showed this phase contained large amounts of magnesium and oxygen with minor amounts of silicon and carbon (Figure S4). We used EPMA to quantify the atomic % of each element in this phase, which provided an approximate stoichiometry of Mg5C3.5O15Si (Table S1; Figure 5A).
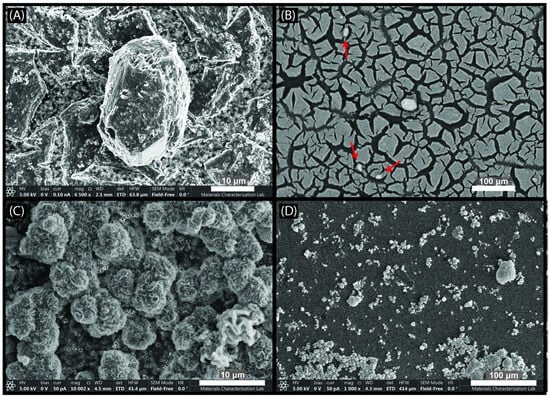
Figure 4.
SEM images of abiotic mineral samples. (A) Example of crystal precipitate from the “crashed” mineral sample calcite crystals with the Mg-O-C-Si phase in the background. (B) Abiotic mineral sample showing thin film of the Mg-O-C-Si phase (resembling mud cracks on the filter) and small crystals with calcite-like morphology and composition on the surface (arrows). (C,D) Images of the floret texture occasionally found in the Mg-O-C-Si phase, pictured from the abiotic mineral filter.
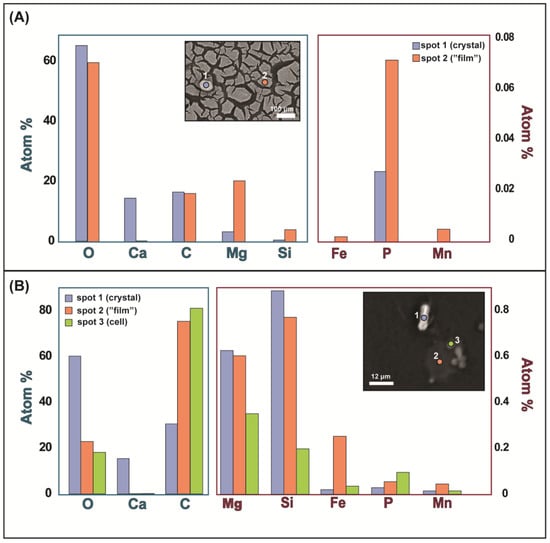
Figure 5.
Atomic % of elements analyzed using EPMA. In both panels, data for elements present in amounts > 1% are in the left plot and data for elements present in amounts < 1% are in the right plot. Top panel (A) shows data from spots 1 and 2 (shown in inset image) of abiotic mineral samples obtained from filtering sample from the sterile medium bottle. In panel (A), spot 1 is on a crystal with calcite-like morphology and composition and spot 2 is on the unknown phase resembling a film with a mud-crack texture on the filter. Additional spots and data for this image are shown in Figure S7 and Table S1. Bottom panel (B) shows data from spots 1, 2, and 3 (shown in inset image) of the Synechococcus treatment medium. In panel (B), spot 1 is on a crystal with calcite-like morphology and composition, spot 2 is on what resembled the unknown, film-like phase, and spot 3 is on a cell.
SEM images of the filters from the growth experiment bottle medium show crystals that were 5 to 10 µm long in close association with the Synechococcus cells on the filter paper (Figure 6). The crystals were prismatic and typically oblong and displayed bladed surfaces instead of smooth surfaces on the crystal faces. In some cases, the mineral precipitate appeared to be nucleating on or connected to the cell’s surface, while in other cases the mineral was not connected to any cells. The crystal morphology is very similar to naturally occurring whiting crystals collected from a whiting even in Green Lake, NY, that were identified as calcite [9]. Both the EPMA data and EDS data on the crystals from the growth treatments showed that the composition is primarily Ca, C, and O, supporting the likelihood that the crystals are calcite (Figure 5B and Figure S5). The phase containing magnesium, oxygen, silicon, and carbon was also present on the growth experiment medium filters but was less abundant (Figure 5B and Figure S5). EPMA was used to determine whether the texture on the surface of the crystals was caused by the Mg-O-C-Si phase that was present in the abiotic samples. Both Mg and Si were present on the crystal surface, cell surface, and what appeared to be a film-like material similar to what was found in the abiotic medium; however, the Mg and Si were lower in abundance than both the crystal and the film material from the abiotic sample (Figure 5). The EPMA data for what visually appeared to be the similar film-like material in the biotic treatment instead appeared to resemble a burst cell by atom % (Figure 5B).
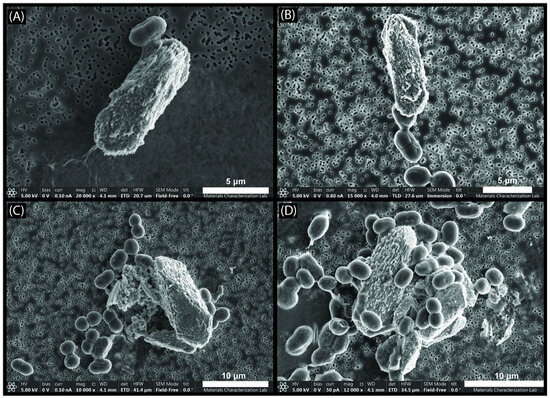
Figure 6.
SEM images of biotic mineral samples from the Synechococcus culture. (A) Cell attached to a calcite crystal that appears to have nucleated on the cell. (B) Single calcite crystal potentially nucleated on a cell that was actively dividing. (C,D) multiple calcite crystals surrounded by cells, multiple of which appear to be attached to the calcite crystals and potentially each other.
4. Discussion
4.1. Enrichments of Trace Elements in Cells and Biotic Calcite
The enrichment of nearly all the trace elements measured was highest in the cellular material and second highest in the biotic mineral material, suggesting that the chemical enrichment of certain elements relative to the environment can distinguish life from nonlife and potentially serve as a biosignature. However, not all elements were uniquely enriched in the cells versus the minerals. Here, we discuss the trace elements that were most enriched in the cells and biotic minerals and potential reasons for their enrichment. We then discuss how the “mineral” portion of the samples analyzed for bulk and trace elements included all solid-phase material in the experimental medium, not only carbonate, and how that impacts our interpretations.
4.1.1. Fe
The cells, biotic minerals, and abiotic minerals were all highly enriched in Fe relative to the medium concentration. Fe is used as a co-factor in most cellular life but is particularly needed in cyanobacteria, resulting in its enrichment in the cell samples. The photosynthetic electron transport used by cyanobacteria contains Fe-demanding photosystems (PSI and PSII) [27,28,29]. As a result, many cyanobacterial clades have developed adaptations to uptake Fe due to the low available Fe in most oxygenated environments on Earth, and therefore become Fe-enriched relative to their environment [30,31,32].
According to our experiments, Fe enrichment may be non-unique to cellular material. The Fe enrichment in the biotic minerals was greater than the cells, although within an order of magnitude of each other. The abiotic minerals were also enriched, but by an order of magnitude less than the cells and biotic minerals. The temperature, precipitation rate, crystal surface structure, and concentration of the element are the main physical controls on how much a given element is incorporated into the calcite crystal lattice [33,34]. In our experiments, the larger enrichment of Fe in the biotic minerals than the abiotic ones may be explained by precipitation in proximity to the cells. That is, the Fe-obtaining adaptations of cyanobacteria may locally concentrate Fe around the cell. The mechanisms of concentrating Fe near the cell include Fe sorption onto EPS [35,36] and extracellular reduction of Fe(III) to Fe(II) [32,37,38]. Both mechanisms would increase Fe availability around the cell, where the biotic calcite is precipitating (Figure 6).
4.1.2. Cu, Zn, and Mn
The enrichments of Cu, Zn, and Mn had similar patterns in our experiment: the cells were most enriched, followed by the biotic minerals, then the abiotic minerals. Like Fe, Cu, Zn, and Mn are all needed by most bacteria as enzymatic cofactors and in proteins. For example, cyanobacteria require Mn in PSII e.g., Ref. [39], Cu in the thylakoid protein plastocyanin e.g., Refs. [40,41], and Zn in carbonic anhydrase e.g., Ref. [42], often causing enrichment of these metals in the cell relative to the environment, as found in our experiments (Figure 3). Furthermore, the mechanisms used by cyanobacteria to concentrate Cu, Zn, and Mn metals around the cell, such as adsorption [43], may also have caused the enrichment of these metals in the calcite that precipitated near the cells (Figure 6). However, while Cu is the second most enriched trace element in the cells (after Fe), Zn is the second most enriched in the biotic minerals, followed by Cu. This may be due to the differences in the extracellular binding affinities of the metals to cyanobacterial cell walls: at a pH of 8, the absorption of Zn > Cu on the cell wall [43], concentrating Zn near the cell to a greater amount than Cu and possibly resulting in a higher Zn than Cu enrichment in the biotic mineral precipitate.
4.1.3. P
Phosphorus is required by all cells for important cellular machinery such as ATP, nucleic acids, and phospholipids e.g., Refs. [44,45]. This high demand makes phosphorus one of the limiting nutrients for phytoplankton growth in the ocean [4]. Cyanobacteria have been documented to consume and store excess P, known as “luxury phosphorus uptake”, which has been shown to cause variability in the C:P stoichiometry of certain strains of Synechococcus depending on the concentration in the cell’s environment [44,46]. Despite the high demand, the P enrichment factor of the cells in our experiment is lower than that of Fe, Cu, Zn, and Mn. P was still highly enriched in the cells—greater than 100× the medium concentration relative to Mg (Table 2). The P concentrations of the cells, when normalized to Mg concentrations, are the highest out of all the trace elements considered. The P concentration in the medium, however, is an order of magnitude higher than that of the other trace elements measured, which results in a lower calculated enrichment factor of the cells relative to the medium.
The biotic minerals were also enriched in P relative to the medium, but by an order of magnitude less than the cells. The biotic minerals were, however, more enriched in P than abiotic minerals. This was confirmed by the EPMA spot data (Figure 5). Previous work has demonstrated that biogenic calcite is not more enriched in P than abiotic calcite by default, but instead that P concentrations in carbonate minerals are proportional to the concentration in the solution and inversely proportional to the carbonate alkalinity of the solution, independent of the origin of the carbonate [47,48]. We would then expect our biotic minerals to have equivalent or even less P enrichment (due to cellular consumption of P) than the abiotic minerals. Our contradictory results suggest that perhaps calcite that precipitates extremely near or on cyanobacteria is impacted by the heightened concentrations of P near the cell, potentially sorbed to EPS.
4.1.4. Enrichment in Abiotic Minerals—Slow vs. Rapid Precipitation
The enrichments of the measured trace elements in the slow precipitating abiotic mineral fraction were consistently lower than the biotic mineral fraction when normalized to Mg, although this pattern may be an artifact of higher Mg concentrations in the abiotic mineral samples (see Section 4.2). As previously discussed, higher enrichment in biotic minerals may result from precipitation near cells because cells can concentrate trace elements in their microenvironment whereas the abiotic carbonate precipitated in a solution that likely is more spatially homogenous with respect to dissolved ion concentrations.
The extremely minor, or entire lack of, enrichment for all the trace elements measured was unique to the abiotic carbonate minerals crashed from the solution. This may be partly due to the precipitation rate, as a higher precipitation rate is inversely correlated with partition coefficients of some trace metals [19]. However, this is more likely due to the much higher concentration of the MgO phase present in these samples, as inferred by the higher Mg/Ca ratio (Table S2).
4.2. Caveats Due to Mg-O-C-Si Mineral Phase
The Mg-O-C-Si solid phase was unanticipated in the experiments. Silicon was not intentionally added but may have been present in minor amounts of one or more of the salts used to create the medium, or from the filters that were used for SEM and EPMA analysis (SEM map of blank filter shows some minor silicon; Figure S6). The carbon present in this phase also may be an artifact of the conductive carbon coating used to perform SEM and EPMA but is ~3% elevated in this phase relative to the blank filter. If we exclude the carbon and silicon, the stoichiometry of this phase appears similar to brucite (Mg(OH)2) (Table S1). This phase appears as thin sheets and occasionally clusters of rosettes, reminiscent of brucite “nanoflowers” [49]. Magnesium hydroxides can form from the addition of NaOH to solutions, which we used to buffer the pH of our medium. Additionally, brucite is a known intermediate phase in the formation of magnesium carbonates. Although the carbonation of brucite occurs very slowly at Earth surface conditions due to kinetic inhibitions [50], the presence of organic ligands like acetate may accelerate Mg carbonate formation [51,52]. Minor amounts of brucite carbonation into a Mg carbonate phase could help to explain the carbon found in this phase, and the very high saturation states of Mg-carbonates in the medium indicate the possibility of magnesite formation (Table 1). The presence of silicon, if not attributable to the filter, could instead suggest that this is an amorphous phyllosilicate precursor. However, most phyllosilicate minerals are >15 wt.% silicon, and the phase on our filter is <10 wt.% silicon.
The presence of this phase complicates the data interpretations. High Mg/Ca ratios in the biotic and abiotic mineral samples suggest that this phase was significantly present in the mineral fraction analyzed for trace and major elements. As a result, our enrichment factors for the Synechococcus treatment cannot be considered as solely the partitioning between cyanobacterial cells, CaCO3 minerals that form from cyanobacterial photosynthesis, and the solution. Instead, it represents the partitioning between all the solid-phase minerals that formed and the cyanobacterial cells. The relative amount of the Mg-O-C-Si phase appears to be lower in the biotic mineral samples than the abiotic mineral samples, which impacts the results because the samples are normalized to their Mg concentrations. We addressed this by showing how trends may change when normalizing to a sample’s Mg + Ca or to only Ca (Figure S8). When normalizing only to Mg + Ca, most trends hold. When normalizing to just Ca, the cells remain more enriched than the minerals for most trace elements, but the abiotic minerals become either as enriched or slightly more enriched than the biotic mineral samples for all the measured trace elements (Figure S8). Thus, the finding that the biotic mineral enrichments are greater than the abiotic mineral enrichments will require further investigation to confirm it.
4.3. Implications for Biosignature Use and Microbial Carbonates in the Rock Record
The consistent enrichment of trace elements in the Synechococcus cells relative to both the medium solution and the precipitated minerals suggests that enrichment of trace metals above that of matrix and other abiotic fabrics in the host rock should be considered a biosignature. Furthermore, our use of growth medium with higher-than-seawater trace metal concentrations may mute the microbial enrichments relative to the growth solution, making our results a lower bound on what may be expected in the natural world.
To use the biosignature on samples from the rock record of Earth or other planets in the Solar System, preservation of the geochemical signature through time is necessary. Preservation may depend on whether the bioaccumulation of trace elements within the cellular material can be translated to carbonate minerals if the cellular material is not preserved, which may occur through processes like the microbial mat-induced precipitation of carbonate [18]. Such preservation has been observed in the rock record in ancient microbialites [53]. However, we observed enrichments of trace elements in both the biotic and abiotically formed minerals, which suggests that the degree of enrichment within mineral material matters to distinguish life from nonlife. Furthermore, trace elements with ionic radii that are smaller than Ca, like those most enriched in our samples (Cu, Fe, Mn, and Zn), are preferentially concentrated into carbonate minerals during diagenesis [20,54]. This complicates the use of trace metal enrichments in carbonates from the rock record to assign biogenicity. In contrast, diagenetic fluids are likely to decrease the phosphorus concentration of carbonate minerals over time, depending on the P concentration of the burial fluid [55,56]. The co-occurrence of both trace metals (Cu, Fe, Mn, and Zn) and P enrichments in a carbonate would provide strong evidence for biogenicity.
It is important to target the least altered samples when evaluating the biogenicity of microbial facies in the rock record. Using methods to assess levels of post-depositional alteration, such as textural analysis, Sr concentrations, and rare earth element measurements, is important to perform alongside any biosignature analysis [57,58]. Additionally, using in situ measurements that allow for spatial specificity in addition to or instead of bulk measurements can help target primary/unaltered material. In our experiments, in situ methods like EDS and EPMA allowed us to supplement the bulk mineral measurements and provided evidence for an extra mineral phase in addition to calcite, but the resolution of these instruments were not high enough to detect the trace metals that were present in concentrations at the parts per billion scale. Nano-scale Secondary Ion Mass Spectrometry (NanoSIMS) and/or ICP-MS performed using laser ablation on rock thin section may be optimal methods to search for co-occurring P and trace metal enrichments on a µm scale in carbonate minerals to assess the biogenicity of carbonate material [16,59].
5. Conclusions
Microbial processes impact the geochemical attributes of mineralogical materials, providing potential for the development of inorganic biosignatures. Our data indicate that a combination of both trace metal enrichments of Cu, Fe, Mn, and Zn and P enrichments in carbonate rocks and/or organic material within carbonate minerals (relative to the surrounding matrix) provide promising axes of evidence for an inorganic geochemical biosignature. Inorganic biosignatures may need to be multi-faceted, so based on the work presented here, trace element enrichments could be used alongside evidence such as facies analysis and isotopic composition when diagnosing biogenicity. Future work to isolate the carbonate phases formed by cyanobacteria, separate from other minerals that form (such as magnesium oxide/hydroxide phases), and to determine whether distribution coefficients (Kd) for trace elements differ from abiotically formed carbonate would help to direct biosignature use further.
Supplementary Materials
The following supporting information can be downloaded at: https://www.mdpi.com/article/10.3390/min15040378/s1, Figure S1: Cell Counts; Figure S2: Replicate experiment trace metal data; Figure S3: EDS elemental maps of image from Figure 4A; Figure S4: EDS elemental maps of image from Figure 4C; Figure S5: EDS elemental maps of image from Figure 6C; Figure S6: DS elemental maps of a blank filter; Figure S7. Spot locations for EPMA data in Table S1; Figure S8. Normalization of sample elemental data by only Ca+Mg (A) or Ca only (B); Table S1. EPMA data for spots labeled in Figure S5; Table S2. Mg/Ca ratios for all samples.
Author Contributions
Conceptualization, data curation, investigation, methodology, visualization, validation, writing—original draft, H.L.; conceptualization, resources, supervision, writing—review and editing, M.I.; conceptualization, data curation, methodology, writing—review and editing, G.S.; conceptualization, funding acquisition, methodology, project administration, resources, supervision, writing—review and editing, C.H.H. All authors have read and agreed to the published version of the manuscript.
Funding
This research was partly funded by NASA Astrobiology NfoLD (Network for Life Detection) Grant 80NSSC18K1140 to the Laboratory for Agnostic Biosignatures and the Penn State Department of Geosciences graduate student scholarships.
Data Availability Statement
The original raw data presented in the study, if not already in the Supplementary Files, are openly available here: https://doi.org/10.26208/B01C-8M65 (created on 18 February 2025).
Acknowledgments
Thank you to the Penn State Materials Research Institute technical staff, Julie Anderson for help running and obtaining images from the scanning electron microscope, and Maureen Feineman for help running and obtaining data from the Electron Microprobe. Thank you also to the technical staff of the Laboratory for Isotopes and Metals in the Environment, Laura Lieremann for running and obtaining data from the ICP-AES, and Dongxiang Wang for running and obtaining the data from the ICP-MS. Lastly, thank you to Zhidan Zhang for obtaining the cyanobacteria and preparing them for use.
Conflicts of Interest
The authors declare no conflicts of interest.
References
- The MSR Campaign Science Group (MCSG); Czaja, A.D.; Zorzano, M.; Kminek, G.; Meyer, M.A.; Beaty, D.W.; Sefton-Nash, E.; Carrier, B.L.; Thiessen, F.; Haltigin, T.; et al. Report of the Science Community Workshop on the proposed First Sample Depot for the Mars Sample Return Campaign. Meteorit. Planet. Sci. 2023, 58, 885–896. [Google Scholar] [CrossRef]
- Geider, R.; La Roche, J. Redfield revisited: Variability of C:N:P in marine microalgae and its biochemical basis. Eur. J. Phycol. 2002, 37, 1–17. [Google Scholar] [CrossRef]
- Redfield, A.C. The Biological Control of Chemical Factors in the Environment. Am. Sci. 1958, 46, 230A-221. [Google Scholar]
- Moore, C.M.; Mills, M.M.; Arrigo, K.R.; Berman-Frank, I.; Bopp, L.; Boyd, P.W.; Galbraith, E.D.; Geider, R.J.; Guieu, C.; Jaccard, S.L.; et al. Processes and patterns of oceanic nutrient limitation. Nat. Geosci. 2013, 6, 701–710. [Google Scholar] [CrossRef]
- Huertas, M.J.; López-Maury, L.; Giner-Lamia, J.; Sánchez-Riego, A.M.; Florencio, F.J. Metals in Cyanobacteria: Analysis of the Copper, Nickel, Cobalt and Arsenic Homeostasis Mechanisms. Life 2014, 4, 865–886. [Google Scholar] [CrossRef]
- Bergmann, K.D.; Grotzinger, J.P.; Fischer, W.W. Biological Influences on Seafloor Carbonate Precipitation. Palaios 2013, 28, 99–115. [Google Scholar]
- de Brito, M.M.; Bundeleva, I.; Marin, F.; Vennin, E.; Wilmotte, A.; Plasseraud, L.; Visscher, P.T. Properties of exopolymeric substances (EPSs) produced during cyanobacterial growth: Potential role in whiting events. Biogeosciences 2023, 20, 3165–3183. [Google Scholar] [CrossRef]
- Schultze-Lam, S.; Beveridge, T.J.; Des Marais, D.J. Whiting events: Biogenic origin due to the photosynthetic activity of cyanobacterial picoplankton. Limnol. Oceanogr. 1997, 42, 133–141. [Google Scholar] [CrossRef]
- Stanton, C.; Barnes, B.D.; Kump, L.R.; Cosmidis, J. A re-examination of the mechanism of whiting events: A new role for diatoms in Fayetteville Green Lake (New York, USA). Geobiology 2022, 21, 210–228. [Google Scholar] [CrossRef]
- Thompson, J.B. Microbial Whitings. In Microbial Sediments; Riding, R.E., Awramik, S.M., Eds.; Springer: Berlin/Heidelberg, Germany, 2000; pp. 250–260. [Google Scholar] [CrossRef]
- Obst, M.; Wehrli, B.; Dittrich, M. CaCO3 nucleation by cyanobacteria: Laboratory evidence for a passive, surface-induced mechanism. Geobiology 2009, 7, 324–347. [Google Scholar] [CrossRef]
- Schultze-Lam, S.; Harauz, G.; Beveridge, T.J. Participation of a cyanobacterial S layer in fine-grain mineral formation. J. Bacteriol. 1992, 174, 7971–7981. [Google Scholar] [CrossRef] [PubMed]
- Schultze-Lam, S.; Beveridge, T.J. Physicochemical characteristics of the mineral-forming S-layer from the cyanobacterium Synechococcus strain GL24. Can. J. Microbiol. 1994, 40, 216–223. [Google Scholar] [CrossRef]
- Webb, G.E.; Kamber, B.S. Trace Element Geochemistry as a Tool for Interpreting Microbialites. In Earliest Life on Earth: Habitats, Environments and Methods of Detection; Golding, S.D., Glikson, M., Eds.; Springer: Dordrecht, The Netherlands, 2011; pp. 127–170. [Google Scholar] [CrossRef]
- Dupraz, C.; Reid, R.P.; Braissant, O.; Decho, A.W.; Norman, R.S.; Visscher, P.T. Processes of carbonate precipitation in modern microbial mats. Earth-Sci. Rev. 2009, 96, 141–162. [Google Scholar] [CrossRef]
- Kamber, B.S.; Webb, G.E. Transition metal abundances in microbial carbonate: A pilot study based on in situ LA-ICP-MS analysis. Geobiology 2007, 5, 375–389. [Google Scholar] [CrossRef]
- Sforna, M.C.; Daye, M.; Philippot, P.; Somogyi, A.; van Zuilen, M.A.; Medjoubi, K.; Gérard, E.; Jamme, F.; Dupraz, C.; Braissant, O.; et al. Patterns of metal distribution in hypersaline microbialites during early diagenesis: Implications for the fossil record. Geobiology 2017, 15, 259–279. [Google Scholar] [CrossRef]
- Warke, M.R.; Edwards, N.P.; Wogelius, R.A.; Manning, P.L.; Bergmann, U.; Egerton, V.M.; Kimball, K.C.; Garwood, R.J.; Beukes, N.J.; Schröder, S. Decimeter-scale mapping of carbonate-controlled trace element distribution in Neoarchean cuspate stromatolites. Geochim. Cosmochim. Acta 2019, 261, 56–75. [Google Scholar] [CrossRef]
- Lorens, R.B. Sr, Cd, Mn and Co distribution coefficients in calcite as a function of calcite precipitation rate. Geochim. Cosmochim. Acta 1981, 45, 553–561. [Google Scholar] [CrossRef]
- Rimstidt, J.; Balog, A.; Webb, J. Distribution of trace elements between carbonate minerals and aqueous solutions. Geochim. Cosmochim. Acta 1998, 62, 1851–1863. [Google Scholar] [CrossRef]
- Lee, B.D.; Apel, W.A.; Walton, M.R. Calcium carbonate formation by Synechococcus sp. strain PCC 8806 and Synechococcus sp. strain PCC 8807. Bioresour. Technol. 2006, 97, 2427–2434. [Google Scholar] [CrossRef]
- Yamamura, H.; Hayakawa, M.; Iimura, Y. Application of sucrose-gradient centrifugation for selective isolation of Nocardia spp. from soil. J. Appl. Microbiol. 2003, 95, 677–685. [Google Scholar] [CrossRef]
- Pouchou, J.L.; Pichoir, F. Basic expression of ‘PAP’ computation for quantitative EPMA. In Proceedings of the 11th International Congress on X-ray Optics and Microanalysis (ICXOM), London, ON, Canada, 4–8 August 1986; pp. 249–253. [Google Scholar]
- Parkhurst, D.L.; Appelo, C.A.J. Description of input and examples for PHREEQC version 3: A computer program for speciation, batch-reaction, one-dimensional transport, and inverse geochemical calculations. In Techniques and Methods; U.S. Geological Survey: Reston, VA, USA, 2013; p. 6-A43. [Google Scholar] [CrossRef]
- Plummer, L.N.; Parkhurst, D.L.; Fleming, G.W.; Dunkle, S.A. A Computer Program Incorporating Pitzer’s Equations for Calculation of Geochemical Reactions in Brines; Water-Resources Investigations Report; Department of the Interior, US Geological Survey: Reston, VA, USA, 1988; Volume 88. [CrossRef]
- Pitzer, K.S. Ion Interaction Approach: Theory and Data Correlation. In Activity Coefficients in Electrolyte Solutions, 2nd ed.; CRC Press: Boca Raton, FL, USA, 1991. [Google Scholar]
- Jordan, P.; Fromme, P.; Witt, H.T.; Klukas, O.; Saenger, W.; Krauß, N. Three-dimensional structure of cyanobacterial photosystem I at 2.5 A resolution. Nature 2001, 411, 909–917. [Google Scholar] [CrossRef]
- Kurisu, G.; Zhang, H.; Smith, J.L.; Cramer, W.A. Structure of the Cytochrome b6f Complex of Oxygenic Photosynthesis: Tuning the Cavity. Science 2003, 302, 1009–1014. [Google Scholar] [CrossRef]
- Stroebel, D.; Choquet, Y.; Popot, J.-L.; Picot, D. An atypical haem in the cytochrome b6f complex. Nature 2003, 426, 413–418. [Google Scholar] [CrossRef]
- Ferreira, F.; Straus, N.A. Iron deprivation in cyanobacteria. J. Appl. Phycol. 1994, 6, 199–210. [Google Scholar] [CrossRef]
- Morrissey, J.; Bowler, C. Iron Utilization in Marine Cyanobacteria and Eukaryotic Algae. Front. Microbiol. 2012, 3, 43. [Google Scholar] [CrossRef]
- Qiu, G.-W.; Koedooder, C.; Qiu, B.-S.; Shaked, Y.; Keren, N. Iron transport in cyanobacteria-from molecules to communities. Trends Microbiol. 2022, 30, 229–240. [Google Scholar] [CrossRef]
- Dromgoole, E.L.; Walter, L.M. Iron and manganese incorporation into calcite: Effects of growth kinetics, temperature and solution chemistry. Chem. Geol. 1990, 81, 311–336. [Google Scholar] [CrossRef]
- Paquette, J.; Reeder, R.J. Relationship between surface structure, growth mechanism, and trace element incorporation in calcite. Geochim. Cosmochim. Acta 1995, 59, 735–749. [Google Scholar] [CrossRef]
- Demirel, S.; Ustun, B.; Aslim, B.; Suludere, Z. Toxicity and uptake of iron ions by Synechocystis sp. E35 isolated from Kucukcekmece Lagoon, Istanbul. J. Hazard. Mater. 2009, 171, 710–716. [Google Scholar] [CrossRef]
- Swanner, E.D.; Wu, W.; Hao, L.; Wüstner, M.L.; Obst, M.; Moran, D.M.; McIlvin, M.R.; Saito, M.A.; Kappler, A. Physiology, Fe(II) oxidation, and Fe mineral formation by a marine planktonic cyanobacterium grown under ferruginous conditions. Front. Earth Sci. 2015, 3, 60. [Google Scholar] [CrossRef]
- Kranzler, C.; Lis, H.; Shaked, Y.; Keren, N. The role of reduction in iron uptake processes in a unicellular, planktonic cyanobacterium. Environ. Microbiol. 2011, 13, 2990–2999. [Google Scholar] [CrossRef]
- Kranzler, C.; Lis, H.; Finkel, O.M.; Schmetterer, G.; Shaked, Y.; Keren, N. Coordinated transporter activity shapes high-affinity iron acquisition in cyanobacteria. ISME J. 2014, 8, 409–417. [Google Scholar] [CrossRef]
- Umena, Y.; Kawakami, K.; Shen, J.-R.; Kamiya, N. Crystal structure of oxygen-evolving photosystem II at a resolution of 1.9 Å. Nature 2011, 473, 55–60. [Google Scholar] [CrossRef]
- Osman, D.; Cavet, J.S. Chapter 8-Copper Homeostasis in Bacteria. In Advances in Applied Microbiology; Laskin, A.I., Sariaslani, S., Gadd, G.M., Eds.; Academic Press: Cambridge, MA, USA, 2008; Volume 65, pp. 217–247. [Google Scholar] [CrossRef]
- Tottey, S.; Rich, P.R.; Rondet, S.A.; Robinson, N.J. Two Menkes-type ATPases Supply Copper for Photosynthesis in Synechocystis PCC 6803*. J. Biol. Chem. 2001, 276, 19999–20004. [Google Scholar] [CrossRef]
- Barnett, J.P.; Millard, A.; Ksibe, A.Z.; Scanlan, D.J.; Schmid, R.; Blindauer, C.A. Mining Genomes of Marine Cyanobacteria for Elements of Zinc Homeostasis. Front. Microbiol. 2012, 3, 142. [Google Scholar] [CrossRef]
- Bishop, B.A.; Flynn, S.L.; Warchola, T.J.; Alam, S.; Robbins, L.J.; Liu, Y.; Owttrim, G.W.; Alessi, D.S.; Konhauser, K.O. Adsorption of biologically critical trace elements to the marine cyanobacterium Synechococcus sp. PCC 7002: Implications for marine trace metal cycling. Chem. Geol. 2019, 525, 28–36. [Google Scholar] [CrossRef]
- Dyhrman, S.T. Nutrients and Their Acquisition: Phosphorus Physiology in Microalgae. In The Physiology of Microalgae; Borowitzka, M.A., Beardall, J., Raven, J.A., Eds.; Springer International Publishing: Cham, Switzerland, 2016; pp. 155–183. [Google Scholar] [CrossRef]
- Rao, N.N.; Gómez-García, M.R.; Kornberg, A. Inorganic Polyphosphate: Essential for Growth and Survival. Annu. Rev. Biochem. 2009, 78, 605–647. [Google Scholar] [CrossRef]
- Bertilsson, S.; Berglund, O.; Karl, D.M.; Chisholm, S.W. Elemental composition of marine Prochlorococcus and Synechococcus: Implications for the ecological stoichiometry of the sea. Limnol. Oceanogr. 2003, 48, 1721–1731. [Google Scholar] [CrossRef]
- Ingalls, M.; Blättler, C.L.; Higgins, J.A.; Magyar, J.S.; Eiler, J.M.; Fischer, W.W. P/Ca in Carbonates as a Proxy for Alkalinity and Phosphate Levels. Geophys. Res. Lett. 2020, 47, e2020GL088804. [Google Scholar] [CrossRef]
- Sø, H.U.; Postma, D.; Jakobsen, R.; Larsen, F. Sorption of phosphate onto calcite; results from batch experiments and surface complexation modeling. Geochim. Cosmochim. Acta 2011, 75, 2911–2923. [Google Scholar] [CrossRef]
- Ma, X.; Ma, H.; Jiang, X.; Jiang, Z. Preparation of magnesium hydroxide nanoflowers from boron mud via anti-drop precipitation method. Mater. Res. Bull. 2014, 56, 113–118. [Google Scholar] [CrossRef]
- Butt, D.P.; Lackner, K.S.; Wendt, C.H.; Conzone, S.D.; Kung, H.; Lu, Y.; Bremser, J.K. Kinetics of Thermal Dehydroxylation and Carbonation of Magnesium Hydroxide. J. Am. Ceram. Soc. 1996, 79, 1892–1898. [Google Scholar] [CrossRef]
- Dung, N.; Unluer, C. Carbonated MgO concrete with improved performance: The influence of temperature and hydration agent on hydration, carbonation and strength gain. Cem. Concr. Compos. 2017, 82, 152–164. [Google Scholar] [CrossRef]
- Nguyen, H.; Santos, H.; Sreenivasan, H.; Kunther, W.; Carvelli, V.; Illikainen, M.; Kinnunen, P. On the carbonation of brucite: Effects of Mg-acetate on the precipitation of hydrated magnesium carbonates in aqueous environment. Cem. Concr. Res. 2022, 153, 106696. [Google Scholar] [CrossRef]
- Sforna, M.C.; Philippot, P.; Somogyi, A.; van Zuilen, M.A.; Medjoubi, K.; Schoepp-Cothenet, B.; Nitschke, W.; Visscher, P.T. Evidence for arsenic metabolism and cycling by microorganisms 2.7 billion years ago. Nat. Geosci. 2014, 7, 811–815. [Google Scholar] [CrossRef]
- Swart, P.K. The geochemistry of carbonate diagenesis: The past, present and future. Sedimentology 2015, 62, 1233–1304. [Google Scholar] [CrossRef]
- Dodd, M.S.; Zhang, Z.; Li, C.; Algeo, T.J.; Lyons, T.W.; Hardisty, D.S.; Loyd, S.J.; Meyer, D.L.; Gill, B.C.; Shi, W.; et al. Development of carbonate-associated phosphate (CAP) as a proxy for reconstructing ancient ocean phosphate levels. Geochim. Cosmochim. Acta 2021, 301, 48–69. [Google Scholar] [CrossRef]
- Ingalls, M.; Grotzinger, J.P.; Present, T.; Rasmussen, B.; Fischer, W.W. Carbonate-Associated Phosphate (CAP) Indicates Elevated Phosphate Availability in Neoarchean Shallow Marine Environments. Geophys. Res. Lett. 2022, 49, e2022GL098100. [Google Scholar] [CrossRef]
- Allwood, A.C.; Kamber, B.S.; Walter, M.R.; Burch, I.W.; Kanik, I. Trace elements record depositional history of an Early Archean stromatolitic carbonate platform. Chem. Geol. 2010, 270, 148–163. [Google Scholar] [CrossRef]
- Banner, J.L. Application of the trace element and isotope geochemistry of strontium to studies of carbonate diagenesis. Sedimentology 1995, 42, 805–824. [Google Scholar] [CrossRef]
- Wacey, D.; Gleeson, D.; Kilburn, M.R. Microbialite taphonomy and biogenicity: New insights from NanoSIMS. Geobiology 2010, 8, 403–416. [Google Scholar] [CrossRef] [PubMed]
Disclaimer/Publisher’s Note: The statements, opinions and data contained in all publications are solely those of the individual author(s) and contributor(s) and not of MDPI and/or the editor(s). MDPI and/or the editor(s) disclaim responsibility for any injury to people or property resulting from any ideas, methods, instructions or products referred to in the content. |
© 2025 by the authors. Licensee MDPI, Basel, Switzerland. This article is an open access article distributed under the terms and conditions of the Creative Commons Attribution (CC BY) license (https://creativecommons.org/licenses/by/4.0/).