
Mineral Chemistry and Iron Isotope Characteristics of Magnetites in Pertek Fe-Skarn Deposit (Türkiye)


Abstract
1. Introduction
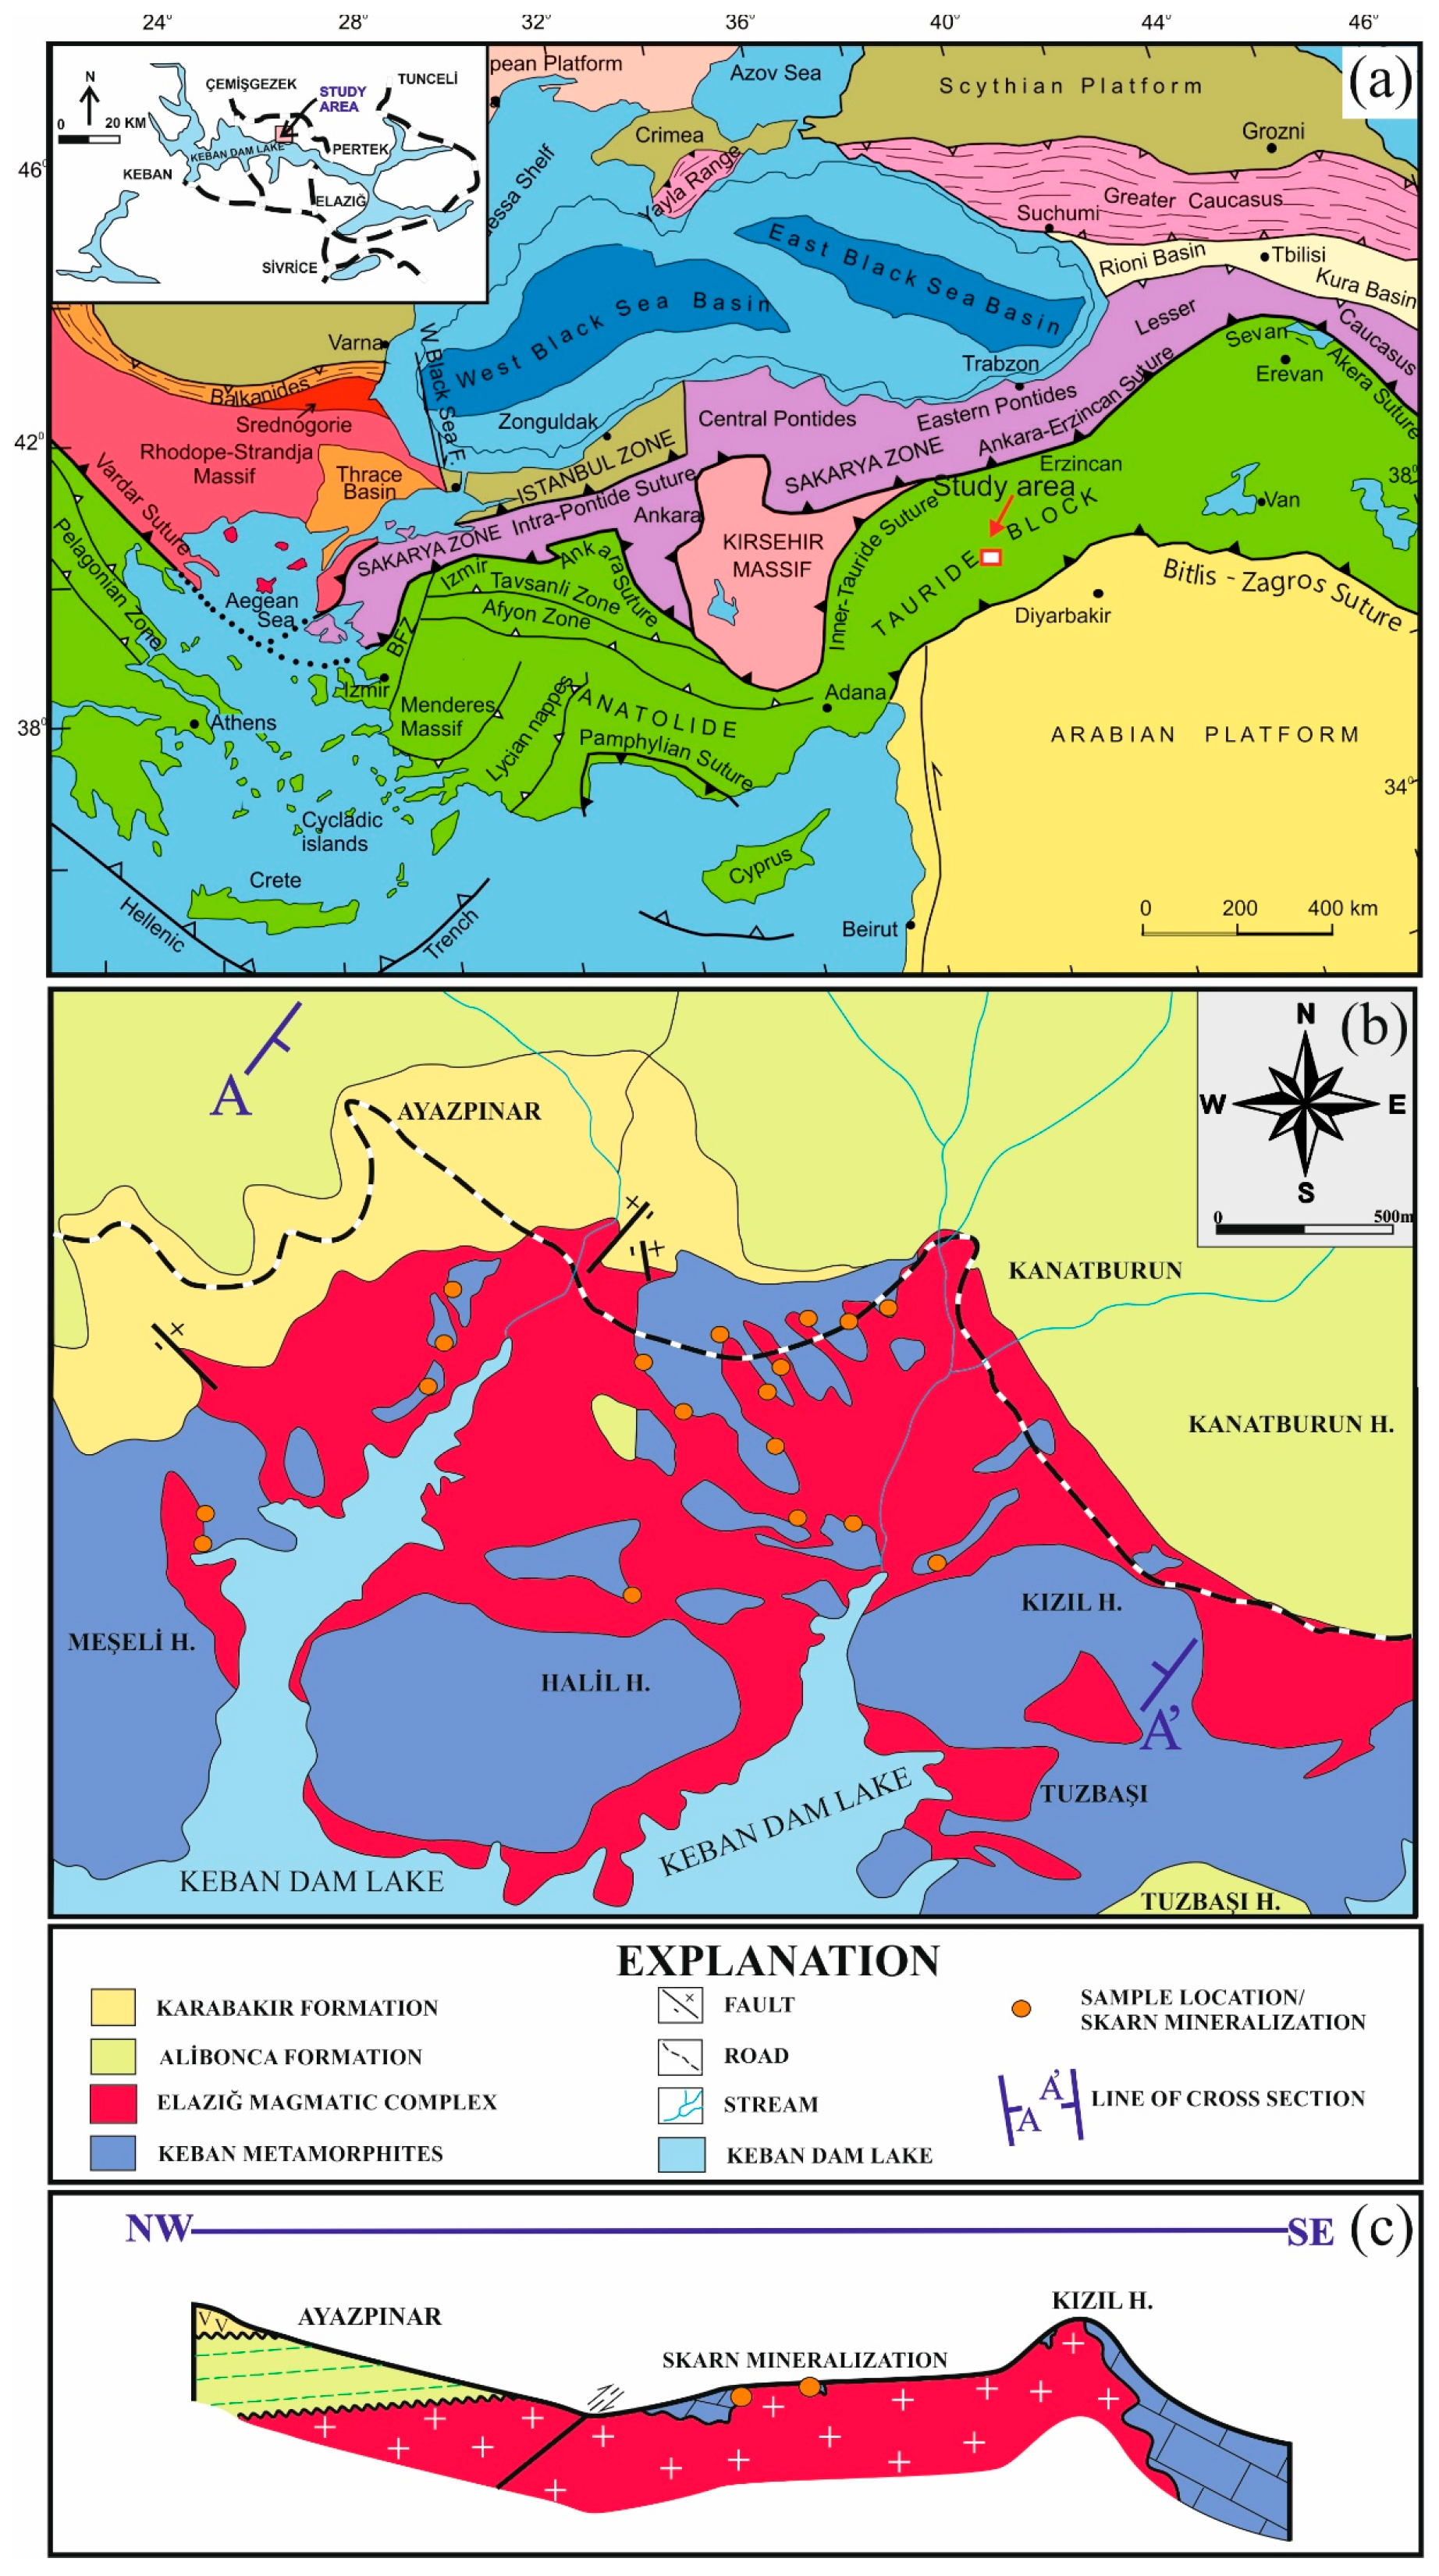
2. Geological Background
3. Materials and Methods
3.1. Sample Preparation
3.2. Major and Trace Element Analysis
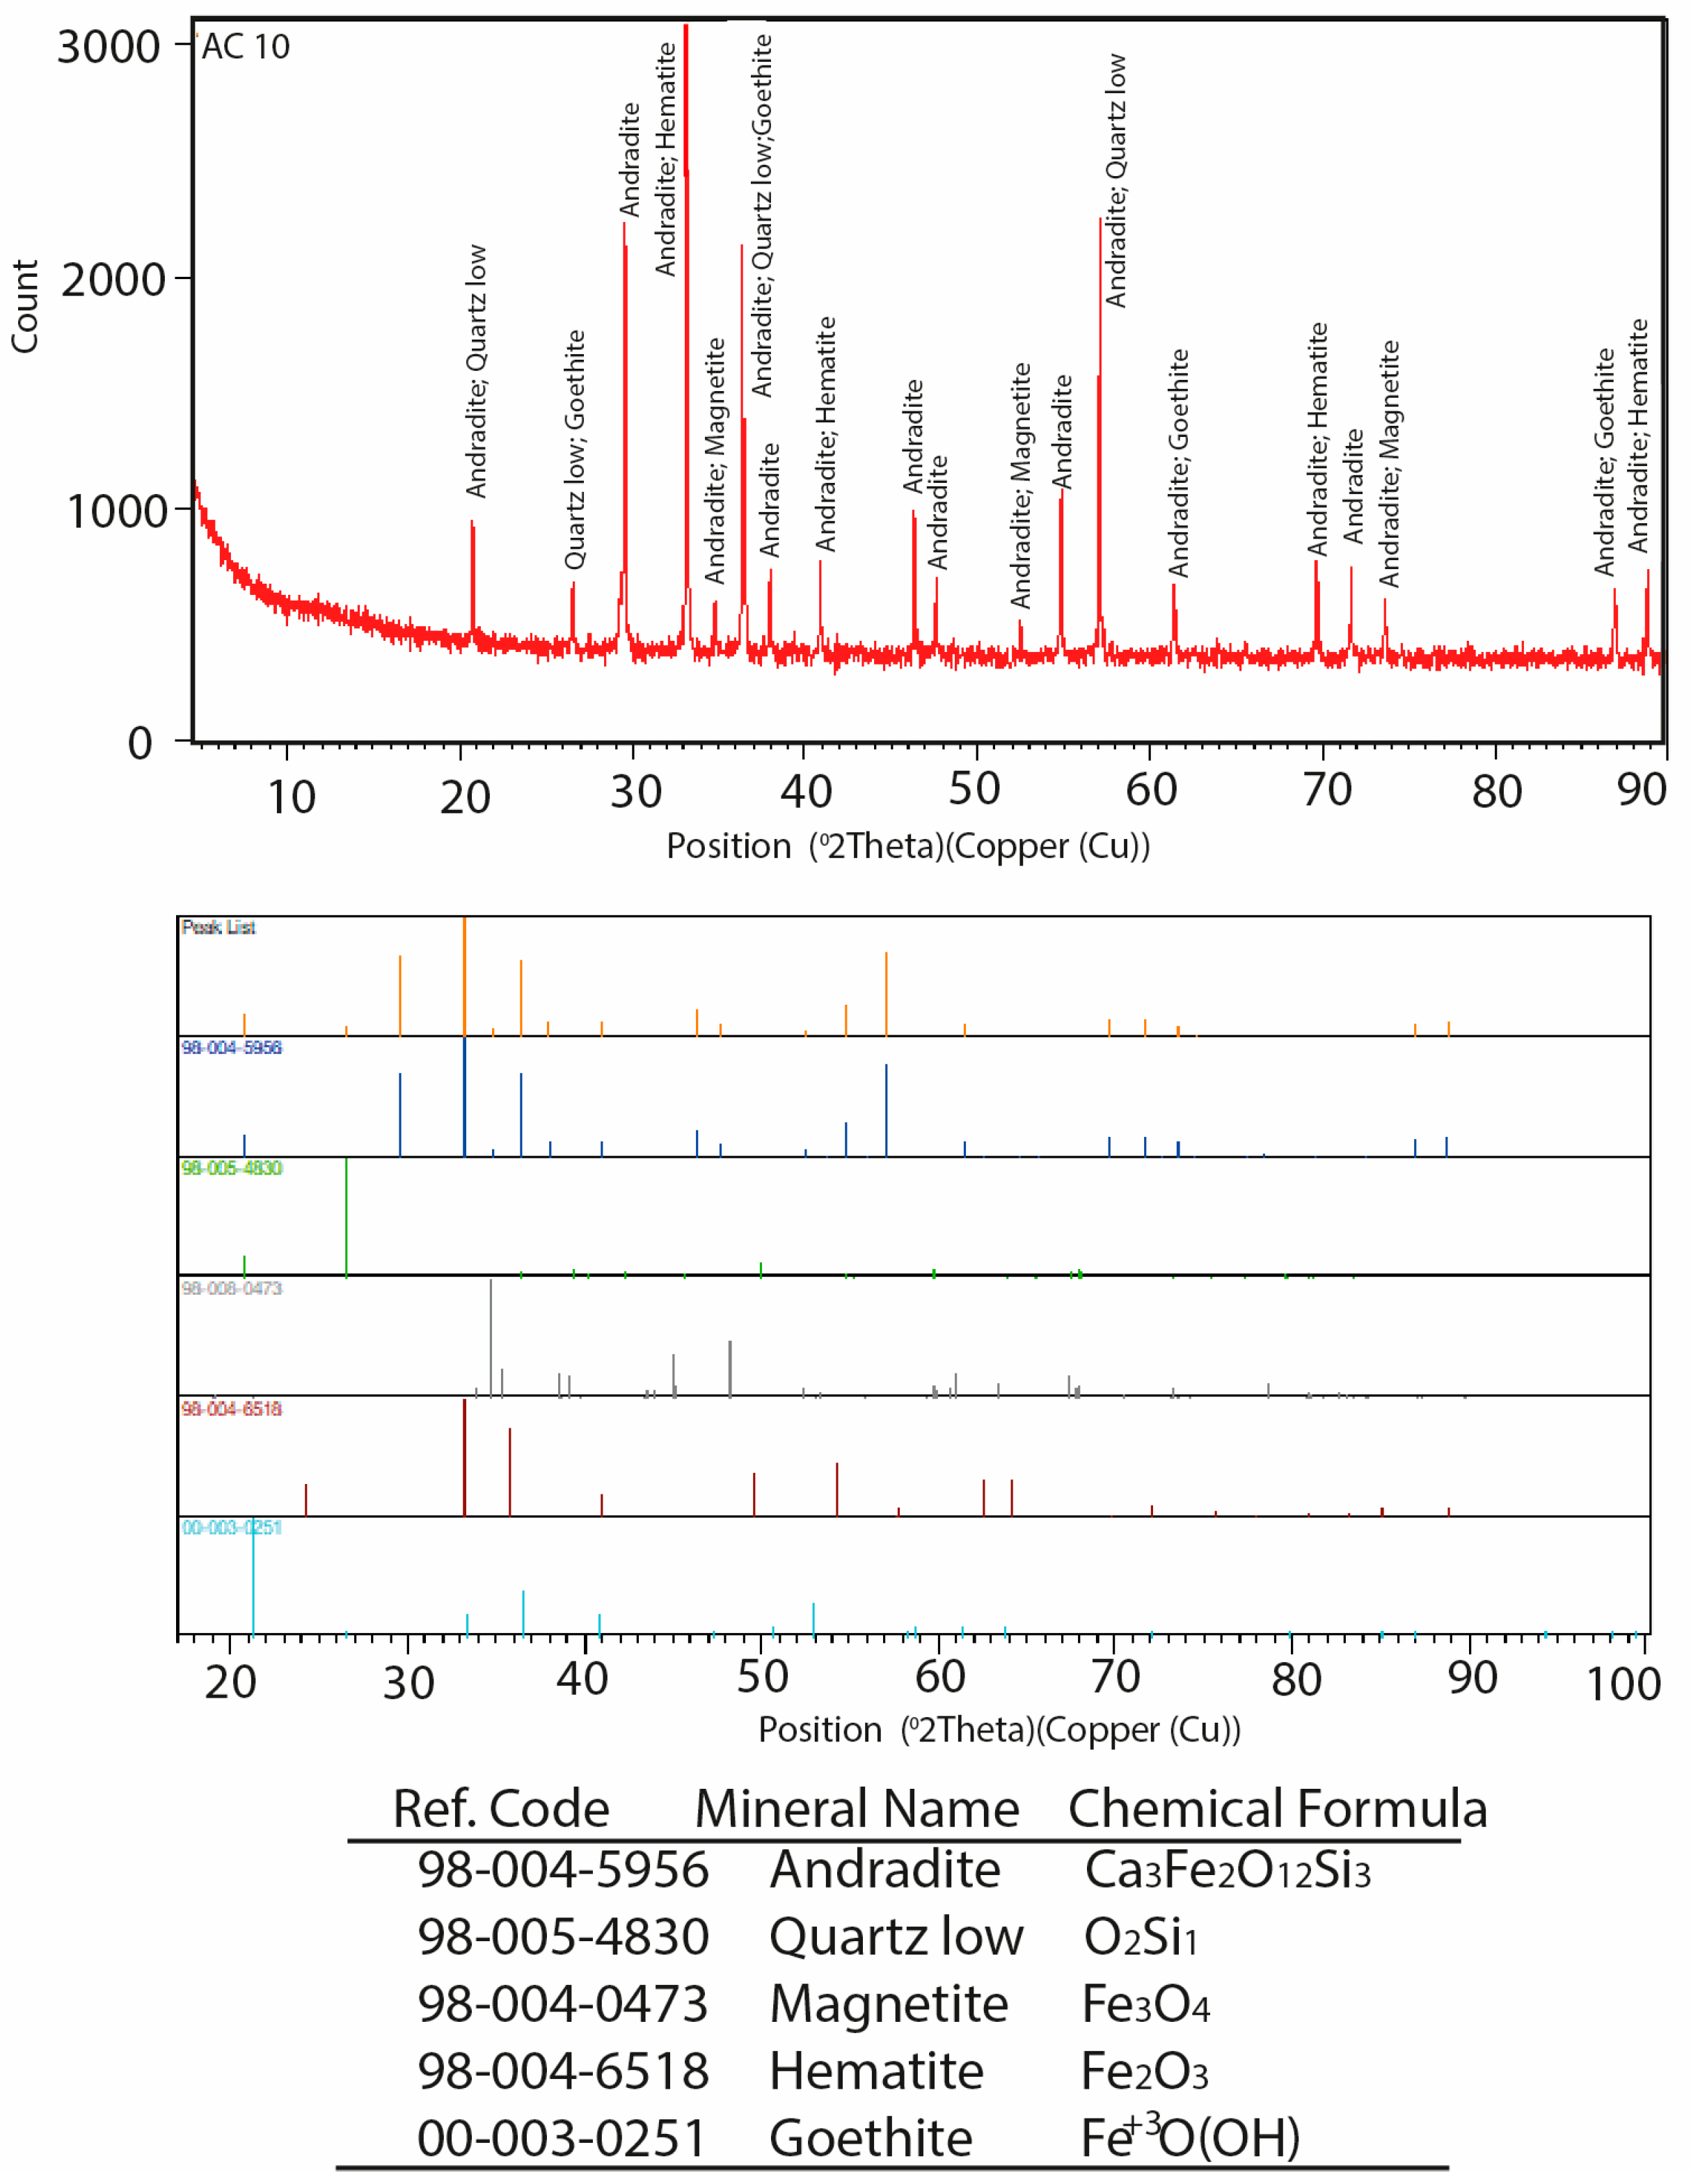
3.3. X-Ray Diffraction (XRD) Examination
3.4. Iron Isotope Analysis (MC–ICP–MS)
3.5. Mineralogical Chemistry Assessment (LA–ICP–MS)
4. Results
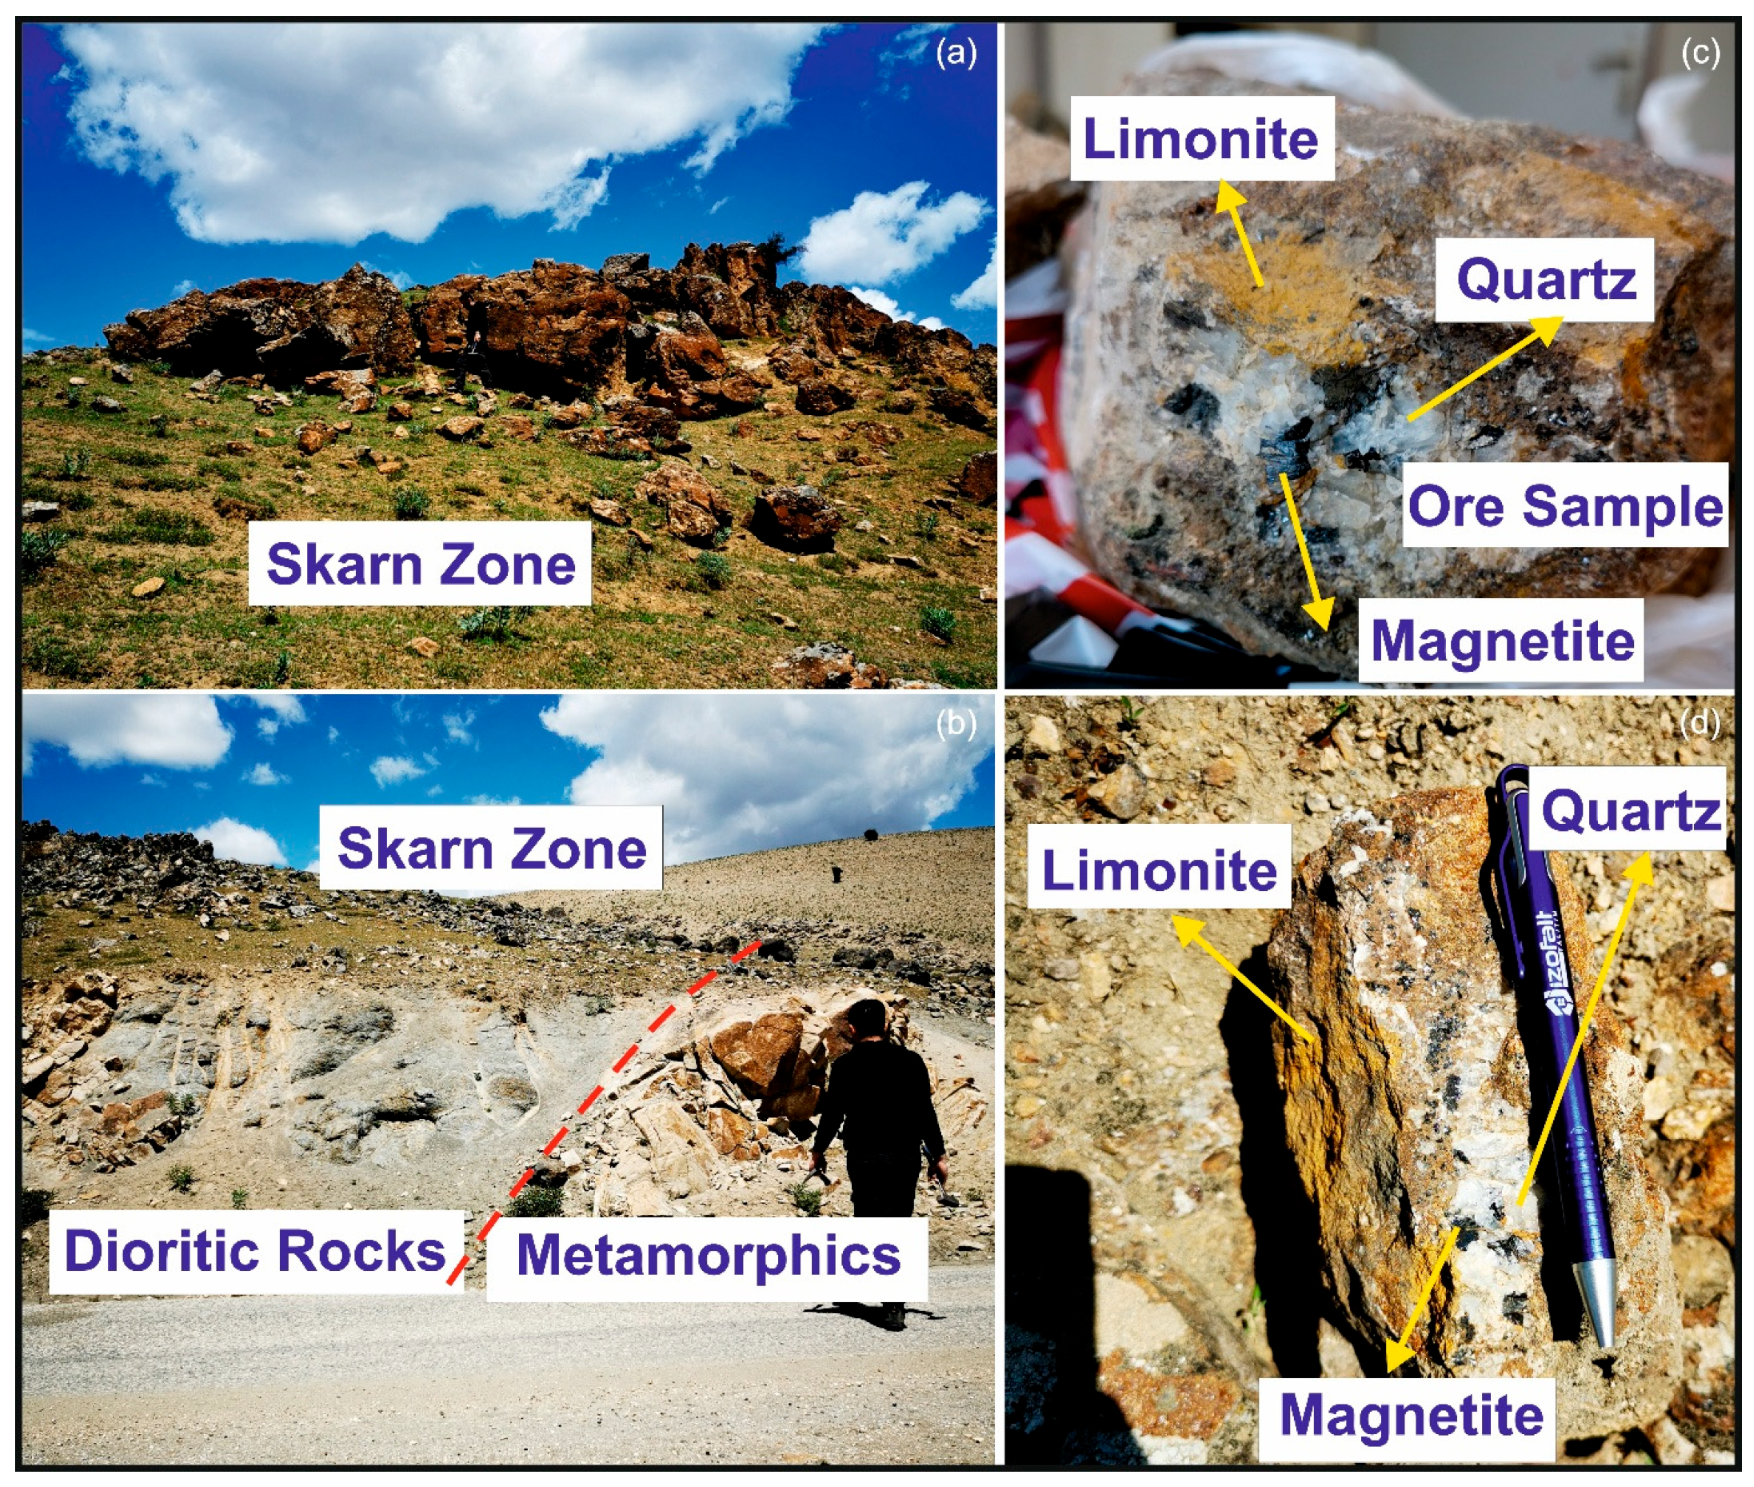
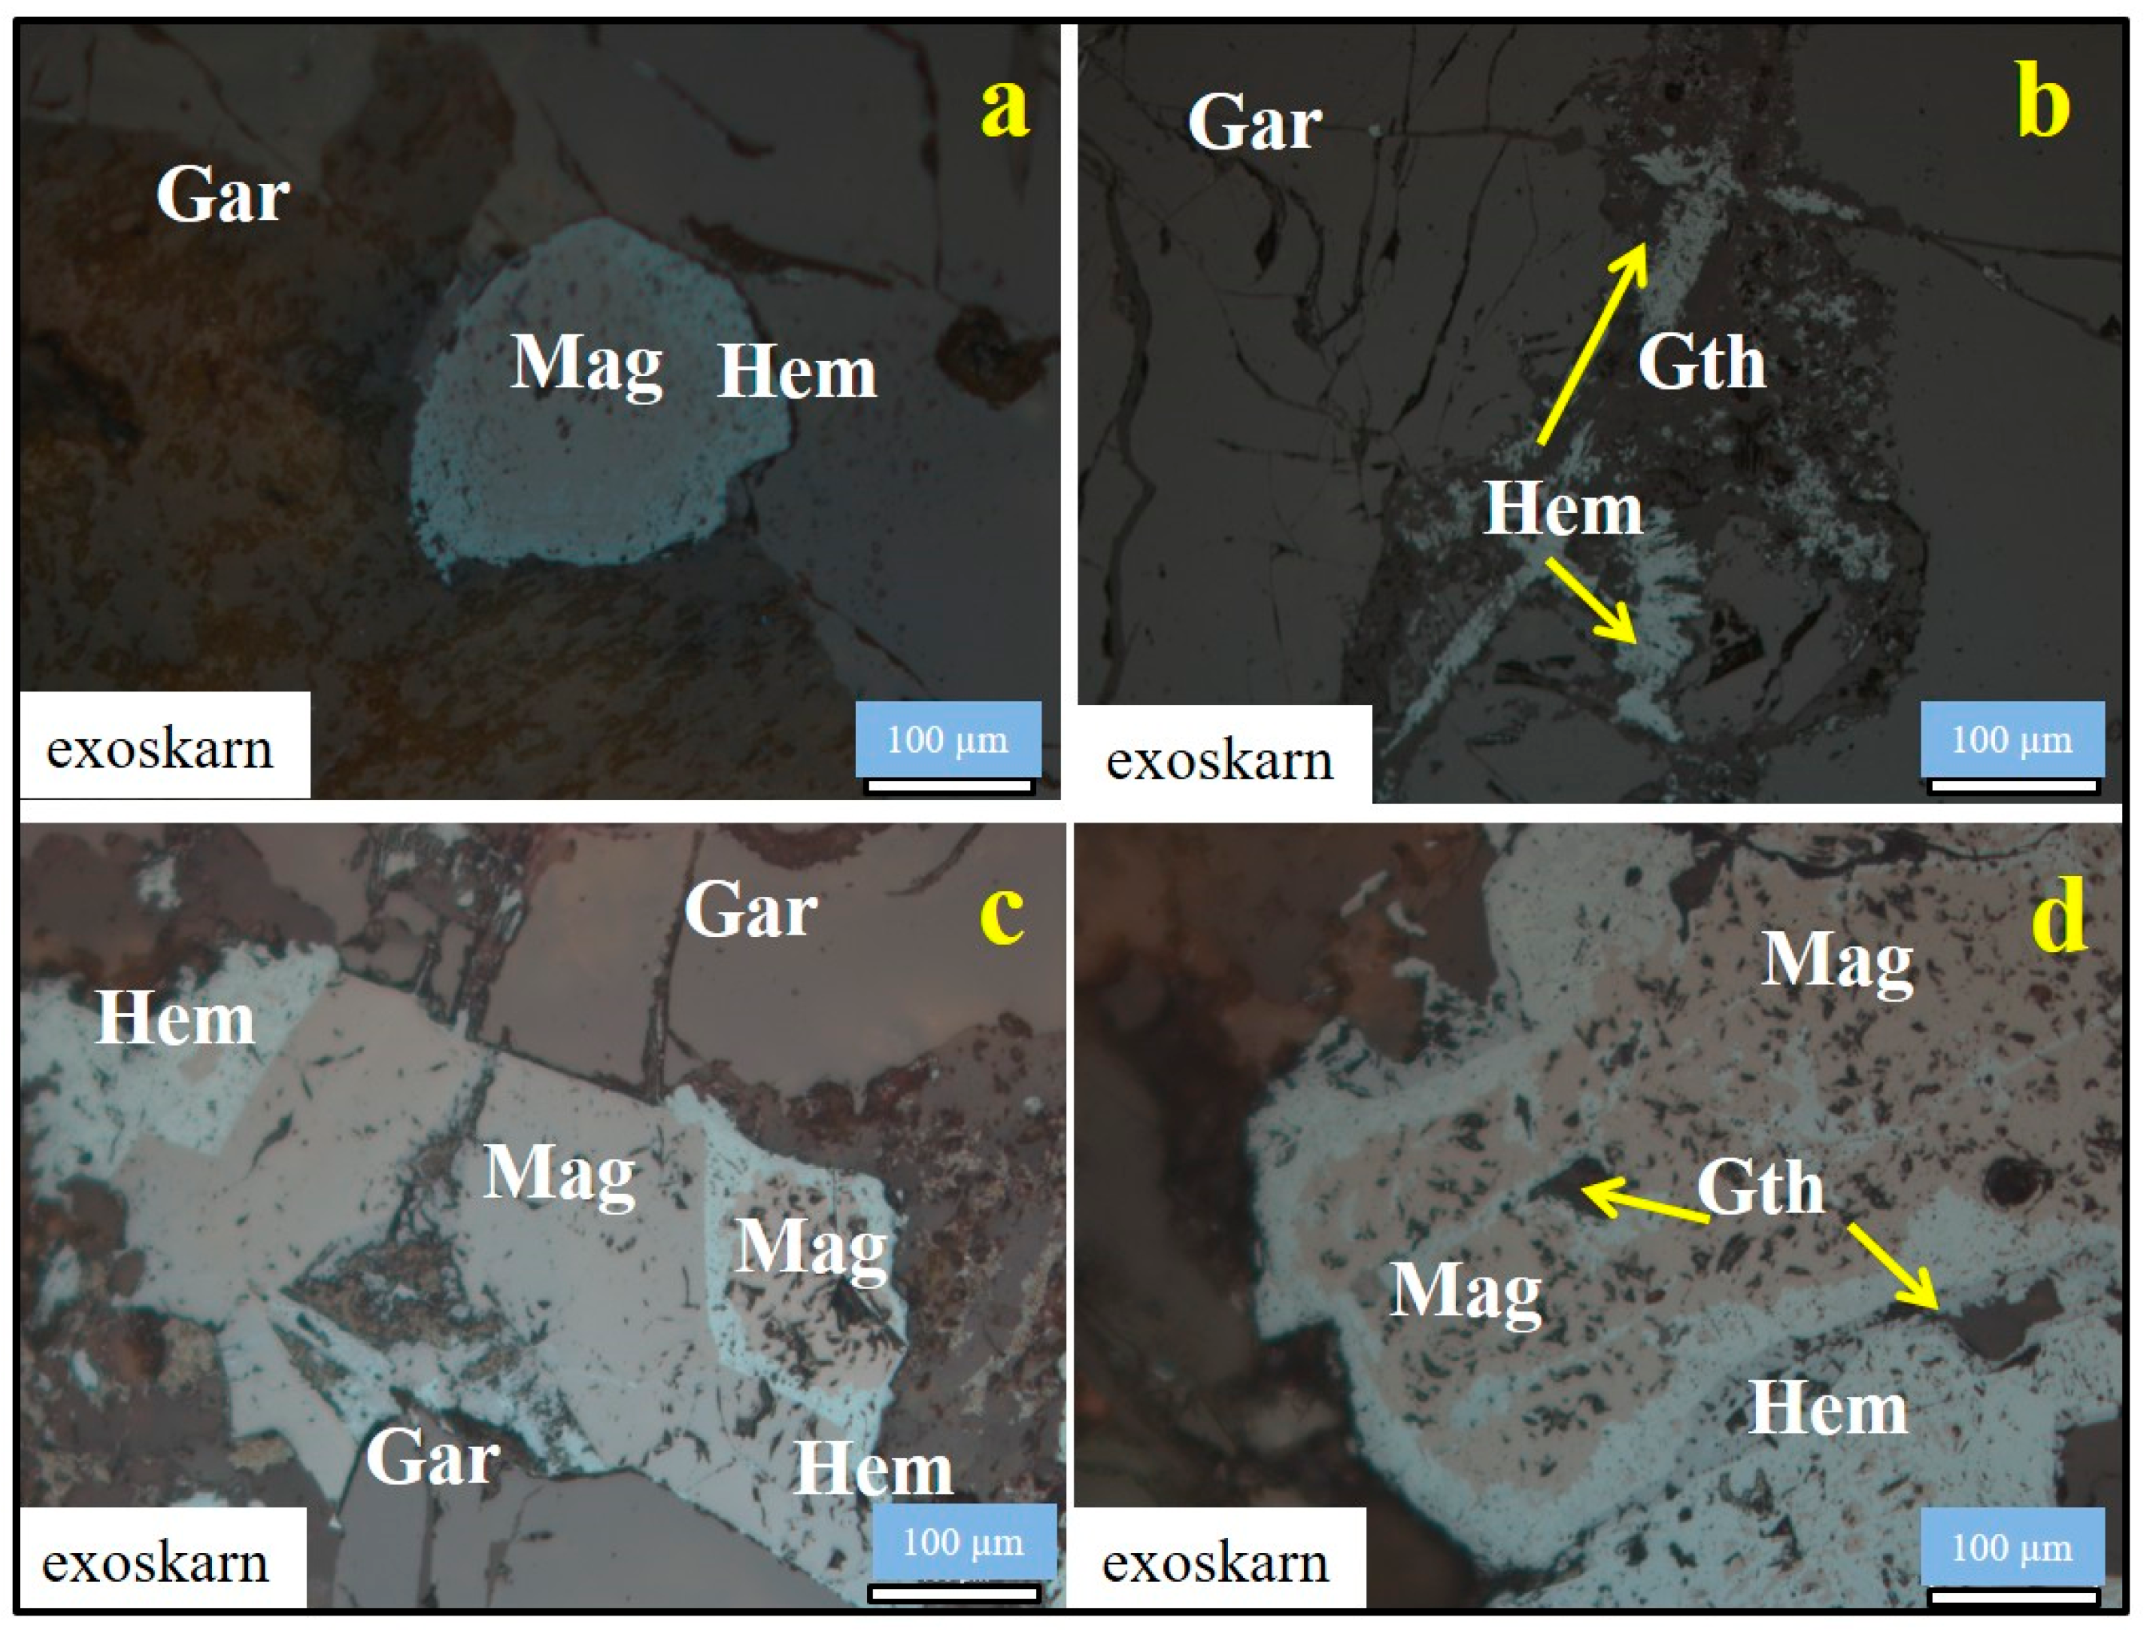
4.1. Petrography
4.2. Mineral Chemistry
4.3. Whole-Rock Major and Trace Elements
4.4. Isotope Geochemistry
5. Discussion
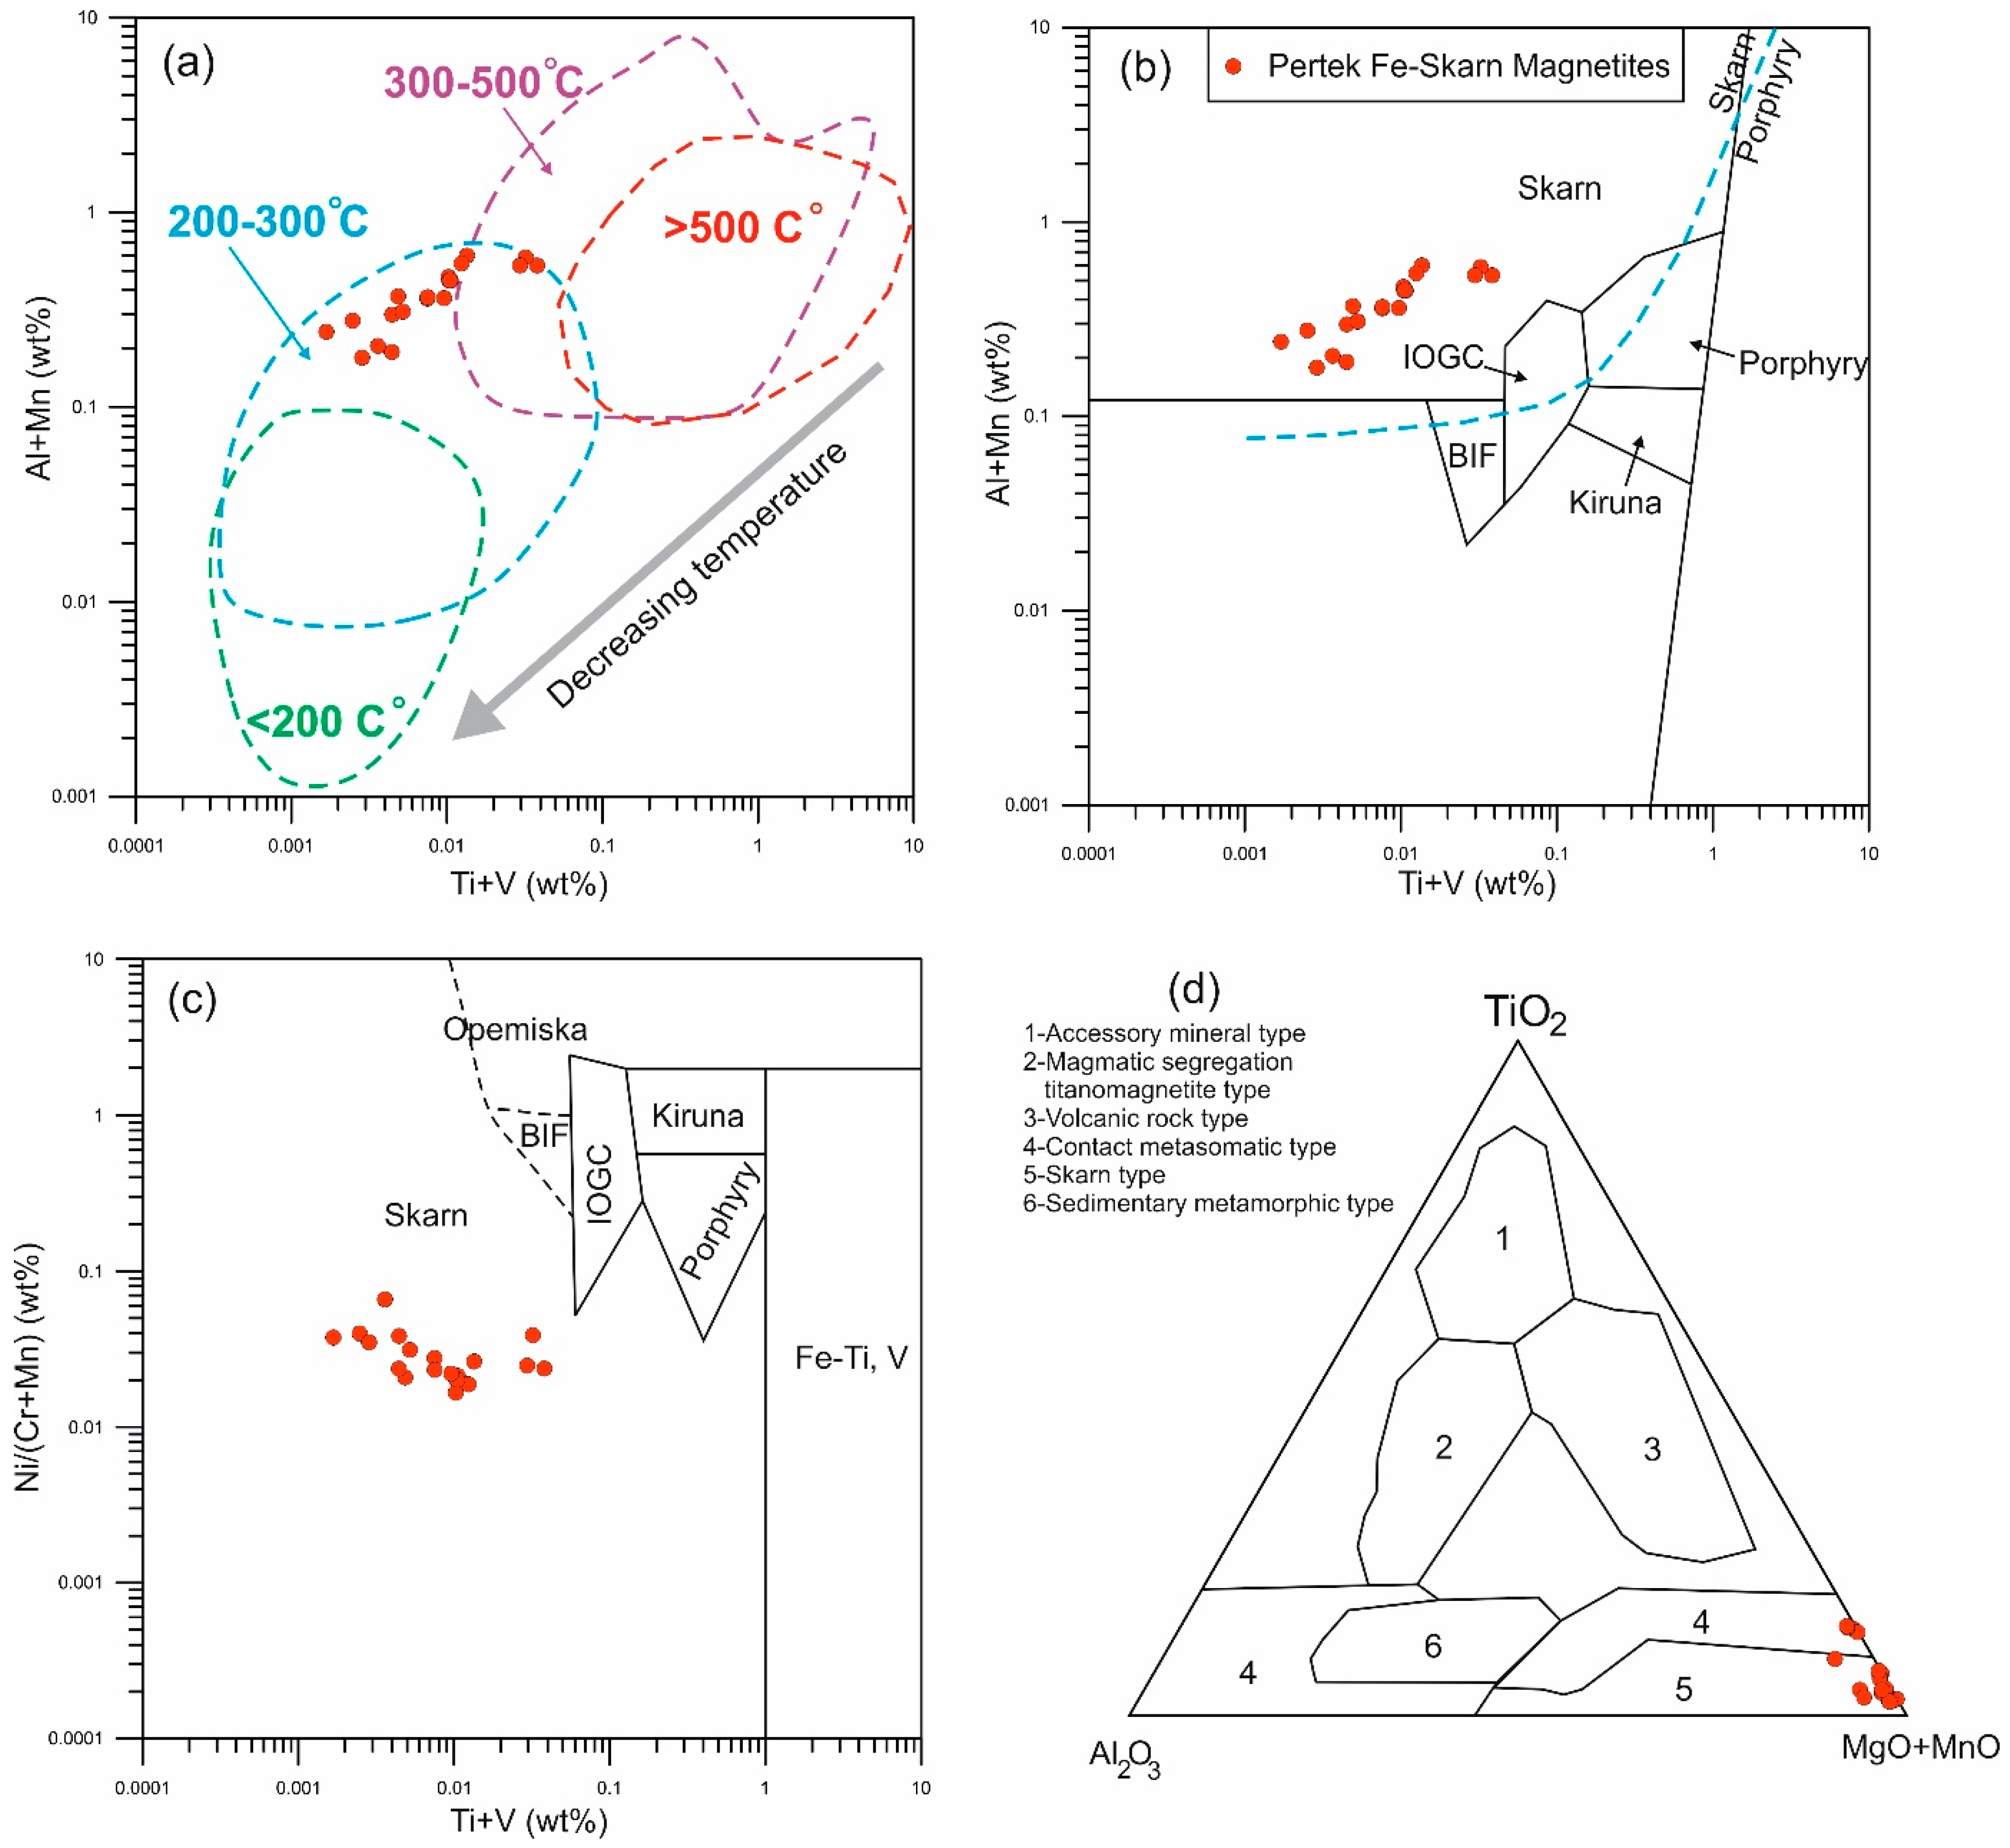
5.1. Mineral Chemistry and Geothermometry of Magnetite
- − TMg-mag (°C) is the temperature of magnetite, and
- − XMg is the magnesium content in magnetite.
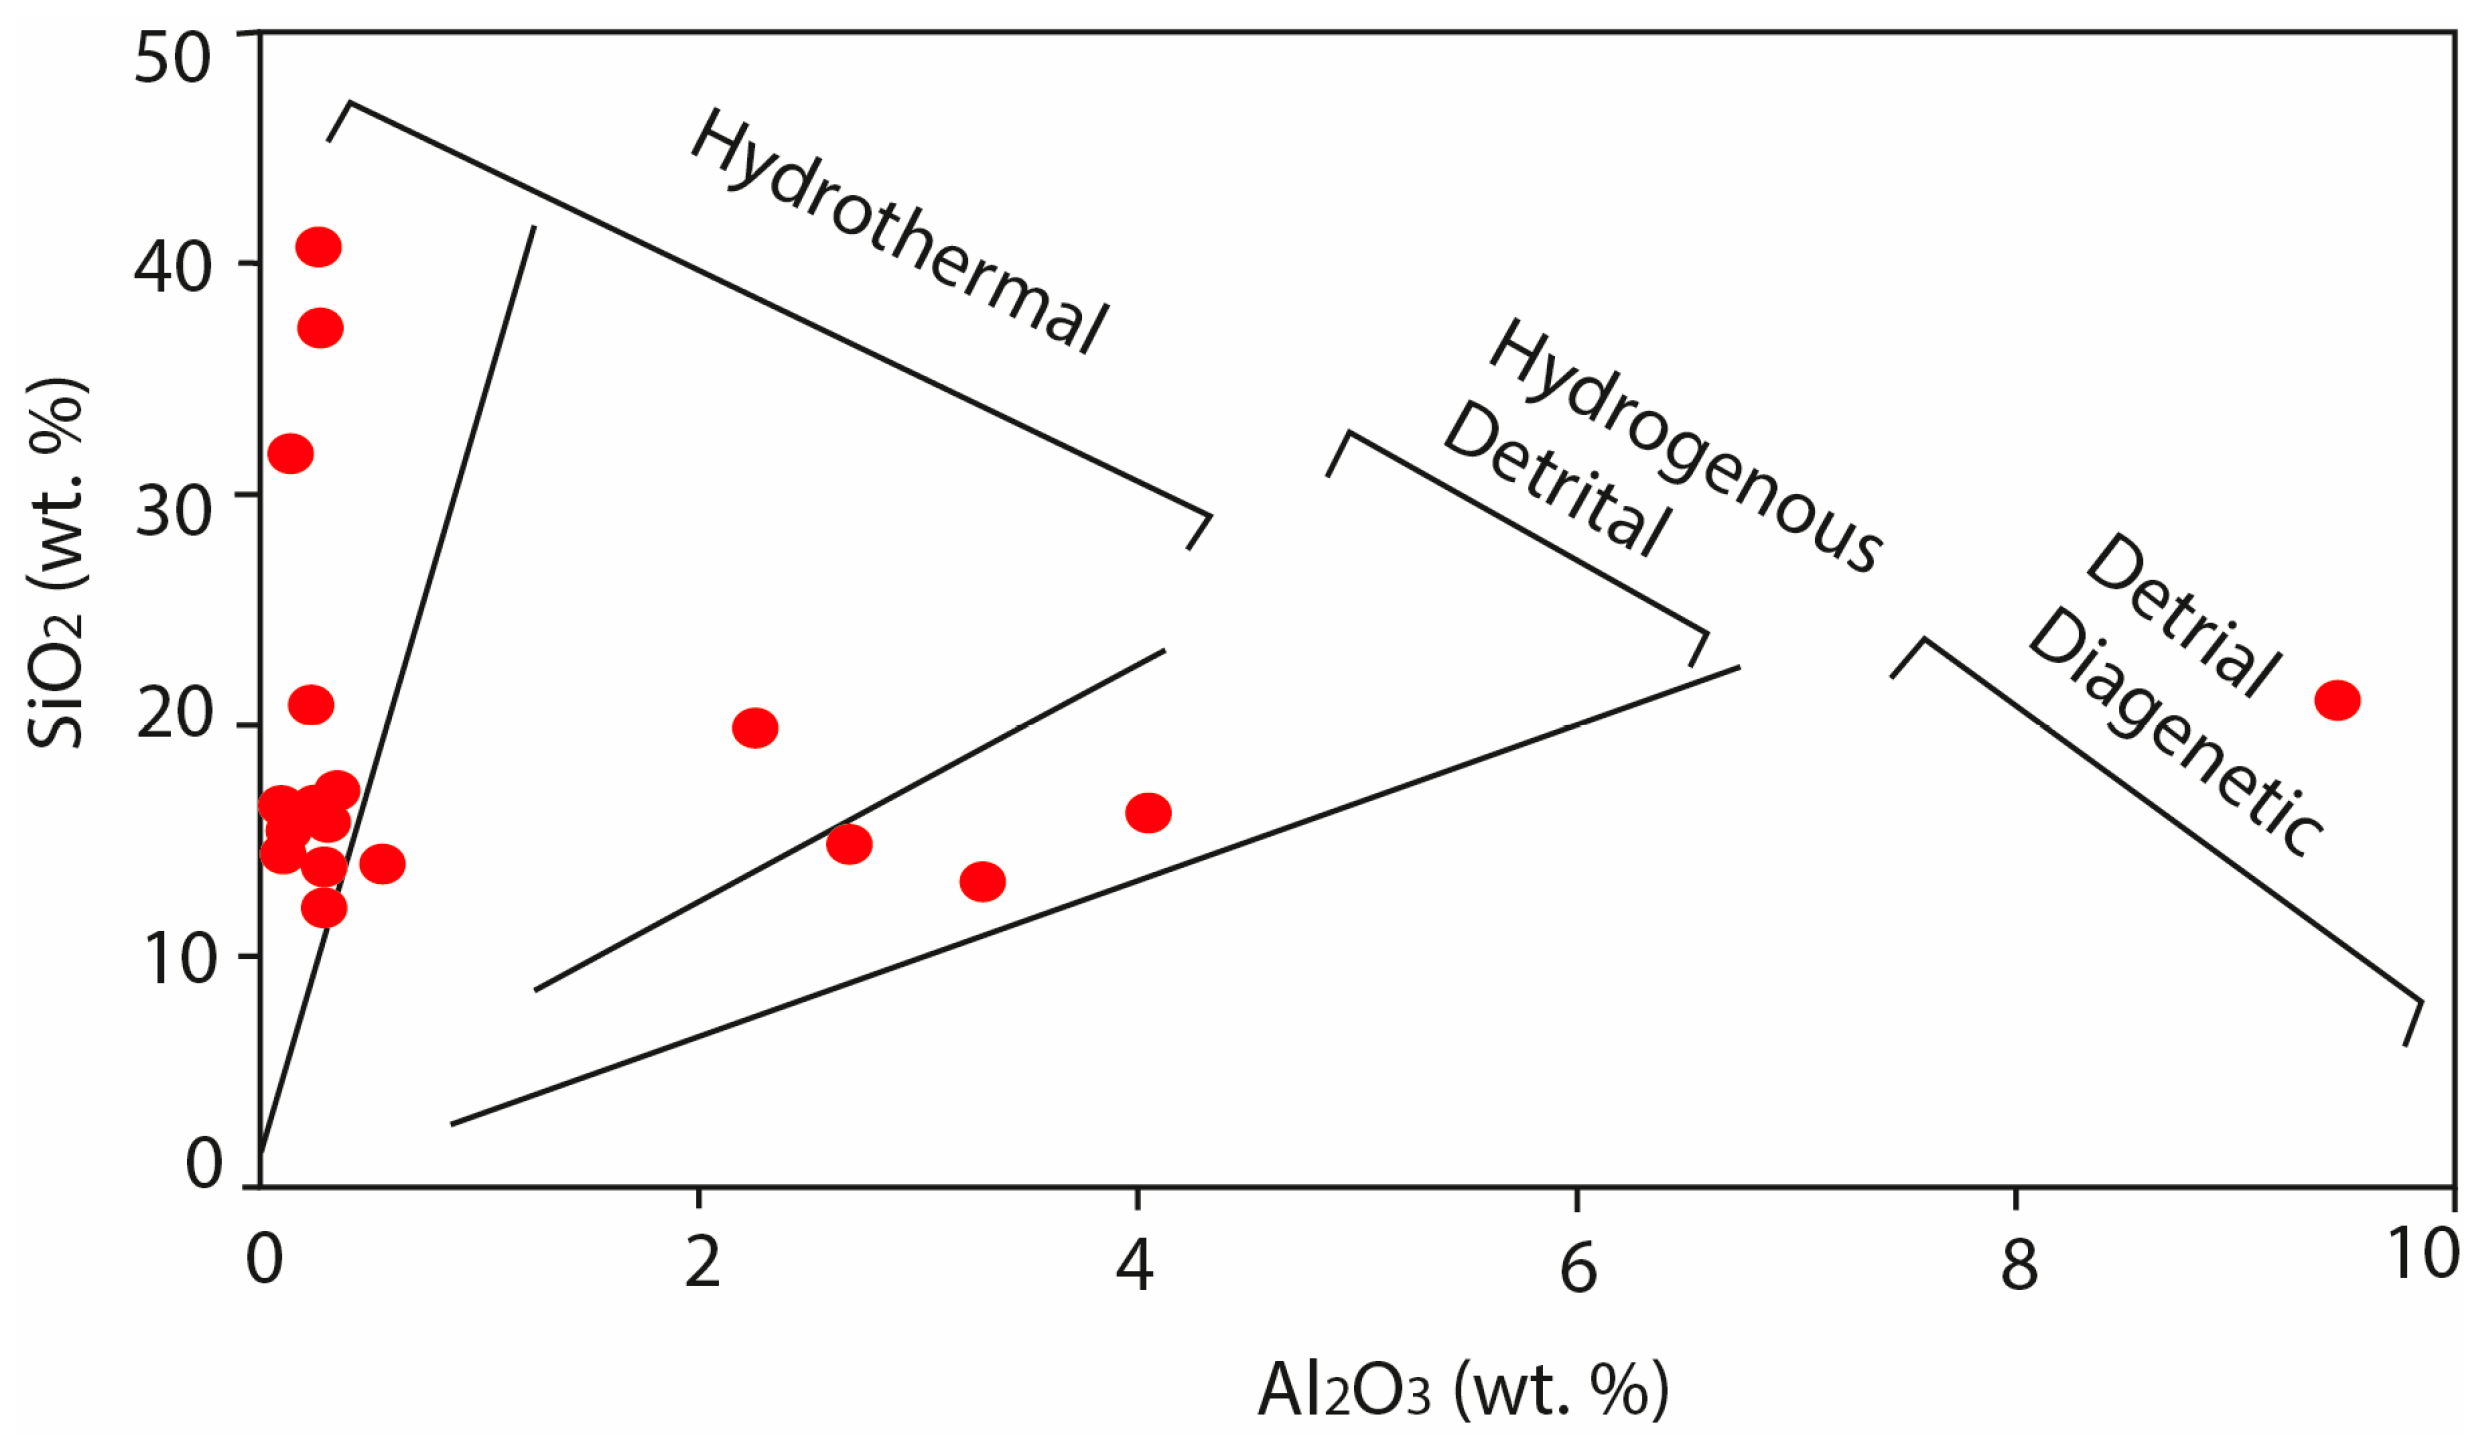
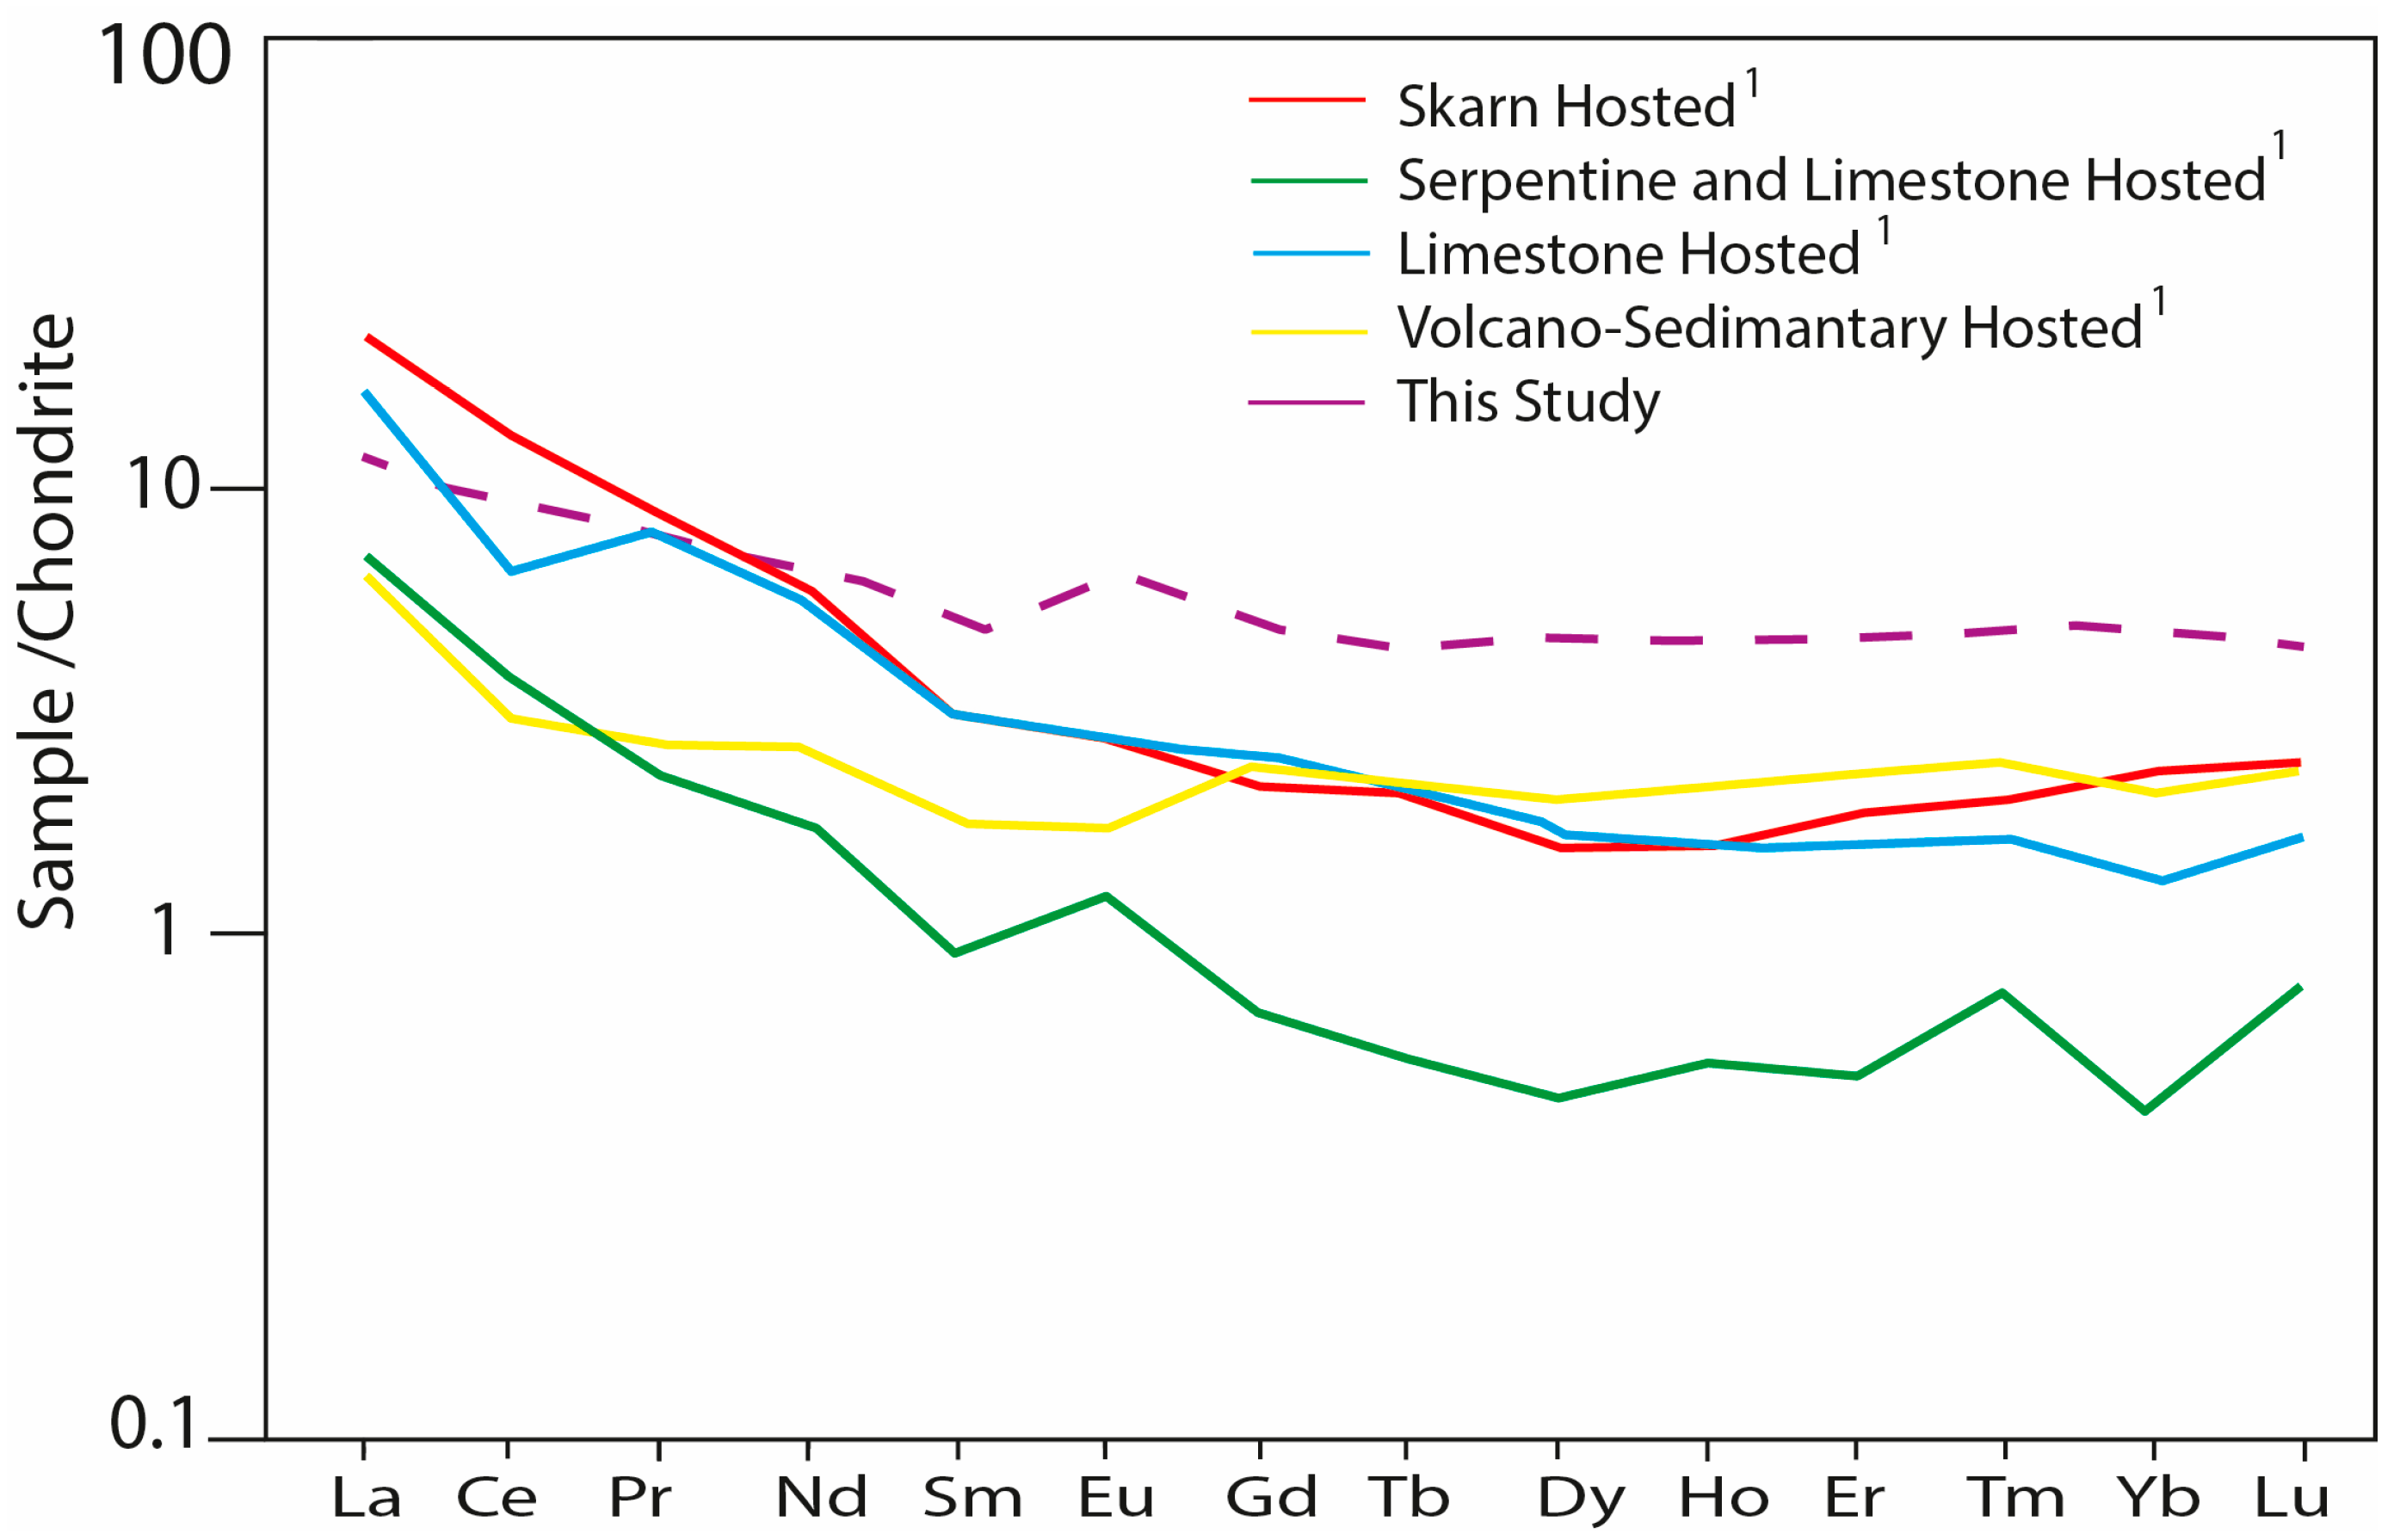
5.2. Major, Trace Element and Rare Earth Elements Geochemistry of Whole Rock
5.3. Iron Isotope Geochemistry
6. Conclusions
Author Contributions
Funding
Data Availability Statement
Conflicts of Interest
References
- Meinert, L.D.; Dipple, G.M.; Nicolescu, G.M. World Skarn Deposits. In Economic Geology 100th Anniversary; Hedenquist, J.W., Thompson, J.F.H., Goldfarb, R.J., Richards, J.P., Eds.; Elsevier Science B.V.: Amsterdam, The Netherlands, 2005; Volume 1905–2005, pp. 299–336. (In Dutch) [Google Scholar]
- Meinert, L.D. Skarns and skarn deposits. Geosci. Can. 1992, 19. Available online: https://journals.lib.unb.ca/index.php/GC/article/view/3773 (accessed on 8 February 2025).
- Einaudi, M.T.; Burt, D.M. Introduction-terminology, classification, and composition of skarn deposits. Econ. Geol. 1982, 77, 745–754. [Google Scholar]
- Metcalfe, I. Multiple Tethyan ocean basins and orogenic belts in Asia. Gondwana Res. 2021, 100, 87–130. [Google Scholar]
- Okay, A.I.; Tüysüz, O. Tethyan sutures of northern Turkey. Geol. Soc. Lond. Spec. Publ. 1999, 156, 475–515. [Google Scholar]
- Mao, J.; Pirajno, F.; Lehmann, B.; Maocheng, L.; Berzina, A. Distribution of porphyry deposits in the Eurasian continent and their corresponding tectonic settings. J. Asian Earth Sci. 2014, 79, 576–584. [Google Scholar]
- Altunbey, M. Geology and Origin of Iron Mineralizations of Tuzbaşi–Kanatburun–Ayazpinar (Pertek–Tunceli) Area. Ph.D. Thesis, Fırat University Graduate School of Science and Technology, Elazığ, Turkey, 1996; p. 176. [Google Scholar]
- Ketin, I. Anadolu’nun Tektonik Birlikleri (tectonic units of Anatolia). Bull. Min. Res. Explor. 1966, 66, 23–34. [Google Scholar]
- Yılmaz, Y.; Yiğitbaş, E.; Çemen, İ. Tectonics of the Southeast Anatolıan Orogenıc Belt; Authorea: New York, NY, USA, 2022. [Google Scholar] [CrossRef]
- Perincek, D. Guidebook for Excursion (B), Interrelations of the Arab and Anatolian plates. In Proceedings of the First Geology Congress on Middle East, Ankara, Turkey, 4–7 September 1979. [Google Scholar]
- Şengor, A.M.; Yilmaz, Y. Tethyan evolution of Turkey: A plate tectonic approach. Tectonophysics 1981, 75, 181–241. [Google Scholar]
- Beyarslan, M.; Bingöl, A.F. Petrology of a supra-subduction zone ophiolite (Kömürhan-Elazığ-Turkey). Can. J. Earth Sci. 2000, 37, 1411–1424. [Google Scholar]
- Yılmaz, Y. New evidence and model evolution of the southeast Anatolian orogen. Geol. Soc. Am. Bull. 1993, 105, 251–271. [Google Scholar] [CrossRef]
- Yılmaz, Y.; Yigitbas, E.; Genç, Ş.C. Ophiolitic and metamorphic assemblages of Southeast Anatolia and their significance in the geological evolution of the orogenic belt. Tectonics 1993, 12, 1280–1297. [Google Scholar]
- Akgül, B. Piran Koyü (Keban) Çevresindeki Magmatik Kayaçların Petrografik ve Petrolojik Ozelliklerinin Incelenmesi. Ph.D. Thesis, Fırat University, Elazığ, Turkey, 1993; p. 125. [Google Scholar]
- Rızaoglu, T.; Parlak, O.; Hock, V.; Koller, F.; Hames, W.E.; Billor, Z. Andean type active margin formation in the Eastern Taurides: Geochemical and geochronological evidence from the Baskil Granitoid, SE Turkey. Tectonophysics 2009, 473, 188–207. [Google Scholar]
- Sar, A.; Ertürk, M.A.; Rizeli, M.E. Genesis of Late Cretaceous Intra-Oceanic Arc Intrusions in the Pertek Area of Tunceli Province, Eastern Turkey, and Implications for the Geodynamic Evolution of the Southern Neo-Tethys: Results of Zircon U-Pb Geochronology and Geochemical and Sr-Nd Isotopic Analyses. Lithos 2019, 350–351, 105263. [Google Scholar] [CrossRef]
- Lin, Y.C.; Chung, S.L.; Bingol, A.F.; Beyarslan, M.; Lee, H.Y.; Yang, J.H. Petrogenesis of Late Cretaceous Elazığ Magmatic Rocks from SE Turkey: New Age and Geochemical and Sr-Nd-Hf Isotopic Constraints. In Proceedings of the 2015 Goldschmidt Conference, Prague, Czech Republic, 16–21 August 2015. [Google Scholar]
- Ertürk, M.A.; Beyarslan, M.; Chung, S.-L.; Lin, T.-H. Eocene magmatism (Maden Complex) in the Southeast Anatolian Orogenic Belt: Magma genesis and tectonic implications. Geosci. Front. 2018, 9, 1829–1847. [Google Scholar]
- Ertürk, M.A.; Sar, A.; Rizeli, M.E. Petrology, zircon U-Pb geochronology and tectonic implications of the A1-type intrusions: Keban region, eastern Turkey. Geochemistry 2022, 82, 125882. [Google Scholar]
- Ertürk, M.A.; Kara, H.; Sar, A.; Yılmaz, İ.; Aysal, N. Geochronology and Petrogenesis of the Early Miocene Felsic Dykes: New evidence for initiation of post-collisional magmatism in the SW Malatya-Eastern Anatolia (Turkey). Geol. Carpathica 2023, 74, 245–260. [Google Scholar]
- Ertürk, M.A.; Kara, H.; Kalender, L. Oxygen Isotope Composition of the Silicate Minerals and Chrome Ores in the Guleman Ophiolite in Southeastern Türkiye. Dokl. Earth Sci. 2024, 515, 2. [Google Scholar] [CrossRef]
- Ertürk, M.A. Geochronology and Petrology of Late Cretaceous Subduction-Related Volcanics from Elazığ, SE Türkiye: Insights into Deciphering Petrogenesis and Magma Generation Processes. Geochemistry 2025, 85, 126234. [Google Scholar] [CrossRef]
- Asutay, H.J. Baskil (Elazığ) çevresinin jeolojisi ve Baskil magmatitlerinin petrolojisi. Maden Teknik Arama Dergisi. 1986, 107, 49–72. [Google Scholar]
- Herece, E.İ.; Acar, Ş. Upper Cretaceous-Tertiary Geology/Stratigraphy of Pertek and Its Vicinity (Tunceli, Turkey). Bull. Miner. Res. Explor. 2016, 153, 1–44. Available online: https://dergipark.org.tr/tr/pub/bulletinofmre/article/278774 (accessed on 8 February 2025).
- Altunbey, M.; Sagiroglu, A. Skarn-Type Ilmenite Mineralization of the Tuzbaşi–Tunceli Region, Eastern Turkey. J. Asian Earth Sci. 2003, 21, 481–488. [Google Scholar] [CrossRef]
- Liu, Y.; Hu, Z.; Gao, S.; Günther, D.; Xu, J.; Gao, C.; Chen, H. In situ analysis of major and trace elements of anhydrous minerals by LA-ICPMS without applying an internal standard. Chem. Geol. 2008, 257, 34–43. [Google Scholar]
- Haskin, L.A.; Wildeman, F.A.; Frey, K.A.; Collins, C.R.; Keedy, M.; Haskin, A. Rare earths in sediments. J. Geophys. Res. 1966, 7, 6091–6105. [Google Scholar]
- Bender, M.; Broecker, W.; Middel, U.; Kay, R.; Sun, S.-S.; Biscaye, P. Geochemistry of three cores from the East Pacific Rise. Earth Planet. Sci. Lett. 1971, 12, 425–433. [Google Scholar]
- Glasby, D. Mechanisms of enrichment of the rare elements in marine manganese nodules. Mar. Chem. 1972, 1, 105–125. [Google Scholar]
- Frierdich, A.J.; Beard, B.L.; Scherer, M.M.; Johnson, C.L. Determination of the Fe(II) a magnetite equilibrium iron isotope fractionation factor using the three-isotope method and a multi-direction approach to equilibrium. Earth Planet. Sci. Lett. 2014, 391, 77–86. [Google Scholar]
- Polyakov, V.B.; Clayton, R.N.; Horita, J.; Mineev, S.D. Equilibrium iron isotope fractionation factors of minerals: Reevaluation from the data of nuclear inelastic resonant X-ray scattering and Mössbauer spectroscopy. Geochim. Cosmochim. Acta 2007, 71, 3833–3846. [Google Scholar]
- Polyakov, V.B.; Mineev, S.D. The use of Mössbauer spectroscopy in stable isotope geochemistry. Geochim. Cosmochim. Acta 2000, 64, 849–865. [Google Scholar]
- Scheka, S.A.; Platkov, A.V.; Vezhosek, A.A.; Levashov, G.B.; Oktyabrsky, R.A. The Trace Elementparagenesis of Magnetite; Nauka: Shubinsky lane, Moscow, 1980; p. 147. [Google Scholar]
- Dupuis, C.; Beaudoin, G. Discriminant diagrams for iron oxide trace element fingerprinting of mineral deposit types. Mineral. Dep. 2011, 46, 319–335. [Google Scholar]
- Dare, S.A.; Barnes, S.J.; Beaudoin, G.; Méeric, J.; Boutroy, E.; Potvin-Doucet, C. Trace elements in magnetite as petrogenetic indicators. Mineral. Dep. 2014, 49, 785–796. [Google Scholar] [CrossRef]
- Nadoll, P.; Angerer, T.; Mauk, J.L.; French, D.; Walshe, J. The chemistry of hydrothermal magnetite: A review. Ore Geol. Rev. 2014, 61, 1–32. [Google Scholar]
- Ahmad, S.N.; Rose, A.W. Fluid inclusions in porphyry and skarn ore at Santa Rita, New Mexico. Econ. Geol. 1980, 75, 229–250. [Google Scholar]
- Carew, M.J. Controls on Cu-Au Mineralisation and Fe Oxide Metasomatism in the Eastern Fold Belt, NW Queensland, Australia (Unpublished Thesis). Ph.D. Thesis, James Cook University, Douglas, QLD, Australia, 2004. [Google Scholar]
- Bhattacharya, H.N.; Chakraborty, I.; Ghosh, K.K. Geochemistry of some banded iron-formations of the Archean Supracrustals, Jharkhand-Orissa region, India. J. Earth Syst. Sci. 2007, 116, 245–259. [Google Scholar]
- Nadoll, P. Geochemistry of Magnetite from Hydrothermal Ore Deposits and Host Rocks—Case Studies from the Proterozoic Belt Supergroup, Cu-Mo-porphyry+ skarn and Climax-Mo Deposits in the Western United States. Ph.D. Thesis, University of Auckland, Auckland, New Zealand, 2011. [Google Scholar]
- Zhao, H.; Li, X.; Wang, J.; Zhou, L. Fe isotope fractionation and hydrothermal alteration in the Yeshan Fe-skarn deposit. China Ore Geol. Rev. 2024, 152, 105381. [Google Scholar]
- Wen, Z.; Chen, M.; Zhang, F.; Liu, Y. Iron isotope constraints on the genetic model of the Baijian skarn deposi. China Miner. 2024, 14, 304. [Google Scholar]
- Zhu, B.; Zhang, H.F.; Zhao, X.M.; He, Y.S. Iron isotope fractionation during skarn-type alteration: Implications for metal source in the Han-Xing iron skarn deposit. Ore Geol Rev. 2016, 74, 139–150. [Google Scholar]
- Nadoll, P.; Mauk, J.L. Trace element composition of magnetite and its implications for mineral exploration: The Makeng Fe deposit, China. Econ. Geol. 2015, 110, 1759–1781. [Google Scholar] [CrossRef]
- Canil, D.; Lacourse, T. Geothermometry using minor and trace elements in igneous and hydrothermal magnetite. Chem. Geol. 2020, 541, 119576. [Google Scholar]
- Lin, S. Discussion on mineral chemistry, genesis and evolution of Magnetite. Acta Mineral. Sin. 1982, 3, 166–174. [Google Scholar]
- Crerar, D.A.; Namson, J.; Chyi, M.S.; Williams, L.; Feigenson, M.D. Manganiferous cherts of the Franciscan Assemblage: I. General geology, ancient and modern analogues and implications for hydrothermal convenction at oceanic spreading centers. Econ Geol. 1982, 77, 5–19. [Google Scholar]
- Bonatti, E.; Kraemer, T.; Rydel, H. Classification and genesis of submarine iron-manganese deposits. Natl. Sci. Found. 1972, 149–166. [Google Scholar]
- Rona, P.A. Criteria for recognition of Hydrothermal Mineral Deposits in Oceanic crust. Econ. Geol. 1978, 73, 135–160. [Google Scholar] [CrossRef]
- Nicholson, K. Contrasting mineralogical—Geochemical signatures of manganese oxides: Genesis to metallogenesis. Econ. Geol. 1992, 87, 1253–1264. [Google Scholar] [CrossRef]
- Grigoryev, N.A.; Sazonov, V.N.; Murzin, V.V.; Gladkovskiy, V. Sulfides as gold carriers in skarn magnetite deposit skarns and ores. Geochem. Int. 1990, 27, 142–146. [Google Scholar]
- Kesler, S.E. Contact-localized ore formation in the Memé mine, Haiti. Econ. Geol. 1968, 63, 541–552. [Google Scholar] [CrossRef]
- Vidal, C.E.; Injoque-Espinoza, J.; Sidder, G.B.; Mukasa, S.B. Amphibolitic Cu-Fe skarn deposits in the central coast of Peru. Econ. Geol. 1990, 85, 1447–1461. [Google Scholar] [CrossRef]
- Sun, W.; McDonough, W. Chemical and isotopic systematics of oceanic basalts: Implications for mantle composition and processes. Geol. Soc. Lond. Spec. Publ. 1989, 42, 313–345. [Google Scholar] [CrossRef]
- Kuşçu, İ.; Gençalioğlu Kuşçu, G.; Göncüoğlu, M.C. Skarn Mineralogy and Zoning Patterns of Karamadan (Yahyalı-Kayseri) Iron Deposit. Geol. Bull. Turk. 2001, 44. [Google Scholar]
- Danielson, A.; Möller, P.; Dulski, P. The europium anomalies in banded iron formations and the thermal history of the oceanic crust. Chem. Geol. 1992, 97, 89–100. [Google Scholar] [CrossRef]
- Jiang, S.Y.; Yu, J.M.; Lu, J.J. Trace and rare-earth element geochemistry in tourmaline and cassiterite from the Yunlong tin deposit, Yunnan, China: Implication for migmatitic–hydrothermal fluid evolution and ore genesis. Chem. Geol. 2004, 209, 193–213. [Google Scholar] [CrossRef]
- Möller, P.; Parekh, P.P.; Schneider, H.J. The application of Tb/Ca-Tb/La abundance rations to problems of fluorspar genesis. Miner. Depesita 1976, 11, 111–116. [Google Scholar] [CrossRef]
- Möller, P.; Morteani, G. On the chemical fractionation of the rare earth elements durumg the formation of Ca-minerals and its application to problems of the genesis of ore deposits. In The Significance of Trace Elements in Solving Petrogenetic Problems and Controversies Theophorastos; Augustitthis, S.S., Ed.; Theophrastus Publications: Athens, Greece, 1983; pp. 747–791. [Google Scholar]
- Constantopoulos, J. Fluid inclusion and rare earth element geochemistry of fluorite from south. Central idaho. Econ. Geol. 1988, 83, 626–636. [Google Scholar] [CrossRef]
- Gaspar, M.; Knaack, C.; Meinert, L.D.; Moretti, R. REE in skarn systems: A LA-ICP-MS study of garnets from the Crown Jewel gold deposit. Geochim. Cosmochim. Acta 2008, 72, 185–205. [Google Scholar]
- Fu, Y.; Sun, X.; Li, D.; Lin, H. U-Pb Geochronology and Geochemistry of U-Rich Garnet from the Giant Beiya Gold-Polymetallic Deposit in SW China: Constraints on Skarn Mineralization Process. Minerals 2018, 8, 128. [Google Scholar] [CrossRef]
- Bau, M. Rare-earth element mobility during hydrothermal and metamorphic fluid-rock interaction and the significance of the oxidation state of europium. Chem. Geol. 1991, 93, 219–230. [Google Scholar] [CrossRef]
- Zhang, Y.; Liu, Q.; Shao, Y.; Li, H. Fingerprinting the Hydrothermal Fluid Characteristics from LA-ICP-MS Trace Element Geochemistry of Garnet in the Yongping Cu Deposit, SE China. Minerals 2017, 7, 199. [Google Scholar] [CrossRef]
- Öztürk, H.; Kasapçı, C.; Cansu, Z.; Hanilçi, N. Geochemical characteristics of iron ore deposits in central eastern Turkey: An approach to their genesis. Int. Geol. Rev. 2016, 58, 1673–1690. [Google Scholar] [CrossRef]
- Crinci, J.; Jurkowic, I. Rare earth elements in Triassic bauxites of Croatia Yugoslavia. Travaux 1990, 19, 239–248. [Google Scholar]
- Maas, R.; McCulloch, M.T.; Campbell, I.H.; Page, R.W. Sm-Nd isotope systematics in uranium-rare earth element mineralization at the Mary Kathleen uranium mine, Queenland. Econ. Geol. 1987, 82, 1805–1826. [Google Scholar]
- Pan, Y.; Fleet, M.E.; Stone, W.E. Skarn mineralization (Cr, Fe, Au) in an Archean greenstone belt, White River property, Hemlo area, Ontario. Econ. Geol. 1991, 86, 1626–1645. [Google Scholar] [CrossRef]
- Kato, Y. Rare Earth Elements as an indicator to origins of skarn deposits: Examples of the Kamioka Zn-Pb and YoshiwaraSannotake Cu(–Fe) deposits in Japan. Resour. Geol. 1999, 49, 183–198. [Google Scholar] [CrossRef]
- Xue, S.; Niu, Y.; Chen, Y.; Shi, Y.; Xia, B.; Wang, P.; Gong, H.; Wang, X.; Duan, M. Iron Isotope Fractionation during Skarn Cu-Fe Mineralization. Minerals 2021, 11, 444. [Google Scholar] [CrossRef]
- Wang, Y.; Zhu, X.; Mao, J.; Li, Z.; Cheng, Y. Iron isotope fractionation during skarn-type metallogeny: A case study of the Xinqiao Cu–S–Fe–Au deposit in the Middle-Lower Yangtze valley. Ore Geol. Rev. 2011, 43, 194–202. [Google Scholar]
- Wang, Y.; Zhu, X.K.; Cheng, Y.B. Fe isotope behaviors during sulfide-dominated skarn-type mineralization. J. Asian Earth Sci. 2015, 103, 374–392. [Google Scholar]
- Wang, Y.; Zhu, X.; Tang, C.; Mao, J.; Chang, Z. Discriminate between magmatic and magmatic hydrothermal ore deposits using Fe isotopes. Ore Geol. Rev. 2021, 130, 103946. [Google Scholar]
- Wawryk, C.M.; Foden, J.D. Iron-isotope systematics from the Batu Hijau Cu-Au deposit, Sumbawa, Indonesia. Chem. Geol. 2017, 466, 159–172. [Google Scholar]
- Poitrasson, F.; Freydier, R. Heavy iron isotope composition of granites determined by high-resolution MC-ICP-MS. Chem. Geol. 2005, 222, 132–147. [Google Scholar]
- Heimann, A.; Beard, B.L.; Johnson, C.M. The role of volatile exsolution and subsolidus flfluid/rock interactions in producing high 56Fe/54Fe ratios in siliceous igneous rocks. Geochim. Cosmochim. Acta 2008, 72, 4379–4396. [Google Scholar]
- Syverson, D.D.; Borrok, D.M.; Seyfried, W.E. Experimental determination of equilibrium Fe isotopic fractionation between pyrite and dissolved Fe under hydrothermal conditions. Geochim. Cosmochim. Acta. 2013, 122, 170–183. [Google Scholar]
- Li, Q.W.; Zhao, J.H.; Wang, Q.; Zhang, Z.F.; An, Y.J.; He, Y.T. Iron isotope fractionation in hydrous basaltic magmas in deep crustal hot zones. Geochim. Cosmochim. Acta. 2020, 279, 29–44. [Google Scholar]
- Zhang, B.M.; Zhao, G.L.; Ma, G.X. Metallogenic Series and Models of the Main Metallogenic Zones in Hebei Province; Petroleum Industry Press: Beijing, China, 1996; pp. 1–273. [Google Scholar]
- Sağıroğlu, A. Pertek-Demürek (Tunceli) Skarn Tipi Manyetit ve İlişkili Bakır Cevherleşmeleri. Turk. Jeol. Bülteni C 1992, 35, 63–70. [Google Scholar]
- Sipahi, F.; Akpınar, İ.; Eker, Ç.S.; Kaygusuz, A.; Vural, A.; Yılmaz, M. 2014. Formation of the Eğrikar (Gümüşhane) Fe–Cu skarn type mineralization in NE Turkey: U–Pb zircon age, lithogeochemistry, mineral chemistry, fluid inclusion, and O-H-C-S isotopic compositions. J. Geochem. Explor. 2017, 182, 32–52. [Google Scholar]
- Chapman, J.B.; Weiss, D.J.; Shan, Y.; Lemburger, M. Iron isotope fractionation during leaching of granite and basalt by hydrochloric and oxalic acids. Geochim. Cosmochim. Acta 2009, 73, 1312–1324. [Google Scholar]
- Tang, D.; Qin, K.; Mao, Y.; Noreen, J.E. Magnetite geochemistry and iron isotope signature of disseminated and massive mineralization in the Kalatongke magmatic Cu–Ni sulfide deposit, northwest China. Chem. Geol. 2022, 605, 120965. [Google Scholar]
- Johnson, C.; Beard, B.; Weyer, S. Iron Geochemistry: An Isotopic Perspective; Jochen Hoefs, J., Ed.; Springer Nature: Göttingen, Germany, 2020; ISSN 2364-5105/2364-5113. ISBN 978-3-030-33827-5/978-3-030-33828-2. [Google Scholar]
- Rustad, J.R.; Casey, W.H.; Yin, Q.Z.; Bylaska, E.J.; Felmy, A.R.; Bogatko, S.A.; Jackson, V.E.; Dixon, D.A. Isotopic fractionation of Mg2+ (aq), Ca2+ (aq), and Fe2+ (aq) with carbonate minerals. Geochim. Cosmochim. Acta. 2010, 74, 6301–6323. [Google Scholar] [CrossRef]
- Frost, C.D.; von Blanckenburg, F.R.; Schoenberg, B.R.; Frost, S.; Swapp, M. Preservation of Fe isotope heterogeneities during diagenesis and metamorphism of banded iron formation. Contrib Miner. Petrol. 2006, 153, 211–235. [Google Scholar] [CrossRef]
- Tristan, M.C.; Adam, C.S.; Martin, R.; Fernando, B.; Mauricio, A.; Craig, C.L.; Ilya, N.B. The formation of the Mantoverde iron oxide-copper-gold (IOCG) deposit, Chile: Insights from Fe and O stable isotopes and comparisons with iron oxide-apatite (IOA) deposits. Min. Dep. 2020, 55, 1489–1504. [Google Scholar]
- Chen, Y.; Su, S.; He, Y.; Li, S.; Hou, J.; Feng, S.; Gao, K. Fe isotope compositions and implications on mineralization of Xishimen iron deposit in Wuan, Hebei. Acta Petrol. Sin. 2014, 30, 3443–3454. [Google Scholar]
- Zhang, R.; John, S.G.; Zhang, J.; Ren, J.; Wu, Y.; Zhu, Z.; Liu, S.; Zhu, X.; Marsay, C.M.; Wenger, F. Transport and reaction of iron and iron stable isotopes in glacial meltwaters on Svalbard near Kongsfjorden: From rivers to estuary to ocean. Earth Planet. Sci. Lett. 2015, 424, 201–211. [Google Scholar]


| (a) | ||||||||||||||||||||
|---|---|---|---|---|---|---|---|---|---|---|---|---|---|---|---|---|---|---|---|---|
| Sample | SiO2 | TiO2 | Al2O3 | Fe2O3 | FeO | MnO | MgO | CaO | Na2O | K2O | P2O5 | |||||||||
| AC-1_01 | 0.51 | 0.06 | 0.97 | 68.97 | 31.03 | 0.02 | 0.07 | 1.71 | 0.00 | 0.00 | 0.00 | |||||||||
| AC-1_02 | 0.14 | 0.02 | 1.12 | 68.97 | 31.03 | 0.01 | 0.03 | 0.48 | 0.00 | 0.00 | 0.00 | |||||||||
| AC-1_03 | 0.26 | 0.02 | 1.02 | 68.97 | 31.03 | 0.01 | 0.03 | 0.21 | 0.00 | 0.00 | 0.00 | |||||||||
| AC-1_04 | 0.32 | 0.05 | 1.10 | 68.97 | 31.03 | 0.01 | 0.04 | 0.22 | 0.00 | 0.00 | 0.00 | |||||||||
| AC-1_04 | 0.17 | 0.04 | 1.00 | 68.97 | 31.03 | 0.01 | 0.02 | 0.18 | 0.00 | 0.00 | 0.00 | |||||||||
| AC-8_01 | 0.96 | 0.00 | 0.83 | 68.97 | 31.03 | 0.03 | 0.09 | 2.55 | 0.01 | 0.01 | 0.00 | |||||||||
| AC-8_02 | 0.44 | 0.01 | 0.69 | 68.97 | 31.03 | 0.01 | 0.02 | 0.43 | 0.00 | 0.00 | 0.00 | |||||||||
| AC-8_03 | 0.17 | 0.00 | 0.46 | 68.97 | 31.03 | 0.00 | 0.01 | 0.08 | 0.00 | 0.00 | 0.00 | |||||||||
| AC-8_04 | 0.41 | 0.00 | 0.37 | 68.97 | 31.03 | 0.02 | 0.04 | 0.97 | 0.00 | 0.00 | 0.00 | |||||||||
| AC-8_05 | 0.34 | 0.00 | 0.51 | 68.97 | 31.03 | 0.01 | 0.02 | 1.07 | 0.00 | 0.00 | 0.00 | |||||||||
| AC-10_01 | 0.10 | 0.00 | 0.56 | 68.97 | 31.03 | 0.01 | 0.03 | 0.05 | 0.00 | 0.00 | 0.01 | |||||||||
| AC-10_02 | 0.12 | 0.00 | 0.35 | 68.97 | 31.03 | 0.01 | 0.02 | 0.19 | 0.00 | 0.00 | 0.00 | |||||||||
| AC-10_03 | 0.16 | 0.00 | 0.33 | 68.97 | 31.03 | 0.00 | 0.02 | 0.05 | 0.00 | 0.00 | 0.00 | |||||||||
| AC-10_04 | 0.12 | 0.00 | 0.58 | 68.97 | 31.03 | 0.00 | 0.01 | 0.06 | 0.00 | 0.00 | 0.00 | |||||||||
| AC-10_05 | 0.08 | 0.01 | 0.68 | 68.97 | 31.03 | 0.00 | 0.01 | 0.04 | 0.02 | 0.00 | 0.00 | |||||||||
| AC-18_01 | 0.79 | 0.01 | 0.79 | 68.97 | 31.03 | 0.03 | 0.09 | 2.13 | 0.01 | 0.00 | 0.10 | |||||||||
| AC-18_02 | 0.78 | 0.01 | 0.79 | 68.97 | 31.03 | 0.03 | 0.09 | 2.17 | 0.01 | 0.00 | 0.10 | |||||||||
| AC-18_03 | 0.08 | 0.01 | 0.69 | 68.97 | 31.03 | 0.00 | 0.01 | 0.04 | 0.02 | 0.00 | 0.00 | |||||||||
| AC-18_04 | 0.79 | 0.01 | 0.79 | 68.97 | 31.03 | 0.03 | 0.09 | 2.20 | 0.01 | 0.00 | 0.10 | |||||||||
| AC-18_05 | 0.26 | 0.01 | 0.67 | 68.97 | 31.03 | 0.01 | 0.02 | 0.66 | 0.00 | 0.00 | 0.01 | |||||||||
| (b) | ||||||||||||||||||||
| Sample | AC -1_01 | AC -1_02 | AC -1_03 | AC -1_04 | AC -1_04 | AC -8_01 | AC -8_02 | AC -8_03 | AC -8_04 | AC -8_05 | AC 10_01 | AC 10_02 | AC 10_03 | AC 10_04 | AC 10_05 | AC 18_01 | AC 18_02 | AC-18_03 | AC-18_04 | AC-18_05 |
| Sc | 1.41 | 1.61 | 1.16 | 1.27 | 1.34 | 1.14 | 0.60 | 0.51 | 0.74 | 0.78 | 0.90 | 0.59 | 0.56 | 0.56 | 1.20 | 1.31 | 1.36 | 1.23 | 1.36 | 0.69 |
| V | 42.76 | 28.75 | 27.83 | 28.38 | 29.96 | 77.12 | 18.52 | 15.31 | 33.09 | 20.87 | 26.53 | 27.65 | 22.81 | 24.31 | 25.08 | 45.64 | 45.53 | 25.08 | 45.95 | 41.97 |
| Cr | 2.28 | 2.72 | 1.83 | 2.22 | 2.81 | 2.04 | 1.91 | 2.66 | 2.40 | 2.83 | 2.22 | 1.69 | 2.63 | 2.21 | 2.22 | 1.83 | 1.78 | 2.06 | 1.82 | 1.80 |
| Co | 4.70 | 1.24 | 1.18 | 0.98 | 1.03 | 6.17 | 1.89 | 0.74 | 3.65 | 2.34 | 2.22 | 1.95 | 1.41 | 1.20 | 1.50 | 4.40 | 4.35 | 1.49 | 4.39 | 1.69 |
| Ni | 4.53 | 1.99 | 0.98 | 2.31 | 1.59 | 4.23 | 1.32 | 1.07 | 7.87 | 3.63 | 1.60 | 1.02 | 1.21 | 0.96 | 0.91 | 5.49 | 5.40 | 0.75 | 5.41 | 1.66 |
| Ga | 5.44 | 5.12 | 5.71 | 5.32 | 5.62 | 6.89 | 6.66 | 6.77 | 8.47 | 7.37 | 8.01 | 7.35 | 7.74 | 7.22 | 7.44 | 5.49 | 5.72 | 7.47 | 5.72 | 4.56 |
| Ge | 10.99 | 9.25 | 8.21 | 8.01 | 8.02 | 13.73 | 12.54 | 11.00 | 11.50 | 10.60 | 12.68 | 11.78 | 10.65 | 10.83 | 10.36 | 9.59 | 9.42 | 10.44 | 9.47 | 8.19 |
| Rb | 0.10 | 0.07 | 0.05 | 0.05 | 0.04 | 0.28 | 0.31 | 0.10 | 0.14 | 0.07 | 0.35 | 0.09 | 0.22 | 0.07 | 0.47 | 0.08 | 0.08 | 0.45 | 0.08 | 0.05 |
| Sr | 5.50 | 2.20 | 1.26 | 1.19 | 0.87 | 9.31 | 2.41 | 0.82 | 3.54 | 3.58 | 0.59 | 0.64 | 0.27 | 0.26 | 0.36 | 7.74 | 7.90 | 0.35 | 7.99 | 2.41 |
| Y | 0.25 | 0.18 | 0.17 | 0.16 | 0.22 | 0.35 | 0.09 | 0.06 | 0.14 | 0.14 | 0.19 | 0.14 | 0.14 | 0.09 | 0.08 | 0.21 | 0.22 | 0.08 | 0.22 | 0.13 |
| Zr | 7.05 | 6.64 | 4.67 | 12.31 | 9.54 | 1.93 | 0.65 | 0.39 | 0.44 | 0.55 | 3.64 | 3.07 | 2.07 | 6.48 | 4.93 | 1.33 | 1.29 | 4.98 | 1.30 | 1.53 |
| Nb | 0.46 | 0.18 | 0.12 | 0.30 | 0.28 | 0.14 | 0.07 | 0.01 | 0.01 | 0.01 | 0.03 | 0.02 | 0.01 | 0.03 | 0.06 | 0.11 | 0.10 | 0.06 | 0.10 | 0.11 |
| Cs | 0.03 | 0.02 | 0.02 | 0.02 | 0.02 | 0.11 | 0.02 | 0.01 | 0.02 | 0.02 | 0.26 | 0.06 | 0.17 | 0.03 | 0.03 | 0.01 | 0.01 | 0.02 | 0.01 | 0.01 |
| Ba | 3.04 | 1.48 | 1.63 | 1.18 | 1.01 | 9.99 | 1.49 | 0.33 | 3.27 | 1.90 | 1.04 | 0.51 | 0.51 | 0.47 | 0.36 | 4.21 | 4.04 | 0.36 | 4.09 | 0.91 |
| La | 0.07 | 0.04 | 0.04 | 0.04 | 0.04 | 0.08 | 0.07 | 0.01 | 0.03 | 0.04 | 0.03 | 0.03 | 0.05 | 0.03 | 0.04 | 0.06 | 0.06 | 0.04 | 0.06 | 0.03 |
| Ce | 0.15 | 0.09 | 0.14 | 0.09 | 0.10 | 0.16 | 0.21 | 0.03 | 0.08 | 0.08 | 0.02 | 0.04 | 0.06 | 0.04 | 0.12 | 0.13 | 0.13 | 0.13 | 0.13 | 0.07 |
| Pr | 0.03 | 0.03 | 0.02 | 0.02 | 0.02 | 0.04 | 0.02 | 0.01 | 0.02 | 0.02 | 0.01 | 0.01 | 0.02 | 0.01 | 0.04 | 0.03 | 0.04 | 0.05 | 0.04 | 0.02 |
| Nd | 0.18 | 0.12 | 0.12 | 0.15 | 0.12 | 0.13 | 0.08 | 0.04 | 0.07 | 0.10 | 0.03 | 0.07 | 0.07 | 0.06 | 0.07 | 0.16 | 0.16 | 0.07 | 0.16 | 0.08 |
| Sm | 0.04 | 0.04 | 0.02 | 0.03 | 0.03 | 0.06 | 0.04 | 0.04 | 0.06 | 0.04 | 0.04 | 0.03 | 0.04 | 0.03 | 0.06 | 0.04 | 0.04 | 0.06 | 0.04 | 0.01 |
| Eu | 0.01 | 0.01 | 0.01 | 0.01 | 0.01 | 0.01 | 0.07 | 0.01 | 0.05 | 0.01 | 0.01 | 0.01 | 0.01 | 0.01 | 0.02 | 0.01 | 0.01 | 0.02 | 0.01 | 0.01 |
| Gd | 0.04 | 0.04 | 0.04 | 0.04 | 0.04 | 0.03 | 0.06 | 0.04 | 0.04 | 0.04 | 0.03 | 0.03 | 0.04 | 0.04 | 0.04 | 0.06 | 0.06 | 0.04 | 0.06 | 0.03 |
| Tb | 0.01 | 0.01 | 0.01 | 0.01 | 0.01 | 0.01 | 0.01 | 0.01 | 0.01 | 0.00 | 0.01 | 0.01 | 0.01 | 0.00 | 0.01 | 0.00 | 0.00 | 0.01 | 0.00 | 0.00 |
| Dy | 0.03 | 0.03 | 0.02 | 0.03 | 0.03 | 0.04 | 0.03 | 0.03 | 0.03 | 0.03 | 0.01 | 0.02 | 0.03 | 0.03 | 0.02 | 0.03 | 0.03 | 0.02 | 0.03 | 0.02 |
| Ho | 0.01 | 0.00 | 0.01 | 0.01 | 0.01 | 0.01 | 0.01 | 0.01 | 0.01 | 0.01 | 0.01 | 0.01 | 0.01 | 0.01 | 0.01 | 0.01 | 0.01 | 0.01 | 0.01 | 0.01 |
| Er | 0.03 | 0.03 | 0.02 | 0.03 | 0.03 | 0.03 | 0.03 | 0.03 | 0.03 | 0.03 | 0.03 | 0.01 | 0.03 | 0.03 | 0.02 | 0.03 | 0.03 | 0.02 | 0.03 | 0.02 |
| Tm | 0.01 | 0.01 | 0.01 | 0.01 | 0.01 | 0.01 | 0.02 | 0.01 | 0.01 | 0.01 | 0.01 | 0.01 | 0.00 | 0.01 | 0.01 | 0.01 | 0.00 | 0.01 | 0.01 | 0.00 |
| Yb | 0.05 | 0.04 | 0.04 | 0.04 | 0.04 | 0.04 | 0.05 | 0.05 | 0.02 | 0.04 | 0.04 | 0.04 | 0.04 | 0.04 | 0.03 | 0.03 | 0.03 | 0.03 | 0.03 | 0.03 |
| Lu | 0.01 | 0.01 | 0.01 | 0.01 | 0.01 | 0.01 | 0.01 | 0.01 | 0.01 | 0.01 | 0.01 | 0.01 | 0.01 | 0.01 | 0.02 | 0.01 | 0.01 | 0.02 | 0.01 | 0.01 |
| Hf | 0.10 | 0.06 | 0.04 | 0.18 | 0.11 | 0.05 | 0.03 | 0.03 | 0.03 | 0.03 | 0.03 | 0.02 | 0.01 | 0.05 | 0.03 | 0.03 | 0.02 | 0.03 | 0.02 | 0.01 |
| Ta | 0.03 | 0.01 | 0.01 | 0.03 | 0.02 | 0.01 | 0.02 | 0.01 | 0.01 | 0.01 | 0.01 | 0.01 | 0.01 | 0.01 | 0.01 | 0.01 | 0.01 | 0.01 | 0.01 | 0.01 |
| Pb | 0.38 | 0.35 | 0.36 | 0.27 | 0.50 | 0.47 | 0.27 | 0.05 | 0.66 | 0.25 | 0.12 | 0.09 | 0.05 | 0.16 | 0.17 | 0.20 | 0.21 | 0.17 | 0.22 | 0.12 |
| Th | 0.14 | 0.11 | 0.10 | 0.22 | 0.17 | 0.05 | 0.02 | 0.01 | 0.01 | 0.01 | 0.09 | 0.11 | 0.09 | 0.20 | 0.17 | 0.05 | 0.04 | 0.17 | 0.04 | 0.03 |
| U | 0.24 | 0.16 | 0.15 | 0.13 | 0.18 | 0.32 | 0.20 | 0.06 | 0.22 | 0.16 | 0.08 | 0.08 | 0.08 | 0.12 | 0.24 | 0.26 | 0.26 | 0.24 | 0.26 | 0.14 |
| B | 9.45 | 4.32 | 3.46 | 4.07 | 3.49 | 7.63 | 6.62 | 6.65 | 5.79 | 5.88 | 7.95 | 7.77 | 6.38 | 6.73 | 6.51 | 4.25 | 4.19 | 6.28 | 4.24 | 3.40 |
| Zn | 25.87 | 8.99 | 6.42 | 10.63 | 6.96 | 34.34 | 8.70 | 2.65 | 18.69 | 12.24 | 8.80 | 6.97 | 6.26 | 5.30 | 7.11 | 31.81 | 32.09 | 7.02 | 32.45 | 7.15 |
| AC 1 | AC 2 | AC 3 | AC 4 | AC 5 | AC 6 | AC 7 | AC 8 | AC 9 | AC 10 | AC 11 | AC 12 | AC 13 | AC 14 | AC 15 | AC 16 | AC 17 | AC 18 | |
|---|---|---|---|---|---|---|---|---|---|---|---|---|---|---|---|---|---|---|
| SiO2 | 29.44 | 32.38 | 67.44 | 25.50 | 35.18 | 44.69 | 32.09 | 30.90 | 28.30 | 29.07 | 42.01 | 33.85 | 43.36 | 32.82 | 34.87 | 86.26 | 79.23 | 33.70 |
| Al2O3 | 0.97 | 0.65 | 0.19 | 0.68 | 0.59 | 17.96 | 0.26 | 5.13 | 6.27 | 0.68 | 4.36 | 7.66 | 0.48 | 0.28 | 0.39 | 0.54 | 0.54 | 0.30 |
| Fe2O3 | 11.95 | 31.48 | 6.24 | 7.17 | 23.44 | 12.77 | 60.50 | 16.54 | 14.53 | 31.83 | 9.61 | 11.26 | 29.75 | 33.93 | 31.54 | 3.58 | 4.38 | 29.67 |
| MgO | 0.29 | 0.19 | 0.22 | 0.25 | 0.51 | 6.28 | 0.13 | 3.94 | 3.64 | 0.31 | 10.54 | 6.02 | 1.14 | 0.33 | 0.48 | 0.14 | 0.21 | 0.33 |
| CaO | 34.78 | 32.89 | 15.25 | 39.51 | 29.72 | 12.67 | 0.27 | 35.71 | 36.74 | 33.34 | 26.50 | 32.90 | 21.50 | 29.79 | 29.70 | 1.10 | 0.93 | 31.08 |
| Na2O | <0.01 | <0.01 | <0.01 | <0.01 | <0.01 | 2.23 | <0.01 | <0.01 | <0.01 | <0.01 | <0.01 | <0.01 | 0.84 | 0.19 | 0.14 | 0.04 | <0.01 | <0.01 |
| K2O | 0.02 | <0.01 | 0.02 | 0.01 | 0.01 | 0.48 | <0.01 | <0.01 | 0.01 | 0.02 | 0.03 | <0.01 | 0.20 | 0.02 | <0.01 | 0.04 | 0.02 | 0.01 |
| TiO2 | <0.01 | <0.01 | <0.01 | <0.01 | <0.01 | 0.80 | <0.01 | 0.30 | 0.37 | <0.01 | 0.38 | 0.44 | <0.01 | 0.01 | <0.01 | <0.01 | <0.01 | <0.01 |
| MnO | 0.29 | 0.27 | 0.19 | 0.34 | 0.32 | 0.22 | 0.10 | 0.41 | 0.37 | 0.43 | 0.39 | 0.66 | 1.05 | 0.50 | 0.39 | 0.01 | 0.01 | 0.24 |
| P2O5 | 0.09 | <0.01 | 0.02 | 0.03 | 0.02 | 0.12 | <0.01 | <0.01 | 0.03 | <0.01 | <0.01 | <0.01 | <0.01 | 0.03 | <0.01 | <0.01 | <0.01 | 0.06 |
| SO3 | 0.02 | 0.01 | 0.03 | 0.02 | 0.05 | 0.05 | 0.17 | 0.02 | 0.01 | 0.01 | 0.02 | <0.01 | 0.01 | 0.01 | 0.01 | 4.87 | 9.66 | 0.12 |
| Cl | <0.01 | <0.01 | 0.02 | <0.01 | <0.01 | 0.07 | <0.01 | 0.02 | 0.02 | 0.02 | 0.05 | 0.04 | <0.01 | 0.02 | 0.02 | <0.01 | <0.01 | <0.01 |
| Cr2O3 | <0.01 | <0.01 | <0.01 | <0.01 | <0.01 | <0.01 | <0.01 | <0.01 | <0.01 | <0.01 | <0.01 | <0.01 | <0.01 | <0.01 | <0.01 | <0.01 | <0.01 | <0.01 |
| LOI | 22.12 | 2.11 | 10.34 | 26.48 | 10.13 | 1.56 | 6.17 | 6.98 | 9.67 | 4.27 | 6.07 | 7.10 | 1.62 | 2.03 | 2.43 | 3.37 | 4.95 | 4.43 |
| Total | 52.59 | 53.89 | 510.9 | 25.63 | 35.54 | 288.2 | 33.30 | 34.96 | 228.3 | 43.81 | 42.18 | 33.86 | 89.31 | 117.8 | 372.8 | 473.2 | 475.2 | 597.7 |
| Sc | 9.00 | 7.00 | 5.00 | 7.00 | 7.00 | 37.00 | <1 | 13.00 | 18.00 | 7.00 | 15.00 | 13.00 | 6.00 | 6.00 | 7.00 | 2.00 | 3.00 | 8.00 |
| V | 19.00 | 3.00 | 50.00 | 10.00 | 5.00 | 289.00 | 20.00 | 57.00 | 86.00 | 5.00 | 50.00 | 140.00 | <1 | 32.00 | 10.00 | 6.00 | 5.00 | 4.00 |
| Co | 26.00 | 40.00 | 59.00 | 23.00 | 23.00 | 65.00 | 325.00 | 14.00 | 15.00 | 24.00 | 25.00 | 20.00 | 48.00 | 18.00 | 28.00 | 70.00 | 92.00 | 47.00 |
| Ni | 19.00 | 61.00 | 31.00 | 4.00 | 35.00 | 42.00 | 203.00 | 32.00 | 22.00 | 65.00 | 16.00 | 24.00 | 64.00 | 62.00 | 56.00 | 12.00 | 17.00 | 58.00 |
| Cu | 94.00 | 16.00 | 21.00 | 3.00 | 32.00 | 22.00 | 1592.00 | 175.00 | <1 | <1 | 66.00 | 103.00 | <1 | <1 | 13.00 | 2.00 | 5.00 | 375.00 |
| Zn | 11.00 | <1 | 26.00 | 9.00 | 18.00 | 85.00 | 802.00 | 39.00 | 33.00 | 8.00 | 80.00 | 61.00 | 163.00 | 46.00 | 33.00 | 5.00 | 8.00 | <1 |
| As | <1 | 9.00 | 7.00 | 8.00 | 8.00 | 5.00 | <1 | <1 | <1 | 7.00 | <1 | <1 | <1 | <1 | <1 | 298.00 | 334.00 | <1 |
| Sr | 75.00 | 13.00 | 32.00 | 71.00 | 64.00 | 289.00 | 34.00 | 34.00 | 41.00 | 19.00 | 72.00 | 56.00 | 46.00 | 19.00 | 20.00 | 13.00 | 11.00 | 26.00 |
| Zr | 15.00 | 14.00 | 79.00 | 17.00 | 15.00 | 45.00 | 15.00 | 76.00 | 66.00 | 14.00 | 105.00 | 107.00 | 20.00 | 15.00 | 18.00 | 14.00 | 14.00 | 13.00 |
| Nb | 2.00 | 1.00 | 3.00 | 6.00 | 2.00 | 4.00 | 2.00 | 4.00 | 5.00 | 2.00 | 3.00 | 5.00 | 3.00 | 5.00 | 3.00 | 3.00 | 2.00 | 1.00 |
| Mo | 2.00 | <1 | 2.00 | 3.00 | 6.00 | 2.00 | 15.00 | 1.00 | 1.00 | 3.00 | 1.00 | <1 | 2.00 | 2.00 | 4.00 | 3.00 | 3.00 | 3.00 |
| Ba | <1 | <1 | 9.00 | <1 | <1 | 54.00 | 32.00 | <1 | <1 | <1 | <1 | <1 | 61.00 | 16.00 | 10.00 | 22.00 | 15.00 | <1 |
| Pb | <1 | <1 | <1 | 10.00 | <1 | 5.00 | <1 | <1 | <1 | <1 | <1 | <1 | <1 | <1 | <1 | 35.00 | 36.00 | 5.00 |
| Ga | 4.89 | 9.95 | 2.19 | 4.58 | 9.29 | 15.36 | 3.88 | 10.88 | 11.81 | 15.71 | 6.27 | 9.15 | 8.61 | 15.50 | 10.47 | 1.75 | 1.83 | 15.20 |
| Rb | 6.66 | 5.05 | 13.19 | 6.18 | 6.29 | 15.96 | 4.61 | 5.63 | 5.56 | 6.46 | 7.78 | 6.85 | 12.98 | 16.10 | 7.34 | 18.51 | 17.48 | 7.85 |
| In | 0.05 | 0.22 | 0.01 | 0.15 | 0.81 | 0.04 | 0.61 | 0.37 | 0.36 | 0.42 | 0.17 | 0.13 | 1.00 | 2.43 | 1.96 | 0.05 | 0.03 | 0.31 |
| Cs | 0.06 | 0.04 | 0.00 | 0.00 | 0.01 | 0.68 | 0.01 | 0.02 | 0.02 | 0.37 | 0.20 | 0.21 | 0.77 | 0.15 | 0.24 | 0.05 | 0.04 | 0.06 |
| Tl | 0.01 | 0.01 | 0.00 | 0.00 | 0.01 | 0.06 | 0.00 | 0.00 | 0.00 | 0.01 | 0.01 | 0.01 | 0.01 | 0.00 | 0.01 | 0.24 | 0.39 | 0.00 |
| Y | 3.38 | 3.04 | 7.62 | 6.32 | 1.62 | 11.89 | 0.88 | 15.73 | 15.24 | 1.40 | 9.95 | 48.13 | 4.16 | 10.37 | 5.25 | 1.48 | 1.23 | 9.92 |
| Th | 0.10 | 0.07 | 0.05 | 0.04 | 0.05 | 0.67 | 0.05 | 1.04 | 1.17 | 0.04 | 0.70 | 1.08 | 0.52 | 0.36 | 0.46 | 0.05 | 0.02 | 0.01 |
| U | 0.15 | 0.18 | 0.89 | 0.20 | 0.57 | 0.24 | 2.63 | 2.86 | 2.32 | 0.29 | 0.32 | 1.35 | 2.35 | 4.23 | 2.21 | 0.13 | 0.32 | 0.15 |
| Fe/Mn | 42.1 | 122 | 34.6 | 21.4 | 75.8 | 58.3 | 671.7 | 41.4 | 40.3 | 74.9 | 24.8 | 17.1 | 28.5 | 69.3 | 81.7 | 397.1 | 485.7 | 128.1 |
| AC 1 | AC 2 | AC 3 | AC 4 | AC 5 | AC 6 | AC 7 | AC 8 | AC 9 | AC 10 | AC 11 | AC 12 | AC 13 | AC 14 | AC 15 | AC 16 | AC 17 | AC 18 | |
|---|---|---|---|---|---|---|---|---|---|---|---|---|---|---|---|---|---|---|
| La | 0.48 | 1.49 | 1.92 | 0.88 | 6.81 | 3.84 | 0.22 | 0.94 | 1.38 | 5.25 | 1.82 | 1.48 | 4.45 | 7.70 | 4.73 | 0.40 | 0.26 | 1.05 |
| Ce | 0.59 | 3.33 | 4.03 | 1.47 | 12.01 | 8.40 | 0.36 | 6.33 | 7.54 | 8.68 | 5.31 | 4.19 | 10.76 | 16.07 | 8.71 | 0.65 | 0.44 | 1.19 |
| Pr | 0.14 | 0.50 | 0.61 | 0.32 | 0.95 | 1.15 | 0.04 | 1.54 | 1.67 | 0.67 | 0.88 | 0.91 | 1.12 | 1.54 | 0.80 | 0.10 | 0.07 | 0.31 |
| Nd | 0.68 | 1.89 | 2.89 | 1.28 | 2.22 | 5.17 | 0.12 | 8.51 | 8.98 | 1.42 | 4.14 | 6.29 | 3.21 | 4.76 | 2.31 | 0.36 | 0.24 | 1.12 |
| Sm | 0.18 | 0.32 | 0.81 | 0.31 | 0.20 | 1.49 | 0.04 | 2.09 | 2.17 | 0.15 | 1.28 | 3.68 | 0.56 | 1.06 | 0.56 | 0.11 | 0.08 | 0.29 |
| Eu | 0.10 | 0.23 | 0.28 | 0.20 | 0.22 | 0.63 | 0.05 | 1.40 | 1.29 | 0.35 | 0.30 | 1.20 | 0.34 | 0.34 | 0.26 | 0.06 | 0.03 | 0.24 |
| Gd | 0.24 | 0.40 | 1.26 | 0.49 | 0.23 | 2.04 | 0.04 | 2.42 | 2.44 | 0.14 | 1.61 | 6.29 | 0.48 | 1.20 | 0.66 | 0.12 | 0.09 | 0.51 |
| Tb | 0.03 | 0.06 | 0.21 | 0.09 | 0.04 | 0.34 | 0.01 | 0.42 | 0.40 | 0.03 | 0.27 | 1.18 | 0.08 | 0.22 | 0.11 | 0.02 | 0.02 | 0.10 |
| Dy | 0.27 | 0.32 | 1.27 | 0.58 | 0.19 | 2.19 | 0.04 | 2.64 | 2.40 | 0.14 | 1.72 | 8.34 | 0.44 | 1.37 | 0.59 | 0.13 | 0.10 | 0.69 |
| Ho | 0.06 | 0.07 | 0.28 | 0.13 | 0.04 | 0.45 | 0.01 | 0.59 | 0.52 | 0.03 | 0.35 | 1.85 | 0.10 | 0.30 | 0.13 | 0.06 | 0.04 | 0.16 |
| Er | 0.20 | 0.20 | 0.77 | 0.39 | 0.13 | 1.33 | 0.03 | 1.92 | 1.58 | 0.09 | 1.07 | 5.90 | 0.29 | 1.00 | 0.39 | 0.10 | 0.07 | 0.49 |
| Tm | 0.03 | 0.03 | 0.11 | 0.06 | 0.02 | 0.20 | 0.00 | 0.30 | 0.24 | 0.02 | 0.17 | 0.94 | 0.05 | 0.18 | 0.07 | 0.02 | 0.01 | 0.08 |
| Yb | 0.18 | 0.17 | 0.69 | 0.36 | 0.12 | 1.33 | 0.02 | 2.00 | 1.67 | 0.06 | 1.05 | 6.33 | 0.22 | 1.33 | 0.46 | 0.08 | 0.06 | 0.43 |
| Lu | 0.02 | 0.02 | 0.10 | 0.05 | 0.02 | 0.20 | 0.00 | 0.31 | 0.24 | 0.01 | 0.15 | 0.96 | 0.03 | 0.19 | 0.07 | 0.01 | 0.01 | 0.07 |
| Ce/Ce* | 0.55 | 0.95 | 0.91 | 0.68 | 1.01 | 0.97 | 0.85 | 1.03 | 1.05 | 0.97 | 1.02 | 0.86 | 1.15 | 1.08 | 1.00 | 0.77 | 0.80 | 0.50 |
| Eu/Eu* | 1.48 | 1.96 | 0.86 | 1.57 | 3.18 | 1.10 | 3.41 | 1.91 | 1.71 | 7.37 | 0.63 | 0.76 | 2.02 | 0.91 | 1.33 | 1.45 | 1.26 | 1.89 |
| Sample | Mineral | δ 56Fe | 2 SD | δ 57/54Fe | 2 SD |
|---|---|---|---|---|---|
| AC1 | Magnetite | 0.272 | 0.043 | 0.432 | 0.039 |
| AC8 | Magnetite | 0.361 | 0.086 | 0.540 | 0.095 |
| AC10 | Magnetite | 0.359 | 0.020 | 0.530 | 0.020 |
| AC18 | Magnetite | 0.305 | 0.053 | 0.419 | 0.144 |
Disclaimer/Publisher’s Note: The statements, opinions and data contained in all publications are solely those of the individual author(s) and contributor(s) and not of MDPI and/or the editor(s). MDPI and/or the editor(s) disclaim responsibility for any injury to people or property resulting from any ideas, methods, instructions or products referred to in the content. |
© 2025 by the authors. Licensee MDPI, Basel, Switzerland. This article is an open access article distributed under the terms and conditions of the Creative Commons Attribution (CC BY) license (https://creativecommons.org/licenses/by/4.0/).
Share and Cite
Kara, H.; Yalçın, C.; Ertürk, M.A.; Kalender, L. Mineral Chemistry and Iron Isotope Characteristics of Magnetites in Pertek Fe-Skarn Deposit (Türkiye). Minerals 2025, 15, 369. https://doi.org/10.3390/min15040369
Kara H, Yalçın C, Ertürk MA, Kalender L. Mineral Chemistry and Iron Isotope Characteristics of Magnetites in Pertek Fe-Skarn Deposit (Türkiye). Minerals. 2025; 15(4):369. https://doi.org/10.3390/min15040369
Chicago/Turabian StyleKara, Hatice, Cihan Yalçın, Mehmet Ali Ertürk, and Leyla Kalender. 2025. "Mineral Chemistry and Iron Isotope Characteristics of Magnetites in Pertek Fe-Skarn Deposit (Türkiye)" Minerals 15, no. 4: 369. https://doi.org/10.3390/min15040369
APA StyleKara, H., Yalçın, C., Ertürk, M. A., & Kalender, L. (2025). Mineral Chemistry and Iron Isotope Characteristics of Magnetites in Pertek Fe-Skarn Deposit (Türkiye). Minerals, 15(4), 369. https://doi.org/10.3390/min15040369