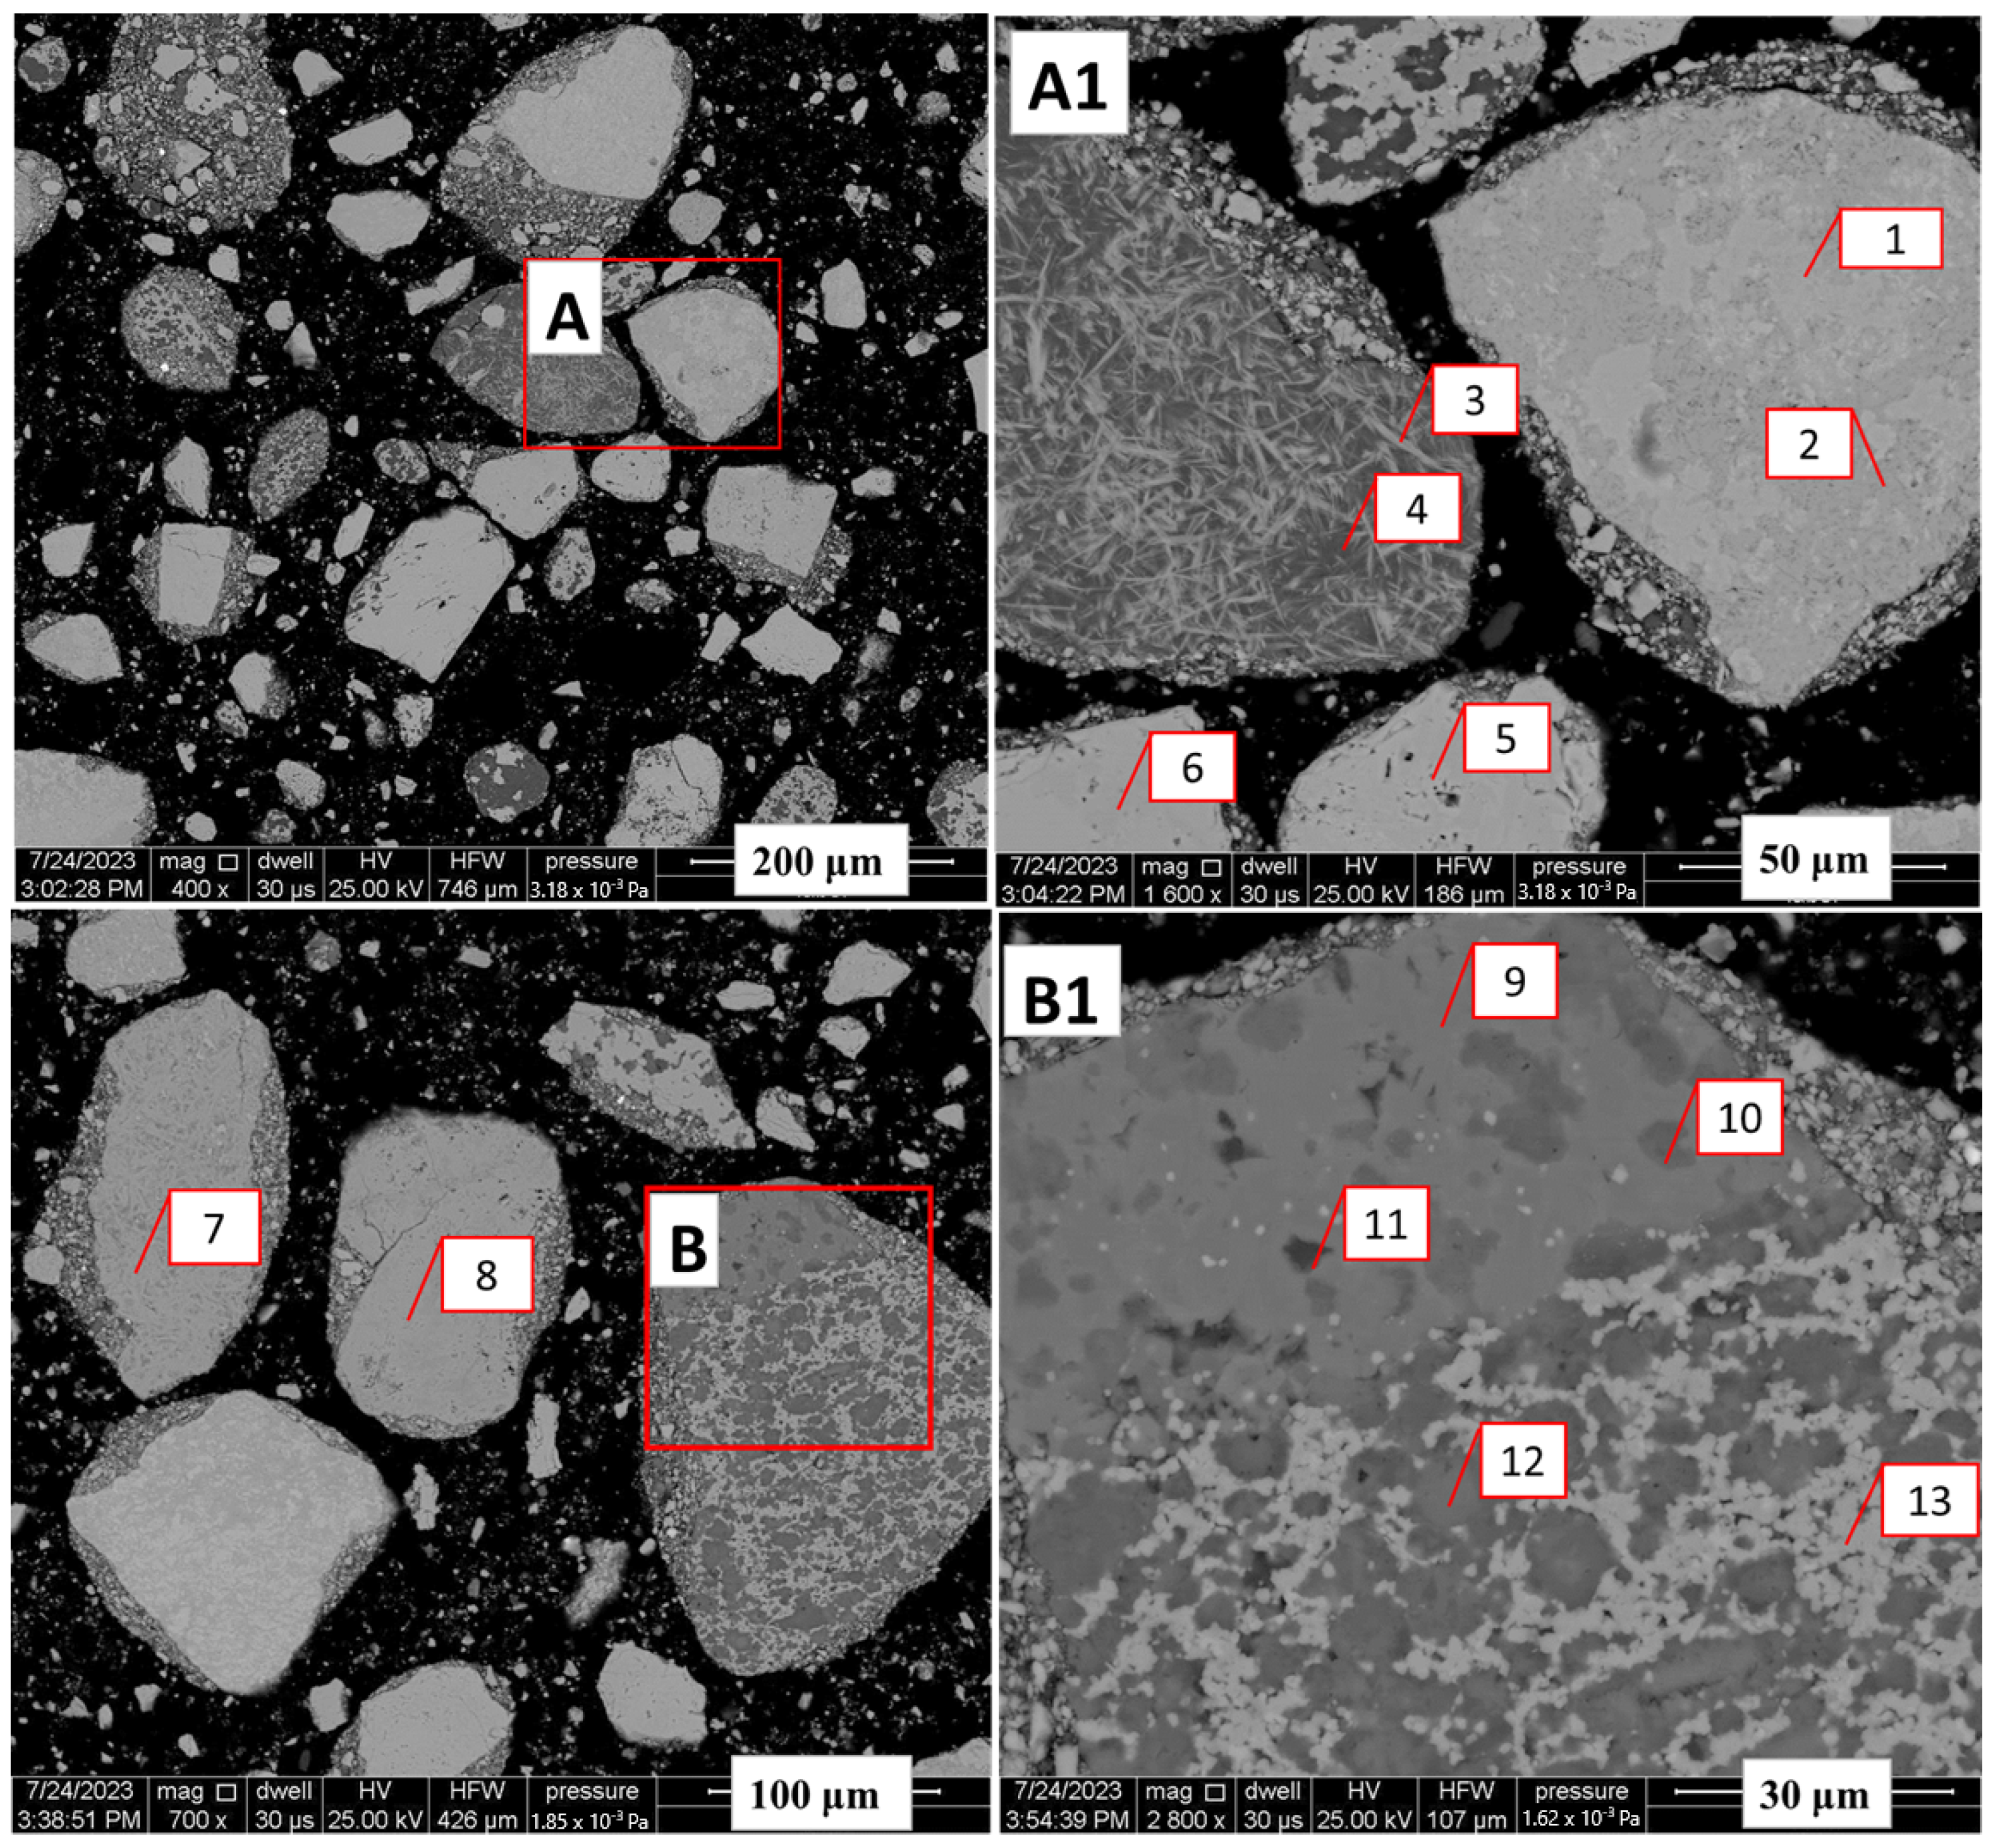
Figure 1.
Back-scattered electron images of the Nchwaneng manganese ore (A–B1). (A1,B1) are magnifications of red boxes in (A,B) at m and m, respectively. (A1) shows the various manganese bearing phases which includes hausmannite being adjacent to marokite (Spots 1 and 2) and as discrete particles (Spot 5). Specular marokite set on a groundmass of calcite can be seen in Spot 3. Spot 4 show a rare occurence of Mn-calcite. Braunite II (Spot 6) is shown as a discrete particle. (B1) displays a particle consisting of marokite–kutnohorite–Mn calcite–Mn serpentine, showing the phases of carbonates present (Spots 9–13). Particles containing Mn–oxide and braunite are shown in (B) (Spots 7 and 8, respectively).
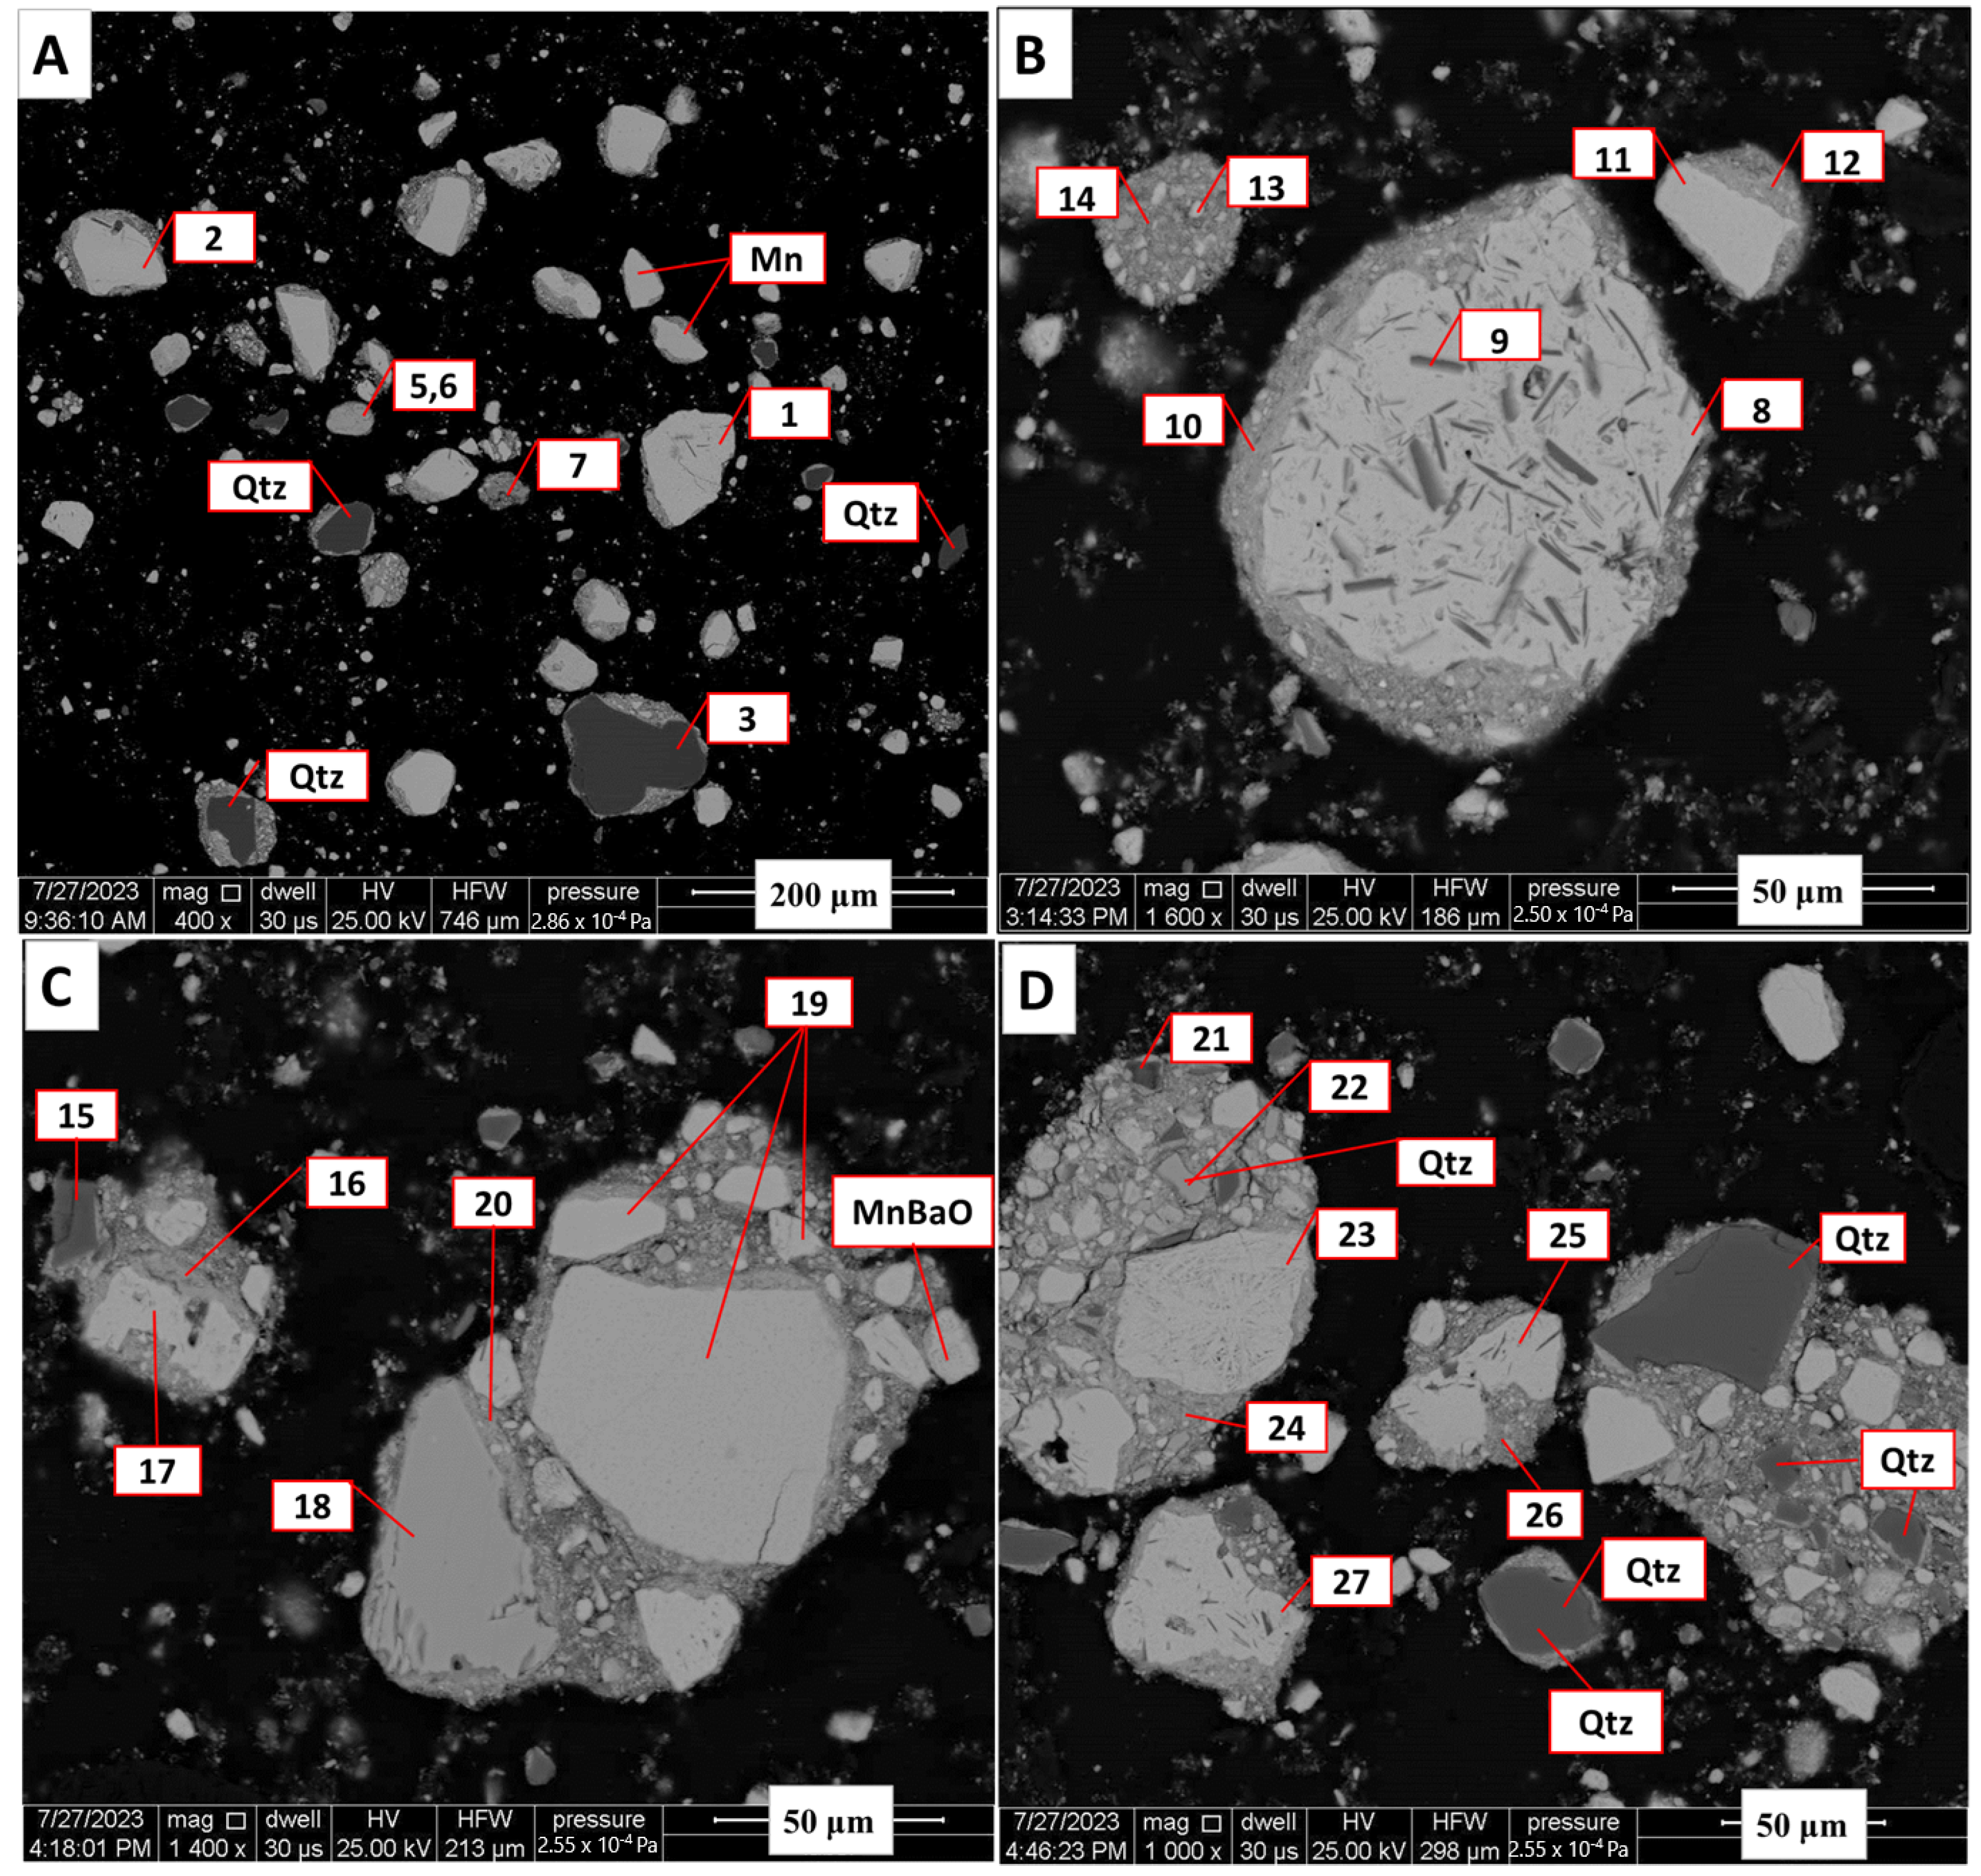
Figure 2.
Back-scattered electron images of Zambian manganese ore (A–D). These images show the prevalence of romanechite as the manganese bearing phase. Quartz particles can also be seen. Mixed spectra of mica–romanechite are shown in Spots 7 and 9 and romanechite with silicates in Spots 24 and 25. Spectra of Mn–oxide mixed with quartz are shown in Spot 21.
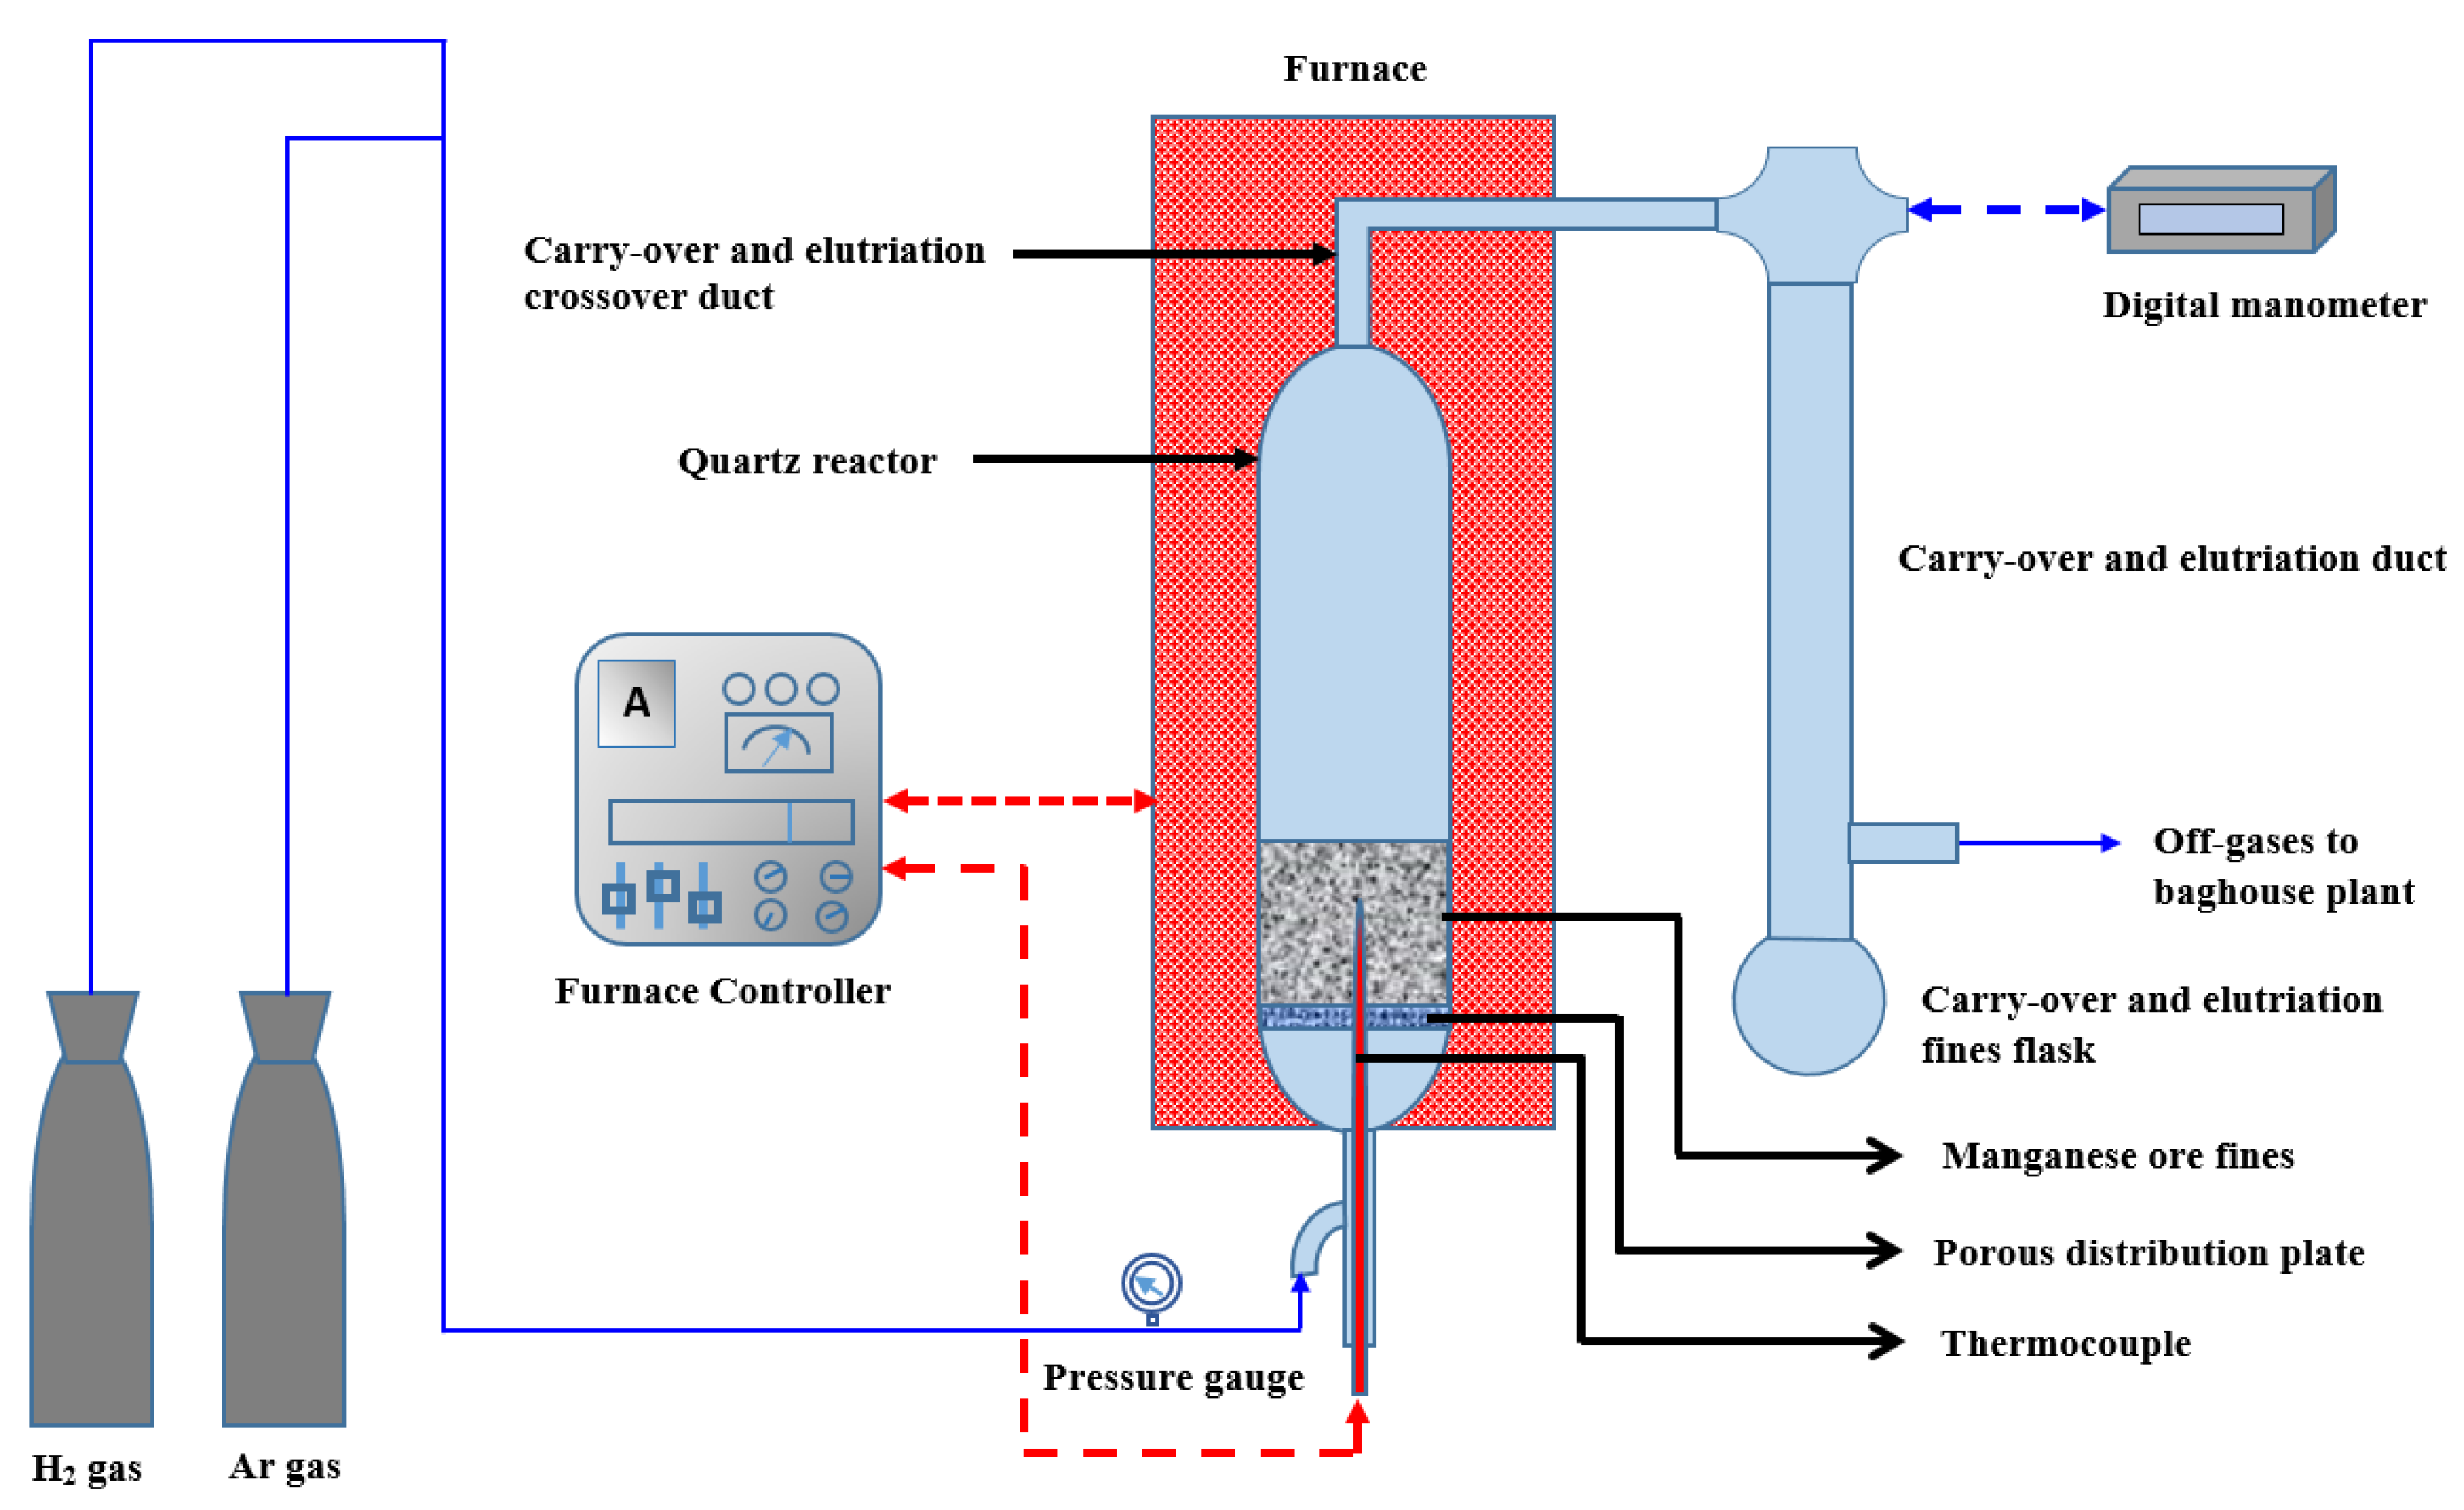
Figure 3.
Schematic representation of experimental set-up for lab-scale fluidization.
Figure 3.
Schematic representation of experimental set-up for lab-scale fluidization.
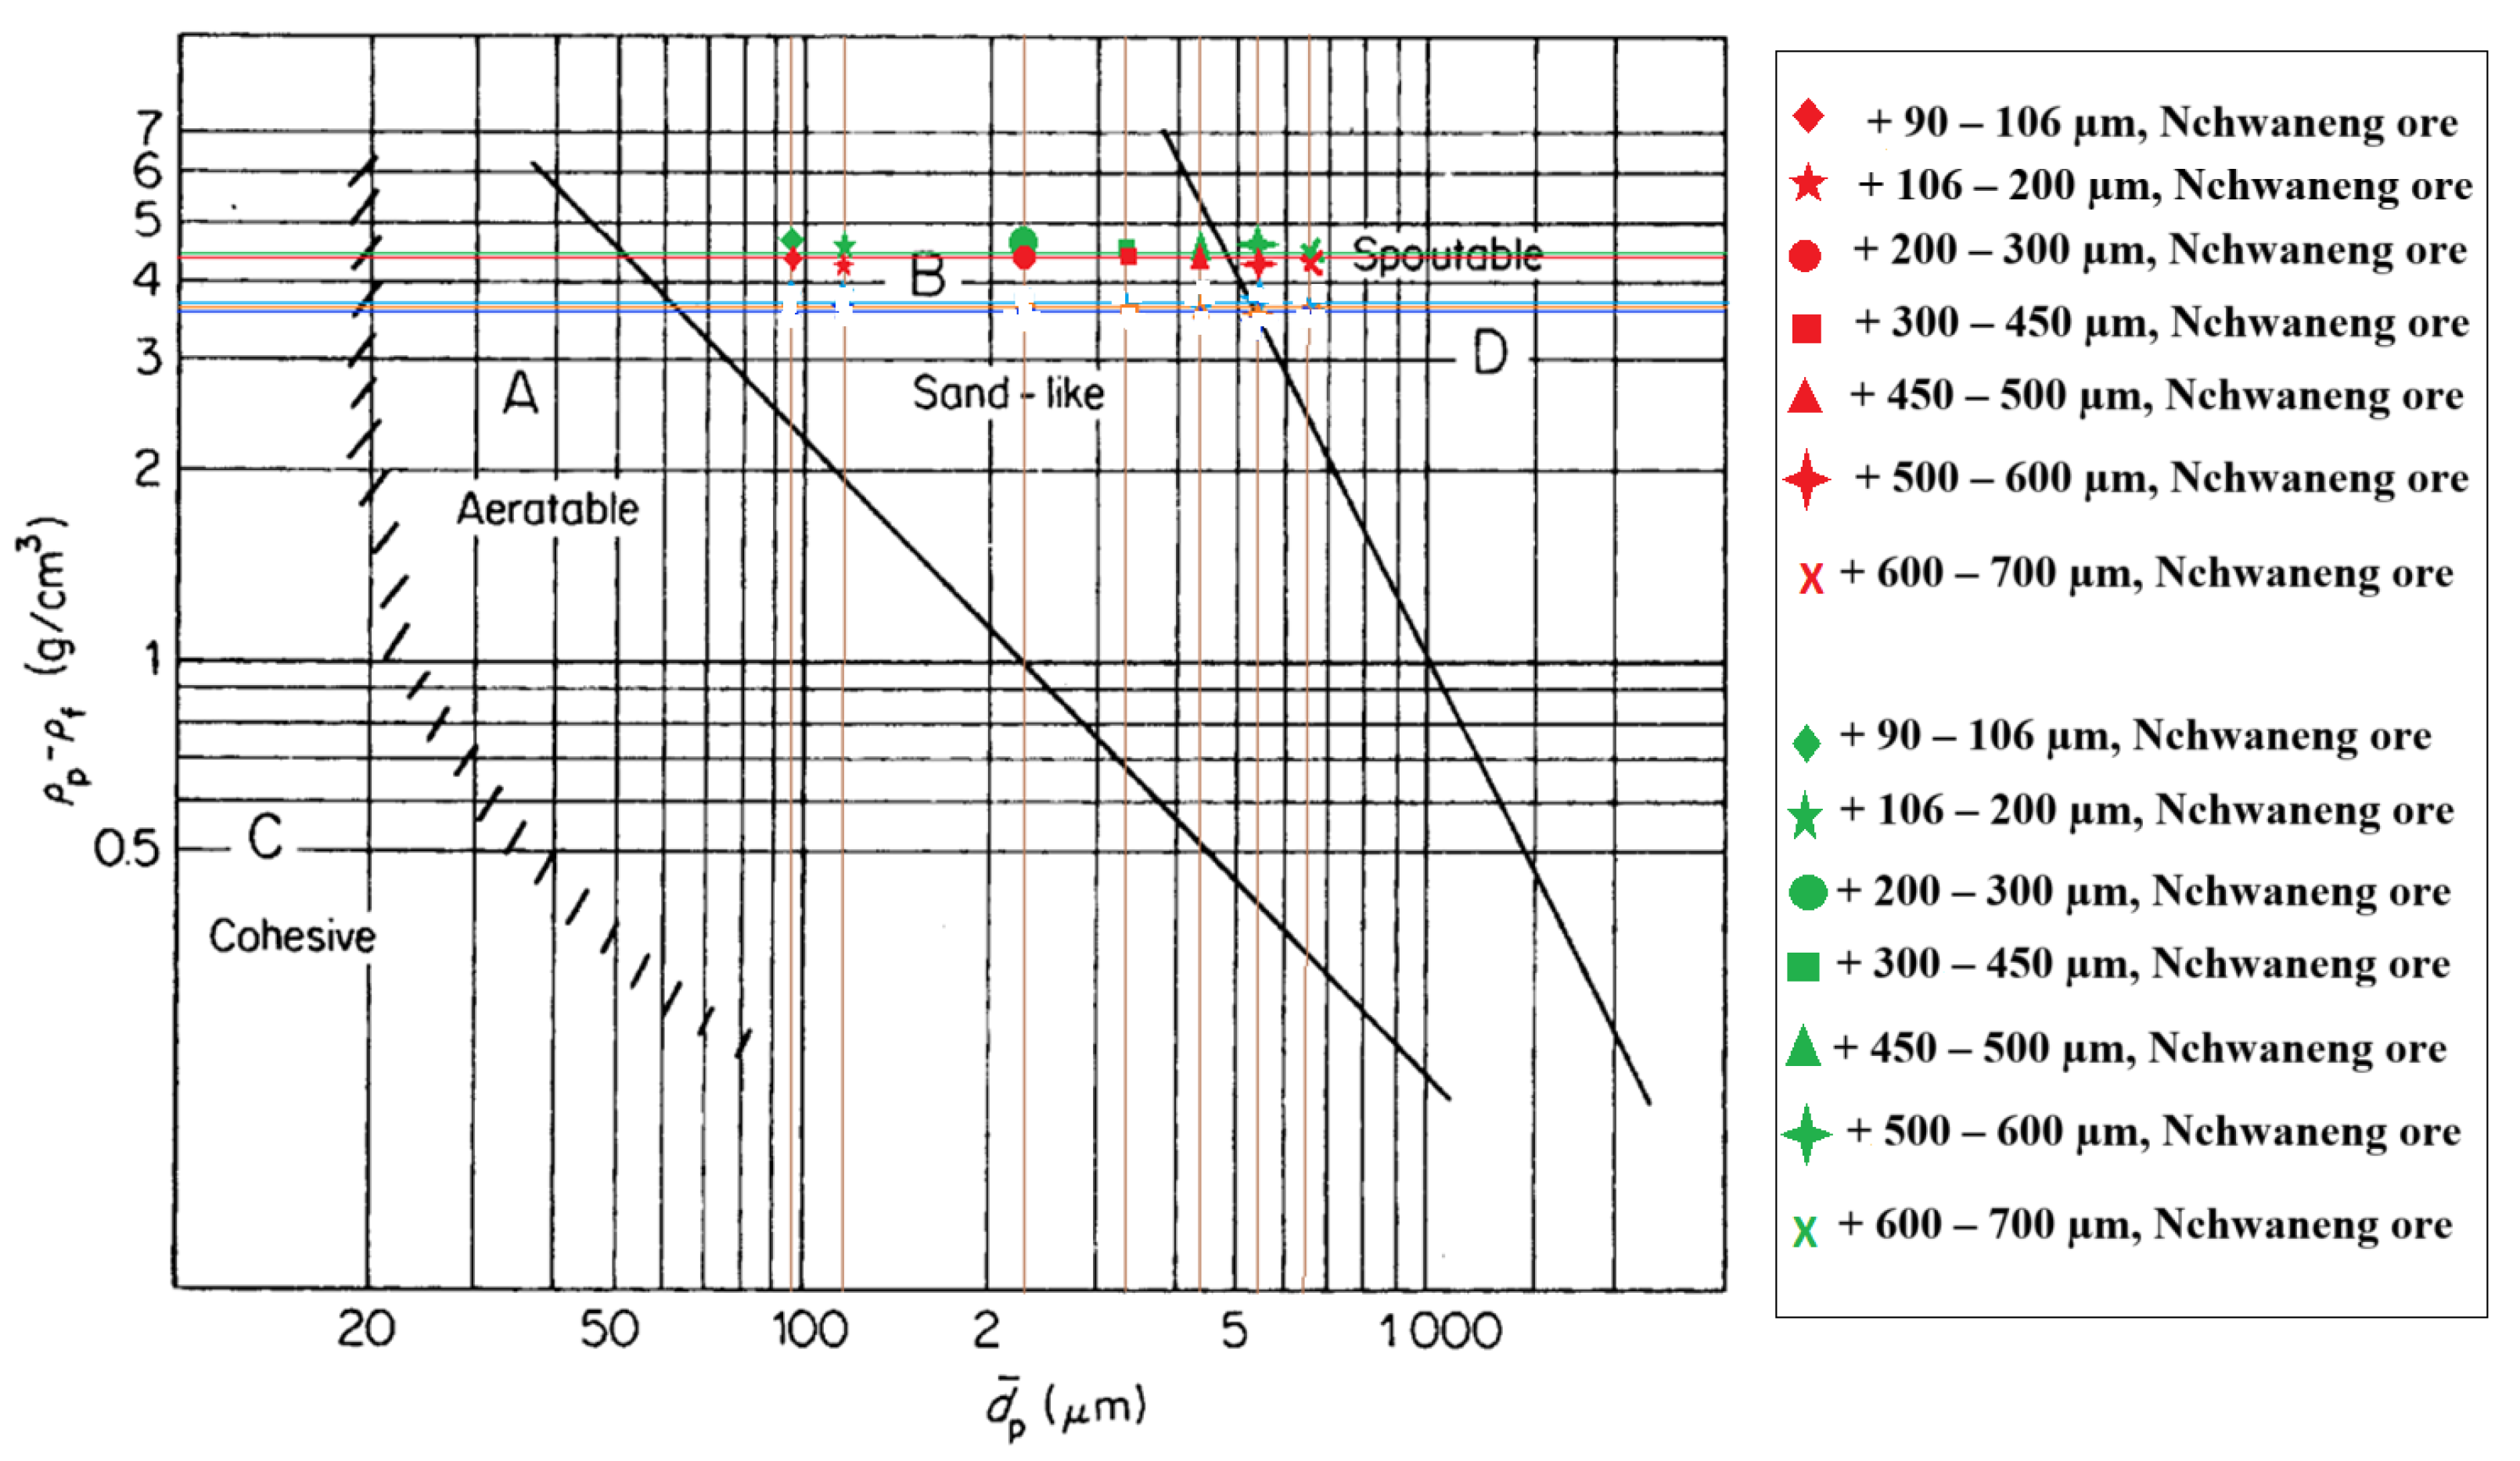
Figure 4.
Geldart chart for classification of raw Nchwaneng and Zambian manganese ore fines of particle size ranges of +90–m, +106–m, +200–m, +300–m, +450–m, +500–m and +600–m.
Figure 4.
Geldart chart for classification of raw Nchwaneng and Zambian manganese ore fines of particle size ranges of +90–m, +106–m, +200–m, +300–m, +450–m, +500–m and +600–m.
Figure 5.
Example of high-speed camara image at minimum fluidization velocity.
Figure 5.
Example of high-speed camara image at minimum fluidization velocity.
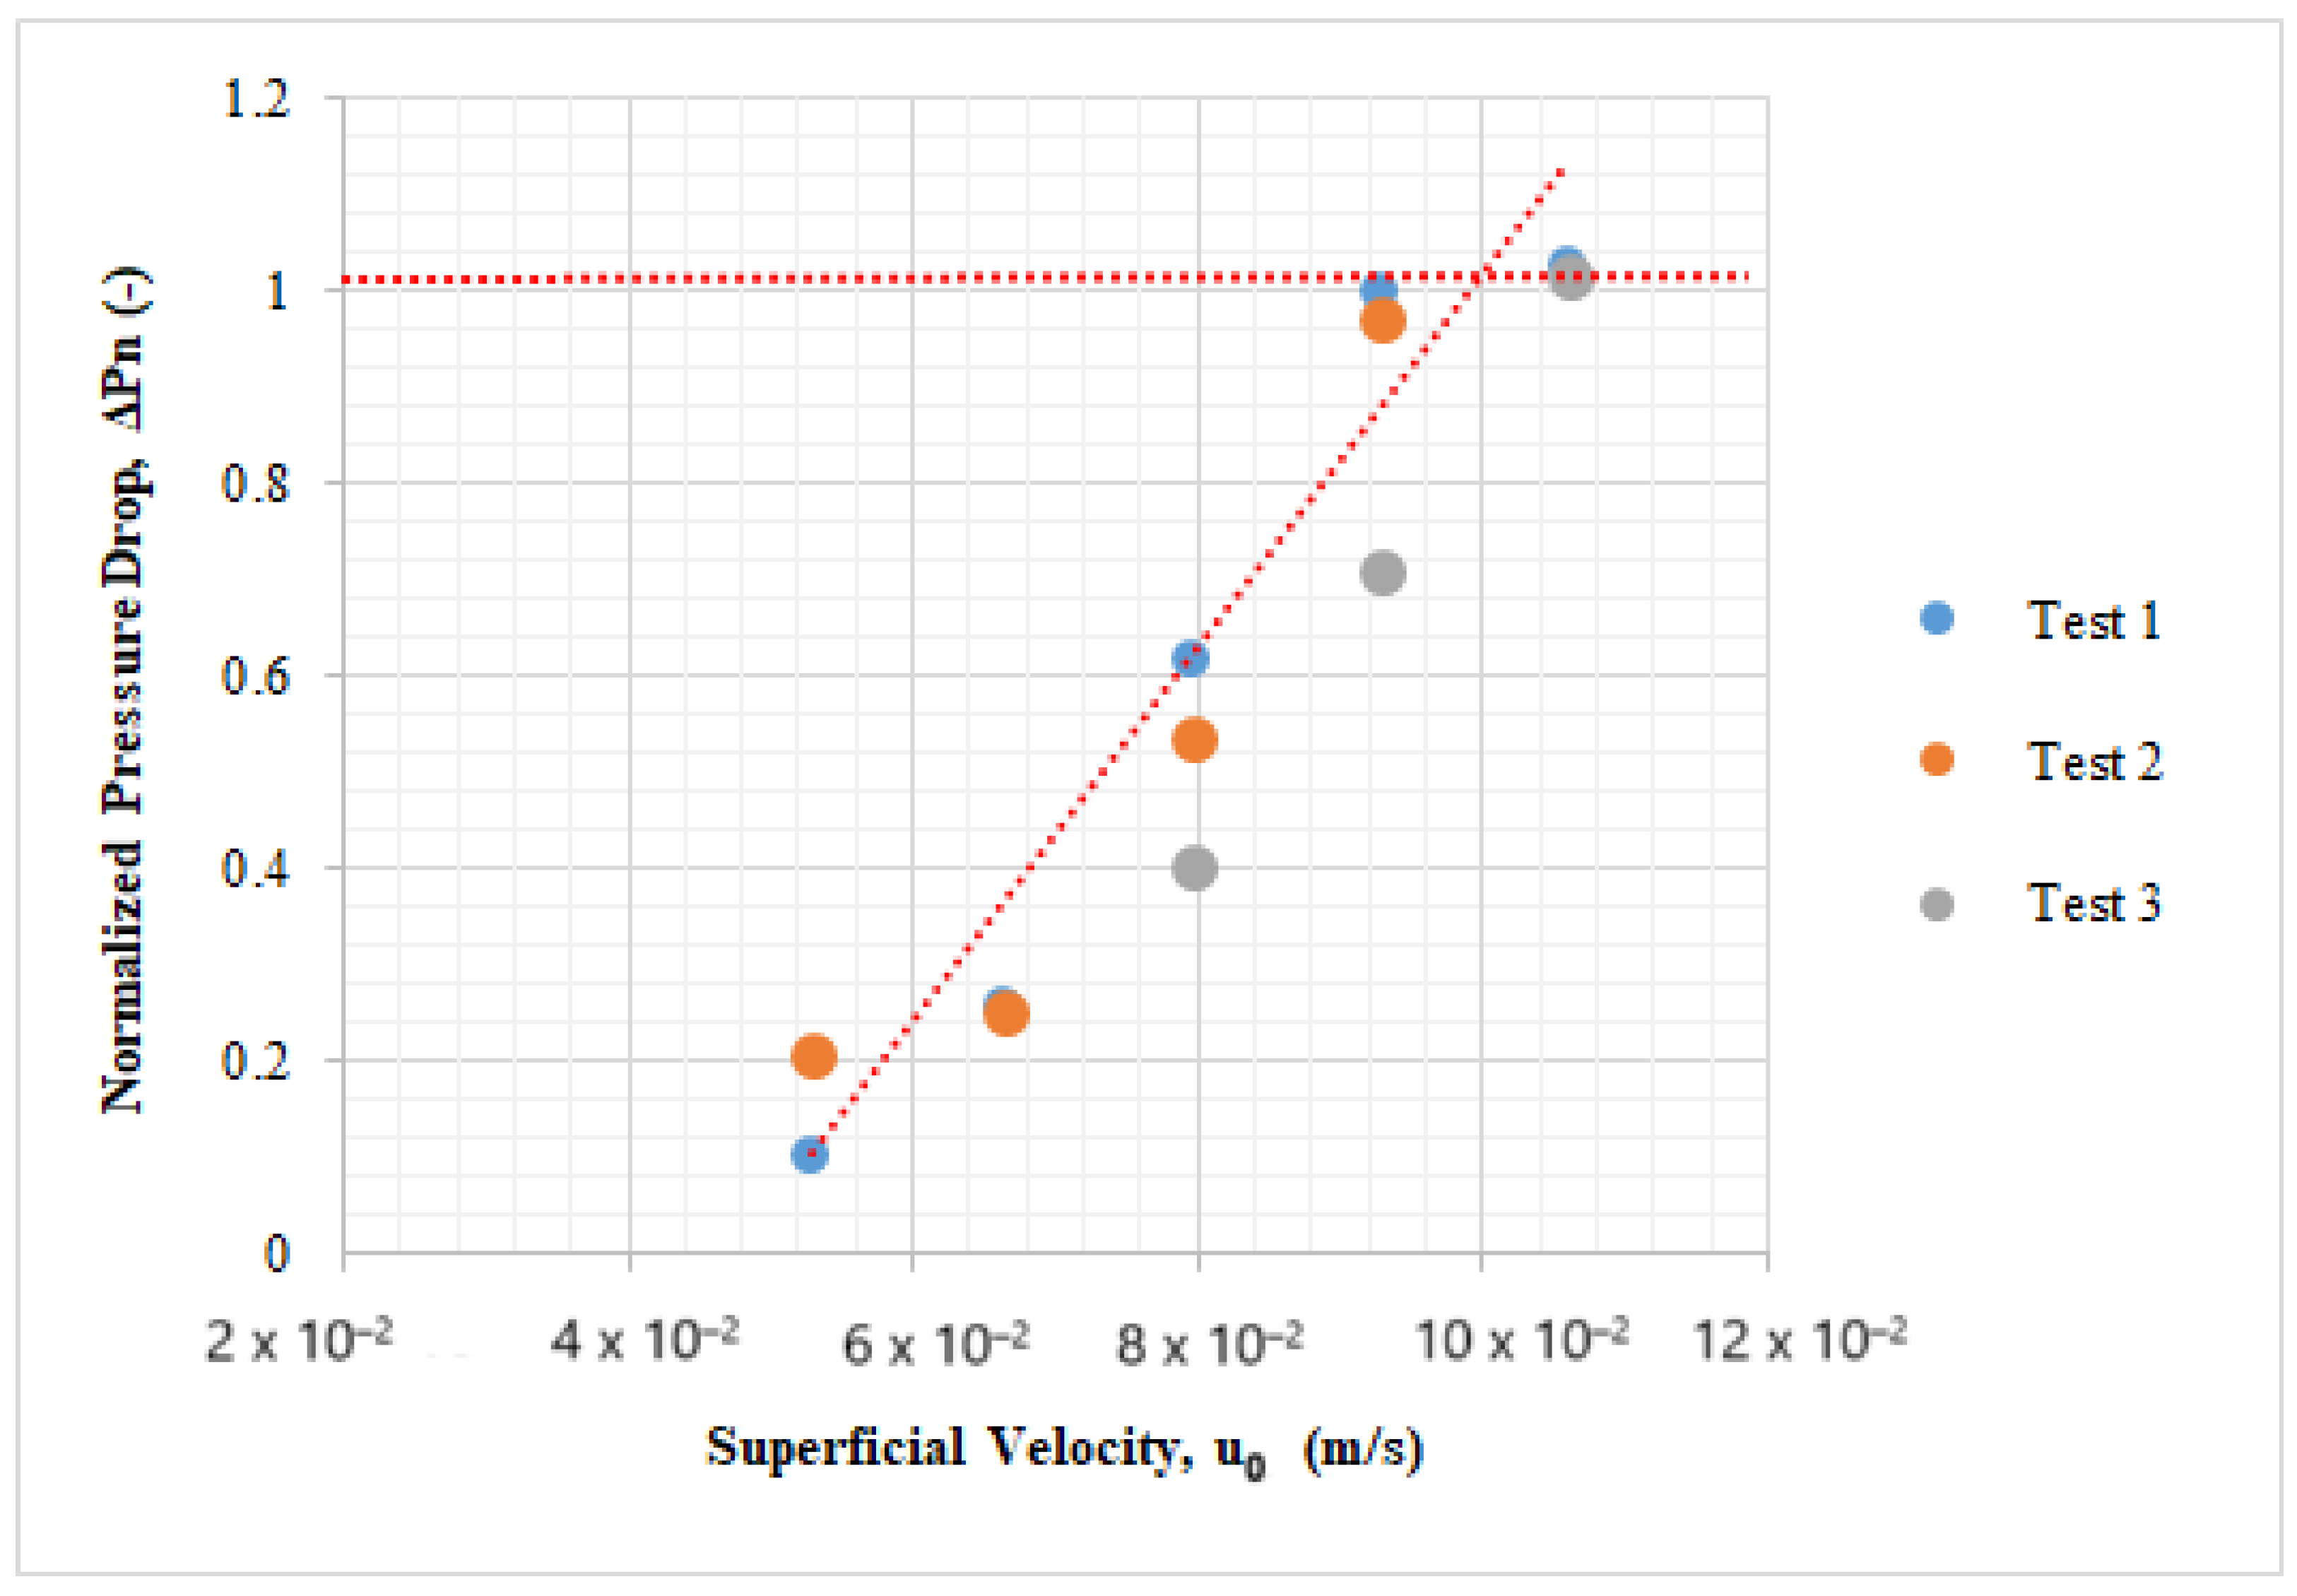
Figure 6.
A plot of normalized pressure drop versus superficial gas velocities.
Figure 6.
A plot of normalized pressure drop versus superficial gas velocities.
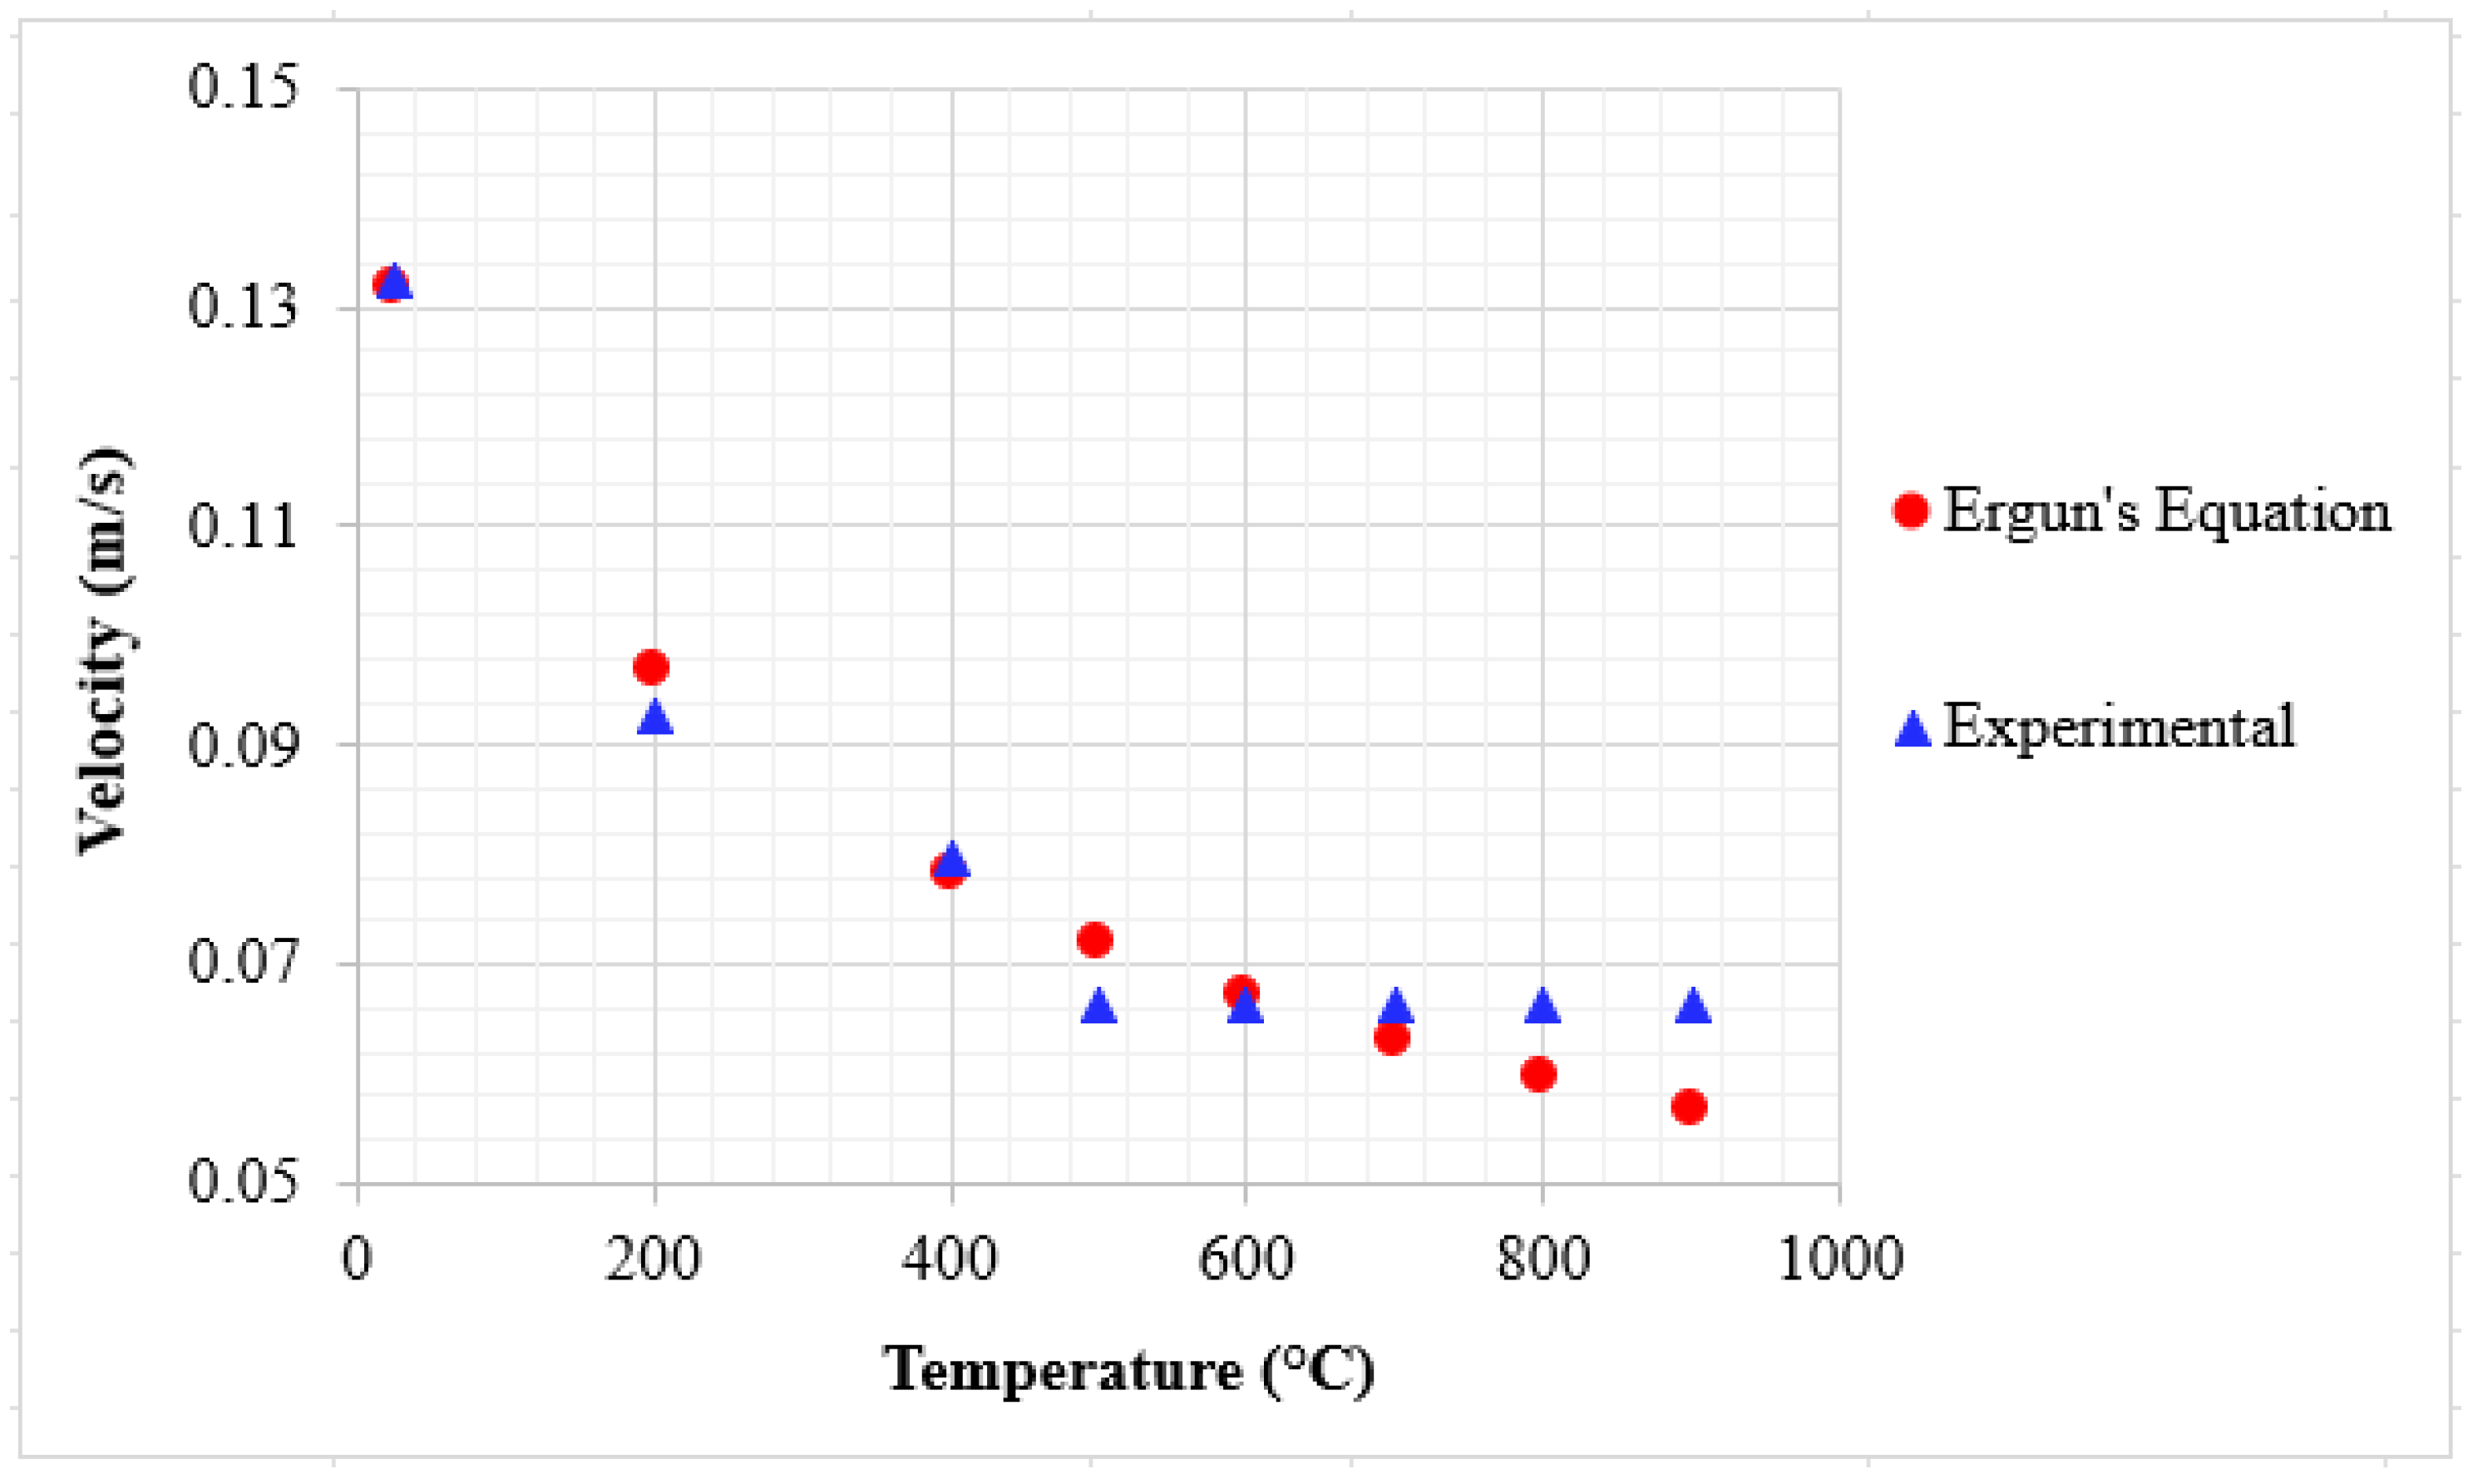
Figure 7.
Comparison of experimental and Ergun’s equation [
25] minimum fluidization velocity as a function of temperature.
Figure 7.
Comparison of experimental and Ergun’s equation [
25] minimum fluidization velocity as a function of temperature.
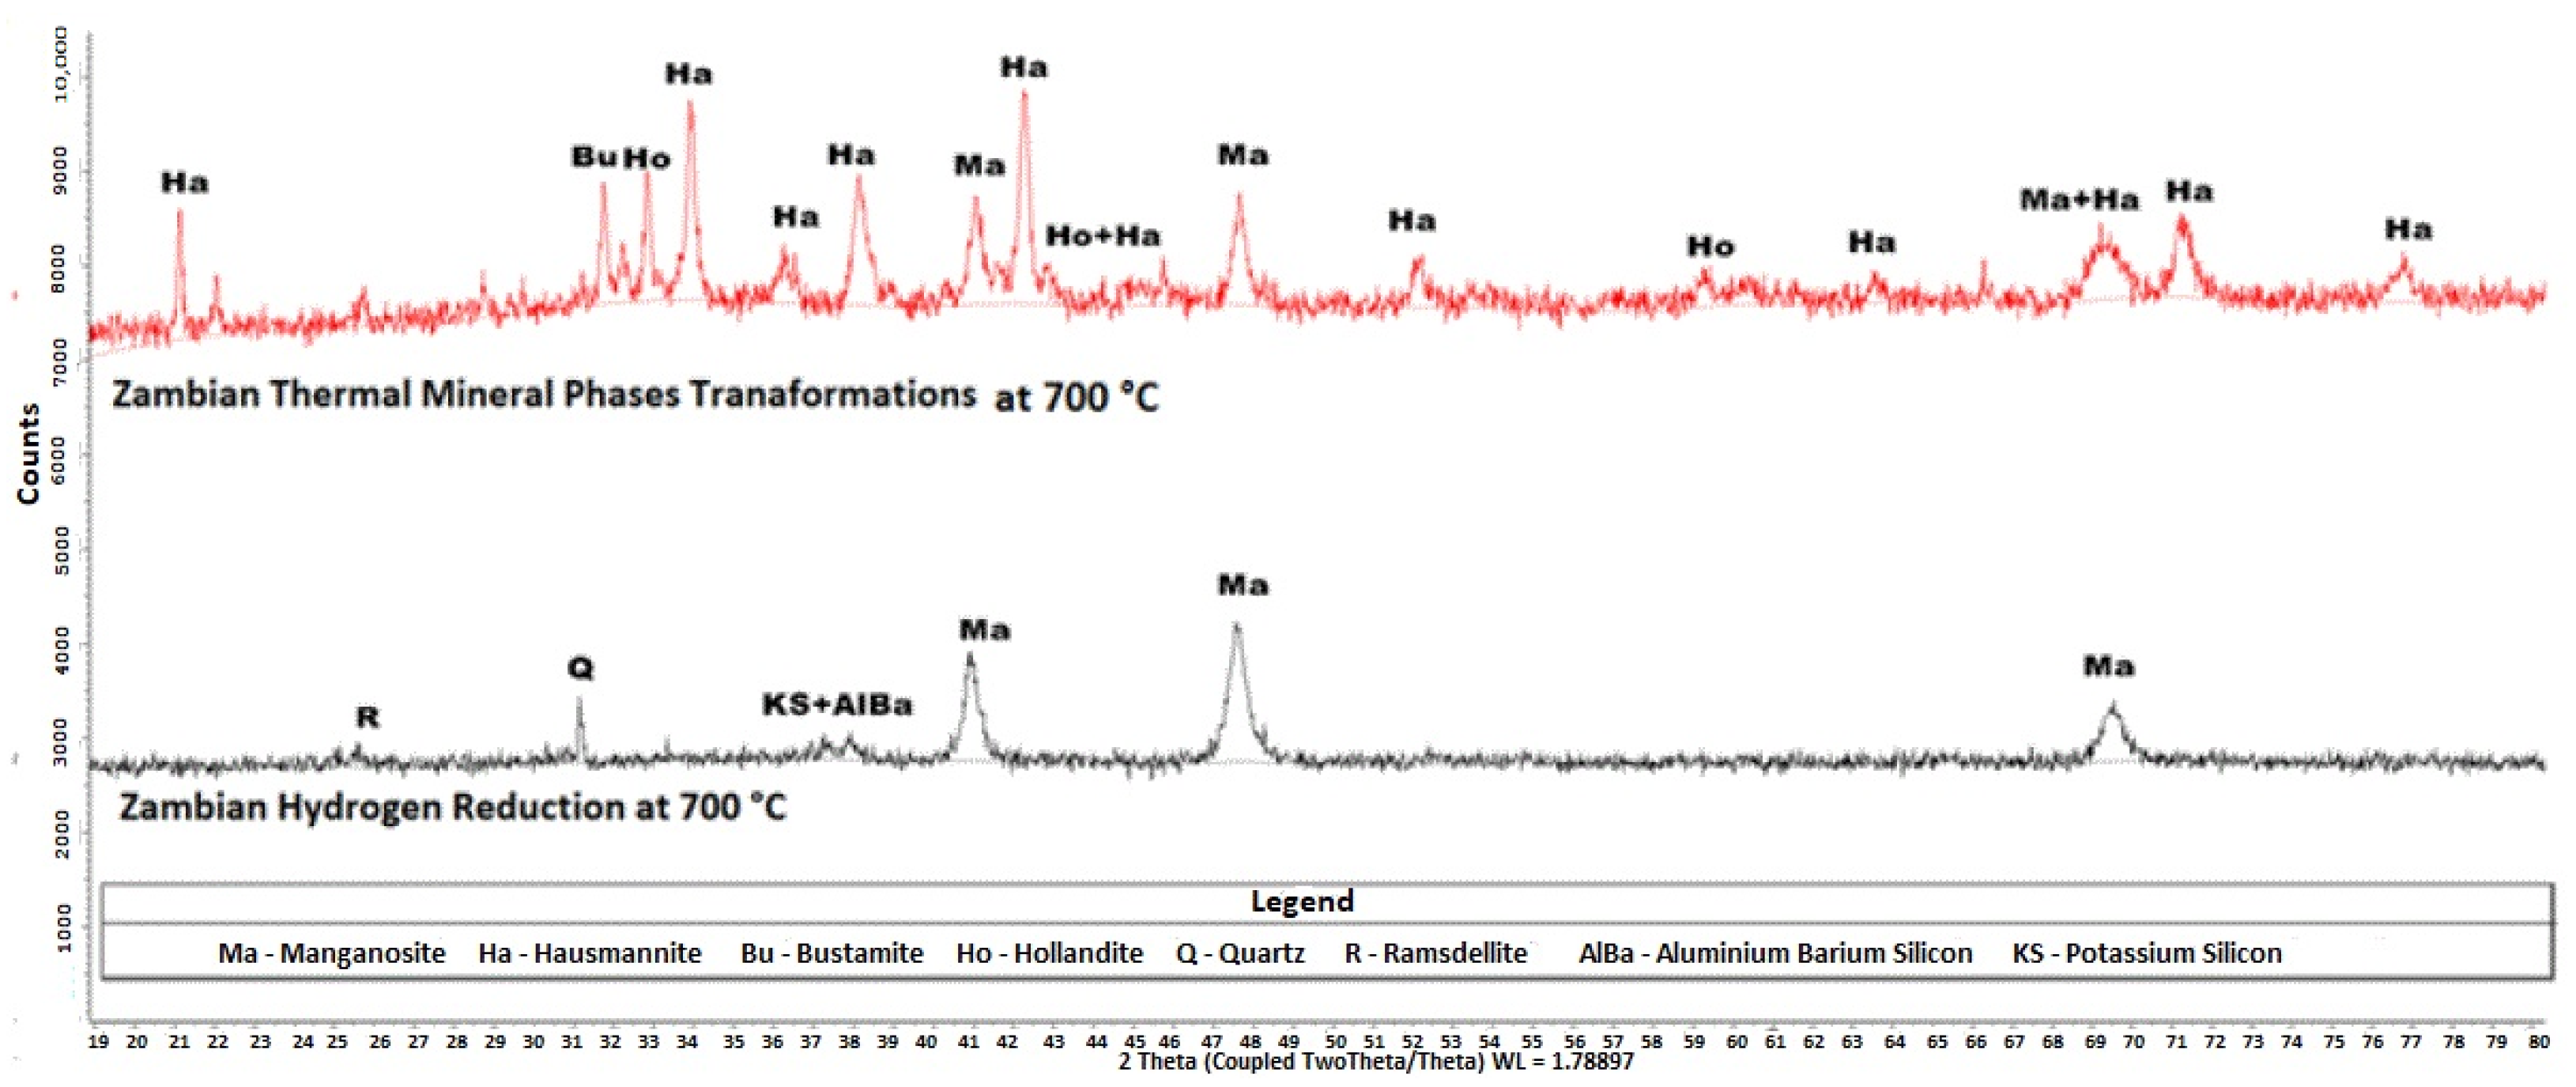
Figure 8.
XRD diffractograms of the products of Zambian ore heated under argon at C and the product of Zambian ore reduced by hydrogen gas at C. The analysis was conducted using a Bruker D8 diffractometer equipped with Fe-filtered Co K radiation. Data were collected over a 2 range of 5–80° with a step size of 0.02° 2. Phase identification was performed using Bruker EVA® software, while quantitative phase analysis was conducted using TOPAS® software.
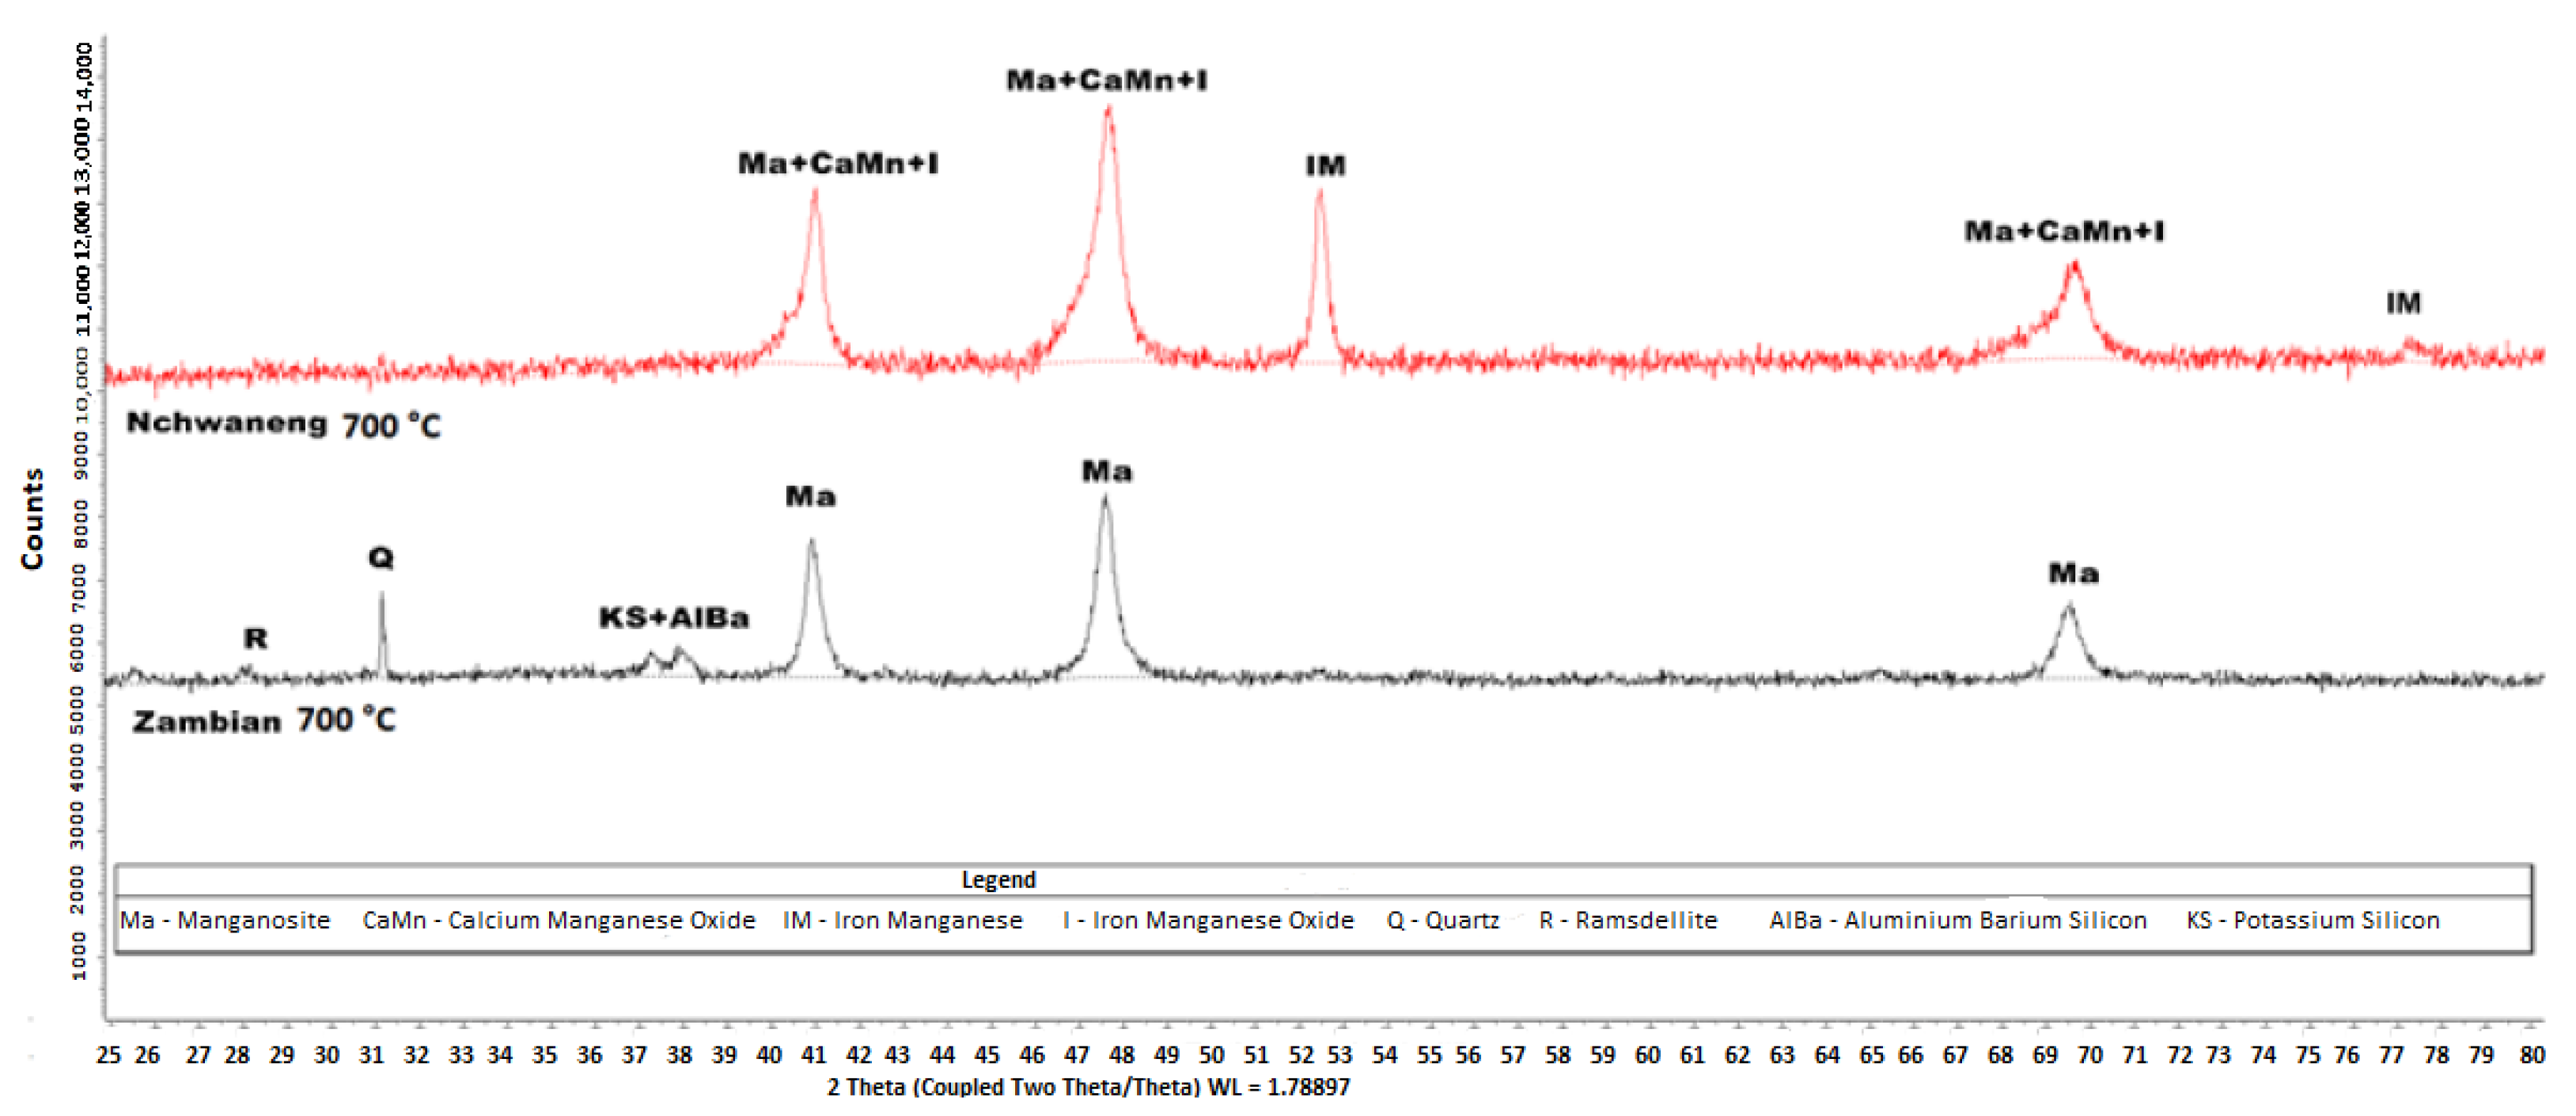
Figure 9.
XRD diffractograms of the products of Nchwaneng and Zambian manganese ores that were reduced, respectively, by hydrogen gas at C. The analysis was conducted using a Bruker D8 diffractometer equipped with Fe-filtered Co K radiation. Data were collected over a 2 range of 5–80° with a step size of 0.02° 2. Phase identification was performed using Bruker EVA® software, while quantitative phase analysis was conducted using TOPAS® software.
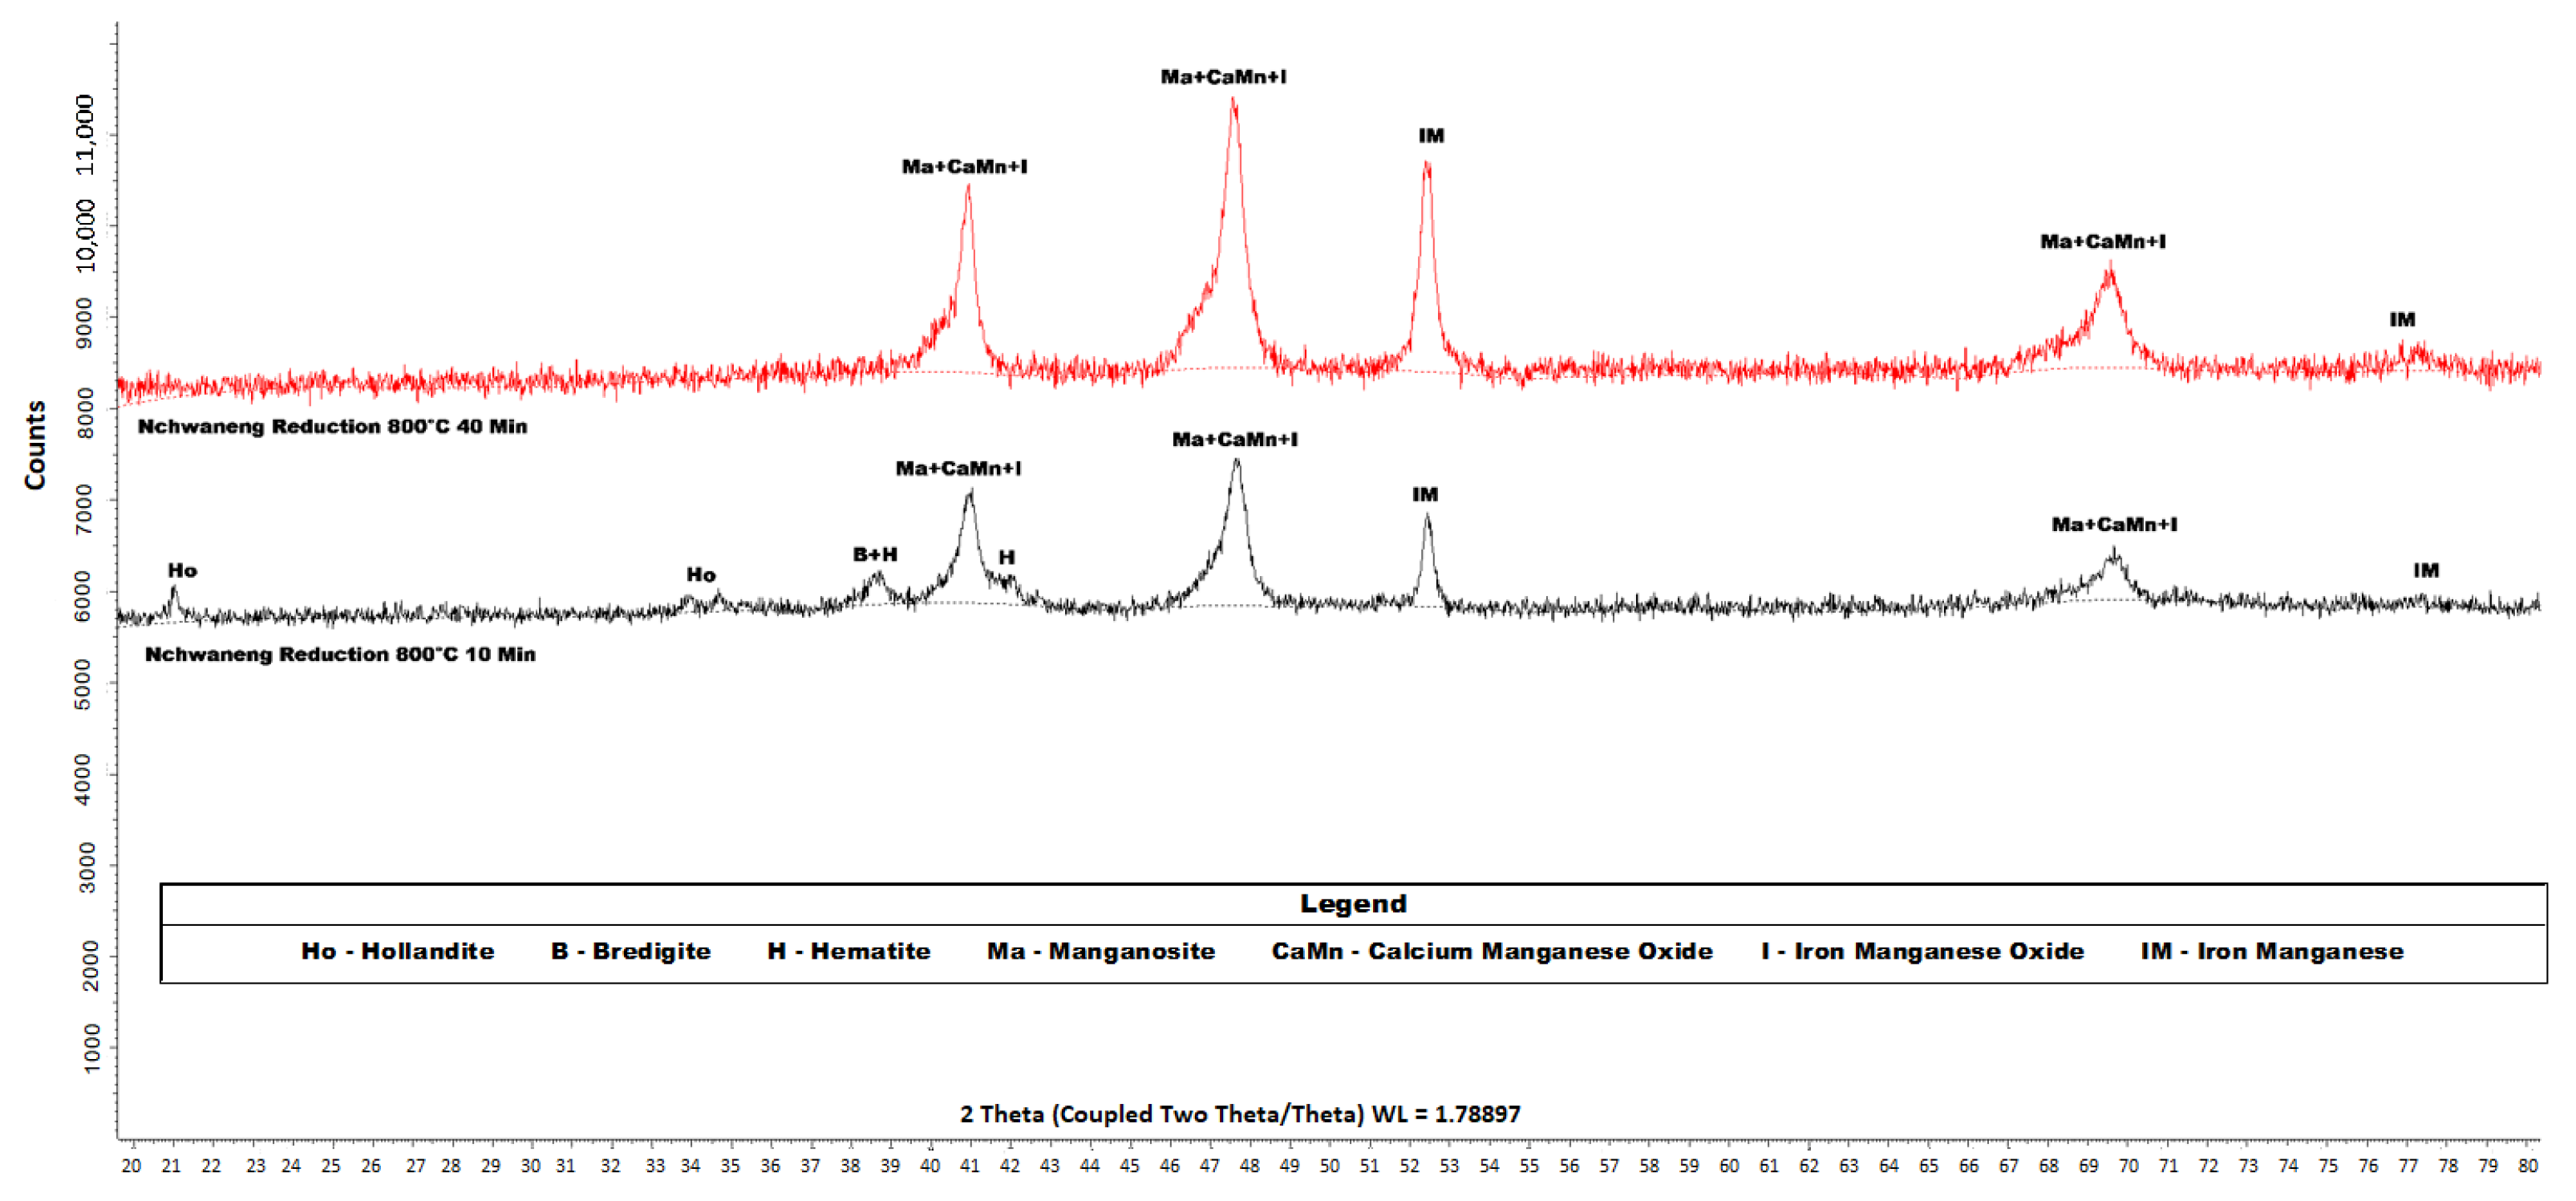
Figure 10.
XRD diffractograms of the products of Nchwaneng manganese ore that was reduced by hydrogen gas over two respective residence times (10 and 40 min) at C. The analysis was conducted using a Bruker D8 diffractometer equipped with Fe-filtered Co K radiation. Data were collected over a 2 range of 5–80° with a step size of 0.02° 2. Phase identification was performed using Bruker EVA® software, while quantitative phase analysis was conducted using TOPAS® software.
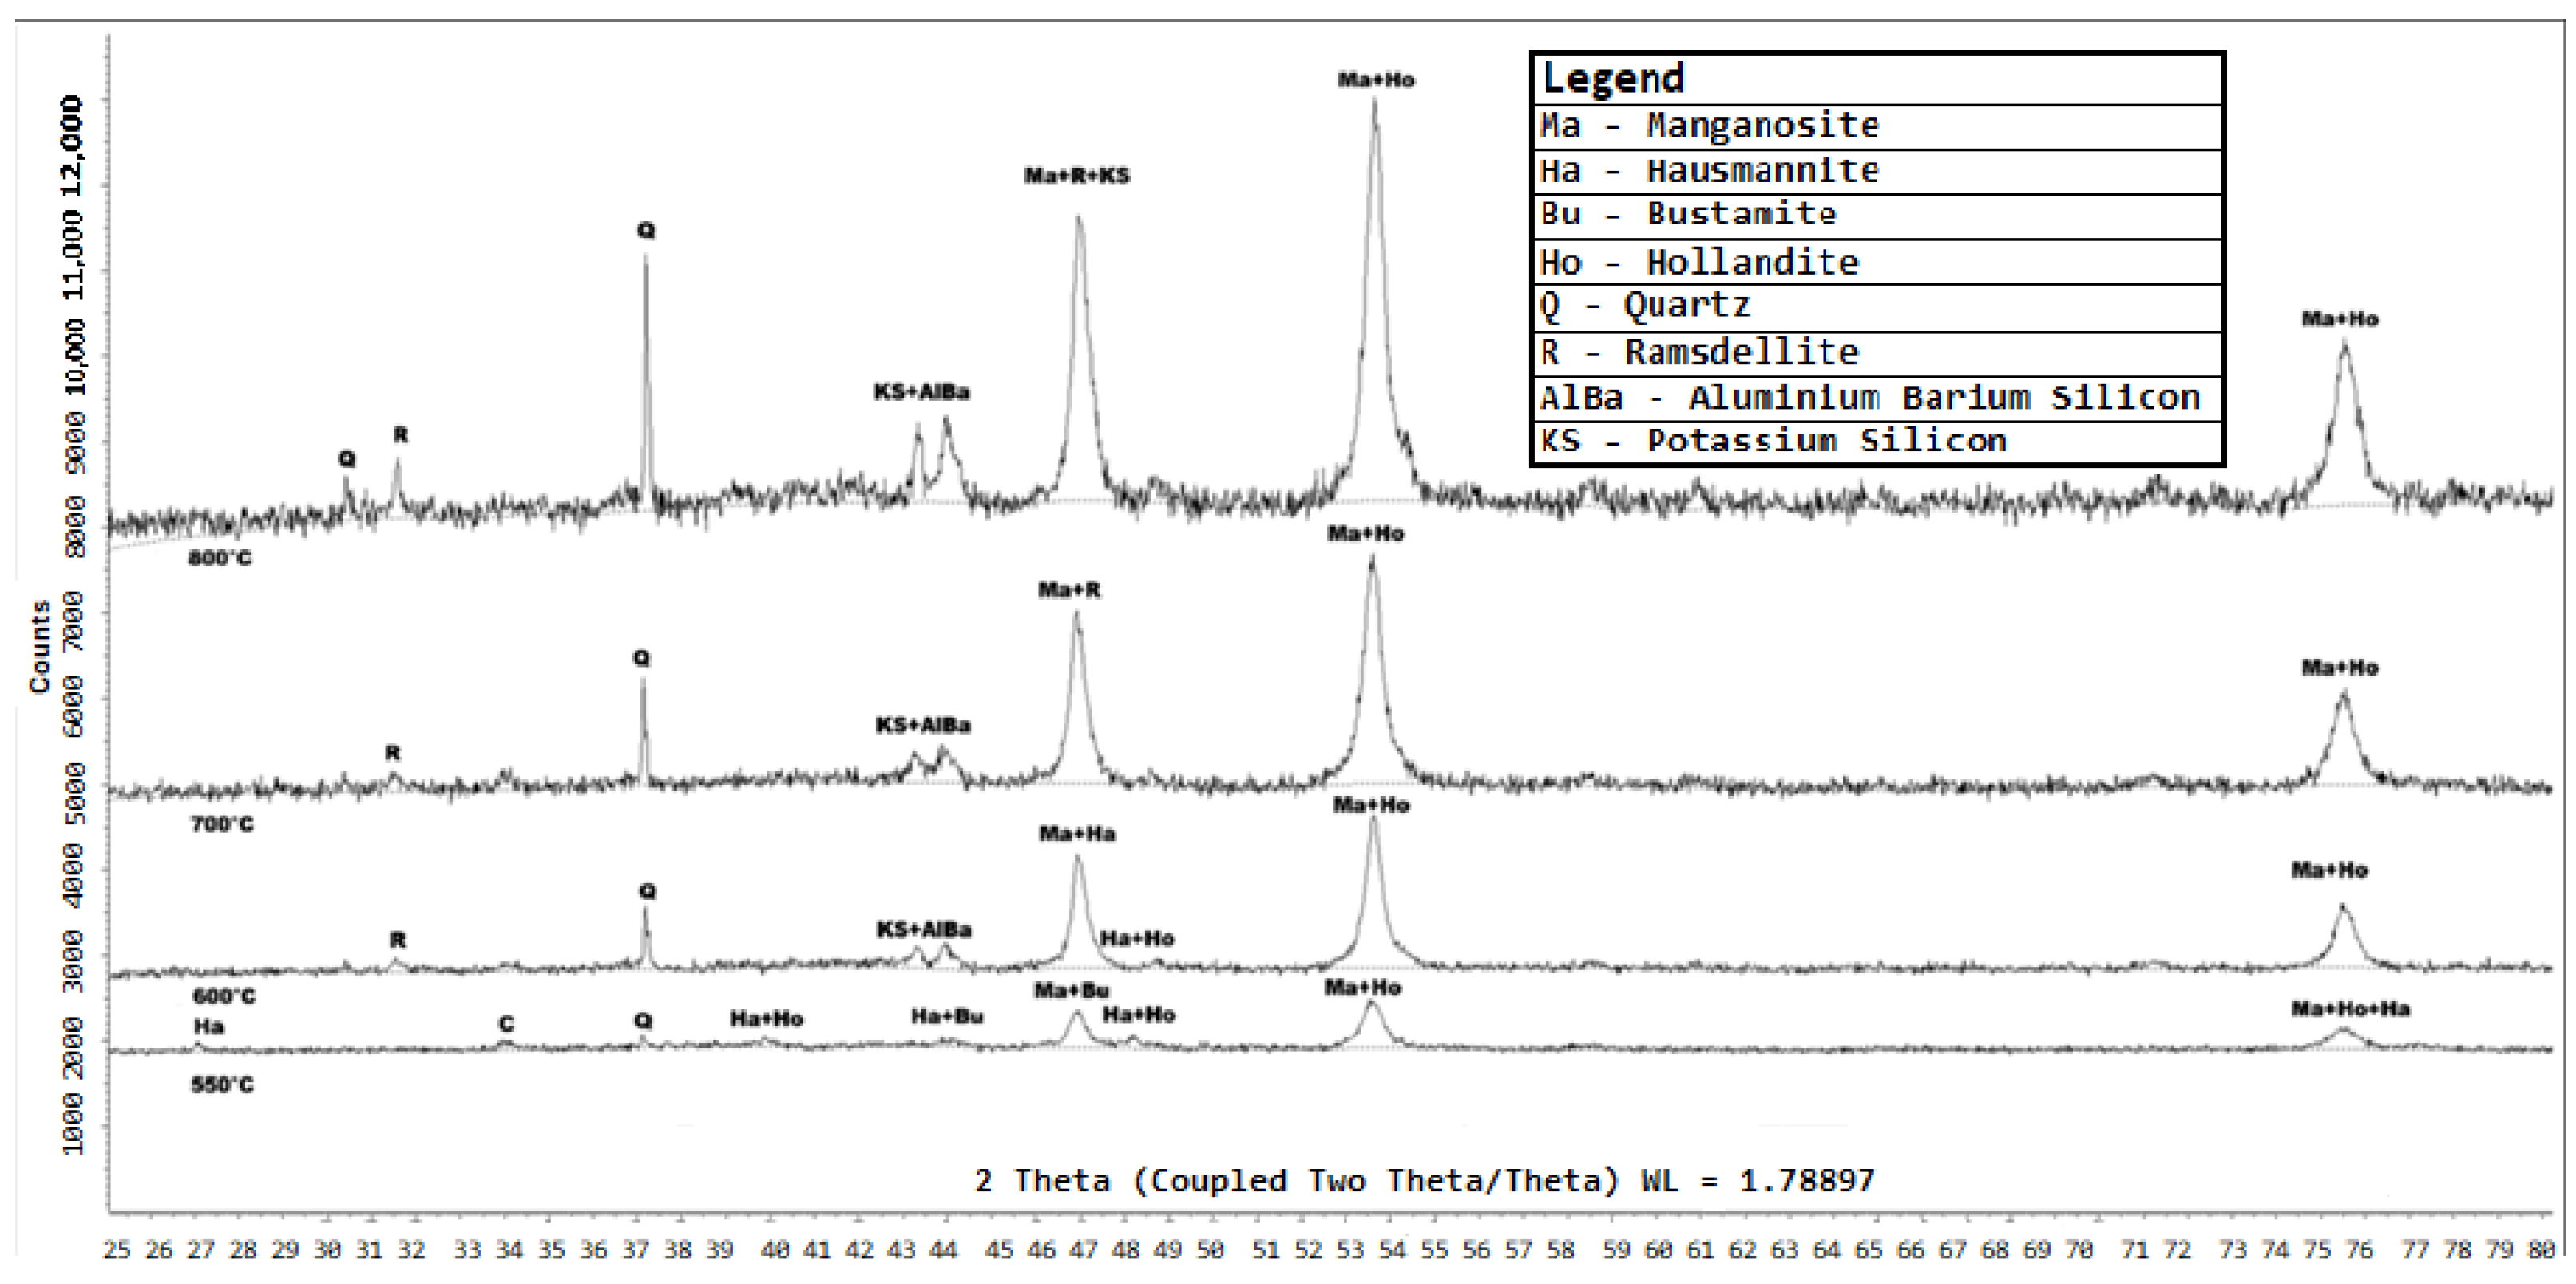
Figure 11.
XRD diffractograms of the products of Zambian manganese ore that was reduced by hydrogen gas at C, C, C and C, respectively. The analysis was conducted using a Bruker D8 diffractometer equipped with Fe-filtered Co K radiation. Data were collected over a 2 range of 5–80° with a step size of 0.02° 2. Phase identification was performed using Bruker EVA® software, while quantitative phase analysis was conducted using TOPAS® software.
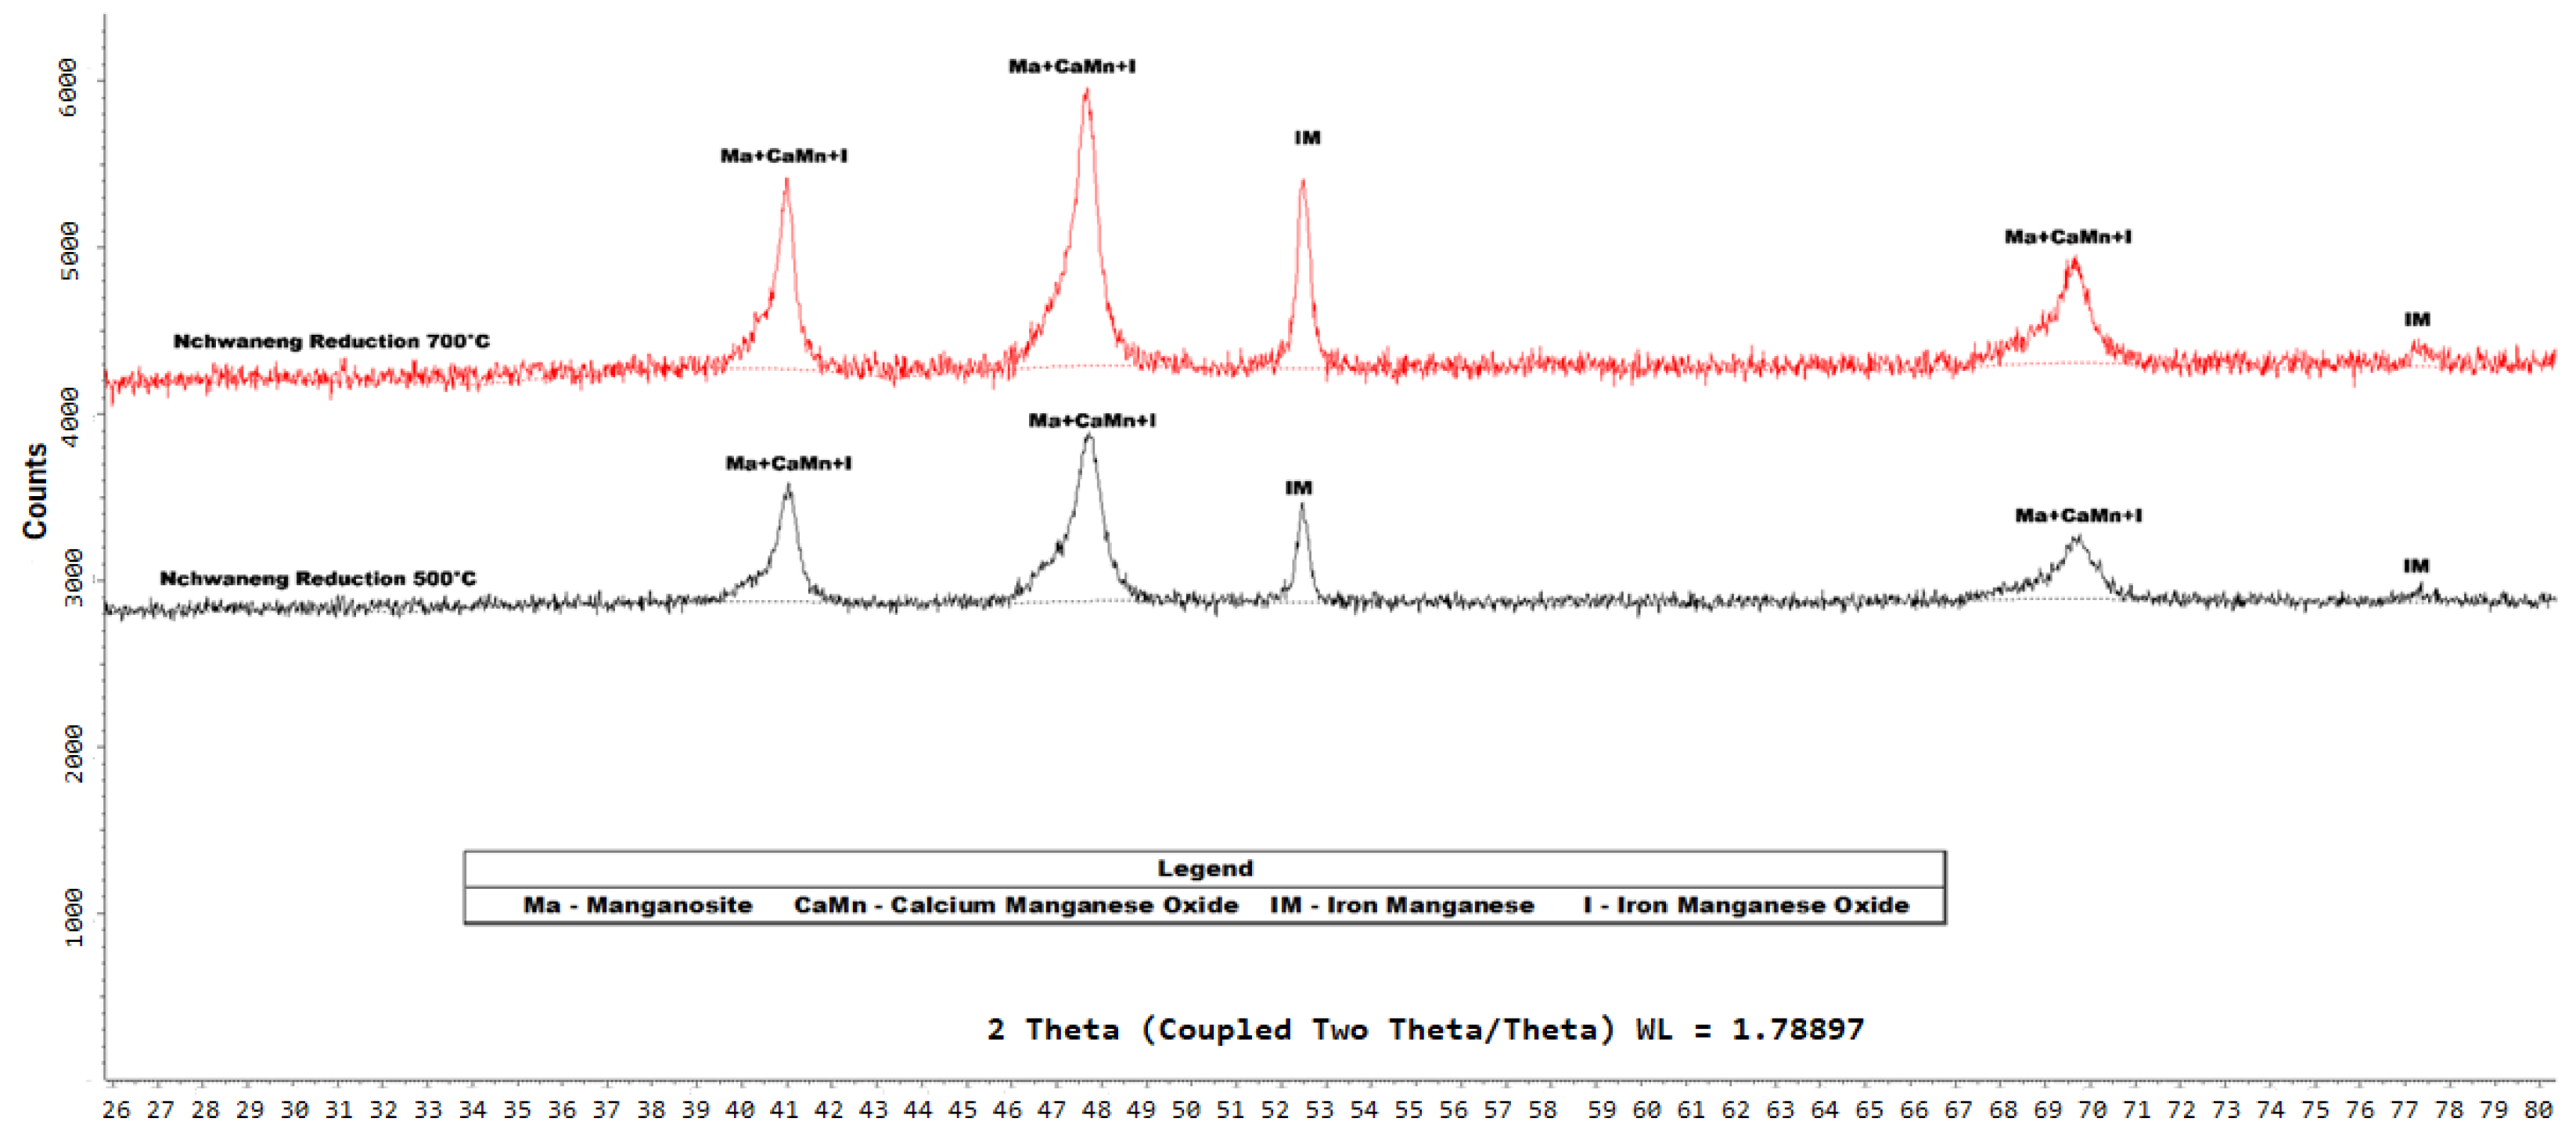
Figure 12.
XRD diffractograms of the products of Nchwaneng manganese ore that was reduced by hydrogen gas at C and C, respectively. The analysis was conducted using a Bruker D8 diffractometer equipped with Fe-filtered Co K radiation. Data were collected over a 2 range of 5–80° with a step size of 0.02° 2. Phase identification was performed using Bruker EVA® software, while quantitative phase analysis was conducted using TOPAS® software.
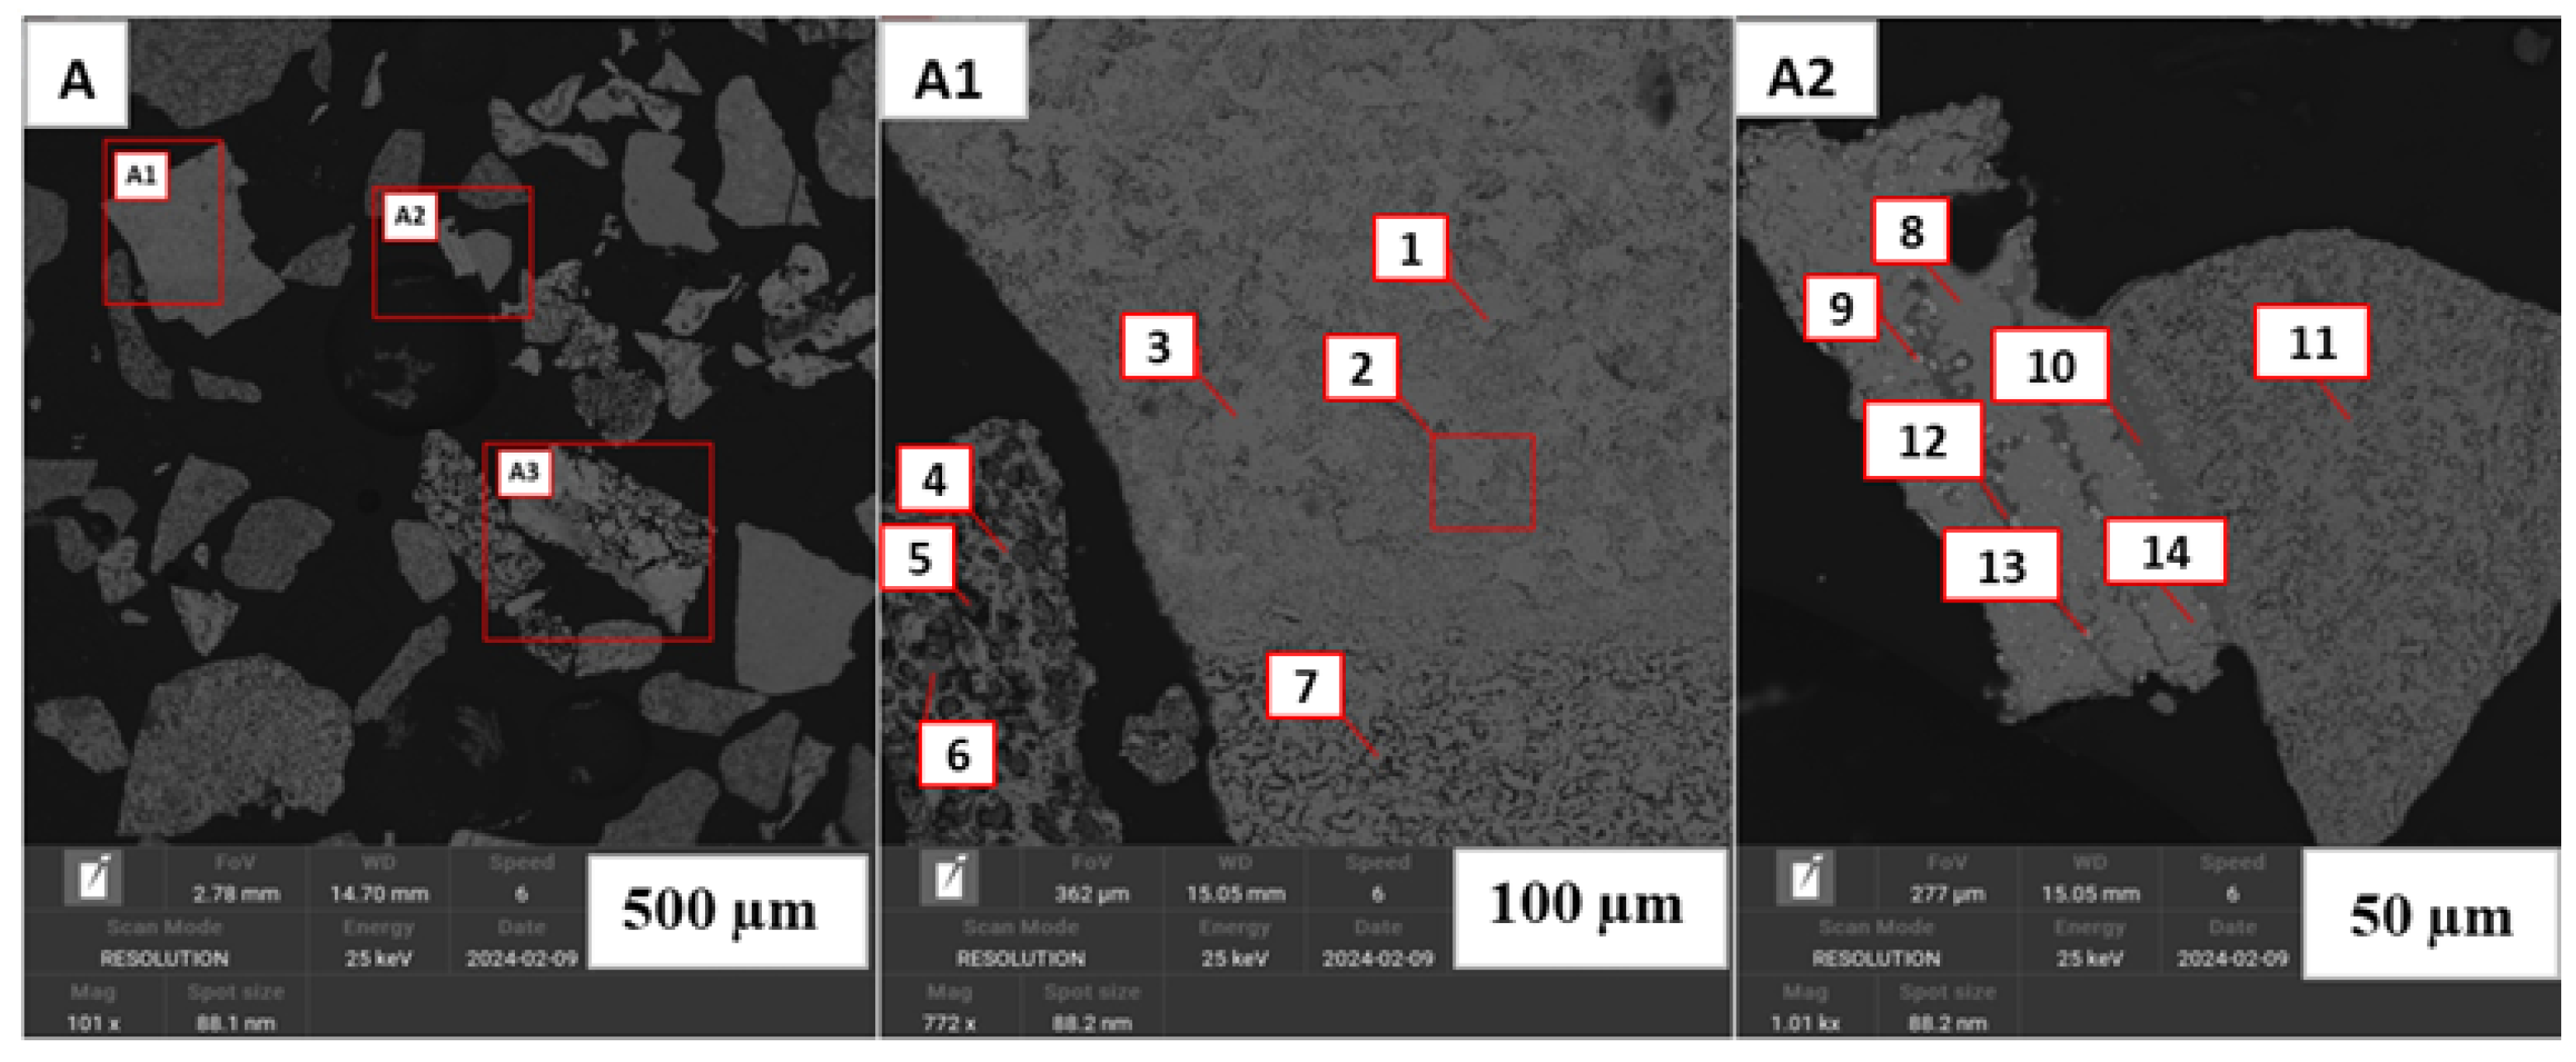
Figure 13.
Back-scattered electron images of the product of Nchwaneng ore that was reduced by hydrogen gas at C (A–A2). (A1,A2) are the magnifications of their corresponding red boxes in (A) at m and m, respectively. (A1) shows the prevalence of impure manganosite (Spots 1, 2 and 3). Porous textures are also shown in (A1) and can be associated with calcination and reduction towards formation of manganese oxides (Spots 4, 5, and 7). The rare occurrence of calcium phosphorus is also displayed in Spot 6. (A2) shows the prevalence of iron manganese oxide (Spots 9 and 13) and Mn silicate mix (Spots 10 and 12). Similar to (A1), manganosite, calcium manganese oxide and iron manganese oxide are also shown in Spots 8, 11 and 14, respectively.
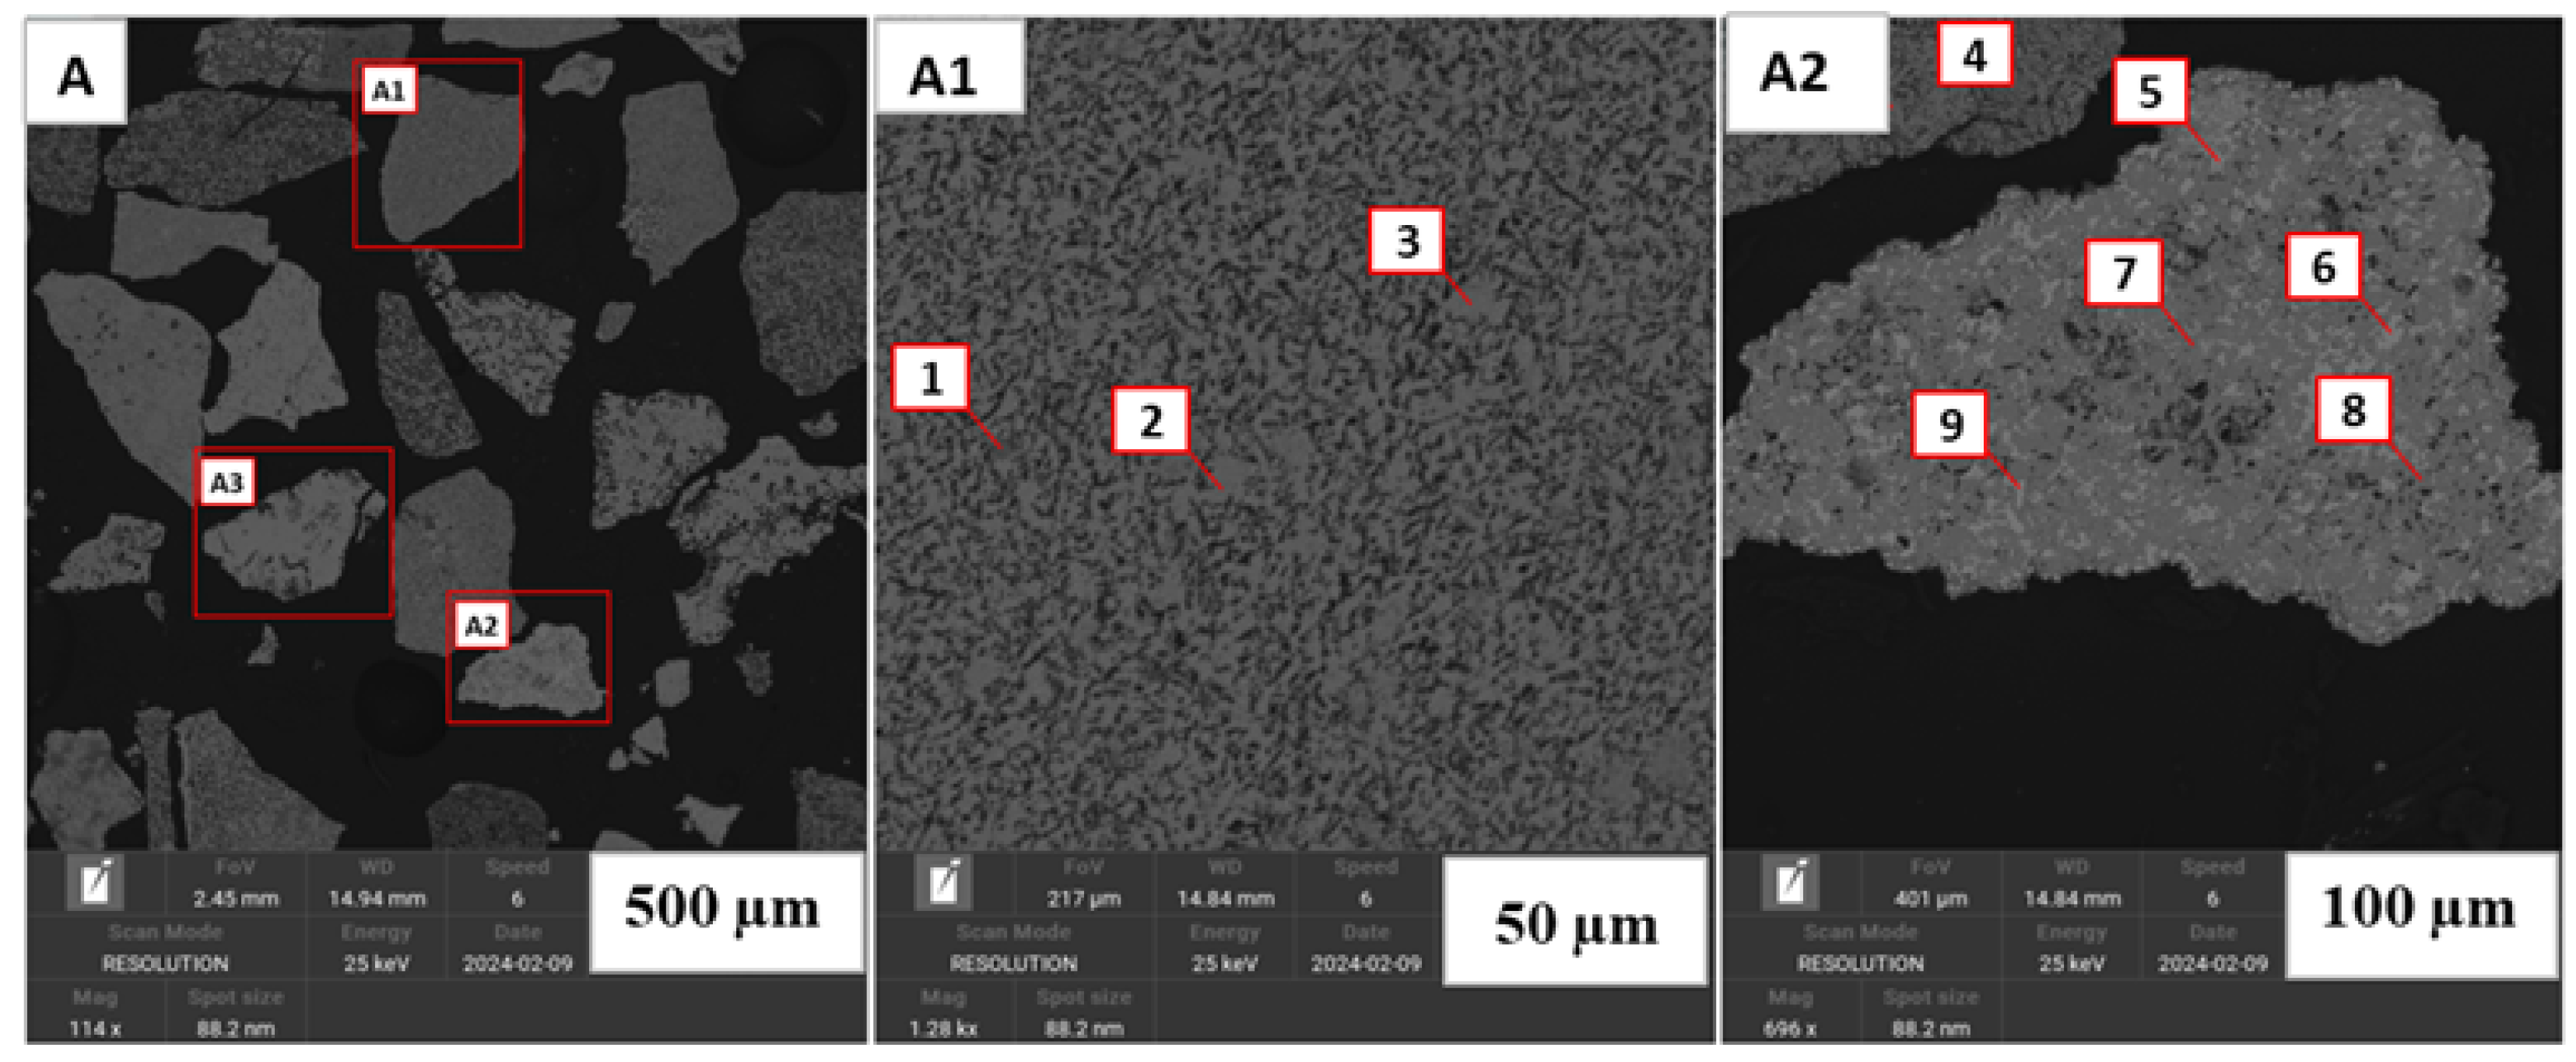
Figure 14.
Back-scattered electron images of the product of Nchwaneng ore that was reduced by hydrogen gas at C (A–A2). (A1,A2) are the magnifications of their corresponding red boxes in (A) at m and m, respectively. Porous texture is displayed to be more prevalent at C. (A1,A2) show the prevalence of calcium manganese oxide (Spots 2, 4, 7 and 8) and iron manganese (Spots 5, 6 and 9). Silicate mix and and impure manganosite are also displayed in Spots 1 and 3, respectively.
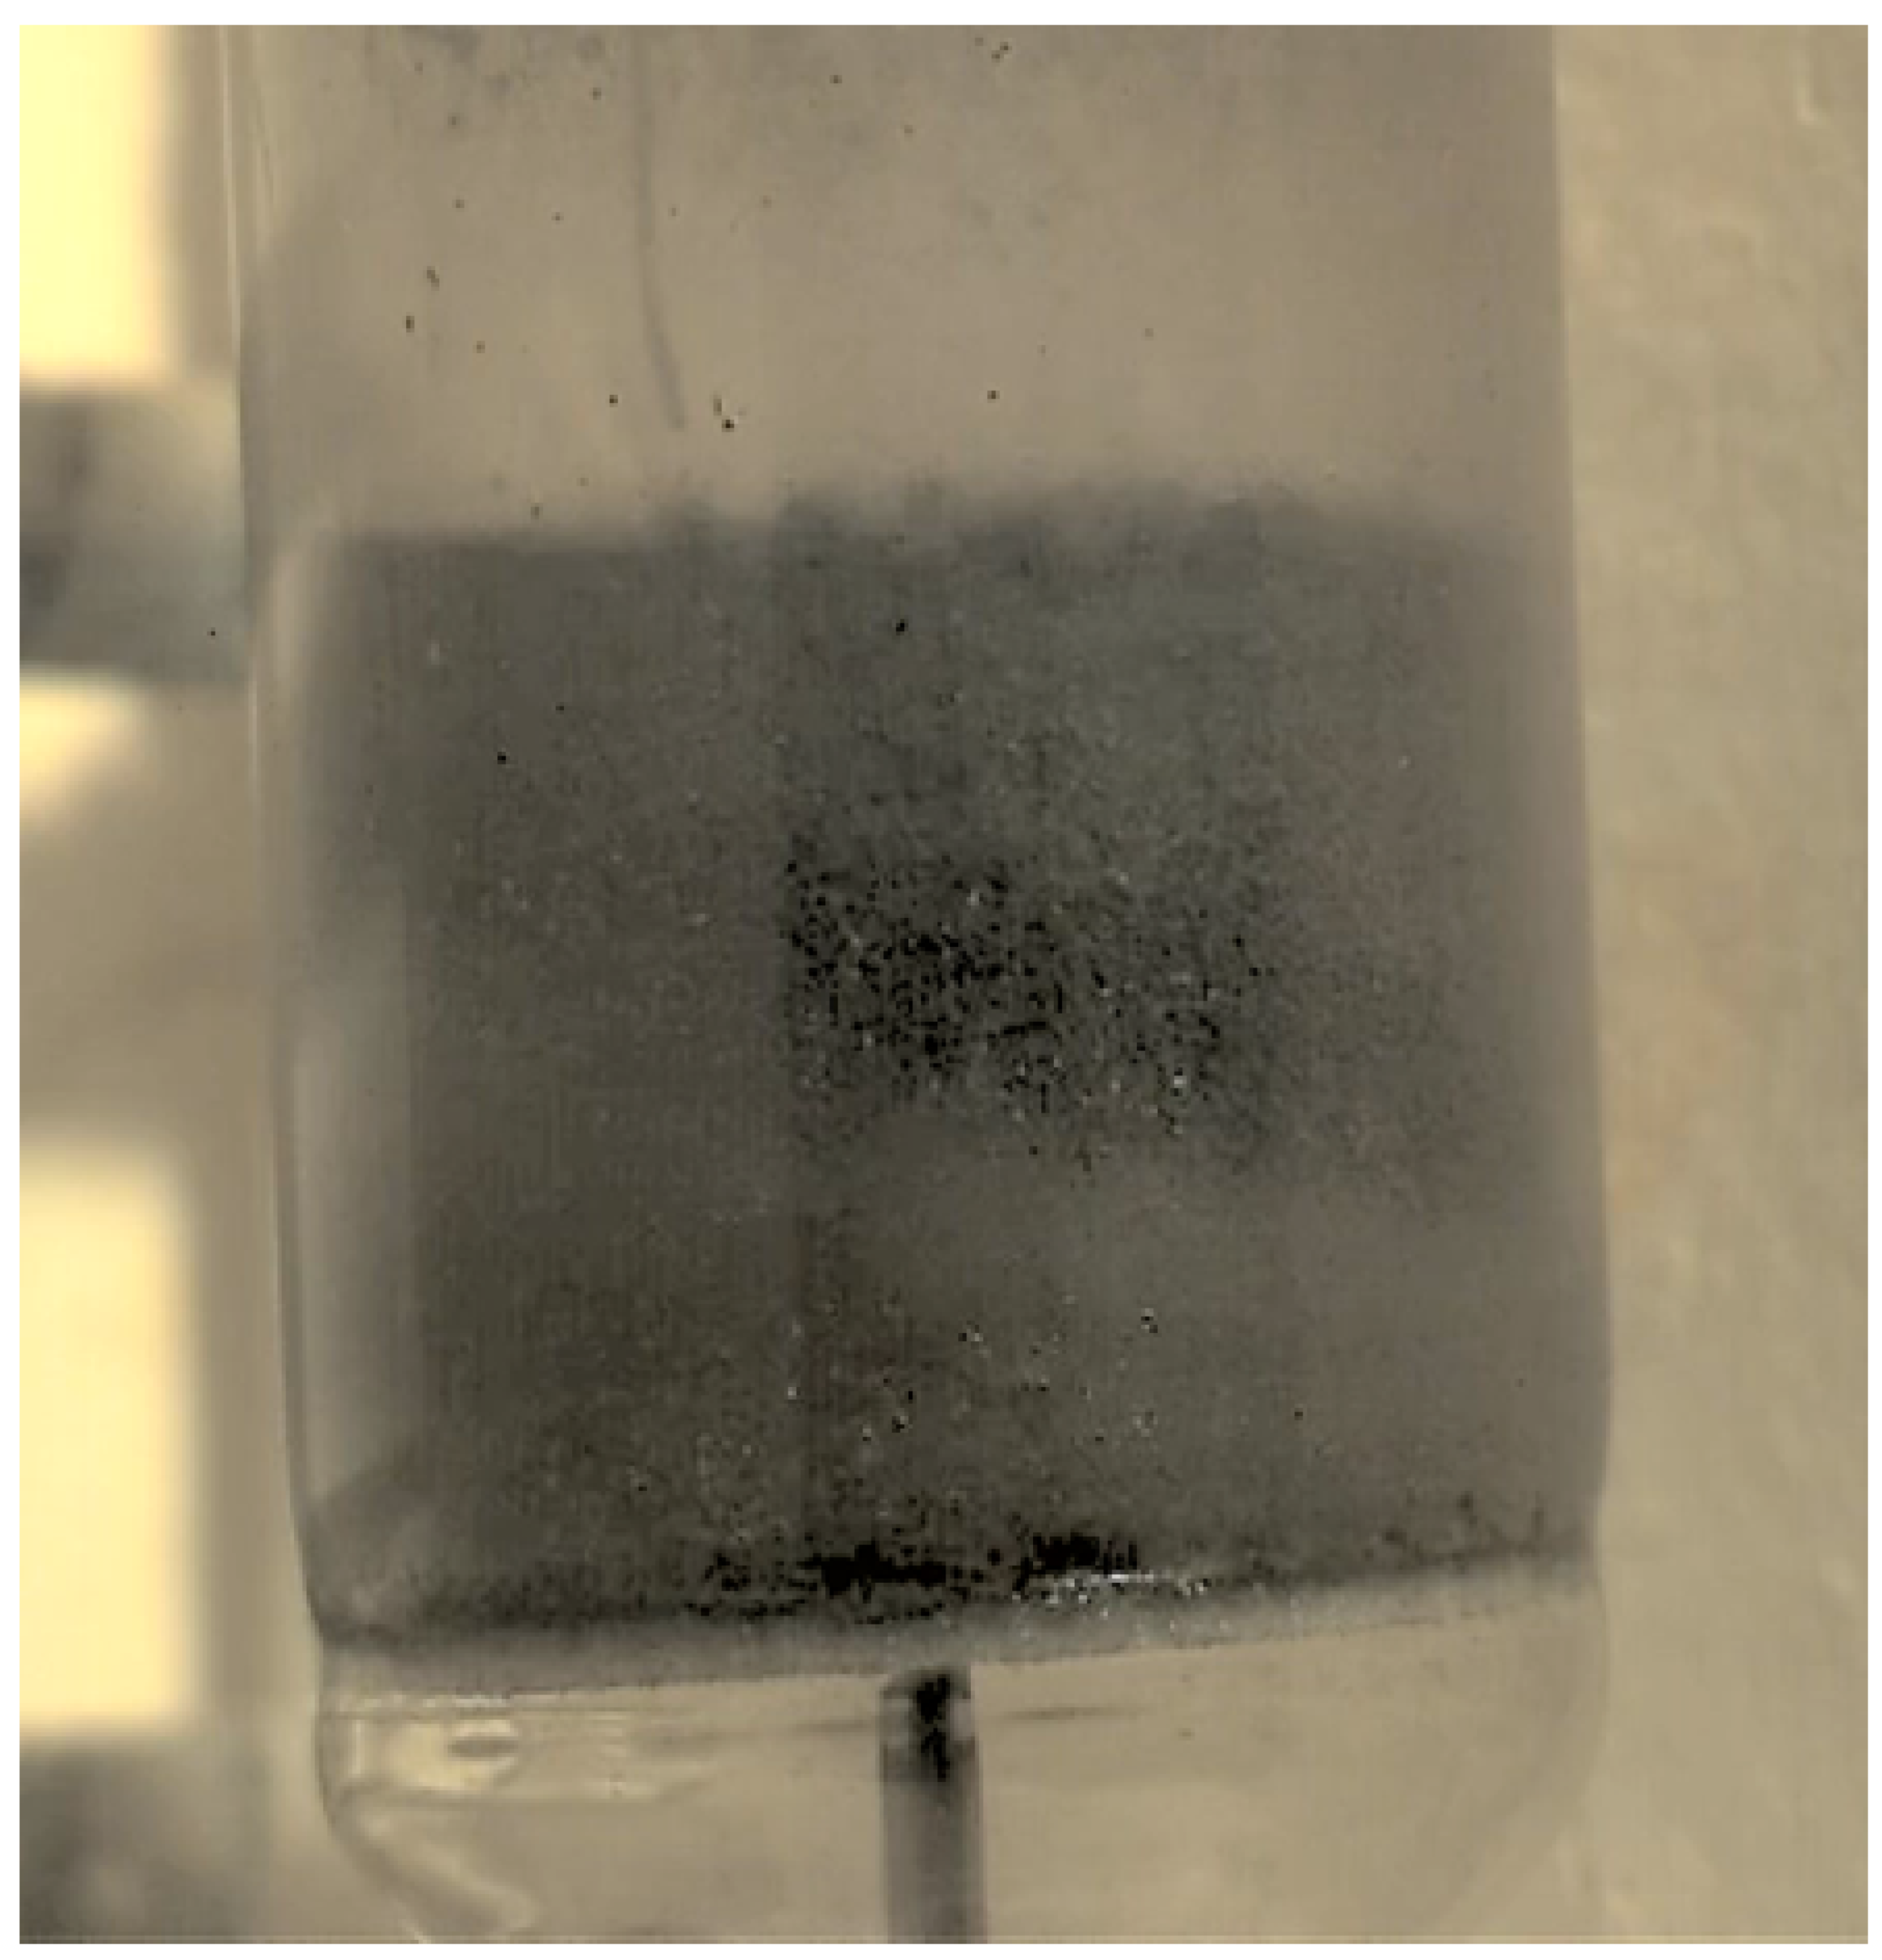
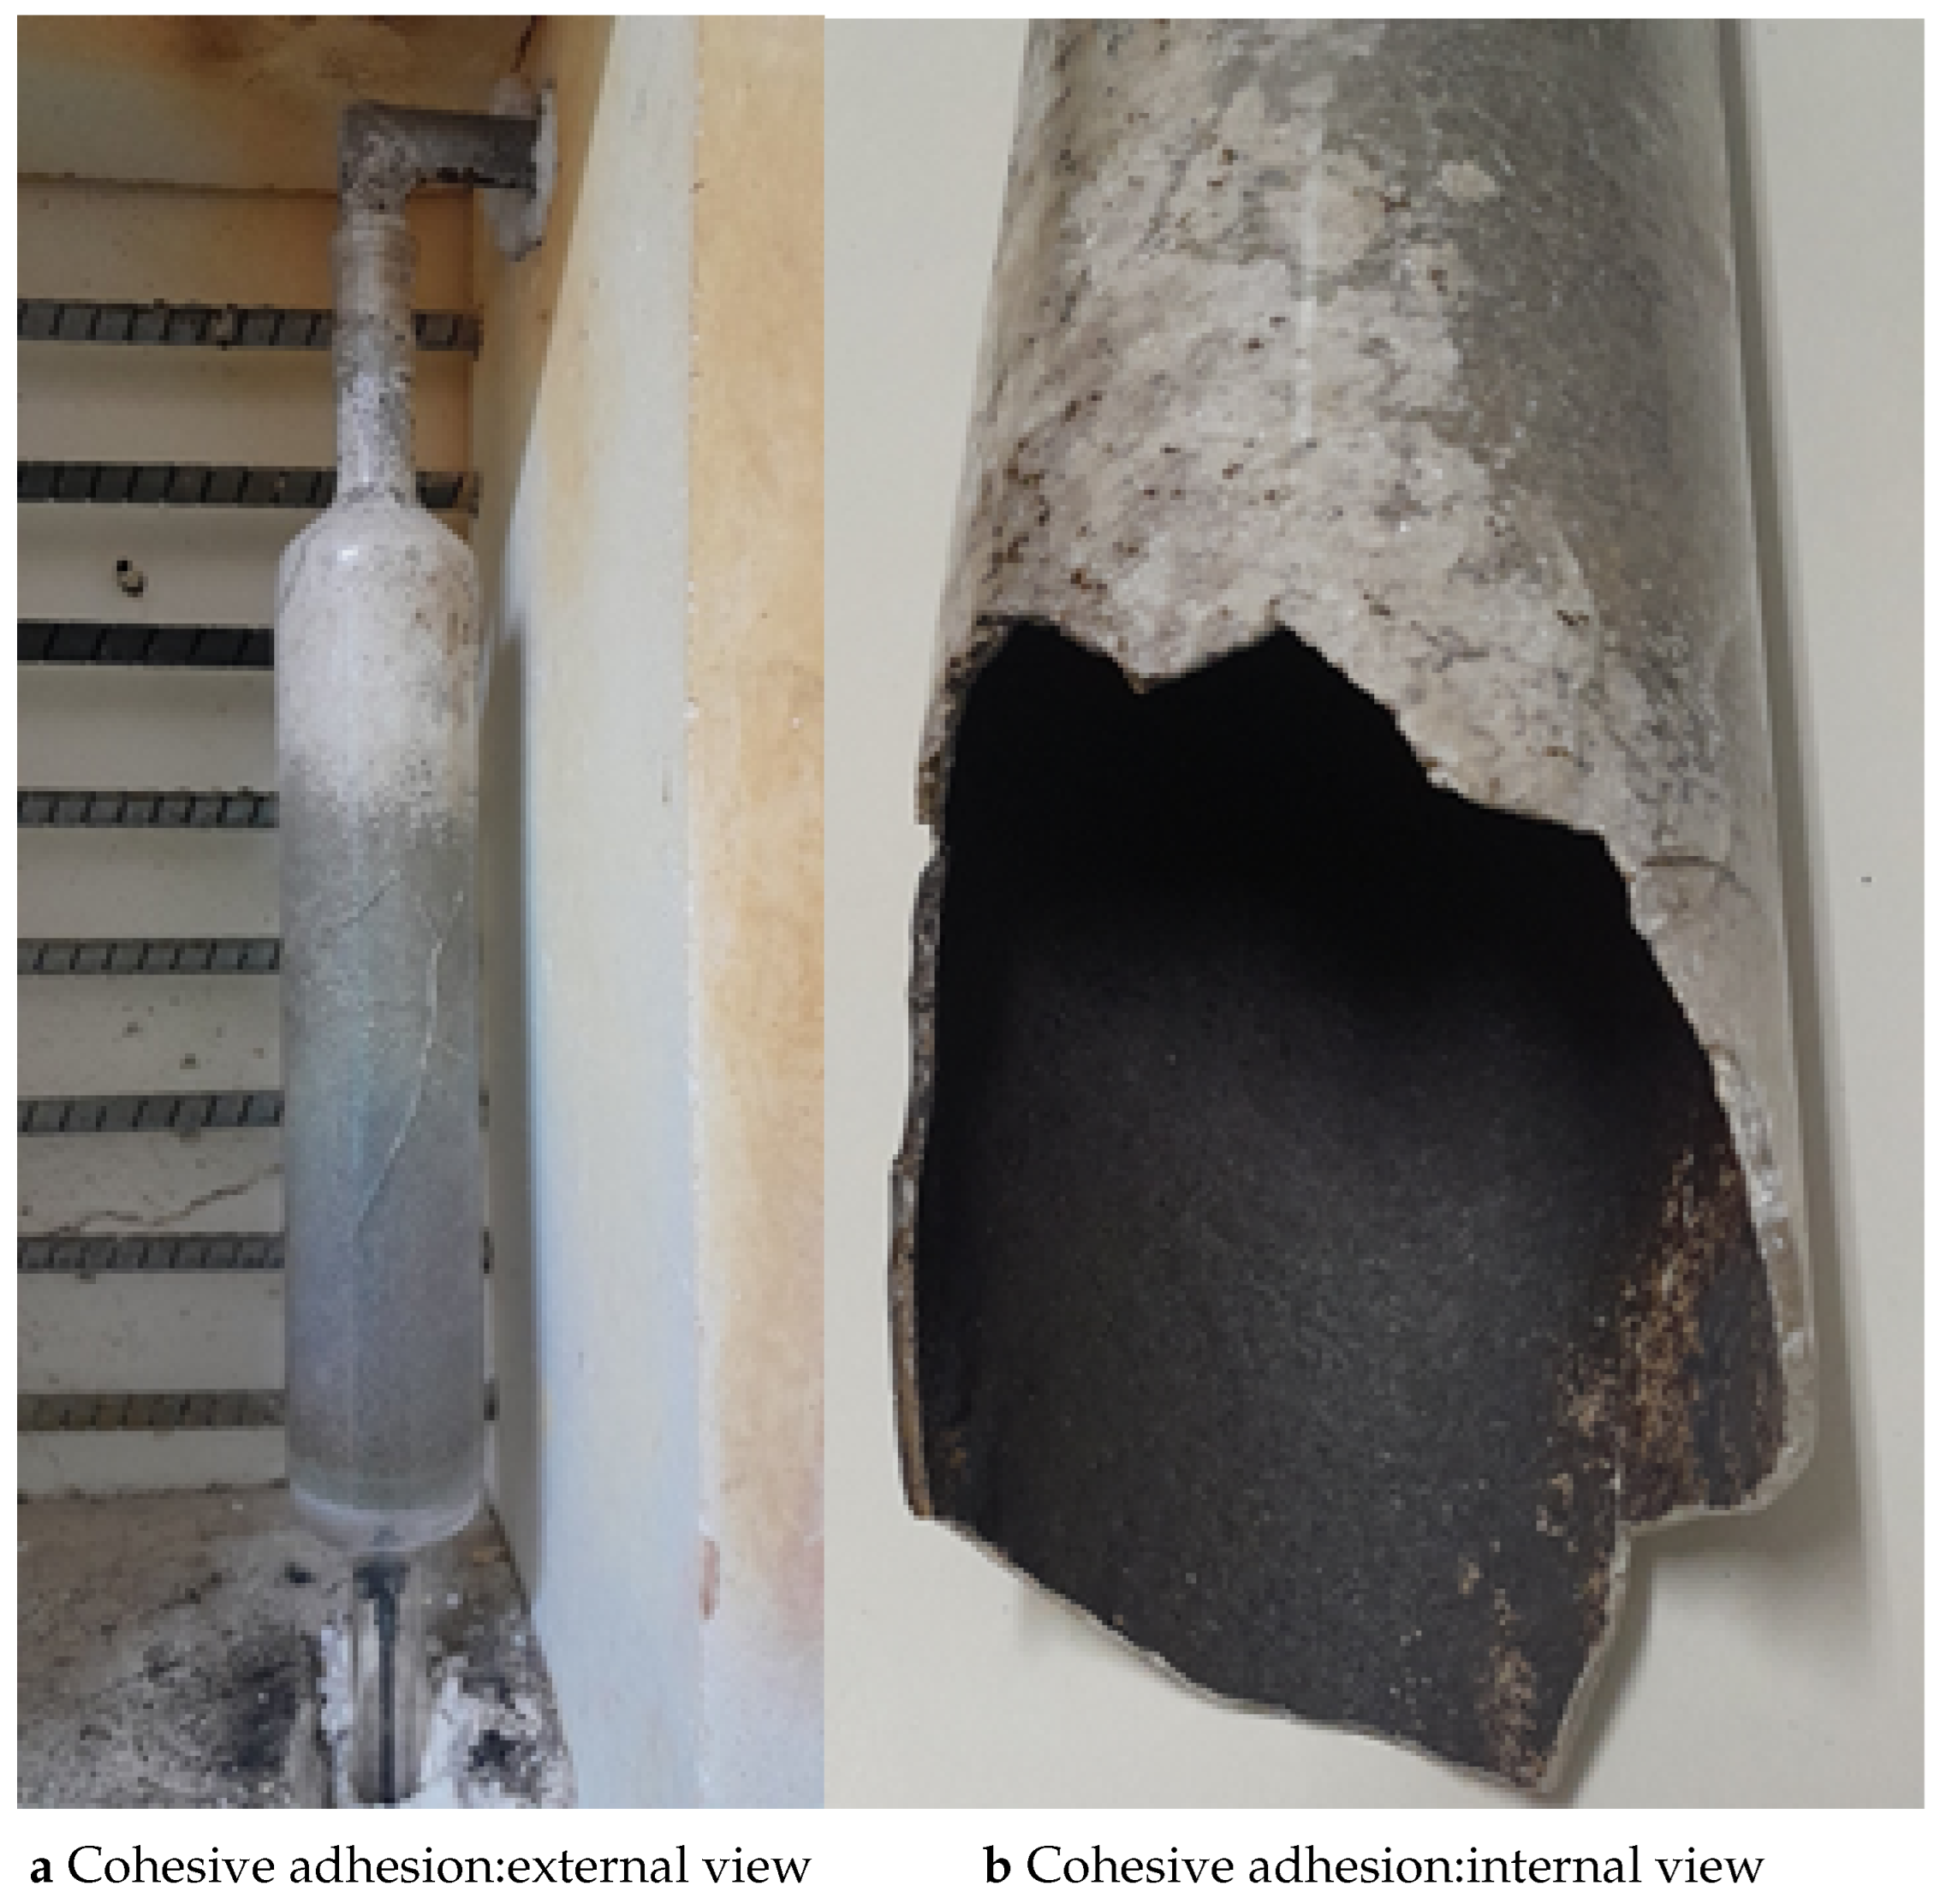
Figure 15.
Image of the embrittled reactor after Mn ore hydrogen reduction test at C with (a) showing the appearance of the reactor from outside (shattered, yet kept together and opaqued by the cohesively adhered layer of the reduction product). (b) shows the cross-section of the embrittled/reacted glass and the appearance of the cohesively adhered product of the reduced Mn ore.
Figure 16.
Back-scattered electron images of the product of Nchwaneng ore that was reduced by hydrogen gas at C (A–A3). (A1–A3) are the magnifications of their corresponding red boxes in (A) at m. The prevalence of iron manganese is shown in Spots 9, 17, 18 and 19. Silicate mix, which is associated with high temperature (C) is displayed in Spots 2, 6, 7, 11 and 13. Quartz, which is associated with embrittlement and erosion of the reactor glass at high temperature (C) is exhibited in Spots 1 and 15. Spots 4 and 14 exhibit calium manganese oxide. Iron manganese oxide is displayed in Spots 12 and 16. Rarely occurring are manganosite and magnesium manganese oxide. Iron is also displayed in Spots 8 and 10.
Table 1.
Sphericity and other structural properties of raw Nchwaneng ore particles.
Table 1.
Sphericity and other structural properties of raw Nchwaneng ore particles.
| Sample | Area (µm²) | Min (Diameter) (µm) | Equivalent Circular Diameter (µm) | Phase ID | Sphericity | Elongation | Aspect Ratio | Max (Diameter) (µm) | Mean (Diameter) (µm) | Perimeter (µm) | Shape Factor | Convexity |
|---|
| −600 + 500 µm
| 17,645.45 | 37.89 | 53.79 | 1.00 | 0.77 | 1.31 | 1.38 | 76.19 | 51.30 | 225.37 | 2.23 | 1.00 |
| 7342.47 | 17.85 | 25.94 | 1.00 | 0.73 | 712.42 | 1.91 | 36.45 | 24.31 | 113.72 | 2.73 | 0.99 |
| 6518.40 | 17.19 | 28.56 | 1.00 | 0.71 | 708.52 | 1.50 | 46.22 | 26.02 | 122.37 | 3.22 | 1.00 |
| −500 + 450 µm | 7641.97 | 26.17 | 38.72 | 1.00 | 0.67 | 2039.33 | 1.50 | 56.48 | 36.31 | 155.35 | 2.39 | 1.00 |
| 20,083.59 | 56.58 | 89.08 | 1.00 | 0.44 | 3900.72 | 1.94 | 128.97 | 83.59 | 380.89 | 2.17 | 0.99 |
| 24,265.5 | 64.8 | 100.22 | 1.00 | 0.45 | 2637.19 | 1.93 | 141.01 | 94.87 | 425.94 | 2.01 | 0.99 |
| −450 + 300 µm | 5898.03 | 26.17 | 41.34 | 1.00 | 0.58 | 1.62 | 2.07 | 61.02 | 38.98 | 186.97 | 1.61 | 0.99 |
| 5652.78 | 24.14 | 37.16 | 1.00 | 0.62 | 301.80 | 2.01 | 53.96 | 35.02 | 166.92 | 1.77 | 0.99 |
| 5877.38 | 27.95 | 43.57 | 1.00 | 0.50 | 2393.35 | 2.33 | 63.79 | 41.01 | 198.36 | 1.96 | 0.99 |
| −300 + 200 µm | 7353.34 | 32.62 | 52.47 | 1.00 | 0.64 | 1042.72 | 1.67 | 78.74 | 49.28 | 229.44 | 1.39 | 1.00 |
| 4456.58 | 17.97 | 32.01 | 1.00 | 0.67 | 2508.51 | 1.55 | 51.29 | 29.09 | 141.98 | 2.30 | 1.00 |
| 4313.82 | 21.18 | 29.86 | 1.00 | 0.70 | 3761.76 | 1.37 | 40.87 | 28.40 | 116.79 | 2.67 | 1.00 |
| −200 + 106 µm | 1231.8 | 11.50 | 17.09 | 1.00 | 0.68 | 2242.2 | 1.42 | 22.97 | 16.08 | 65.87 | 2.71 | 1.00 |
| 4058.7 | 27.41 | 42.72 | 1.00 | 0.55 | 1499.6 | 1.86 | 60.69 | 40.62 | 188.61 | 1.55 | 1.00 |
| 1469.9 | 12.30 | 18.80 | 1.00 | 0.67 | 1679.4 | 1.47 | 26.27 | 17.64 | 77.76 | 2.55 | 1.00 |
Table 2.
Respective chemical analyses of raw Nchwaneng and Zambian manganese ores.
Table 2.
Respective chemical analyses of raw Nchwaneng and Zambian manganese ores.
| | ICP_FEMN | XRF_Q_S_SCAN |
|---|
| | | CaO | | | MgO | MnO | | Al | Ca | Fe | K | P | Si | Ti |
|---|
| | % | % | % | % | % | % | % | % | % | % | % | % | % | % |
| Nchwaneng ore | 0.28 | 7.16 | <0.07 | 17.4 | 1.97 | 56.80 | 3.84 | 0.32 | 5.32 | 12.95 | 0.05 | 0.04 | 1.93 | 0.02 |
| Zambian ore | 2.28 | 0.37 | <0.07 | 1.98 | 0.27 | 59.40 | 8.80 | 1.13 | 0.10 | 1.99 | 0.41 | 0.05 | 3.13 | 0.19 |
Table 3.
Respective mineral proportions in as-received Nchwaneng and Zambian manganese ores.
Table 3.
Respective mineral proportions in as-received Nchwaneng and Zambian manganese ores.
| Mineral | Ideal Chemical Composition | Nchwaneng Ore | Zambia Ore |
|---|
| | | % | % |
| Braunite | | 41.36 | ND |
| Hausmannite | | 3.62 | ND |
| Kutnohorite | ()(OH | 3.49 | ND |
| Bixbyite | 1. | 14.16 | ND |
| Manganite | MnO | 6.96 | ND |
| Marokite | | 2.7 | ND |
| Rhodochrosite | () | <1 | ND |
| Romanechite | (Ba,O(, | ND | 56.1 |
| Pyrolusite | | ND | 21.44 |
| Cryptomelane | K(, | ND | 5.91 |
| Hollandite | Ba(, | ND | 2.19 |
| Jacobsite | | ND | 2.04 |
| Coronadite | Pb(, | ND | 1.26 |
| Galaxite | (Mn,Mg)(Al, | ND | <1 |
| Ankerite | Ca(,Mg)( | ND | 1.26 |
| Lizardite | ()(OH | ND | <1 |
| Hematite | | 13.68 | <1 |
| Dolomite | CaMg( | 7.87 | ND |
| Calcite | | 5.61 | ND |
| Quartz | | ND | 8.27 |
Table 4.
Mineral phases in spots shown in the back-scattered electron images (
Figure 1) from SEM-EDS analyses of Nchwaneng manganese ore.
Table 4.
Mineral phases in spots shown in the back-scattered electron images (
Figure 1) from SEM-EDS analyses of Nchwaneng manganese ore.
| Spot | C | O | Mg | Si | P | Ca | Mn | Fe | Phase |
|---|
| Spot 1 | ND | 26.18 | ND | ND | ND | 1.38 | 72.44 | ND | Hausmannite |
| Spot 2 | ND | 29.42 | ND | ND | ND | 14.32 | 56.26 | ND | Marokite |
| Spot 3 | ND | 36.04 | ND | ND | ND | 21.75 | 42.21 | ND | Marokite–calcite mix |
| Spot 4 | ND | 45.00 | ND | ND | ND | 44.73 | 9.07 | ND | Mn–calcite |
| Spot 5 | ND | 22.73 | ND | ND | ND | 2.06 | 75.21 | ND | Hausmannite |
| Spot 6 | ND | 24.73 | ND | 2.68 | ND | 4.91 | 67.68 | ND | Braunite II |
| Spot 7 | ND | 32.72 | 2.77 | ND | ND | 2.92 | 57.57 | 4.02 | Mn–oxide |
| Spot 8 | ND | 29.85 | ND | 5.07 | ND | 5.59 | 59.49 | ND | Braunite |
| Spot 9 | ND | 25.07 | 4.64 | ND | ND | 14.31 | 55.98 | ND | Marokite–Kutnohorite mix |
| Spot 10 | ND | 40.60 | 6.00 | ND | ND | 32.79 | 20.61 | ND | Marokite of Kutnohorite/Mn–calcite |
| Spot 11 | ND | 38.79 | 22.49 | 14.28 | ND | 5.63 | 18.81 | ND | Mn–serpentine |
| Spot 12 | ND | 26.50 | 1.99 | 0.09 | ND | 39.67 | 31.75 | ND | Kutnohorite |
| Spot 13 | ND | 25.76 | ND | 4.66 | ND | 1.75 | 67.84 | ND | Braunite |
Table 5.
Mineral phases in spots shown in the back-scattered electron images (
Figure 2) from SEM-EDS analyses of Zambian manganese ore.
Table 5.
Mineral phases in spots shown in the back-scattered electron images (
Figure 2) from SEM-EDS analyses of Zambian manganese ore.
|
Spot
|
0
|
Al
|
Si
|
K
|
Ca
|
Mn
|
Fe
|
Ba
| Ti |
Phases
|
|---|
|
Spot 1
|
19.89
| ND | ND | ND | ND |
59.19
|
1.29
|
19.63
| ND | Romanechite |
|
Spot 2
|
20.08
| ND | ND | ND | ND |
60.77
|
0.87
|
18.28
| ND | Romanechite |
|
Spot 3
|
53.26
| ND |
46.74
| ND | ND | ND | ND | ND | ND |
Quartz
|
|
Spot 4
|
53.26
| ND |
46.74
| ND | ND | ND | ND | ND | ND |
Quartz
|
|
Spot 5
|
20.85
| ND | ND | ND | ND |
66.53
| ND |
12.62
| ND | Romanechite |
|
Spot 6
|
21.34
| ND | ND | ND | ND |
69.69
| ND |
8.96
| ND | Romanechite |
|
Spot 7
|
34.21
|
13.93
|
9.66
|
1.81
| ND |
32.83
| ND |
7.56
| ND | Mica–Romanecite mixed spectra |
|
Spot 8
|
20.38
| ND | ND | ND | ND |
63.57
| ND |
16.05
| ND | Romanechite |
|
Spot 9
|
36.12
|
12.48
|
13.88
|
5.93
| ND |
24.68
| ND |
6.91
| ND | Mica–Romanechite mixed spectra |
|
Spot 10
|
23.24
|
1.65
|
2.24
|
0.52
| ND |
61.22
| ND |
11.14
| ND | Romanechite |
| Spot 11 |
20.46
| ND | ND | ND | ND |
64.08
| ND |
15.46
| ND | Romanechite |
| Spot 12 |
23.66
|
2.71
|
2.38
|
0.52
| ND |
58.37
| ND |
12.36
| ND | Romanechite |
|
Spot 13
|
21.65
|
0.85
|
0.81
| ND | ND |
61.30
|
1.91
|
13.48
| ND | Romanechite |
| Spot 14 |
25.11
|
3.87
|
4.00
|
1.18
| ND |
52.66
| ND |
13.19
| ND |
Romanechite
|
|
Spot 15
|
53.26
| ND |
46.74
| ND | ND | ND | ND | ND | ND |
Quartz
|
| Spot 16 |
23.76
|
3.17
|
2.34
| ND | ND |
54.33
|
3.2
|
13.21
| ND |
Romanechite
|
| Spot 17 |
20.17
| ND | ND | ND | ND |
59.70
|
2.58
|
17.55
| ND | Romanechite |
| Spot 18 |
32.36
| ND | ND | ND | ND |
2.23
|
31.4
| ND |
33.98
| Ilmenite |
| Spot 19 |
20.36
| ND | ND | ND | ND |
63.43
| ND |
16.21
| ND | Romanechite |
|
Spot 20
|
22.75
|
1.82
|
1.89
| ND | ND |
59.55
| ND |
13.98
| ND | Romanechite |
|
Spot 21
|
45.78
| ND |
35.36
| ND | ND |
17.87
|
0.99
| ND | ND | Mn oxide + quartz mixed spectra |
|
Spot 22
|
22.55
| ND | ND | ND | ND |
77.45
| ND | ND | ND | Mn oxide |
|
Spot 23
|
19.69
| ND | ND | ND | ND |
59.17
| ND |
21.14
| ND | Romanechite |
|
Spot 24
|
29.59
|
6.75
|
7.19
| ND |
3.29
|
45.12
| ND |
8.05
| ND | Romanechite mixed with silicate |
|
Spot 25
|
23.73
|
2.46
|
2.52
| ND | ND |
59.31
| ND |
11.98
| ND | Romanechite mixed with silicate |
|
Spot 26
|
20.29
| ND | ND | ND | ND |
63.01
| ND |
16.7
| ND | Romanechite |
|
Spot 27
|
20.11
| ND | ND | ND | ND |
61.80
| ND |
18.09
| ND | Romanechite |
Table 6.
Comparison of minimum fluidization velocities of determined using respective approaches of Geldard, Hessels and Ergun.
Table 6.
Comparison of minimum fluidization velocities of determined using respective approaches of Geldard, Hessels and Ergun.
| | Effect of Particle Size | Effect of Sample Mass |
|---|
| Particle-Size Range (m) | +106–200 | +200–300 | +300–450 | +450–500 | +500–600 | +106–600 | Mass (g) | 300 g | 500 g | 700 g |
|---|
| Sample Mass (g) | 700 | 700 | 700 | 700 | 700 | 700 | Particle-Size Range (m) | +300–450 | +300–450 | +300–450 |
| Geldard Approach, (m/s) | 0.053 | 0.072 | 0.072 | 0.088 | 0.088 | 0.070 | 0.053 | 0.070 | 0.070 | |
| Hessels Approach, (m/s) | - | - | - | - | - | 0.092 | - | - | - | |
| Ergun Equation, (m/s) | 0.026 | 0.090 | 0.13 | 0.19 | 0.55 | 0.098 | 0.13 | 0.13 | 0.13 | |
Table 7.
Mineral phases of the products of Zambian ore heated under argon at C and the product of Zambian ore reduced by hydrogen gas at C.
Table 7.
Mineral phases of the products of Zambian ore heated under argon at C and the product of Zambian ore reduced by hydrogen gas at C.
| | | Relative Abundance (Mass %) |
|---|
| Compound Name | Formula | Thermal Mineral Transformations | Hydrogen Reduction |
|---|
| Iron Manganese Oxide | (FeO (MnO | 15–30 | >50 |
| Calcium Manganese Oxide | (MnO(CaO | ND | 5–15 |
| Leucite | | 5–15 | ND |
| Ramsdellite | | 5–15 | ND |
| Lithosite | () | 5-15 | ND |
| Spinel | | 5–15 | ND |
| Kaonite | Mn() | 5–15 | ND |
| Hausmannite | | 30–50 | ND |
| Akageneite | O(OH) | ND | 5–15 |
| Quartz | | ND | <5 |
Table 8.
Mineral phases of the products of Nchwaneng ore and Zambian manganese ore that were reduced by hydrogen gas at C.
Table 8.
Mineral phases of the products of Nchwaneng ore and Zambian manganese ore that were reduced by hydrogen gas at C.
| | | Relative Abundance (Mass %) |
|---|
| Compound Name | Formula | Nchwaneng | Zambian |
|---|
| Iron Manganese Oxide | (FeO(MnO | 30–50 | >50 |
| Calcium Manganese Oxide | (MnO(CaO | 5–15 | 5–15 |
| Manganosite | MnO | 15–30 | ND |
| Iron Manganese | | 15–30 | ND |
| Akageneite | O(OH) | ND | 5–15 |
| Quartz | | ND | <5 |
Table 9.
Mineral phases of the products of Nchwaneng manganese ore that was reduced by hydrogen gas over two respective residence times (10 and 40 min) at C.
Table 9.
Mineral phases of the products of Nchwaneng manganese ore that was reduced by hydrogen gas over two respective residence times (10 and 40 min) at C.
| Compound Name | Formula | Relative Abundance (Mass %) |
|---|
| | | 10 min | 40 min |
|---|
| Iron Manganese Oxide | (FeO(MnO | 15–30 | 30–50 |
| Calcium Manganese Oxide | (MnO(CaO | 5–15 | 5–15 |
| Manganosite | MnO | 5–15 | 15–30 |
| Iron Manganese | | 5–15 | 15–30 |
| Hollandite | Ba(, | 5–15 | ND |
| Hematite | | 5–15 | ND |
| Bredigite | Mg( | 15–30 | ND |
Table 10.
Mineral phases of the products of Zambian manganese ore that was reduced by hydrogen gas at C, C, C and C, respectively.
Table 10.
Mineral phases of the products of Zambian manganese ore that was reduced by hydrogen gas at C, C, C and C, respectively.
| Compound Name | Formula | Relative Abundance (Mass %) |
|---|
| | | 550
C | 600
C | 700
C | 800
C |
|---|
| Iron Manganese Oxide | (FeO(MnO | 30–50 | >50 | >50 | >50 |
| Calcium Manganese Oxide | (MnO(CaO | ND | ND | 5–15 | ND |
| Lorenzenite | () | ND | 5–15 | ND | ND |
| Sodium Manganese Iron Carbide Nitride | | 5–15 | ND | ND | ND |
| Srebrodolskite | | 5–15 | ND | ND | ND |
| Andradite | () | 5-15 | ND | ND | ND |
| Forsterite | | 15–30 | 5–15 | ND | ND |
| Akageneite | O(OH) | ND | 5–15 | 5–15 | ND |
| Ramsdellite | | ND | ND | ND | 5–15 |
| Kurchatovite | () | ND | ND | ND | 5–15 |
| Barium Oxide Peroxide | Ba((O | ND | ND | ND | <5 |
| Quartz | | 5–15 | <5 | <5 | 5–15 |
Table 11.
Mineral phases of the products of Nchwaneng manganese ore that was reduced by hydrogen gas at C and C, respectively.
Table 11.
Mineral phases of the products of Nchwaneng manganese ore that was reduced by hydrogen gas at C and C, respectively.
| Compound Name | Formula | Relative Abundance (Mass %) |
|---|
| | | 500
C | 700
C |
|---|
| Iron Manganese Oxide | (FeO(MnO | 30–50 | 30–50 |
| Calcium Manganese Oxide | (MnO(CaO | 5–15 | 5–15 |
| Manganosite | MnO | 15–30 | 15–30 |
| Iron Manganese | | 5–15 | 15–30 |
| Quartz | | 5-15 | ND |
Table 12.
Mineral phases on the spots on the back-scattered electron images (
Figure 13) of the product of Nchwaneng manganese ore that was reduced by hydrogen gas at
C.
Table 12.
Mineral phases on the spots on the back-scattered electron images (
Figure 13) of the product of Nchwaneng manganese ore that was reduced by hydrogen gas at
C.
| Spot | O | Mg | Al | Si | S | Na | K | P | Ca | Mn | Fe | Ba | Phase |
|---|
| 1 | 25.4 | ND | ND | ND | ND | ND | ND | ND | 2.7 | 72.0 | ND | ND | Impure Manganosite |
| 2 | 26.2 | ND | ND | ND | 0.6 | ND | ND | ND | 3.8 | 69.4 | ND | ND | Impure Manganosite |
| 3 | 26.7 | ND | ND | ND | ND | ND | ND | ND | 2.4 | 70.9 | ND | ND | Impure Manganosite |
| 4 | 28.2 | 2.5 | ND | 3.2 | ND | ND | ND | ND | 11.2 | 43.9 | 11.1 | ND | Calcium Manganese Oxide |
| 5 | 44.4 | 32.3 | ND | ND | ND | ND | ND | ND | 9.9 | 7.4 | 6.0 | ND | Magnesium Manganese Oxide |
| 6 | 41.2 | ND | ND | 0.6 | ND | ND | ND | 17.5 | 40.7 | ND | ND | ND | Calcium Phosphorus Oxide |
| 7 | 24.2 | ND | ND | ND | ND | ND | ND | ND | 3.5 | 56.1 | 16.2 | ND | Iron Manganese Oxide |
| 8 | 28.0 | ND | ND | ND | ND | ND | ND | ND | ND | 72.0 | ND | ND | Manganosite |
| 9 | ND | ND | ND | 1.0 | ND | ND | ND | ND | ND | 3.7 | 95.4 | ND | Iron Manganese |
| 10 | 35.4 | ND | ND | 14.5 | ND | ND | ND | ND | 12.2 | 37.9 | ND | ND | Mn Silicate Mix |
| 11 | 26.8 | ND | ND | 0.9 | ND | ND | ND | ND | 15.5 | 56.8 | ND | ND | Calcium Manganese Oxide |
| 12 | 38.3 | ND | 0.9 | 15.1 | 0.8 | 5.2 | 1.0 | ND | 3.9 | 30.9 | ND | 3.8 | Mn Silicate Mix |
| 13 | ND | ND | ND | ND | ND | ND | ND | ND | ND | 3.9 | 96.1 | ND | Iron Manganese |
| 14 | 23.6 | ND | ND | ND | ND | ND | ND | ND | ND | 64.2 | 12.2 | ND | Iron Manganese Oxide |
Table 13.
Mineral phases on the spots on the back-scattered electron images (
Figure 14) of the product of Nchwaneng manganese ore that was reduced by hydrogen gas at
C.
Table 13.
Mineral phases on the spots on the back-scattered electron images (
Figure 14) of the product of Nchwaneng manganese ore that was reduced by hydrogen gas at
C.
| Spot | O | Mg | Al | Si | P | Ca | Mn | Fe | Phase |
|---|
| 1 | 62.2 | ND | 1.6 | 15.4 | 1.0 | 1.8 | 8.6 | 9.3 | Silicate Mix |
| 2 | 24.8 | ND | ND | ND | ND | 10.9 | 64.3 | ND | Calcium Manganese Oxide |
| 3 | 26.8 | 2.3 | ND | ND | ND | 3.8 | 67.1 | ND | Impure Manganosite |
| 4 | 27.3 | 2.1 | ND | 1.2 | ND | 9.9 | 59.7 | ND | Calcium Manganese Oxide |
| 5 | ND | ND | ND | ND | ND | ND | 1.1 | 99.0 | Iron Manganese |
| 6 | ND | ND | ND | ND | ND | ND | 1.5 | 98.5 | Iron Manganese |
| 7 | 27.5 | ND | ND | ND | ND | 6.0 | 66.6 | ND | Calcium Manganese Oxide |
| 8 | 23.8 | ND | ND | ND | ND | 5.1 | 59.3 | 11.9 | Calcium Manganese Oxide |
| 9 | ND | ND | ND | N | ND | ND | 1.7 | 98.3 | Iron Manganese |


