Abstract
To reveal the forming process of organic matter pores in shales, an experiment combining thermal heating and scanning electron microscopy (SEM) was conducted on an oil shale sample with a vitrinite reflectance value of 0.46% from the Huadian Formation in the Huadian Basin, northeastern China. The heating temperatures were from 417.8 °C to 700.8 °C, and the corresponding Easy%Ro values were between 1.00% and 3.70%. Four pieces of macerals in the SEM images, including vitrinite (one piece), funginite (one piece), and solid bitumen (two pieces), were observed during the whole heating process. The results showed that organic pores started to appear and increased in all the studied macerals. Each piece of maceral had two rapid growth points of organic matter pores. During heating, organic pores were initially isolated and then became connected. Among the three types of macerals, solid bitumen was more porous, which may be related to the fact that solid bitumen was more easily thermally degraded. Funginite had more pores than vitrinite at all the heating temperatures. Cracks were observed in vitrinite and funginite during heating, and the vitrinite had more cracks, which may be attributed to its stiffness and brittleness. Almost all the organic matter pores were irregular in this study, but bubble-like or sponge-like organic pores have been reported in natural shales. The difference in shapes of organic matter pores may be derived from our experimental system as it cannot consider pressure. These results provide some implications for the mechanism of formation of organic matter pores.
1. Introduction
Shales have been extensively investigated as reservoirs since shale gas was commercially produced [1,2,3,4,5,6,7,8,9,10,11,12,13,14,15]. Pores in shales were classified as interparticle pores, intraparticle pores, and organic pores [16]. Among the three types of pores, organic pores are often considered to be the most important storage space for gas due to the strong positive correlations between gas content and total organic carbon (TOC) content observed in many gas shales [17]. Therefore, the origin and evolution of organic pores were investigated by researchers.
Organic matter (OM) pores are intra-pores located within organic matter [16]. They are also termed organic matter-hosted pores by other researchers [18,19]. OM pores have been classified into primary and secondary pores. The former ones are hosed in primary macerals such as inertinite [11], while the latter ones are considered to be formed as a result of petroleum generation [20,21]. The secondary OM pores are always the dominant types in gas shales and therefore received much more attention. If not otherwise specified, OM pores refer to secondary pores in this study.
The development of OM pores is mainly influenced by OM types (macerals), OM abundance, and thermal maturity [22,23,24]. Of the three controls, OM type plays an important role in organic matter pore formation. The development of OM pores in various macerals is very different from one another. Solid bitumen contains many more pores than terrigenous macerals including vitrinite and inertinite because of their lower hydrocarbon potentials [18,25,26]. Whether the pores in zooclasts like graptolite and chitinozoan are primary or secondary remains controversial [27,28,29]. Thermal maturity is another main control of OM pore formation. Most investigators believe that OM pores are induced by hydrocarbon generation and expulsion and the development of OM pores should be a function of thermal maturity [20,21,23,30,31,32]. The lower limit of vitrinite reflectance for OM pores formation was given to be 0.6% [16] and 0.9% [33]. Thermal simulation showed that pores could be observed in the OM with high sulfur content at lower maturity than the OM with low sulfur content [34]. Organic matter abundance mainly influences the preservation of OM pores [18]. It has been reported that shale samples with higher TOC contents contained fewer OM pores than samples with lower TOC contents [18]. Apart from the three factors above, mineralogical composition can also affect the preservation of OM pores. Shales with high contents of quartz, feldspar, and calcite were more available for the preservation of OM pores than those containing lots of clay minerals because rigid minerals can keep OM pores from compaction [35,36,37].
The forecasting models of OM pores were built based on the theory of petroleum generation kinetics [38,39,40]. However, within a specific scanning electron microscopy (SEM) image, there are often pores in some organic matter and other organic matter is pore-free [30], indicating that organic pores were not only related to maturation but also were controlled by the characteristics of organic matter itself [11,22,41,42]. Hence the pore development of macerals in shales became the focus of the investigation of organic matter pores. Previous work was conducted on natural shale samples with different maturities (i.e., obtained from well cores or outcrops) [26,27,43,44], which makes it difficult to observe the same maceral across a thermal maturity range. In this case, the formation of organic pores cannot be clearly discerned because the two dominant factors (maturity and maceral) cannot be considered at the same time.
Fortunately, combined thermal heating and SEM imaging provides a way to observe the same piece of maceral during artificial maturation. Several studies have been conducted on shales [45,46,47,48]. Although some cracks related to organic matter were seen in these works, organic pores were not observed, which may be a result of the organic matter had not been heated effectively. Therefore, this new instrument has not been used to investigate the process of organic pore formation.
In this study, we collected an oil shale sample from the Huadian Formation of Huadian Basin, northeastern China. Artificial maturation was performed on it using an SEM system with a piece of heating equipment. The heating temperatures were from 417.8 °C to 700.8 °C, and the corresponding Easy%Ro values were between 1.00% and 3.70%. The morphology of vitrinite, funginite, and solid bitumen was observed during the heating process, and the surface porosities of each piece of maceral were quantified. These results provide observations related to the formation of organic pores in various macerals and provide further experience for future experiments.
2. Geological Settings and Sample
The Huadian Basin is located in the middle part of Dunhua-Mishan Fault Zone, northeastern China [49] (Figure S1a,b). It has an area of 40 km2 and is a basin-bearing oil shale [50]. The Huadian Formation overlies various types of basement including Carboniferous-Permian granites, lower Paleozoic and Permo-Carboniferous sedimentary rocks, and its thickness is about 1500 m [50]. The Middle Eocene Huadian Formation consists of a lower Pyrite Member, a middle Oil Shale Member, and an upper Carbonaceous Shale Member (Figure S2) [51]. Among the three members, the Oil Shale Member was deposited when the basin subsidence reached the maximum [50]. The rocks of the Oil Shale Member are dominantly mudstones and shales (Figure S2) [52]. Huadian oil shales have a low maturity with vitrinite reflectances ranging from 0.5%–0.65% [52], and they were mined by three companies with 50,000 t oil produced through retorting oil shale each year [53]. In this study, one oil shale sample was collected from the Oil Shale Member of the Huadian Formation in one local mine (Figure S1c).
3. Methods
3.1. Rock-Eval and TOC
The collected sample was crushed into 100 mesh with a pestle and mortar. The sample was used in Rock-Eval and TOC analysis. Pyrolysis was performed using a Rock-Eval 6 instrument produced by Vinci Technologies, Paris, France and TOC content was obtained from a CS-230 carbon and sulfur analyzer manufactured by LECO, Michigan, USA according to their corresponding standards [32,54].
3.2. Organic Petrology
A piece of sample with a diameter of about 8 mm and a width of approximately 1 mm was obtained from a bulk sample by being polished with dry emery paper. Then, the sample was milled with Ar ion milling using an EMTIC3X instrument produced by Leica, Wetzlar, Germany under an accelerating voltage of 4 kV for 4 h. The maceral composition in the milled sample was observed under a LEICA DM 4500P polarizing microscope produced by Leica, Wetzlar, Germany using light and fluorescence excitation by blue light in oil immersion (50× magnification). Another piece of the studied shale sample was prepared according to ISO 7404-2 [55] for vitrinite reflectance measurement and maceral observation. Vitrinite reflectance was measured using an AX10 microscope produced by ZEISS Oberkochen, Germany with an integrated TIDAS CCD UV/NIR microscope photometer produced by J&M Essingen, Germany in oil immersion objective (50× magnification) according to ASTM D7708-14 [56].
3.3. Thermal Heating and SEM Imaging
The milled sample was cleaned using absolute ethyl alcohol to remove immersion oil. The surface was coated with gold. Subsequently, it was heated using the combined heating and SEM system. This system consists of heating equipment produced by Qiyue Technology Hangzhou, China and an SEM produced by TESCAN Brno, Czech Republic (Figure 1).
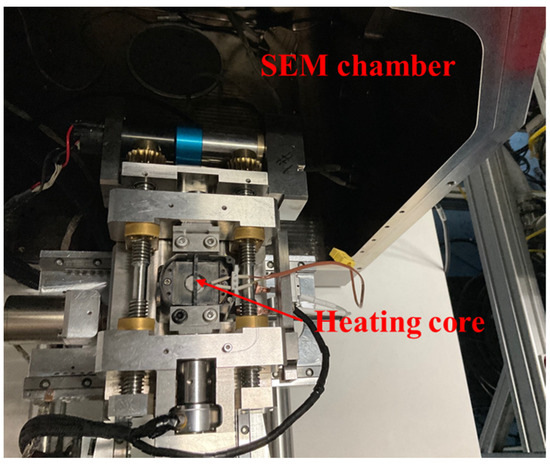
Figure 1.
The heating and SEM system used in this study.
The treated sample was firstly heated in the simulation system from room temperature to 417.8 °C and kept at this temperature for 30 min. Four pieces of macerals in the same piece of the sample, including one piece of vitrinite, one piece of funginite, and two pieces of solid bitumen, were observed under SEM within 3 min. The temperature was elevated to 461.5 °C, 511 °C, 553 °C, 602 °C, 658 °C and 700.8 °C, successively (Figure 2, Table 1). These non-integer temperatures were selected in the process of heating because it is difficult for the instrument to control temperatures according to design, and close temperatures were used. Each temperature was kept for 30 min, and the same four pieces of macerals were observed using SEM under an accelerating voltage of 20 kV and a working distance of ~17.6 mm within 3 min. The studied sample was examined using secondary electron imaging. EasyRo was a parameter reflecting the maturity of organic matter and was calculated using heating time and temperature based on the equation established by Sweeny and Burnham [57]. Then, a modified EasyRo model was proposed by Tang et al. [58], which is believed to improve the accuracy of calculated maturity. Because the vitrinite reflectance values of the heated sample cannot be measured the modified EasyRo model was used to obtain the maturity of each heating temperature (Table 1).
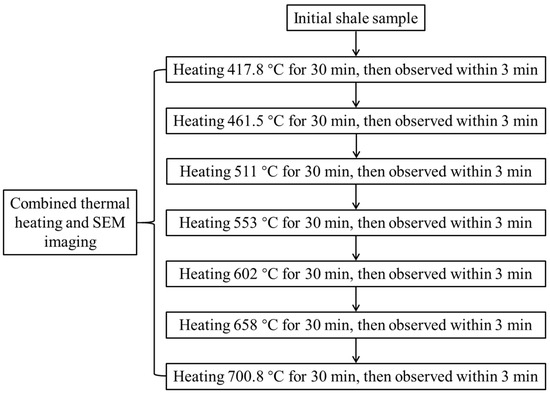
Figure 2.
Workflow diagram of combining heating and SEM imaging simulation.

Table 1.
Heating temperatures and maturities of the thermal simulation.
3.4. Quantification of Organic Pores
Organic pores were quantified using the JMicrovision 1.3.2 software [59]. This software can calculate areas and perimeters of pores, and equivalent circular diameters and surface porosities were obtained from areas and perimeters. Manual interpretation of pore boundaries was performed using the method suggested by Milliken et al. [18] and Pommer and Milliken [31]. For some SEM images, pores were not easily identified (Figure 3a). In this case, we magnified it in JMicrovision software and pores became obvious in this state (Figure 3b), and each pore could be counted (Figure 3c) and surface porosity can be obtained (Figure 3d). In one SEM image, the surface porosity of organic matter was obtained by dividing the area of pores using the area of the SEM view. The result was then divided by 100. Thus, the surface porosity was obtained. A total of 6260 organic pores were quantified in this study.
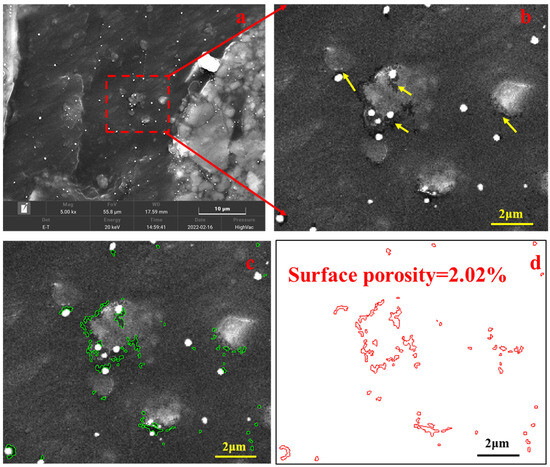
Figure 3.
Identification of organic pores in SEM image with low magnifications at low heating temperatures ((a) SEM image of vitrinite at 5000× instrument magnification and 417.8 °C, the red box indicates the area of the right side. (b) A magnified area from the left image, yellow arrows indicate pores. (c) Pores were marked using green lines in the SEM image shown in (b). (d) Extracted pores marked using red lines from SEM image of (c)).
4. Results
4.1. Geochemical Characteristics
The geochemical parameters are shown in Table 2. The TOC content of the studied sample is 10.97 wt.%, and S1 and S2 are 1.43 mg/g and 73.48 mg/g, respectively. Its Tmax and HI are 442 °C and 670 mg/g TOC, respectively, suggesting that the organic matter in it belongs to lacustrine type I. The vitrinite reflectance of the oil shale sample is 0.46%, indicating a low maturity. In the view of macerals, vitrinite, inertinite, liptinite and solid bitumen were observed in the studied sample (Figure 4). Among them, solid bitumen (55%) is the most, followed by inertinite (21%), liptinite (15%) and vitrinite (9%) (Table 3).
Table 2.
Geochemical parameters of the studied sample.
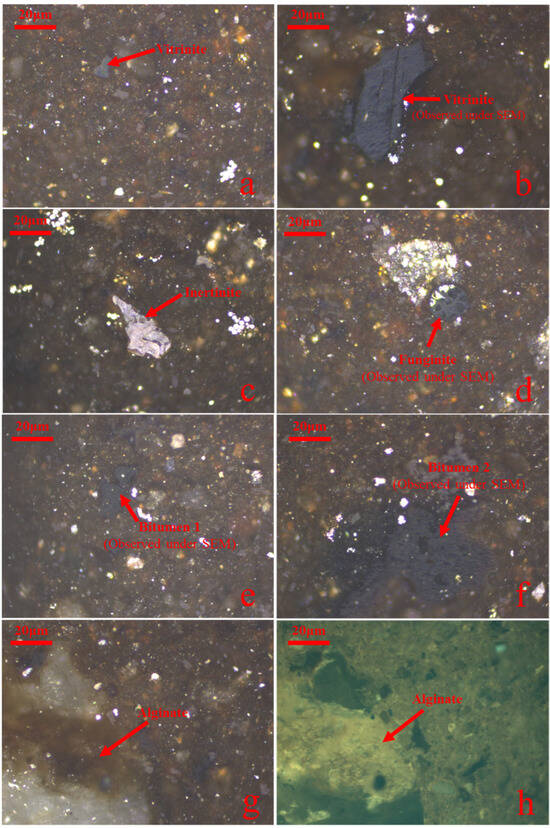
Figure 4.
Photomicrographs of the dominant macerals in the initial sample. (All the images are in oil immersion. (a) Vitrinite, incident white light. (b) Vitrinite observed during thermal simulation, incident white light. (c) Inertinite, incident white light. (d) Funginite observed during thermal simulation, incident white light. (e) Solid bitumen observed during thermal simulation, incident white light. (f) Solid bitumen observed during thermal simulation, incident white light. (g) Alginite, incident white light. (h) The same field as (g), Alginite, blue light fluorescence).
Table 3.
Maceral composition of the studied sample.
4.2. SEM Images and Pore Diameters
A piece of vitrinite (Figure 4b), a piece of funginite (Figure 4d), and two pieces of solid bitumen (Figure 4e,f) were observed in detail while being heated and the pores in each SEM image were analyzed using the JMicrovision 1.3.2 software. Two pieces of solid bitumen were observed during the thermal simulation. There is no obvious difference in optical properties between the two pieces of solid bitumen, but the chemical composition may be different. The first one was shown in Figure 4e, called solid bitumen 1 in this study. Another one was shown in Figure 4f, recorded as solid bitumen 2. Most of the SEM images taken in the heating process are shown in the supplemental file. Here, we only describe parts of SEM images of solid bitumen 1.
At 30,000× instrument magnification, pores in solid bitumen 1 became visible at 417.8 °C (Figure 5b), and the porosity increased slowly in the temperature range of 417.8–553 °C (Figure 5b–e) but increased quickly when the heating temperature rose from 602 °C to 700.8 °C (Figure 5f–h). The number of pores increased initially and decreased finally because they became connected with each other (Figure 5h), and the average pore diameter kept increasing during the simulation (Figure 5h).
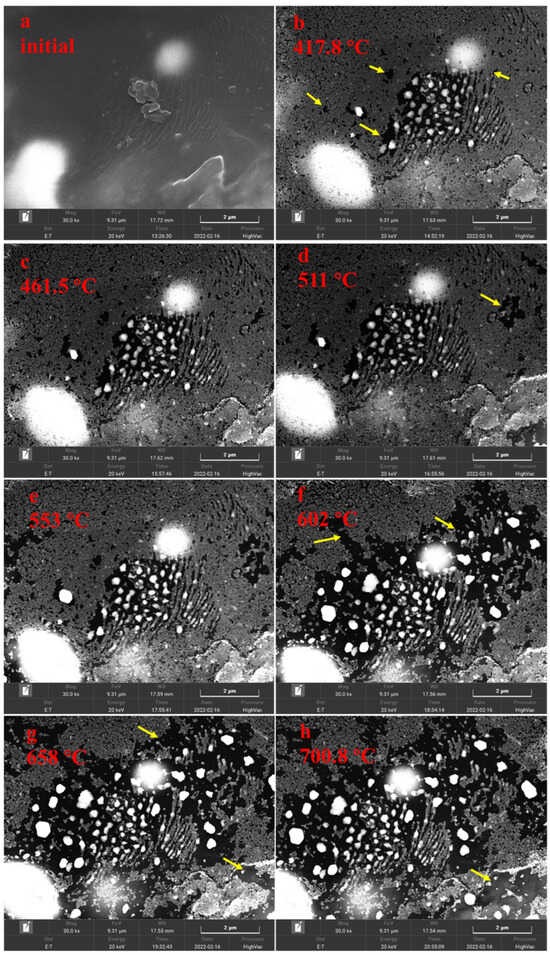
Figure 5.
SEM images of solid bitumen 1 at 30,000× instrument magnification during heating simulation ((a) initial, (b) 417.8 °C, (c) 461.5 °C, (d) 511 °C, (e) 553 °C, (f) 602 °C, (g) 658 °C, (h) 700.8 °C).
When the heating temperature was set at 417.8 °C, the overview of solid bitumen 1 can be seen at 5000× instrument magnification, and only a few pores were observed. Several cracks appeared between the edges of solid bitumen 1 and minerals around it (Figure 6a). At 10,000× instrument magnification, we found some pores in the middle of visible field (Figure 6b). At 30,000× instrument magnification, more pores were seen, and pores in the middle of this image were larger than those near the edge (Figure 6c). At 100,000× instrument magnification, the sizes of pores were measured, they are between 80nm and 300nm (Figure 6d).
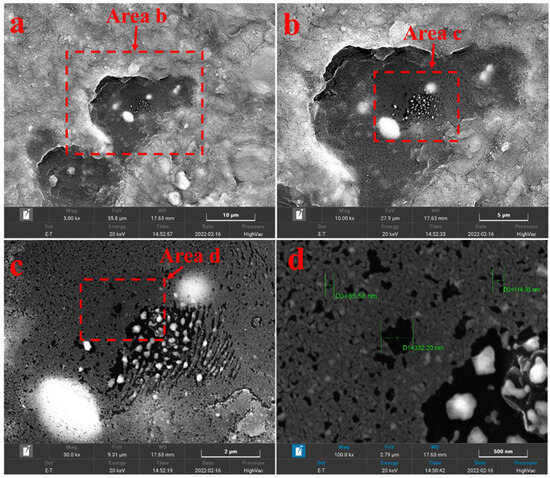
Figure 6.
SEM images of solid bitumen 1 at the heating temperature of 417.8 °C ((a) 5000× magnification, (b) 10,000× magnification, (c) 30,000× magnification, (d) 100,000× magnification).
4.3. Surface Porosity
The surface porosities of the observed vitrinite, funginite, solid bitumen 1, and solid bitumen 2 are in the ranges of 0%–61.34%, 0%–86.66%, 0%–90.41%, and 0%–65.41%, respectively (Table 4, Table 5, Table 6 and Table 7). For almost all observed areas, surface porosity increased with the heating temperature (Table 4, Table 5, Table 6 and Table 7).
Table 4.
Surface porosities of the observed vitrinite.
Table 5.
Surface porosities of the observed funginite.
Table 6.
Surface porosities of solid bitumen 1.
Table 7.
Surface porosities of solid bitumen 2.
5. Discussion
5.1. Organic Pores Evolution
Organic pores were generally considered to be formed due to petroleum generation [20,21]. As a logical consequence, organic pores should increase and enlarge with the increasing maturation of organic matter. All the surface porosity lines increased during thermal simulation in this study (Figure 4), which is consistent with the knowledge above. Some investigators argued that organic pores increased initially but then decreased when maturation reached 3.5%Ro [60], and 4.0%Ro was considered to be the upper limit of organic pores based on the data from the Longmaxi shales in the Sichuan Basin, China [44]. Our results at these limits show an increase in pores with increasing temperature. The results of Chen and Xiao [60] were based on the powdered samples obtained from thermal simulation. Tenger et al. [44] did not show the SEM images to support their argument.
Moreover, there are some cases where organic porosity increased in natural shale samples with very high maturities. Curtis et al. [33] investigated the development of organic porosity in the Woodford shale with increasing thermal maturity using natural shale samples. Their results showed an increase to 3.6%Ro. Although a decrease occurred at the maturity of 6.36%Ro (the highest Ro value in their study), there were not any samples with maturities between 3.6%Ro and 6.36%Ro in their study. Therefore, based on the results herein, the mature threshold should be in the range of 3.6%–6.36%, and the increasing organic porosity in our experiment with a maturity range of 1.00%–3.70% may be consistent with the natural shale samples.
The kerogen samples with vitrinite reflectance values between 1.25% and 3.90% from marine-continental transitional shales in the Qinshui Basin, northern China had a continuous increase in pore volume [61]. For the Lower Silurian Longmaxi shale in the Sichuan Basin of China, organic porosity increased with the rise in thermal maturity until 3.5%Ro [44,62]. These works support our results that organic porosity has a continuous increase in the calculated Ro range of 1.00%–3.70%.
In terms of the mechanism of organic pore formation at high maturities (2.0%Ro–3.70%Ro), we attribute it to gas generation. The pyrolysis experiments performed on coal samples with different maturities showed that the upper thermal maturity limit of gas generation was about 5.0%Ro [63]. The corresponding limit of marine kerogen was around 3.5%Ro [64]. Hence, it is possible that the studied macerals are producing gas at the highest Ro value of 3.70% and organic pores can also be induced.
Most of the organic pores were observed in shales with a gas window maturity. Therefore, organic pores were considered to be related to gas generation [65]. Lots of Organic matter pores were formed when vitrinite reflectance reached ~1.3%, the onset of gas window [31], which was also attributed to gas generation. However, at 1.35%EasyRo, organic pores did not increase significantly in our sample (Figure 7). There is a distinct difference in surface porosity between various magnifications (Figure 7). The surface porosity line increased with the increasing magnification for each maceral (Figure 7). These changes indicate that pores in the marcels have an uneven development. On the other hand, bigger pores (>300 nm) were observed under low magnification (Figures S4 and S6), while smaller pores (<300 nm) were seen under high magnification (Figures S8, S10 and S12). Therefore, to characterize the general surface porosity of each maceral, we averaged the values of various magnifications and plotted them in Figure 8. There are two rapid growth points for each researched maceral. For vitrinite, they are 1.00%EasyRo and 3.00%EasyRo. For funginite, they are 1.00%EasyRo and 2.39%EasyRo. For solid bitumen 1, they are 1.00%EasyRo and 3.00%EasyRo. For solid bitumen 2, they are 1.00%EasyRo and 3.49%EasyRo (Figure 8). Between these two points, surface porosities increased relatively slowly (Figure 8). By careful examination of the SEM images, it was found that pores in the vitrinite initially formed at the rim between itself and the clay mineral (Figures S9b–d and S11a,b), which may be related to the catalysis of clay minerals [18], because clay mineral can catalyze gas generation under laboratory heating experiments [66]. Then, as maturation increased the parts far from the rim also formed pores (Figures S9e–h and S11c–g). Pores in funginite initially increased in the heating temperature range of 417.8–461.5 °C (Figures S17b,c and S19a,b), and then the pores became connected with each other (Figures S17d–h and S19c–g), which resulted in a decrease in the number of pores and the pores were larger (Figure S20h). Pores in solid bitumen 1 and solid bitumen 2 initially were seen sporadically (Figure 9b–e, Figures S25a–d, S33b,c and S35a,b), and when heating temperature reached one threshold (e.g., 602 °C for solid bitumen 1) pores were connected with each other and surface porosity increased quickly (Figure 5f–h, Figures S25e–g, S33d–h and S35c–g).
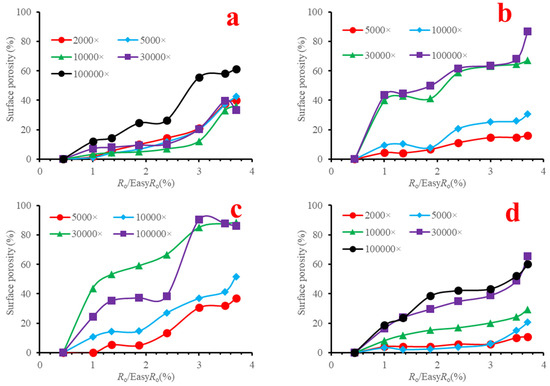
Figure 7.
Surface porosities with the increasing maturation ((a) vitrinite, (b) funginite, (c) solid bitumen 1, (d) solid bitumen 2).
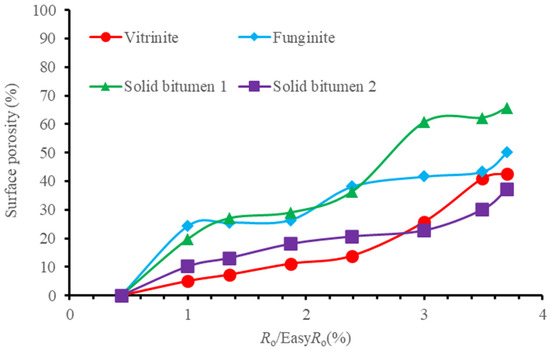
Figure 8.
The average lines of surface porosities at various magnifications of macerals with the increasing maturation.
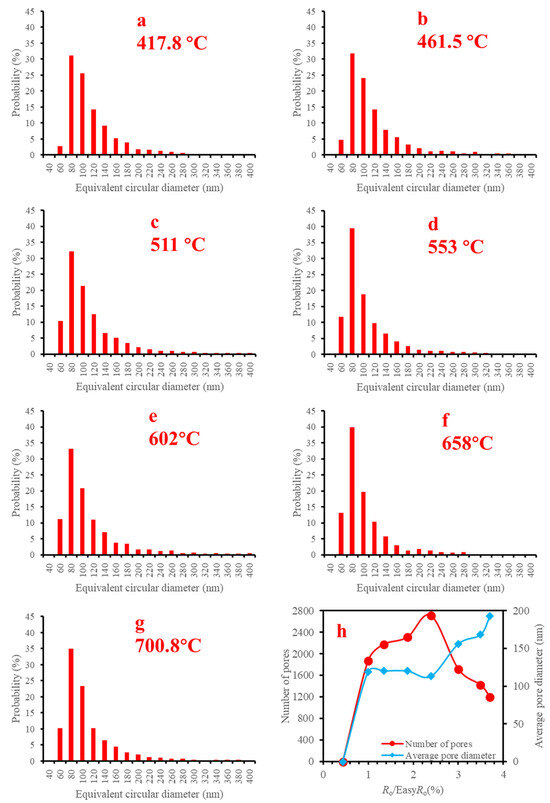
Figure 9.
Histograms of equivalent circular diameter, numbers and average pore diameters of organic matter pores in the SEM images at 30,000× instrument magnification of solid bitumen 1 during heating simulation ((a) 417.8 °C, (b) 461.5 °C, (c) 511 °C, (d) 553 °C, (e) 602 °C, (f) 658 °C, (g) 700.8 °C, (h) number of pores and average pore diameter with the increasing maturation).
Take the images of 30,000× magnification as examples, there exists a general trend that the numbers of pores decreased while the average pore diameters increased for the studied macerals (Figure 10), which is due to the pores becoming connected with each other with the increasing maturity. This explanation is supported by the SEM images (e.g., Figure 5e–h, Figures S9e–h, S11d–g, S19a–g, S25a–g, S31c–h, S33c–h and S35b–g).
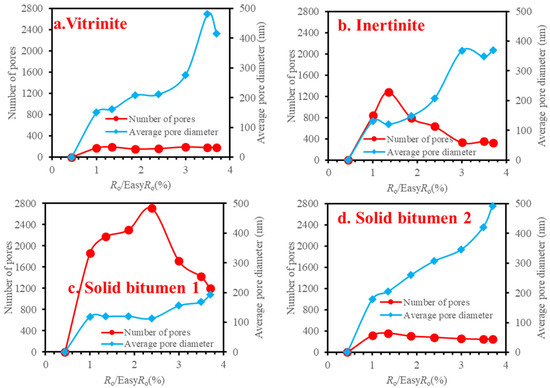
Figure 10.
The numbers and average pore diameters of organic matter pores in the SEM images at 30,000× instrument magnification during heating simulation.
The evolution models of organic matter pores in macerals investigated in this study can be used to predict organic pores in geological settings. However, it should be noted that the results may be rough because many conditions have not been considered in our simulation, such as pressure and liquids.
5.2. Effects of Macerals on Organic Pores
Within the four pieces of macerals, solid bitumen 1 was relatively more porous (Figure 9), which may be related to solid bitumen was more easily thermally degraded [67] than other macerals. This point is consistent with most of the published data [18,22,44]. However, the surface porosity of solid bitumen 2 is far lower than solid bitumen 1, which may be attributed to the difference in chemical composition between them. The previous works believe that vitrinite and inertinite almost have no pores [22,68]. However, organic pores were seen in vitrinite and funginite from our sample (Figures S11b–h and S17b–h). This case may be attributed to the organic matter in the thermal simulation, which was heated at a much higher temperature than the subsurface. High temperature-induced pores in the macerals (vitrinite and funginite) with low hydrocarbon potential. It should be noted that funginite is more aliphatic than vitrinite [69]. Therefore, it can generate gas during thermal simulation and pores could be formed. It can be seen that the funginite had more pores than the vitrinite at all the heating temperatures (Figure 8). A few studies argued that vitrinite had more big pores than inertinite [70,71,72]. Moreover, inertinite was considered to be less porous than vitrinite [41]. This case could be illustrated that funginite is one special inertinite, it is not the product of plant organisms [73] and has more hydrocarbon potential than vitrinite [69].
There were no pores in the left lower and right upper parts of the original funginite (Figure S13a). When it was heated at 461.5 °C several big pores appeared in the two parts mentioned above (Figure S13c). We speculate these pores belong to cellular structures that could not be observed in the original funginite due to the filled solid bitumen (Figure S13a,b). When it was heated at 461.5 °C, the filled solid bitumen was volatilized (Figure S13c), resulting in the appearance of original pores in the piece of funginite. There are two pieces of evidence supporting this speculation. First, these cellular structure pores had no changes in size during the heating process. Second, organic pores in the funginite likely resulting from hydrocarbon generation increased and became larger with the increasing heating temperature (Figure S17b–h). Actually, cellular lumens were observed in funginite and fusinite (inertinitic maceral) [19,74,75], which were recognized as primary pores. More organic pores were seen after Soxhlet extraction using organic solvent [19], also supporting our explanation above.
5.3. Organic Matter- Hosted Cracks
Cracks were observed in our sample, and the vitrinite relatively has more cracks than other pieces (Figure S3). There are two types of cracks related to vitrinite, including (a) the cracks localized at the contacts between organic matter (vitrinite and funginite) and inorganic minerals (Figures S3d–h and S13c–h); and (b) cracks within the vitrinite (Figure S3e–h). There were no cracks related to solid bitumen in the studied sample; however, Katz and Arango [23] observed cracks between solid bitumen and minerals. The first type of cracks was considered to be formed by the differential heat transfer between organic matter and inorganic minerals [35,76]. The cracks within organic matter were only found in the piece of vitrinite in our study (Figure S3d–h). Ting [77] argued that vitrinite generally had more cracks than other macerals. Cracks within organic matter were also found in many previous works [29,65,78]; most researchers believed that cracks within organic matter were induced by hydrocarbon generation in the absence of pressure constraint [33,79]. It is well known that vitrinite has a very low hydrocarbon generation potential [67]. Therefore, we speculate that the crack in the vitrinite of our sample was not mainly induced by hydrocarbon generation. It may be related to stiffness and brittleness because it was reported that vitrinite was stiffer than solid bitumen [80].
5.4. Implications
Most reported organic pores in natural shale samples were bubble-like or sponge-like [18,23,81,82]. However, the pores shown in this study were almost irregular (Figures S9, S19, S25 and S33). The difference in pore shapes between natural samples and the simulated sample in this study may reflect that the formation of organic matter pores was not only controlled by temperature but also influenced by pressure from overburden and liquids in the subsurface [18,83]. Unfortunately, the current system combining heating and imaging cannot consider pressure, but the results from the system enable us to improve our understanding of the mechanism of organic pore development.
It should be noted that the surface porosities obtained from various magnifications (i.e., 2000×, 5000×, 10,000×, 30,000×, and 100,000×) have significant differences (Table 4, Table 5, Table 6 and Table 7, and Figure 7). With the increasing magnification, surface porosity increased clearly, suggesting pores in organic matter were heterogeneous even for a specific piece of maceral. Similar heterogeneities were also observed in natural samples [33,84].
Our experimental results showed us the typical phenomena of organic pores’ appearance and changes, but several other artificial thermal simulations did not. For example, Gao et al. [47] observed there were no changes in organic matter during the period of being heated. They put a piece of shale sample in the corresponding crushed sample, then the mixed sample was heated in an open thermal simulation system. We speculated that the piece of shale sample was not heated effectively in their experiment; therefore, no organic pores were formed. Yuan and Yang [48] did not observe the formation of many organic pores through experiments using a system combining heating and SEM imaging. Maybe the macerals in their study were not correctly identified. Another possibility is that the equipment they used cannot simulate the forming process of organic matter pores effectively because this technique is quite new and still immature at the moment.
6. Conclusions
This study showed the formation of pores in several macerals from an experiment conducted in an SEM instrument with a heating core. Our observations allow us to draw the following conclusions. Owing to the small number of macerals, our conclusions need to be viewed with some degree of caution.
(1) During heating, pores in all the studied macerals (vitrinite, funginite, and solid bitumen) became more and larger from 1.00%EasyRo to 3.70%EasyRo. Organic pores were isolated initially, but then were connected with each other, resulting in the increase in surface porosity and pore size. The surface porosities of vitrinite, funginite, and solid bitumen reached 42.67%, 50.13%, and 65.73%, respectively, at the end of the heating.
(2) Among the studied macerals, solid bitumen was more porous during the whole heating process, which may be related to solid bitumen having more labile carbon-to-carbon bonds with higher HI than other vitrinite and funginite. Some primary pores in the funginite were observed when the filled solid bitumen was volatilized. More cracks were seen in the vitrinite than in other macerals, which may be related to that vitrinite is stiffer and more brittle. It should be noted that the pore development in one maceral may be very different from piece to piece. To establish a general model for each maceral, more observations should be conducted.
(3) Combined thermal heating and SEM imaging is a very new method of investigating the formation of organic pores in shales, and it is still a new technique. Some researchers did not observe organic pores in their simulations, which may be caused by low heating efficiency and misidentified macerals. Although our results provide implications for the formation mechanism of organic pores, more experimental work is needed to improve the method of combining thermal heating and SEM imaging in the future.
Supplementary Materials
The following supporting information can be downloaded at https://www.mdpi.com/article/10.3390/min15040336/s1, Figure S1: (a) Location of the Huadian Basin within China; (b) location of the Huadian Basin within Dunhua-Mishan Fault Zone; (c) the geological map of Huadian Basin (modified from reference1); Figure S2: Stratigraphic column of Huadian Formation in the Huadian Basin (modified from reference1); Figure S3: SEM images at 2000× instrument magnification of the vitrinite during heating simulation ((a) initial, (b) 417.8 °C, (c) 461.5 °C, (d) 511 °C, (e) 553 °C, (f) 602 °C, (g) 658 °C, (h) 700.8 °C); Figure S4: Histograms of equivalent circular diameter, numbers and average pore diameters of organic matter pores in the SEM images at 2000× instrument magnification of the vitrinite during heating simulation ((a) 417.8 °C, (b) 461.5 °C, (c) 511 °C, (d) 553 °C, (e) 602 °C, (f) 658 °C, (g) 700.8 °C, (h) number of pores and average pore diameter with the increasing maturation); Figure S5: SEM images at 5000× instrument magnification of the vitrinite during heating simulation ((a) initial, (b) 417.8 °C, (c) 461.5 °C, (d) 511 °C, (e) 553 °C, (f) 602 °C, (g) 658 °C, (h) 700.8 °C); Figure S6: Histograms of equivalent circular diameter, numbers and average pore diameters of organic matter pores in the SEM images at 5000× instrument magnification of the vitrinite during heating simulation ((a) 417.8 °C, (b) 461.5 °C, (c) 511 °C, (d) 553 °C, (e) 602 °C, (f) 658 °C, (g) 700.8 °C, (h) number of pores and average pore diameter with the increasing maturation); Figure S7: SEM images at 10,000× instrument magnification of the vitrinite during heating simulation ((a) initial, (b) 417.8 °C, (c) 461.5 °C, (d) 511 °C, (e) 553 °C, (f) 602 °C, (g) 658 °C, (h) 700.8 °C); Figure S8: Histograms of equivalent circular diameter, numbers and average pore diameters of organic matter pores in the SEM images at 10,000× instrument magnification of the vitrinite during heating simulation ((a) 417.8 °C, (b) 461.5 °C, (c) 511 °C, (d) 553 °C, (e) 602 °C, (f) 658 °C, (g) 700.8 °C, (h) number of pores and average pore diameter with the increasing maturation); Figure S9: SEM images at 30,000× instrument magnification of the vitrinite during heating simulation ((a) initial, (b) 417.8 °C, (c) 461.5 °C, (d) 511 °C, (e) 553 °C, (f) 602 °C, (g) 658 °C, (h) 700.8 °C); Figure S10: Histograms of equivalent circular diameter, numbers and average pore diameters of organic matter pores in the SEM images at 30,000× instrument magnification of the vitrinite during heating simulation ((a) 417.8 °C, (b) 461.5 °C, (c) 511 °C, (d) 553 °C, (e) 602 °C, (f) 658 °C, (g) 700.8 °C, (h) number of pores and average pore diameter with the increasing maturation); Figure S11: SEM images at 100,000× instrument magnification of the vitrinite during heating simulation ((a) 417.8 °C, (b) 461.5 °C, (c) 511 °C, (d) 553 °C, (e) 602 °C, (f) 658 °C, (g) 700.8 °C); Figure S12: Histograms of equivalent circular diameter, numbers and average pore diameters of organic matter pores in the SEM images at 100,000× instrument magnification of the vitrinite during heating simulation ((a) 417.8 °C, (b) 461.5 °C, (c) 511 °C, (d) 553 °C, (e) 602 °C, (f) 658 °C, (g) 700.8 °C, (h) number of pores and average pore diameter with the increasing maturation); Figure S13: SEM images at 5000× instrument magnification of the funginite during heating simulation ((a) initial, (b) 417.8 °C, (c) 461.5 °C, (d) 511 °C, (e) 553 °C, (f) 602 °C, (g) 658 °C, (h) 700.8 °C); Figure S14: Histograms of equivalent circular diameter, numbers and average pore diameters of organic matter pores in the SEM images at 5000× instrument magnification of the funginite during heating simulation ((a) 417.8 °C, (b) 461.5 °C, (c) 511 °C, (d) 553 °C, (e) 602 °C, (f) 658 °C, (g) 700.8 °C, (h) number of pores and average pore diameter with the increasing maturation); Figure S15: SEM images at 10,000× instrument magnification of the funginite during heating simulation ((a) initial, (b) 417.8 °C, (c) 461.5 °C, (d) 511 °C, (e) 553 °C, (f) 602 °C, (g) 658 °C, (h) 700.8 °C); Figure S16: Histograms of equivalent circular diameter, numbers and average pore diameters of organic matter pores in the SEM images at 10,000× instrument magnification of the funginite during heating simulation ((a) 417.8 °C, (b) 461.5 °C, (c) 511 °C, (d) 553 °C, (e) 602 °C, (f) 658 °C, (g) 700.8 °C, (h) number of pores and average pore diameter with the increasing maturation); Figure S17: SEM images at 30,000× instrument magnification of the funginite during heating simulation ((a) initial, (b) 417.8 °C, (c) 461.5 °C, (d) 511 °C, (e) 553 °C, (f) 602 °C, (g) 658 °C, (h) 700.8 °C); Figure S18: Histograms of equivalent circular diameter, numbers and average pore diameters of organic matter pores in the SEM images at 30,000× instrument magnification of the funginite during heating simulation ((a) 417.8 °C, (b) 461.5 °C, (c) 511 °C, (d) 553 °C, (e) 602 °C, (f) 658 °C, (g) 700.8 °C, (h) number of pores and average pore diameter with the increasing maturation); Figure S19: SEM images at 100,000× instrument magnification of the funginite during heating simulation ((a) 417.8 °C, (b) 461.5 °C, (c) 511 °C, (d) 553 °C, (e) 602 °C, (f) 658 °C, (g) 700.8 °C); Figure S20: Histograms of equivalent circular diameter, numbers and average pore diameters of organic matter pores in the SEM images at 100,000× instrument magnification of the funginite during heating simulation ((a) 417.8 °C, (b) 461.5 °C, (c) 511 °C, (d) 553 °C, (e) 602 °C, (f) 658 °C, (g) 700.8 °C, (h) number of pores and average pore diameter with the increasing maturation); Figure S21: SEM images at 5000× instrument magnification of solid bitumen 1 during heating simulation ((a) initial, (b) 417.8 °C, (c) 461.5 °C, (d) 511 °C, (e) 553 °C, (f) 602 °C, (g) 658 °C, (h) 700.8 °C); Figure S22: Histograms of equivalent circular diameter, numbers and average pore diameters of organic matter pores in the SEM images at 5000× instrument magnification of solid bitumen 1 during heating simulation ((a) 417.8 °C, (b) 461.5 °C, (c) 511 °C, (d) 553 °C, (e) 602 °C, (f) 658 °C, (g) 700.8 °C, (h) number of pores and average pore diameter with the increasing maturation); Figure S23: SEM images at 10,000× instrument magnification of solid bitumen 1 during heating simulation ((a) initial, (b) 417.8 °C, (c) 461.5 °C, (d) 511 °C, (e) 553 °C, (f) 602 °C, (g) 658 °C, (h) 700.8 °C); Figure S24: Histograms of equivalent circular diameter, numbers and average pore diameters of organic matter pores in the SEM images at 10,000× instrument magnification of solid bitumen 1 during heating simulation ((a) 417.8 °C, (b) 461.5 °C, (c) 511 °C, (d) 553 °C, (e) 602 °C, (f) 658 °C, (g) 700.8 °C, (h) number of pores and average pore diameter with the increasing maturation); Figure S25: SEM images at 100,000× instrument magnification of solid bitumen 1 during heating simulation ((a) 417.8 °C, (b) 461.5 °C, (c) 511 °C, (d) 553 °C, (e) 602 °C, (f) 658 °C, (g) 700.8 °C); Figure S26: Histograms of equivalent circular diameter, numbers and average pore diameters of organic matter pores in the SEM images at 100,000× instrument magnification of solid bitumen 1 during heating simulation ((a) 417.8 °C, (b) 461.5 °C, (c) 511 °C, (d) 553 °C, (e) 602 °C, (f) 658 °C, (g) 700.8 °C, (h) number of pores and average pore diameter with the increasing maturation); Figure S27: SEM images at 2000× instrument magnification of solid bitumen 2 during heating simulation ((a) initial, (b) 417.8 °C, (c) 461.5 °C, (d) 511 °C, (e) 553 °C, (f) 602 °C, (g) 658 °C, (h) 700.8 °C); Figure S28: Histograms of equivalent circular diameter, numbers and average pore diameters of organic matter pores in the SEM images at 2000× instrument magnification of solid bitumen 2 during heating simulation ((a) 417.8 °C, (b) 461.5 °C, (c) 511 °C, (d) 553 °C, (e) 602 °C, (f) 658 °C, (g) 700.8 °C, (h) number of pores and average pore diameter with the increasing maturation); Figure S29: SEM images at 5000× instrument magnification of solid bitumen 2 during heating simulation ((a) initial, (b) 417.8 °C, (c) 461.5 °C, (d) 511 °C, (e) 553 °C, (f) 602 °C, (g) 658 °C, (h) 700.8 °C); Figure S30: Histograms of equivalent circular diameter, numbers and average pore diameters of organic matter pores in the SEM images at 5000× instrument magnification of solid bitumen 2 during heating simulation ((a) 417.8 °C, (b) 461.5 °C, (c) 511 °C, (d) 553 °C, (e) 602 °C, (f) 658 °C, (g) 700.8 °C, (h) number of pores and average pore diameter with the increasing maturation); Figure S31: SEM images at 10,000× instrument magnification of solid bitumen 2 during heating simulation ((a) initial, (b) 417.8 °C, (c) 461.5 °C, (d) 511 °C, (e) 553 °C, (f) 602 °C, (g) 658 °C, (h) 700.8 °C); Figure S32: Histograms of equivalent circular diameter, numbers and average pore diameters of organic matter pores in the SEM images at 10,000× instrument magnification of solid bitumen 2 during heating simulation ((a) 417.8 °C, (b) 461.5 °C, (c) 511 °C, (d) 553 °C, (e) 602 °C, (f) 658 °C, (g) 700.8 °C, (h) number of pores and average pore diameter with the increasing maturation); Figure S33: SEM images at 30,000× instrument magnification of solid bitumen 2 during heating simulation ((a) initial, (b) 417.8 °C, (c) 461.5 °C, (d) 511 °C, (e) 553 °C, (f) 602 °C, (g) 658 °C, (h) 700.8 °C); Figure S34: Histograms of equivalent circular diameter, numbers and average pore diameters of organic matter pores in the SEM images at 30,000× instrument magnification of solid bitumen 2 during heating simulation ((a) 417.8 °C, (b) 461.5 °C, (c) 511 °C, (d) 553 °C, (e) 602 °C, (f) 658 °C, (g) 700.8 °C, (h) number of pores and average pore diameter with the increasing maturation); Figure S35: SEM images at 100,000× instrument magnification of solid bitumen 2 during heating simulation ((a) 417.8 °C, (b) 461.5 °C, (c) 511 °C, (d) 553 °C, (e) 602 °C, (f) 658 °C, (g) 700.8 °C); Figure S36: Histograms of equivalent circular diameter, numbers and average pore diameters of organic matter pores in the SEM images at 100,000× instrument magnification of solid bitumen 2 during heating simulation ((a) 417.8 °C, (b) 461.5 °C, (c) 511 °C, (d) 553 °C, (e) 602 °C, (f) 658 °C, (g) 700.8 °C, (h) number of pores and average pore diameter with the increasing maturation).
Author Contributions
Conceptualization, H.H.; methodology, H.H.; software, C.H., S.X. and J.C.; investigation, H.H.; resources, H.H.; data curation, C.H., W.W., Y.W. and J.W.; writing-original draft preparation, H.H.; writing-review and editing, A.K.; supervision, H.H.; funding acquisition, H.H. All authors have read and agreed to the published version of the manuscript.
Funding
This project was funded by the Natural Science Foundation of Sichuan Province (2024NSFSC0088), National Science Foundation of China (41972161) and Science and Technology Cooperation Project of the CNPC-SWPU Innovation Alliance (2020CX050103).
Data Availability Statement
Data are contained within the article and supplementary materials.
Acknowledgments
The authors would like to thank the associate editor for her precious time to hand this paper. Three anonymous reviewers are acknowledged for their constructive comments and suggestions, which help us improve this paper significantly.
Conflicts of Interest
The authors declare no conflicts of interest.
References
- Curtis, J.B. Fractured shale-gas systems. AAPG Bull. 2002, 86, 1921–1938. [Google Scholar] [CrossRef]
- Ross, D.J.K.; Bustin, R.M. The importance of shale composition and pore structure upon gas storage potential of shale gas reservoirs. Mar. Pet. Geol. 2009, 26, 916–927. [Google Scholar] [CrossRef]
- Slatt, R.M.; O’Brien, N.R. Pore types in the Barnett and Woodford gas shales: Contribution to understanding gas storage and migration pathways in fine-grained rocks. AAPG Bull. 2011, 95, 2017–2030. [Google Scholar] [CrossRef]
- Chalmers, G.R.L.; Bustin, R.M.; Power, I.M. Characterization of gas shale pore systems by porosimetry, pycnometry, surface area, and field emission scanning electron microscopy/transmission electron microscopy image analyses: Examples from the Barnett, Woodford, Haynesville, Marcellus, and Doig units. AAPG Bull. 2012, 96, 1099–1119. [Google Scholar] [CrossRef]
- Clarkson, C.R.; Solano, N.; Bustin, R.M.; Bustin, A.M.M.; Chalmers, G.R.; He, L.; Melnichenko, Y.B.; Radliński, A.P.; Blach, T.P. Pore structure characterization of North American shale gas reservoirs using USANS/SANS, gas adsorption, and mercury intrusion. Fuel 2013, 103, 606–616. [Google Scholar] [CrossRef]
- Mastalerz, M.; Schimmelmann, A.; Drobniak, A.; Chen, Y. Porosity of Devonian and Mississippian New Albany Shale across a maturation gradient: Insights from organic petrology, gas adsorption, and mercury intrusion. AAPG Bull. 2013, 97, 1621–1643. [Google Scholar] [CrossRef]
- Tian, H.; Pan, L.; Xiao, X.M.; Wilkins, R.W.; Meng, Z.; Huang, B. A preliminary study on the pore characterization of Lower Silurian black shales in the Chuandong thrust fold belt, Southwester China using low pressure N2 adsorption and FE-SEM methods. Mar. Pet. Geol. 2013, 48, 8–19. [Google Scholar] [CrossRef]
- Yang, F.; Ning, Z.; Liu, H. Fractal characteristics of shales from a shale gas reservoir in the Sichuan Basin, China. Fuel 2014, 115, 378–384. [Google Scholar] [CrossRef]
- Han, H.; Zhong, N.N.; Ma, Y.; Huang, C.X.; Wang, Q.; Chen, S.J.; Lu, J.G. Gas storage and controlling factors in an over-mature marine shale: A case study of the Lower Cambrian Lujiaping shale in the Dabashan arc-like thrust–fold belt, southwestern China. J. Nat. Gas Sci. Eng. 2016, 33, 839–853. [Google Scholar] [CrossRef]
- Chandra, D.; Vishal, V. A critical review on pore to continuum scale imaging techniques for enhanced shale gas recovery. Earth-Sci. Rev. 2021, 217, 103638. [Google Scholar] [CrossRef]
- Liu, B.; Mastalerz, M.; Schieber, J. SEM petrography of dispersed organic matter in black shales: A review. Earth-Sci. Rev. 2022, 224, 103874. [Google Scholar]
- Bahadur, J.; Chandra, D.; Das, A.; Vishal, V.; Agrawal, A.K.; Sen, D. Pore anisotropy in shale and its dependence on thermal maturity and organic carbon content: A scanning SAXS study. Int. J. Coal Geol. 2023, 273, 104268. [Google Scholar] [CrossRef]
- Zhang, X.; Zhao, X.M.; Ge, J.W.; Li, S.X.; Zhang, T.S. Karst topography paces the deposition of lower Permian, organic-rich, marine– continental transitional shales in the southeastern Ordos Basin, northwestern China. AAPG Bull. 2024, 108, 849–875. [Google Scholar] [CrossRef]
- Wang, R.Y.; Hu, Z.Q.; Long, S.X.; Liu, G.X.; Zhao, J.H.; Li, D.; Wei, D.; Wang, P.W.; Shuai, Y. Differential characteristics of the Upper Ordovician-Lower Silurian Wufeng-Longmaxi shale reservoir and its implications for exploration and development of shale gas in/around the Sichuan Basin. Acta Geol. Sin. Engl. 2019, 93, 520–535. [Google Scholar]
- Wang, R.Y.; Liu, Y.J.; Li, Z.; Wang, D.H.; Wang, G.P.; Lai, F.Q.; Li, Z.H.; He, J.H. Microscopic pore structure characteristics and controlling factors of marine shale: A case study of Lower Cambrian shales in the Southeastern Guizhou, Upper Yangtze Platform, South China. Front. Earth Sci. 2024, 12, 1368326. [Google Scholar]
- Loucks, R.G.; Reed, R.M.; Ruppel, S.C.; Hammes, U. Spectrum of pore types and networks in mudrocks and a descriptive classification for matrix-related mudrock pores. AAPG Bull. 2012, 96, 1071–1098. [Google Scholar] [CrossRef]
- Strąpoć, D.; Mastalerz, M.; Schimmelmann, A.; Drobniak, A.; Hasenmueller, N.R. Geochemical constraints on the origin and volume of gas in the New Albany shale (Devonian-Mississippian) eastern Illinois basin. AAPG Bull. 2010, 94, 1713–1740. [Google Scholar] [CrossRef]
- Milliken, K.L.; Rudnicki, M.; Awwiller, D.N.; Zhang, T.W. Organic matter-hosted pore system, Marcellus Formation (Devonian), Pennsylvanic. AAPG Bull. 2013, 97, 177–200. [Google Scholar] [CrossRef]
- Löhr, S.C.; Baruch, E.T.; Hall, P.A.; Kennedy, M.J. Is organic pore development in gas shales influenced by the primary porosity and structure of thermally immature organic matter? Org. Geochem. 2015, 87, 119–132. [Google Scholar] [CrossRef]
- Jarvie, D.M.; Hill, R.J.; Ruble, T.E.; Pollastro, R.M. Unconventional shale-gas systems: The Mississippian Barnett shale of north-central Texas as one model for thermogenic shale-gas assessment. AAPG Bull. 2007, 91, 475–499. [Google Scholar] [CrossRef]
- Loucks, R.G.; Reed, R.M.; Ruppel, S.C.; Jarvie, D.M. Morphology, genesis, and distribution of nanometer-scale pores in siliceous mudstones of the Mississippian Barnett Shale. J. Sediment. Res. 2009, 79, 848–861. [Google Scholar] [CrossRef]
- Liu, B.; Schieber, J.; Mastalerz, M. Combined SEM and reflected light petrography of organic matter in the New Albany Shale (Devonian-Mississippian) in the Illinois Basin: A perspective on organic pore development with thermal maturation. Int. J. Coal Geol. 2017, 184, 57–72. [Google Scholar] [CrossRef]
- Katz, B.J.; Arango, I. Organic porosity: A geochemist’s view of the current state of understanding. Org. Geochem. 2018, 123, 1–16. [Google Scholar] [CrossRef]
- Mastalerz, M.; Drobniak, A.; Stankiewicz, A.B. Origin, properties, and implications of solid bitumen in source-rock reservoirs: A review. Int. J. Coal Geol. 2018, 195, 14–36. [Google Scholar] [CrossRef]
- Liu, B.; Schieber, J.; Mastalerz, M. Petrographic and micro-FTIR study of organic matter in the Upper Devonian New Albany Shale during thermal maturation: Implications for kerogen transformation. In Mudstone Diagenesis: Research Perspectives for Shale Hydrocarbon Reservoirs, Seals, and Source Rocks; Camp, W., Milliken, K., Taylor, K., Fishman, N., Hackley, P., Macquaker, J., Eds.; AAPG Memoir: Tulsa, OK, USA, 2019; Volume 120, pp. 165–188. [Google Scholar]
- Pang, P.; Han, H.; Tan, X.C.; Ren, S.M.; Guo, C.; Xie, L.; Zheng, L.L.; Zhu, H.H.; Gao, Y.; Xie, X.H. Organic matter pores in the Chang 7 lacustrine shales from the Ordos Basin and its effect on reflectance measurement. Petrol. Sci. 2023, 20, 60–86. [Google Scholar] [CrossRef]
- Luo, Q.; Zhong, N.; Dai, N.; Zhang, W. Graptolite-derived organic matter in the wufengelongmaxi formations (upper ordovicianelower silurian) of south-eastern chongqing, China: Implications for gas shale evaluation. Int. J. Coal Geol. 2016, 153, 87–98. [Google Scholar]
- Ma, Y.; Zhong, N.; Cheng, L.; Pan, Z.; Dai, N.; Zhang, Y.; Yang, L. Pore structure of the graptolite-derived OM in the Longmaxi Shale, southeastern Upper Yangtze Region, China. Mar. Pet. Geol. 2016, 72, 1–11. [Google Scholar] [CrossRef]
- Ardakani, O.H.; Sanei, H.; Ghanizadeh, A.; Lavoie, D.; Chen, Z.; Clarkson, C.R. Do all fractions of organic matter contribute equally in shale porosity? A case study from Upper Ordovician Utica Shale, southern Quebec, Canada. Mar. Pet. Geol. 2018, 92, 794–808. [Google Scholar] [CrossRef]
- Curtis, M.E.; Cardott, B.J.; Sondergeld, C.H.; Rai, C.S. The development of organic porosity in the woodford shale as a function of thermal maturity. In Proceedings of the SPE Annual Technical Conference and Exhibition, San Antonio, TX, USA, 8–10 October 2012. SPE-160158-MS. [Google Scholar]
- Pommer, M.; Milliken, K. Pore types and pore-size distributions across thermal maturity, Eagle Ford Formation, southern Texas. AAPG Bull. 2015, 99, 1713–1744. [Google Scholar] [CrossRef]
- Han, H.; Pang, P.; Li, Z.L.; Shi, P.T.; Guo, C.; Liu, Y.; Chen, S.J.; Lu, J.G.; Gao, Y. Controls of organic and inorganic compositions on pore structure of lacustrine shales of Chang 7 member from Triassic Yanchang Formation in the Ordos Basin, China. Mar. Pet. Geol. 2019, 100, 270–284. [Google Scholar] [CrossRef]
- Curtis, M.E.; Cardott, B.J.; Sondergeld, C.H.; Rai, C.S. Development of organic porosity in the Woodford Shale with increasing thermal maturity. Int. J. Coal Geol. 2012, 103, 26–31. [Google Scholar]
- Knapp, L.J.; Ardakani, O.H.; Reyes, J.; Ishikawa, K. Early porosity generation in organic-sulfur-rich mudstones. Sci. Rep. 2023, 13, 9904. [Google Scholar] [CrossRef]
- Fishman, N.S.; Hackley, P.C.; Lowers, H.A.; Hill, R.J.; Egenhoff, S.O.; Eberl, D.D.; Blum, A.E. The nature of porosity in organic-rich mudstones of the Upper Jurassic Kimmeridge Clay Formation, North Sea, offshore United Kingdom. Int. J. Coal Geol. 2012, 103, 32–50. [Google Scholar] [CrossRef]
- Dong, T.; He, S.; Chen, M.; Hou, Y.; Guo, X.; Wei, C.; Han, Y.; Yang, R. Quartz types and origins in the Paleozoic Wufeng-Longmaxi Formations, Eastern Sichuan Basin, China: Implications for porosity preservation in shale reservoirs. Mar. Pet. Geol. 2019, 106, 62–73. [Google Scholar] [CrossRef]
- Knapp, L.J.; Ardakani, O.H.; Uchida, S.; Nanjo, T.; Otomo, C.; Hattori, T. The influence of rigid matrix minerals on organic porosity and pore size in shale reservoirs: Upper Devonian Duvernay Formation, Alberta, Canada. Int. J. Coal Geol. 2020, 227, 103525. [Google Scholar] [CrossRef]
- Modica, C.J.; Lapierre, S.G. Estimation of kerogen porosity in source rocks as a function of thermal transformation: Example from the Mowry shale in the Powder River basin of Wyoming. AAPG Bull. 2012, 96, 87–108. [Google Scholar] [CrossRef]
- Romero-Sarmiento M., F.; Ducros, M.; Carpentier, B.; Lorant, F.; Cacas, M.; Pegaz-Fiornet, S.; Wolf, S.; Rohais, S.; Moretti, I. Quantitative evaluation of TOC, organic porosity and gas retention distribution in a gas shale play using petroleum system modeling: Application to the Mississippian Barnett shale. Mar. Pet. Geol. 2013, 45, 315–330. [Google Scholar] [CrossRef]
- Chen, Z.; Jiang, C. A revised method for organic porosity estimation in shale reservoirs using Rock-Eval data: Example from Duvernay Formation in the Western Canada Sedimentary Basin. AAPG Bull. 2016, 100, 405–422. [Google Scholar] [CrossRef]
- Teng, J.; Mastalerz, M.; Hampton, L. Maceral controls on porosity characteristics of lithotypes of Pennsylvanian high volatile bituminous coal: Example from the Illinois Basin. Int. J. Coal Geol. 2017, 172, 80–94. [Google Scholar] [CrossRef]
- Teng, J.; Liu, B.; Mastalerz, M.; Schieber, J. Origin of organic matter and organic pores in the overmature Ordovician-Silurian Wufeng-Longmaxi Shale of the Sichuan Basin, China. Int. J. Coal Geol. 2022, 253, 103970. [Google Scholar]
- Guan, Q.; Lü, X.; Dong, D.; Cai, X. Origin and significance of organic-matter pores in Upper ordovician wufeng-lower Silurian Longmaxi mudstones, Sichuan basin. J. Petrol. Sci. Eng. 2019, 176, 554–561. [Google Scholar] [CrossRef]
- Borjigin, T.; Lu, L.F.; Yu, L.J.; Zhang, W.T.; Pan, A.Y.; Shen, B.J.; Wang, Y.; Yang, Y.F.; Gao, Z.W. Formation, preservation and connectivity control of organic pores in shale. Petrol. Explor. Develop. 2021, 48, 798–812. [Google Scholar] [CrossRef]
- Castagna, M.; Goergen, E.; Skinner, K.; Dahl, J.E. Utilization of an ESEMTM with an embedded heating stage to investigate pyrolosis in immature oil shale. Microsc. Microanal. 2014, 20 (Suppl. 3), 1642–1643. [Google Scholar] [CrossRef]
- Camp, W.K.; Knowles, W.; Hooghan, K.; Ruble, T.E. Microsctructural analysis of the transformation of organic matter during artificial thermal maturation of the Upper Cretaceous Boquillas (Eagle Ford) Formation, Texas, USA. Microsc. Microanal. 2017, 23 (Suppl. 1), 2128–2129. [Google Scholar] [CrossRef]
- Gao, Z.; Xuan, Q.X.; Hu, Q.H.; Jiang, Z.X.; Liu, X.X. Pore structure evolution characteristics of continental shale in China as indicated from thermal simulation experiments. AAPG Bull. 2021, 105, 2159–2180. [Google Scholar] [CrossRef]
- Yuan, Y.; Yang, J.Y. Temperature-driven hydrocarbon generation-expulsion and structural transformation of organic-rich shale assessed by in situ heating SEM. Front. Earth. Sci. 2021, 9, 797760. [Google Scholar] [CrossRef]
- Liu, Z.J.; Meng, Q.T.; Liu, R.; Dong, Q.S. Geochemical characteristics of oil shale of Eocene Jijuntun Formation and its geological significance, Fushun Basin. Acta Petrol. Sin. 2009, 25, 2340–2350. (In Chinese) [Google Scholar]
- Meng, Q.T.; Bruch, A.A.; Sun, G.; Liu, Z.J.; Hu, F.; Sun, P.C. Quantitative reconstruction of Middle and Late Eocene paleoclimate based on palynological records from the Huadian Basin, northeastern China: Evidence for monsoonal influence on oil shale formation. Palaeogeogr. Palaeocl. 2018, 510, 63–77. [Google Scholar] [CrossRef]
- Sun, P.C.; Liu, Z.J.; Meng, Q.T.; Liu, R.; Jia, J.; Hu, X. Effect of the basin-fill features on oil shale formation in Paleogene, Huadian Basin. J. China coal Soc. 2011, 36, 1110–1116, (in Chinese with English abstract). [Google Scholar]
- Sun, P.C.; Sachsenhofer, R.F.; Liu, Z.J.; Strobl, S.A.I.; Meng, Q.T.; Liu, R.; Zhen, Z. Organic matter accumulation in the oil shale- and coal-bearing Huadian Basin (Eocene; NE China). Int. J. Coal Geol. 2013, 105, 1–15. [Google Scholar] [CrossRef]
- Li, S. The developments of Chinese oil shale activities. Oil Shale 2012, 29, 101–102. [Google Scholar] [CrossRef]
- Behar, F.; Beaumont, B.; De, B.; Penteado, H.L. Rock-Eval 6 technology: Performances and developments. Oil Gas Sci. Technol. 2001, 56, 111–134. [Google Scholar] [CrossRef]
- ISO 7404-2; Methods for the Petrographic Analysis of Coals–Part 2: Methods of Preparing Coal Samples. International Organization for Standardization: Geneva, Switzerland, 2009.
- ASTM D7708-14; Standard Test Method for Microscopical Determination of the Reflectance of Vitrinite Dispersed in Sedimentary Rocks. ASTM International: West Conshohocken, PA. USA, 2014. Available online: www.astm.org (accessed on 28 May 2014).
- Sweeney, J.J.; Burnham, A.K. Evaluation of a sample method of vitrinite reflectance based on chemical kinetics. AAPG Bull. 1990, 74, 1559–1570. [Google Scholar]
- Tang, Y.; Jenden, P.D.; Nigrini, A.; Teerman, S.C. Modeling early methane generation in coal. Energ. Fuel. 1996, 10, 659–671. [Google Scholar] [CrossRef]
- Roduit, N. JMICROVISION Version 1.2.7: Image Analysis Toolbox For Measuring And Quantifying Components Of High-Definition Images. 2008. Available online: http://www.jmicrovision.com (accessed on 23 January 2025).
- Chen, J.; Xiao, X.M. Evolution of nanoporosity in organic-rich shales during thermal maturation. Fuel 2014, 129, 173–181. [Google Scholar] [CrossRef]
- Lu, C.; Xiao, X.M.; Gai, H.F.; Feng, Y.; Li, G.; Meng, G.M.; Gao, P. Nanopore structure characteristics and evolution of type III kerogen in marine-continental transitional shales from the Qinshui basin, northern China. Geoenergy Sci. Eng. 2023, 221, 211413. [Google Scholar] [CrossRef]
- Gao, Y.Q.; Cai, X.; Zhang, P.X.; He, G.S.; Gao, Q.F.; Wan, J.Y. Pore characteristics and evolution of Wufeng-Longmaxi Fms shale gas reservoirs in the basin-margin transition zone of SE Chongqing. Nat. Gas Ind. B 2019, 6, 323–332. [Google Scholar] [CrossRef]
- Mi, J.; Zhang, S.C.; Chen, J.P.; He, K.; Liu, K.Y.; Li, X.Q.; Bi, L.N. Upper thermal maturity limit for gas generation from humic coal. Int. J. Coal Geol. 2015, 152, 123–131. [Google Scholar] [CrossRef]
- Mi, J.K.; Zhang, S.C.; Su, J.; He, K.; Zhang, B.; Tian, H.; Li, X.Q. The upper thermal maturity limit of primary gas generated from marine organic matters. Mar. Petrol. Geol. 2018, 89, 120–129. [Google Scholar] [CrossRef]
- Curtis, M.E.; Sondergeld, C.H.; Rai, C.S. Relationship Between Organic Shale Microstructure and Hydrocarbon Generation. In Proceedings of the SPE Unconventional Resources Conference, Woodland, Houston, TX, USA, 10–12 April 2013. SPE Paper 164540. [Google Scholar]
- Tannenbaum, E.; Huizinga, B.J.; Kaplan, I.R. Role of minerals in thermal alteration of organic matter. Part II: A material balance. AAPG Bull. 1986, 70, 1156–1165. [Google Scholar] [CrossRef]
- Tissot, B.P.; Welte, D.H. Petroleum Occurrence and Formation; Springer: Berlin/Heidelberg, Germany, 1984; p. 699. [Google Scholar]
- Chalmers, G.R.; Bustin, R.M. A multidisciplinary approach in determining the maceral (kerogen type) and mineralogical composition of Upper Cretaceous Eagle Ford Formation: Impact on pore development and pore size distribution. Int. J. Coal Geol. 2017, 171, 93–110. [Google Scholar] [CrossRef]
- Dai, S.; Bartley, R.; Bartley, S.; Valentim, B.; Guedes, A.; O’Keefe, J.M.K.; Kus, J.; Mastalerz, M.; Hower, H.C. Organic geochemistry of funginite (Miocene, Eel River, Mendocino County, California, USA) and macrinite (Cretaceous, Inner Mongolia, China). Int. J. Coal Geol. 2017, 179, 60–71. [Google Scholar] [CrossRef]
- Clarkson, C.R.; Bustin, R.M. Variation in micropore capacity and size distribution with composition in bituminous coal of the Western Canadian Sedimentary Basin: Implications for coalbed methane potential. Fuel 1996, 75, 1483–1498. [Google Scholar] [CrossRef]
- Clarkson, C.R.; Bustin, R.M. The effect of pore structure and gas pressure upon the transport properties of coal: A laboratory and modeling study: 1. Isotherms and pore volume distributions. Fuel 1999, 78, 1333–1344. [Google Scholar] [CrossRef]
- Mastalerz, M.; Drobniak, A.; Rupp, J. Meso-and micropore characteristics of coal lithotypes: Implications for CO2 adsorption. Energy Fuel 2008, 22, 4049–4061. [Google Scholar]
- Hower, J.C.; O’keefe, J.M.K.; Watt, M.A.; Pratt, T.J.; Eble, C.F.; Stucker, J.D.; Richardson, A.R.; Kostova, I.J. Notes on the origin of inertinite macerals in coals: Observation on the importance of fungi in the origin of macrinite. Int. J. Coal Geol. 2009, 80, 135–143. [Google Scholar] [CrossRef]
- Milliken, K.L.; Ko, L.T.; Pommer, M.; Marsaglia, K.M. SEM petrography of eastern Mediterranean sapropels: Analogue data for assessing organic matter in oil and gas shales. J. Sediment. Res. 2014, 84, 961–974. [Google Scholar] [CrossRef]
- Yang, C.; Xiong, Y.Q.; Zhang, J.C.; Liu, Y.K.; Chen, C. Comprehensive Understanding of OM-Hosted Pores in Transitional Shale: A Case Study of Permian Longtan Shale in South China Based on Organic Petrographic Analysis, Gas Adsorption, and X-ray Diffraction Measurements. Energy Fuel 2019, 33, 8055–8064. [Google Scholar]
- Meng, Q.; Hao, F.; Tian, J. Origins of non-tectonic fractures in shale. Earth-SCI. Rev. 2021, 222, 103825. [Google Scholar] [CrossRef]
- Ting, F.T. Coal macerals. In Coal Structure; Meyers, R.A., Ed.; Academic Press: New York, NY, USA, 1982; pp. 7–49. [Google Scholar]
- Li, K.J.; Kong, S.Q.; Xia, P.; Wang, X.L. Microstructural characterization of organic matter pores in coal-measure shale. Adv. Geo-Energy Res. 2020, 4, 372–391. [Google Scholar]
- Gao, Z.; Liang, Z.; Hu, Q.; Jiang, Z.; Xuan, Q. A new and integrated imaging and compositional method to investigate the contributions of organic matter and inorganic minerals to the pore spaces of lacustrine shale in China. Mar. Pet. Geol. 2021, 127, 104962. [Google Scholar] [CrossRef]
- Zhao, J.; Zhang, W.; Zhang, D.; Wei, R.; Wang, Y. Influence of geochemical features on the mechanical properties of organic matter in shale. J. Geophys. Res. Sol. Ea. 2020, 125, e2020JB019809. [Google Scholar] [CrossRef]
- Hu, G.; Pang, Q.; Jiao, K.; Hu, C.; Liao, Z. Development of organic pores in the Longmaxi Formation overmature shales: Combined effects of thermal maturity and organic matter composition. Mar. Pet. Geol. 2020, 116, 104314. [Google Scholar] [CrossRef]
- Wang, G. Deformation of organic matter and its effect on pores in mud rocks. AAPG Bull. 2020, 104, 21–36. [Google Scholar] [CrossRef]
- Liu, Y.; Xiong, Y.; Peng, P. Effects of oil expulsion and pressure on nanopore development in highly mature shale: Evidence from a pyrolysis study of the Eocence Maoming oil shale, south China. Mar. Pet. Geol. 2017, 86, 526–536. [Google Scholar]
- Mathia, E.J.; Bowen, L.; Thomas, K.M.; Aplin, A.C. Evolution of porosity and pore type in organic-rich, calcareous, lower Toarcian Posidonia shale. Mar. Pet. Geol. 2016, 75, 117–139. [Google Scholar] [CrossRef]
Disclaimer/Publisher’s Note: The statements, opinions and data contained in all publications are solely those of the individual author(s) and contributor(s) and not of MDPI and/or the editor(s). MDPI and/or the editor(s) disclaim responsibility for any injury to people or property resulting from any ideas, methods, instructions or products referred to in the content. |
© 2025 by the authors. Licensee MDPI, Basel, Switzerland. This article is an open access article distributed under the terms and conditions of the Creative Commons Attribution (CC BY) license (https://creativecommons.org/licenses/by/4.0/).