1. Introduction
Aluminum and its alloys are extensively used across various industries, including high-speed rail, renewable energy vehicles, aerospace, and maritime sectors. Their resistance to corrosion, ease of processing, and recyclability contribute to aluminum’s position as the second most widely used metal worldwide, following iron [
1]. In China, the Hall-Héroult process, employing a cryolite–alumina system, is used to produce aluminum. Overhaul slag, a byproduct during electrolytic cell maintenance, contains waste barrier materials with substantial lithium content (1–3%) [
2], primarily sourced from electrolytes [
3]. This lithium accumulates over time due to the addition of lithium salts to enhance electrolysis efficiency [
4] or from lithium oxide-containing bauxite [
5].
Prolonged contact with electrolyte and molten aluminum results in the gradual degradation of electrolytic cell linings, causing deformation and lithium leakage into the waste barrier material. Annually, China produces 1.25–2.08 million tons of overhaul slag, including 440,000–730,000 tons of lithium-rich waste barrier material [
6], highlighting the importance of lithium recovery for a sustainable aluminum industry and stable lithium supply [
7].
Overhaul slag, mainly composed of waste barrier materials and cathode carbon blocks, is typically leached together for lithium recovery [
8]. However, the complex composition of the slag requires advanced processing techniques for efficient leaching and separation. Selective treatment [
9], which classifies and processes the slag based on its components, enhances resource recovery. Optoelectronic sorting was used to separate waste barrier materials and cathode carbon blocks [
10], with lithium recovery from the latter being well-documented [
11]. In contrast, the extraction of lithium, aluminum, and sodium from waste barrier materials has received less attention. Furthermore, regional variations in material composition highlight the need for customized leaching methods, underscoring the urgency of investigating these processes.
Sulfuric acid leaching has been widely employed to extract lithium from various sources, including lepidolite [
12], spent lithium batteries [
13], and electrolytes in aluminum electrolysis cells [
14,
15]. Under conditions of 1.2 mol/L sulfuric acid, a temperature of 95 °C, a leaching time of 20 min, and a liquid-to-solid ratio of 4:1, lithium extraction from aluminum electrolytic cell electrolytes achieved a rate of 85% [
16]. The lithium-containing overhaul slag was treated with concentrated sulfuric acid, followed by leaching, alkali digestion, caustic treatment, and carbonation to produce battery-grade lithium carbonate. Economic analysis of this process indicated low production costs, highlighting its potential for large-scale implementation [
17]. Additionally, the lithium-containing electrolytes were leached with concentrated sulfuric acid, yielding sodium cryolite and lithium carbonate through a simple and efficient process [
16]. The low cost and availability of sulfuric acid, coupled with its ease of handling in terms of equipment corrosion, make it an attractive option for industrial applications. Given the successful use of sulfuric acid in leaching aluminum electrolysis electrolytes, its potential for leaching waste barrier material from aluminum electrolysis cells is promising. However, systematic research on sulfuric acid leaching of waste barrier material remains limited, highlighting the need for further investigation into the underlying mechanisms.
This study explores the leaching behavior of elements such as lithium, aluminum, silicon, and sodium from waste barrier material using sulfuric acid as the leaching agent under atmospheric pressure. The waste barrier material was thoroughly characterized in terms of its key phases and chemical composition. The effects of sulfuric acid concentration, liquid-to-solid ratio, reaction temperature, and reaction time on the leaching process were systematically investigated. Additionally, the leaching mechanisms of these elements were thoroughly examined. Kinetic models for the leaching of lithium, aluminum, and sodium were developed, and changes in the phase composition, particle size, and surface morphology of the waste barrier material before and after leaching were compared. This research aims to provide both technical and theoretical support for the comprehensive utilization of waste barrier material from aluminum electrolysis cells.
2. Experimental Details
2.1. Materials and Sample Preparation
The waste barrier material used in this study was sourced from a sample (96% pass 200 mesh) processed after an intelligent sorting system at a solid waste treatment facility in Qinghai Province. The primary elemental composition of the waste barrier material is presented in
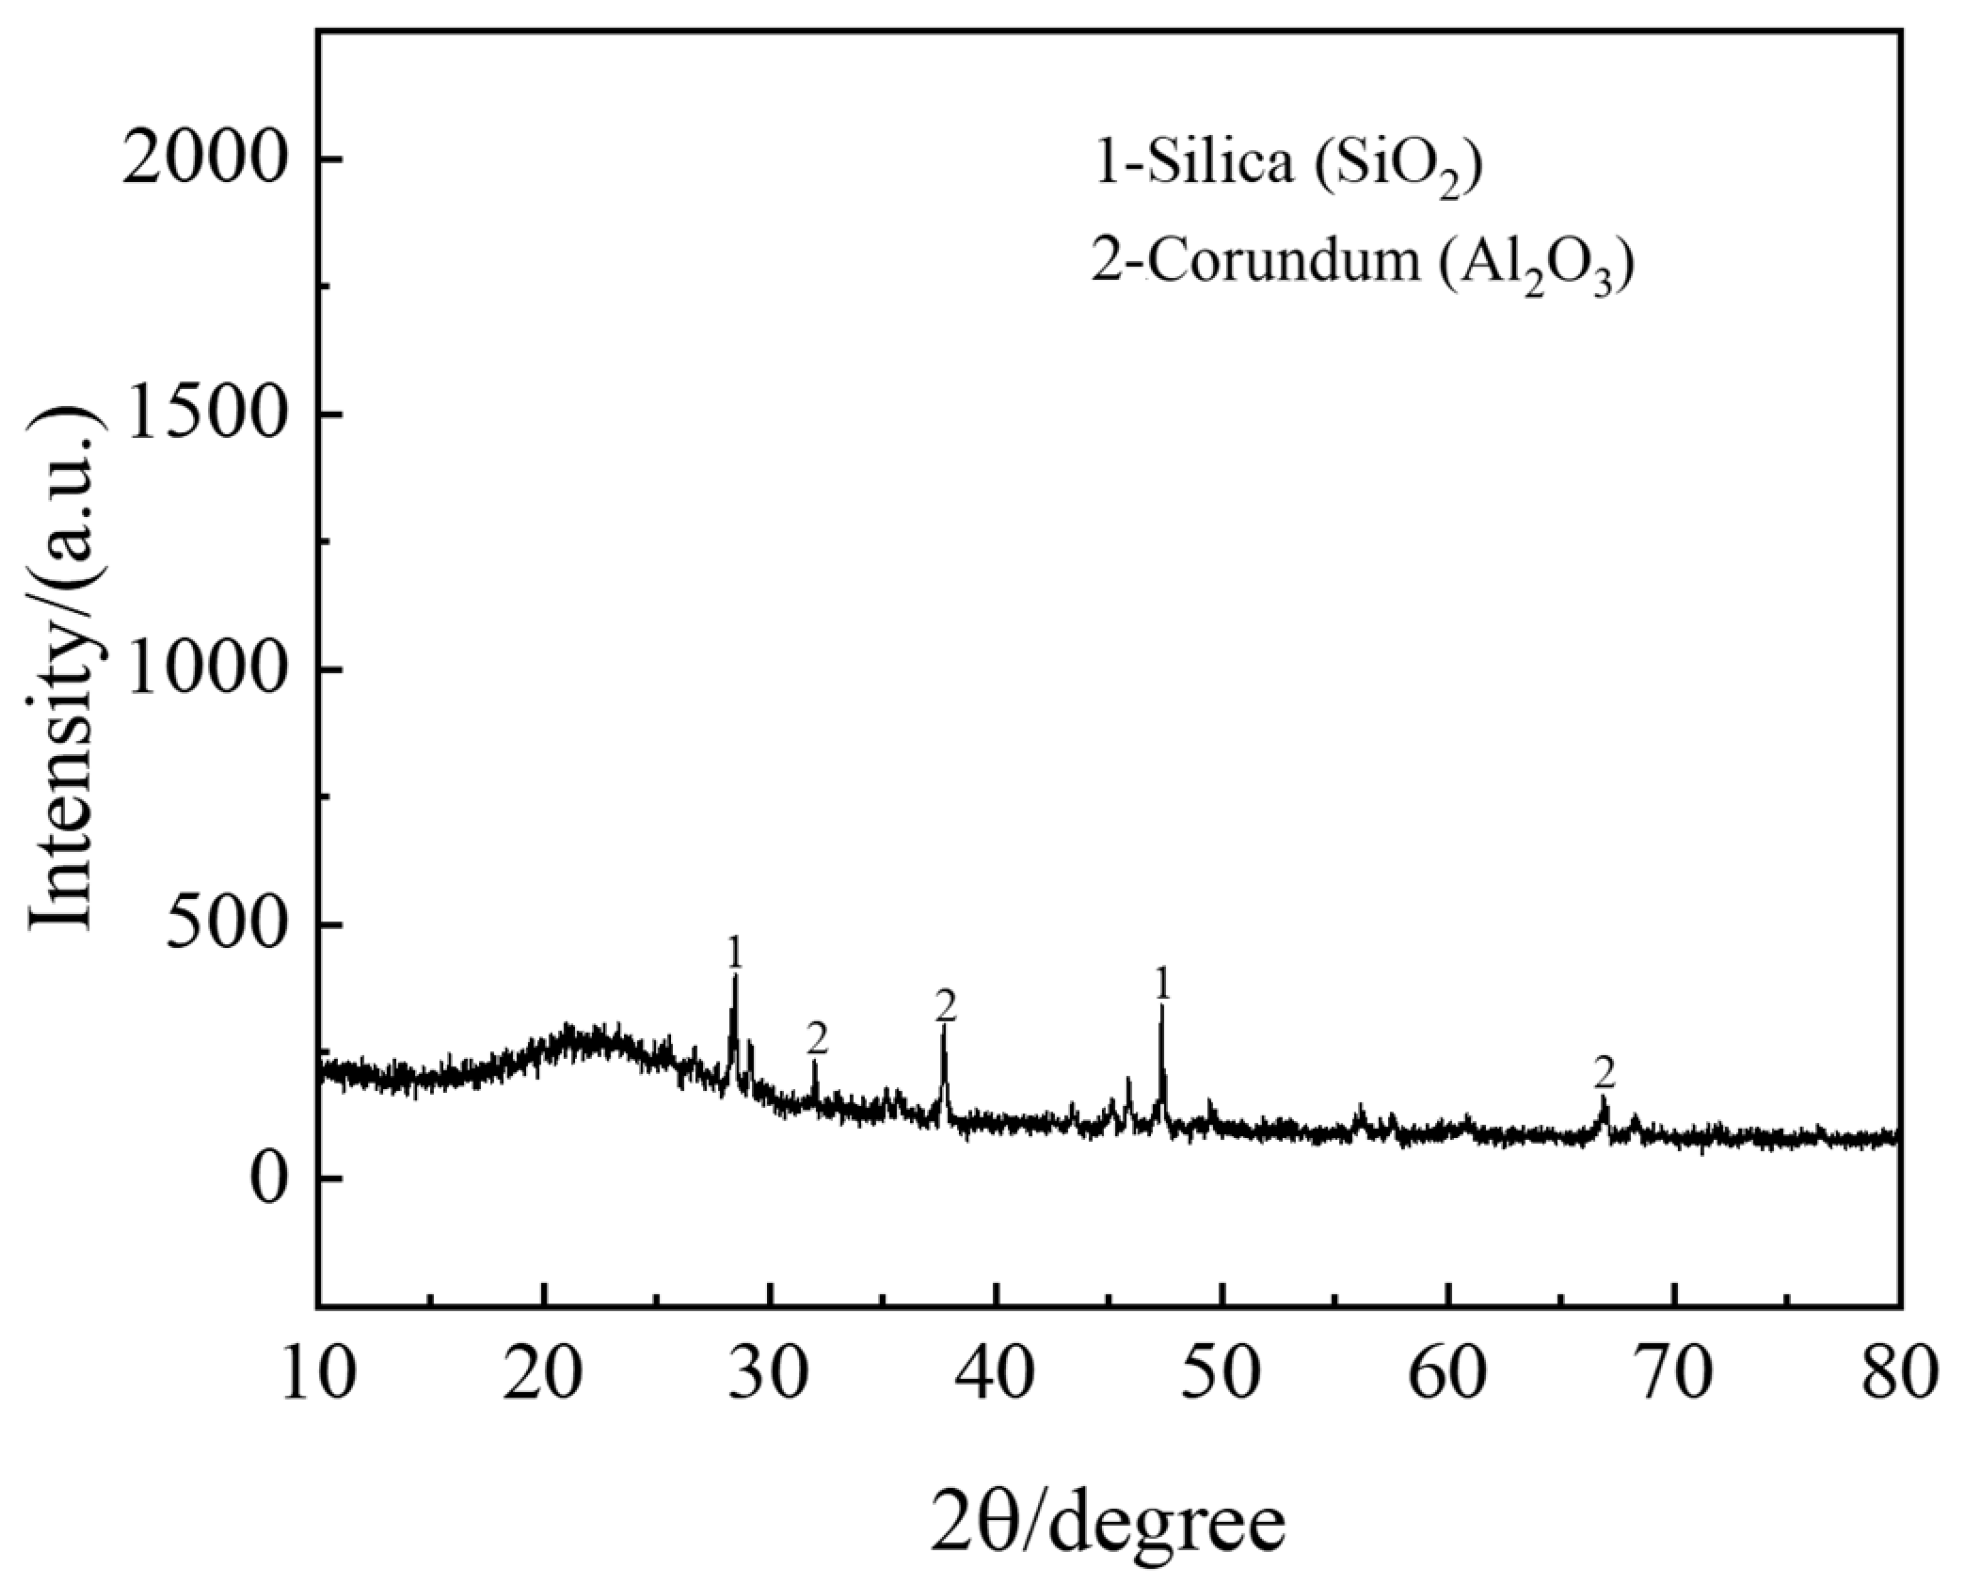
Table 1. The X-ray diffraction (XRD) pattern of the material, depicted in
Figure 1, indicates that its primary constituents are nepheline (79.0%), sodium fluoride (13.7%), and corundum (7.3%).
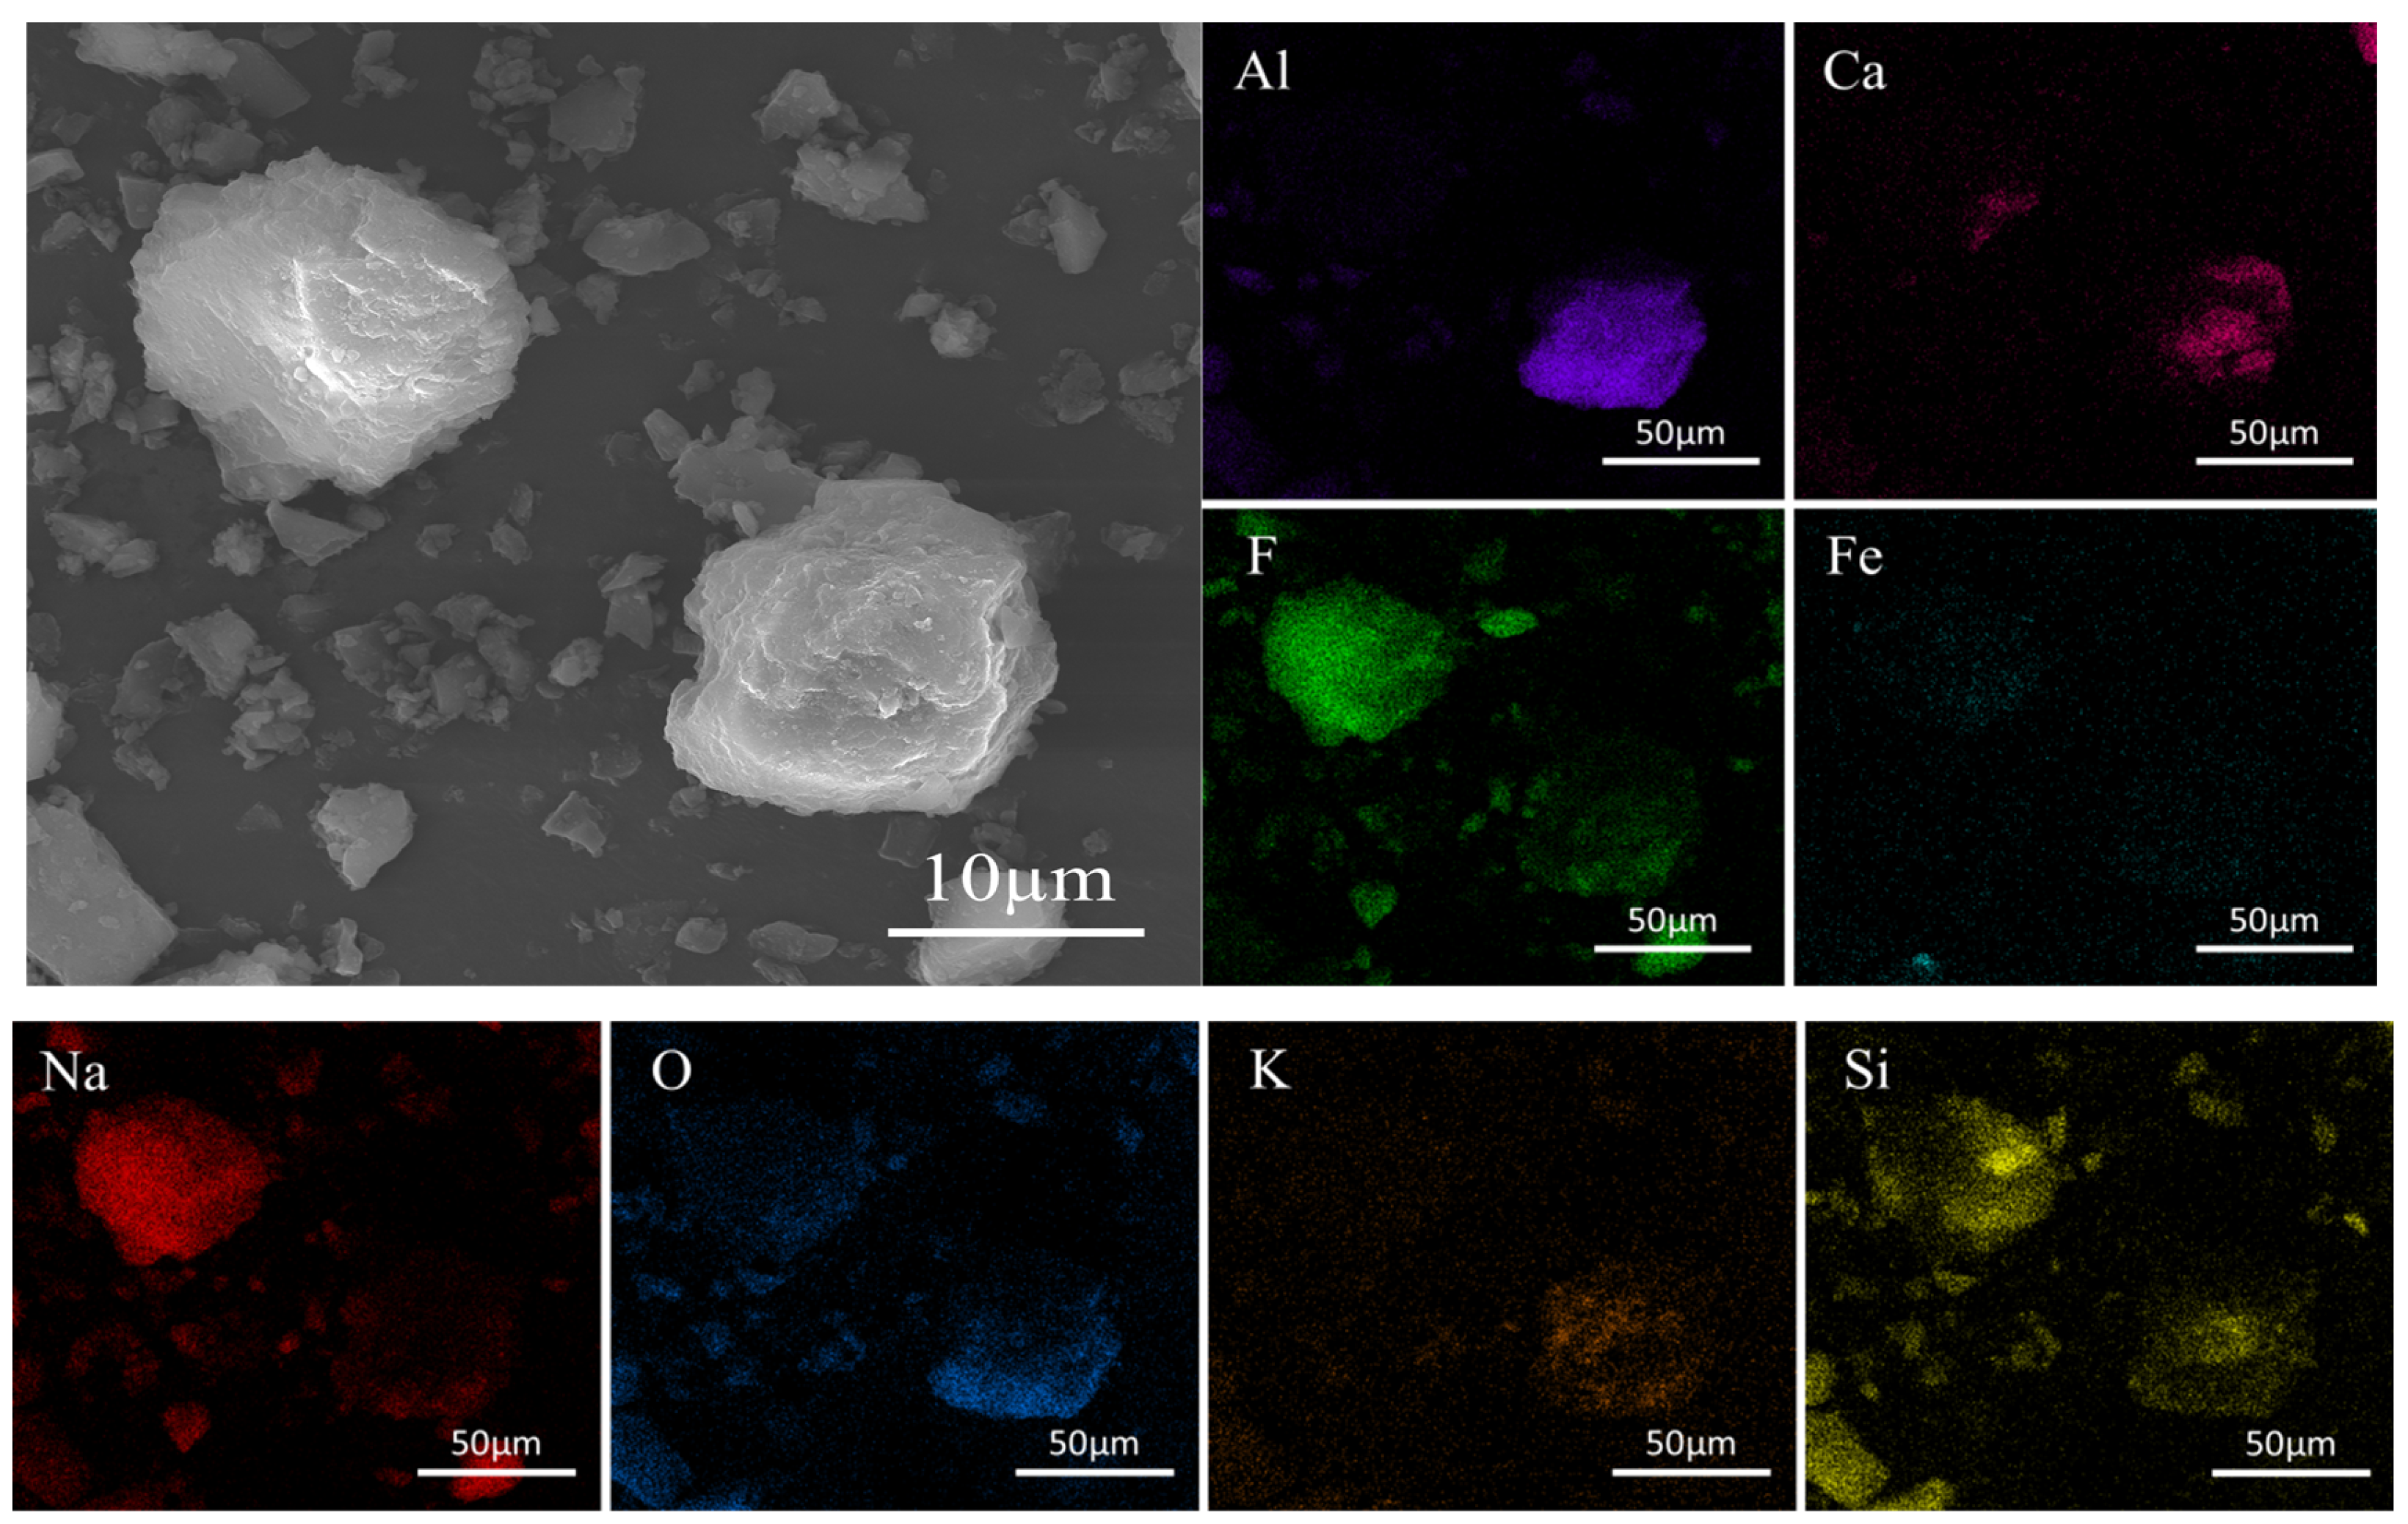
The SEM-EDS analysis of the waste barrier material is presented in
Figure 2. The material exhibits a complex composition and a relatively rough surface, with particles largely spherical in shape and covered by numerous fine particles. EDS analysis reveals that the elemental distribution within the material is both complex and uneven. Larger particles predominantly consist of Si, F, Al, and Na, while smaller particles also contain Fe and Ca in addition to Si, F, Al, and Na. The analysis further indicates that the elements are intermixed within the particles. The detailed characterization method can be found in
Section 2.3.
2.2. Experimental Methods
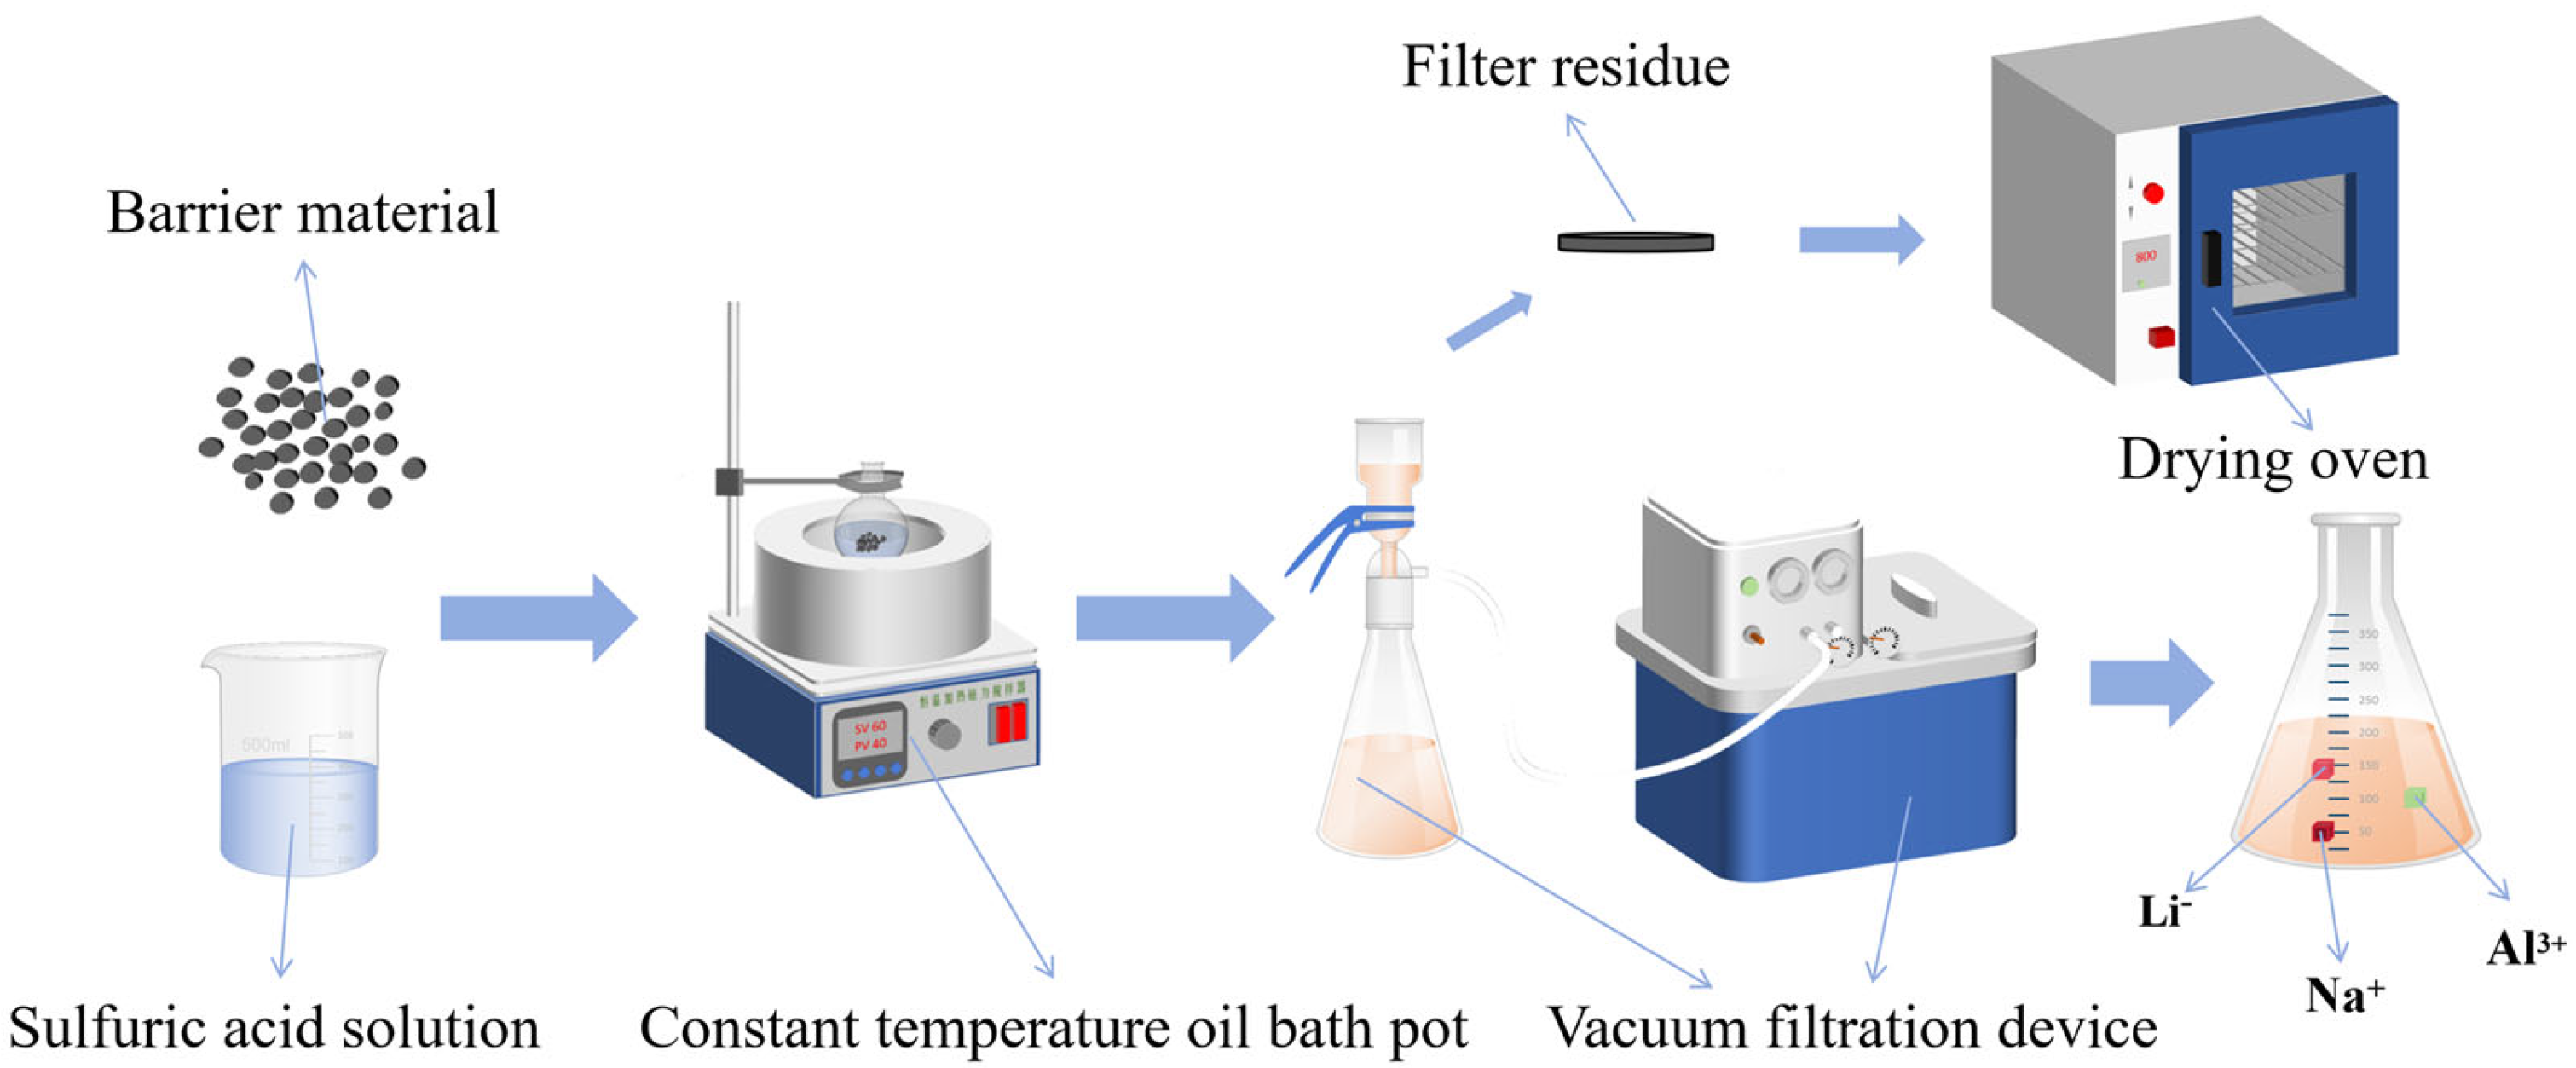
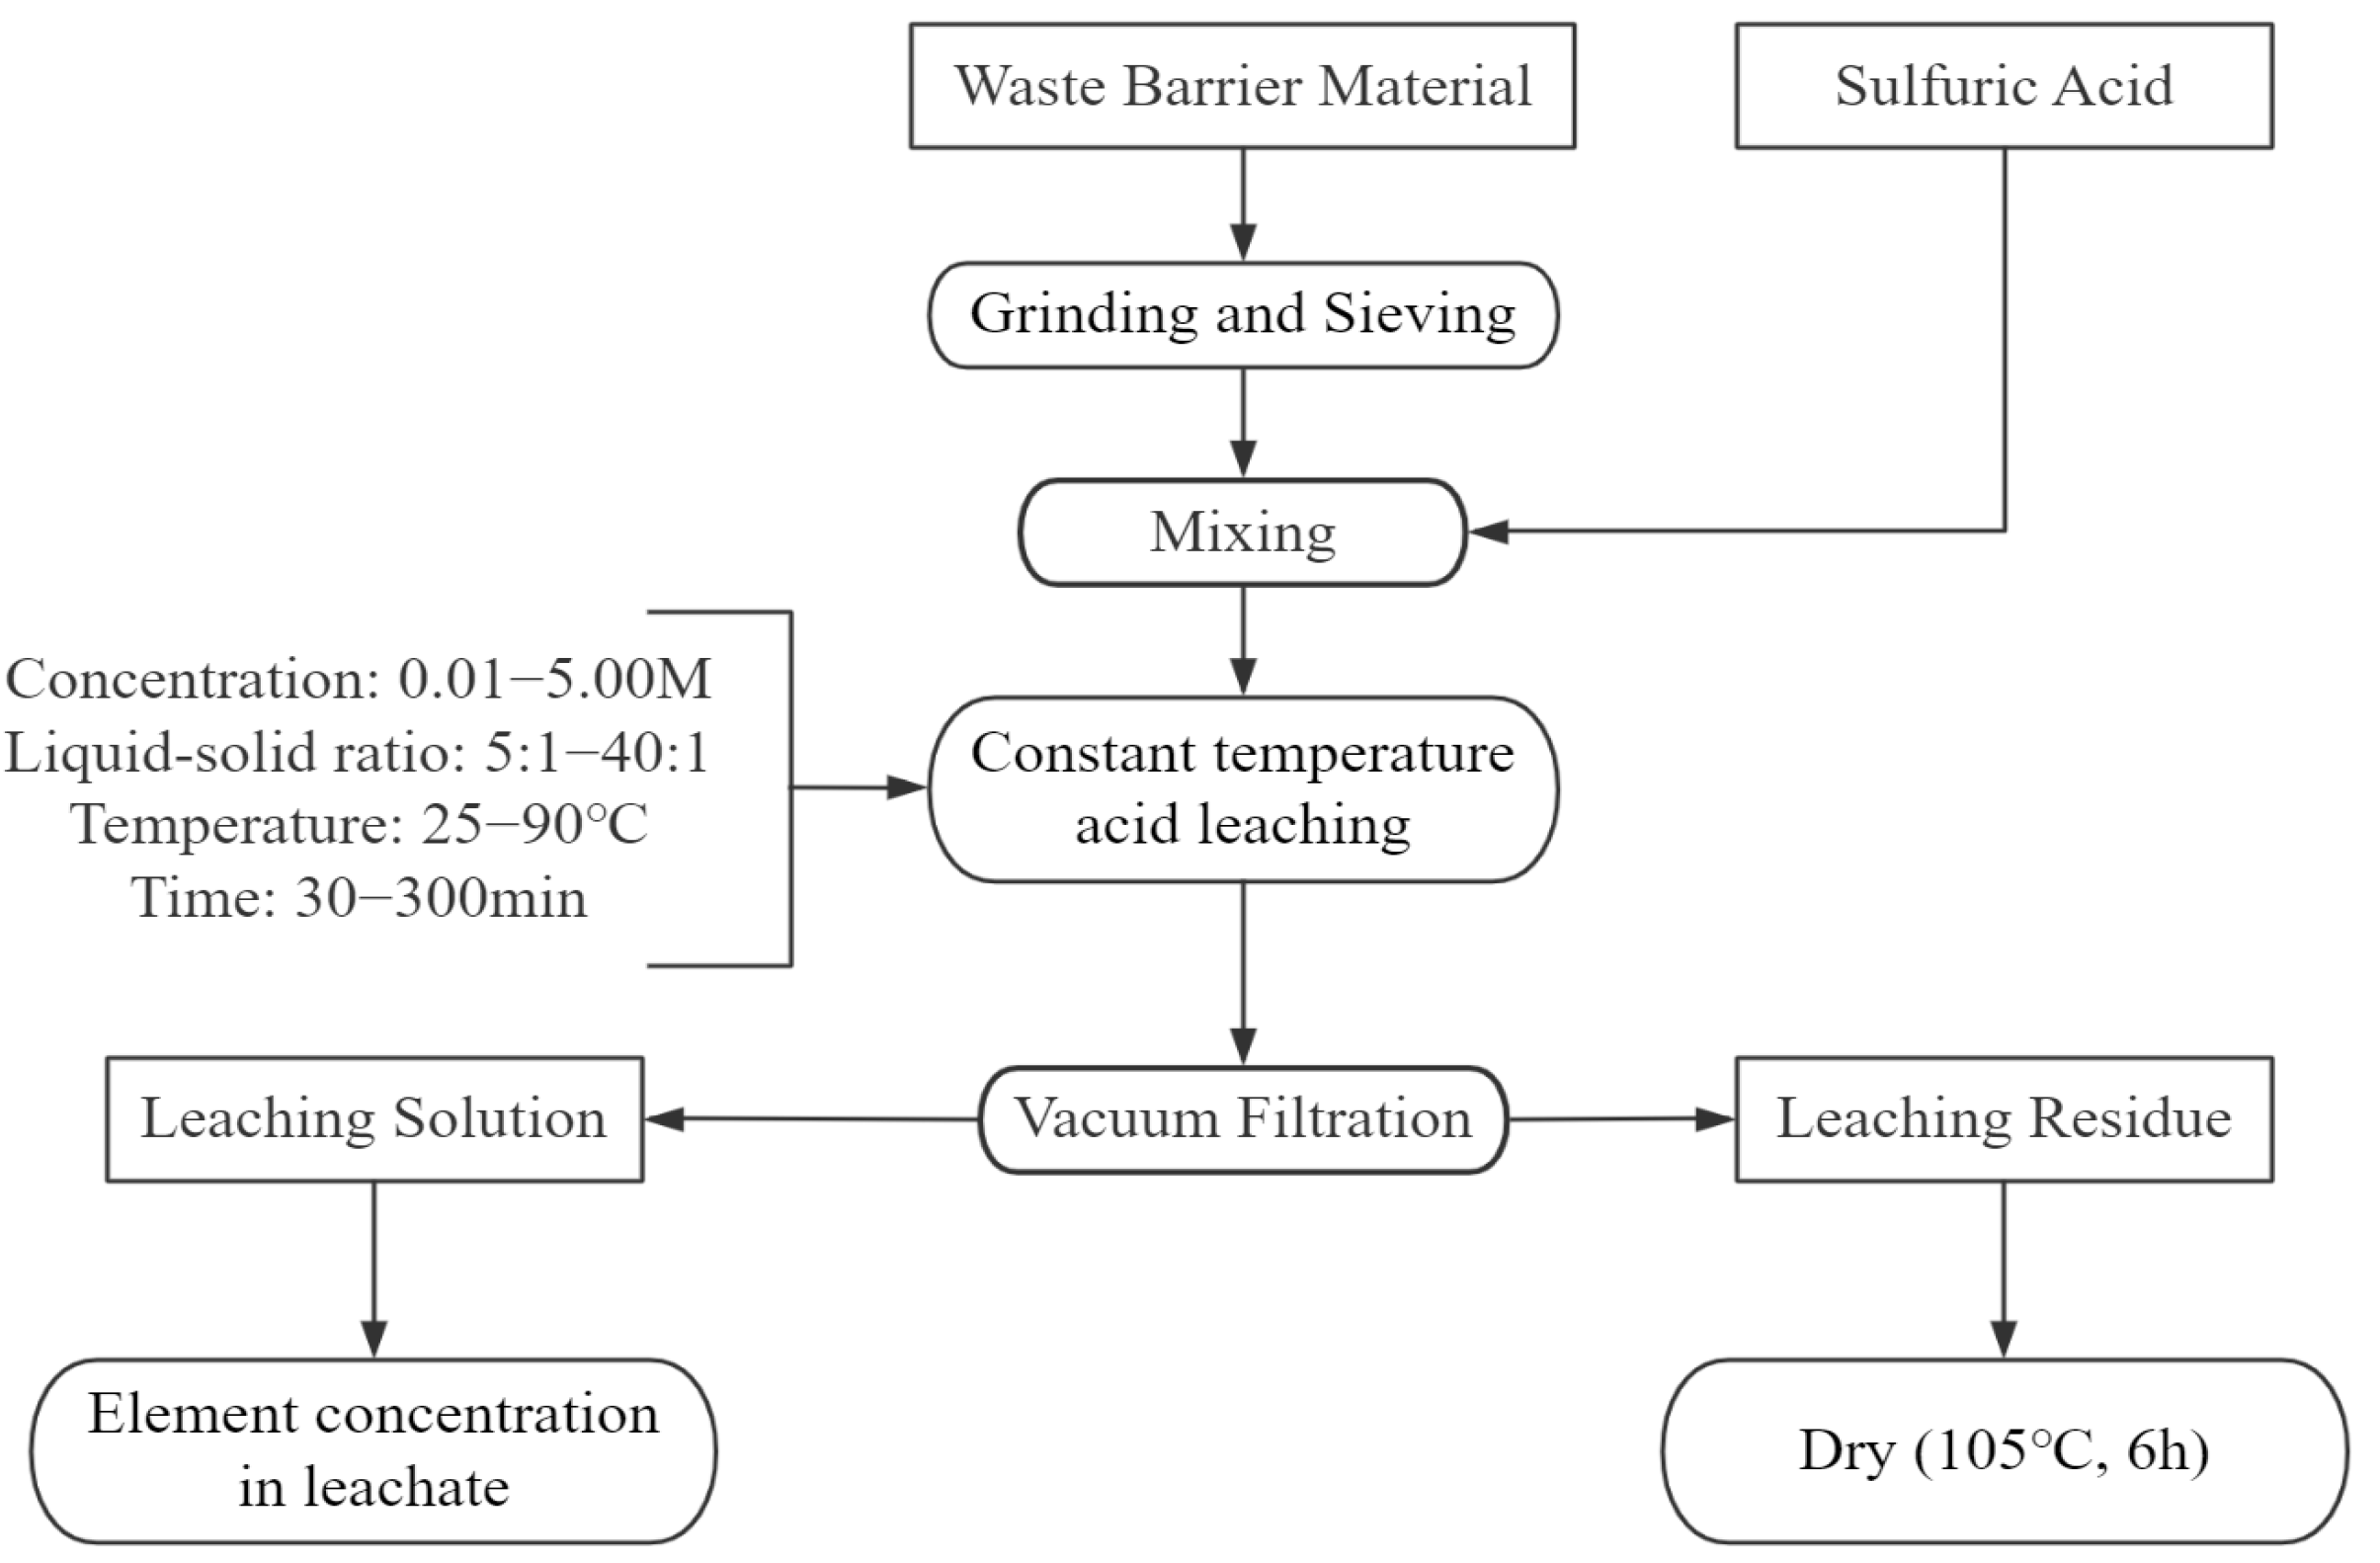
The leaching experiment, illustrated in
Figure 3, was conducted in a 250 mL round-bottom flask placed in a constant-temperature water bath with magnetic stirring (DF-101S, Shanghai Lichen Bangxi Instrument Technology Co., Shanghai, China). The stirring speed was maintained at a constant rate throughout the experiment to ensure uniform mixing of the solid particles and sulfuric acid. A temperature probe within the oil bath monitored the reaction temperature, while the exhaust gases were treated with a sodium hydroxide solution. Following the reaction, the mixture was filtered through a sintered glass funnel to separate the solid and liquid phases. Finally, the solid phase was dried in an electric blast drying oven at 105 °C for 6 h and weighed. The process diagram is shown in
Figure 4.
The calculation of the element extraction rate is as follows:
where ε represents the element extraction rate (%), c is the concentration of the element in the leachate (g/L), V is the volume of the leachate (L), W is the element content in the waste barrier material (mass fraction,%), and m is the mass of the waste barrier material (g).
Experiments were performed under carefully controlled conditions, with key parameters like temperature, time, and reagent concentration closely monitored. The relative standard deviations of triplicates fell within certified laboratory limits, with mean values reported in tables and figures, excluding error bars.
2.3. Characterization Methods
The particle size distribution of the raw material was analyzed using a laser diffraction particle size analyzer (MASTER SIZER 2000, Malvern Panalytical, Worcestershire, UK). Solid waste barrier materials and residues were first roasted and then dissolved using sodium peroxide and anhydrous sodium carbonate. Sodium, lithium, aluminum, and silicon concentrations in both dissolved solids and leachate were measured using an inductively coupled plasma optical emission spectrometer (ICAP 6300, Thermo Fisher Scientific, Waltham, MA, USA). Solid-phase characterization was performed using X-ray diffraction (XRD, Bruk/D8 Advance, Yokohama, Japan), with measurements taken at 40 kV, 20 mA, a scan rate of 10°/min, and a scanning range of 10–80°. The surface morphology of the solids was examined using a scanning electron microscope coupled with an energy-dispersive X-ray spectrometer (SEM-EDS, JEOL JSM-6490LV, Tokyo, Japan).
3. Results and Discussion
A systematic investigation was carried out on the sulfuric acid leaching of waste barrier material, with a focus on thermodynamics, experimental conditions, reaction kinetics, phase transitions, and changes in particle size.
3.1. Thermodynamic Analysis of the Leaching Process
From a thermodynamic perspective, the chemical reactions in the system can be identified by comparing the Gibbs free energy changes of each reaction, providing insights into the primary chemical processes involved. Chemical analysis of the waste barrier material reveals significant concentrations of elements such as aluminum (Al), sodium (Na), and silicon (Si). Upon reaction with sulfuric acid, the fluorides formed HF in the exhaust gases. Aluminum is converted to soluble Al
2(SO
4)
3, lithium to Li
2SO
4, and sodium to Na
2SO
4. Nepheline reacts with acids to produce silicic acid (H
4SiO
4). Due to its instability, silicic acid molecules undergo condensation, forming polysilicic acids (H
2SiO
3). These subsequently develop into silica sols. Through gelation, silica sols transform into silica gels (mSiO
2·(m + 1)H
2O), resulting in a silicon-rich colloid that remains in the residue [
18]. The potential reactions that may occur are outlined below.
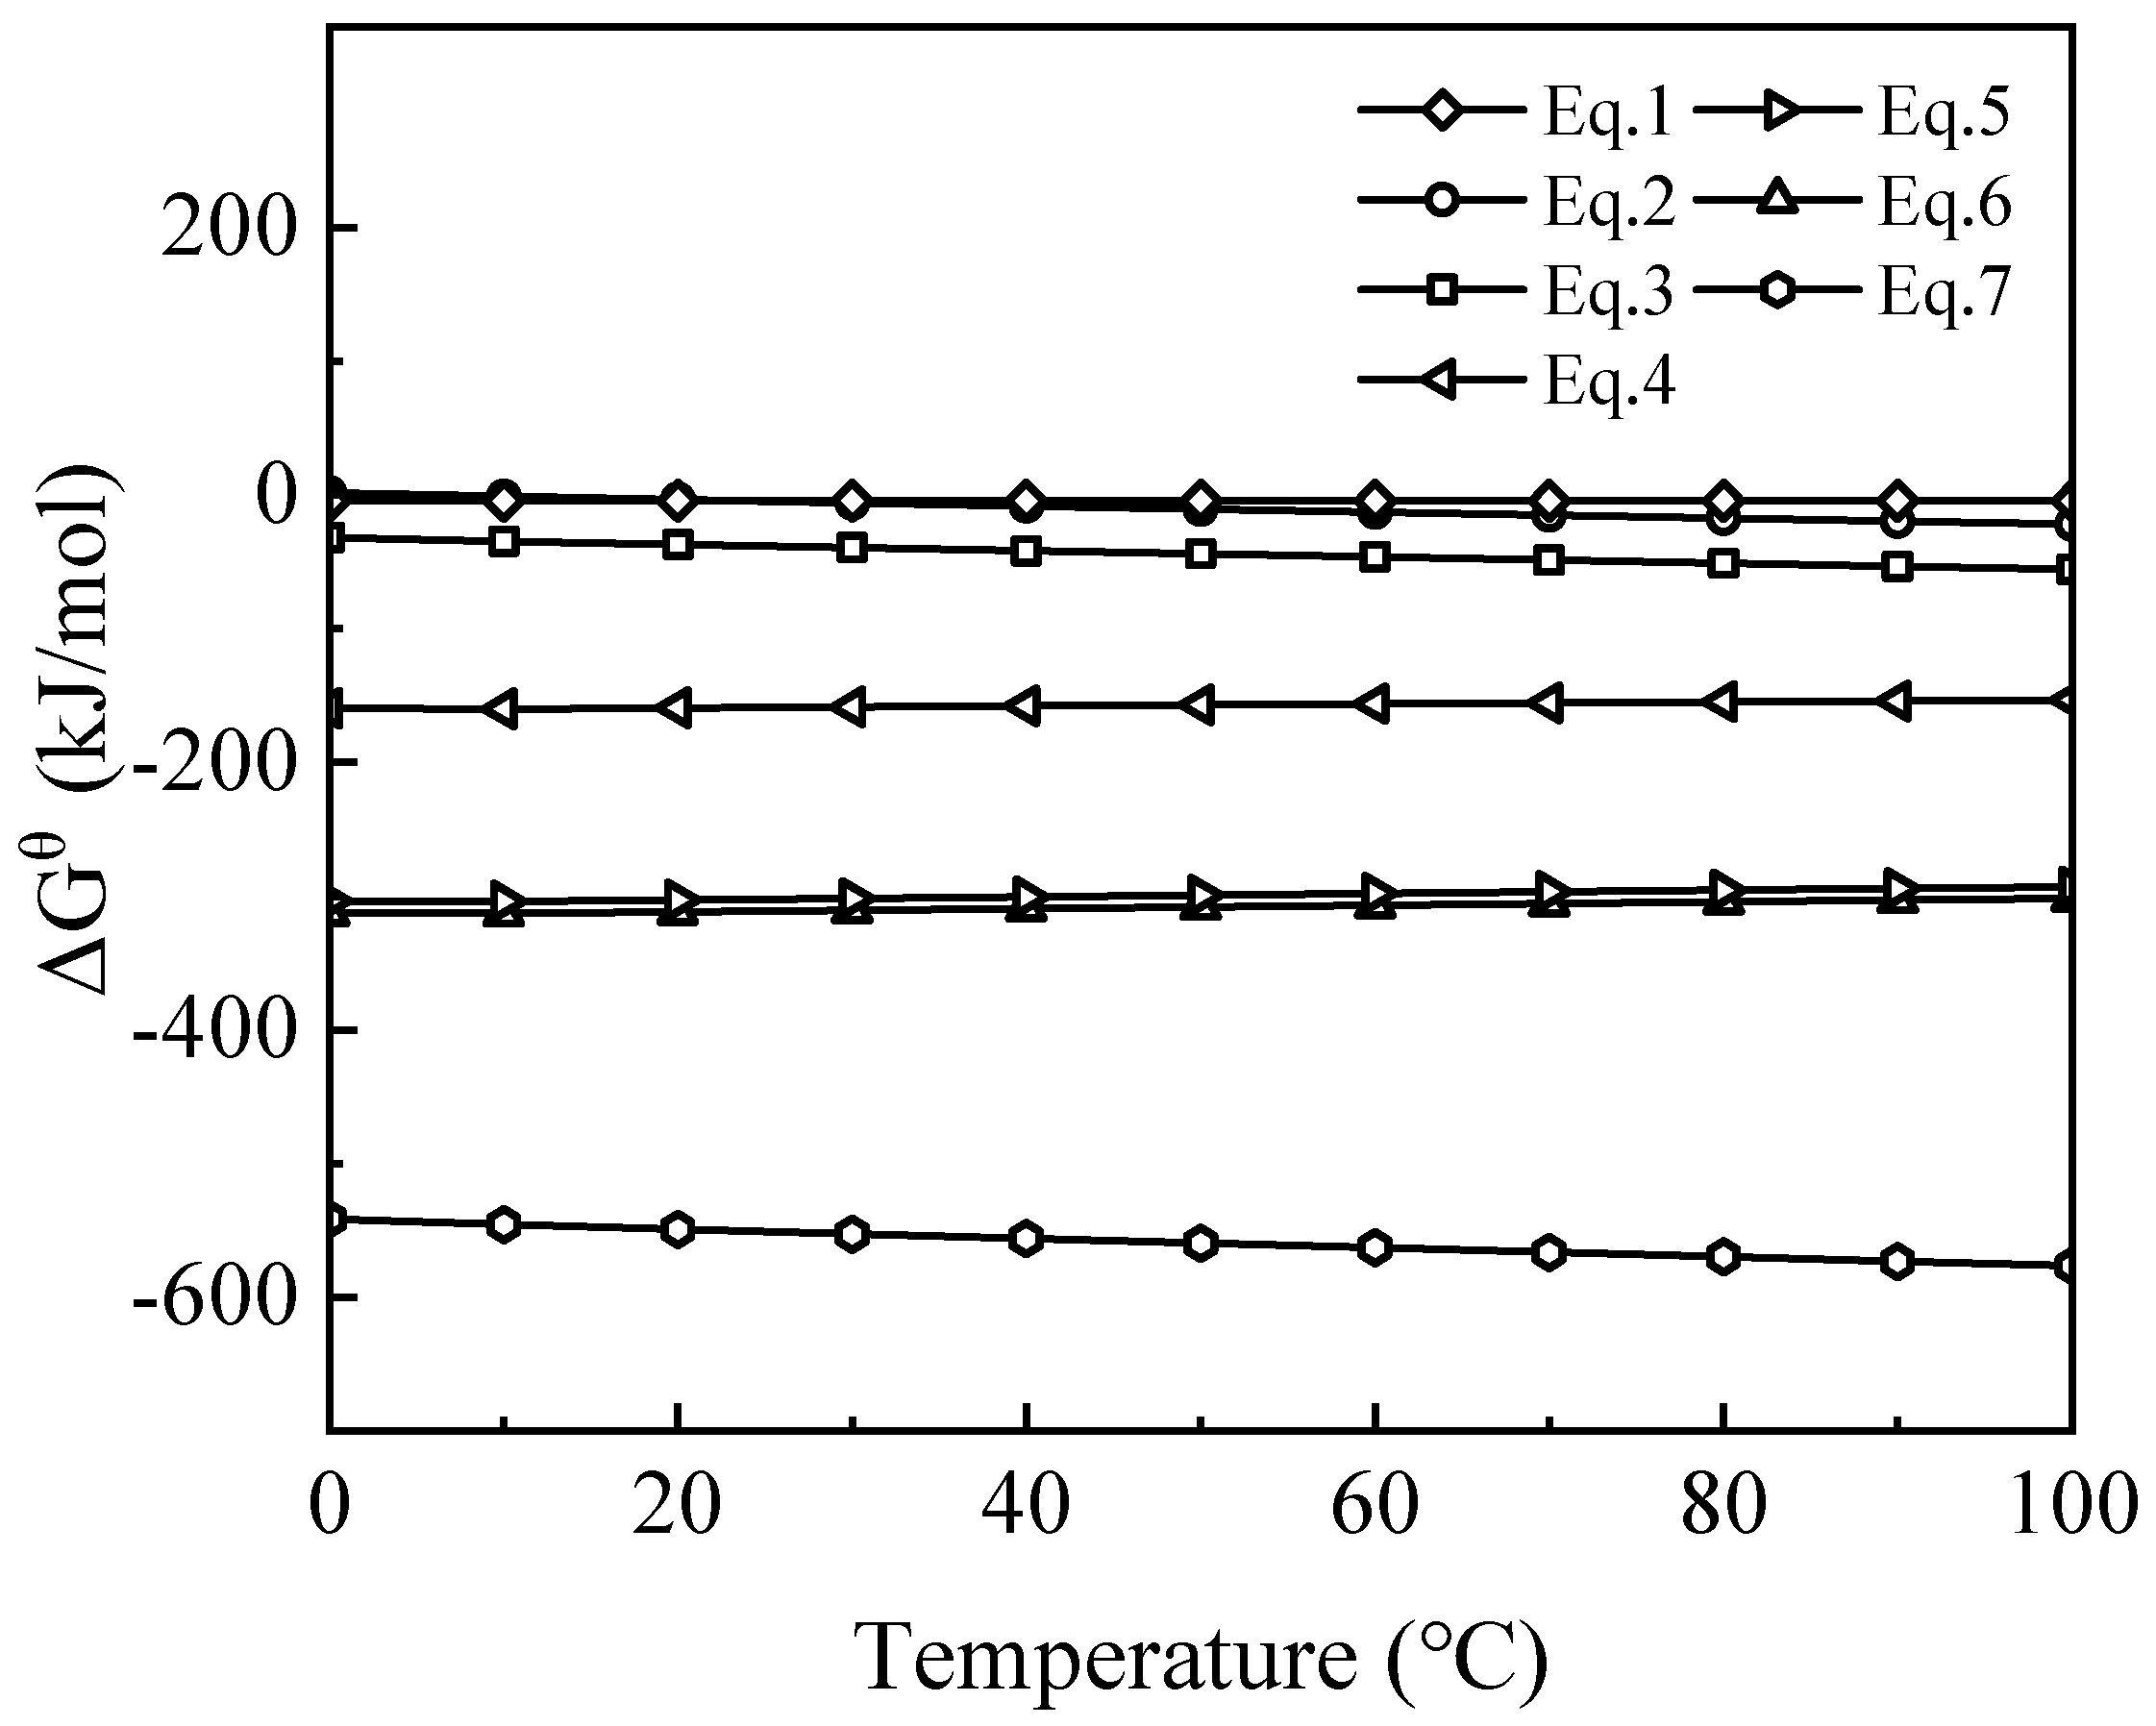
The standard Gibbs free energy change (ΔG
θ) was calculated using the equilibrium composition module of HSC Chemical 6.0, as shown in
Figure 5. At a leaching temperature of 90 °C, the ΔG
θ for all reactions between the waste barrier material and sulfuric acid are negative, indicating that these reactions are thermodynamically favorable at this temperature. Among these, the ΔG
θ for reaction (2) is closer to zero, suggesting that other reactions are more favorable than reaction (2). This also implies that the driving force for the reactions of Na
2SO
4 and Li
2SO
4 at this temperature is low, leading to slower reaction rates. However, the negative ΔG
θ for reaction (2) suggests that Li
2SO
4 may continue to react with Na
2SO
4, forming the more stable NaLiSO
4.
3.2. Influence Factors in H2SO4 Leaching
This study explores the leaching behavior of lithium, aluminum, sodium, and silicon during sulfuric acid leaching of waste barrier material. The effects of leaching temperature, H2SO4 concentration, solid-to-liquid ratio, and reaction time on the extraction efficiencies of these elements were systematically evaluated. Additionally, the kinetics of the leaching process were analyzed to better understand the underlying mechanisms.
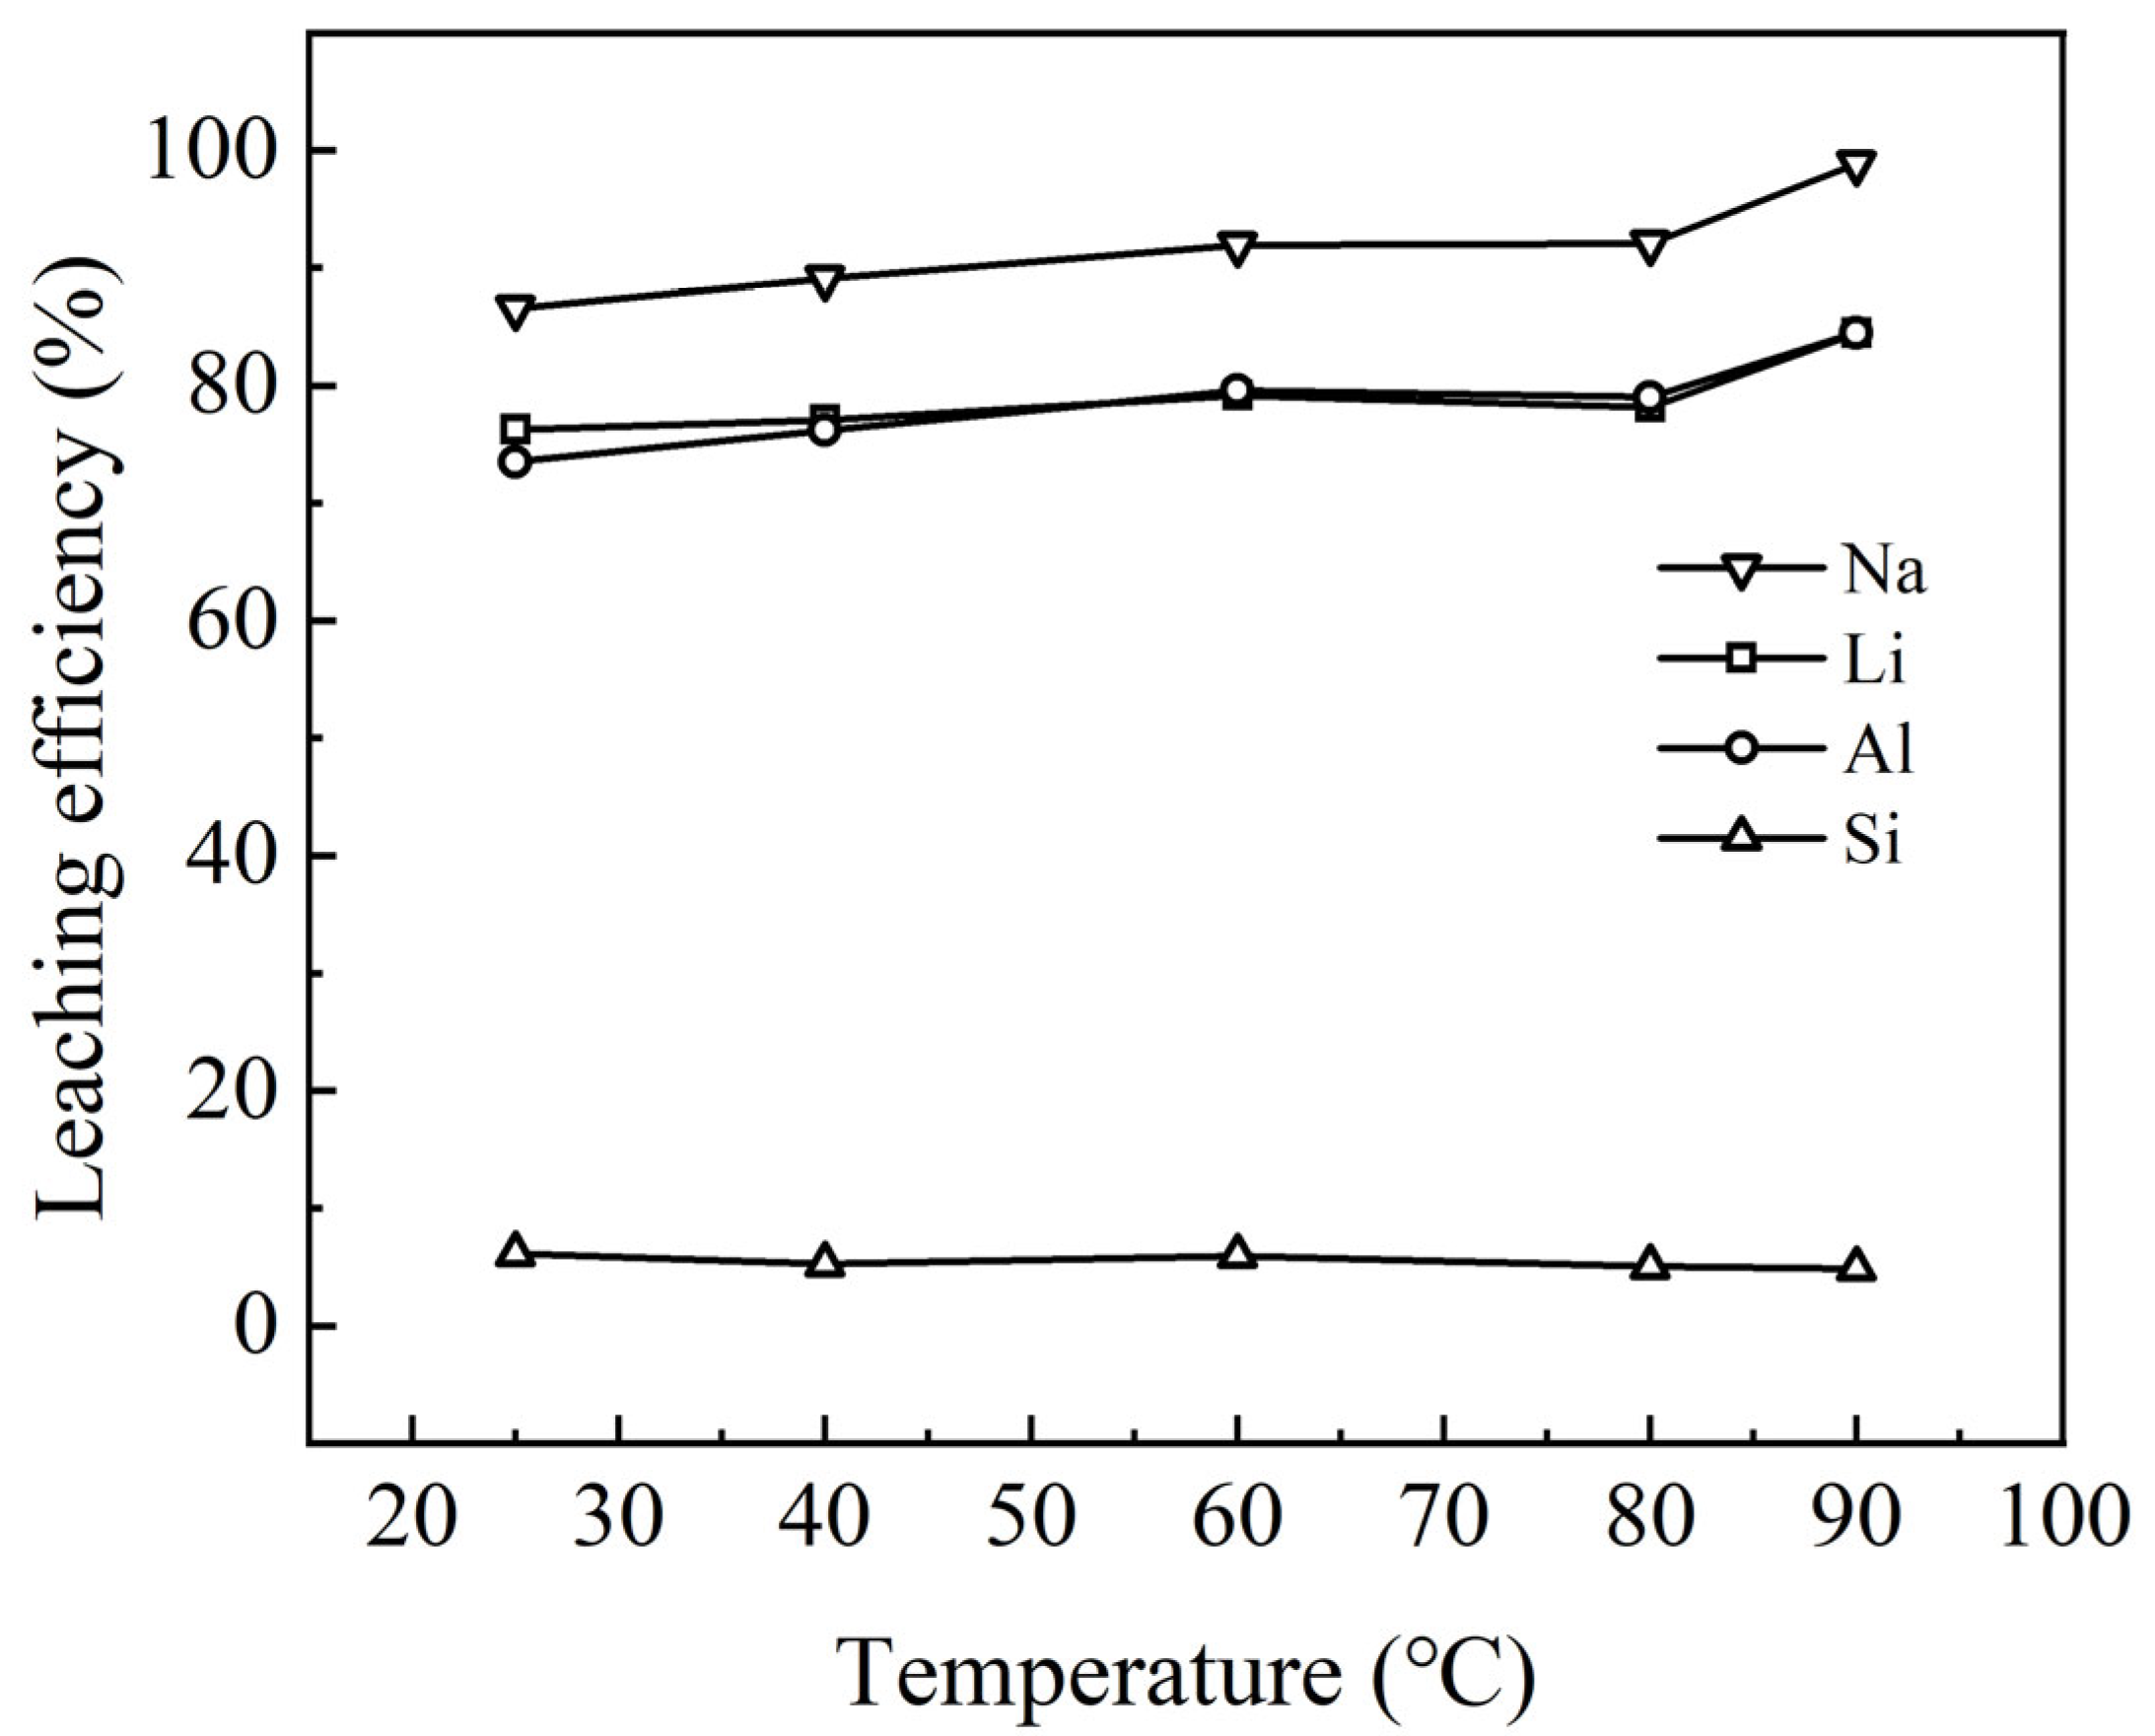
3.2.1. Effect of Temperature on Leaching Behavior
Increasing the temperature enhances the mass transfer rate and facilitates molecular collisions, thereby accelerating the reaction rate and shortening the time to reach equilibrium. Temperature also influences the reaction equilibrium constant [
19]. In this regard, the leaching rates of the waste barrier material at various temperatures are shown in
Figure 6.
Figure 6 illustrates the impact of reaction temperature on the leaching efficiencies of Na, Li, Al, and Si. Within the temperature range of 25 °C to 80 °C, the leaching rates of these elements remain relatively consistent, with only minor fluctuations. However, as the temperature rises from 80 °C to 90 °C, a significant increase in the leaching rates of Na, Li, and Al is observed. At higher temperatures, H
4SiO
4 sol transforms into a polygel, with a tendency to form larger particles. This transition enhances both the filtration rate and the leaching efficiency of high-silicon zinc residues [
20], which results suggest that elevated temperatures promote the formation of a residue structure with a reduced specific surface area, which in turn limits the entrapment or adsorption of ions, thereby improving leaching performance. These findings may indicate that higher temperatures facilitate the release of Li, Na, and Al ions. At 90 °C, the leaching rates for Na, Li, and Al reach 98.8%, 84.9%, and 85.1%, respectively, making this temperature optimal for subsequent experiments.
The low leaching rate of silicon as a function of temperature can be attributed to several factors. At lower temperatures, silicic acid in solution may undergo spontaneous polymerization into micrometer-sized colloids due to inadequate supersaturation of silicate species (such as monomers or oligomers). This results in a decreased concentration of dissolved silica in the solution, leading to a reduced silicon leaching rate. As the temperature increases, dissolved silicon tends to form amorphous silica gel, which subsequently precipitates back into the residue. Consequently, the silicon leaching rate remains relatively stable at approximately 5.5%, irrespective of temperature changes.
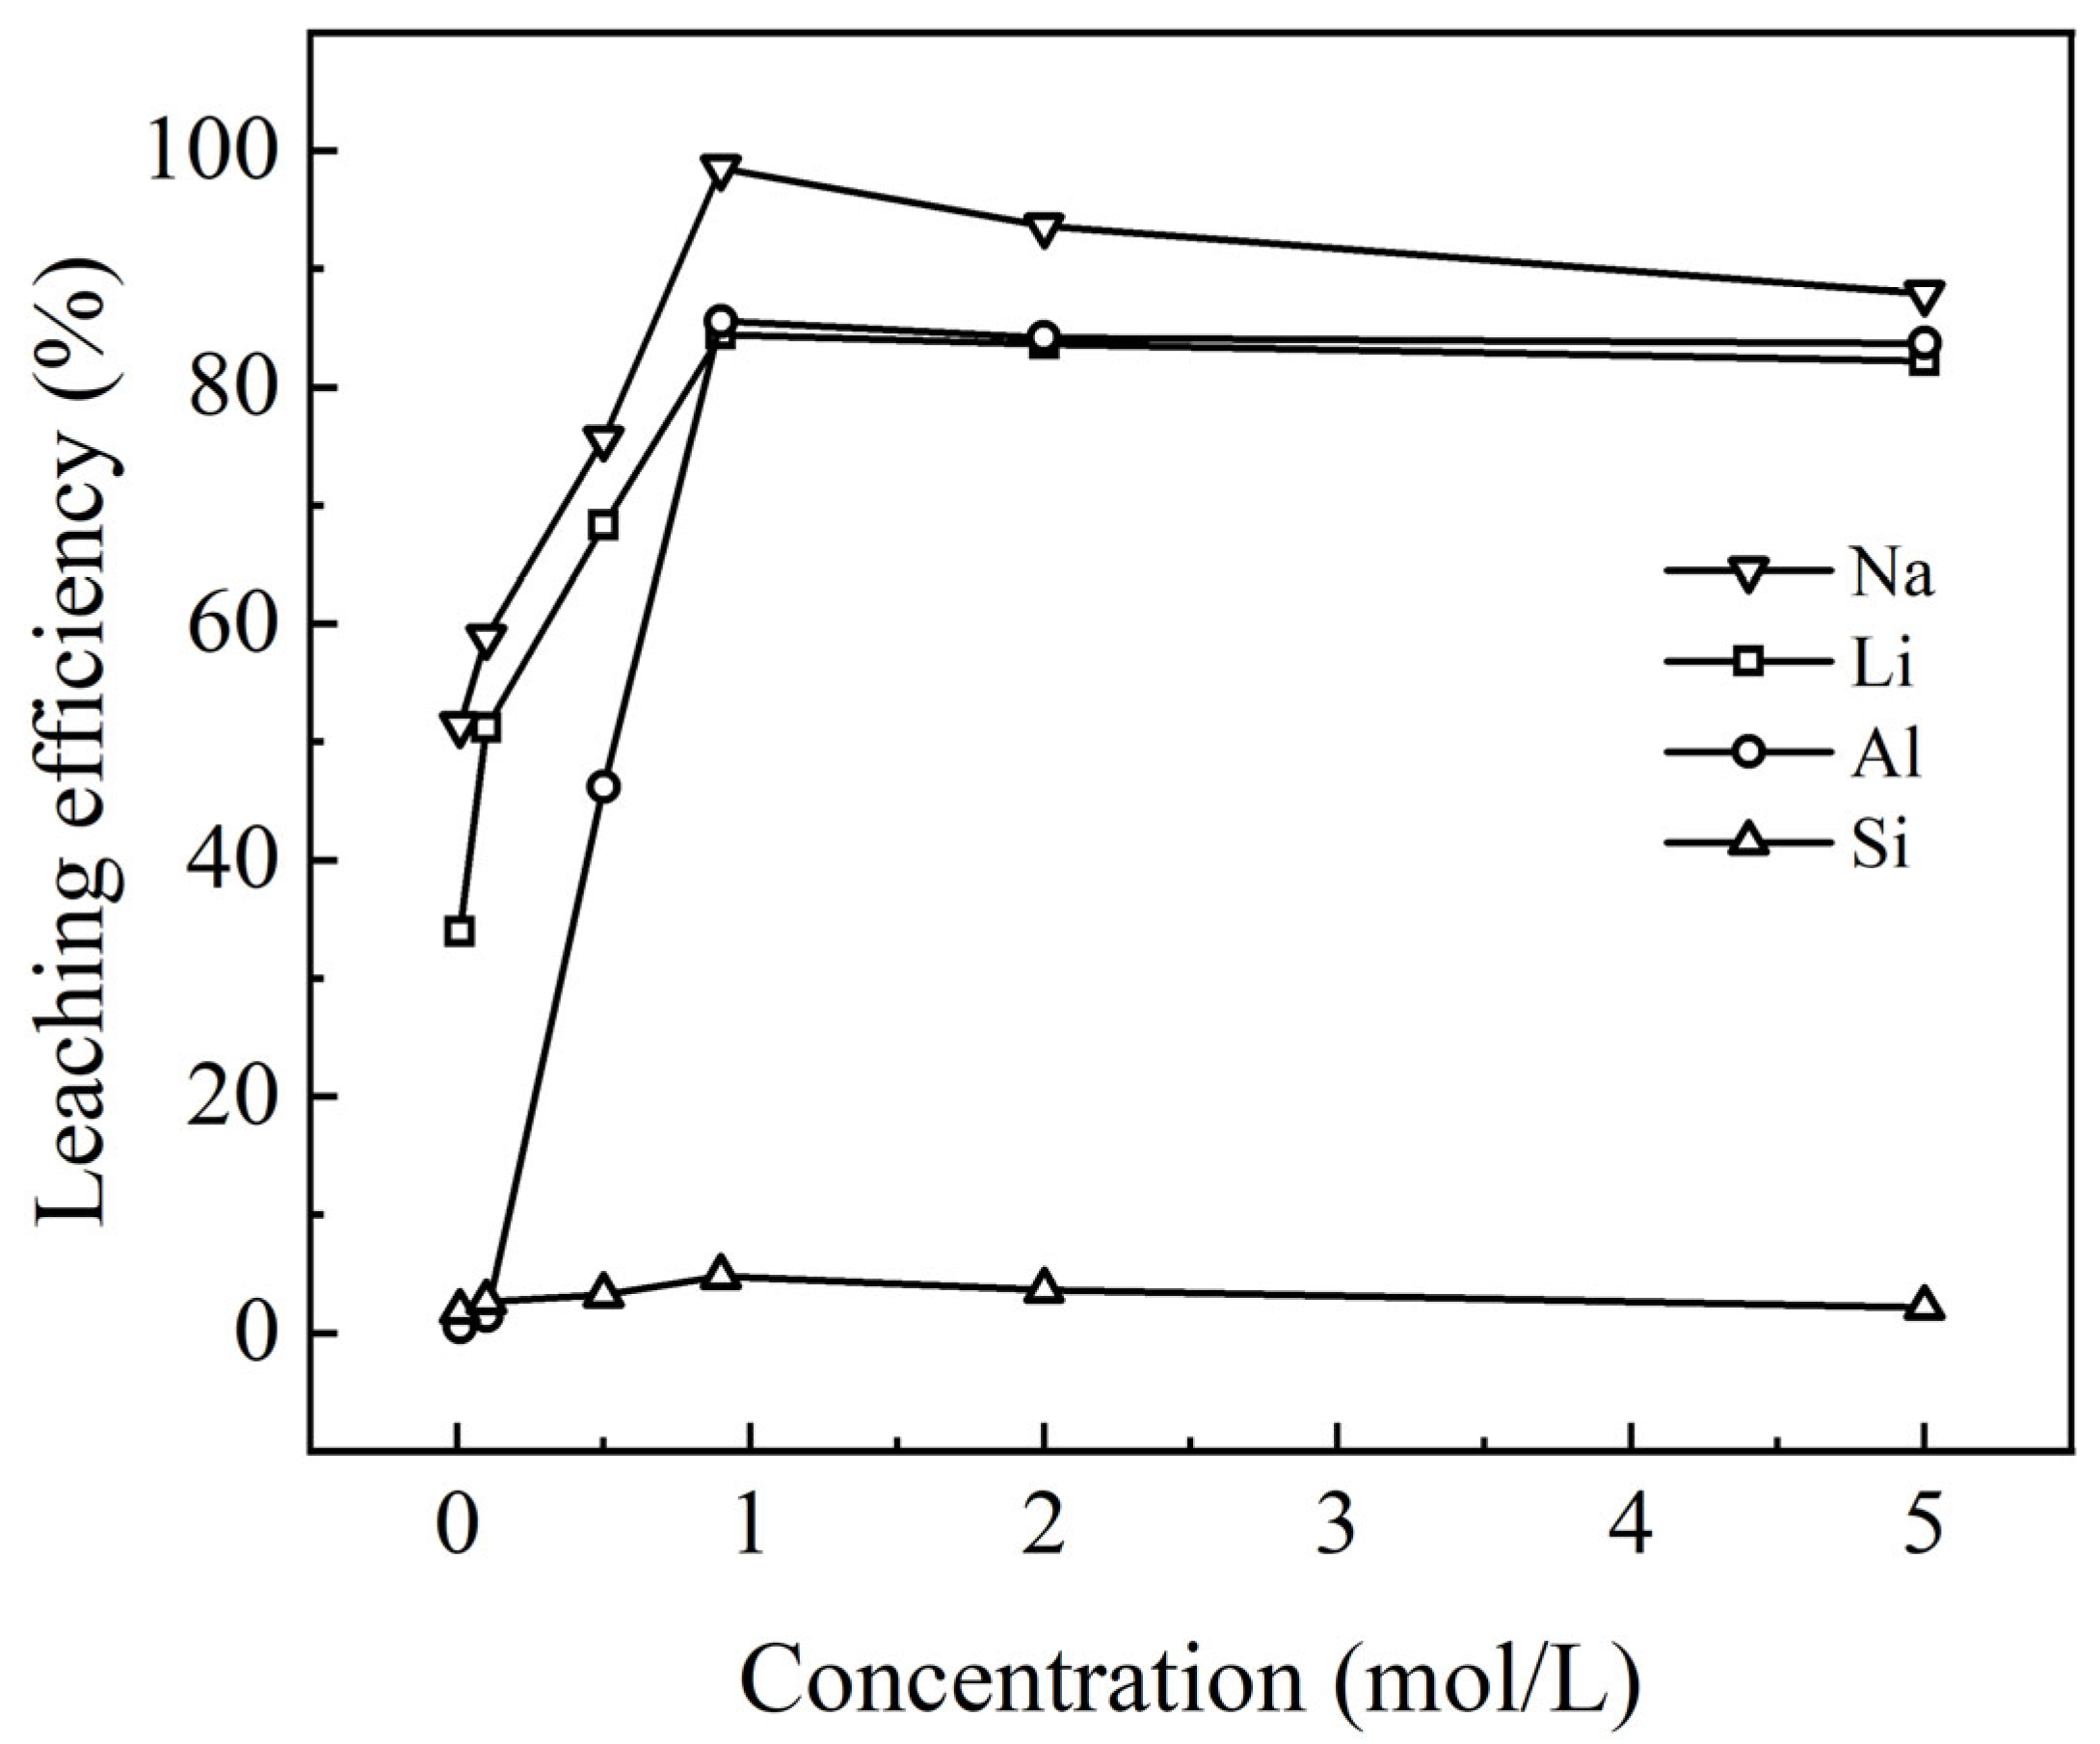
3.2.2. Effect of H2SO4 Concentration on Leaching Behavior
Increasing the amount of sulfuric acid provides more active acid molecules to react with the solid material, thereby accelerating the dissolution process and enhancing the overall dissolution rate. The effect of varying H
2SO
4 concentrations on the leaching rates of lithium, aluminum, sodium, and silicon is shown in
Figure 7.
As shown in
Figure 7, the effect of initial H
2SO
4 concentration (0.01 M, 0.1 M, 0.5 M, 0.9 M, 2 M, and 5 M) on the leaching rates of Li, Al, Na, and Si was investigated. A maximum of 5 M sulfuric acid solution (approximately 38%) was selected for the experiment, since both 316 L stainless steel and PVDF plastic are compatible and offer durability and cost-efficiency for this concentration. The results indicated that the leaching rates of Li, Al, Na, and Si increased with higher initial H
2SO
4 concentrations, with Na leaching at a significantly faster rate compared to the other elements. At an initial H
2SO
4 concentration of 0.01 mol/L, the leaching rate of Na reached approximately 51% after 90 min, while the Si leaching rate remained below 2%. At a concentration of 0.9 mol/L, the leaching rates of all four elements peaked, with Na reaching over 98%. As H
2SO
4 concentration increased, aluminum’s leaching rate rose sharply from less than 0.5% to about 85%, but further increases in H
2SO
4 concentration to 5 mol/L led to a slight decrease in aluminum leaching. The trends for Li and Na followed a similar pattern to that of aluminum. This phenomenon is likely attributable to the formation of polysilicic acids or silica gels at elevated sulfuric acid concentrations. These substances adsorb elements from the solution, resulting in a slightly reduced leaching rate at high sulfuric acid concentrations, such as 5 mol/L. Based on these results, an initial H
2SO
4 concentration of 0.9 mol/L was selected for subsequent experiments.
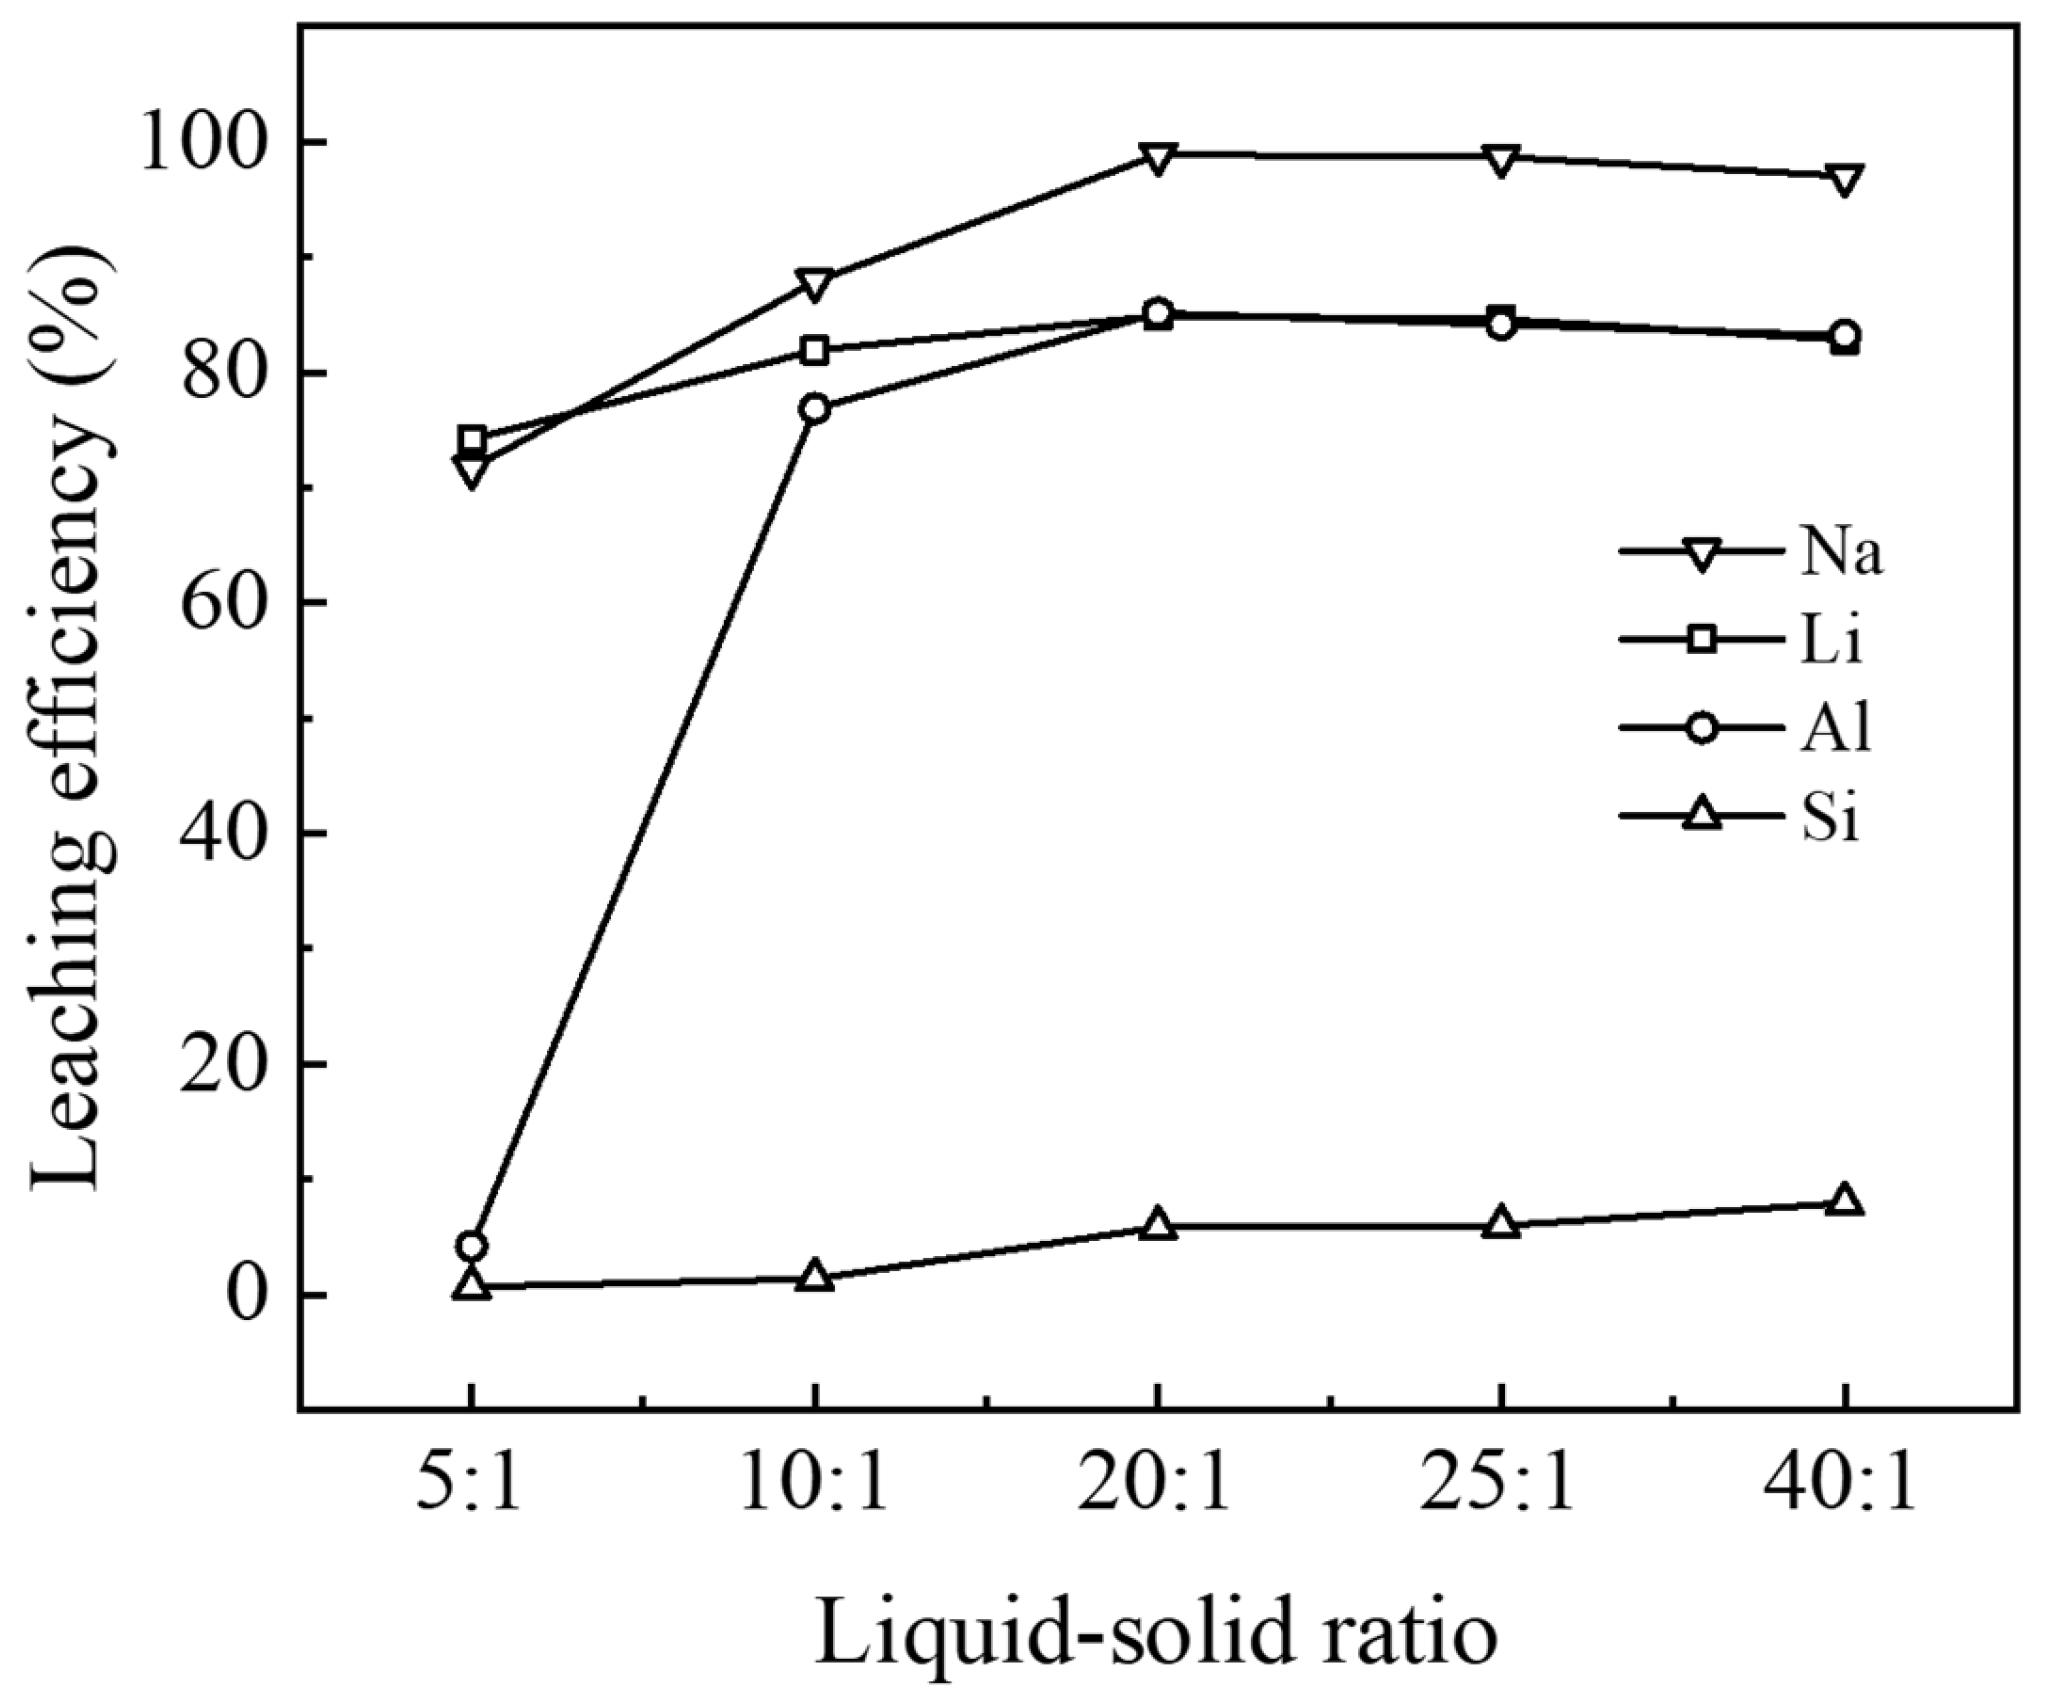
3.2.3. Effect of Liquid–Solid Ratio on Leaching Behavior
The liquid-to-solid ratio is a crucial parameter in the acid leaching process, defined as the mass ratio of acid solution to solid material [
21]. Its influence on the leaching process manifests in several ways. First, an increase in the liquid-to-solid ratio generally leads to improved leaching rates by increasing the contact between the liquid and solid materials, thus enhancing the mass transfer rate between phases [
22]. Second, a higher liquid-to-solid ratio reduces the viscosity of the slurry, which improves the mass transfer efficiency at the solid–liquid interface, potentially further enhancing the leaching rate [
23]. In this study, five different liquid-to-solid ratios (5:1, 10:1, 20:1, 25:1, and 40:1) were examined to assess their impact on the leaching rates of various elements in waste barrier material.
As shown in
Figure 8, the leaching rates of Li, Al, and Na initially increased and then decreased slightly as a function of the liquid–solid ratio. The most notable change in leaching rate occurred for aluminum within the range of 5:1 to 20:1, indicating that the increase in the liquid–solid ratio had the greatest impact on aluminum leaching. Further increases in the liquid–solid ratio led to a stabilization of aluminum leaching, likely because residual aluminum exists in the form of α-Al
2O
3, which has strong chemical stability to H
2SO
4 [
24]. When the liquid–solid ratio was 20:1, the leaching rates for Na, Li, and Al reached their maximums at 98.8%, 84.9%, and 85.1%, respectively. These results suggest that the optimal sulfuric acid dosage is 20:1.
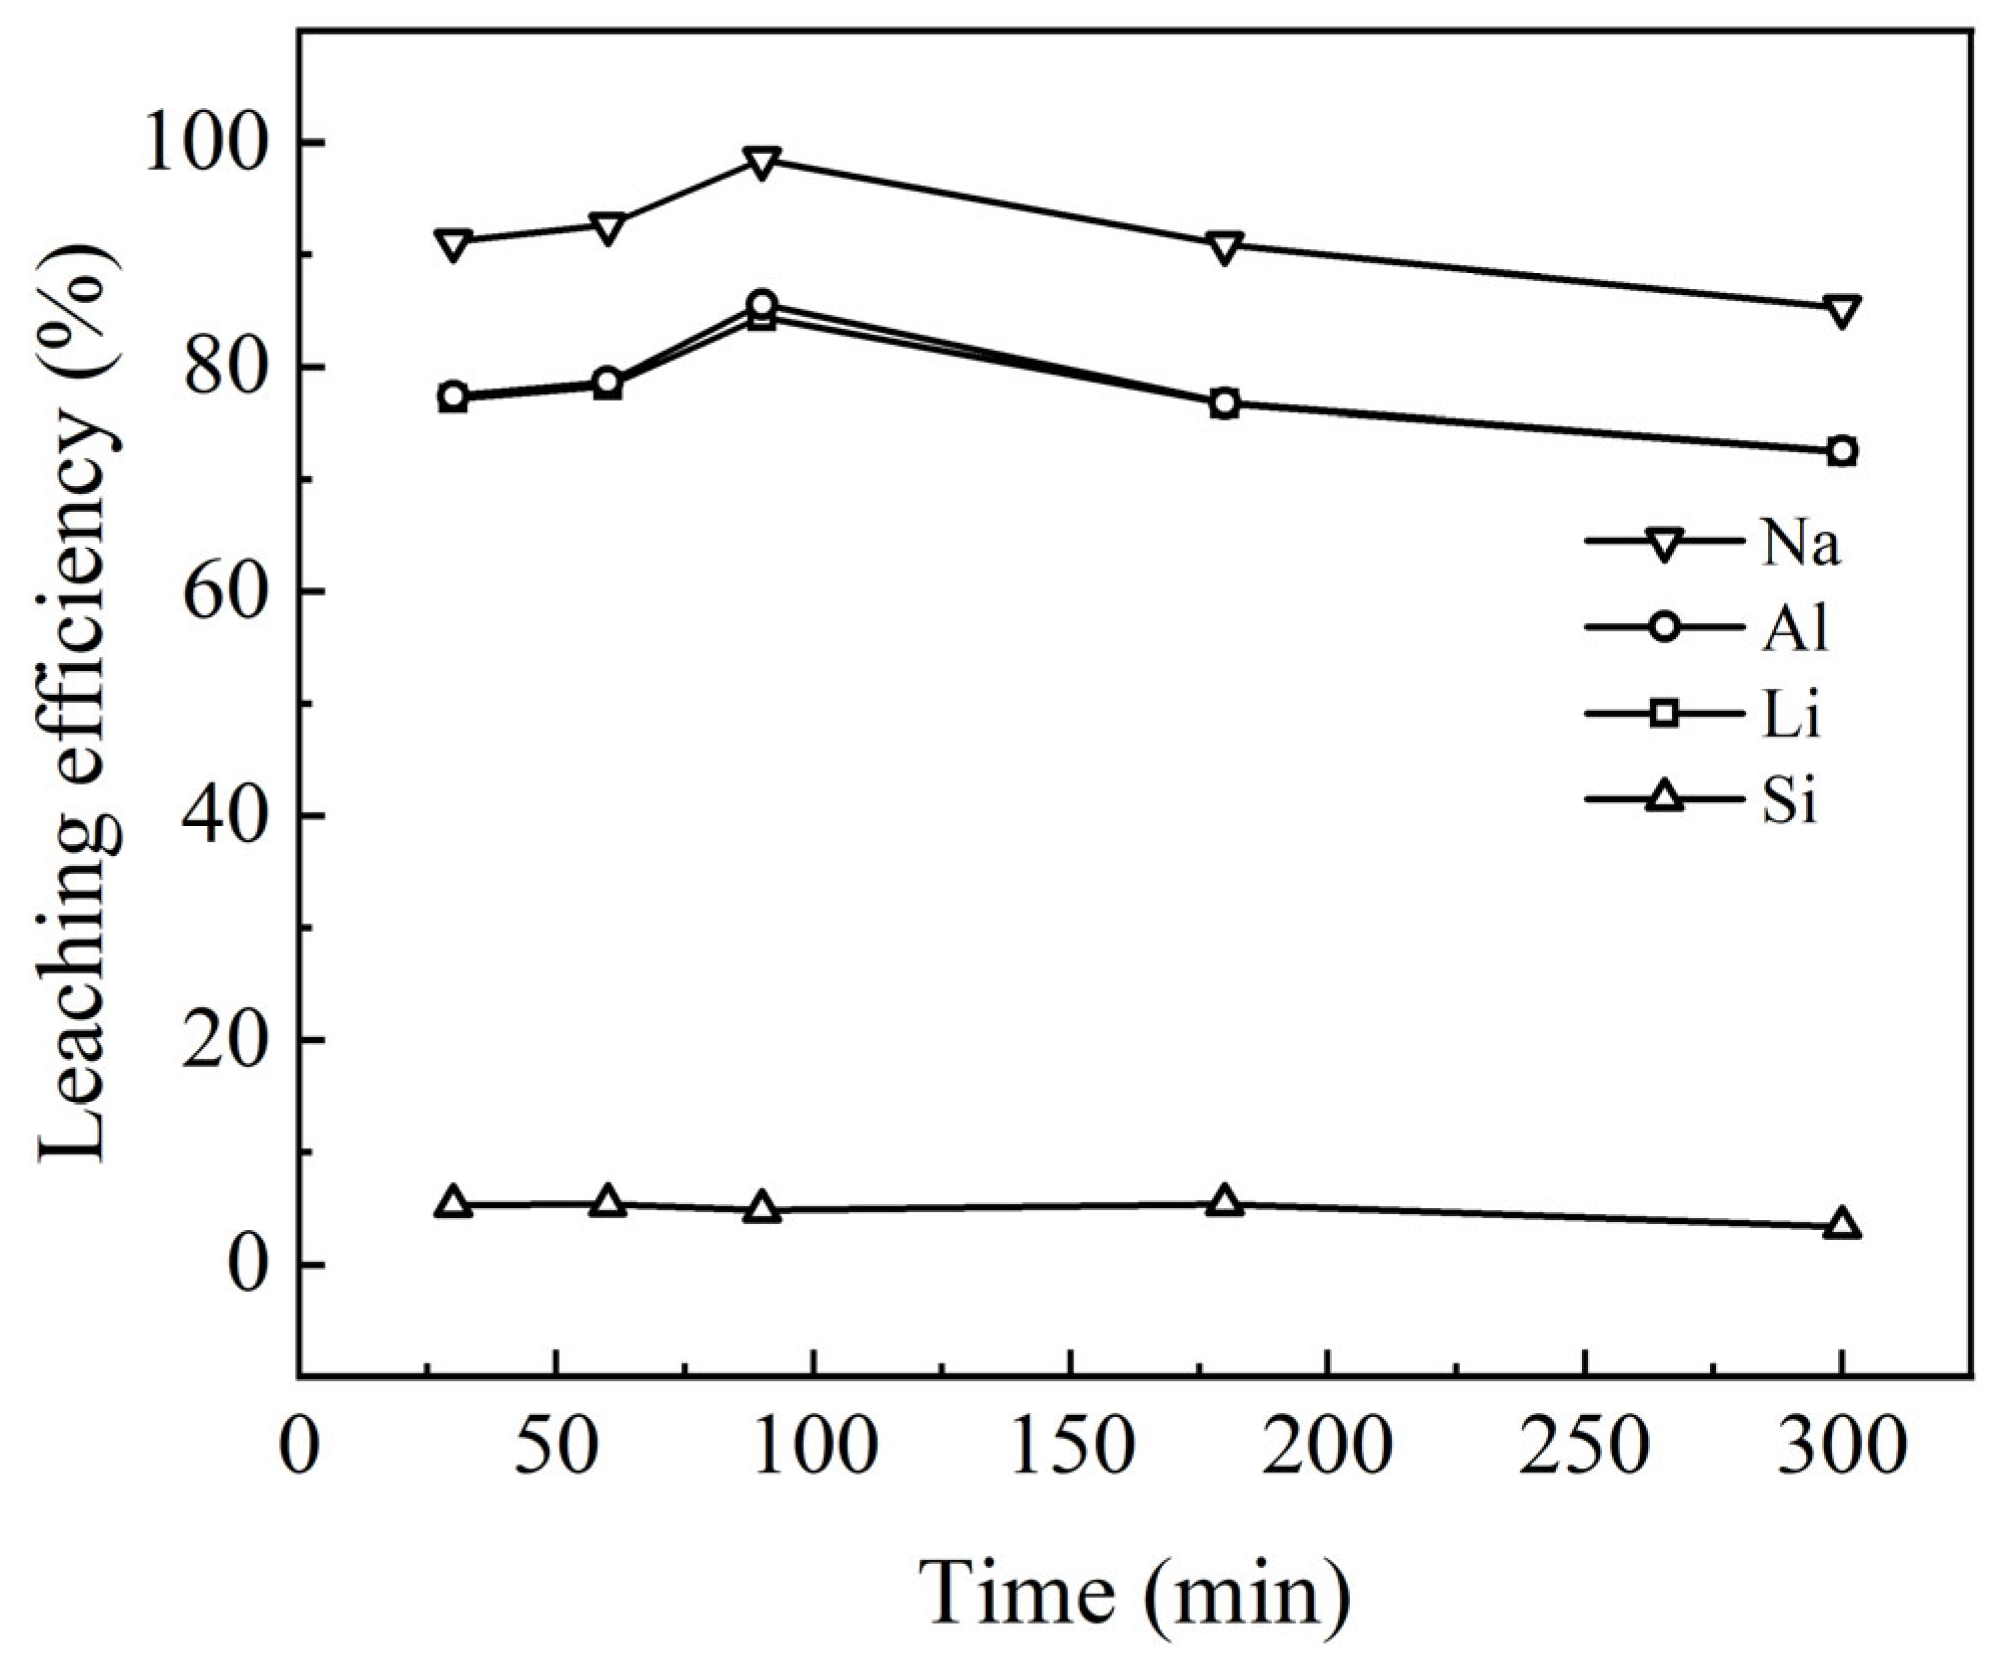
3.2.4. Effect of Reaction Time on Leaching Behavior
Reaction time is a critical parameter in the hydrometallurgical acid leaching process, as it directly influences both the leaching efficiency and the concentration of metal ions in the leachate. As reaction time increases, the kinetics of the leaching process tend to stabilize, approaching the theoretical maximum leaching rate, which optimizes chemical reaction efficiency during production. However, it is important to note that the leaching process may transition from chemical reaction control to diffusion control over time, potentially resulting in a decrease in the leaching rate.
The effects of reaction time on the recovery rates of lithium (Li), aluminum (Al), sodium (Na), and silicon (Si) from waste barrier material were evaluated. The results (
Figure 9) show that as reaction time increases, the leaching rates of Li, Al, and Na initially rise and then slightly decrease. The gel was detected in the residue, suggesting that with extended reaction time, dissolved elements may either adsorb onto or precipitate with the gel, returning to the residue. Consequently, the leaching efficiency of Na, Al, and Li decreased after 90 min. The optimal leaching rates for these elements were achieved after 90 min of reaction; the maximum leaching rates for Li, Al, and Na were found to be 98.8%, 84.9%, and 85.1%, respectively. These findings suggest that, under these conditions, the reaction between H
2SO
4 and these metals reaches equilibrium relatively quickly, resulting in the highest recovery rates.
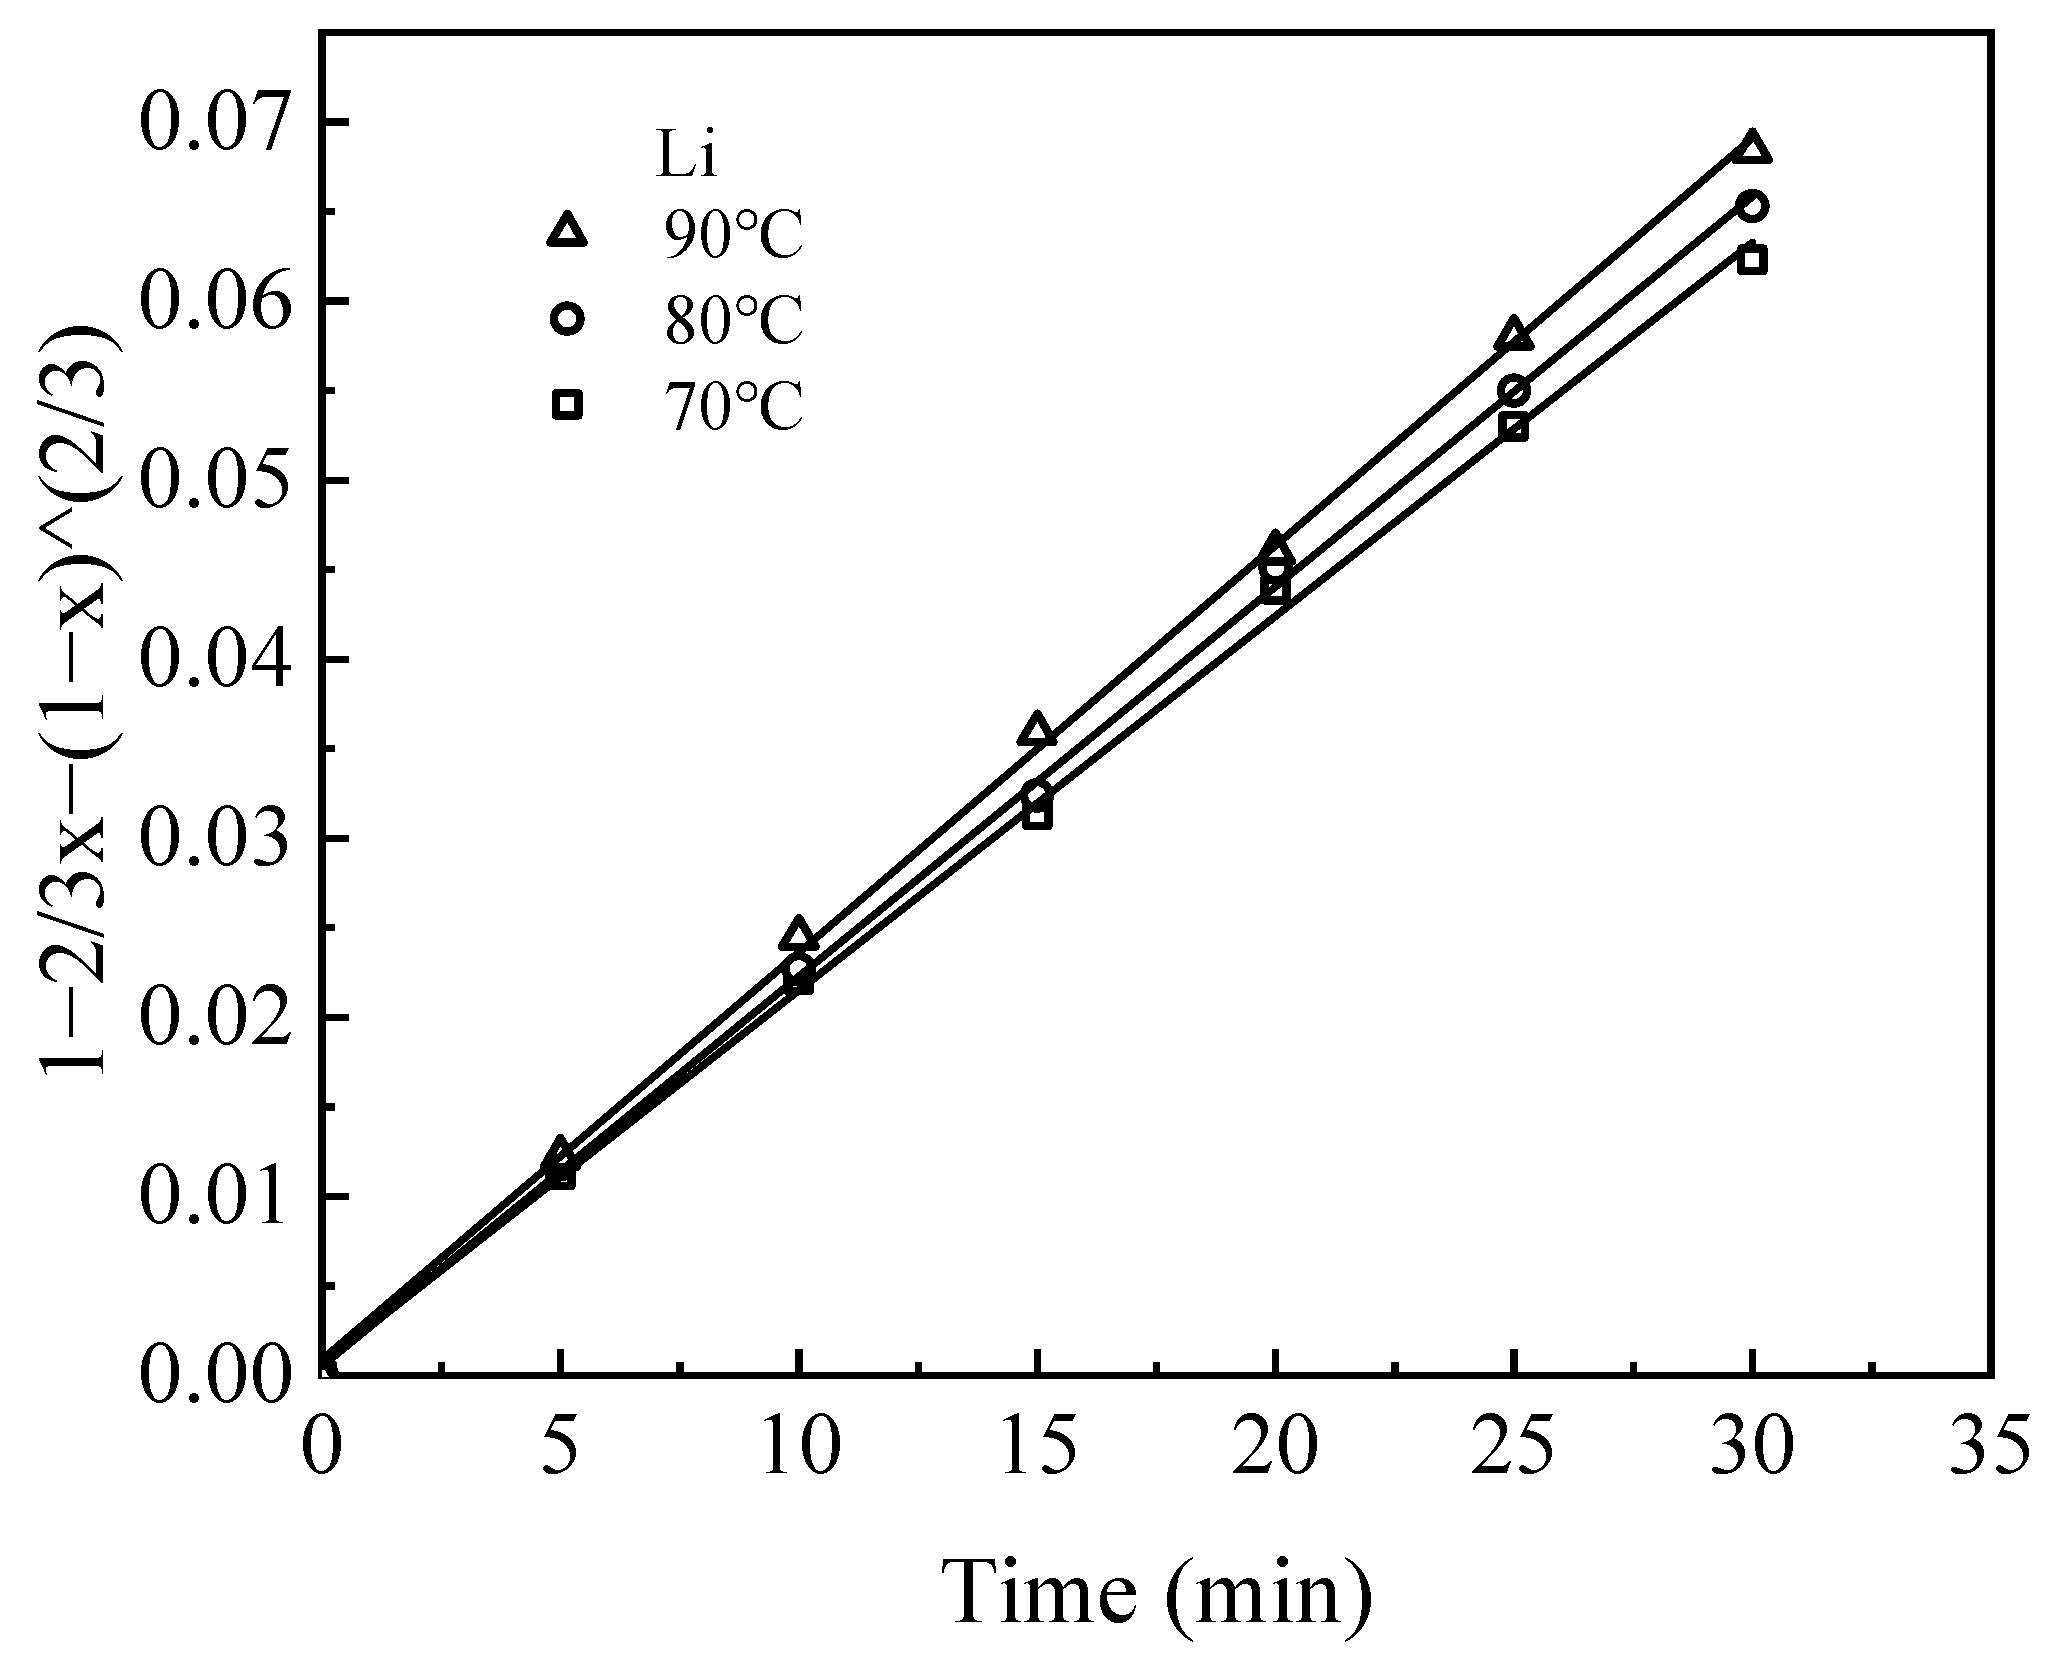
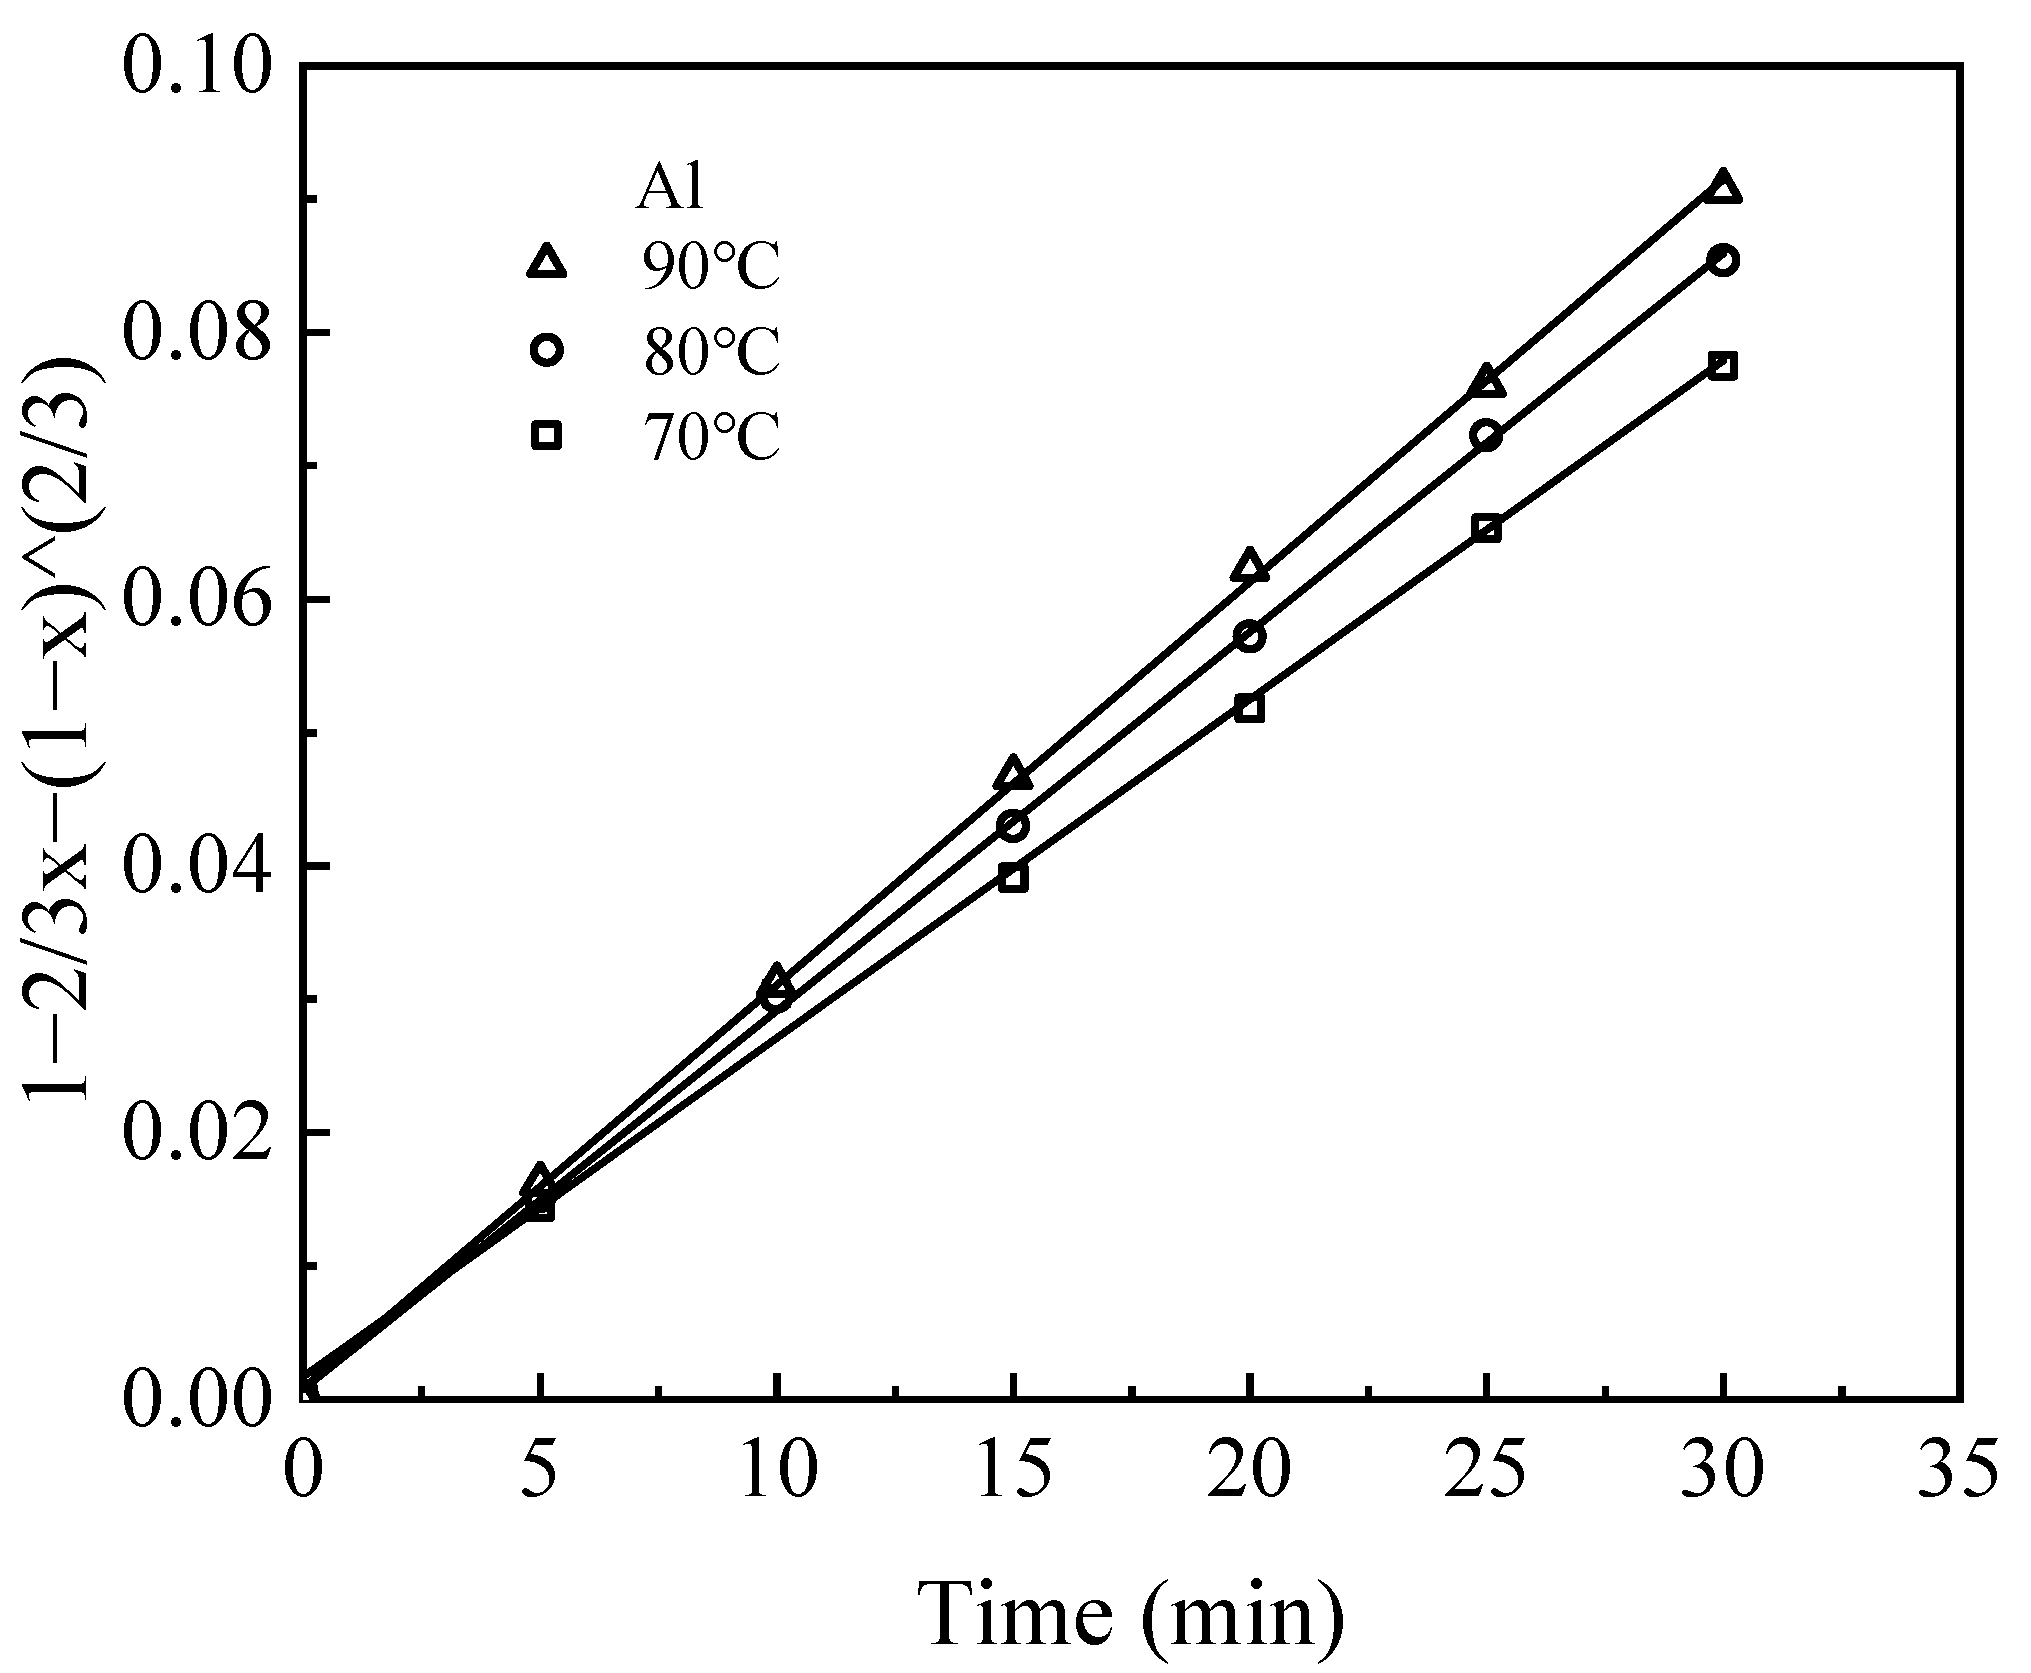
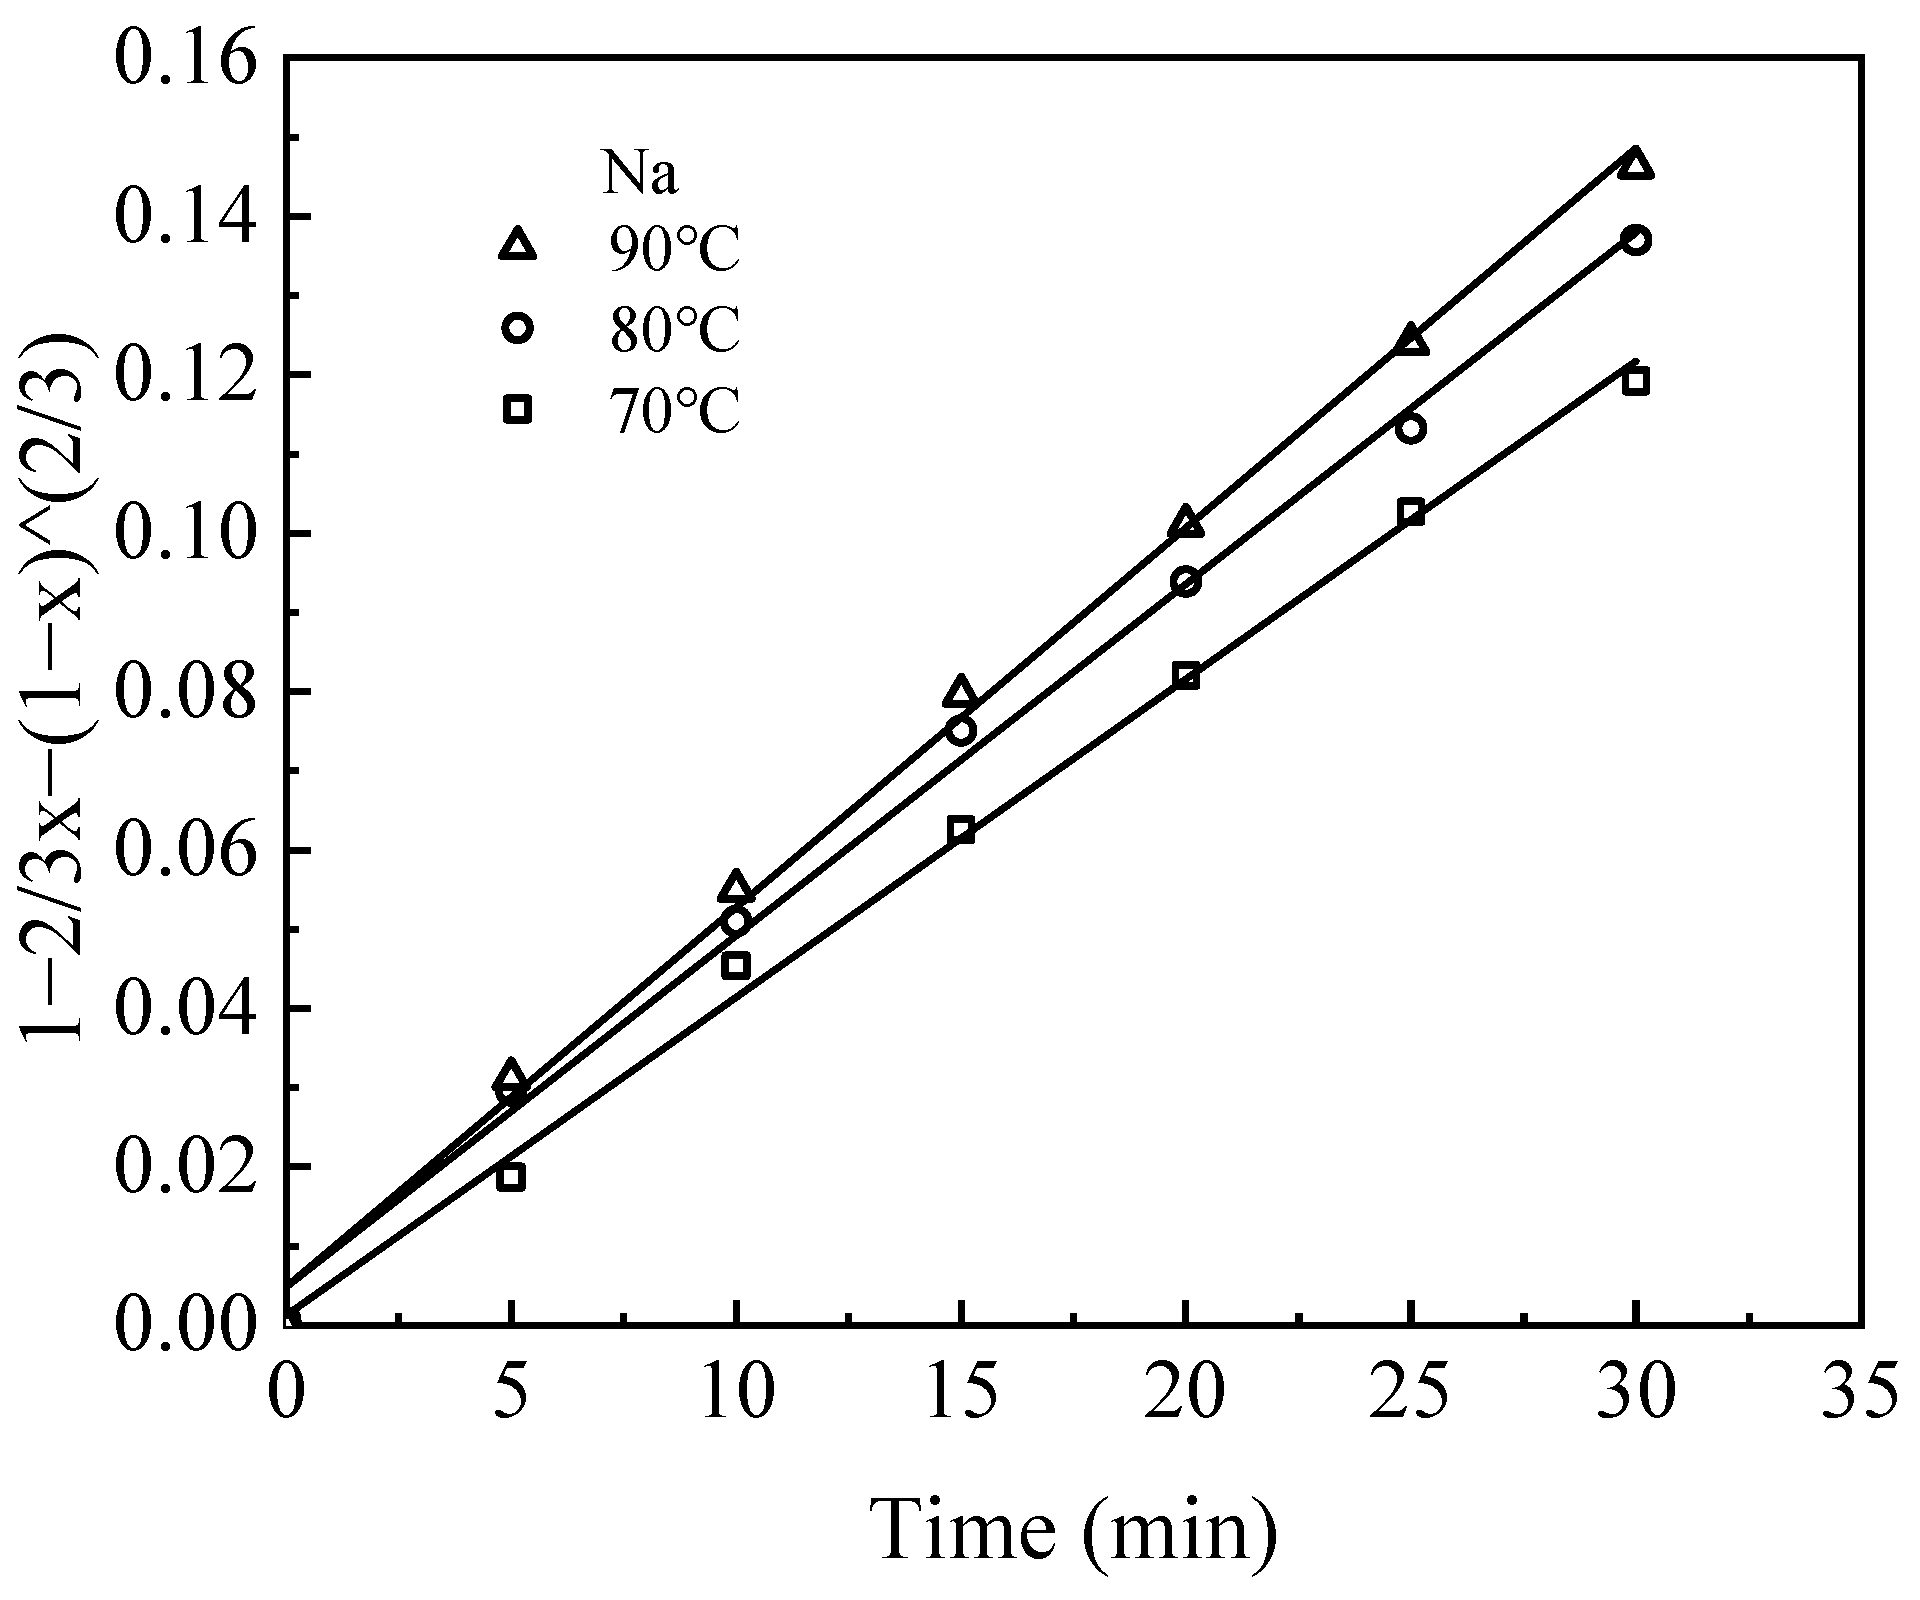
3.3. Leaching Kinetics
Leaching kinetic behavior was analyzed by fitting experimental data obtained from leaching tests at various temperatures using the shrinking core model (SCM) [
25]. The model considers both chemical reaction control and diffusion control of the solid phase product layer. The fitting parameters and corresponding kinetic equations for the leaching of Li, Al, and Na are summarized in
Table 2.
The leaching process, governed by liquid–solid interactions, was assumed to take place without the diffusion control of H2SO4 in solution, where H+ ions facilitate the dissolution of elements from the waste barrier into the solution. The dissolution of these elements occurs sequentially, with the elements releasing layer by layer during leaching.
The kinetic data for the leaching process closely follow the internal diffusion control model, as indicated by high R
2 values (>0.98) (
Figure 10,
Figure 11 and
Figure 12). The rate constant (k) for each element increases with temperature, reflecting the fact that elevated temperatures facilitate metal ion diffusion and mass transfer, thereby accelerating the rate at which equilibrium is reached [
26].
According to the Arrhenius equation (Equation (9)), the temperature dependence of the reaction rate constant can be described as [
27,
28]:
where k is the rate constant, A is the pre-exponential factor, E
a is the apparent activation energy, T is the thermodynamic temperature, and R is the molar gas constant. Activation energy values greater than 41.8 kJ/mol indicate chemical reaction control, while values between 4.18 and 12.54 kJ/mol suggest diffusion control [
29]. Based on the fitting data (
Figure 13), the activation energies for Li, Al, and Na leaching were 4.29 kJ/mol, 8.99 kJ/mol, and 9.11 kJ/mol, respectively. Since these values are all below 12.54 kJ/mol, the leaching process for these elements is primarily controlled by internal diffusion. These findings are consistent with typical wet metallurgical leaching systems, where diffusion limitation often dominates in porous media environments [
30]. The observed diffusion control mechanism implies that the leaching rate is mainly controlled by the transport of leaching agents through the boundary layer and solid product film, rather than inherent chemical reaction kinetics. It is worth noting that the difference in activation energy between different elements (4.29–9.11 kJ/mol) indicates the presence of significant diffusion barriers in their respective product layers. The relatively high value of aluminum (8.99 kJ/mol) and sodium (9.11 kJ/mol) may indicate the formation of a denser passivation layer during the dissolution process, which is consistent with the amphoteric properties of aluminum in acidic/alkaline media. The recent in situ atomic force microscopy study [
31] confirmed this phenomenon, demonstrating the differential surface reconstruction behavior between these metals. In acidic conditions, the dissolution of lithium occurs primarily through acid–base reactions, leading to the formation of lithium salts and the release of lithium ions (Li
+). In contrast to more complex metals, its activation energy is comparatively low.
3.4. Characterization of Leaching Residue
The leaching residue obtained under optimal conditions (0.9 M H
2SO
4, 90 min, 90 °C, liquid–solid ratio of 20:1) was subjected to X-ray diffraction (XRD) analysis to investigate phase changes during the leaching process. The dissolved weight of the waste barrier material is 58.8%. The results (
Figure 14) reveal that the major components of the leaching residue are Al
2O
3 and SiO
2. Notably, there is a pronounced hump in the 10–30° range, indicating a substantial presence of amorphous SiO
2 in the residue [
32]. The low leaching rate of silicon can be attributed to the formation of silica gel. Additionally, alumina (Al
2O
3) persists both before and after leaching, suggesting that the residual aluminum in the residue does not react with sulfuric acid or is encapsulated within the waste barrier material, preventing efficient leaching. This indicates that the raw material may contain α-Al
2O
3, which does not readily react with sulfuric acid, thereby limiting aluminum leaching.
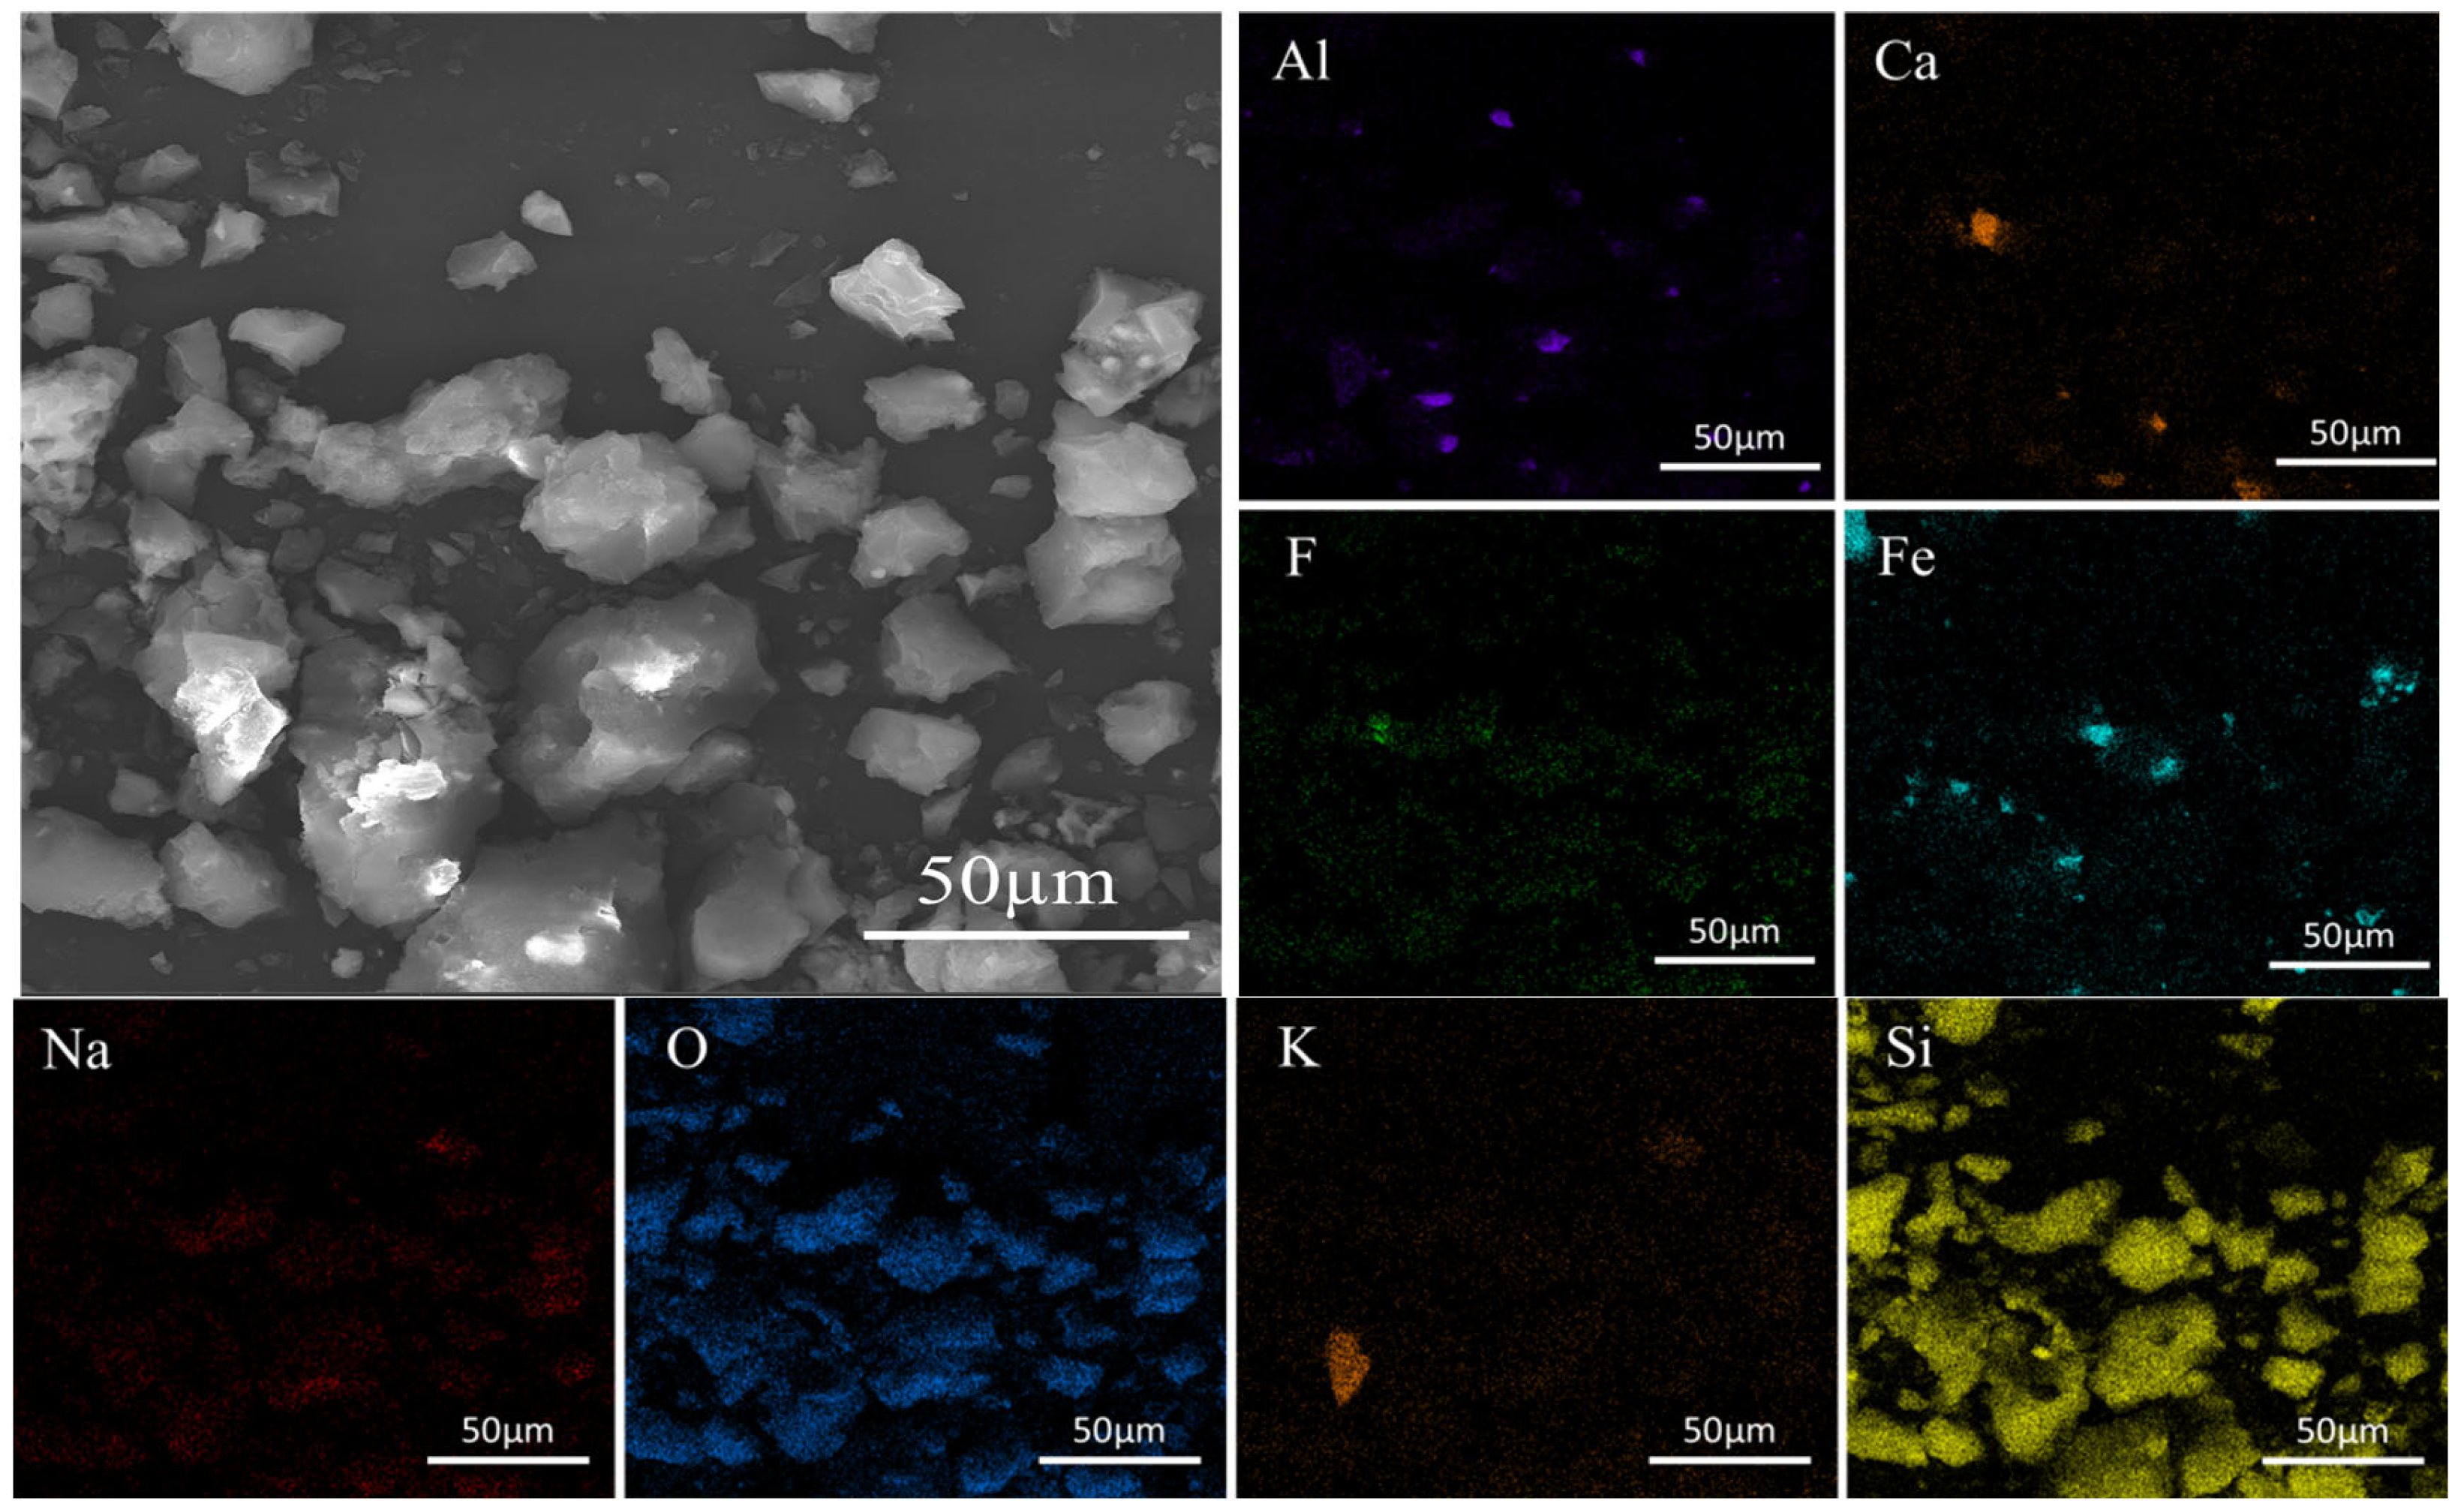
Scanning electron microscopy (SEM) images of the leaching residue (
Figure 15) reveal the formation of numerous irregular particles, smaller in volume compared to the original waste barrier material, with smoother and more rounded surfaces. Energy-dispersive spectroscopy (EDS) analysis (
Figure 15) indicates a significant decrease in the concentrations of Al, Na, and Ca, while Si and O are more widely distributed. This observation is consistent with the XRD results that amorphous SiO
2 formed in the residue.
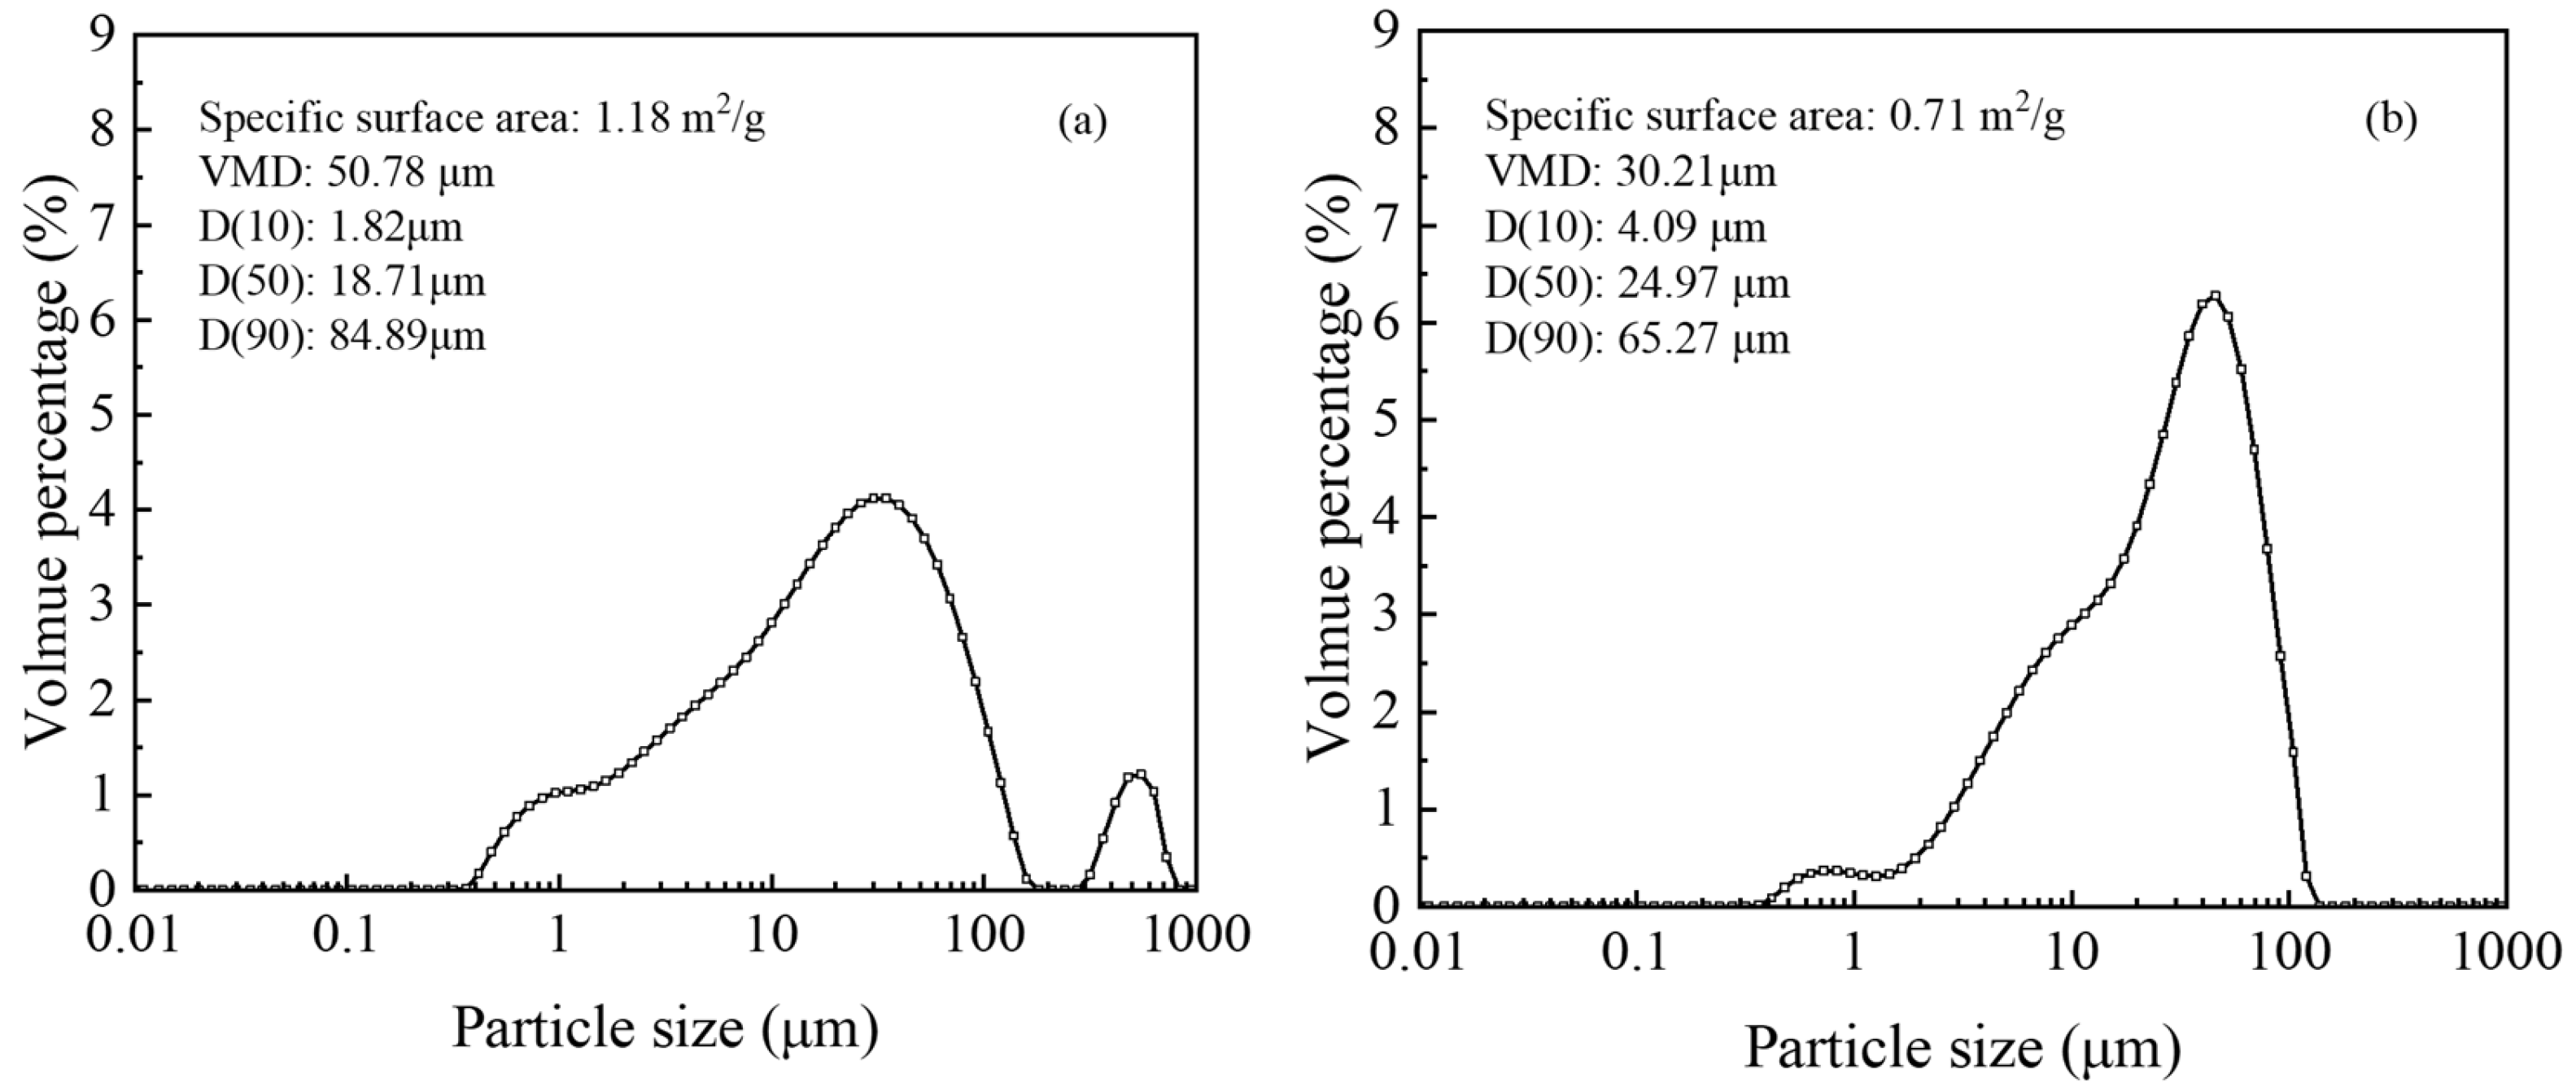
Particle size distribution and specific surface area were evaluated before and after acid leaching. The surface area of the residue decreased from 1.18 m
2/g to 0.71 m
2/g, while D
10 increased from 1.82 μm to 4.09 μm, suggesting that the leaching process dissolved smaller particles, resulting in a smoother surface, as shown by SEM images (
Figure 15). Analysis of particle size distribution revealed a reduction in volume-average diameter (VMD) and D
90, from 50.78 μm and 84.89 μm to 30.21 μm and 65.27 μm, respectively, indicating dissolution of both fine and larger particles during leaching (
Figure 16).
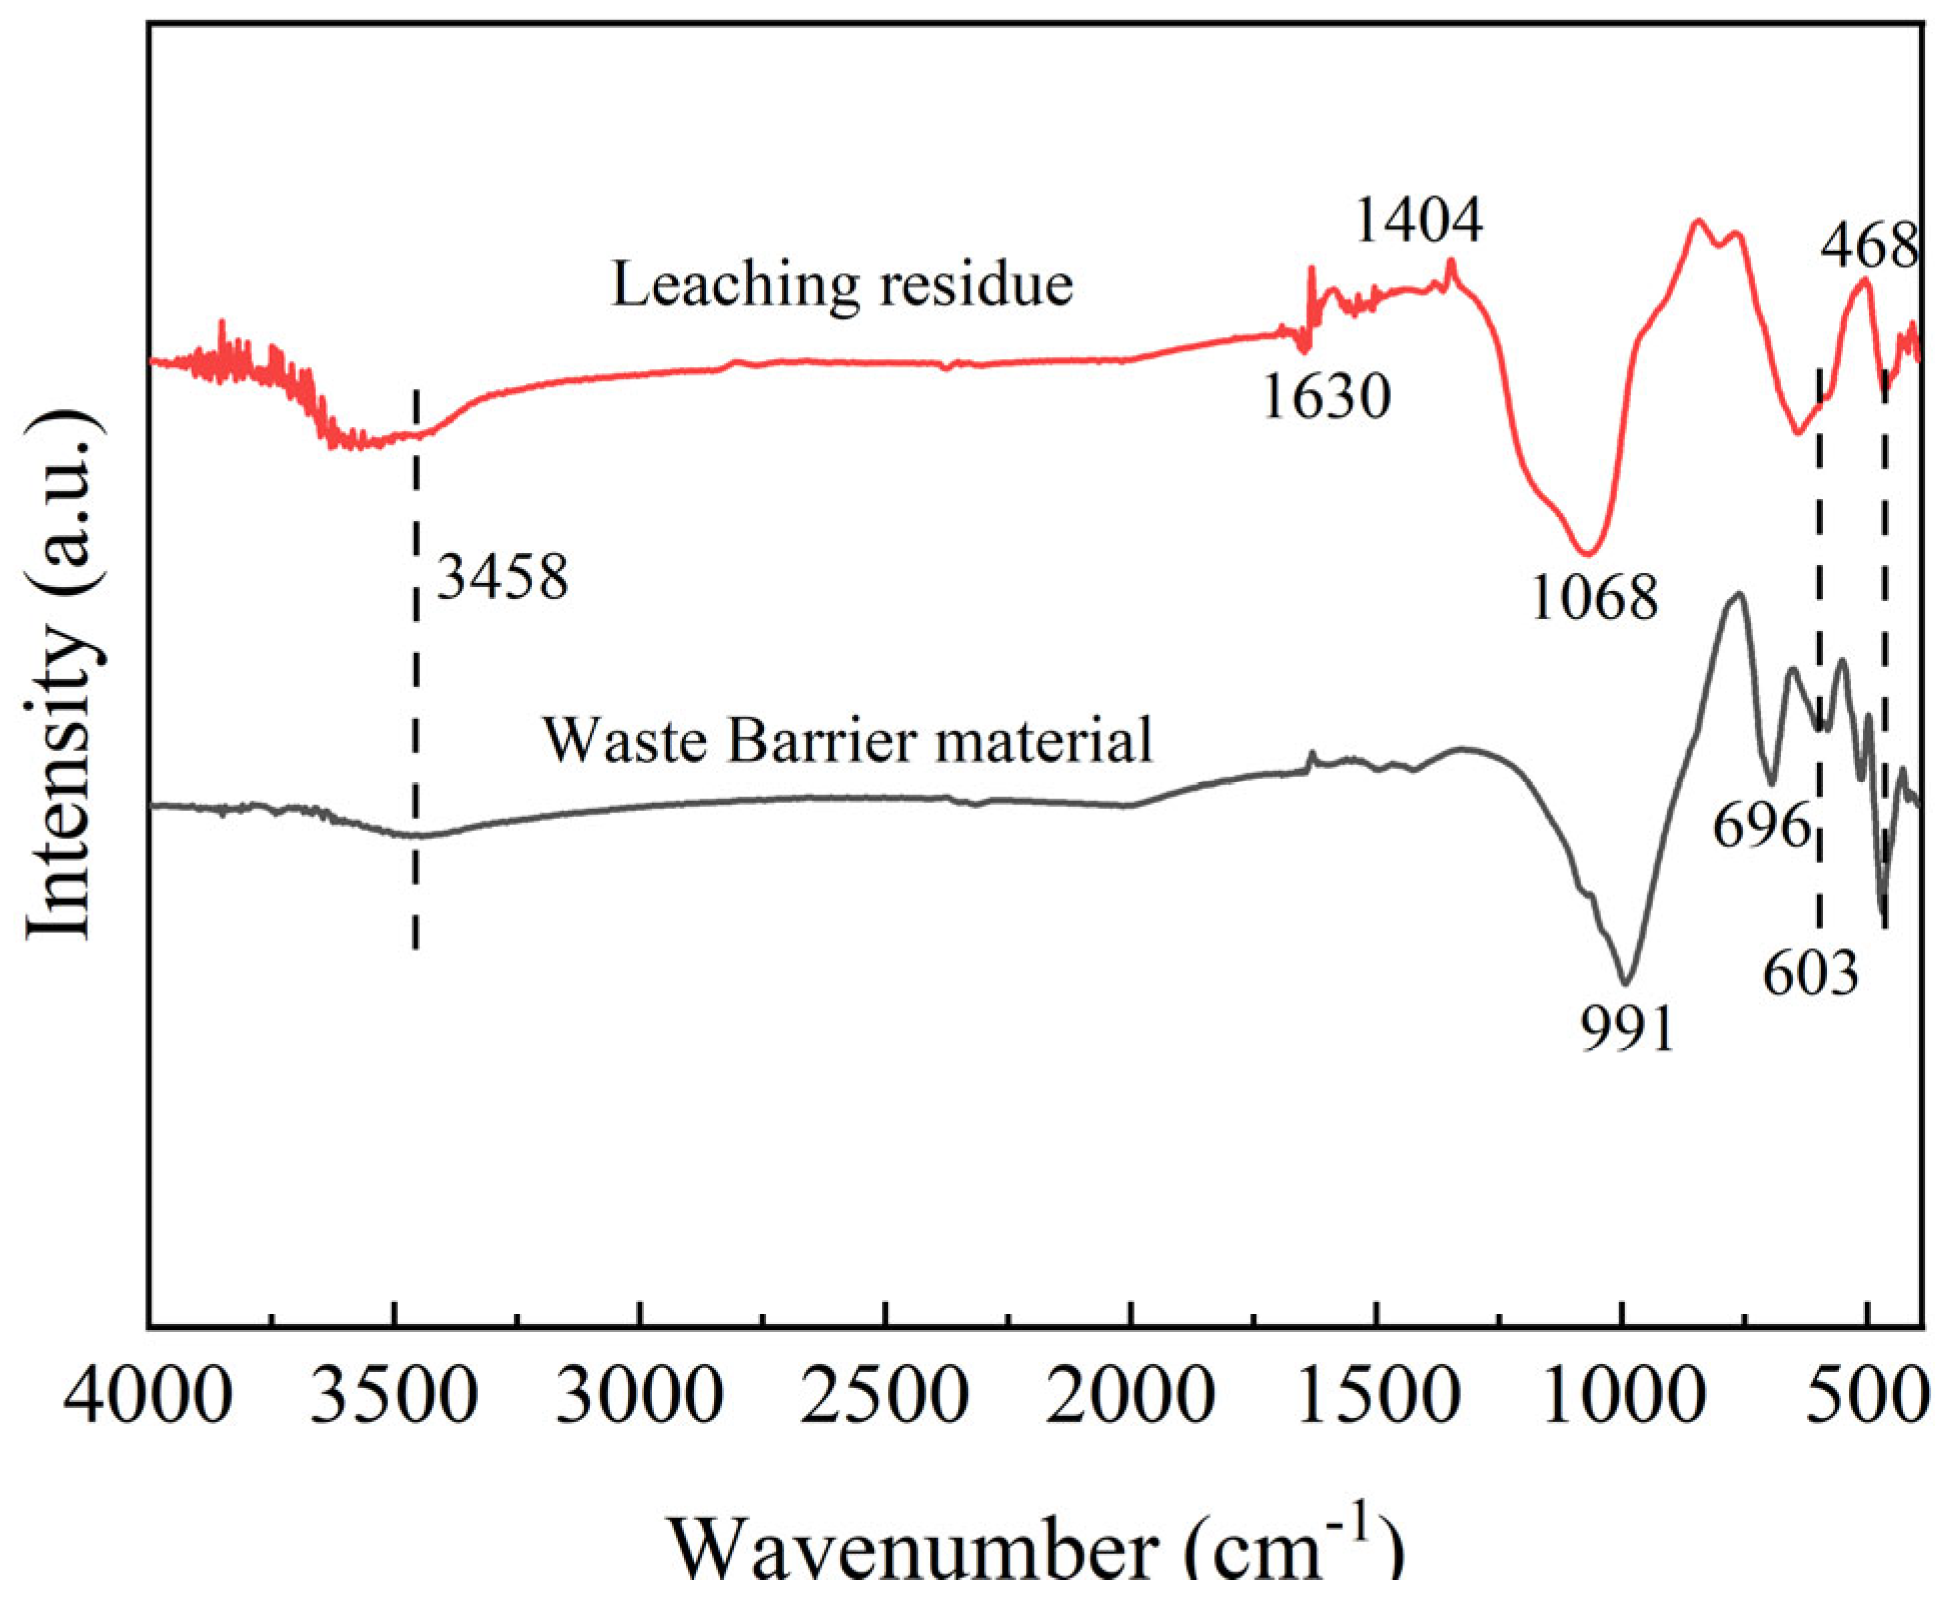
The FTIR spectra of the waste barrier material after sulfuric acid leaching under optimal conditions are shown in
Figure 17. The spectrum of the waste barrier material exhibits prominent infrared absorption peaks at 991, 696, 603, and 468 cm⁻
1, corresponding to nepheline [
33]. The Si-O-Al characteristic band of short-range ordered aluminosilicates is located at 975–1018 cm
−1 [
34]. The peak at 468 cm⁻
1 is identified as the symmetric stretching and bending vibration of the Si-O bond [
35]. As for leaching residue, the infrared adsorption peak of 468 cm⁻
1 is significantly weaker after acid leaching as expected. The infrared adsorption peaks of 1068 cm
−1 and 3458 cm
−1 in the leaching residue are attributed to amorphous silica. The Si-O-Si characteristic band of amorphous silica is located at 1000–1100 cm
−1. Amorphous silicon often contains some moisture, so there is a broad absorption peak of O-H stretching vibration located at 3300–3500 cm
−1 [
36]. A distinct band of water-soluble silicates in the leaching residue is observed near 1400 cm
−1, while the absorption feature at approximately 1630 cm
−1 is commonly assigned to the bending or deformation vibration of molecularly coordinated water bound to the Si-O-Si framework [
37]. The serrated peak was observed in the leaching residue in the 3600–3800 cm
−1 range, corresponding to the silanol (SiOH) stretching vibration [
38].
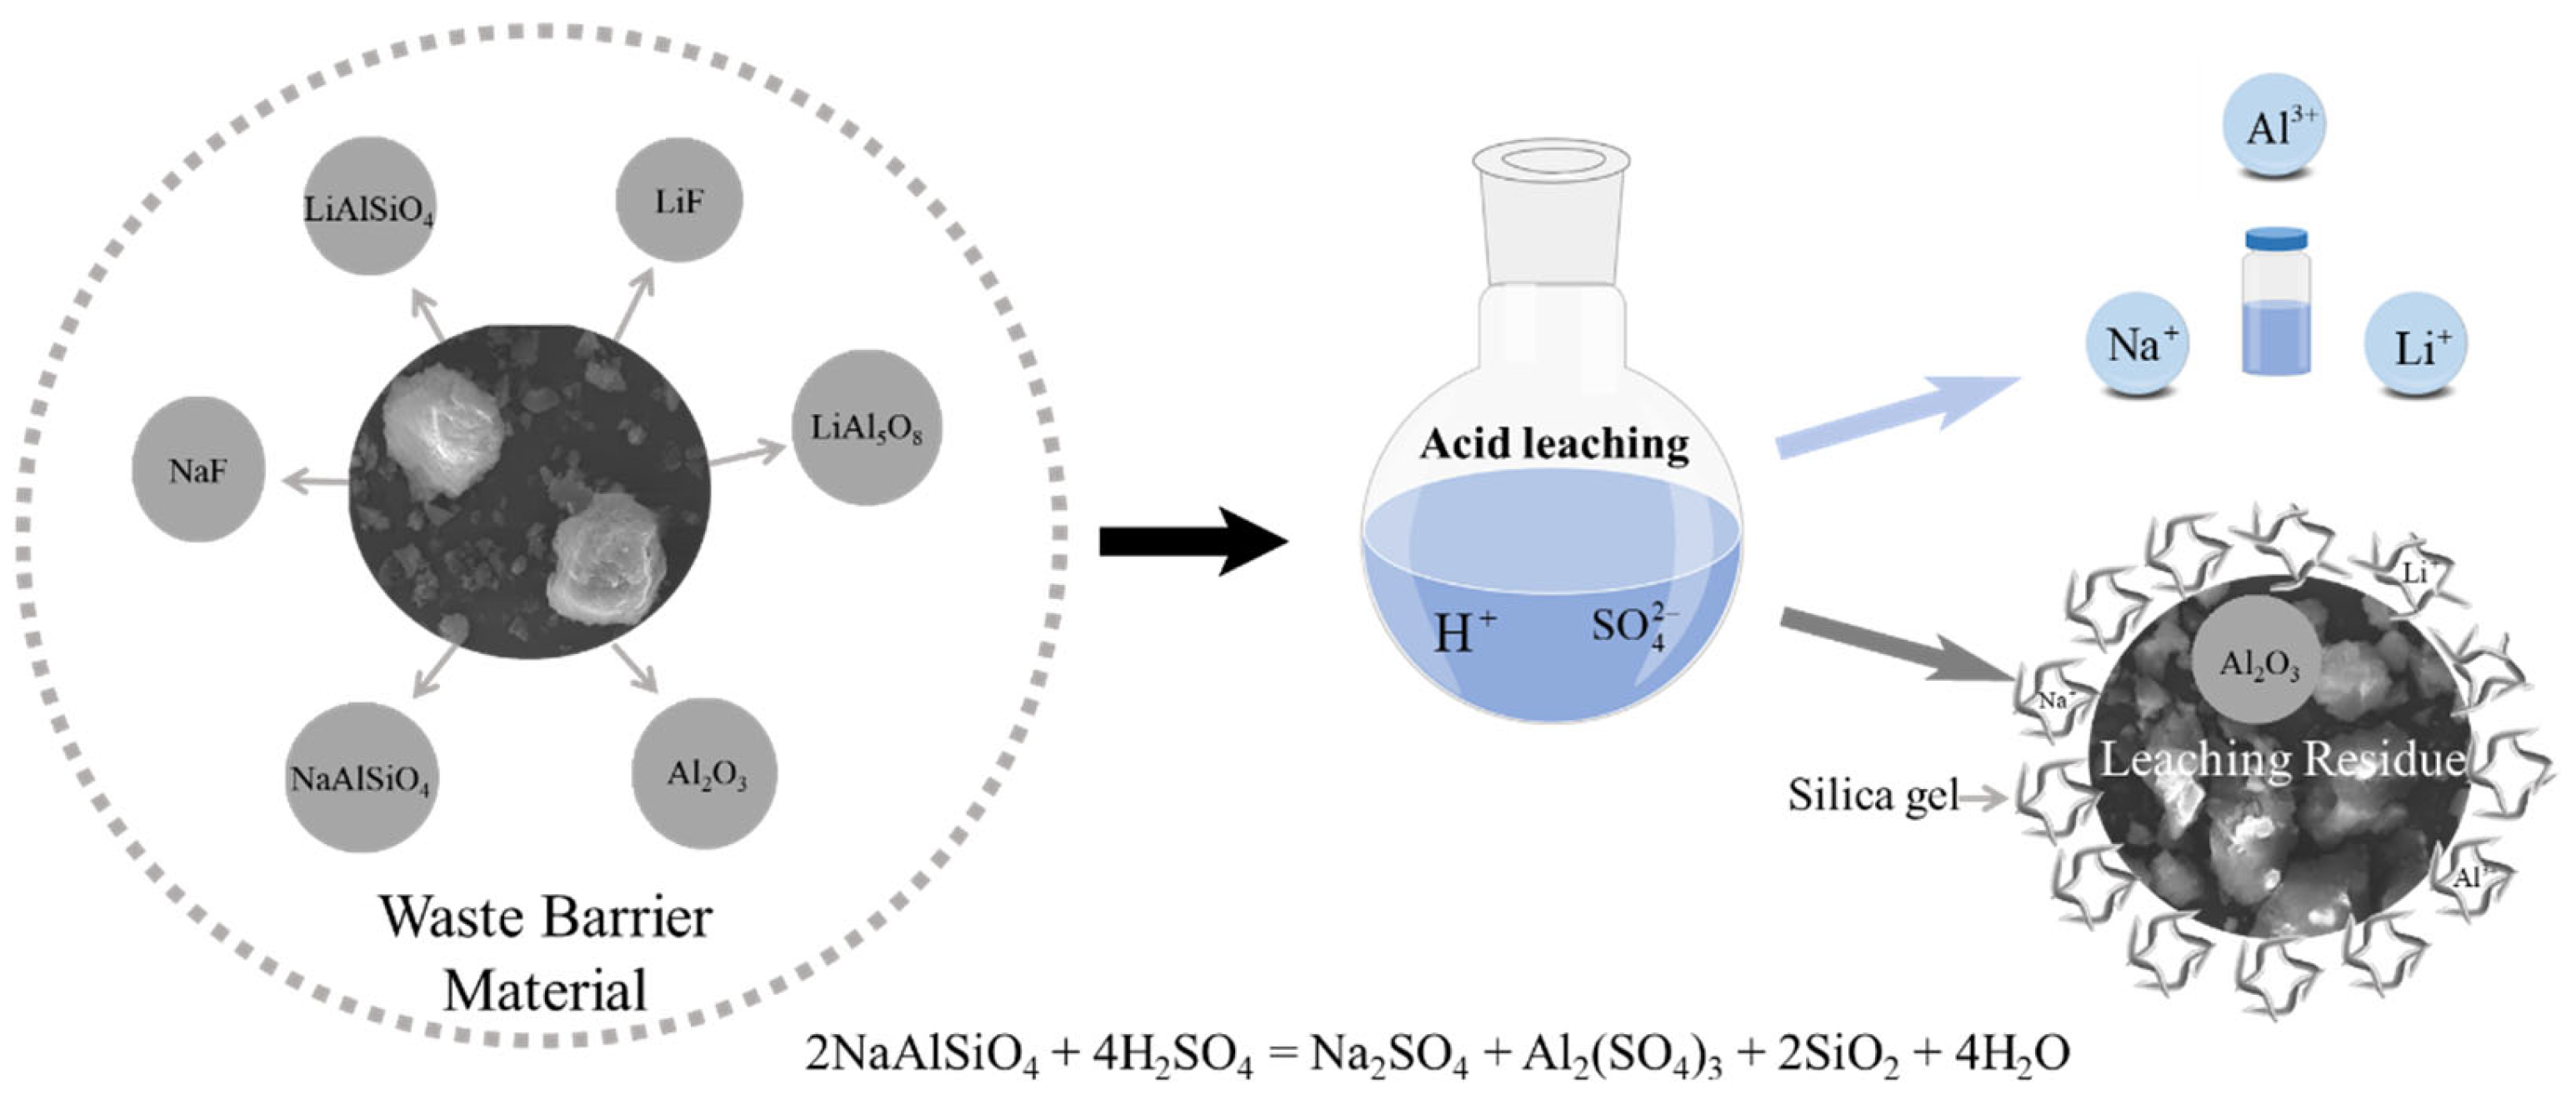
3.5. Proposed Mechanism
Based on
Section 3.1,
Section 3.2 and
Section 3.3, the leaching process of Na, Al, and Li from waste barrier material using H
2SO
4 can be understood through a “layered dissolution-diffusion-adsorption model” (
Figure 18). Initially, fluorine salts dissolve in water, and H
2SO
4 then reacts with the particle surface, further dissolving phases like LiF, LiAlSiO
4, and LiAl
5O
8, releasing Li⁺ and Al
3⁺ ions into the leachate as sulfate salts (Li
2SO
4, Al
2(SO
4)
3). Simultaneously, aluminum silicate minerals such as nepheline decompose, releasing Al
3⁺ and Na⁺ ions and forming a porous silica gel matrix. This gel acts as a dynamic barrier, adsorbing the leached ions and trapping unreacted particles, which restricts further acid penetration. Leaching kinetics follow a diffusion-controlled process, where the limiting factor is the transport of H⁺ ions and dissolved metal species through the silica gel, which thickens over time. As the process continues, the silica gel’s dual role—adsorption and encapsulation—reduces the leaching efficiency by limiting ion mobility and surface reactivity. This model integrates chemical dissolution, diffusion, and adsorption, illustrating the balance between metal extraction and passivation.
4. Summary and Conclusions
Overhaul slag is commonly leached directly for lithium recovery, but its complex composition requires advanced processing techniques. Selective treatment using optoelectronic sorting enhances resource recovery by concentrating waste barrier materials and cathode carbon blocks. While lithium extraction from cathode carbon blocks is well-documented, further research is needed on waste barrier material, particularly due to regional compositional differences. This study pioneers the sulfuric acid leaching process for extracting lithium, sodium, and aluminum from waste barrier material. It includes a systematic analysis of the thermodynamics, kinetics, and changes in phase and particle size before and after leaching.
Geographical variations in waste barrier composition impact leaching efficiency. Future research should examine how regional mineralogy and contaminants influence leaching and tailor methods accordingly. Silica gel hinders acid penetration and traps ions. Developing additives or modifying processes, like temperature control and surfactants, can suppress gel formation, while post-leaching treatments can remove it. Testing alternative leaching agents or hybrid methods, such as ultrasound-assisted leaching, can enhance lithium recovery while minimizing silica dissolution. Addressing gaps in material variability, process scalability, and element recovery can advance sustainable lithium extraction from industrial wastes. Ongoing investigations will continue, with the following conclusions drawn at this stage:
1. Under the optimal conditions of 0.9 mol/L H2SO4 concentration, a H2SO4-to-waste barrier material mass ratio of 20:1, a reaction temperature of 90 °C, and a leaching time of 90 min, the leaching efficiencies are 84.9% for lithium, 85.1% for aluminum, 98.8% for sodium, and 4.8% for silicon.
2. The sulfuric acid leaching process for Li, Al, and Na can be described using the unreacted shrinking core model and is governed by internal diffusion. The activation energies (Ea) for the leaching reactions of Li, Al, and Na are 4.29 kJ/mol, 8.99 kJ/mol, and 9.11 kJ/mol, respectively.
3. XRD analysis reveals significant compositional differences between the raw material and the leaching residue under optimal conditions. The major components of the raw material include nepheline, corundum, and sodium fluoride. In contrast, the leaching residue mainly consists of SiO2, Al2O3, and silica gel.
4. Silica gel formed in the residue functions as a dynamic barrier, adsorbing leached ions and trapping unreacted particles, which restricts further acid penetration.


