Article

The Role of Fluid Chemistry in the Diagenetic Transformation of Detrital Clay Minerals: Experimental Insights from Modern Estuarine Sediments

by
Anas Muhammad Salisu
1,
Abdulwahab Muhammad Bello
2,
Abduljamiu O. Amao
2 and
Khalid Al-Ramadan
1,2,*
1
Geosciences Department, College of Petroleum Engineering and Geosciences, King Fahd University of Petroleum and Minerals, Dhahran 31261, Saudi Arabia
2
Center for Integrative Petroleum Research, College of Petroleum Engineering and Geosciences, King Fahd University of Petroleum and Minerals, Dhahran 31261, Saudi Arabia
*
Author to whom correspondence should be addressed.
Minerals 2025, 15(3), 317; https://doi.org/10.3390/min15030317
Submission received: 3 February 2025 / Revised: 1 March 2025 / Accepted: 11 March 2025 / Published: 19 March 2025
(This article belongs to the Section Clays and Engineered Mineral Materials)

Abstract

:
The diagenetic transformation of detrital clay minerals significantly influences sandstone reservoir quality, with fluid chemistry and temperature playing key roles in dictating transformation pathways during burial diagenesis. While these processes are well-documented in basinal settings, the diagenetic alterations of sediments in dynamic environments like estuaries remain underexplored. This study investigates the impact of fluid composition on the transformation of modern estuarine sediments through hydrothermal experiments using sediments from the Gironde estuary, SW France. A range of natural and synthetic solutions including seawater (SW), 0.1 M KCl (SF1), 0.1 M NaCl, KCl, CaCl2·2H2O, MgCl2·6H2O (SF2), estuarine water (EW), and 0.1 M Na2CO3 (SF3) were used under temperatures from 50 °C to 250 °C for 14 days, with a fixed fluid-to-sediment ratio of 10:1. The results revealed distinct mineralogical transformations driven by fluid composition. Dissolution of detrital feldspars and clay materials began at lower temperatures (<100 °C). The authigenic formation of smectite and its subsequent illitization in K-rich fluids (SW, SF1) occurred between 150 °C and 250 °C, replicating potassium-driven illitization processes observed in natural sandstones. Additionally, chlorite formation occurred through the conversion of smectite in SF2 and EW. Geochemical analysis showed that SF2 produced Mg-rich chlorites, while EW yielded Fe-rich chlorites. This aligns with diagenetic trends in coastal environments, where Fe-rich chlorites are typically associated with estuarine systems. The resulting authigenic illite and chlorite exhibited morphological and chemical characteristics similar to those found in natural sandstones, forming through dissolution-crystallization and solid-state transformation mechanisms. In contrast to illite and chlorite, SF3 produced entirely different mineral phases, including halite and analcime (zeolite), attributed to the high alkalinity and Na-rich composition of the solution. These findings provide valuable insights into the role of fluid chemistry in the diagenetic alteration of modern sediments and their implications for the evolution of sandstone reservoirs, which is critical for energy exploration and transition.

Graphical Abstract

1. Introduction

The influence of clay minerals on sandstone reservoir quality has been widely documented [1,2,3,4,5,6,7,8,9]. Grain-coating clays, such as chlorite, illite, and mixed-layer clays, have been shown to inhibit authigenic quartz cementation in deeply buried reservoirs, thereby preserving reservoir quality [10,11,12,13]. Conversely, pore-filling clays, including smectite, kaolinite, and illite, occupy pore spaces and obstruct fluid flow, significantly reducing reservoir porosity and permeability [14,15,16,17]. Numerous studies have investigated the occurrence and distribution of grain-coating clays and their role in preserving reservoir quality [2,18,19,20]. These studies highlight the influence of depositional environments on the distribution of authigenic clay coats. For instance, chlorite commonly occurs in fluvial to marginal marine environments [18], whereas smectite is prevalent in nearshore marine sediments [21]. Diagenetic clay coatings develop through the recrystallization of detrital precursors or direct precipitation from pore fluids during burial diagenesis [22,23,24]. These clay coatings significantly influence fluid flow, mineral stability, and reservoir quality across sedimentary systems worldwide, including marginal marine environments [5,9,25].
Modern marginal marine sediments, such as those found in estuarine environments, often contain detrital clay coatings that vary in texture and composition based on depositional sub-environments [26]. These variations create heterogeneities that influence diagenesis and present significant challenges for reservoir quality prediction models [27]. Recent works have explored the controls influencing the occurrence and distribution of detrital grain-coating clays in modern marginal marine settings [28,29,30,31,32,33]. However, the physicochemical factors controlling the diagenetic transformation of these sediments remain understudied. Understanding these transformation pathways is particularly important as marginal marine reservoirs gain prominence for groundwater and energy exploration [34], carbon capture and storage (CCS), and hydrogen storage [9,27] due to their porosity, permeability, and mineralogical stability. The ability to predict how clay minerals will evolve under burial conditions is essential for evaluating the long-term storage capacity and injectivity of these reservoirs.
Variations in fluid chemistry, temperature, and pressure dictate the transformation pathways of detrital materials during burial diagenesis [34,35,36,37]. For example, the presence of Al3+, Mg2+, and Fe2+ in formation brines is crucial for chlorite formation during fluid–rock interactions [38,39], while K+ is essential for the precipitation of authigenic illite [14,30,40,41]. Changes in the fluid–rock ratio, fluid chemistry, and pH of formation water can result in the development of different authigenic clay minerals during burial, even when derived from the same detrital mineral precursors [42,43]. Consequently, understanding the mineralogical and geochemical pathways that govern clay diagenesis has become increasingly important, particularly in the context of sustainable practices such as geothermal energy production and carbon capture and storage (CCS) technologies, which are vital for the energy transition.
This study investigates the role of fluid chemistry in the diagenetic alteration of detrital clay minerals, using sediments from the Gironde estuary, SW France, as an analog for ancient marginal marine sandstones. These fresh sediments, free from extensive weathering or diagenetic alterations, provide a suitable framework for simulating burial diagenesis under controlled conditions and investigating the formation of clay minerals during the sand-to-stone transition. Hydrothermal reactor experiments were conducted to replicate diagenetic conditions, exposing sediments to fluids with varying pH and compositions under controlled temperatures. The specific objectives were to (1) simulate the diagenetic formation of clay minerals in modern estuary sediments as analogs for deep burial diagenesis; (2) determine the mechanisms of formation for these clay minerals; (3) assess the impact of fluid chemistry on clay mineral transformation pathways; and (4) evaluate the relevance of the hydrothermal experiments to natural sandstone diagenesis.

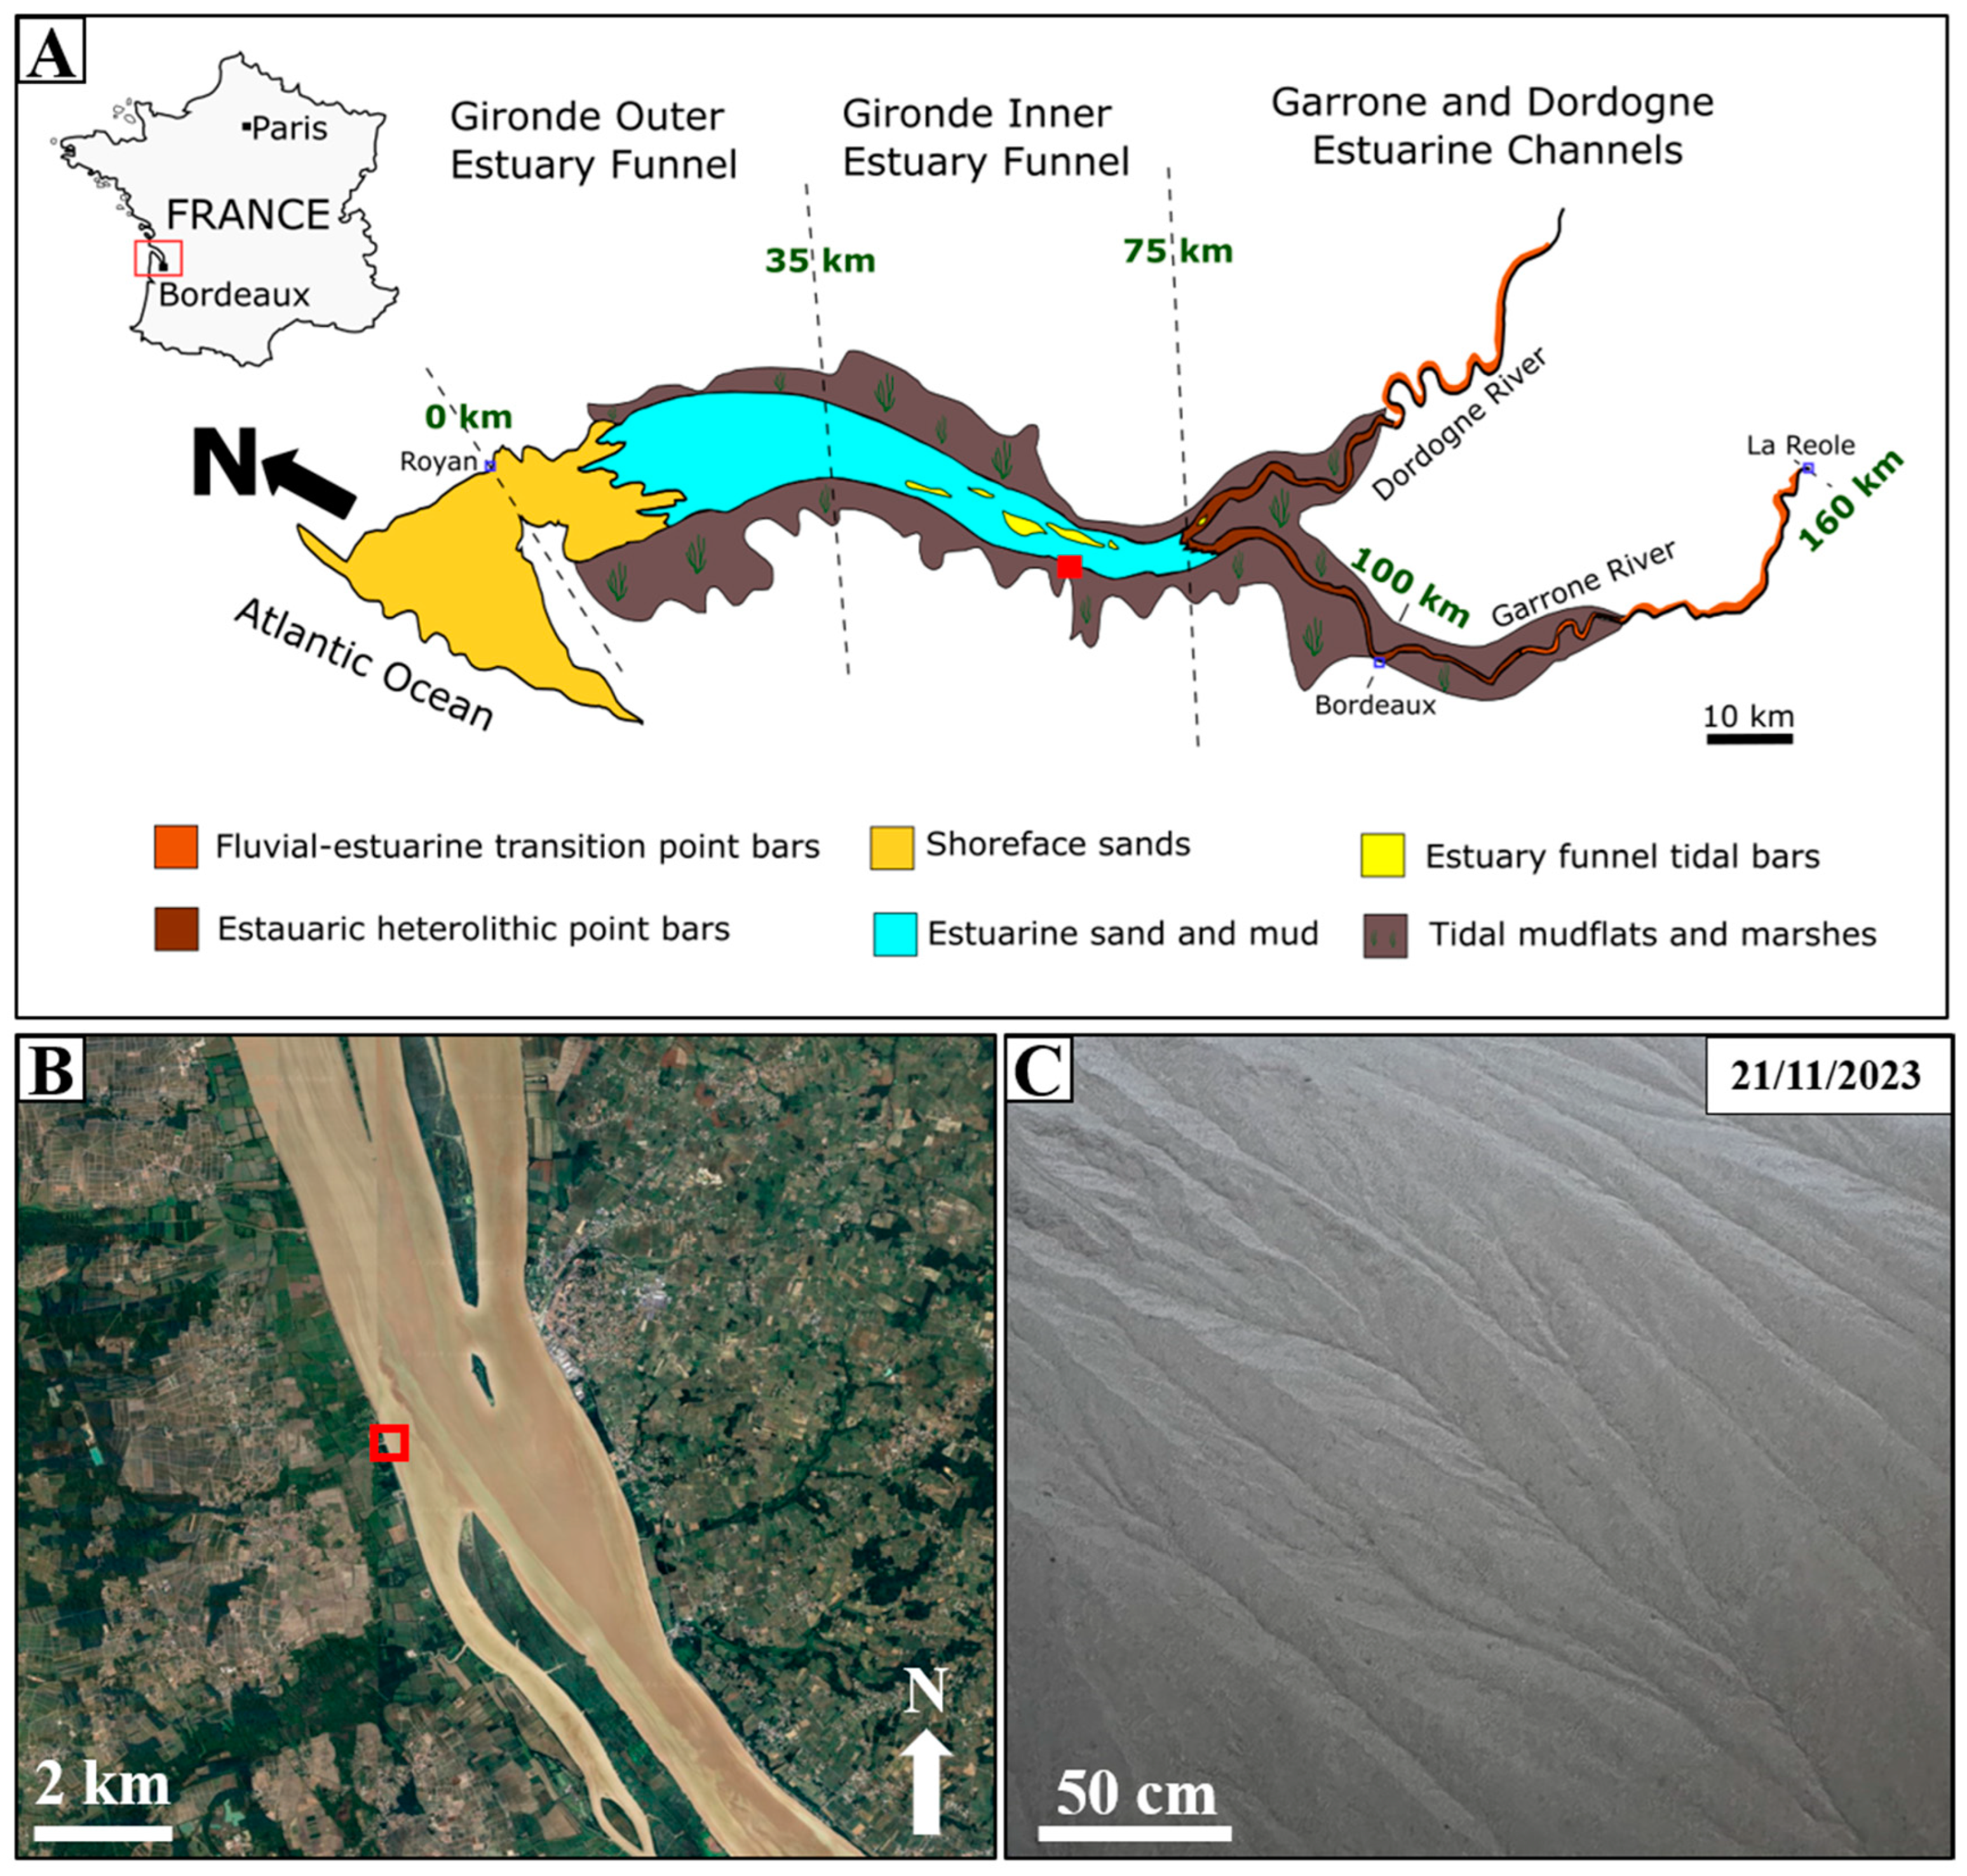
2. Study Area and Geologic Background of the Sample

This study utilized sediments from the modern Gironde estuary, located in the Nouvelle-Aquitaine region of southwestern France (Figure 1A). The estuary is one of Europe’s largest estuarine systems, covering an approximate surface area of 630 km2 [32,44]. It extends about 160 km inland from its mouth to its upstream tidal limit [31]. The estuary is fed by two principal rivers, the Garonne and Dordogne, which drain waters from the Pyrenees and the Massif Central, respectively, forming an extensive watershed [45]. The Gironde estuary is macrotidal and characterized by semi-diurnal tides, with tidal ranges varying from 1.5 m during neap tides to 5.5 m during spring tides [32,46]. Its morphology and hydrodynamics are shaped by a complex interplay of fluvial and tidal processes, resulting in different patterns of sediment transport and deposition [31]. The estuary is typically divided into three main zones based on its morphology and hydrodynamics: the outer estuary funnel, the inner estuary funnel, and the Garonne and Dordogne estuarine channels [31,47,48]. A defining feature of the Gironde estuary is its well-developed Turbidity Maximum Zone (TMZ), a highly dynamic region where suspended sediment concentrations can reach up to 300 g/L during slack water [46,49]. The TMZ, which varies seasonally, facilitates hydrodynamic trapping of fine-grained sediments, including clay minerals, fine quartz grains, and organic matter [32].
The sediment distribution within the estuary reflects its heterolithic nature: sandy tidal bars, point bars, and fine-grained intertidal and subtidal deposits [31]. Specifically, the samples used in this study were collected from estuarine sands and muds within the inner estuary funnel (Figure 1A–C). The estuary’s sedimentary framework, with its extensive muddy deposits on estuarine banks and intertidal flats, serves as an analog to many ancient sedimentary systems. Understanding these systems is essential for interpreting sedimentary processes, including the authigenesis of clay minerals. Additionally, the origin and distribution of detrital clay coats within the Gironde estuary are well documented [31,32,50,51].

3. Methods

This study integrated several laboratory experiments and analytical techniques, including hydrothermal reactor experiments, scanning electron microscopy (SEM), energy dispersive X-ray spectroscopy (EDS), X-ray fluorescence (XRF), X-ray diffraction (XRD; bulk and clay fraction), scanning transmission electron microscopy (STEM), inductively coupled plasma optical emission spectroscopy (ICP-OES), and focused ion beam scanning electron microscopy (FIB-SEM). All experiments and analyses were conducted at the laboratories of the Center for Integrative Petroleum Research, College of Petroleum Engineering and Geosciences, King Fahd University of Petroleum and Minerals, Saudi Arabia. The detailed methodologies for each analysis are outlined below.

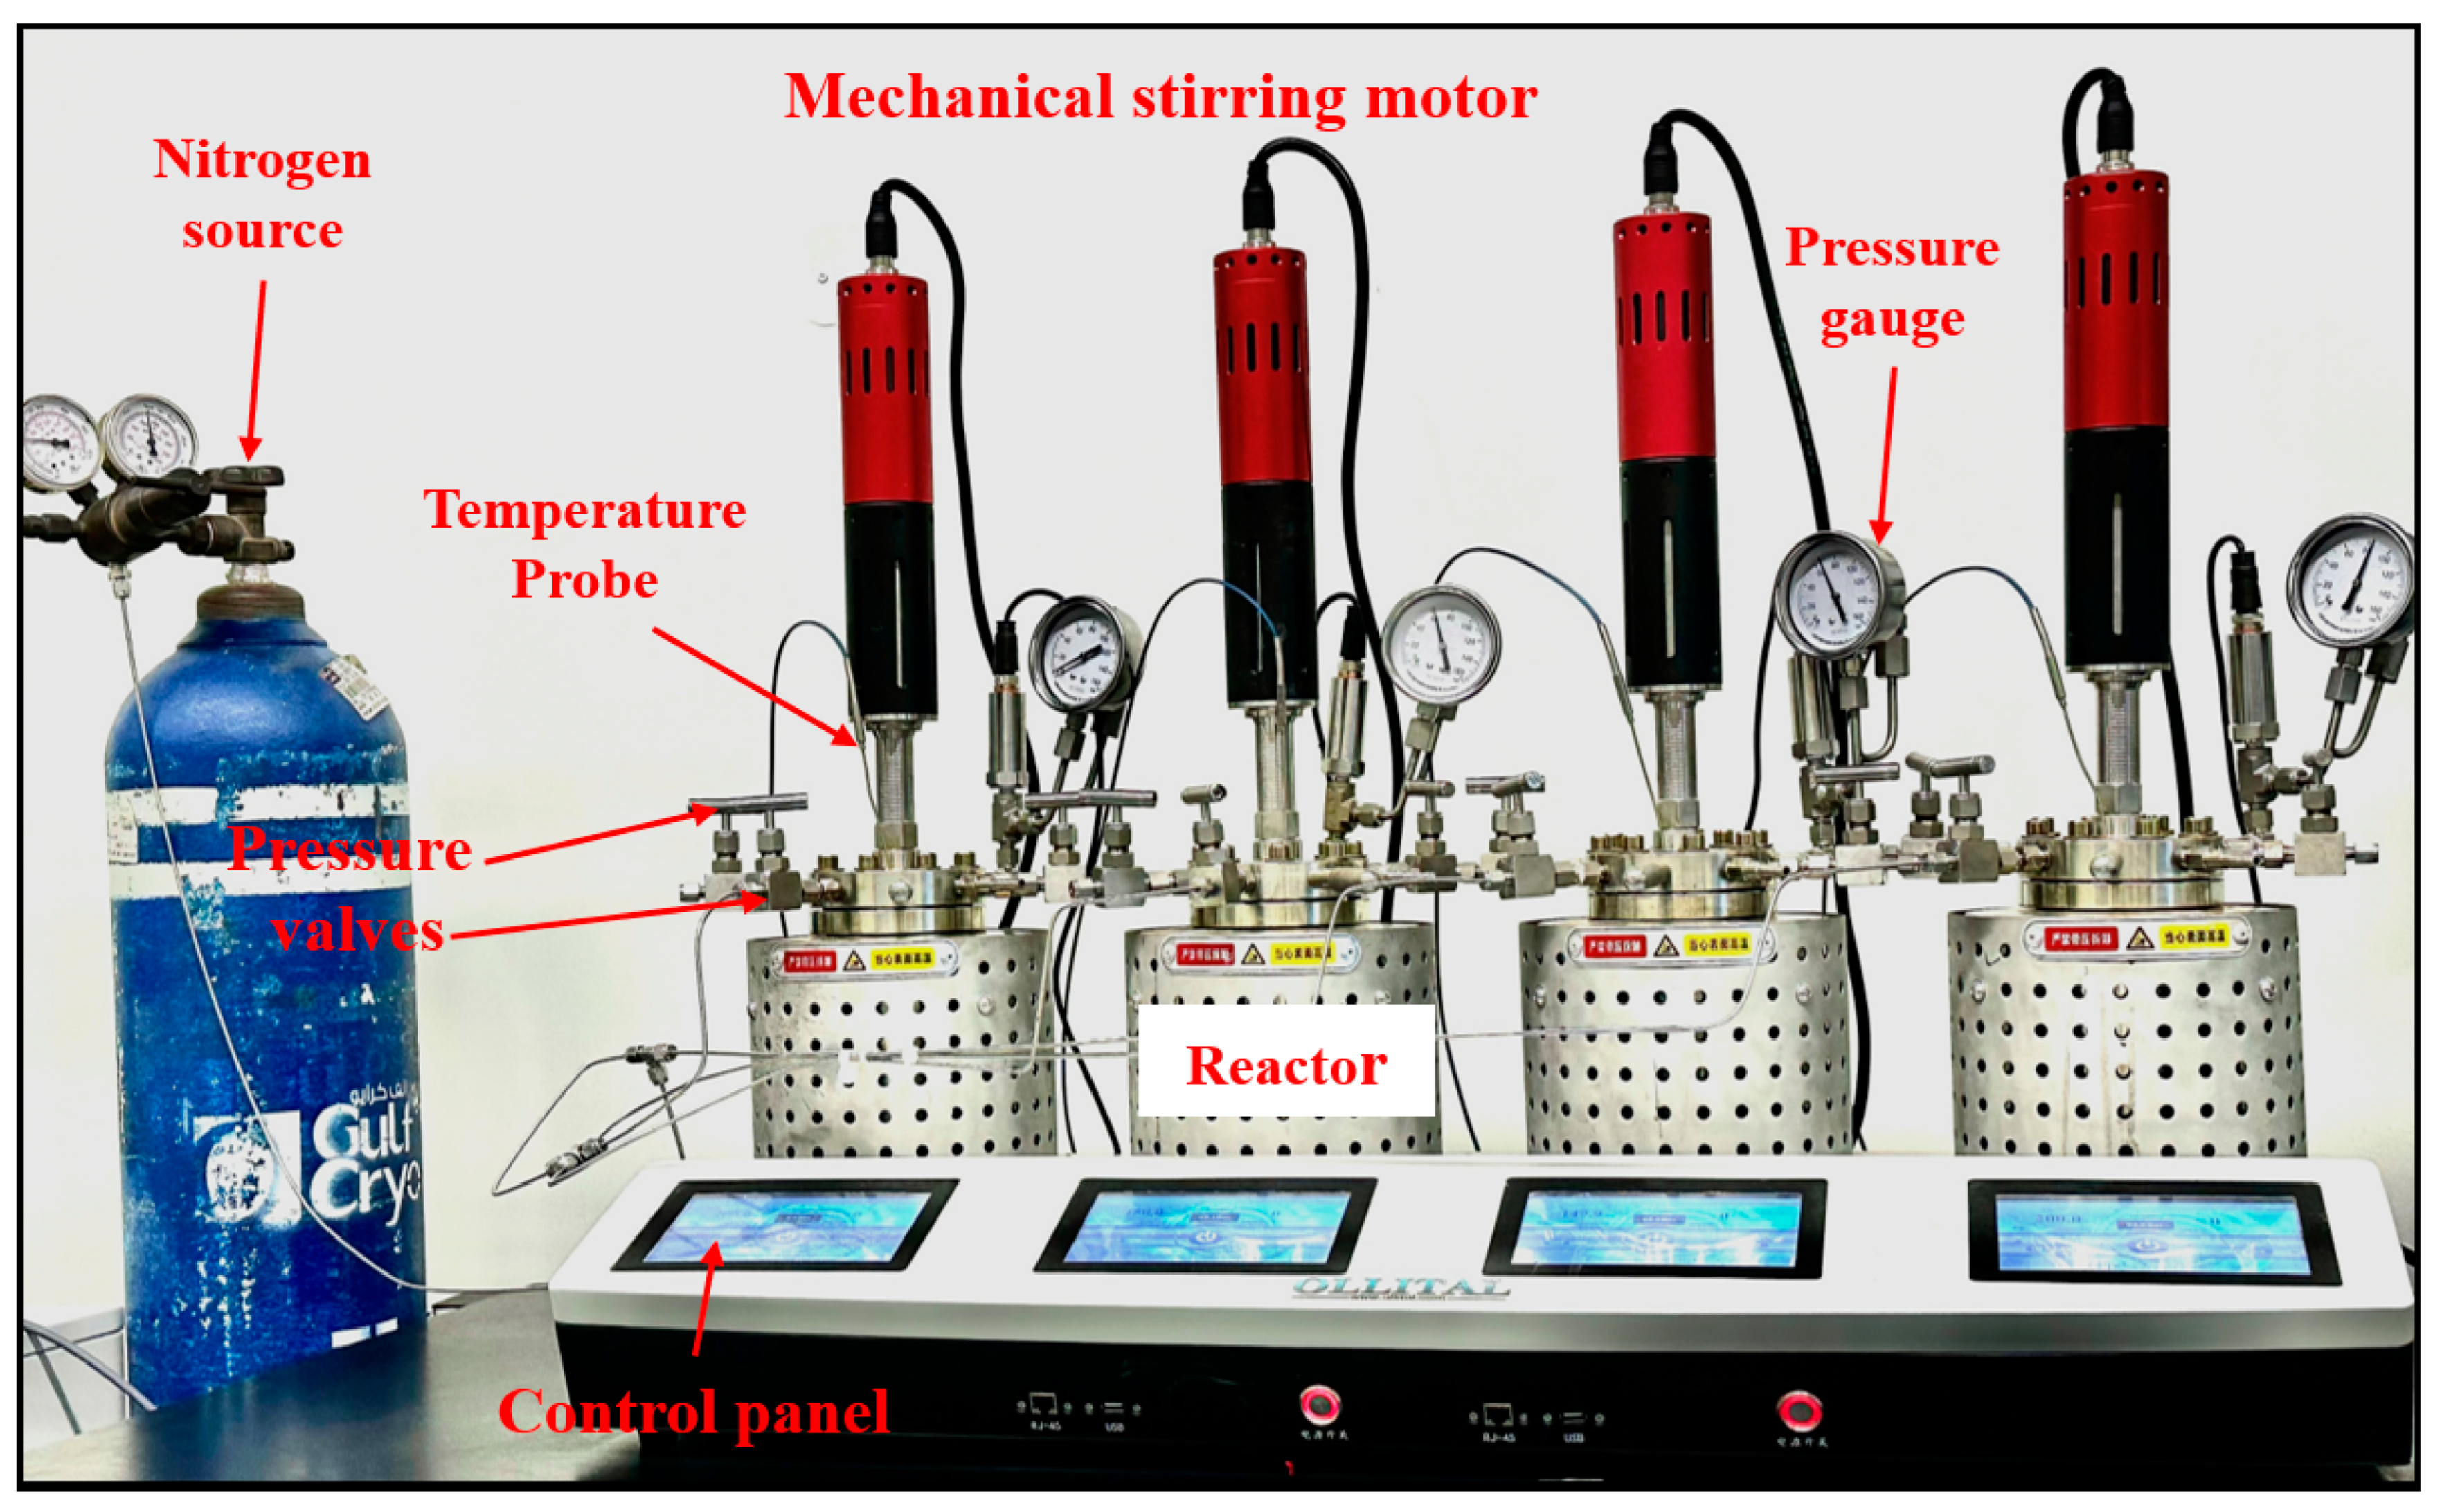
3.1. Hydrothermal Experiments

The hydrothermal reactor experiments were conducted using an Ollital OLT-HP-500 (Ollital Tech., Fujian, China) multi-position parallel reactor autoclave system, connected to a nitrogen gas cylinder (Figure 2). This system comprises four stainless steel micro-stirred parallel reactors, each equipped with independent controls for temperature, pressure, and elapsed time. The reactor kettles have a maximum capacity of 500 mL and can be heated to temperatures of up to 350 °C and pressures of 160 bars. Temperature regulation is achieved through a Smart PID algorithm control system, ensuring an accuracy of ±0.1 °C. The sediment samples were divided into twelve portions before the experiments, each weighing 20 g. For each experiment, 20 g of sediment were placed into a 50 µm stainless steel mesh and positioned at the bottom of the reactor kettles. The kettles were then filled with 200 mL of the respective experimental solutions, as outlined in Table 1. The experimental solutions included the following: Red Sea water for experiments 1–5; a 0.1 M KCl-enriched Red Sea water solution for experiment 6; a single 0.1 M mixed solution containing NaCl, KCl, CaCl2·2H2O, and MgCl2·6H2O for experiments 7–10; Gironde estuarine water for experiment 11; and a 0.1 M Na2CO3 solution for experiment 12. Each salt in the mixed solution for experiments 7–10 was prepared at an individual concentration of 0.1 M, ensuring that all major cations were included at equal molarity.
The reactors were then sealed and pressurized with nitrogen gas to an initial pressure of approximately 40 bar at room temperature. They were subsequently heated to the target experimental temperatures, which ranged from 50 °C to 250 °C (Table 1), at a heating rate of 15 °C per minute. While the initial pressure was consistent across all experiments (~40 bar at room temperature), it increased with temperature and the specific reaction fluid, stabilizing at the final pressure after 1–3 h (Table 1). The samples were maintained at the designated experimental temperatures for 14 days under strictly closed conditions, following the procedures described by [36,52]. After each experiment, the reactors were switched off and cooled to room temperature. The sediment samples were then recovered and air-dried. Post-experiment solutions were also retrieved, immediately analyzed for pH, and subjected to ICP-OES analysis at room temperature. The synthetic fluid compositions used in this study were simplified to include only the major cations. The fluid-to-rock ratio of 10:1 ensured sufficient interaction between the fluid and sediment to facilitate mineral transformations.

3.2. Analytical Techniques

3.2.1. SEM/SEM-EDS Analyses
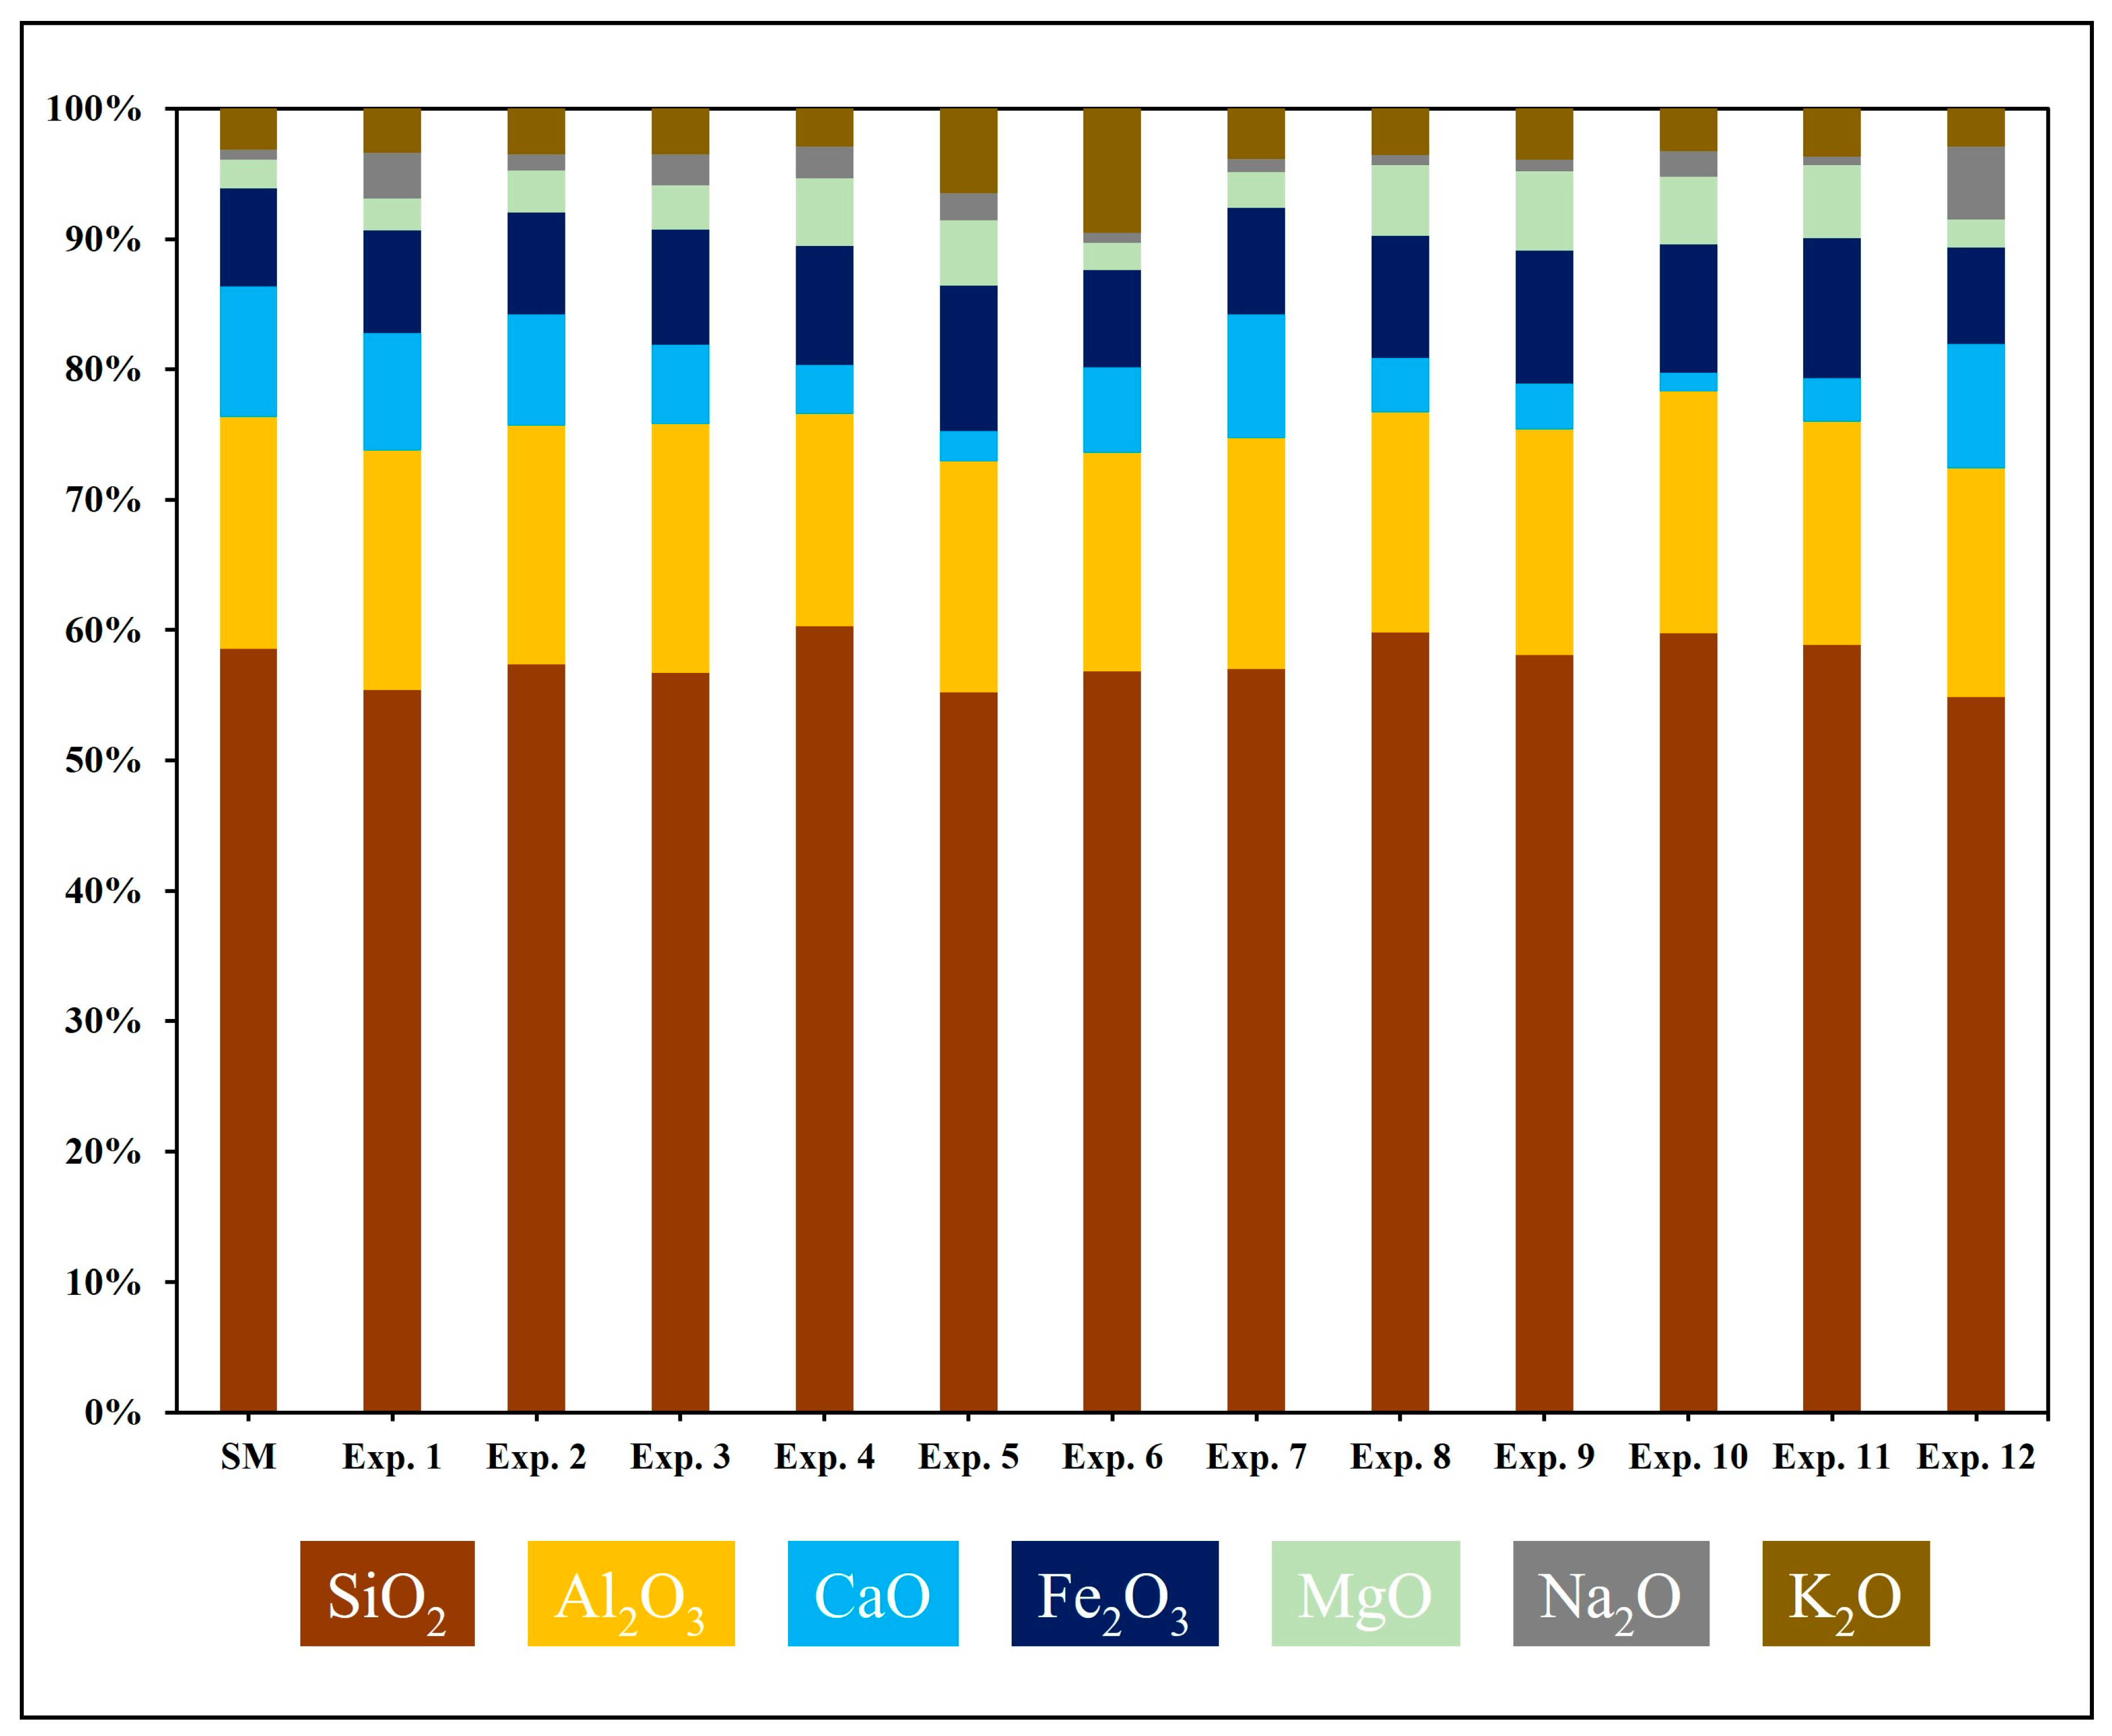
The pre- and post-experiment samples were analyzed using a Zeiss Gemini 550 scanning electron microscope (SEM) (Zeiss, Oberkochen, Germany). The SEM was equipped with a backscattered electron (BSE) detector and an Aztec energy-dispersive spectrometer (EDS) system, developed by Oxford Instruments, UK. For pre-experiment analysis, loosely disaggregated sediments were bonded to an aluminum stub using carbon adhesive tape, while post-experiment consolidated samples were mounted on stubs. Both samples were coated with a 30 nm layer of gold using a Quorum Q150R sputter coater (Quorum Tech., Laughton, UK) to ensure optimal imaging and analysis [53,54]. The SEM analyses were conducted at accelerating voltages ranging between 10 and 15 kV, with probe currents of 1 to 2 nA, respectively. The SEM and SEM-EDS investigations were conducted to examine the morphology, chemical composition, and textural relationships of detrital minerals in the initial material, as well as the formation and characteristics of any authigenic minerals that developed during the experiments.

3.2.2. XRF Analysis

The oxide compositions of pre- and post-experiment samples were analyzed using a Panalytical Zetium (Malvern Panalytical, Almelo, Netherlands) wavelength-dispersive X-ray fluorescence (WD-XRF) spectrometer. Samples were prepared by fusion with lithium metaborate flux using a Classie The OX Advanced fusion instrument (Malvern Panalytical, Almelo, Netherlands). For each sample, 1.0 g of finely ground material was mixed with 10.0 g of flux (LiBO2:Li2B4O7 in a 49.75:49.75:0.50 ratio) in a platinum-gold crucible. The mixture underwent a controlled heating program: an initial hold at 500 °C for 2 min, a gradual ramp to 1125 °C over 27 min with intermittent rocking, and final vigorous swirling before being poured into a mold to form homogeneous glass disks. The cooled glass disks were analyzed on the Zetium spectrometer, equipped with a high-resolution Cu anode X-ray tube and specialized analyzing crystals for enhanced sensitivity and resolution across major, minor, and trace elements. The quantitative analysis utilized synthetic-certified reference materials (WROXI series) and was validated with periodic quality control standards. PANalytical SuperQ software (version 6) was used for spectral acquisition, matrix corrections, and data processing, ensuring accuracy and precision. This methodology, optimized for geological materials, supported the reliable detection of major oxides and trace oxides at ppm levels.

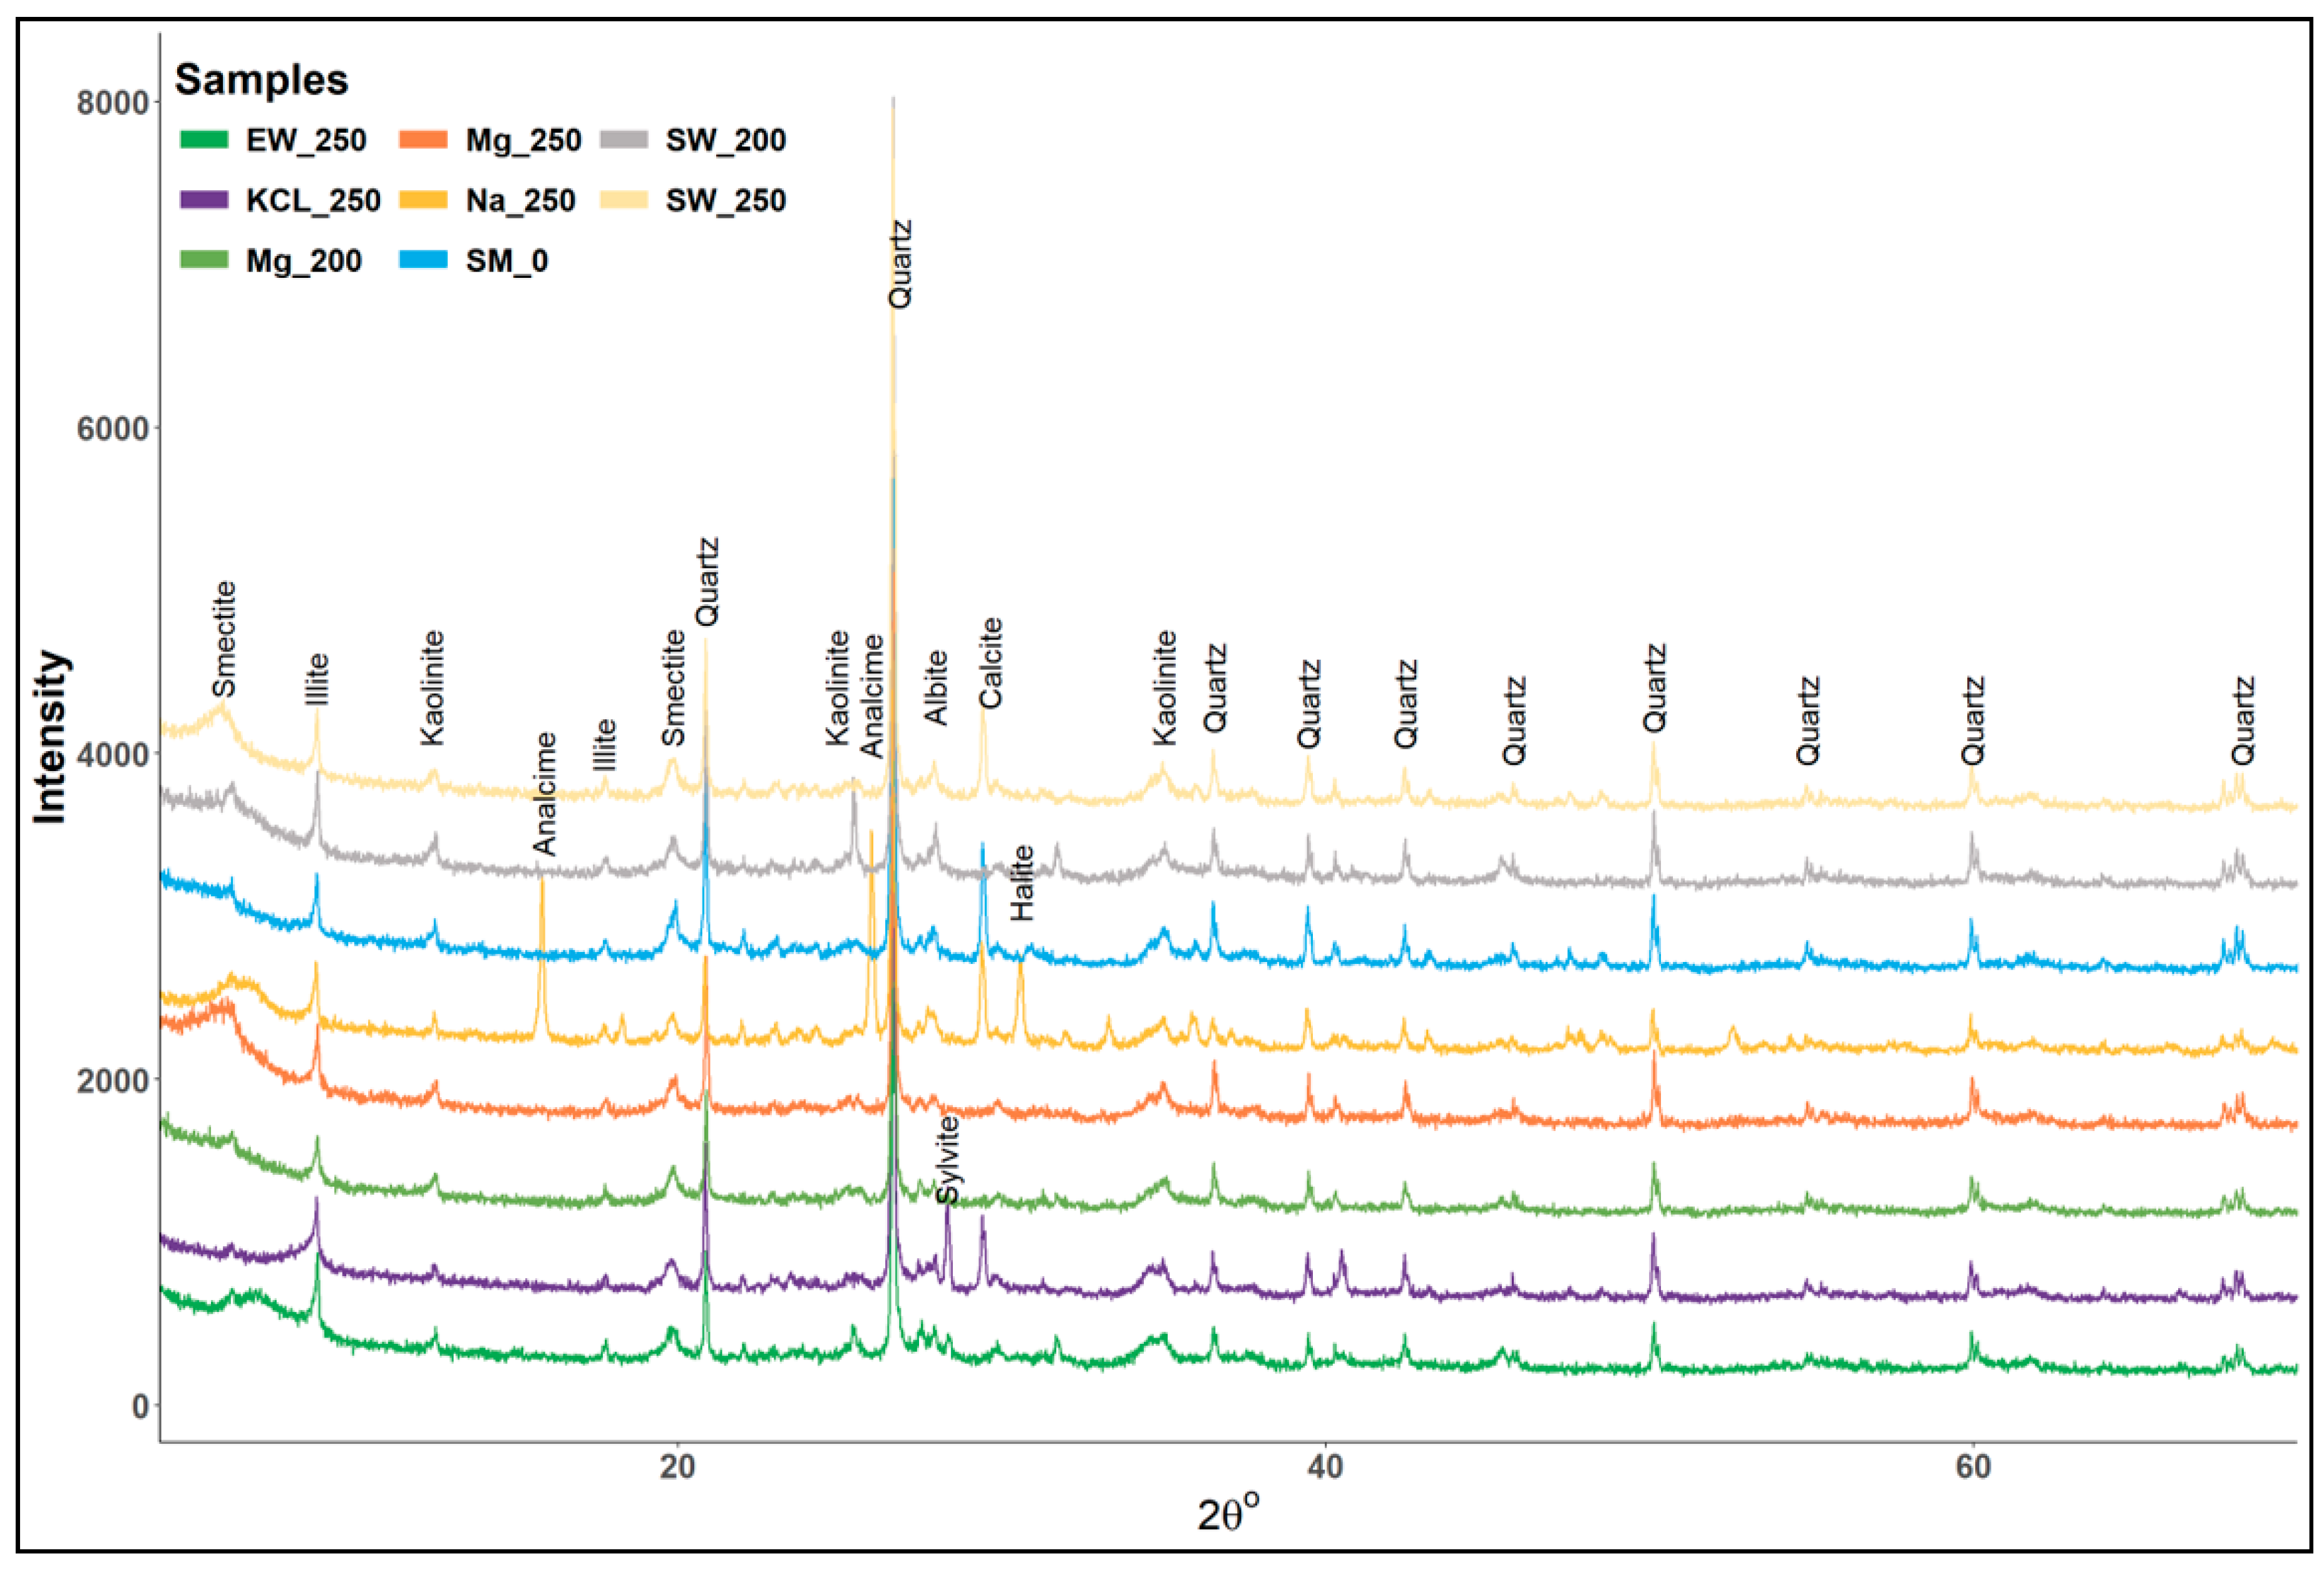
3.2.3. Bulk and Clay Fraction XRD Analysis

The mineralogical compositions of bulk and clay fractions (<2 µm) in the starting and post-experiment samples were determined via X-ray diffraction (XRD), using the Malvern Empyrean PANalytical (Malvern Panalytical, Almelo, Netherlands) diffractometer with Ni-filtered Cu Kα radiation. Bulk sediments were air-dried, powdered with a Retsch RM 200 mill, and analyzed under conditions of 45 kV and 40 mA across a 4.5–70° 2θ range with an 8.7 s scan time using the procedures outlined by [17].
Clay fractions (<2 µm) were isolated through gravity settling and centrifugation, as described by [9]. Five grams of bulk sample were dispersed in 100 mL of deionized water, ultrasonicated for 20 min with periodic stirring, and settled to remove sand and silt particles. The clay-rich supernatants were concentrated by centrifugation at 5000 rpm for 15 min. The separated clay fractions were prepared as oriented aggregates and were analyzed in three states: air-dried, ethylene glycol-solvated, and heated at 550 °C (1 h). Analyses were conducted over a 4–40° 2θ range with a 0.05°/s step size. Clay minerals were identified using HighScore Plus (v. 4.9), with the ICDD PDF-4-2022 mineralogical library and additional data from [55]. The baseline peak positions of air-dried clays were compared with those after ethylene glycol (EG) solvation and heating treatments to distinguish the clay minerals. For semi-quantitative analysis, Rietveld refinement was conducted in HighScore Plus using structure files from the Inorganic Crystal Structure Database (ICSD, 2021.1), carefully selected for compatibility with oriented clay samples. Profile-matching techniques ensured alignment between experimental spectra and reference patterns, while the March–Dollase function was applied to correct preferred orientation effects. Profex software (5.4.1) was also used for cross-validation to enhance result reliability. Despite following these protocols, the results remain semi-quantitative due to HighScore’s inherent limitations in accurately quantifying oriented clay minerals.

3.2.4. STEM Analysis

The morphological and structural characterization of clay minerals was conducted using scanning transmission electron microscopy (STEM) on a Dual Beam Laser FIB-SEM system (Zeiss 550, Zeiss, Oberkochen, Germany). The integrated STEM detector, positioned beneath the specimen and aligned perpendicularly to the optical axis, collected transmitted electrons that passed through the samples. The separated clay fractions were prepared as aqueous suspensions in deionized water and aspirated onto carbon-coated copper 200-mesh TEM grids (QUANTFOIL, Thüringen, Germany). The grids were dried in a desiccator before being mounted on a specialized TEM grid holder adapted for the SEM stage. The analyses were conducted under operating conditions of 10 kV accelerating voltage and a probe current of 500 pA. The segmented design of the STEM detector enabled selective enhancement of image contrast by activating or deactivating specific detector segments (aSTEM4 B). Multiple micrographs were acquired under these conditions to ensure thorough characterization of the samples. Additionally, elemental compositions of specific minerals were determined using energy-dispersive X-ray spectroscopy (EDS) at several points of interest.

3.2.5. ICP-OES Analysis

Inductively Coupled Plasma-Optical Emission Spectroscopy (ICP-OES) was employed to determine the elemental composition of major cations in solutions before and after the hydrothermal experiments. Analyses were performed using a PerkinElmer Plasma Quant 9000 ICP-OES instrument, (PerkinElmer, Shelton, CT, USA) which utilizes plasma as an excitation source to detect optical emissions. Post-experiment fluids were collected, transferred to vials, and diluted to the appropriate ratios prior to analysis. This procedure allowed for the quantification of key cations, including Al, Ca, Fe, Mg, K, and Na, in both pre-and post-experiment solutions.

3.2.6. FIB-SEM Analysis

Focused Ion Beam Scanning Electron Microscopy (FIB-SEM) was employed to examine the internal structure of the samples with high-resolution imaging. The analysis was performed using a Zeiss Crossbeam 550 FIB-SEM (Zeiss, Oberkochen, Germany), equipped with a Gallium FIB column and automated using SmartFIB software (v. 7.05). For cross-sectioning, a trapezoidal trench with a 30 μm width and 20 μm depth was milled in three stages. Coarse milling (30 kV, 15 nA) rapidly excavated the trench, followed by intermediate milling (30 kV, 700 pA) to expose the target area. A final fine polishing step (30 kV, 300 pA) created a smooth surface and removed residual debris. Tilt correction was applied to optimize imaging accuracy, and micrographs were captured to document key features. Serial sectioning was then conducted with a 50 nm slice thickness over a 40 μm length, generating sequential layers for detailed analysis. Both secondary electron (SE) and backscattered electron (BSE) micrographs were automatically recorded for each section, enabling comprehensive characterization of the sample’s cross-sectional properties.

4. Results

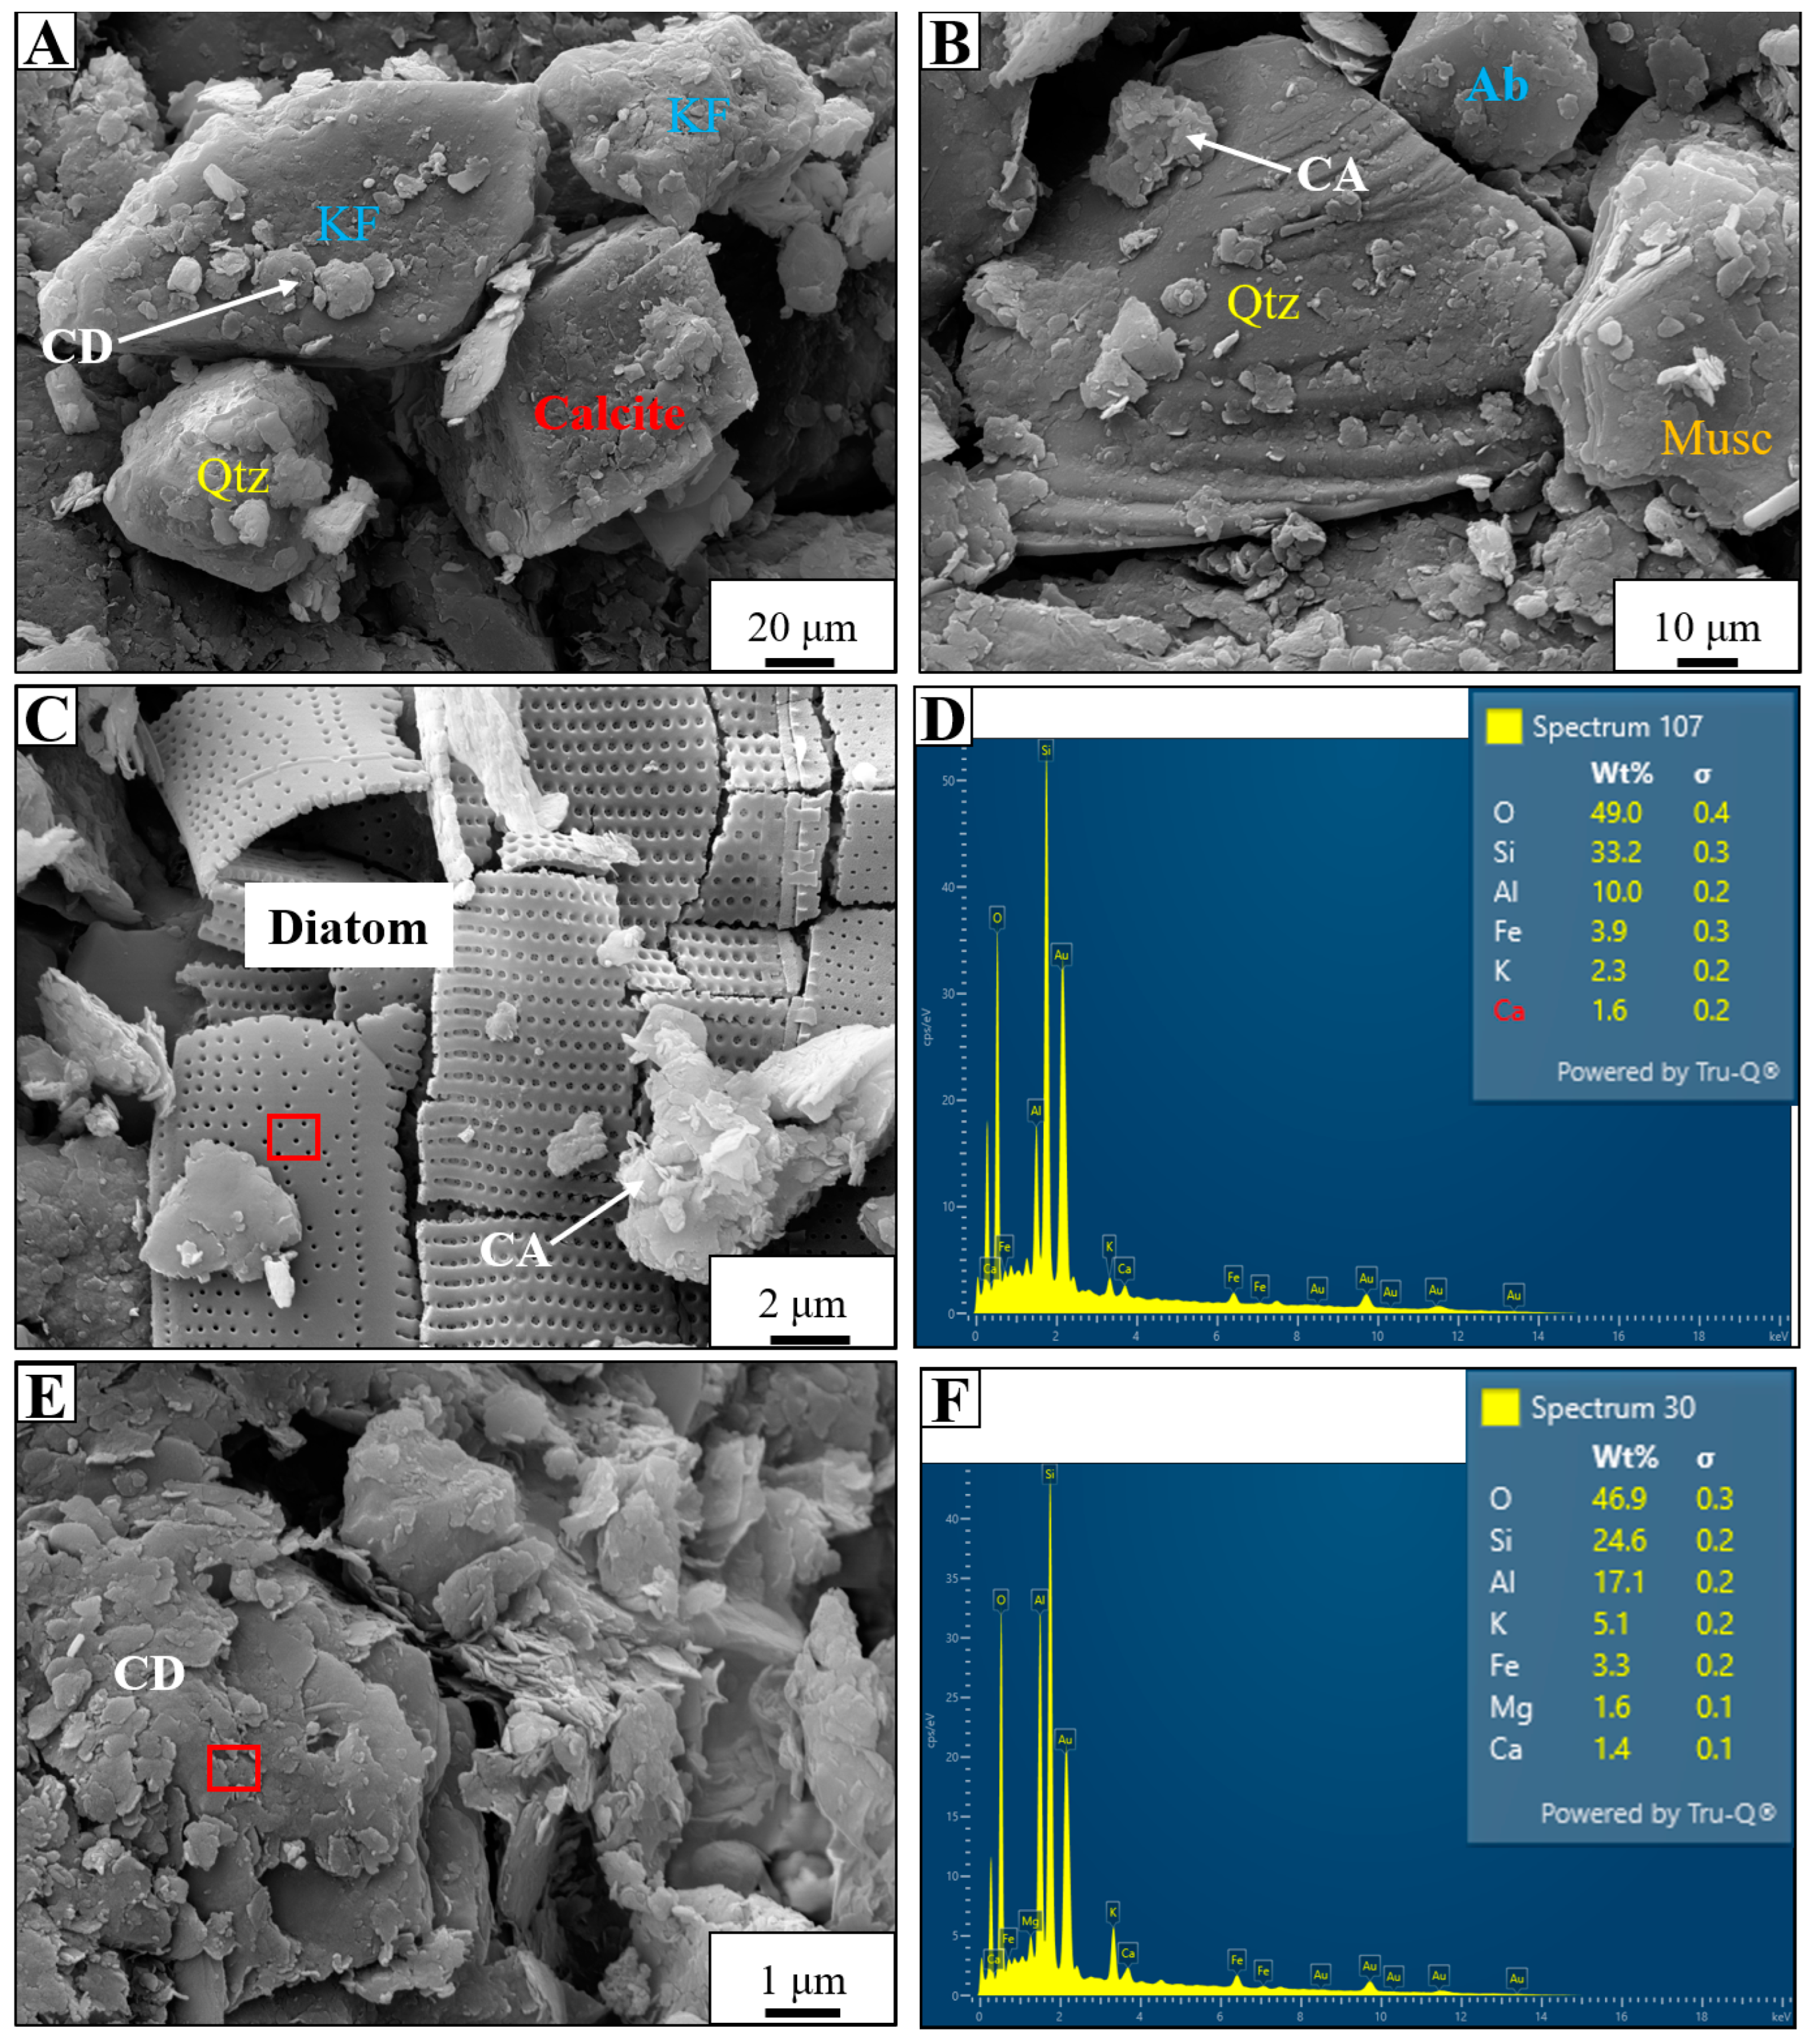
4.1. Compositional Evaluation of the Starting Material

The starting material consists of fine to silt-sized grains that are moderately sorted and angular to subangular in shape. WD-XRF oxide analyses (Table 2) indicate that the sediment is dominated by SiO2 (57.43 wt%), Al2O3 (17.43 wt%), CaO (9.87 wt%), Fe2O3 (7.38 wt%), K2O (3.07 wt%), and MgO (2.12 wt%) (Figure 3). Minor amounts of TiO2 (1.01 wt%) and Na2O (0.79 wt%) are also present, while ClO2, MnO, P2O5, SO3, and SrO occur in trace quantities (Table 2). Bulk XRD analysis (Table 3, Figure 4) reveals that the sediment is predominantly composed of quartz (40.7%), plagioclase (14.7%), and orthoclase (5.3%) (Table 3). Additionally, significant amounts of calcite (9.7%) and muscovite (9.3%) are present. Clay minerals, including kaolinite, smectite, and illite, constitute 20.3% of the total bulk mineralogy (Table 3).
These findings are further supported by SEM and EDS analyses, which demonstrate that the dominant detrital grains are monocrystalline quartz (Figure 5A,B), K-feldspar (Figure 5A), albite, and muscovite (Figure 5B). Carbonate materials are predominantly calcite (Figure 5A). The results also reveal that the framework grains are partially coated with detrital clay and silt-sized materials, which occur as drapes (Figure 5A) and aggregates (Figure 5B). These grain coats are primarily composed of clay minerals, with minor amounts of silt-sized quartz grains and diatoms (Figure 5C,D). However, even under higher-resolution SEM imaging (Figure 5E), it was challenging to identify specific clay minerals based on morphology due to poor crystallization and poorly defined internal structures. EDS analysis confirms that the grain coats are composed of Si, O, Al, K, Fe, Mg, and Ca (Figure 5F). XRD analyses of the clay fraction reveal that the detrital clay mineral assemblage is dominated by kaolinite (51.5%) and illite (41.1%), with minor contributions from smectite (5.3%) and no detectable chlorite (Figure 6A, Table 3). Smectite peaks were identified after ethylene glycol solvation. They disappeared, along with kaolinite, following heating to 550 °C for 1 h (Figure 6A). The d-spacing values of the identified clay minerals are annotated on the overlaid diffraction peaks (Figure 6A).

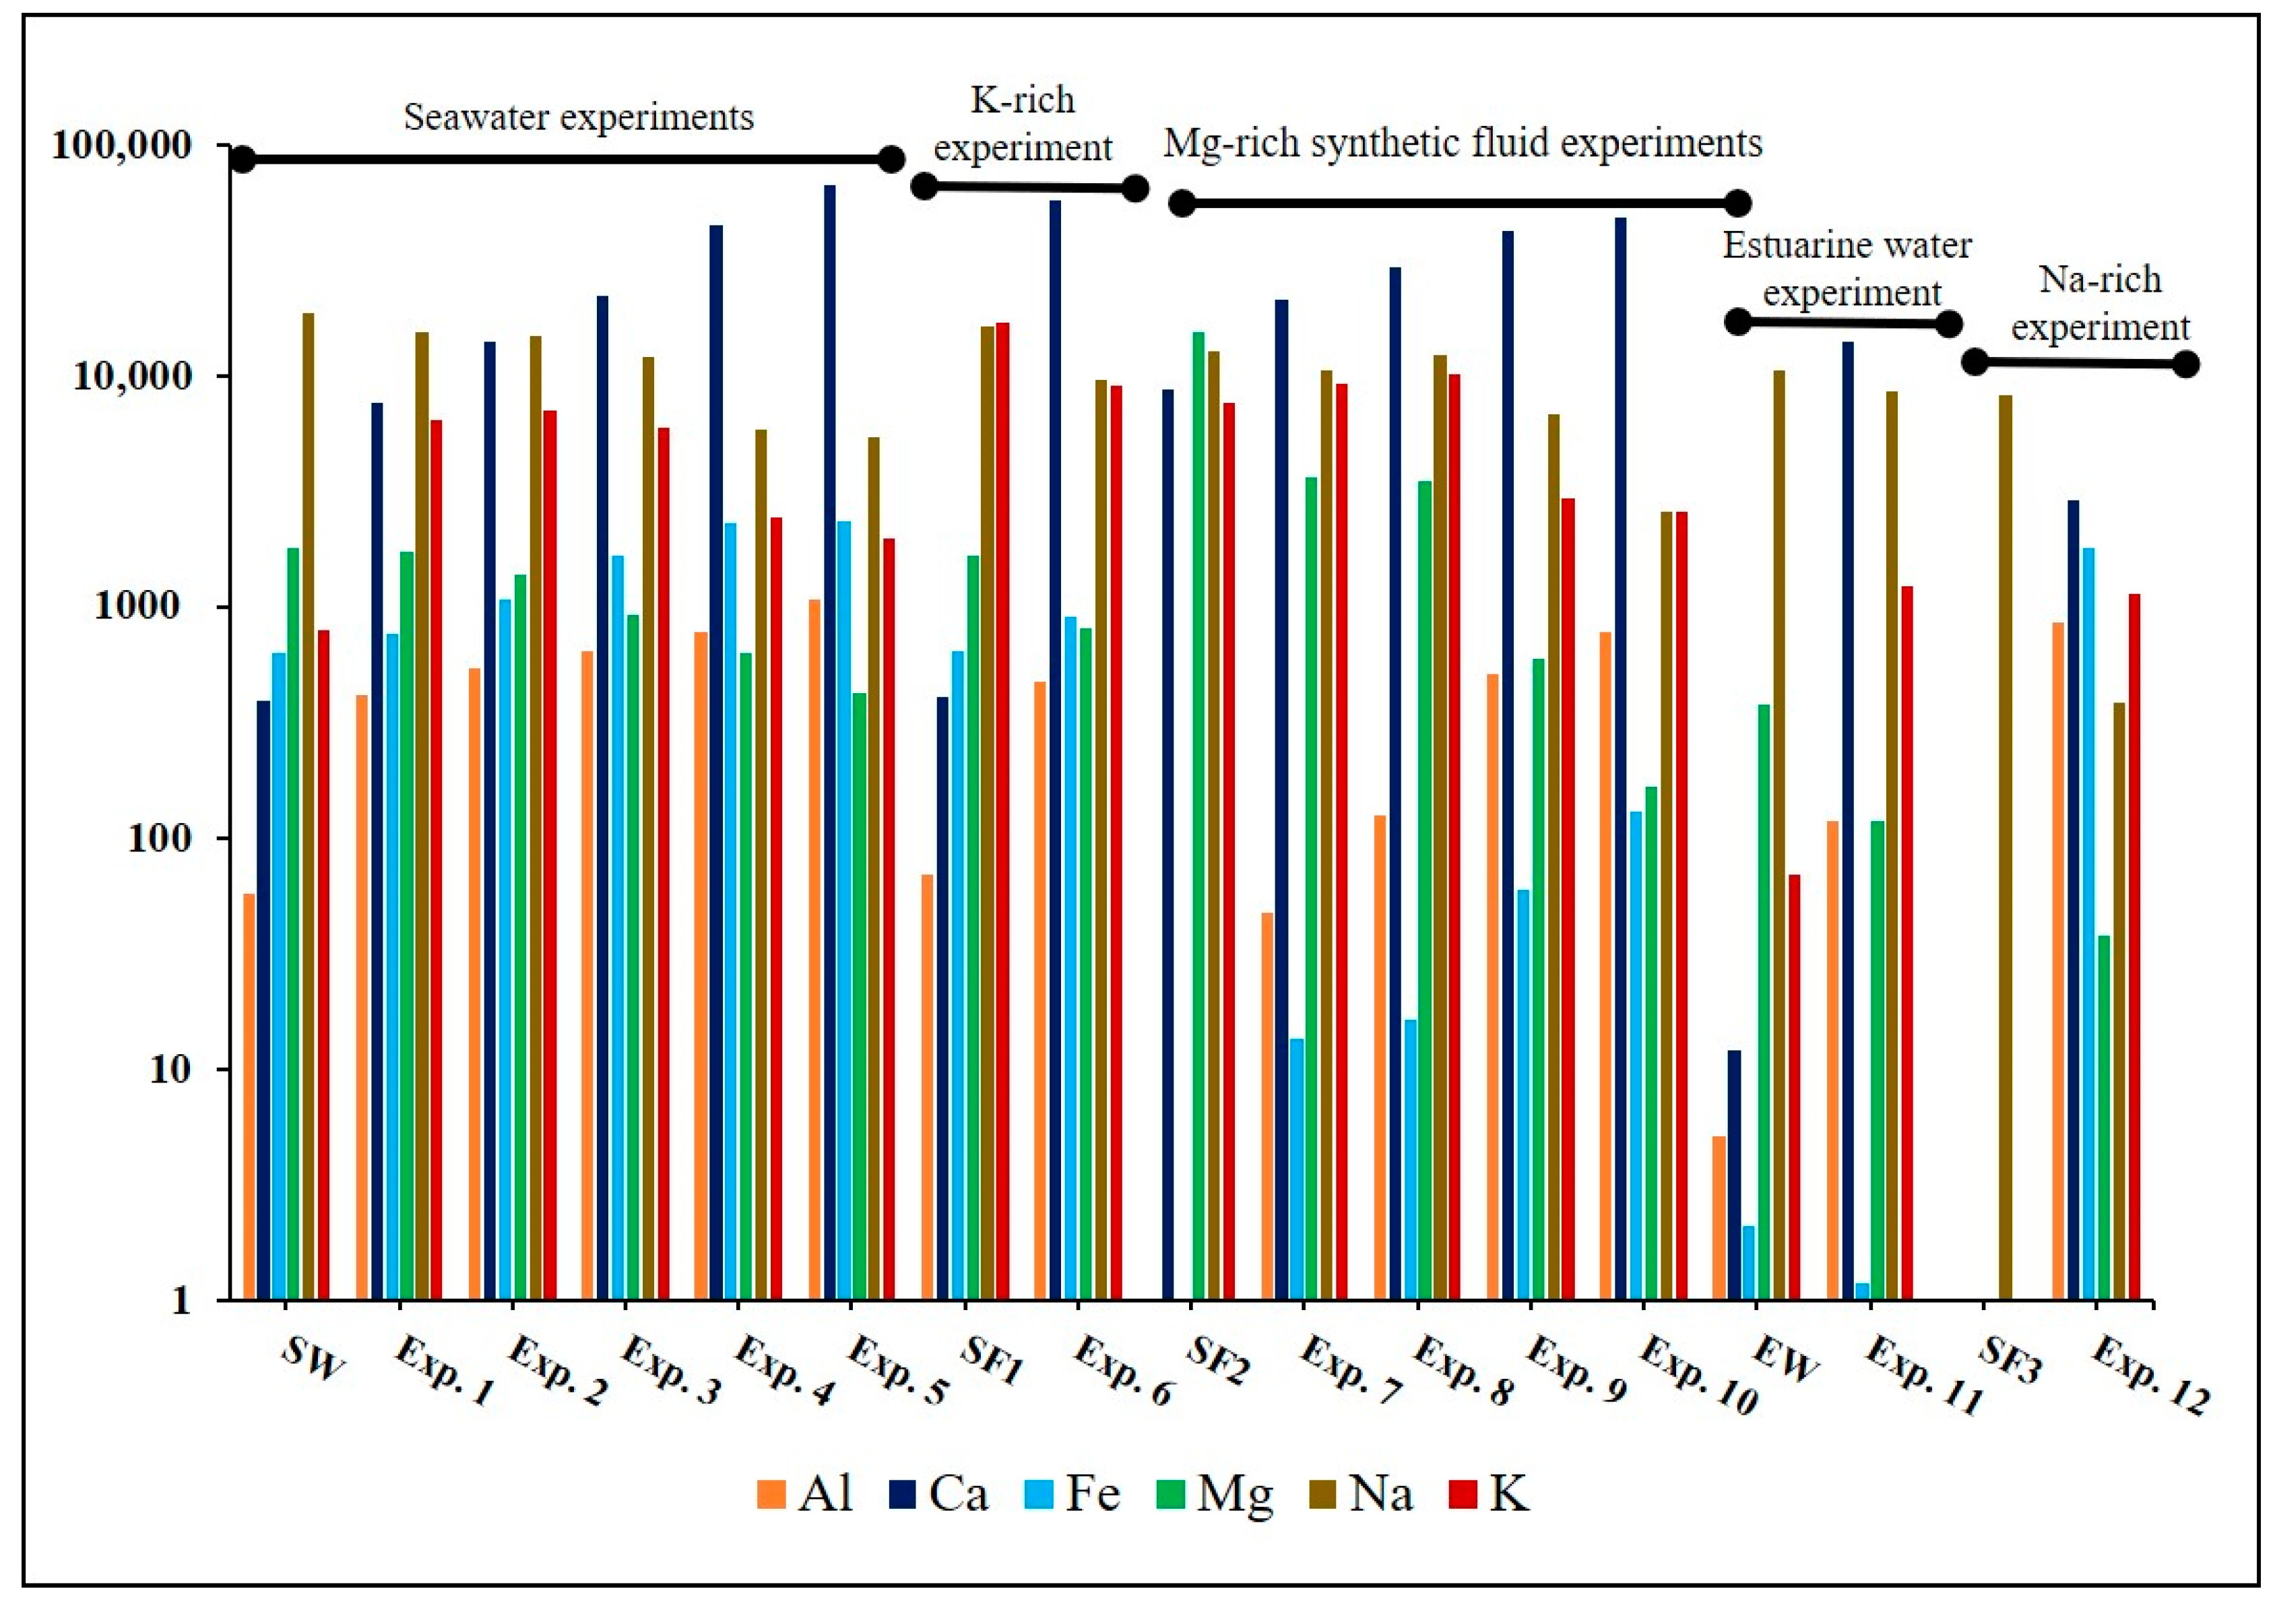
4.2. Geochemical and Mineralogical Evaluation of Post-Experiment Samples

A detailed compositional assessment of the reactive fluids and solids retrieved after the hydrothermal experiments was conducted using ICP-OES, WD-XRF, SEM, SEM-EDS, STEM, and XRD analyses. The results demonstrate distinct geochemical and mineralogical changes influenced by the experimental fluids’ chemistry and increasing temperatures (Figure 3, Figure 4, Figure 5, Figure 6, Figure 7, Figure 8, Figure 9, Figure 10, Figure 11, Figure 12 and Figure 13; Table 2, Table 3 and Table 4). Below, the findings are presented based on the observed changes in experiments conducted with different reactive fluids.

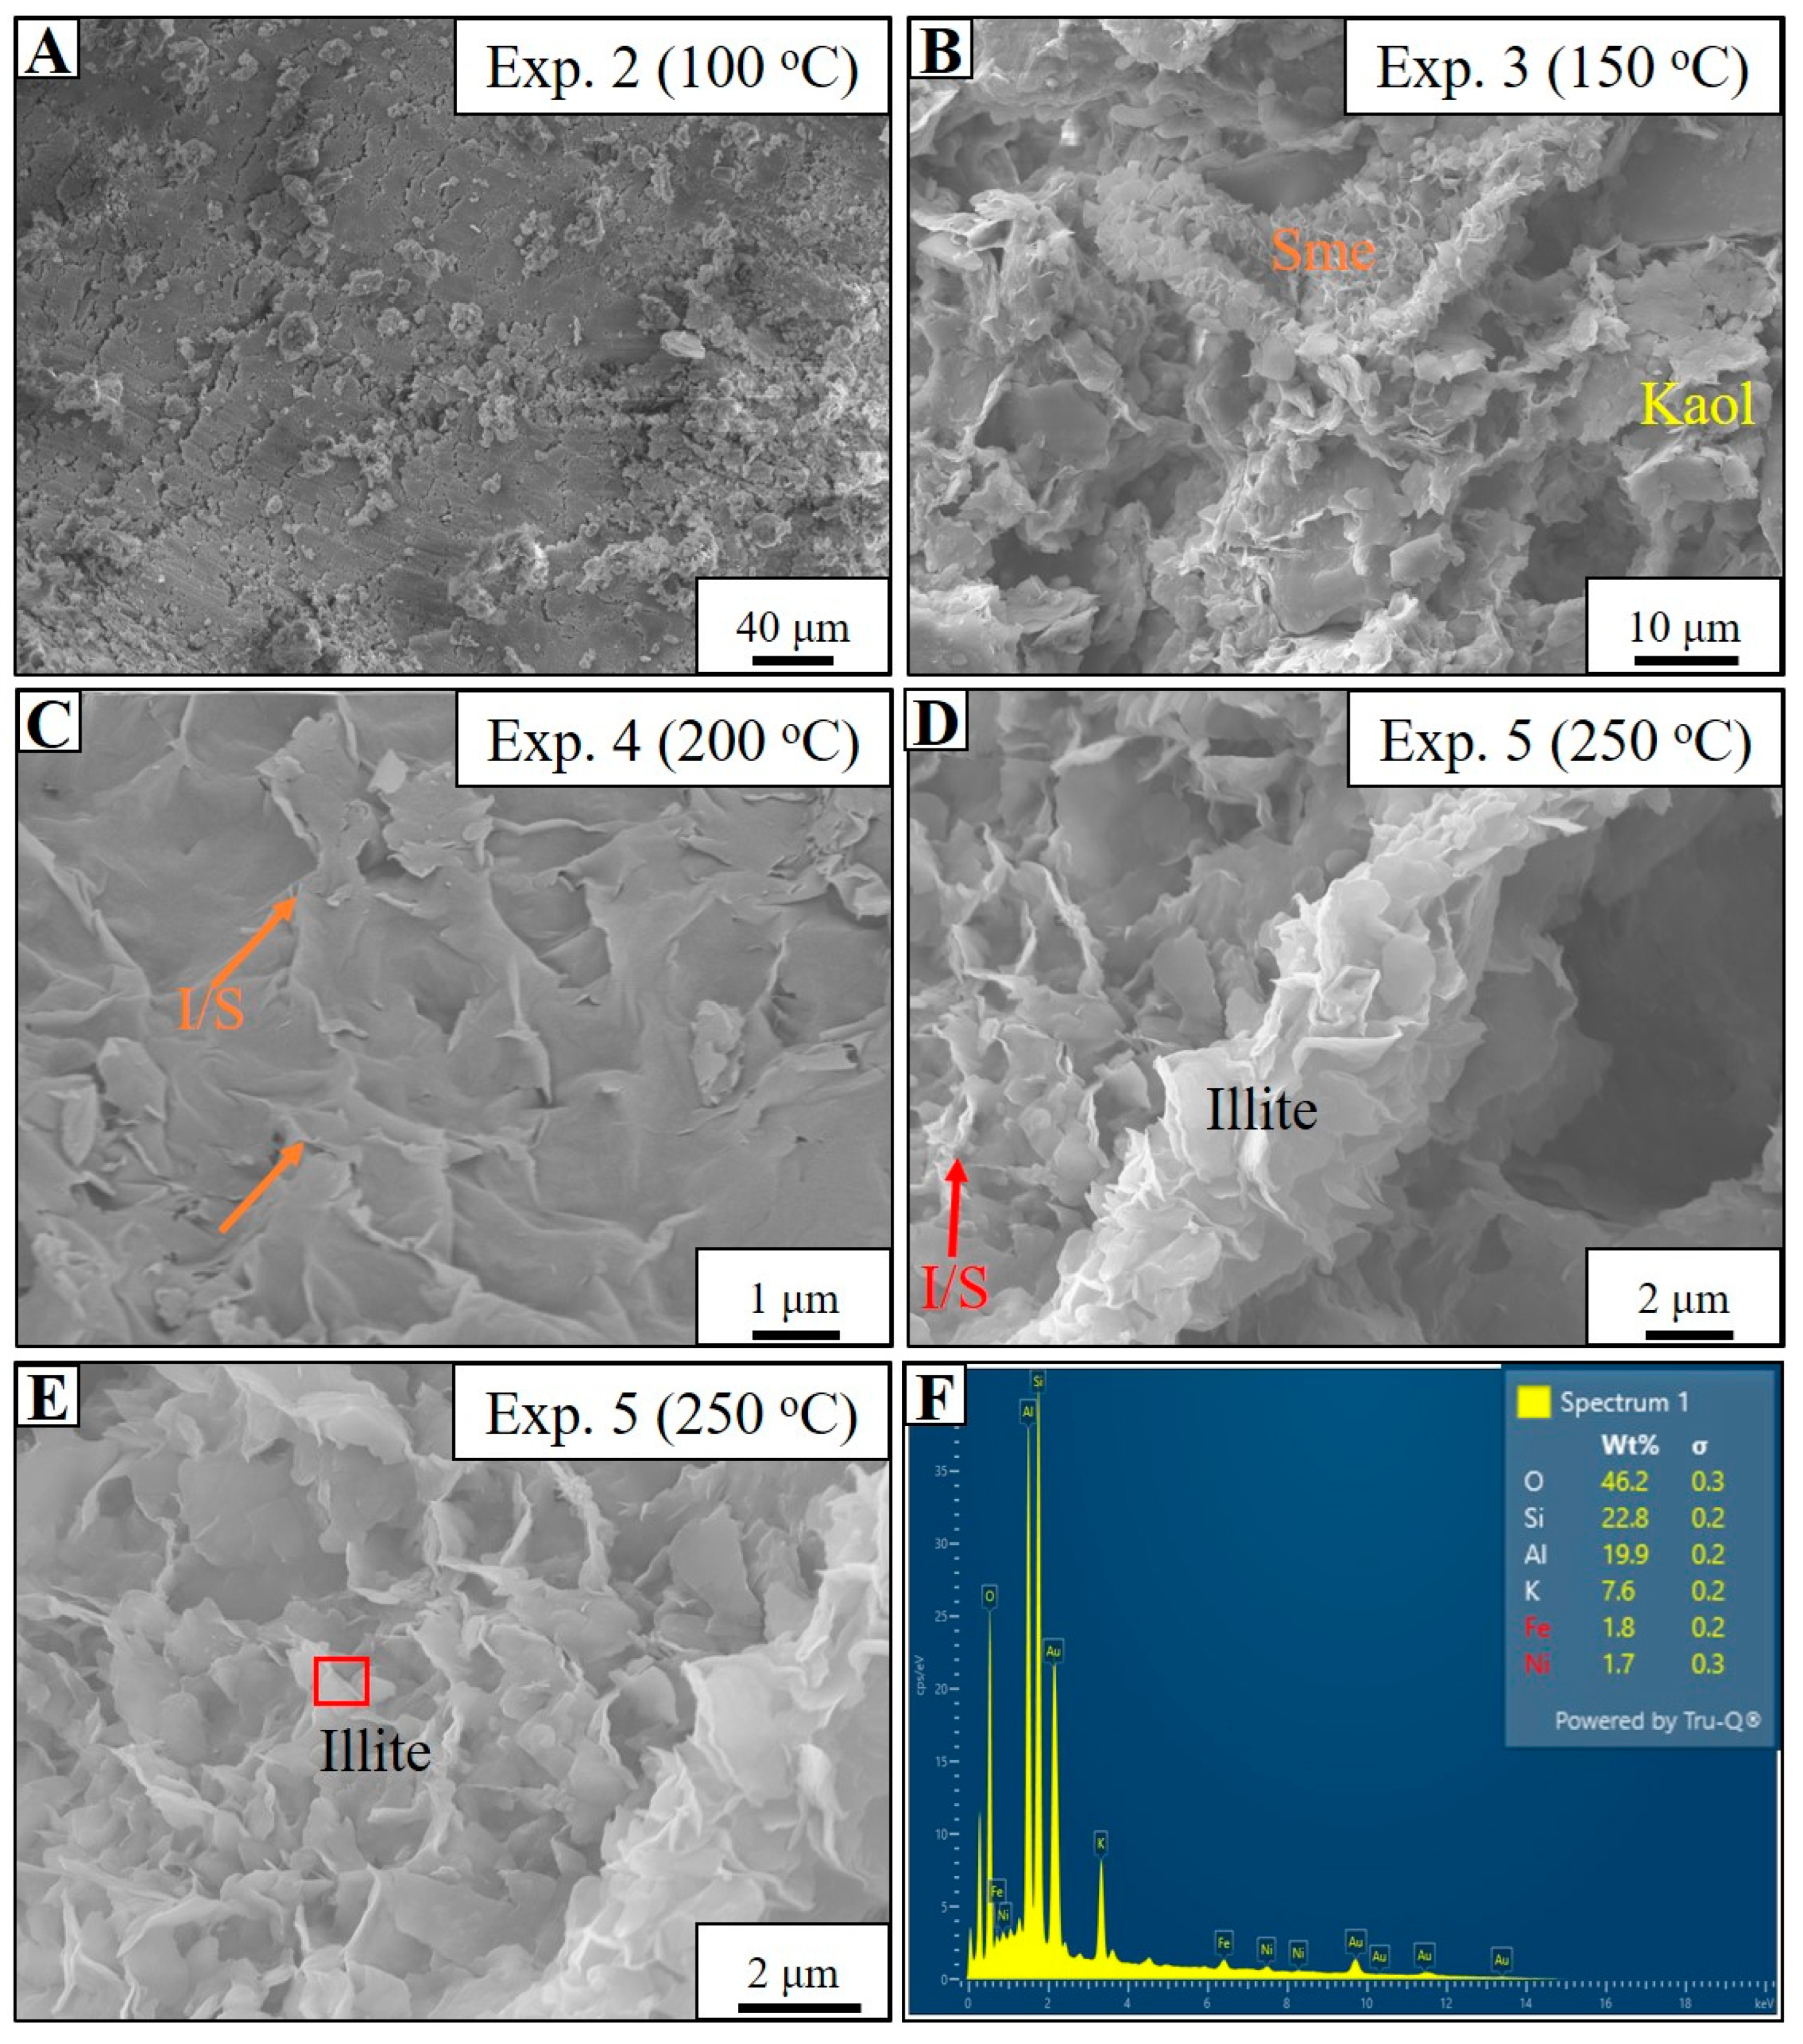
4.3. Seawater-Based Experiments (Experiments 1–6)

Experiments 1–5 were performed using natural Red Sea water under increasing temperatures of 50, 100, 150, 200, and 250 °C, respectively, with a constant duration of 14 days per experiment, while Exp. 6 was conducted with 0.1 M KCl dissolved in Red Sea water (SF1) at 250 °C for 14 days (Table 1). XRF analyses of the sediments from these experiments reveal variations in major and minor oxides with increasing experimental temperature (Table 2, Figure 3). The concentration of SiO2 fluctuates, increasing from 52.86 wt% in Exp. 1 to 56.43 wt% in Exp. 2, before decreasing to 54.59 wt% in Exp. 6 (Table 2). During Experiments 1–3, the Al2O3 content in the reacting solids increases slightly, from 17.55 wt% in Exp. 1 to 18.36 wt% in Exp. 3, but then decreases significantly to 15.47 wt% and 16.94 wt% in Experiments 4 and 5, respectively. Calcium oxide (CaO) consistently decreases with rising experimental temperature, from 8.62 wt% in Exp. 1 to 2.22 wt% in Exp. 5, and increasing to 6.29 wt% in Exp. 6 (Table 2). Similarly, Na2O shows a slight decrease as temperature increases. In contrast, Fe2O3, MgO, and K2O concentrations generally increase with temperature, except in Exp. 4, where K2O decreases slightly to 2.73 wt%. Notably, K2O increases significantly, from 3.07 wt% in the starting material to 9.14 wt% in Exp. 6. Trace oxides such as ClO2, MnO, P2O5, SO3, and SrO remain relatively stable across all experiments, except for ClO2, which shows irregular fluctuations (Table 2).
The hydrochemical composition of the Red Sea water and SF1 pre- and post-experiments (Experiments 1–6) is summarized in Table 4 and Figure 10. The pH of the fluids decreases consistently with increasing temperatures, dropping from 8.12 in the initial Red Sea water to 6.34 in Exp. 5. Similarly, in Exp. 6, the pH decreases from 7.78 in the pre-reacted solution to 6.86 post-experiment (Table 4). Total dissolved solids (TDS) increase significantly during the experiments, with TDS rising from 36.71 ppt in the starting solution of Experiments 1–5 to 58.95 ppt and 105.2 ppt in Experiments 4 and 5, respectively. For Exp. 6, TDS increase from 43.95 ppt pre-experiment to 104.5 ppt post-experiment (Table 4). ICP-OES analysis highlights variations in six major cations (Al, Ca, Fe, Mg, K, Na) during the experiments. Aluminum (Al) concentration rises steadily from 57.7 mg/L in the starting solution to 420 mg/L in Exp. 1 and 1080 mg/L in Exp. 5, corresponding to increasing temperatures. Calcium (Ca) shows a marked increase in the fluid phase, from 396 mg/L in the starting solution to 67,000 mg/L in Exp. 5, contrasting with its rapid depletion in the solids (Table 2). Potassium (K) concentrations increase during Experiments 1 and 2 but decline in Exp. 3, before being significantly consumed in Experiments 4–6 (Table 4). Iron (Fe) concentrations increase slightly with temperature, while magnesium (Mg) and sodium (Na) concentrations decrease (Table 4).
Bulk mineralogical results from XRD analyses indicate that quartz remains the dominant mineral throughout the experiments (Table 3, Figure 4), though its concentration decreases slightly from 41.0% in Exp. 1 to 38.9% in Exp. 5 and 29.4% in Exp. 6. Orthoclase decreases significantly, from 8.1% in Exp. 1 to 2.4% in Exp. 5, while plagioclase undergoes a moderate decrease (Table 3). Both muscovite and calcite dissolve rapidly with rising temperatures, with calcite reducing from 5.1% in Exp. 1 to 1.2% in Exp. 5. Conversely, clay mineral content increases significantly, from 20.9% in Exp. 1 to 38.4% in Exp. 5 and 37.1% in Exp. 6. Halite is observed in minor amounts (1.7%) in Exp. 4, while sylvite appears at 3.6% in Exp. 6 (Table 3). Oriented XRD analyses of the clay fraction (<2 µm) identify kaolinite, smectite, and illite (Table 3, Figure 6B,C). In Exp. 5, the primary smectite peak (001) is detected at a d-spacing of 14.9 Å in the air-dried analysis, shifting to 16.99 Å after ethylene glycol treatment, with a 002 peak at 8.5 Å. The 001 peak disappears after heating to 550 °C for 1 h (Figure 6B). Smectite is absent in Exp. 6 (Figure 6C). Kaolinite’s 001 and 002 peaks at 7.15 Å and 3.57 Å, respectively, are observed in both air-dried and ethylene glycol-treated samples but disappear after heating in Exp. 5. In Exp. 6, kaolinite peaks appear weaker compared to Exp. 5 (Figure 6C). Illite’s 001, 002, and 003 peaks are identified at 10.01 Å, 4.99 Å, and 3.07 Å, respectively, and are present in both untreated and treated analyses (Figure 6B,C). Semi-quantitative analyses of the clay fraction reveal that kaolinite decreases with increasing temperatures, while smectite fluctuates irregularly (Table 3). Kaolinite declines from 50% in Exp. 1 to 18% in Exp. 5 and 20% in Exp. 6. Smectite decreases slightly in the low-temperature experiments, from 5% in Exp. 1 to 4.9% in Exp. 2, before increasing to 7.2% in Exp. 3. It subsequently declines to 3%, 2%, and trace amounts in Experiments 4, 5, and 6, respectively. In contrast, illite increases significantly, from 40% in Exp. 1 to 76% and 80% in Experiments 5 and 6, respectively (Table 3). Minor silt-sized quartz is also observed in the clay fraction, and sylvite peaks appear in Exp. 6 (Figure 6C).
SEM and EDS analyses of low-temperature experiments (Experiments 1 and 2) show minimal changes in detrital grain distribution, with no significant mineralogical transformations observed (Figure 7A). However, SEM reveals the disaggregation and partial dissolution of aggregated detrital grain coats in Exp. 2 (Figure 7A). During Exp. 3 (150 °C), smectite precipitates adjacent to kaolinite platelets, forming incipient crenulated to honeycomb morphologies (Figure 7B). These newly formed smectite coatings develop further in Exp. 4 (200 °C), displaying improved internal structures and crystallinity (Figure 7C). Illitization of smectite begins in Exp. 4 and progresses into Exp. 5 (250 °C). SEM shows the replacement of smectite by mixed-layer illite/smectite and eventually illite, which retains the honeycomb morphologies of smectite but develops spiny terminations characteristic of illite (Figure 7D,E). EDS confirms that the newly formed illite is dominated by Si, O, Al, and K, with minor Fe (Figure 7F). STEM analyses further identify pseudohexagonal kaolinite, smectite, and illite in Exp. 5 (Figure 8).
In Exp. 6, SEM and EDS analyses reveal similar transformations to those observed in Exp. 5. SEM observations show the dissolution of kaolinite and the formation of sylvite adjacent to mixed-layer illite/smectite (Figure 9A,B). Newly formed illite from smectite displays rugged honeycomb morphologies, while illitized kaolinite exhibits flaky to radial morphologies with hairy spikes (Figure 9C). EDS analysis confirms that illite is dominated by Si, Al, O, K, and minor amounts of Fe and Ca (Figure 9D).

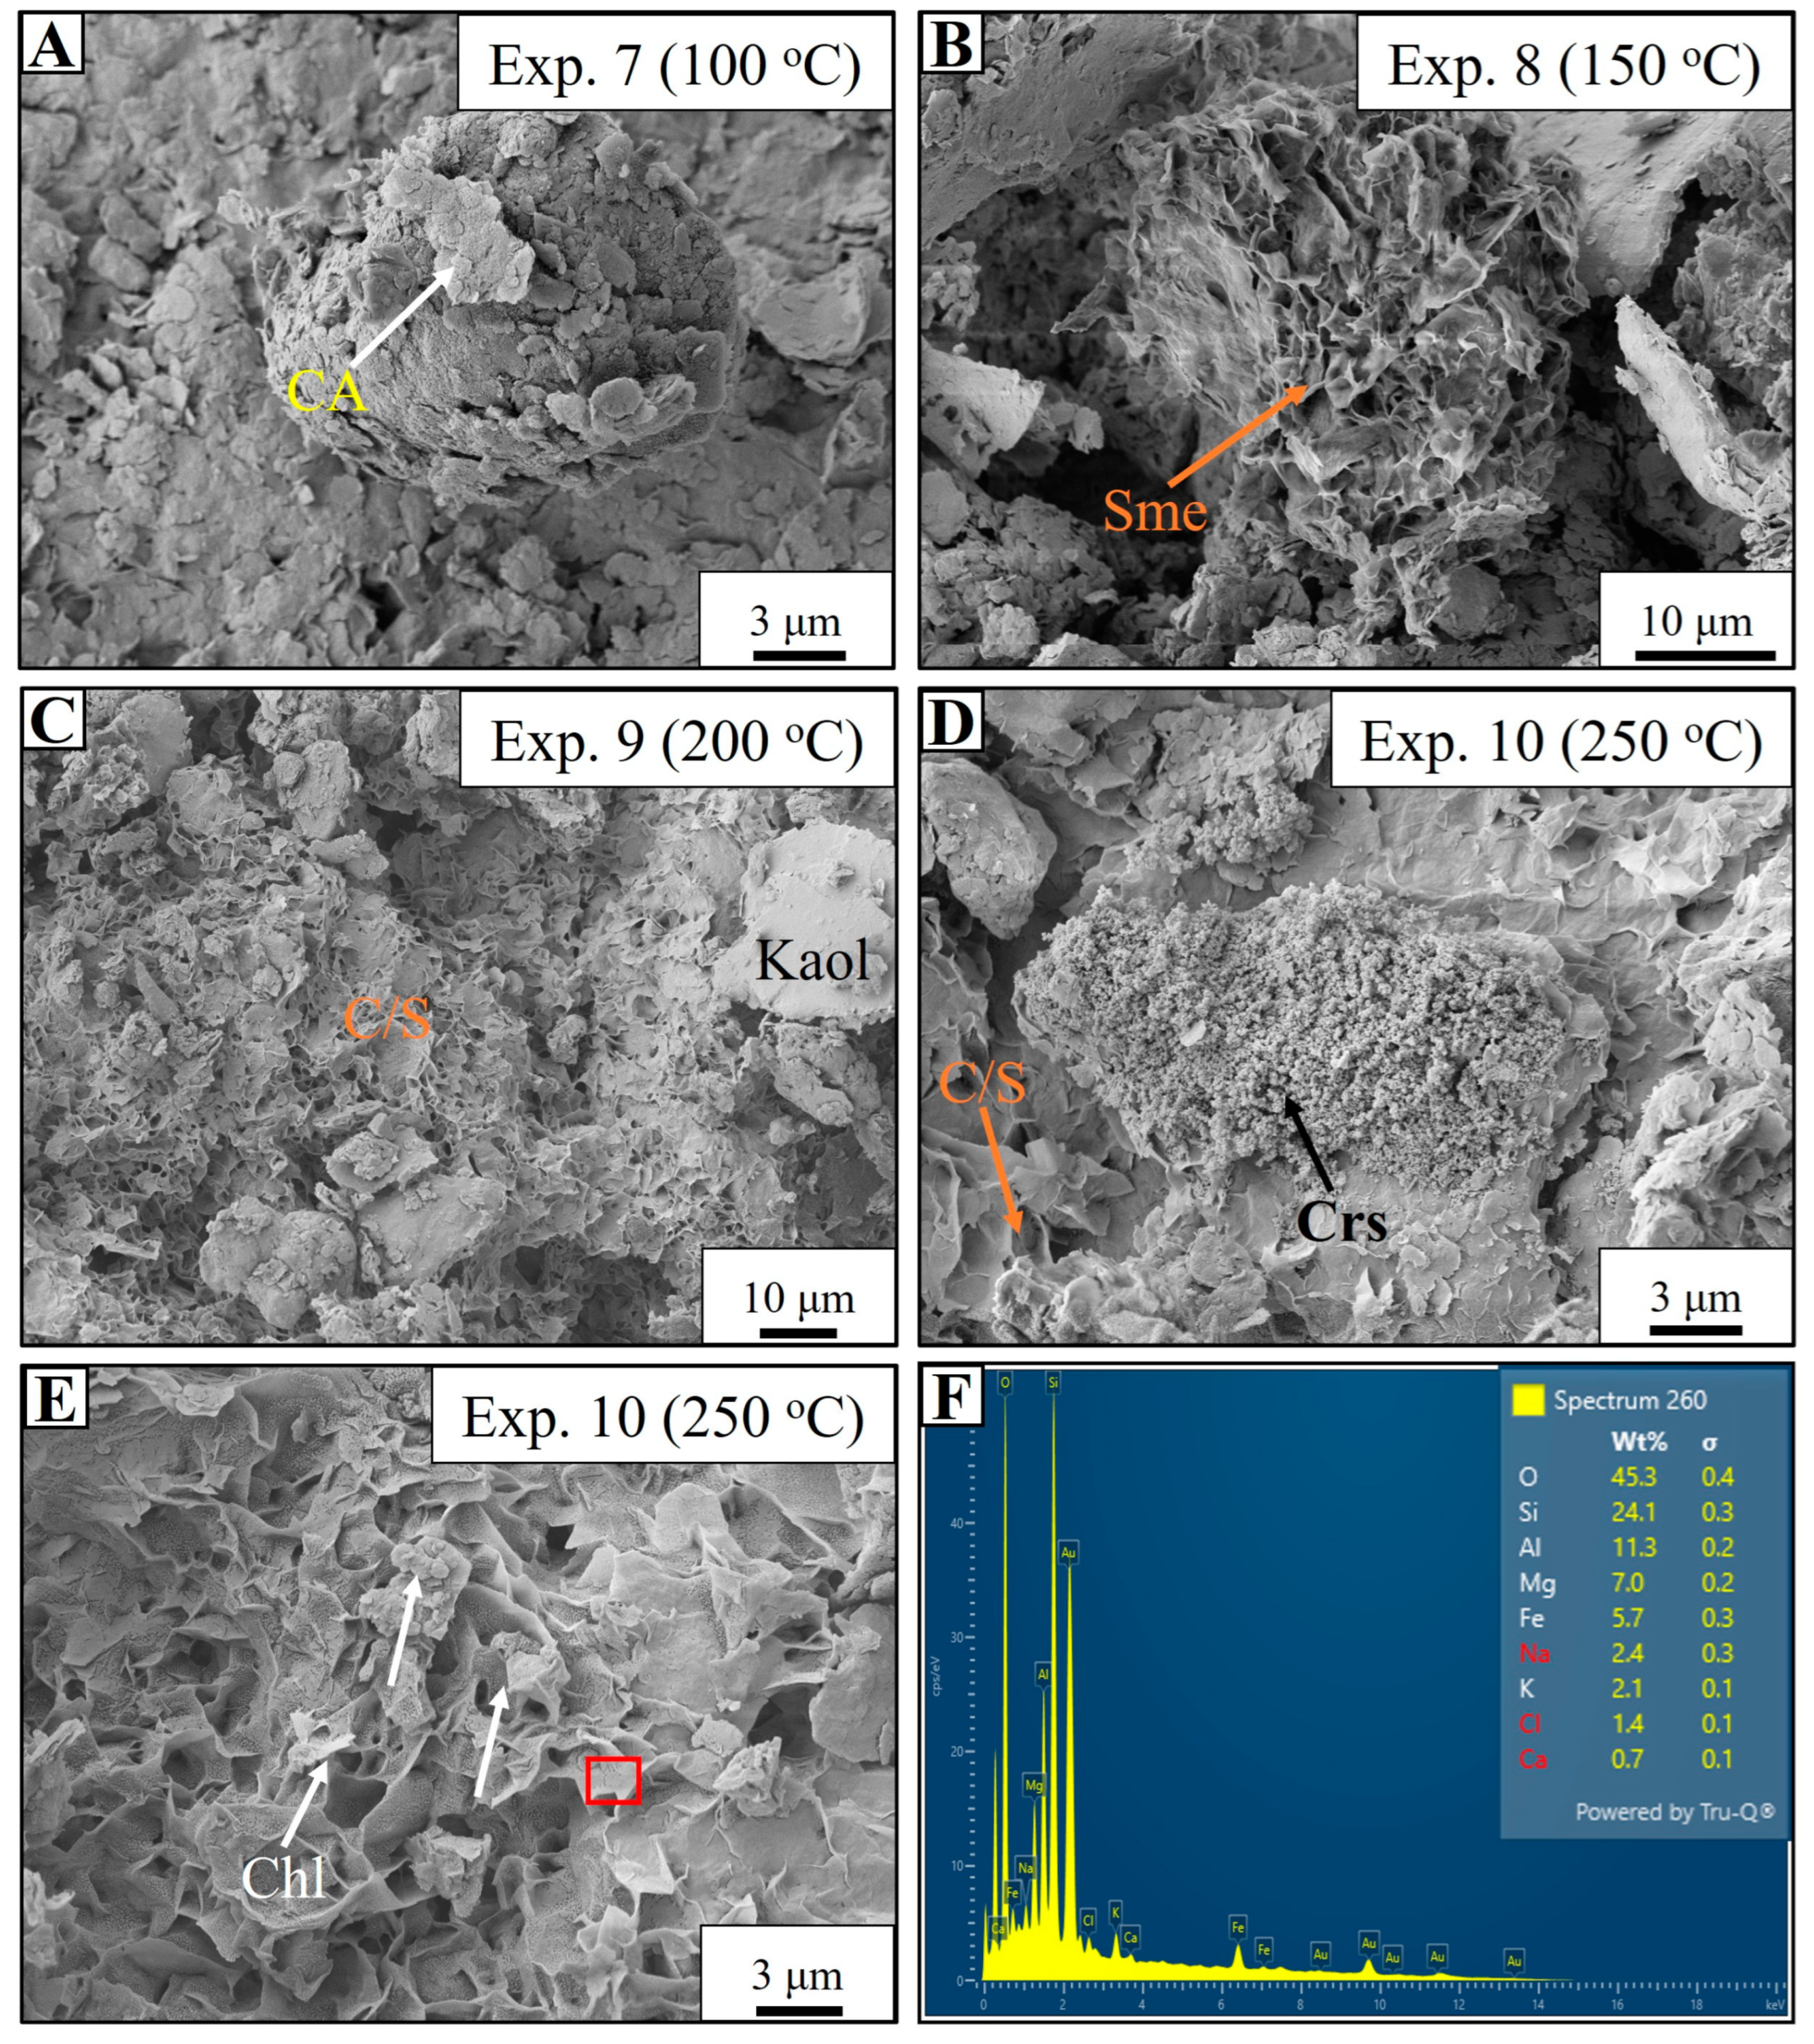
4.4. Mg-Rich Synthetic Fluid-Based Experiments (Experiments 7–10)

Experiments 7, 8, 9, and 10 were conducted at temperatures of 100, 150, 200, and 250 °C, respectively, using a 0.1 M NaCl, KCl, CaCl2·2H2O, and MgCl2·6H2O synthetic solution (SF2) for 14 days each. Results from these experiments highlight some differences in mineralogical and chemical transformations, compared to seawater-based experiments. XRF analysis revealed that SiO2 content increased from 55.08 wt% in Exp. 7 to 58.00 wt% in Exp. 8, slightly decreased in Exp. 9, and rose again in Exp. 10 (Table 2, Figure 3). Al2O3 concentrations exhibited a minor decrease in Exp. 8, remained relatively stable in Exp. 9, and increased in Exp. 10 (Table 2). CaO concentrations significantly decreased with increasing experimental temperatures, from 9.15 wt% in Exp. 7 to 1.39 wt% in Exp. 10. Notably, both Fe2O3 and MgO concentrations increased with rising experimental temperatures, with MgO rising from 2.64 wt% in Exp. 7 to 5.06 wt% in Exp. 10 (Table 2). The concentrations of Na2O and K2O remained relatively unchanged across the experiments (Table 2).
XRD analysis of the bulk mineralogy identified quartz and feldspars (orthoclase and plagioclase) as the dominant minerals in all experiments. Quartz concentrations fluctuated slightly, decreasing in Exp. 10 after an increase in Exp. 9 (Table 3). Orthoclase and plagioclase feldspars decreased with increasing temperature (Table 3). Calcite and muscovite were also present but decreased in concentration with rising temperatures from Exp. 7 to 10 (Table 3). The total clay mineral content in the bulk mineralogy increased progressively, rising from 22.9% in Exp. 7 to 46.7% in Exp. 10 (Table 3). Kaolinite, illite, and chlorite were detected in oriented clay fraction XRD analyses (Figure 6D). In Exp. 10, kaolinite exhibited characteristic peaks at 7.15 Å (001) and 3.57 Å (002) in air-dried and ethylene glycol-treated samples, which disappeared upon heating (Figure 6D). Illite peaks were consistent across all untreated and treated analyses (Figure 6D). Smectite was present in minor to trace amounts and decreases with increasing temperature, with only a weak peak observed at 3.24 Å in Exp. 10 (Figure 6D). A distinctive feature of these experiments was the authigenic formation of chlorite, which began in Exp. 8 and increased with temperature. Chlorite exhibited a primary (001) peak at 13.99 Å (Figure 6D), with low-intensity peaks identified in both air-dried and treated samples. Semi-quantitative analysis showed that kaolinite concentration in the clay fraction decreased with increasing temperature, while smectite decreased from 2% in Exp. 7 to trace amounts in Exp. 10. Illite concentration increased in Experiments 8 and 9 before slightly declining in Exp. 10 (Table 3). Chlorite concentrations consistently increased, rising from 4% in Exp. 7 to 16% in Exp. 10 (Table 3).
The pH and TDS of the pre-experiment solution (SF2) were measured at 5.71 and 45.33 ppt, respectively (Table 4). Post-experiment, the pH increased to 6.22 in Exp. 7 and remained stable throughout the experiments, while TDS rose from 56.15 ppt in Exp. 7 to 62.29 ppt in Exp. 10 (Table 4). ICP-OES analysis of the reacting fluid showed that Al and Fe, initially absent in the pre-reacted solution, were detected post-experiment, with concentrations increasing with temperature (Table 4). Ca concentration increased substantially, reaching 48,400 mg/L in Exp. 10 from an initial 8730 mg/L. Conversely, Mg was consumed, decreasing from 15,500 mg/L in the starting solution to 167 mg/L in Exp. 10 (Table 4, Figure 10). Na concentrations decreased during the experiments, while K showed irregular fluctuations, increasing in Experiments 7 and 8 but decreasing in Experiments 9 and 10 (Table 4, Figure 10).
SEM analysis revealed the onset of detrital aggregate dissolution without new mineral formation in Exp. 7 (Figure 11A). However, evidence of smectite transformation was observed in Exp. 8 (Figure 11B). Mixed-layer chlorite/smectite with a rugged, honeycomb morphology appeared in Exp. 9, adjacent to kaolinite platelets (Figure 11C). Additionally, abundant microcrystalline quartz aggregates developed alongside the transforming mixed-layer chlorite/smectite in Exp. 9 (Figure 11D). Fully developed chlorite with a mixed honeycomb-to-rosette morphology was observed in Exp. 10 (Figure 11E), suggesting partial replacement of smectite while retaining its morphology. EDS analysis identified Si, O, Al, Mg, and Fe as the major elements in the newly formed chlorite, with minor amounts of Na, K, and Ca (Figure 11F).

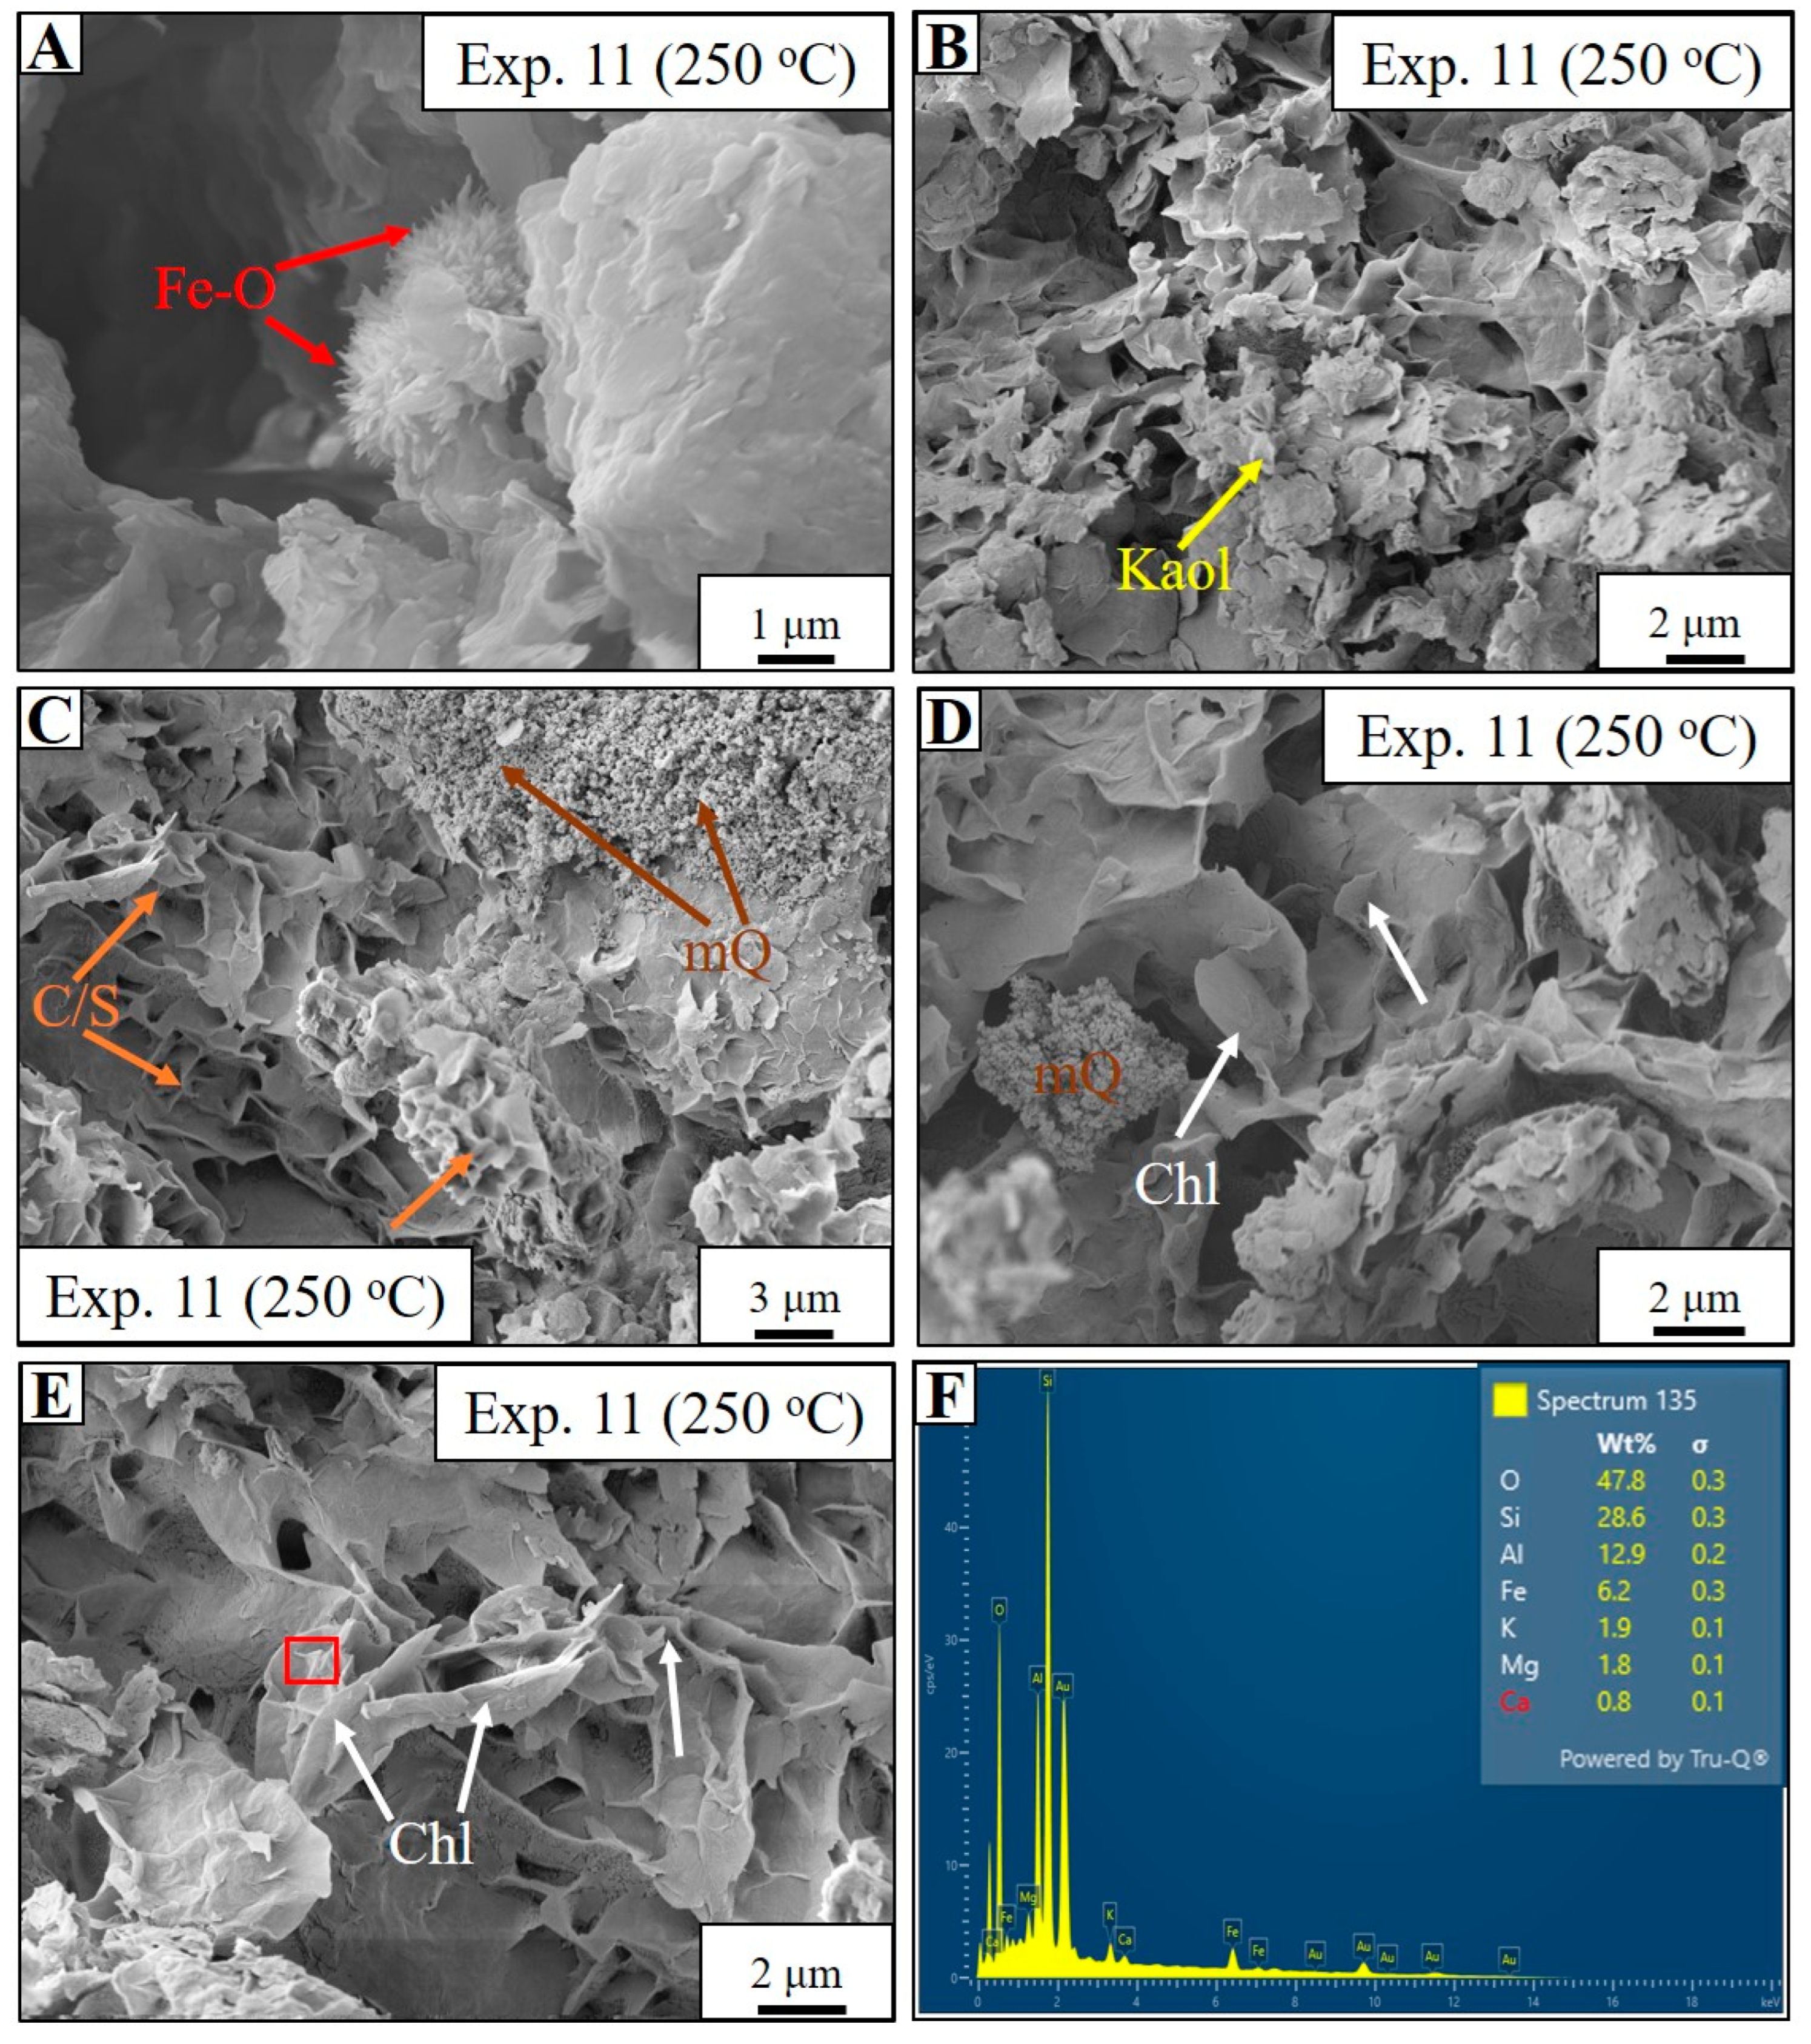
4.5. Estuarine Water-Based Experiment (Experiment 11)

This experiment was conducted at 250 °C for 14 days using natural estuarine water collected from the Gironde estuary, SW France. Comprehensive geochemical and mineralogical analyses were performed on both the solids and solutions before and after the hydrothermal reaction. XRF, XRD, and SEM analyses revealed that all authigenic clay minerals formed in Exp. 10 were also present in Exp. 11, albeit with minor compositional differences (Figure 3, Figure 6, and Figure 12). The oxides identified in the XRF analysis exhibited similar trends to those observed in Exp. 10. The key distinction lies in the amounts of Fe2O3 and MgO (Table 2). While MgO decreased slightly in Exp. 11 (8.23 wt%) compared to Exp. 10 (9.58 wt%), Fe2O3 increased significantly to 7.62 wt% from 5.06 wt% (Table 2). Additionally, concentrations of other minor and trace elements remained largely unchanged (Table 2, Figure 3). All minerals identified in the bulk and clay fraction XRD analyses of Exp. 10 were also detected in Exp. 11, with some variation in concentration (Table 3, Figure 4 and Figure 6). Notably, the concentration of authigenic chlorite increased from 16% in Exp. 10 to 24% in Exp. 11, as quantified from the clay fraction XRD analyses (Table 3, Figure 6E).
The pH of the pre-experimental estuarine water was 7.26 but slightly decreased to 6.91 after the hydrothermal experiment (Table 4). In contrast, the TDS increased from 13.02 ppt to 26.39 ppt post experiment (Table 4). ICP-OES analysis indicated an increase in Al, Ca, and K concentrations in the post-experimental reacting fluid, while Fe was significantly depleted (Table 4). Mg and Na concentrations decreased after the hydrothermal reaction (Table 4, Figure 10).
SEM and STEM analyses provided evidence of authigenic chlorite formation and mixed-layer clays. Small acicular crystals of Fe-oxides (Figure 12A) were observed adjacent to kaolinite (Figure 12B). Moreover, SEM analysis revealed that chlorite in Exp. 11 formed by replacing smectite through mixed-layer stages (Figure 12C–E). The mixed-layer chlorite/smectite exhibited honeycomb to web-like morphologies and was found adjacent to newly formed small aggregates of microcrystalline quartz (Figure 12C). Fully developed authigenic chlorite exhibited rosette morphologies (Figure 12D,E). Elemental analysis of the authigenic chlorite showed Si, O, Al, and Fe as major constituents, with minor amounts of Mg, K, and Ca. This composition differed slightly from the chlorite observed in Exp. 10, which was richer in Mg than Fe (Figure 11F). Furthermore, STEM analysis revealed elongated chlorite crystals (Figure 8E,F) closely associated with mixed-layer chlorite/smectite (Figure 8E).

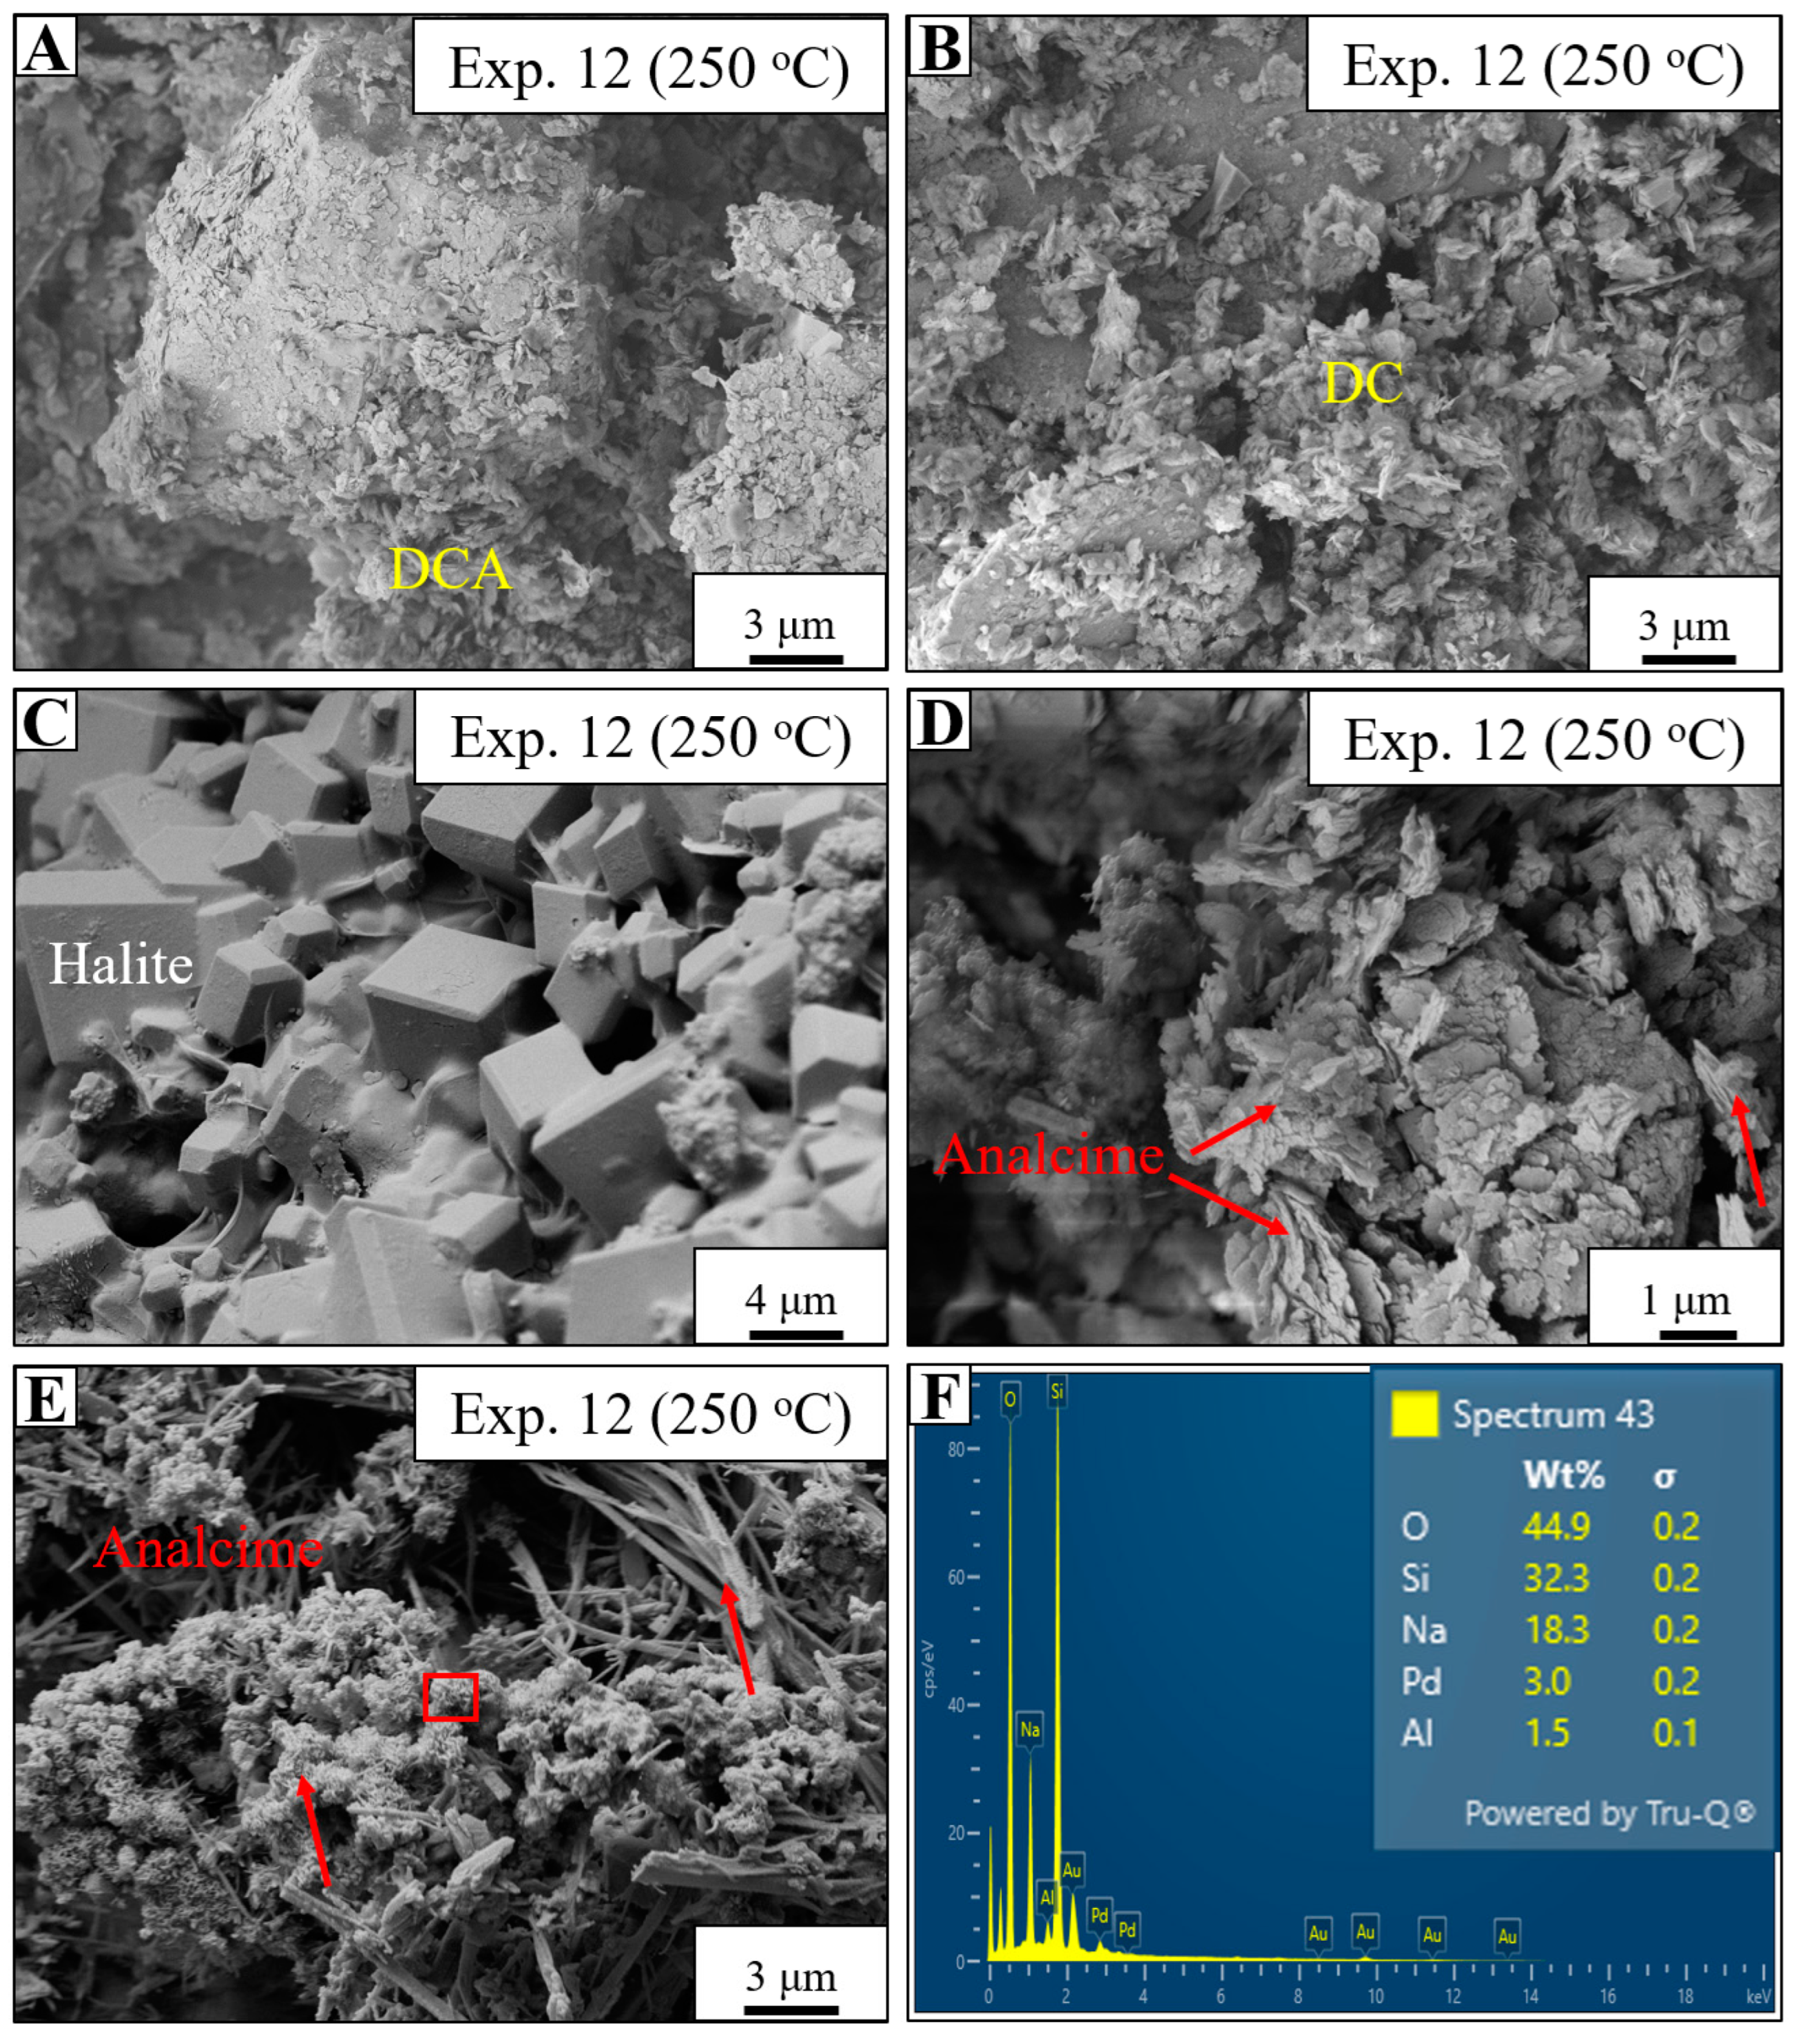
4.6. Na-Rich Synthetic Fluid-Based Experiment (Experiment 12)

This experiment utilized a highly alkaline 0.1 M synthetic Na2CO3 solution at 250 °C for 14 days. Post-reaction XRF analysis of the sediment indicated a substantial increase in Na2O to 5.46 wt% from 0.79 wt% in the starting material (Table 2). This concentration was significantly higher than in all previous experiments (Table 2, Figure 3). While K2O concentrations increased in most prior experiments, they decreased to 2.88 wt% in Exp. 12 from 3.07 wt% in the starting material. Concentrations of CaO, MgO, Fe2O3, and other trace oxides remained relatively stable compared to the starting material (Table 2, Figure 3).
The bulk mineralogical analysis of Exp. 12 showed key differences compared to the starting material, including a decrease in total clay minerals and the presence of analcime (zeolite) unique to this experiment (Table 3, Figure 4). The concentration of clay minerals decreased to 13.1% from 20.3% in the starting material, contrasting with prior experiments, where clay mineral concentrations increased with rising temperature (Table 3). A high-intensity broad peak of authigenic analcime was identified (Figure 4), accounting for 21.7% of the total post-experimental bulk mineralogy (Table 3). This mineral was absent in all previous experiments (Figure 4). Additionally, halite was identified, with a measured concentration of 2.4% (Table 3, Figure 4). Clay fraction XRD analysis revealed kaolinite, illite, and smectite as the primary clay minerals (Figure 6F). Kaolinite concentration decreased to 16%, smectite increased to 40%, and illite remained relatively unchanged at 41% compared to the starting material (Table 3).
The pre-experimental solution had a high pH of 11.32 and a TDS of 13.79 ppt. After the experiment, the pH and TDS decreased to 8.31 and 7.79 ppt, respectively (Table 4). Sodium (Na), the dominant cation in the starting solution, was significantly depleted from 8250 mg/L to 390 mg/L after the reaction (Table 4, Figure 10). Furthermore, ICP-OES analysis revealed that Mg and Fe dissolved during the experiment and were detected in the reactive fluid post experiment (Table 4).
SEM analysis showed no evidence of structurally developed illite or chlorite; however, detrital clay aggregates in the starting material exhibited signs of disaggregation, marking the initial stages of dissolution and/or transformation (Figure 13A, B). Interestingly, SEM analysis confirmed the formation of halite and analcime (zeolite) (Figure 13C–E). Fully developed halite occurred as clear cubic crystals (Figure 13C), while analcime exhibited massive aggregates (Figure 13D) and acicular to botryoidal morphologies (Figure 13E). The massive analcime aggregates formed within dissolving kaolinite (Figure 13D) and transitioned to acicular or botryoidal morphologies when fully developed (Figure 13E). Elemental analysis (EDS) of analcime identified Si, O, Na, and Al as its primary constituents (Figure 13F).

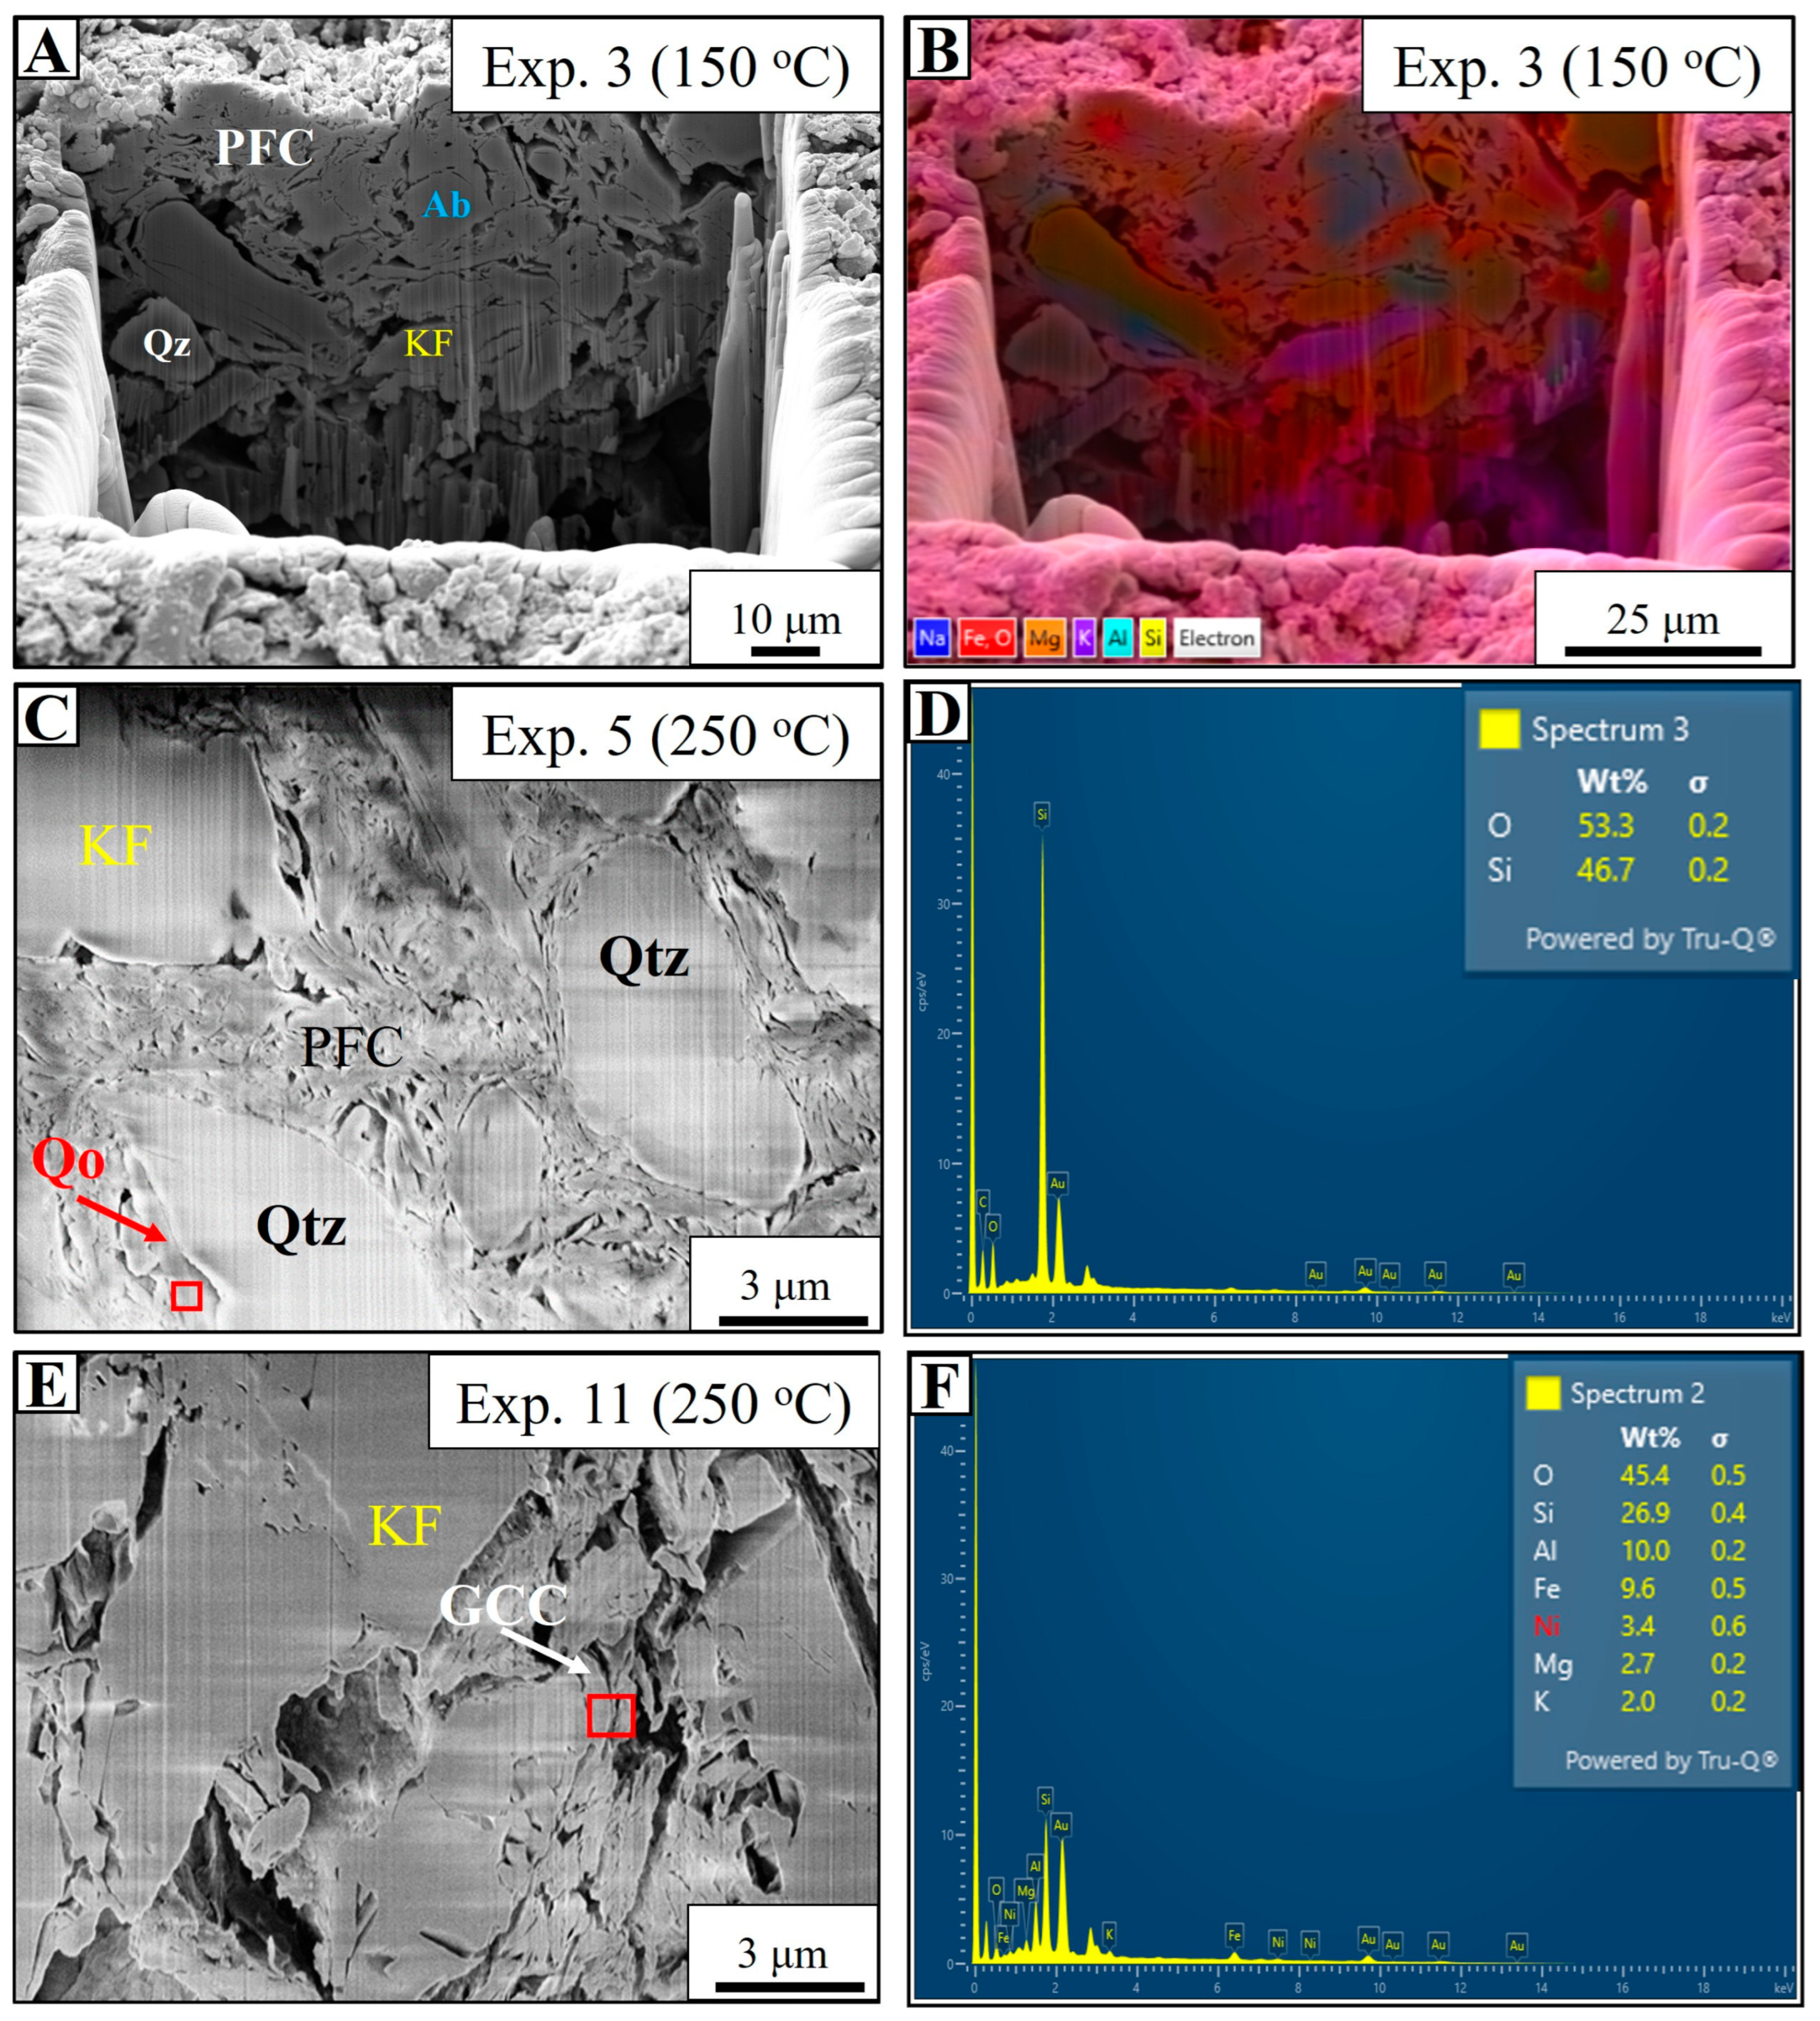
4.7. FIB-SEM Observations

The morphology, composition, distribution, and spatial relationships between framework grains and authigenic clay minerals were further investigated using FIB-SEM and EDS analyses (Figure 14A–F). The 2D internal structure analysis of the post-reacted samples revealed that authigenic clay minerals occurred both as pore-filling phases (Figure 14A–C) and as grain coatings (Figure 14E). Highly microporous pore-filling clay minerals were observed cementing detrital grains in Exp. 3 (Figure 14A,B) but appeared to become less microporous in Exp. 5 (Figure 14C). Additionally, quartz overgrowths were observed surrounding detrital quartz grains where authigenic grain-coating clays were absent (Figure 14C). EDS analysis confirmed that the quartz overgrowth consists of Si and O (Figure 14D). Grain-coating chlorite was identified surrounding detrital K-feldspar grains in Exp. 11 (Figure 14E). Elemental analysis via EDS indicated that chlorite was composed predominantly of O, Si, Al, and Fe, with minor amounts of Mg, K, and Ni (Figure 14F).

5. Discussion

5.1. Controls and Mechanisms of Authigenic Illite Formation

Illite is one of the primary clay minerals synthesized in the present study (Figure 6, Figure 7, Figure 8 and Figure 9), predominantly from seawater-based experiments (Experiments 1–6). These experiments resulted in smectite’s transformation into illite, a common diagenetic pathway observed in many natural sedimentary environments [16,56,57,58]. The formation of authigenic illite in siliciclastic rocks occurs due to the progressive transformation of precursor minerals such as K-feldspar, kaolinite, or smectite, beginning at low temperatures during burial and continuing under elevated temperatures and pressures [22,59]. This study has demonstrated the illitization of authigenic smectite to varying extents through mixed-layer illite/smectite stages, as evidenced by XRD (Table 3, Figure 6), SEM (Figure 7 and Figure 9), and STEM (Figure 8A–D) analyses. The authigenic smectite developed from the dissolution of unstable detrital materials, including orthoclase, calcite, and detrital clay aggregates. This process began at lower-temperature experiments (Experiments 1–2), which provided the necessary silica and cations for smectite neoformation (Table 3, Figure 7A). Consequently, well-crystallized authigenic smectite developed at 150 °C (Exp. 3, Figure 7B). With increasing temperature during progressive burial in natural sedimentary systems, smectite becomes unstable and transforms into illite through mixed-layer stages [14,60].
The smectite-to-illite transformation is influenced by temperature, fluid composition, and the availability of K+ [61,62,63,64,65]. In the present study, this transformation began at 150 °C through the formation of mixed-layer illite/smectite (Figure 7B,C) and reached a plateau at 250 °C (Figure 7E and Figure 8C). The required K+ was supplied through multiple sources, including the dissolution of K-feldspar and the K+ present in the experimental solutions. This conclusion is supported by the observed increase in K concentration in the reaction fluid during Experiments 1–2 (Table 4), which corresponds to the dissolution of detrital orthoclase (Table 3) and the subsequent rapid depletion of K+ during Experiments 4–6, coinciding with the onset of the illitization process (Table 4; Figure 7, Figure 8 and Figure 9). Additionally, the illitization of smectite has been experimentally documented under varied pH conditions, ranging from acidic [66,67] to neutral [43,64,68] and low alkaline [62,69] conditions. Experimental studies by [62,69] have shown that near neutral to high alkaline pH (7–11) increases Si and Al mobility, thereby enhancing illite development. The illite formed in the KCl-rich seawater experiment (Exp. 6) is more developed (Figure 9C) and constitutes over 80% of the total clay fraction (Table 3) compared to the illite formed in Exp. 5, which was conducted using seawater under the same temperature (250 °C). One plausible explanation for this variation in transformation rate is the higher K+ availability in Exp. 6 compared to Exp. 5 (Table 4). Experimental studies by [63] have shown that the rate of smectite-to-illite transformation strongly depends on the concentration of K+ in the reacting fluid. Experiments conducted under high K+ concentrations yield more structurally developed illite from smectite [70], consistent with the observations in this study. Furthermore, the honeycomb and lath-like morphologies of the synthesized smectite and illite closely resemble those observed in natural sandstones [16,56,71].
The mechanisms responsible for the smectite-to-illite transformation have been extensively debated over the past decades and are reviewed by [64,72]. The two most widely accepted mechanisms are dissolution-crystallization (DC) [64,73,74] and solid-state transformation (SST) [75,76]. In the seawater experiments (Experiments 4–5), the illitized smectite mostly retained the honeycomb morphology of smectite, characterized by curling illite flakes tangential to detrital grains (Figure 7C). This characteristic is commonly attributed to SST [64]. However, spikes of illite flakes were observed adjacent to poorly organized illite/smectite with a ragged honeycomb morphology (Figure 7D,E), suggesting the early dissolution of honeycomb smectite and its subsequent illitization. Additionally, studies by [64,77] have shown that precursor minerals can retain their morphology under DC transformation. Furthermore, the illite developed in KCl-rich seawater (Exp. 6) is characterized by lath-like morphology, indicating the dissolution of smectite and the precipitation of illite. This observation aligns with experimental studies by [65,78], which reported the formation of lath-like illite from smectite dissolution under similar temperature and fluid–rock ratios. Moreover, DC has been identified as the primary mechanism of smectite-to-illite transformation in natural fluid-dominated hydrothermal systems [79,80,81], based on observations of morphological changes and chemical variations, consistent with the findings of this study. Therefore, the smectite-to-illite transformation observed in this study (Experiments 4–6) is most likely due to DC rather than SST.

5.2. Authigenic Formation of Chlorite

As demonstrated in this study, the authigenic formation of chlorite is a key feature observed in experiments conducted with Mg-rich synthetic fluid (SF2; Experiments 7–10) and natural estuarine water (Experiment 11) (Figure 11 and Figure 12). The findings indicate that chlorite formed through the transformation of smectite, proceeding via intermediate mixed-layer chlorite/smectite (C/S) phases, as evidenced by SEM (Figure 11 and Figure 12), STEM (Figure 8E,F), and XRD (Figure 6D,E) analyses. In natural sedimentary systems, the chloritization of smectite is predominantly reported to occur through dissolution-crystallization (DC; [22,82,83], with occasional occurrences of solid-state transformation (SST; [84]. Additionally, temperature, fluid composition, and fluid–rock ratios are critical in facilitating the smectite-to-chlorite transformation [40,84,85].
During the DC mechanism, chlorite forms from the chemical components released during the dissolution of smectite, including silica, aluminum, and interlayer cations, while incorporating Fe2+ and Mg2+ supplied either by detrital minerals (e.g., biotite or volcanic fragments) or pore fluids [39]. In this study, the chlorite synthesized in Exp. 11 exhibits a well-developed rosette morphology (Figure 12E) that is closely associated with dissolved, honeycomb-like smectite through interstratified C/S phases (Figure 8E and Figure 12C), characteristic of the DC transformation. In addition, although the chlorite synthesized in Exp. 10 retains the honeycomb morphology of its precursor smectite (Figure 11E) and exhibits interstratified C/S phases (Figure 11C), the C/S is assumed to be newly formed through DC. The required Fe and Mg for the synthesis of chlorite in this study are provided by the experimental solutions, in addition to the dissolution of newly formed Fe-oxide in Exp. 11 (Figure 12A). Thus, our results suggest that chlorite formation predominantly occurs via the DC mechanism.
The chlorites formed in this study exhibit morphology comparable to both experimentally synthesized chlorites and natural authigenic chlorites found in ancient sandstone reservoirs. For instance, honeycomb and rosette morphologies have been reported in experimental studies by [52] and in the Triassic Yanchang Formation of the Ordos Basin, China [86], as well as in numerous natural sandstone reservoirs [18,59,71]. Furthermore, the release of Si and Al into the experimental solution during smectite transformation appears to have contributed significantly to the formation of by-products such as microcrystalline quartz (Figure 11D and Figure 12C–E) and quartz cement (Figure 14C).

5.3. Role of Fluid Chemistry in the Transformation Pathways of Modern Estuarine Sediments

The chemistry of pore fluids during fluid–rock interactions is critical in determining the pathways and extent of diagenetic alteration of detrital clay minerals in modern sediments [34]. Variations in pH, redox potential, salinity, and dissolved ion concentrations influence the mechanisms of mineral transformation and the resulting mineral phases [87,88,89]. These variations are particularly significant in dynamic environments such as estuaries, where fluid composition fluctuates due to freshwater–seawater interactions and organic matter degradation [34]. Additionally, the fluid composition used in hydrothermal experiments is crucial in shaping the mineralogy and chemistry of the synthesized minerals [42,83]. This study utilized five distinct fluids of variable composition, resulting in the formation of distinct mineral phases.
Both SW and SF1 facilitated the authigenic formation of smectite from detrital clay precursors and its subsequent transformation into illite. The illitization of smectite was more pronounced in Experiments 5 and 6, conducted at 250 °C. Nonetheless, slight differences were observed in the smectite illitization rate and the resulting illite’s chemistry. The most significant change in the experimental alteration was an increase in potassium (K) in the interlayer sites, accompanied by a decrease in sodium (Na) and calcium (Ca) (Figure 8D and Figure 9D). The XRD peaks of the authigenic illite were broader in Exp. 6 (Figure 6C) than in Exp. 5 (Figure 6B). Additionally, XRD patterns indicated the presence of smectite alongside illite in Exp. 5 (Figure 6B). In contrast, smectite was undetectable in Exp. 6 (Figure 6C). Sylvite was also formed in Exp. 6 (Table 3, Figure 6C). A plausible explanation for these variations is the higher concentration of K in Exp. 6 compared to Exp. 5, which accelerated the rate of smectite illitization. Kinetic modeling of smectite illitization by [70] demonstrated that elevated K concentrations in pore fluids enhance illitization and accelerate the reaction rate. The slight decrease in pH observed in the experiments is attributed to the release of silica and Fe (Table 4) during the dissolution of detrital clay minerals and the transformation of smectite into illite.
Distinctively, the Mg-rich synthetic fluid (SF2) and the estuarine water (EW) resulted in the formation of chlorite from smectite (Figure 11 and Figure 12). However, slight differences were observed in the chemistries of the authigenic chlorites. Chlorites formed from SF2, enriched in Mg, Ca, K, and Na, were dominantly Mg-rich (Figure 11F). In contrast, chlorites formed from the natural Gironde estuarine water, which contains higher Fe and lower Mg concentrations than SF2, were Fe-rich chlorites (Figure 12F). This observation can be attributed to the relative scarcity of Mg in estuarine water, which forces the chlorites to incorporate more Fe into their structures to maintain charge balance and structural integrity. This is supported by the rapid depletion of Mg in SF2 (Experiments 7–10), which was relatively higher than in Exp. 11 (EW), and the consumption of Fe in Exp. 11 (Table 4). These findings align with the preferential formation of authigenic chlorite in ancient sedimentary environments. In natural sandstone reservoirs, Mg-rich chlorites are commonly associated with continental sandstones, whereas Fe-rich chlorites are prevalent in marginal marine environments such as deltas and estuaries [18,39].
In contrast to the formation of illite and chlorite in Experiments 1–11, Exp. 12, conducted using highly alkaline Na-rich synthetic solutions (SF3), resulted in the formation of halite and analcime (zeolite) that were not observed in the previous experiments (Figure 13). Zeolite minerals are generally rare in sandstones [59,71]. However, where present, they exert significant control on reservoir quality [90,91]. Analcime is one of the most common zeolites and is an important component of many petroliferous reservoirs worldwide [71,92,93]. Although authigenic analcime has been reported to occur from clay mineral precursors [94], its formation in sandstones is commonly associated with the transformation of clinoptilolite from volcanic glass during burial [90,95]. The formation of analcime typically occurs under highly alkaline conditions [96] and is facilitated by the availability of silica, as well as Na [91]. In this study, analcime was formed from the dissolution of detrital clay minerals, which provided the required silica, whereas Na was supplied from the dissolution of calcite and the experimental fluid, respectively (Table 4). The availability of Na and its concentration in pore fluids is essential for analcime stability and its preferential formation over other zeolites [97]. In this study, analcime developed concurrently with halite (Figure 13C).
Despite the use of the same starting material in this study, different minerals were synthesized under varying experimental conditions. These variations are directly associated with the differences in fluid chemistry employed in the experiments. These findings underscore the complex interplay between fluid chemistry and diagenetic processes in modern estuarine sediments.

5.4. Relevance of Hydrothermal Experiments to Natural Sandstone Diagenesis

Although the experimental conditions in this study were designed to simulate natural diagenetic processes, they inevitably represent simplified models of natural sandstone diagenesis. One key limitation is the time scale: natural diagenesis occurs over geologic timescale (millions of years), allowing for gradual reactions influenced by fluctuating temperature, pressure, and fluid composition. In contrast, laboratory experiments accelerate these processes by using elevated temperatures to condense reactions into hours or days. Furthermore, the use of uniform starting materials and static fluid compositions restricts the ability to replicate the inherent heterogeneity of natural systems, where pore-fluid chemistry evolves with burial depth, sediment provenance, and organic matter degradation.
Despite these limitations, hydrothermal experiments remain valuable proxies for investigating diagenetic processes in natural sandstone reservoirs, as they enable the controlled simulation of mineralogical and geochemical transformations. The findings of this study demonstrate strong alignment with key processes observed in natural systems. For instance, the illitization of smectite in potassium-rich fluids (e.g., SF1) closely mirrors potassium-driven transformations documented in sandstone reservoirs [7,22,98]. Similarly, the formation of Mg-rich and Fe-rich chlorites in experiments using SF2 and EW aligns with chlorite development in continental and marginal marine environments, respectively. In deeply buried sandstone reservoirs, Fe-rich chlorites are commonly associated with marginal marine settings, such as estuaries and deltas, where Fe-rich flocculated materials are present [10,18,39]. This observation agrees with the Fe-rich chlorites formed from the natural Gironde estuarine water used in this study.
Another significant finding is the synthesis of analcime from detrital clays under highly alkaline, Na-rich conditions, which broadens the understanding of analcime formation beyond its conventional association with volcanic glass [90]. By employing diverse fluid compositions, including natural seawater, estuarine water, and synthetic solutions with varied ionic concentrations and pH levels, this study provides a comprehensive perspective on how fluid chemistry governs diagenetic pathways. These results emphasize the relevance of hydrothermal experiments in mimicking the geochemical processes that drive the diagenetic transformation of detrital clay minerals during burial. Furthermore, they highlight the potential of modern estuarine sediments as analogs for diagenetic processes, underscoring the critical role of dynamic fluid compositions in shaping mineralogical transformations and reservoir quality.
To deepen the understanding of the impact of fluid chemistry on the diagenetic pathways of modern estuarine sediments, future research should focus on longer experimental durations and the incorporation of dynamic fluid flow to reflect the evolving nature of natural sandstone diagenesis. In addition, conducting geochemical modeling using data from experimental studies would enhance the extrapolation of laboratory findings to geological time scales. While these areas of improvement are necessary, the findings of this study provide a solid foundation for understanding diagenetic alteration in modern estuarine sediments and their implications for sandstone reservoir evolution.

6. Conclusions

  • During the hydrothermal experiments, the dissolution of detrital feldspars and clay aggregates occurred at temperatures below 100 °C, followed by the authigenic formation of smectite at 150 °C.
  • At higher temperatures (150 °C to 250 °C), K-rich fluids (SW, SF1) facilitated the illitization of smectite, replicating potassium-driven processes observed in natural reservoirs. This transformation predominantly occurred via dissolution-crystallization, with the required K+ supplied by the dissolution of K-feldspar and the experimental solutions.
  • The chloritization of smectite occurred in both Mg-rich synthetic fluids (SF2) and natural Gironde estuary water (EW) at 250 °C, producing chlorites with distinct chemistries. SF2 yielded Mg-rich chlorites, while EW produced Fe-rich chlorites, consistent with diagenetic trends in marginal marine environments, where Fe-rich chlorites are associated with estuarine and deltaic systems.
  • The formation of authigenic chlorites involved a combination of dissolution-crystallization and solid-state transformation. The transformation of smectite into chlorite released abundant silica into the experimental solutions, resulting in the precipitation of microcrystalline quartz and quartz overgrowths.
  • Analcime (zeolite) was synthesized under highly alkaline (pH 11.32), Na-rich conditions (SF3), advancing the understanding of zeolite formation beyond its traditional association with volcanic glass precursors.
  • The synthesized mineral phases exhibited chemical and morphological similarities to those found in natural sedimentary systems, highlighting the critical role of fluid chemistry in influencing diagenetic pathways and improving our understanding of detrital clay transformations during burial diagenesis

Author Contributions

Conceptualization, A.M.S.; methodology, A.M.S. and A.O.A.; software, A.M.S. and A.O.A.; validation, A.M.S., A.M.B. and K.A.-R.; formal analysis, A.M.S.; investigation, A.M.S., resources, A.M.B., K.A.-R. and A.O.A.; data curation, A.M.S.; writing—original draft preparation, A.M.S.; writing—review and editing, A.M.S., A.M.B., A.O.A. and K.A.-R.; visualization, A.M.S., A.M.B., A.O.A. and K.A.-R.; supervision, K.A.-R. and A.M.B.; project administration, K.A.-R.; funding acquisition, K.A.-R. All authors have read and agreed to the published version of the manuscript.

Funding

The resources used in this study were provided by the College of Petroleum Engineering and Geosciences (CPG) at King Fahd University of Petroleum and Minerals, Dhahran 32261, Saudi Arabia.

Data Availability Statement

The data presented in this study are available upon request by contacting the corresponding author.

Acknowledgments

The authors sincerely thank the College of Petroleum Engineering and Geosciences (CPG) at King Fahd University of Petroleum and Minerals for providing the necessary resources for this study. We wish to thank Ajibola H. Okeyode and Bandar D. Al-Otaibi for their assistance in sample preparation for SEM analysis and conducting XRF analysis, respectively.

Conflicts of Interest

The authors declare no conflict of interest.

References

  1. Heald, M.T.; Larese, R.E. Influence of Coatings on Quartz Cementation. J. Sediment. Res. 1974, 44, 1269–1274. [Google Scholar] [CrossRef]
  2. Pittman, E.D.; Larese, R.E.; Heald, M.T. Clay Coats: Occurrence and Relevance to Preservation of Porosity in Sandstones. In Origin, Diagenesis, and Petrophysics of Clay Minerals in Sandstones; SEPM Society for Sedimentary Geology: Tulsa, OK, USA, 1992; Volume 47. [Google Scholar]
  3. Worden, R.; Morad, S. Quartz Cementation in Oil Field Sandstones: A Review of the Key Controversies. Spec. Publ. Int. Assoc. Sed. 2000, 29, 1–20. [Google Scholar] [CrossRef]
  4. Taylor, T.R.; Giles, M.R.; Hathon, L.A.; Diggs, T.N.; Braunsdorf, N.R.; Birbiglia, G.V.; Kittridge, M.G.; MacAulay, C.I.; Espejo, I.S. Sandstone Diagenesis and Reservoir Quality Prediction: Models, Myths, and Reality. Am. Assoc. Pet. Geol. Bull. 2010, 94, 1093–1132. [Google Scholar] [CrossRef]
  5. Wooldridge, L.; Worden, R.; Griffiths, J.; Utley, J. Clay Coat Diversity in Marginal Marine Sediments. Sedimentology 2018, 66, 1118–1138. [Google Scholar] [CrossRef]
  6. Lander, R.H.; Bonnell, L.M.; Taylor, T.R.; Espejo, I. Chapter 13—Reservoir Quality and Diagenesis of Deepwater Sandstones. In Deepwater Sedimentary Systems; Rotzien, J.R., Yeilding, C.A., Sears, R.A., Hernández-Molina, F.J., Catuneanu, O.B.T.-D.S.S., Eds.; Elsevier: Amsterdam, The Netherlands, 2022; pp. 471–514. ISBN 978-0-323-91918-0. [Google Scholar]
  7. Bello, A.; Amao, A.; Alqubalee, A.; Al-Hashem, M.; Albarri, H.; Almasrahy, M.; Al-Ramadan, K.; Babalola, L. Diagenetic Controls on Reservoir Porosity of Aeolian and Fluvial Deposits: A Case Study from Permo-Carboniferous Sandstones of Saudi Arabia. Arab. J. Sci. Eng. 2024, 49, 973–993. [Google Scholar] [CrossRef]
  8. Bello, A.M.; Butt, M.N.; Hussain, A.; Amao, A.O.; Olariu, C.; Koeshidayatullah, A.I.; Malik, M.H.; Al-Hashem, M.; Al-Ramadan, K. Impact of Depositional and Diagenetic Controls on Reservoir Quality of Syn-Rift Sedimentary Systems: An Example from Oligocene-Miocene Al Wajh Formation, Northwest Saudi Arabia. Sediment. Geol. 2023, 446, 106342. [Google Scholar] [CrossRef]
  9. Salisu, A.M.; Algheryafi, H.; Bello, A.M.; Amao, A.O.; Al-Otaibi, B.; Al-Ramadan, K. Depositional and Diagenetic Controls on the Reservoir Quality of Marginal Marine Sandstones: An Example from the Early Devonian Subbat Member, Jauf Formation, Northwest Saudi Arabia. Mar. Pet. Geol. 2024, 170, 107147. [Google Scholar] [CrossRef]
  10. Ehrenberg, S.N. Preservation of Anomalously High Porosity in Deeply Buried Sandstones by Grain-Coating Chlorite: Examples from the Norwegian Continental Shelf1. Am. Assoc. Pet. Geol. Bull. 1993, 77, 1260–1286. [Google Scholar] [CrossRef]
  11. Bloch, S.; Lander, R.H.; Bonnell, L. Anomalously High Porosity and Permeability in Deeply Buried Sandstone Reservoirs: Origin and Predictability. Am. Assoc. Pet. Geol. Bull. 2002, 86, 301–328. [Google Scholar] [CrossRef]
  12. Al-Ramadan, K.; Morad, S.; Proust, J.-N.; Al-Aasm, I. Distribution of Diagenetic Alterations within the Sequence Stratigraphic Framework of Shoreface Siliciclastic Deposits: Evidence from the Jurassic Deposits of NE France. J. Sediment. Res. 2005, 75, 10–38. [Google Scholar] [CrossRef]
  13. Walderhaug, O.; Porten, K.W. How Do Grain Coats Prevent Formation of Quartz Overgrowths? J. Sediment. Res. 2022, 92, 988–1002. [Google Scholar] [CrossRef]
  14. McKinley, J.M.; Worden, R.H.; Ruffell, A.H. Smectite in Sandstones: A Review of the Controls on Occurrence and Behaviour during Diagenesis. In Clay Mineral Cements in Sandstones; Wiley: Hoboken, NJ, USA, 1999; pp. 109–128. [Google Scholar]
  15. Khan, M.A.; Khan, T.; Ali, A.; Bello, A.M.; Radwan, A.E. Role of Depositional and Diagenetic Controls on Reservoir Quality of Complex Heterogenous Tidal Sandstone Reservoirs: An Example from the Lower Goru Formation, Middle Indus Basin, Southwest Pakistan. Mar. Pet. Geol. 2023, 154, 106337. [Google Scholar] [CrossRef]
  16. Franks, S.G.; Zwingmann, H. Origin and Timing of Late Diagenetic Illite in the Permian–Carboniferous Unayzah Sandstone Reservoirs of Saudi Arabia. Am. Assoc. Pet. Geol. Bull. 2010, 94, 1133–1159. [Google Scholar] [CrossRef]
  17. Salisu, A.M.; Alqubalee, A.; Bello, A.M.; Al-Hussaini, A.; Adebayo, A.R.; Amao, A.O.; Al-Ramadan, K. Impact of Kaolinite and Iron Oxide Cements on Resistivity and Quality of Low Resistivity Pay Sandstones. Mar. Pet. Geol. 2023, 158, 106568. [Google Scholar] [CrossRef]
  18. Dowey, P.J.; Hodgson, D.M.; Worden, R.H. Pre-Requisites, Processes, and Prediction of Chlorite Grain Coatings in Petroleum Reservoirs: A Review of Subsurface Examples. Mar. Pet. Geol. 2012, 32, 63–75. [Google Scholar] [CrossRef]
  19. Small, J.S.; Hamilton, D.L.; Habesch, S. Experimental Simulation of Clay Precipitation within Reservoir Sandstones; 1, Techniques and Examples. J. Sediment. Res. 1992, 62, 508–519. [Google Scholar] [CrossRef]
  20. Haile, B.G.; Hellevang, H.; Aagaard, P.; Jahren, J. Experimental Nucleation and Growth of Smectite and Chlorite Coatings on Clean Feldspar and Quartz Grain Surfaces. Mar. Pet. Geol. 2015, 68, 664–674. [Google Scholar] [CrossRef]
  21. Almon, W.R.; Fullerton, L.B.; Davies, D.K. Pore Space Reduction in Cretaceous Sandstones through Chemical Precipitation of Clay Minerals. J. Sediment. Res. 1976, 46, 89–96. [Google Scholar] [CrossRef]
  22. Worden, R.; Morad, S. Clay Minerals in Sandstones: Controls on Formation, Distribution and Evolution. In Clay Mineral Cements in Sandstones; Wiley: Hoboken, NJ, USA, 2009; Volume 34, pp. 1–41. ISBN 9781444304336. [Google Scholar]
  23. Ajdukiewicz, J.M.; Larese, R.E. How Clay Grain Coats Inhibit Quartz Cement and Preserve Porosity in Deeply Buried Sandstones: Observations and Experiments. Am. Assoc. Pet. Geol. Bull. 2012, 96, 2091–2119. [Google Scholar] [CrossRef]
  24. Bello, A.M.; Usman, M.B.; Amao, A.O.; Salisu, A.M.; Al-Ramadan, K.; Abubakar, U.; Mukkafa, S.; Kwami, I.A.; Chiroma, L.U.; Al-Hashem, M.; et al. Linking Provenance and Diagenesis to Reservoir Quality Evolution of Sandstones: The Paleocene-Eocene Kerri-Kerri Formation, Northeastern Nigeria. Mar. Pet. Geol. 2025, 172, 107227. [Google Scholar] [CrossRef]
  25. Worden, R.H.; Armitage, P.J.; Butcher, A.R.; Churchill, J.M.; Csoma, A.E.; Hollis, C.; Lander, R.H.; Omma, J.E. Petroleum Reservoir Quality Prediction: Overview and Contrasting Approaches from Sandstone and Carbonate Communities. Geol. Soc. Spec. Publ. 2018, 435, 1–31. [Google Scholar] [CrossRef]
  26. Wooldridge, L.J.; Worden, R.H.; Griffiths, J.; Utley, J.E.P. Clay-Coated Sand Grains in Petroleum Reservoirs: Understanding Theirdistribution via a Modern Analogue. J. Sediment. Res. 2017, 87, 338–352. [Google Scholar] [CrossRef]
  27. Lawan, A.Y.; Worden, R.H.; Utley, J.E.P.; Crowley, S.F. Sedimentological and Diagenetic Controls on the Reservoir Quality of Marginal Marine Sandstones Buried to Moderate Depths and Temperatures: Brent Province, UK North Sea. Mar. Pet. Geol. 2021, 128, 104993. [Google Scholar] [CrossRef]
  28. Wooldridge, L.J.; Worden, R.H.; Griffiths, J.; Utley, J.E.P. How to Quantify Clay-Coat Grain Coverage in Modern and Ancient Sediments. J. Sediment. Res. 2019, 89, 135–146. [Google Scholar] [CrossRef]
  29. Griffiths, J.; Worden, R.H.; Wooldridge, L.J.; Utley, J.E.P.; Duller, R.A. Detrital Clay Coats, Clay Minerals, and Pyrite: A Modern Shallow-Core Analogue for Ancient and Deeply Buried Estuarine Sandstones. J. Sediment. Res. 2018, 88, 1205–1237. [Google Scholar] [CrossRef]
  30. Simon, N.; Worden, R.H.; Muhammed, D.D.; Utley, J.E.P.; Verhagen, I.T.E.; Griffiths, J.; Wooldridge, L.J. Sediment Textural Characteristics of the Ravenglass Estuary; Development of a Method to Predict Palaeo Sub-Depositional Environments from Estuary Core Samples. Sediment. Geol. 2021, 418, 105906. [Google Scholar] [CrossRef]
  31. Virolle, M.; Brigaud, B.; Féniès, H.; Bourillot, R.; Portier, E.; Patrier, P.; Derriennic, H.; Beaufort, D. Preservation and Distribution of Detrital Clay Coats in a Modern Estuarine Heterolithic Point Bar in the Gironde Estuary (Bordeaux, France). J. Sediment. Res. 2021, 91, 812–832. [Google Scholar] [CrossRef]
  32. Virolle, M.; Brigaud, B.; Bourillot, R.; Féniès, H.; Portier, E.; Duteil, T.; Nouet, J.; Patrier, P.; Beaufort, D. Detrital Clay Grain Coats in Estuarine Clastic Deposits: Origin and Spatial Distribution within a Modern Sedimentary System, the Gironde Estuary (South-West France). Sedimentology 2019, 66, 859–894. [Google Scholar] [CrossRef]
  33. Griffiths, J.; Worden, R.H.; Wooldridge, L.J.; Utley, J.E.P.; Duller, R.A.; Edge, R.L. Estuarine Clay Mineral Distribution: Modern Analogue for Ancient Sandstone Reservoir Quality Prediction. Sedimentology 2019, 66, 2011–2047. [Google Scholar] [CrossRef]
  34. Bello, A.M.; Usman, M.B.; Amao, A.O.; Al-Ramadan, K.; Al-Hashem, M.; Kachalla, A.; Abubakar, U.; Salisu, A.M.; Mukkafa, S.; Kwami, I.A.; et al. Diagenesis and Reservoir Quality Evolution of Estuarine Sandstones: Insights from the Cenomanian-Turonian Yolde Formation, Northern Benue Trough, NE Nigeria. Mar. Pet. Geol. 2024, 169, 107073. [Google Scholar] [CrossRef]
  35. Worden, R.H.; Burley, S.D. Sandstone Diagenesis: The Evolution of Sand to Stone; Wiley: Hoboken, NJ, USA, 2009; ISBN 9781444304459. [Google Scholar]
  36. Bello, A.M.; Charlaftis, D.; Jones, S.J.; Gluyas, J.; Acikalin, S.; Cartigny, M.; Al-Ramadan, K. Experimental Diagenesis Using Present-Day Submarine Turbidite Sands. Front. Earth Sci. 2022, 10, 952690. [Google Scholar] [CrossRef]
  37. Bjørlykke, K.; Ramm, M.; Saigal, G.C. Sandstone Diagenesis and Porosity Modification during Basin Evolution. Geol. Rundsch. 1989, 78, 243–268. [Google Scholar] [CrossRef]
  38. Beaufort, D.; Rigault, C.; Billon, S.; Billault, V.; Inoue, A.; Inoue, S.; Patrier, P. Chlorite and Chloritization Processes through Mixed-Layer Mineral Series in Low-Temperature Geological Systems—A Review. Clay Miner. Miner. 2015, 50, 497–523. [Google Scholar] [CrossRef]
  39. Worden, R.H.; Griffiths, J.; Wooldridge, L.J.; Utley, J.E.P.; Lawan, A.Y.; Muhammed, D.D.; Simon, N.; Armitage, P.J. Chlorite in Sandstones. Earth Sci. Rev. 2020, 204, 103105. [Google Scholar] [CrossRef]
  40. Beaufort, D.; Berger, G.; Lacharpagne, J.C.; Meunier, A. An Experimental Alteration of Montmorillonite to a Di + Trioctahedral Smectite Assemblage at 100 and 200 °C. Clay Miner. Miner. 2001, 36, 211–225. [Google Scholar] [CrossRef]
  41. Lanson, B.; Beaufort, D.; Berger, G.; Bauer, A.; Cassagnabère, A.; Meunier, A. Authigenic Kaolin and Illitic Minerals during Burial Diagenesis of Sandstones: A Review. Clay Miner. Miner. 2002, 37, 1–22. [Google Scholar] [CrossRef]
  42. Mosser-Ruck, R.; Cathelineau, M.; Guillaume, D.; Charpentier, D.; Rousset, D.; Barres, O.; Michau, N. Effects of Temperature, ph, and Iron/Clay and Liquid/Clay Ratios on Experimental Conversion of Dioctahedral Smectite to Berthierine, Chlorite, Vermiculite, or Saponite. Clays Clay Miner. 2010, 58, 280–291. [Google Scholar] [CrossRef]
  43. Charlaftis, D.; Dobson, K.J.; Jones, S.J.; Lakshtanov, D.; Crouch, J.; Cook, J. Experimental Simulation of Burial Diagenesis and Subsequent 2D-3D Characterization of Sandstone Reservoir Quality. Front. Earth Sci. 2022, 10, 766145. [Google Scholar] [CrossRef]
  44. Sottolichio, A.; Castaing, P.; Etcheber, H.; Maneux, E.; Schmeltz, M.; Schmidt, S. Observations of Suspended Sediment Dynamics in a Highly Turbid Macrotidal Estuary, Derived from Continuous Monitoring. J. Coast. Res. 2011, 2, 1579–1583. [Google Scholar]
  45. Coynel, A.; Schäfer, J.; Hurtrez, J.-E.; Dumas, J.; Etcheber, H.; Blanc, G. Sampling Frequency and Accuracy of SPM Flux Estimates in Two Contrasted Drainage Basins. Sci. Total Environ. 2004, 330, 233–247. [Google Scholar] [CrossRef]
  46. Castaing, P.; Allen, G.P. Mechanisms Controlling Seaward Escape of Suspended Sediment from the Gironde: A Macrotidal Estuary in France. Mar. Geol. 1981, 40, 101–118. [Google Scholar] [CrossRef]
  47. Allen, G.P. Sedimentary Processes and Facies in the Gironde Estuary: A Recent Model for Macrotidal Estuarine Systems. Can. Soc. Pet. Geol. 1991, 16, 29–39. [Google Scholar]
  48. Billy, J.; Chaumillon, E.; Féniès, H.; Poirier, C. Tidal and Fluvial Controls on the Morphological Evolution of a Lobate Estuarine Tidal Bar: The Plassac Tidal Bar in the Gironde Estuary (France). Geomorphology 2012, 169–170, 86–97. [Google Scholar] [CrossRef]
  49. Etcheber, H.; Schmidt, S.; Sottolichio, A.; Maneux, E.; Chabaux, G.; Escalier, J.M.; Wennekes, H.; Derriennic, H.; Schmeltz, M.; Quemener, L.; et al. Monitoring Water Quality in Estuarine Environments: Lessons from the MAGEST Monitoring Program in the Gironde Fluvial-Estuarine System. Hydrol. Earth Syst. Sci. 2011, 15, 831–840. [Google Scholar] [CrossRef]
  50. Virolle, M.; Brigaud, B.; Luby, S.; Portier, E.; Féniès, H.; Bourillot, R.; Patrier, P.; Beaufort, D. Influence of Sedimentation and Detrital Clay Grain Coats on Chloritized Sandstone Reservoir Qualities: Insights from Comparisons between Ancient Tidal Heterolithic Sandstones and a Modern Estuarine System. Mar. Pet. Geol. 2019, 107, 163–184. [Google Scholar] [CrossRef]
  51. Virolle, M.; Féniès, H.; Brigaud, B.; Bourillot, R.; Portier, E.; Patrier, P.; Beaufort, D.; Jalon-Rojas, I.; Derriennic, H.; Miska, S. Facies Associations, Detrital Clay Grain Coats and Mineralogical Characterization of the Gironde Estuary Tidal Bars: A Modern Analogue for Deeply Buried Estuarine Sandstone Reservoirs. Mar. Pet. Geol. 2020, 114, 104225. [Google Scholar] [CrossRef]
  52. Charlaftis, D.; Jones, S.J.; Dobson, K.J.; Crouch, J.; Acikalin, S. Experimental Study of Chlorite Authigenesis and Influence on Porosity Maintenance in Sandstones. J. Sediment. Res. 2021, 91, 197–212. [Google Scholar] [CrossRef]
  53. Salisu, A.M.; Alhindi, H.; Hussaini, S.R.; Amao, A.O.; Al-Awah, H.; Al-ramadan, K.; Koeshidayatullah, A. 3D Microporosity Characterizations in the Heterogeneous Middle Jurassic Tuwaiq Mountain Formation: Insights into an Unconventional Sweet Spot. ACS Omega 2024, 9, 36273–36290. [Google Scholar] [CrossRef]
  54. Alqubalee, A.; Salisu, A.M.; Bello, A.M.; Al-Hussaini, A.; Al-Ramadan, K. Characteristics, Distribution, and Origin of Ferruginous Deposits within the Late Ordovician Glaciogenic Setting of Arabia. Sci. Rep. 2023, 13, 18430. [Google Scholar] [CrossRef]
  55. Moore, D.M.; Reynolds, R.C. X-Ray Diffraction and the Identification and Analysis of Clay Minerals. Geol. Mag. 1998, 135, 819–842. [Google Scholar] [CrossRef]
  56. Al-Ramadan, K. Illitization of Smectite in Sandstones: The Permian Unayzah Reservoir, Saudi Arabia. Arab. J. Sci. Eng. 2014, 39, 407–412. [Google Scholar] [CrossRef]
  57. Berger, G.; Lacharpagne, J.-C.; Velde, B.; Beaufort, D.; Lanson, B. Kinetic Constraints on Illitization Reactions and the Effects of Organic Diagenesis in Sandstone/Shale Sequences. Appl. Geochem. 1997, 12, 23–35. [Google Scholar] [CrossRef]
  58. Bello, A.M.; Usman, M.B.; Abubakar, U.; Al-Ramadan, K.; Babalola, L.O.; Amao, A.O.; Sarki Yandoka, B.M.; Kachalla, A.; Kwami, I.A.; Ismail, M.A.; et al. Role of Diagenetic Alterations on Porosity Evolution in the Cretaceous (Albian-Aptian) Bima Sandstone, a Case Study from the Northern Benue Trough, NE Nigeria. Mar. Pet. Geol. 2022, 145, 105851. [Google Scholar] [CrossRef]
  59. Taylor, T.R.; Lander, R.H.; Bonnell, L.M. Sandstone Petrography, Petrology, and Modeling; SEPM Society for Sedimentary Geology: Tulsa, OK, USA, 2022. [Google Scholar]
  60. Bentabol, M.; Lamarca-Irisarri, D.; Van Driessche, A.E.S.; Ryan, P.C.; Huertas, F.J. Illitization of Montmorillonite in Ammonium Solutions under Hydrothermal Conditions. Appl. Clay Sci. 2024, 258, 107478. [Google Scholar] [CrossRef]
  61. Mosser-Ruck, R.; Pironon, J.; Cathelineau, M.; Trouiller, A. Experimental Illitization of Smectite in a K-Rich Solution. Eur. J. Mineral. 2001, 13, 829–840. [Google Scholar] [CrossRef]
  62. Drief, A.; Martinez-Ruiz, F.; Nieto, F.; Velilla Sanchez, N. Transmission Electron Microscopy Evidence for Experimental Illitization of Smectite in K-Enriched Seawater Solution at 50 °C and Basic PH. Clays Clay Miner. 2002, 50, 746–756. [Google Scholar] [CrossRef]
  63. Mosser-Ruck, R.; Cathelineau, M. Experimental Transformation of Na,Ca-Smectite under Basic Conditions at 150 °C. Appl. Clay Sci. 2004, 26, 259–273. [Google Scholar] [CrossRef]
  64. Ferrage, E.; Vidal, O.; Mosser-Ruck, R.; Cathelineau, M.; Cuadros, J. A Reinvestigation of Smectite Illitization in Experimental Hydrothermal Conditions: Results from X-ray Diffraction and Transmission Electron Microscopy. Am. Mineral. 2011, 96, 207–223. [Google Scholar] [CrossRef]
  65. Mills, M.M.; Sanchez, A.C.; Boisvert, L.; Payne, C.B.; Ho, T.A.; Wang, Y. Understanding Smectite to Illite Transformation at Elevated (>100 °C) Temperature: Effects of Liquid/Solid Ratio, Interlayer Cation, Solution Chemistry and Reaction Time. Chem. Geol. 2023, 615, 121214. [Google Scholar] [CrossRef]
  66. Small, J.S. Fluid Composition, Mineralogy and Morphological Changes Associated with the Smectite-to-Illite Reaction: An Experimental Investigation of the Effect of Organic Acid Anions. Clay Miner. Miner. 1994, 29, 539–554. [Google Scholar] [CrossRef]
  67. Du, J.; Cai, J.; Chao, Q.; Song, M.; Wang, X. Variations and Geological Significance of Solid Acidity during Smectite Illitization. Appl. Clay Sci. 2021, 204, 106035. [Google Scholar] [CrossRef]
  68. Guillaume, D.; Neaman, A.; Cathelineau, M.; Mosser-Ruck, R.; Peiffert, C.; Abdelmoula, M.; Dubessy, J.; Villiéras, F.; Michau, N. Experimental Study of the Transformation of Smectite at 80 and 300 °C in the Presence of Fe Oxides. Clay Miner. Miner. 2004, 39, 17–34. [Google Scholar] [CrossRef]
  69. Johnston, R.M.; Miller, H.G. The Effect of PH on the Stability of Smectite; Atomic Energy of Canada Ltd.: Chalk River, ON, Canada, 1984. [Google Scholar]
  70. Huang, W.L.; Bishop, A.M.; Brown, R.W. The Effect of Fluid/Rock Ratio on Feldspar Dissolution and Illite Formation under Reservoir Conditions. Clay Miner. Miner. 1986, 21, 585–601. [Google Scholar] [CrossRef]
  71. Ulmer-Scholle, D.S.; Scholle, P.A.; Schieber, J.; Raine, R.J. A Color Guide to the Petrography of Sandstones, Siltstones, Shales and Associated Rocks; American Association of Petroleum Geologists: Tulsa, OK, USA, 2015. [Google Scholar]
  72. Altaner, S.P.; Ylagan, R.F. Comparison of Structural Models of Mixed-Layer Illite/Smectite and Reaction Mechanisms of Smectite Illitization. Clays Clay Miner. 1997, 45, 517–533. [Google Scholar] [CrossRef]
  73. Nadeau, P.H.; Wilson, J.; McHardy, W.J.; Tait, J.M. The Conversion of Smectite to Illite during Diagenesis: Evidence from Some Illitic Clays from Bentonites and Sandstones. Miner. Mag. 1985, 49, 393–400. [Google Scholar] [CrossRef]
  74. Lanson, B.; Sakharov, B.; Claret, F.; Drits, V. Diagenetic Smectite-to-Illite Transition in Clay-Rich Sediments: A Reappraisal of X-Ray Diffraction Results Using the Multi-Specimen Method. Am. J. Sci. 2009, 309, 476–516. [Google Scholar] [CrossRef]
  75. Bell, T.E. Microstructure in Mixed-Layer Illite/Smectite and Its Relationship to the Reaction of Smectite to Illite. Clays Clay Miner. 1986, 34, 146–154. [Google Scholar] [CrossRef]
  76. Roberson, H.E.; Lahann, R.W. Smectite to Illite Conversion Rates: Effects of Solution Chemistry. Clays Clay Miner. 1981, 29, 129–135. [Google Scholar] [CrossRef]
  77. Putnis, A. Mineral Replacement Reactions. Rev. Miner. Geochem. 2009, 70, 87–124. [Google Scholar] [CrossRef]
  78. Whitney, G.; Northrop, H.R. Experimental Investigation of the Smectite to Illite Reaction; Dual Reaction Mechanisms and Oxygen-Isotope Systematics. Am. Mineral. 1988, 73, 77–90. [Google Scholar]
  79. Inoue, A.; KOHYAMA, N.; KITAGAWA, R.; WATANABE, T. Chemical and Morphological Evidence for the Conversion of Smectite to Illite. Clays Clay Miner. 1987, 35, 111–120. [Google Scholar] [CrossRef]
  80. Inoue, A.; Lanson, B.; Fernandes, M.; Sakharov, B.; Murakami, T.; Meunier, A.; Beaufort, D. Illite-Smectite Mixed-Layer Minerals in Hydrothermal Alteration of Volcanic Rocks: I. One-Dimensional XRD Structure Analysis and Characterisation of Component Layers. Clays Clay Miner. 2005, 53, 423–439. [Google Scholar] [CrossRef]
  81. Ylagan, R.F.; Altaner, S.P.; Pozzuoli, A. Reaction Mechanisms of Smectite Illitization Associated with Hydrothermal Alteration from Ponza Island, Italy. Clays Clay Miner. 2000, 48, 610–631. [Google Scholar] [CrossRef]
  82. Środoń, J. Nature of Mixed-Layer Clays and Mechanisms of Their Formation and Alteration. Annu. Rev. Earth Planet. Sci. 1999, 27, 19–53. [Google Scholar] [CrossRef]
  83. Mosser-Ruck, R.; Pignatelli, I.; Bourdelle, F.; Abdelmoula, M.; Barres, O.; Guillaume, D.; Charpentier, D.; Rousset, D.; Cathelineau, M.; Michau, N. Contribution of Long-Term Hydrothermal Experiments for Understanding the Smectite-to-Chlorite Conversion in Geological Environments. Contrib. Mineral. Petrol. 2016, 171, 97. [Google Scholar] [CrossRef]
  84. Robinson, D.; Schmidt, S.T.; De Zamora, A.S. Reaction Pathways and Reaction Progress for the Smectite-to-chlorite Transformation: Evidence from Hydrothermally Altered Metabasites. J. Metamorph. Geol. 2002, 20, 167–174. [Google Scholar] [CrossRef]
  85. Keith, T.E.C.; Bargar, K.E. Petrology and Hydrothermal Mineralogy of US Geological Survey Newberry: 2. Drill Core from Newberry Caldera, Oregon. J. Geophys. Res. Solid. Earth 1988, 93, 10174–10190. [Google Scholar] [CrossRef]
  86. Li, K.; Xi, K.; Cao, Y.; Niu, X.; Wu, S.; Feng, S.; You, Y. Chlorite Authigenesis and Its Impact on Reservoir Quality in Tight Sandstone Reservoirs of the Triassic Yanchang Formation, Southwestern Ordos Basin, China. J. Pet. Sci. Eng. 2021, 205, 108843. [Google Scholar] [CrossRef]
  87. Millot, G. Geology of Clays: Weathering Sedimentology·Geochemistry; Springer Science & Business Media: Berlin, Germany, 2013; ISBN 3662416093. [Google Scholar]
  88. Chamley, H. Clay Sedimentology; Springer Science & Business Media: Berlin, Germany, 2013; ISBN 364285916X. [Google Scholar]
  89. Velde, B.B.; Meunier, A. The Origin of Clay Minerals in Soils and Weathered Rocks; Springer Science & Business Media: Berlin, Germany, 2008; ISBN 3540756345. [Google Scholar]
  90. Iijima, A. Zeolites in Petroleum and Natural Gas Reservoirs. Rev. Miner. Geochem. 2001, 45, 347–402. [Google Scholar]
  91. Lin, T.; Wang, W.; Ma, Q.; Kang, J.; Yang, R.; Liu, X. Formation Mechanism and Implication of Analcime in the Sandstone Reservoirs of the Permian Jingjingzigou Formation in the Jinan Sag, Southern Junggar Basin, NW China. Front. Earth Sci. 2024, 12, 1416594. [Google Scholar] [CrossRef]
  92. Yao, G.; Li, L.; Cai, M.; Liu, Y. Mechanisms of Salinization in a Middle Eocene Lake in the Tanggu Area of the Huanghua Depression. Mar. Pet. Geol. 2017, 86, 155–167. [Google Scholar] [CrossRef]
  93. Niegel, S.; Franz, M. Depositional and Diagenetic Controls on Porosity Evolution in Sandstone Reservoirs of the Stuttgart Formation (North German Basin). Mar. Pet. Geol. 2023, 151, 106157. [Google Scholar] [CrossRef]
  94. Zhu, S.; Cui, H.; Jia, Y.; Zhu, X.; Tong, H.; Ma, L. Occurrence, Composition, and Origin of Analcime in Sedimentary Rocks of Non-Marine Petroliferous Basins in China. Mar. Pet. Geol. 2020, 113, 104164. [Google Scholar] [CrossRef]
  95. Iijima, A. Effect of Pore Water to Clinoptilolite-Analcimealbite Reaction Series. J. Fac. Sci. Univ. Tokyo Sec. II 1975, 19, 133–147. [Google Scholar]
  96. Mallette, A.J.; Espindola, G.; Varghese, N.; Rimer, J.D. Highly Efficient Synthesis of Zeolite Chabazite Using Cooperative Hydration-Mismatched Inorganic Structure-Directing Agents. Chem. Sci. 2024, 15, 573–583. [Google Scholar] [CrossRef]
  97. Chipera, S.J.; Apps, J.A. Geochemical Stability of Natural Zeolites. Rev. Miner. Geochem. 2001, 45, 117–161. [Google Scholar] [CrossRef]
  98. Boles, J.R.; Franks, S.G. Clay diagenesis in Wilcox sandstones of Southwest Texas: Implications of smectite diagenesis on sandstone cementation. J. Sediment. Res. 1979, 49, 55–70. [Google Scholar]
Figure 1. (A) Simplified facies map of the Gironde estuary catchment (modified after [31]), with the red square indicating the location of the samples analyzed in this study. The inset map provides a country-level view of the study area, with the red rectangle marking the approximate position of the estuary. (B) Google Earth aerial image showing the sample collection area (red square). (C) Field photograph depicting the muddy estuarine sediments utilized in this study.
Minerals 15 00317 g001
Figure 2. Photograph of the experimental setup employed in this study, highlighting the key components of the hydrothermal reactors.
Minerals 15 00317 g002
Figure 3. A 2D stacked column plot of XRF analysis illustrating the normalized concentration and distribution of major oxides in the sediments before and after the hydrothermal experiments. Note the relative abundance and evolution of CaO, MgO, Fe2O3, and K2O across the different experiments.
Minerals 15 00317 g003
Figure 4. A stacked plot of the bulk XRD analysis presenting the diffractograms of the major minerals identified in the starting material (SM) and selected experiments conducted using seawater (SW), estuarine water (EW), Mg-rich synthetic fluids (Mg), K-rich synthetic fluids (KCl), and Na-rich synthetic fluids (Na). Notably, a broad analcime peak is observed in Na_250 (Exp. 12), while it is absent in all other experiments.
Minerals 15 00317 g004
Figure 5. SEM and EDS images illustrating detrital framework grains and clay coatings. (A) SEM image showing detrital quartz (Qtz), K-feldspar (KF), and calcite, with clay drapes (CDs) coating the K-feldspar. (B) SEM image highlighting detrital albite (Ab), muscovite (Musc), and clay aggregates (CAs) coating a quartz grain. (C) SEM image and (D) corresponding EDS spectra depicting a diatom embedded within detrital clay coats, with the red square in (C) marking the point of the EDS analysis shown in (D). (E) High-resolution SEM image of a detrital clay drape (CD), with the red square indicating the point of the EDS analysis displayed in (F). (F) EDS spectra of the clay drape in (E) revealing the presence of kaolinite, smectite, and illite.
Minerals 15 00317 g005
Figure 6. XRD patterns of the oriented clay fraction (<2 µm) from the starting material and selected experiments. (A) Overlaid diffractograms of the starting material reveal the presence of smectite, illite, and kaolinite as the primary detrital clays in the sediments. (B) Diffractograms of air-dried, ethylene glycol-solvated, and heated clay fractions from Exp. 5 show the presence of smectite, kaolinite, and illite. Notably, the kaolinite peaks exhibit a decrease in intensity, and the primary smectite peak shifts from 14.90 Å in the air-dried pattern to 16.99 Å following ethylene glycol solvation. (C) Air-dried, ethylene glycol-solvated, and heated diffractograms from Exp. 6 reveal the presence of illite and kaolinite. Smectite peaks are absent, kaolinite peaks are significantly weakened, and an increase in the intensity of the illite peak is observed, alongside the appearance of sylvite. (D,E) Overlaid diffractograms from Experiments 10 and 11 indicate the authigenic formation of chlorite along with the presence of illite and kaolinite. (F) Diffractograms from Exp. 12 confirm the presence of illite, smectite, and kaolinite.
Minerals 15 00317 g006
Figure 7. SEM and SEM-EDS images illustrating the diagenetic features in seawater-based experiments (1–5). (A) SEM image depicting the onset of clay disaggregation and dissolution in Exp. 2. (B) SEM image showing the authigenic formation of honeycomb smectite (Sme) adjacent to kaolinite (Kaol) in Exp. 3. (C) SEM image highlighting the formation of mixed-layer illite/smectite (I/S) with initial crenulated to honeycomb morphologies in Exp. 4. (D) SEM image showing the formation of illite adjacent to mixed-layer I/S in Exp. 5, where the illite retains the honeycomb morphology of smectite. (E) Fully developed illite with honeycomb morphology and spiny terminations. (F) EDS spectra confirming the presence of illite. The location of the EDS point is shown in (E) (red square).
Minerals 15 00317 g007
Figure 8. Diagenetic features of post-experiment clay minerals from STEM and STEM-EDS analyses. (A) STEM image showing hexagonal kaolinite aggregates during Exp. 3. The red square indicates the location of EDS analysis shown in (B). (B) EDS spectra confirming the presence of kaolinite. (C) STEM image illustrating the polycrystalline nature of clays in Exp. 5, where illite developed adjacent to illite/smectite (I/S), smectite, and pseudohexagonal kaolinite. (D) Elemental analysis (EDS) highlighting authigenic illite. The location of the EDS point is shown in (C) (red square). (E) STEM image showing authigenic chlorite and mixed-layer chlorite/smectite (C/S) in Exp. 11. (F) Close-up view of an elongated chlorite crystal in Exp. 11.
Minerals 15 00317 g008
Figure 9. Diagenetic features observed in Exp. 6. (A) SEM image showing kaolinite dissolution (KD). (B) SEM image revealing the occurrence of illite with a rugged honeycomb morphology, alongside mixed-layer illite/smectite (I/S) and newly formed sylvite. (C) Newly formed illite. The illite displayed lath-like to radial flakes morphology. The red square marks the EDS point shown in (D). (D) EDS spectra of the observed illite.
Minerals 15 00317 g009
Figure 10. Clustered histogram displaying the concentrations of Al, Ca, Fe, Mg, Na, and K in pre-experiment solutions and their subsequent evolution post-experiments.
Minerals 15 00317 g010
Figure 11. Main diagenetic features observed in Experiments 7–10 (conducted using Mg-rich synthetic fluid). (A) SEM image illustrating the onset of detrital clay aggregate dissolution in Exp. 7. (B) SEM image showing the initial transformation of smectite in Exp. 8. (C) SEM image highlighting the formation of mixed-layer chlorite/smectite (C/S) with rugged honeycomb morphology adjacent to kaolinite (Kaol). (D) SEM image depicting the formation of microcrystalline quartz (Crs) crystal aggregates alongside transforming chlorite/smectite (C/S). (E) SEM image showing the development of chlorite with mixed honeycomb-to-rosette morphology. The red square marks the location of the EDS spectra shown in (F). (F) EDS spectra indicating the Mg-rich nature of the newly formed chlorite.
Minerals 15 00317 g011
Figure 12. Diagenetic features observed in the estuarine water experiment (Exp. 11). (A) SEM showing acicular crystals of neoformed Fe-oxides (Fe-O). (B) SEM image illustrating the initial transformation of kaolinite (Kaol). (C) SEM image depicting the formation of microcrystalline quartz (mQ) near transforming chlorite/smectite (C/S), which exhibits honeycomb to web-like morphologies. (D,E) SEM images showing the formation of chlorite with rosette morphology. (F) EDS spectra indicating that the chlorite formed in this experiment is Fe-rich. The location of the EDS analysis is marked by the red square in (E).
Minerals 15 00317 g012
Figure 13. Main diagenetic features in Exp. 12 (conducted with Na-rich synthetic fluid). (A) SEM image showing the onset of detrital clay disaggregation (DCA). (B) SEM image showing detrital clay dissolution (DC). (C) SEM image highlighting the formation of cubic halite crystals. (D,E) SEM images depicting the development of massive aggregates (D) and acicular-to-botryoidal (E) authigenic analcime. (F) EDS spectra of the newly formed analcime, indicating its high Na content. The red square in (E) marks the location of the EDS analysis.
Minerals 15 00317 g013
Figure 14. FIB-SEM and EDS images illustrating the internal structure of clay minerals and their relationships with detrital framework grains. (A) FIB-SEM image showing microporous pore-filling clay minerals (PFC) cementing detrital quartz (Qz), K-feldspar (KF), and albite (Ab) in Exp. 3. (B) EDS map of (A). (C) SEM image showing less microporous pore-filling clays (PFCs) cementing quartz (Qtz) and K-feldspar (KF) in Exp. 5. Quartz overgrowths (Qos) are observed at the edges of detrital quartz. (D) EDS spectra of the quartz overgrowth, indicating Si and O as the main constituents. The red square in (C) marks the EDS analysis location. (E) FIB-SEM image showing grain-coating chlorite (GCC) on detrital grains in Exp. 11. (F) EDS spectra of the GCC, showing its Fe-rich content. The red square in (E) marks the EDS analysis location.
Minerals 15 00317 g014
Table 1. Conditions for the hydrothermal experiments.
ExperimentSample IDSolutionsTemperature (°C)Duration (Days)Final Pressure (Bar)
1SW@50Red Sea water 501446.7
2SW@100Red Sea water 1001452.7
3SW@150Red Sea water 1501465.1
4SW@200Red Sea water 2001491.2
5SW@250Red Sea water 25014116.3
6SF1@2500.1 M KCl in Red Sea Water25014117.6
7SF2@1000.1 M NaCl, KCl, CaCl2·2H2O, MgCl2·6H2O1001456.1
8SF2@1500.1 M NaCl, KCl, CaCl2·2H2O, MgCl2·6H2O1501467.5
9SF2@2000.1 M NaCl, KCl, CaCl2·2H2O, MgCl2·6H2O2001479.8
10SF2@2500.1 M NaCl, KCl, CaCl2·2H2O, MgCl2·6H2O25014108.3
11EW@250Estuarine water25014112.5
12SF3@2500.1 M Na2CO325014128.7
SW = seawater; SF = synthetic fluid; EW = estuarine water.
Table 2. WDX-XRF analysis of the starting material and post-reacted samples.
Oxides Measured in Weight Percent (wt %)
ExperimentSample IDSiO2Al2O3CaOFe2O3MgONa2OK2OClO2MnOP2O5SO3SrOTiO2
SMSM@0 57.4317.439.877.382.120.793.070.090.150.180.140.021.01
Exp. 1SW@5052.8617.558.627.482.323.373.242.640.090.180.510.020.94
Exp. 2SW@10056.4318.048.437.663.181.213.460.090.130.210.060.021.04
Exp. 3SW@15054.5918.365.908.493.232.343.351.620.120.200.540.020.97
Exp. 4SW@20057.3015.473.598.684.932.362.731.510.110.161.880.020.90
Exp. 5SW@25052.7716.942.2210.674.782.016.182.260.100.190.710.020.93
Exp. 6SF1@25054.5916.126.297.192.030.739.142.390.120.180.040.010.98
Exp. 7SF2@10055.0817.159.157.942.640.983.721.660.090.170.110.020.94
Exp. 8SF2@15058.0016.344.049.095.250.783.441.330.080.190.060.010.99
Exp. 9SF2@20055.8516.623.399.795.840.863.792.190.090.190.060.010.96
Exp. 10SF2@25058.2418.081.399.585.061.943.160.770.090.220.160.011.06
Exp. 11EW@25057.0616.593.268.237.620.603.591.330.120.190.050.011.35
Exp. 12SF3@25053.9717.269.367.302.145.462.880.090.140.190.040.020.95
SM = Starting material; SW = seawater; SF = synthetic fluid; EW = estuarine water.
Table 3. Bulk and clay fraction composition in pre-and post-reacted samples.
Sample IDBulk Mineralogy (%)Clay Mineralogy (<2 µm) (%)
QtzOrthPlaCalMusCMHalSylAnaTotalKaoSmeIllChl.Qtz
SM40.75.314.79.79.320.3---100.052541-2
Exp. 141.08.117.35.17.620.9---100.050540-5
Exp. 239.37.715.23.76.927.2---100.048642-4
Exp. 338.57.614.93.16.329.6---100.041749-3
Exp. 435.44.816.51.85.134.71.7--100.033358-6
Exp. 538.92.415.61.23.538.4---100.018276-4
Exp. 629.46.314.55.83.337.1-3.6-100.020TR80-0
Exp. 738.29.118.73.08.122.9---100.044248-6
Exp. 836.97.414.93.97.229.7---100.04015243
Exp. 937.64.015.50.53.538.9---100.03405583
Exp. 1035.23.89.70.33.346.7---100.026052166
Exp. 1135.13.514.41.95.836.9---100.025148243
Exp. 1231.25.312.19.15.213.12.4-21.7100.0164041-3
SM = starting material; Qtz = quartz; Orth = orthoclase; Pla = plagioclase; Cal = calcite; Mus = muscovite; CM = clay minerals; Hal = halite; Syl = sylvite; Ana = analcime; Kao = kaolinite; Sme = smectite; Ill = illite; Chl = chlorite.
Table 4. ICP-OES analysis showing the concentrations of major cations in solutions before and after the hydrothermal experiments.
IdentificationpHMajor Cations (mg/L)TDS (ppt)
AlCaFeMgNaK
SWSW@08.1257.7396638182018,65079836.71
Exp. 1SW@507.214207730770174015,680646056.19
Exp. 2SW@1006.8854214,2601080140014,900710056.73
Exp. 3SW@1506.4264822,500169093912,060606058.01
Exp. 4SW@2006.4178244,80023106315950247058.94
Exp. 5SW@2506.34108067,000235043155102000105.2
SF1SF1@07.7870.1410650169016,43017,20043.95
Exp. 6SF1@2506.8647758,00091981896009060104.5
SF2SF2@05.71ND8730ND15,50012,800765045.33
Exp. 7SF2@1006.2247.821,40013.7369012,500928056.15
Exp. 8SF2@1506.4512629,90016.6352010,61010,30062.08
Exp. 9SF2@2006.2852042,50060.16006820299060.69
Exp. 10SF2@2506.2278748,4001321672590262062.29
EWEW@07.265.212.111238110,60070.513.02
Exp. 11EW@2506.9112014,2005.11208700125026.39
SF3SF3@011.32NDNDNDND8250ND13.79
Exp. 12SF3@2508.318602910182038.439011407.79
TDS = total dissolved solids; SW = seawater; SF = synthetic fluid; EW = estuarine water.
Disclaimer/Publisher’s Note: The statements, opinions and data contained in all publications are solely those of the individual author(s) and contributor(s) and not of MDPI and/or the editor(s). MDPI and/or the editor(s) disclaim responsibility for any injury to people or property resulting from any ideas, methods, instructions or products referred to in the content.

