
Evolution of Permian Sedimentary Environment in South China: Constraints on Heterogeneous Accumulation of Organic Matter in Black Shales

Abstract
1. Introduction
2. Geological Setting and Section Description
3. Sample and Methods
3.1. Sampling
3.2. TOC Analysis
3.3. Elemental Analysis
3.4. Data Processing
4. Results
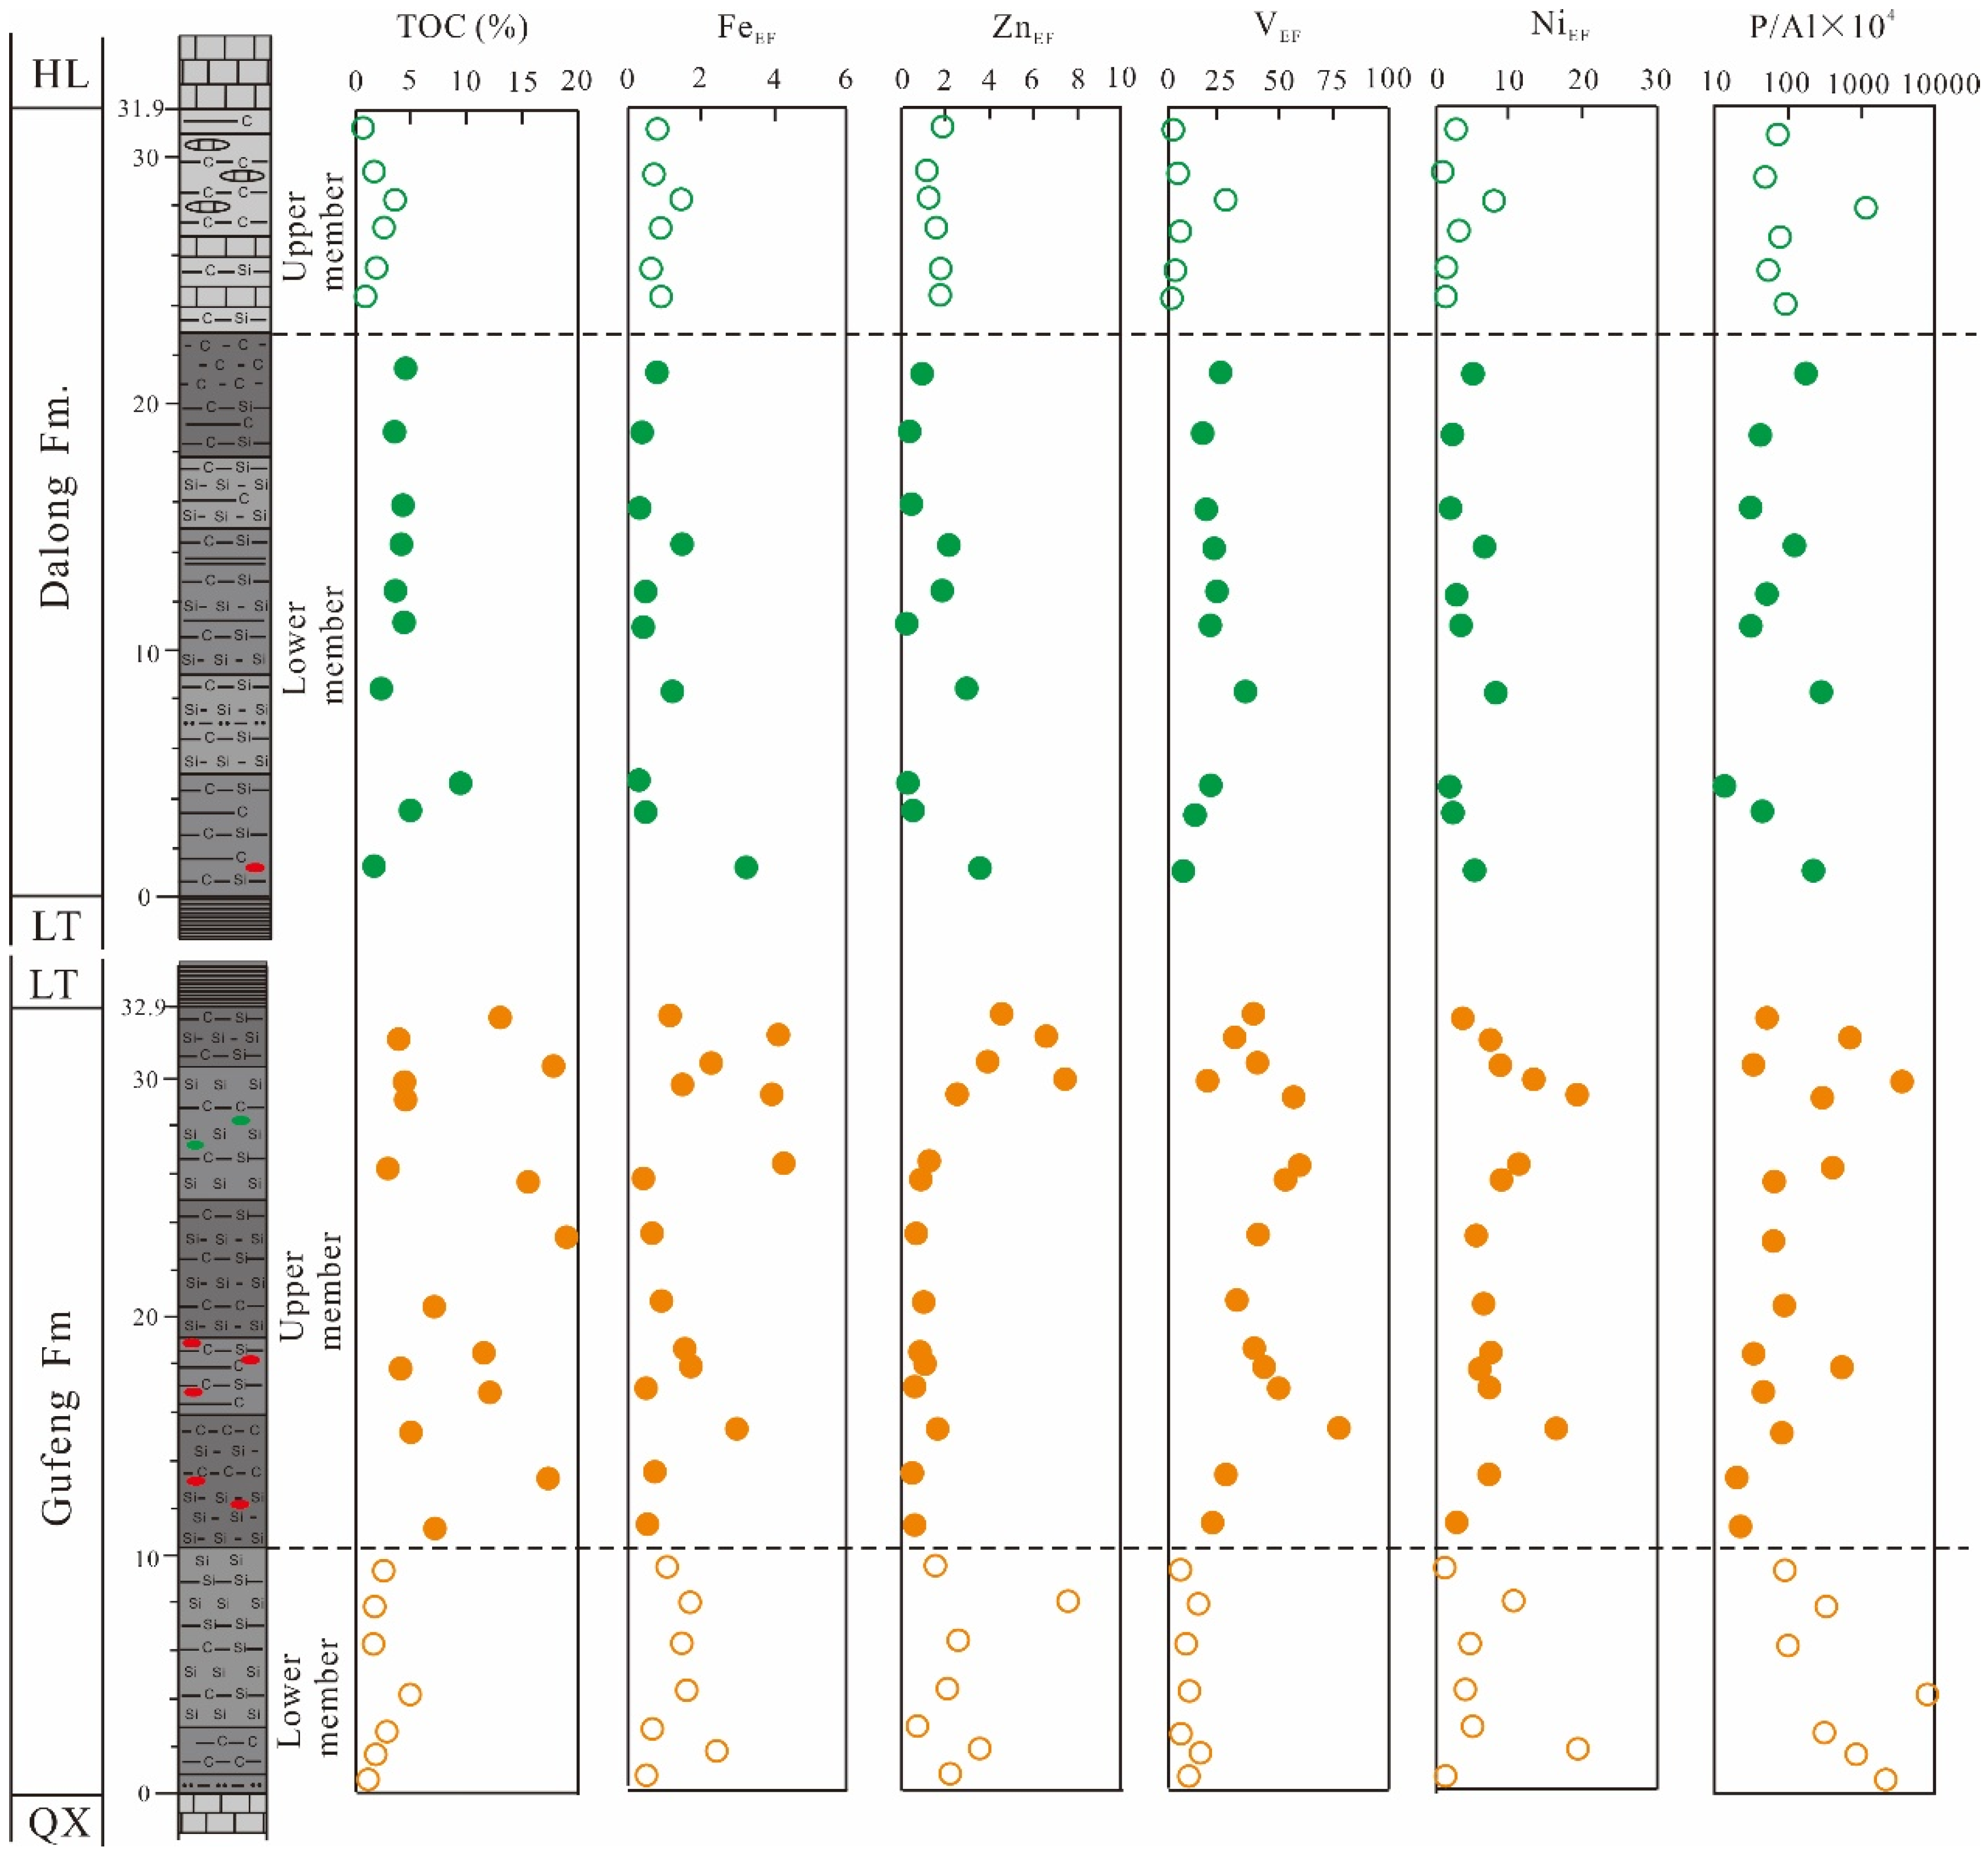
4.1. TOC
4.2. Elemental Compositions
5. Discussion
5.1. Sedimentary Rate
5.2. Paleoclimate
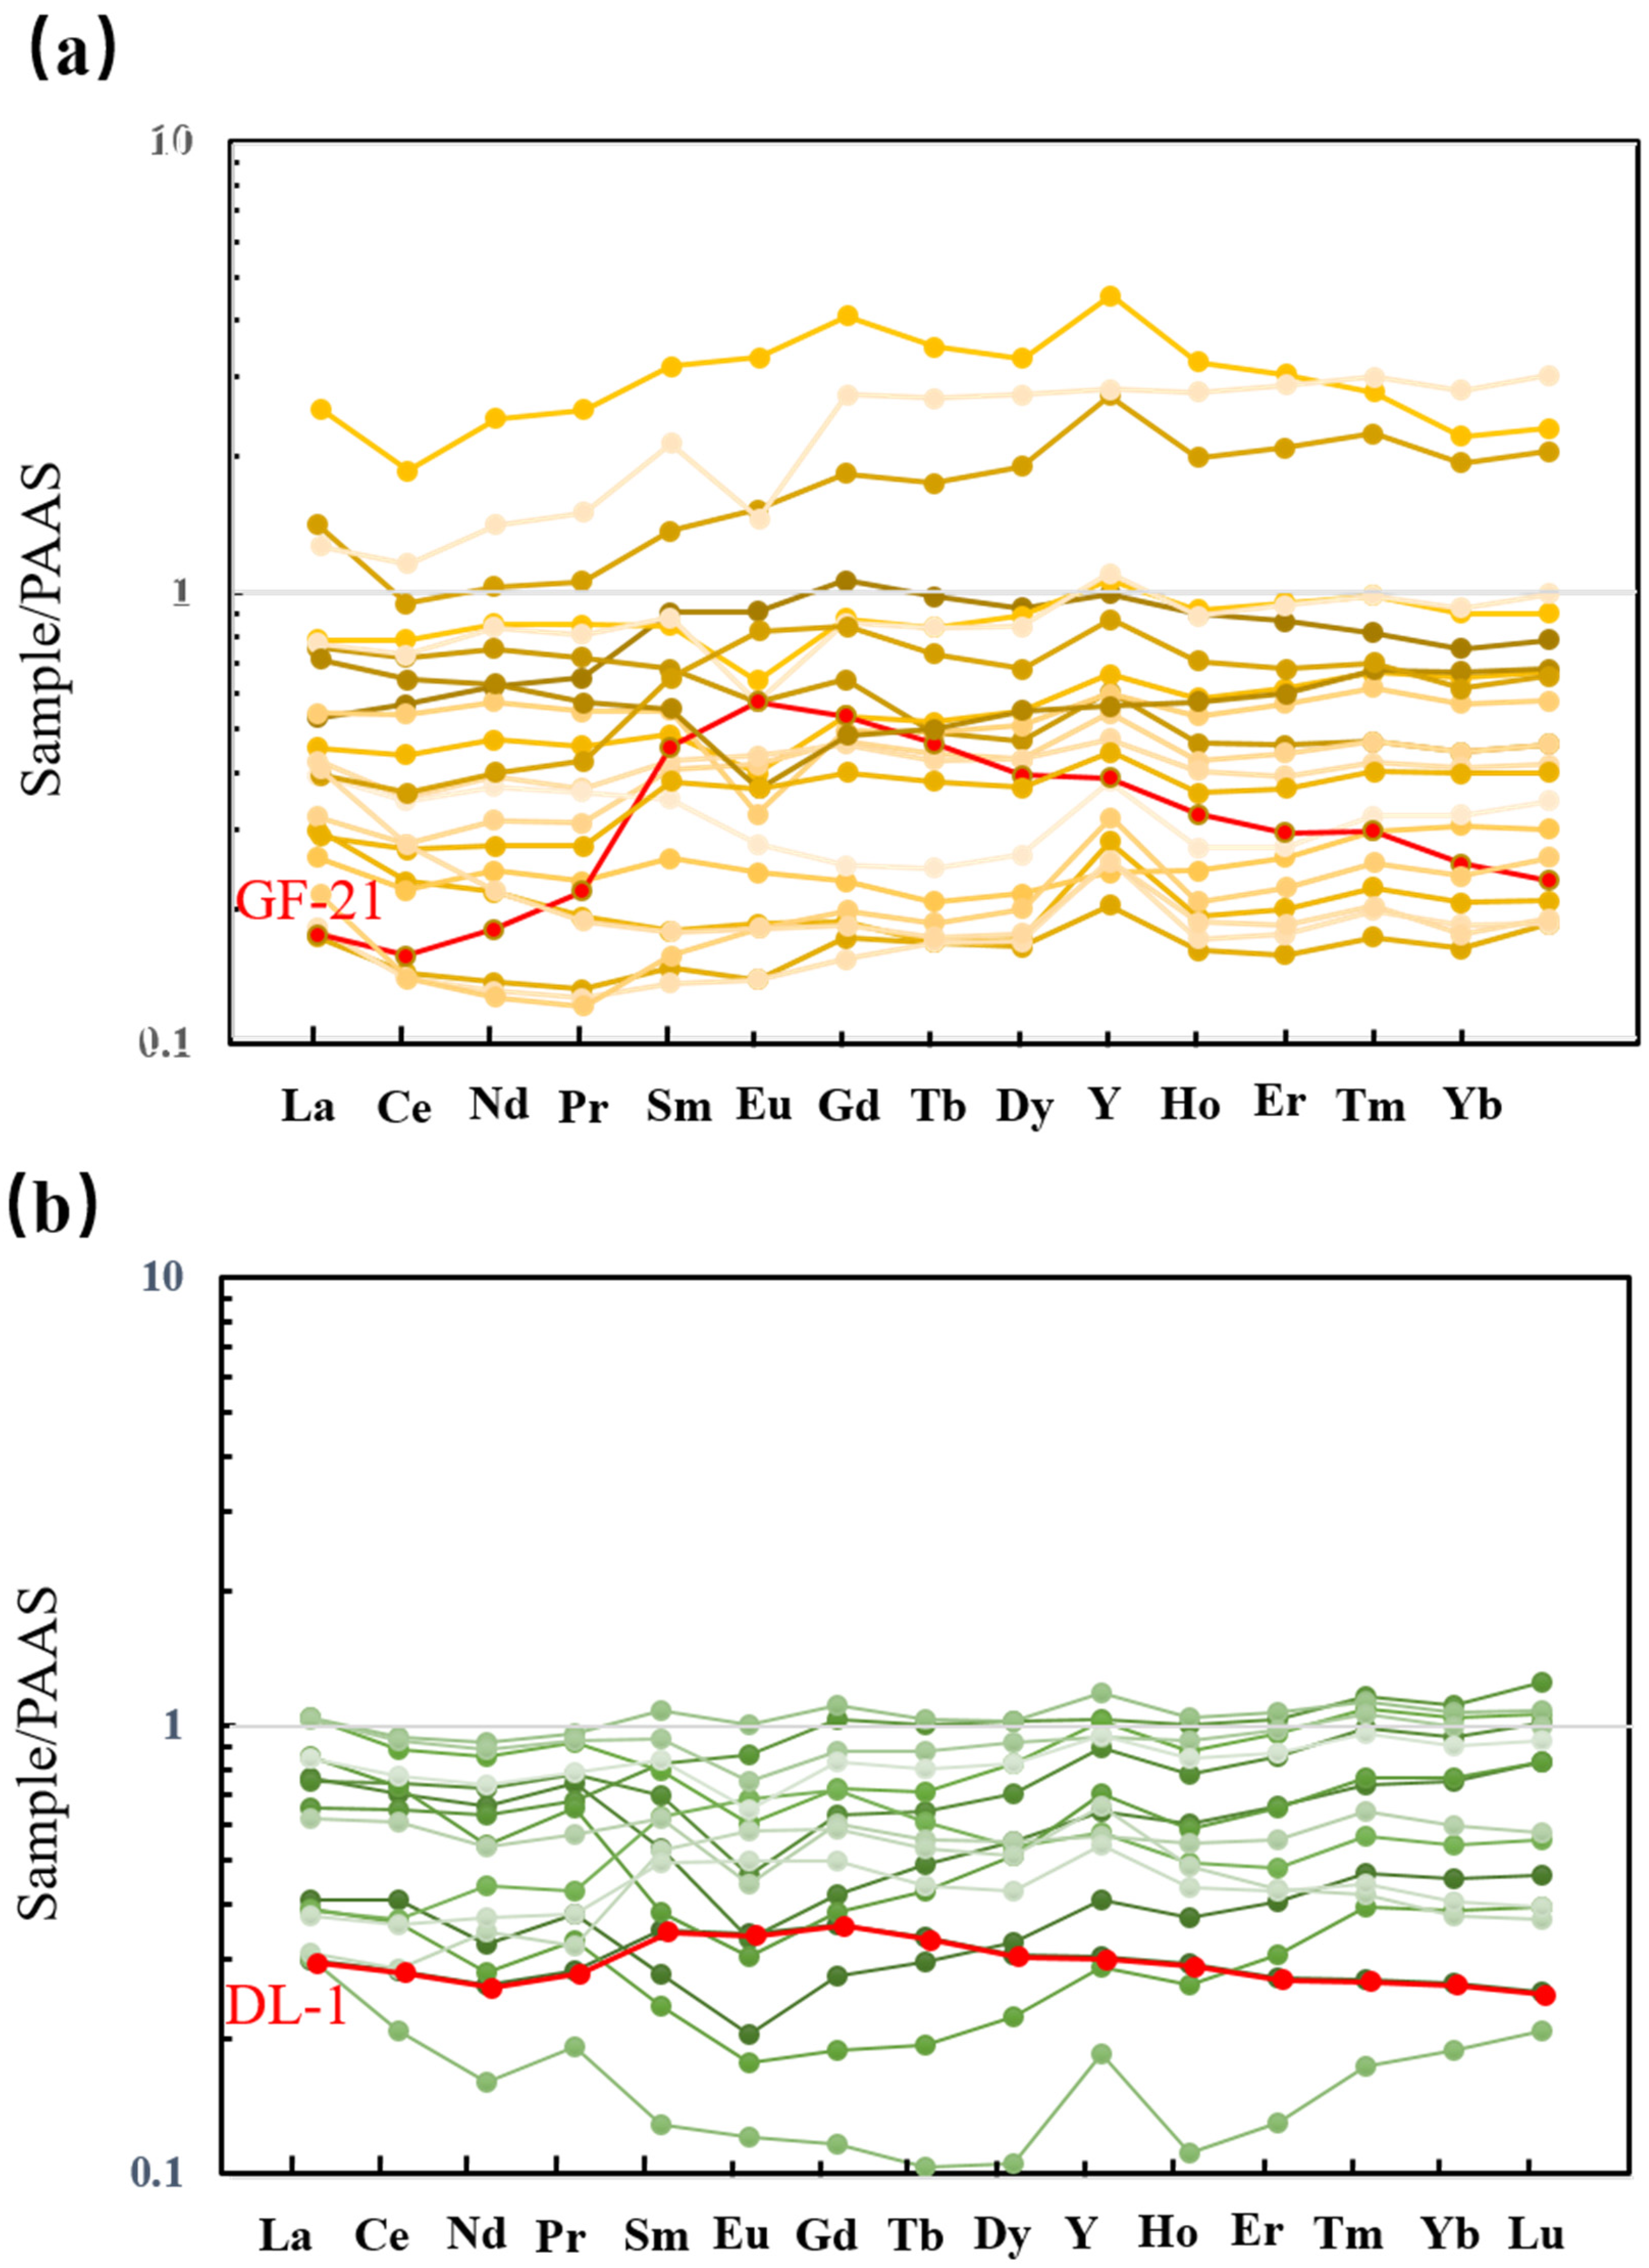
5.3. Hydrothermal Activity
5.4. Paleoproductivity
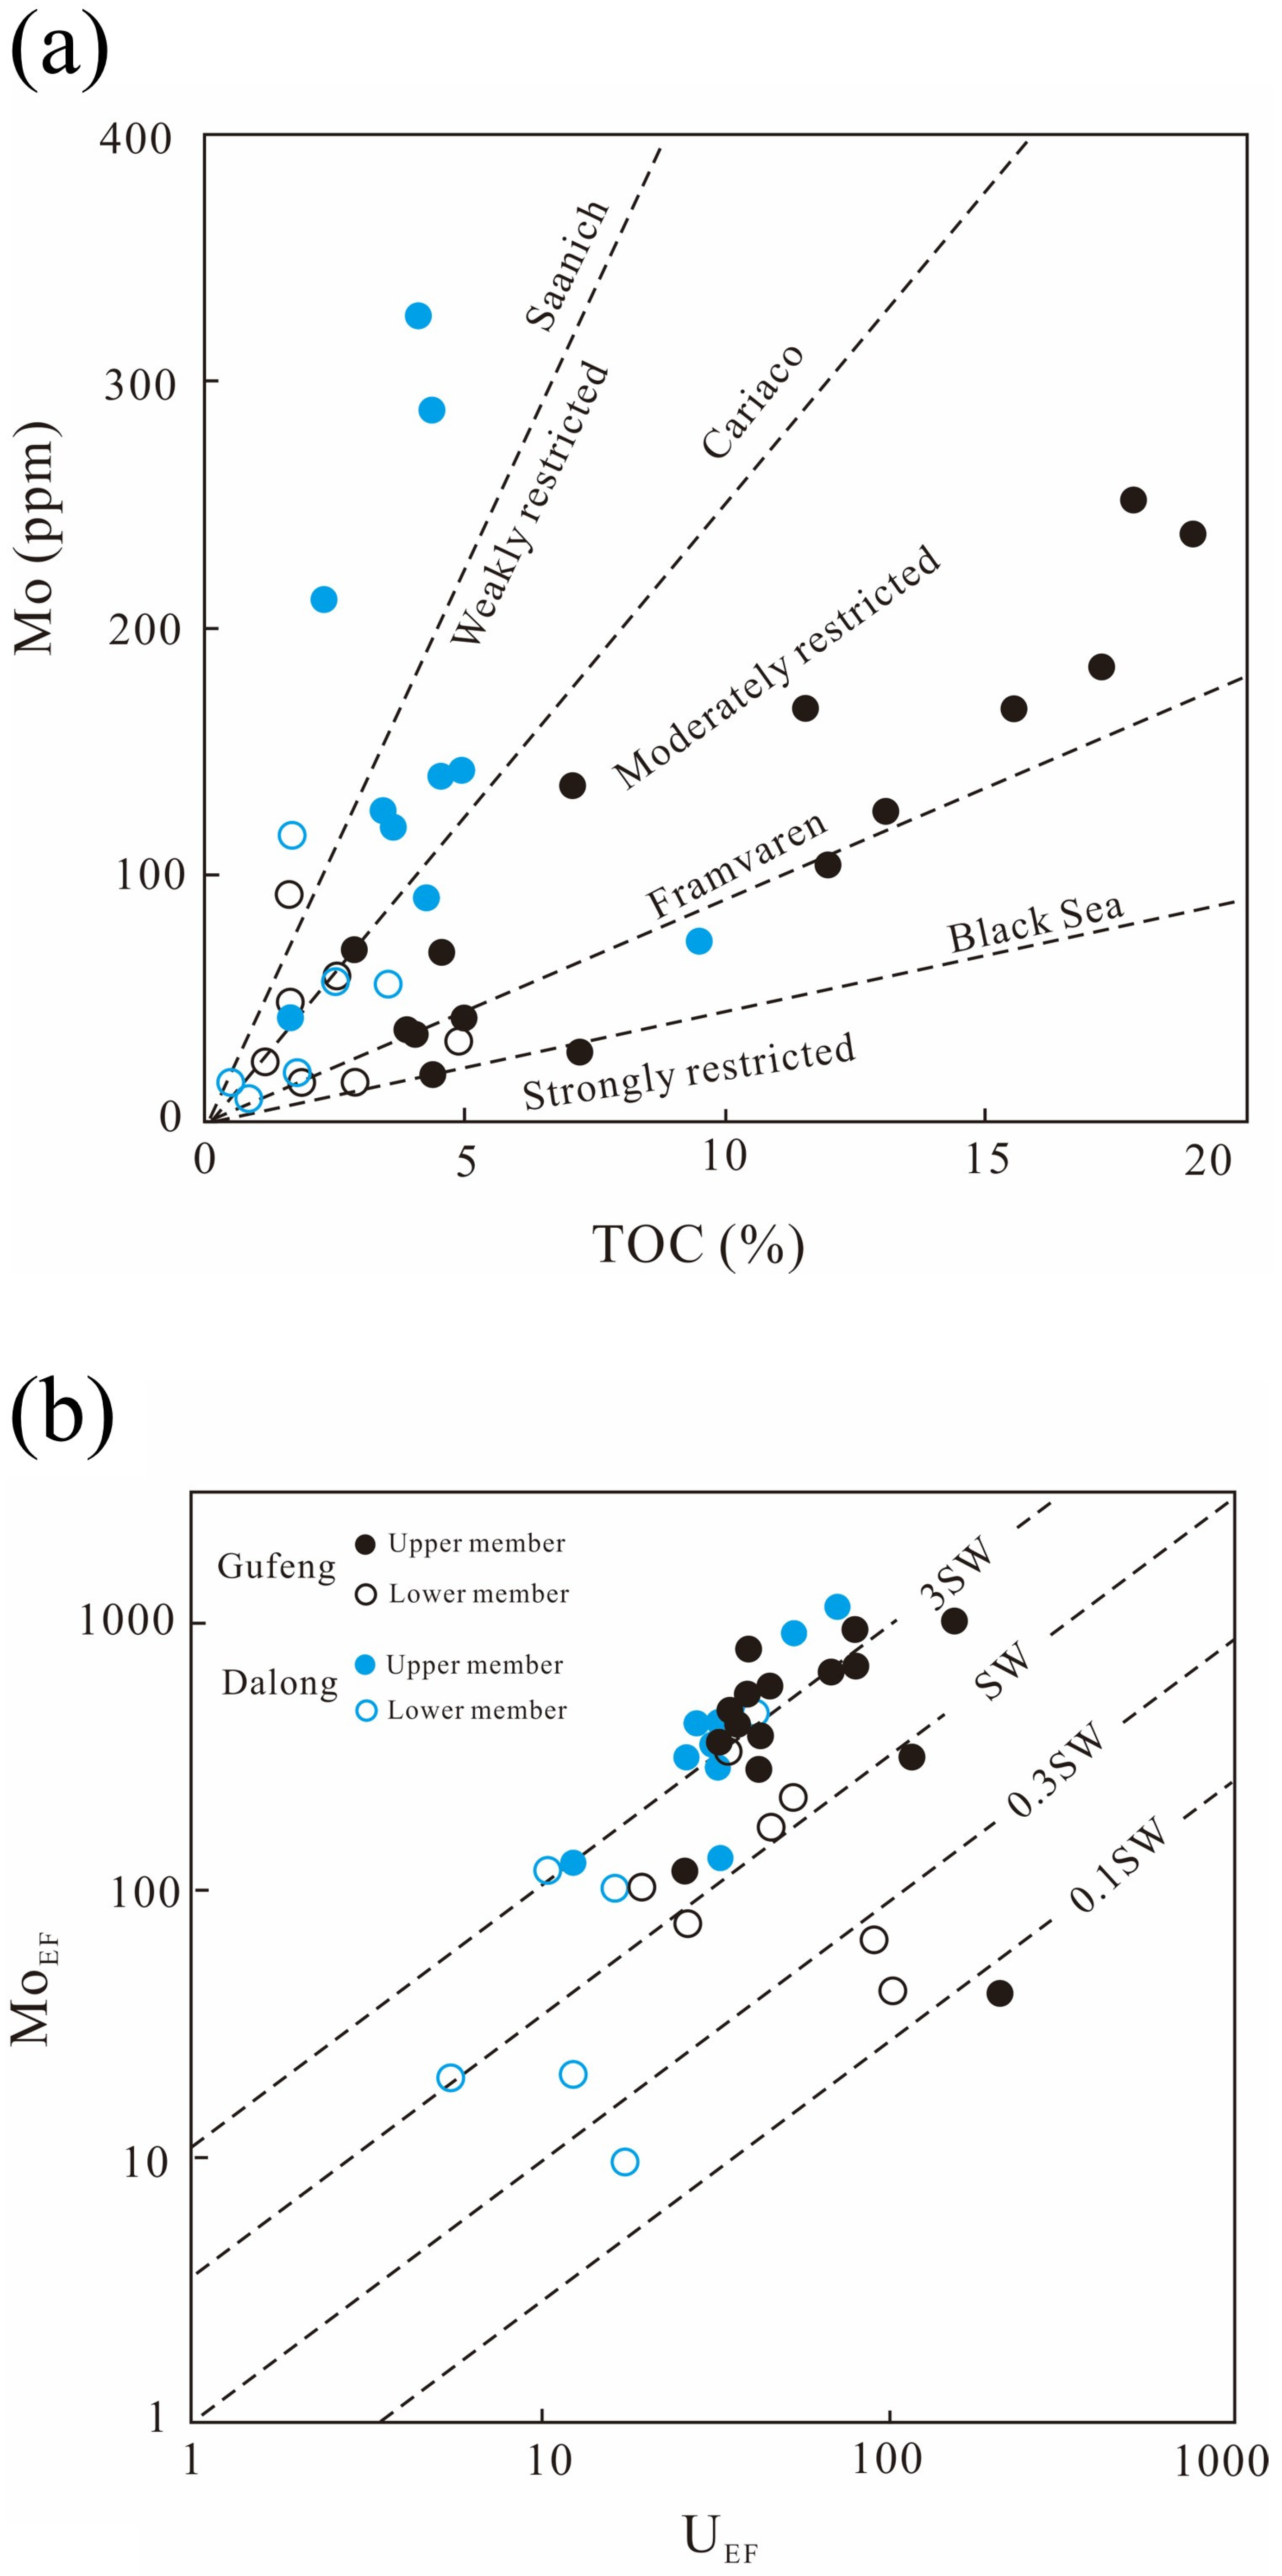
5.5. Redox Conditions
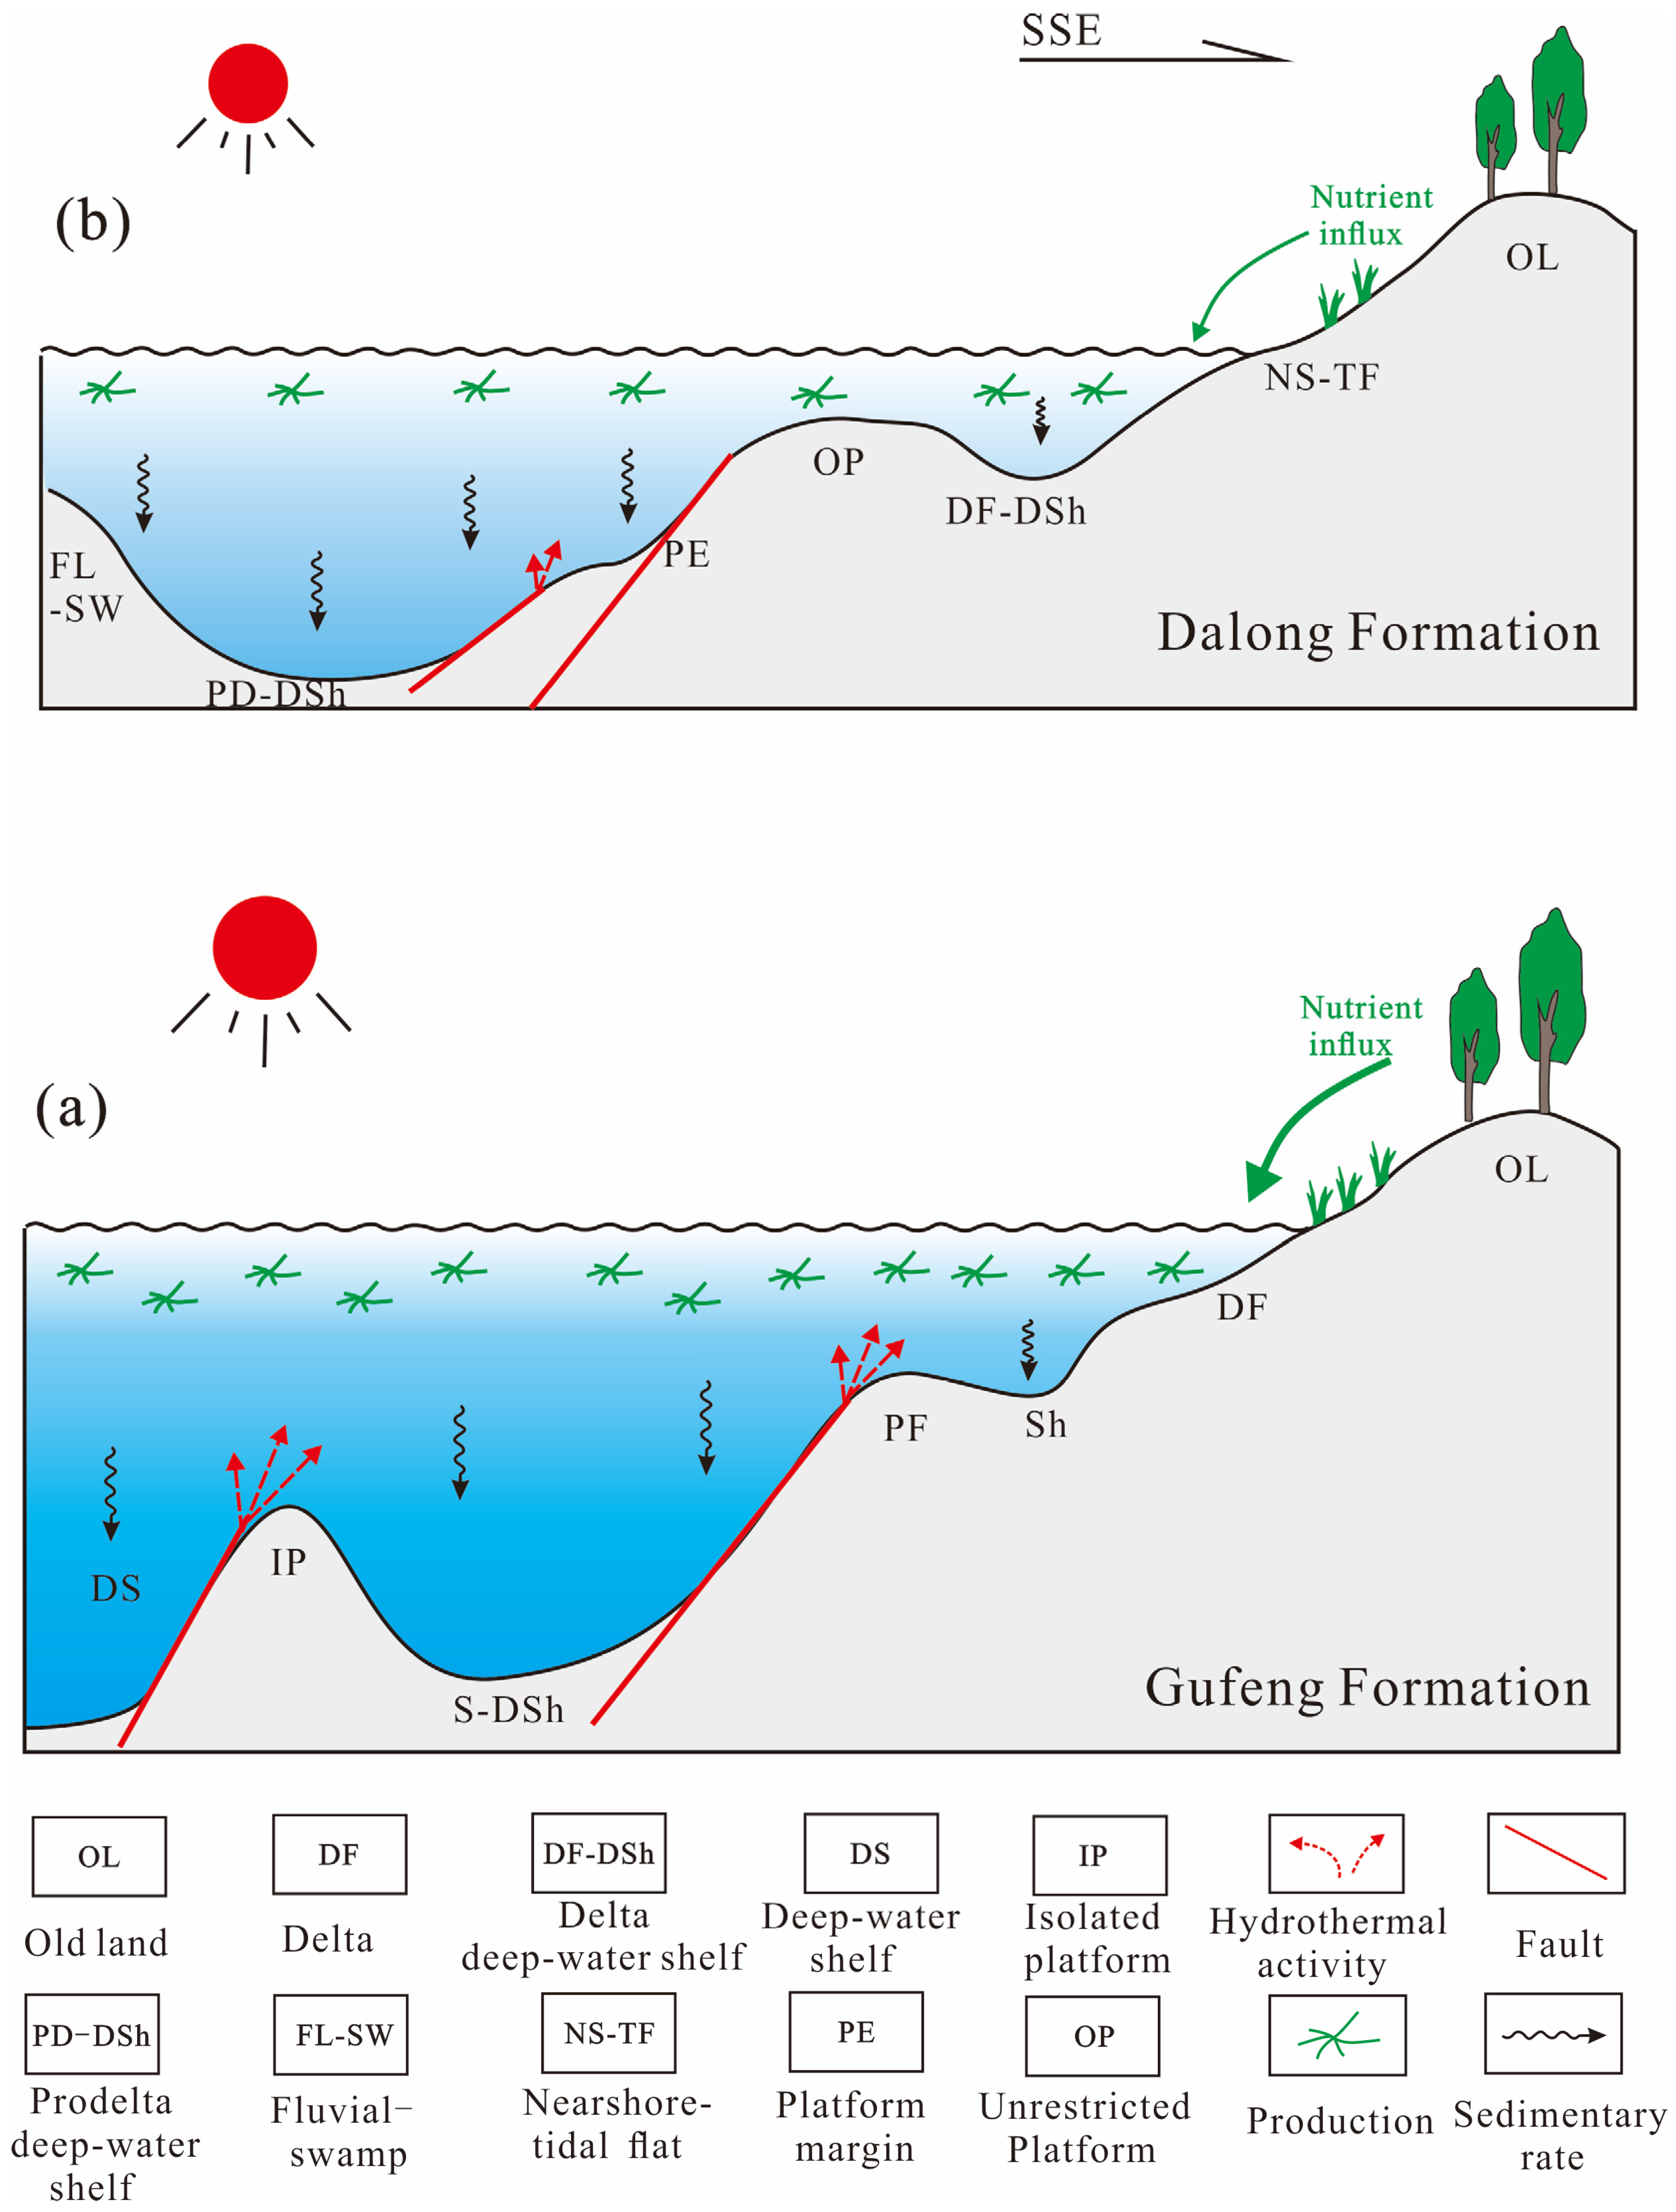
5.6. Paleoenvironmental Model and OM Enrichment
5.6.1. OM Enrichment in the Gufeng Formation
5.6.2. OM Enrichment in the Dalong Formation
5.6.3. Model of Heterogeneous Enrichment
6. Conclusion
Author Contributions
Funding
Data Availability Statement
Conflicts of Interest
References
- Guo, X.S.; Wang, R.Y.; Shen, B.J.; Wang, G.P.; Wan, C.X.; Wang, Q.R. Geological characteristics, resource potential, and development direction of shale gas in China. Pet. Explor. Dev. 2025, 52, 15–28. [Google Scholar] [CrossRef]
- Wang, H.G.; Qiao, L.; Yang, X.; Che, Y.; Ding, J.P. Current status and development recommendations for CNPC’s shale oil and gas engineering technology. Acta Pet. Sin. 2024, 45, 1552–1563. [Google Scholar]
- Bao, H.Y.; Zhao, S.; Wang, B.J. Exploration breakthrough and main controlling factors for shale gas enrichment in the Permian Maokou Formation in Hongxing area in eastern Sichuan Basin. China Pet. Explor. 2024, 29, 65–75. [Google Scholar]
- Jiang, P.F.; Wu, J.F.; Zhu, Y.Q.; Zhang, D.K.; Wu, W.; Zhang, R.; Wu, Z.; Wang, Q.; Yang, Y.R.; Yang, X.; et al. Enrichment conditions and favorable areas for exploration and development of marine shale gas in Sichuan Basin. Acta Pet. Sin. 2023, 44, 91–109. [Google Scholar]
- He, X.; Liang, F.; Li, H.; Zheng, M.J.; Zhao, Q.; Liu, Y.; Liu, W.P. Breakthrough and enrichment mode of marine shale gas in the Lower Cambrian Qiongzhusi Formation in high-yield wells in Sichuan Basin. China Pet. Explor. 2024, 29, 142–155. [Google Scholar]
- Zhang, Q.; Lu, D.L.; Wang, K.; Liu, C.; Guo, M.Q.; Zhang, M.J.; Guo, C.J.; Wang, Y.; Hu, W.Z.; Zhu, X.M. Lithofacies classification and microscopic pore characteristics of fine-grained sedimentary rocks in the Hetang Formation, Lower Yangtze region. Oil Gas Geol. 2024, 45, 1089–1096. [Google Scholar]
- Zhu, W.B.; Zhang, X.H.; Zhou, D.R.; Fang, C.G.; Li, J.Q.; Huang, Z.Q. New cognition on pore structure characteristics of Permian marine shale in the Lower Yangtze Region and its implications for shale gas exploration. Nat. Gas Ind. 2021, 41, 41–55. [Google Scholar] [CrossRef]
- Zhang, X.H.; Chen, C.; Zhang, Y. Geological characteristics of trough facies, Maokou Formation, northwestern Sichuan Basin: Implications for geology. Nat. Gas Explor. Dev. 2018, 41, 42–50. [Google Scholar]
- Liao, S.B.; Shi, G.; Li, J.Q.; Zheng, H.J.; Zhou, D.R.; Wang, C.Z.; Huang, N. Shale gas drilled by well WWD1 in theWangjiang area of Anhui Province. Geol. China 2021, 48, 1657–1658. [Google Scholar]
- Liu, B.; Gao, X.Z.; Li, F.; Gong, Z.Y.; Luo, F.; Du, X.F. Paleoenvironmental reconstruction and organic matter enrichment of Middle Permian black shale: Insights from the Gufeng Formation, Enshi Area, West Hubei. Geoscience 2024, 38, 1484–1496. [Google Scholar]
- Zhou, J.Y.; Chen, J.W.; Zhang, Y.X.; Zhang, Y.G.; Zhang, Y.; Liu, T.Y.; Wan, X.F. Paleo-environment and tectonic background of Mufushan Formation in Lower Yangtze area: Evidence from geochemistry of fine-grained mixed-siliciclastic-calcareous deposits. Acta Geol. Sin. 2021, 95, 1693–1711. [Google Scholar]
- Fu, X.D.; Chen, Y.N.; Luo, B.; Li, W.Z.; Zhang, J.Y.; Wang, X.F.; Qiu, Y.C.; Lv, X.J.; Yao, Q.Y. Characteristics and petroleum geological significant of the high–quality source rocks in the Gufeng Member of the Middle Permian Maokou Formation in the northern Sichuan Basin. Acta Geol. Sin. 2021, 95, 1903–1920. [Google Scholar]
- Shen, W.B.; Wang, Y.Y.; Zheng, Z.Y.; Shen, S.H.; Xie, H.Z.; Qin, H.Y.; Baima, Q.Z. Paleo-Environmental Variation and Its Control on the Organic Matter Accumulation in Black Shale of the Permian Gufeng Formation in the Lower Yangtze Area, South China. Front. Earth Sci. 2022, 10, 899947. [Google Scholar] [CrossRef]
- Tyrrell, T. The relative influences of nitrogen and phosphorus on oceanic primary production. Nature 1999, 400, 523–531. [Google Scholar] [CrossRef]
- Shen, W.B.; Zhu, X.K.; Yan, B.; Li, J. Mechanism of organic matter accumulation in black shale of the Datangpo Formation: Insights from paleoenvironmental variation during the Cryogenian non-glaciation. Precambrian Res. 2022, 383, 106889. [Google Scholar] [CrossRef]
- Ai, J.Y.; Zhong, N.N.; Zhang, T.G.; Zhang, Y.; Wang, T.G.; George, S.C. Oceanic water chemistry evolution and its implications for post-glacial black shale formation: Insights from the Cryogenian Datangpo Formation, South China. Chem. Geol. 2021, 566, 120083. [Google Scholar] [CrossRef]
- Cheng, M.; Zhang, Z.H.; Algeo, T.J.; Liu, S.L.; Liu, X.D.; Wang, H.Y.; Chang, B.; Jin, C.S.; Pan, W.; Cao, M.C.; et al. Hydrological controls on marine chemistry in the Cryogenian Nanhua Basin (South China). Earth Sci. Rev. 2021, 218, 103678. [Google Scholar] [CrossRef]
- Tan, Z.Z.; Jia, W.L.; Li, J.; Yin, L.; Wang, S.S.; Wu, J.X.; Song, J.Z.; Peng, P.A. Geochemistry and molybdenum isotopes of the basal Datangpo Formation: Implications for ocean-redox conditions and organic matter accumulation during the Cryogenian interglaciation. Palaeogeogr. Palaeoclimatol. Palaeoecol. 2021, 563, 110169. [Google Scholar] [CrossRef]
- Schenau, S.J.; Reichart, G.J.; De Lange, G.J. Phosphorus burial as a function of paleo-productivity. Geochim. Cosmochim. Acta 2005, 69, 919–931. [Google Scholar] [CrossRef]
- Tribovillard, N.; Algeo, T.J.; Lyons, T.; Riboulleau, A. Trace metals as paleoredox and paleo-productivity proxies, an update. Chem. Geol. 2006, 232, 12–32. [Google Scholar] [CrossRef]
- Tribovillard, N.; Algeo, T.J.; Baudin, F.; Riboulleau, A. Analysis of marine environmental conditions based on molybdenum-uranium covariation applications to Mesozoic paleoceanography. Chem. Geol. 2012, 324–325, 46–58. [Google Scholar] [CrossRef]
- Algeo, T.J.; Tribovillard, N. Environmental analysis of paleoceanographic systems based on molybdenum–uranium covariation. Chem. Geol. 2009, 268, 211–225. [Google Scholar] [CrossRef]
- Canfield, D.E.; Poulton, S.W.; Knoll, A.H.; Narbonne, G.M.; Ross, G.; Goldberg, T.; Strauss, H. Ferruginous conditions dominated later Neoproterozoic deep–water chemistry. Science 2008, 321, 949–952. [Google Scholar] [CrossRef]
- Cao, J.; Yang, R.F.; Yin, W. Mechanism of organic matter accumulation in residual bay environments, The Early Cretaceous Qiangtang Basin, Tibet. Energy Fuels 2018, 32, 1024–1037. [Google Scholar] [CrossRef]
- Murray, R.W.; Brink, M.R.B.T.; Gerlach, D.C. Rare earth, major, and trace elements in chert from the Franciscan Complex and Monterey Group, California, Assessing REE sources to fine–grained marine sediments. Geochim. Cosmochim. Acta 1991, 55, 1875–1895. [Google Scholar] [CrossRef]
- Bai, L.H.; Shi, W.Z.; Zhang, X.M.; Xu, X.F.; Liu, Y.; Yang, Y.; Feng, Q.; Cao, S.T. Characteristics of Permian Marine Shale and Its Sedimentary Environment in Xuanjing Area, South Anhui Province, Lower Yangtze Area. Earth Sci. 2021, 46, 2204–2217. [Google Scholar]
- Ma, Y.S.; Chen, H.D.; Wang, G.L. Palaeogeography Atlas for Tectonic-Sequence Lithofacies in South China; Science Press: Beijing, China, 2009. [Google Scholar]
- Liu, Z.; Selby, D. Deep-water osmium-isotope record of the Permian–Triassic interval from Niushan, China reveals potential delayed volcanic signal post the mass extinction. Glob. Planet. Change 2021, 200, 103473. [Google Scholar] [CrossRef]
- Ding, J.H.; Zhang, J.C.; Huo, Z.P.; Shen, B.J.; Shi, G.; Yang, Z.H.; Li, X.Q.; Li, C.X. Controlling Factors and Formation Models of Organic Matter Accumulation for the Upper Permian Dalong Formation Black Shale in the Lower Yangtze area, South China, Constraints from Geochemical Evidence. ACS Omega 2021, 6, 3681–3692. [Google Scholar] [CrossRef] [PubMed]
- Shen, S.Z.; Zhang, H.; Zhang, Y.C.; Yuan, D.X.; Chen, B.; He, W.H.; Mu, L.; Lin, W.; Wang, W.Q.; Chen, J.; et al. Permian integrative stratigraphy and timescale of China. Sci. China Earth Sci. 2019, 62, 154–188. [Google Scholar] [CrossRef]
- Calvert, S.E.; Pedersen, T.F. Geochemistry of recent oxic and anoxic marine sediments-implication for the geological record. Mar. Geol. 1993, 113, 67–88. [Google Scholar] [CrossRef]
- Taylor, S.R.; McLennan, S.M. The Continental Crust: Its Composition and Evolution; Blackwell Scientific Publications: Oxford, UK, 1985; p. 311. [Google Scholar]
- Tenger Liu, W.; Xu, Y.; Chen, J. Comprehensive geochemical identification of highly evolved Marine carbonate source rocks: A case study of Ordos Basin. Sci. China Ser. D Earth Sci. 2006, 49, 384–396. [Google Scholar] [CrossRef]
- Shields, G.; Stille, P. Diagenetic constraints on the use of cerium anomalies as palaeoseawater redox proxies: An isotopic and REE study of Cambrian phosphorites. Chem. Geol. 2001, 175, 29–48. [Google Scholar] [CrossRef]
- Ding, J.H.; Zhang, J.C.; Tang, X. Elemental geochemical evidence for depositional conditions and organic matter enrichment of black rock series strata in an inter–platform basin, The Lower Carboniferous Datang Formation, Southern Guizhou, Southwest China. Minerals 2018, 8, 509. [Google Scholar] [CrossRef]
- Ibach, L.E.J. Relationship between sedimentation rate and total organic carbon content in ancient marine sediments. AAPG Bull. 1982, 66, 170–183. [Google Scholar]
- Zhang, S.C.; Zhang, B.M.; Bian, L.Z. Development constraints of marine source rocks in China. Earth Sci. Front. 2005, 12, 39–48. [Google Scholar]
- Nesbitt, H.W.; Young, G.M. Early Proterozoic climates and plate motions inferred from major element chemistry of lutites. Nature 1982, 299, 715–717. [Google Scholar] [CrossRef]
- Algeo, T.J.; Maynard, J.B. Trace–element behavior and redox facies in core shales of Upper Pennsylvanian Kansas–type cyclothems. Chem. Geol. 2004, 206, 289–318. [Google Scholar] [CrossRef]
- Ding, J.H.; Zhang, J.C.; Shi, G.; Shen, B.J.; Tang, X.; Yang, Z.H.; Li, X.Q.; Li, C.X. Sedimentary environment and organic matter accumulation for the Longtan Formation shale in Xuancheng area. Acta Sedimentol. Sin. 2020, 39, 324–340. [Google Scholar] [CrossRef]
- Abou El-Anwar, E.; Salman, S.; Mousa, D.; Aita, S. Geochemical and Mineralogical Evaluation of Black Shale and its Hydrocarbon Potentiality, Southwest Sinai, Egypt, Egypt. J. Chem. 2020, 63, 5055–5070. [Google Scholar] [CrossRef]
- Abou El-Anwar, E.; Salman, S.; Mousam, D.; Aita, S.; Makled, W.; Gentzis, T. Organic Petrographic and Geochemical Evaluation of the Black Shale of the Duwi Formation, El Sebaiya, Nile Valley, Egypt. Minerals 2021, 11, 1416. [Google Scholar] [CrossRef]
- Hung, J.J.; Yeh, H.Y.; Peng, S.H.; Chen, C.T.A. Influence of submarine hydrothermalism on sulfur and metal accumulation in surface sediments in the Kueishantao venting feld off northeastern Taiwan. Mar. Chem. 2018, 198, 88–96. [Google Scholar] [CrossRef]
- Shen, S.Z.; Crowley, J.L.; Wang, Y. Calibrating the end-Permian mass extinction. Science 2011, 334, 1367–1372. [Google Scholar] [CrossRef] [PubMed]
- Liao, Z.W.; Hu, W.X.; Cao, J. A preliminary investigation of the development and hydrocarbon potential of the black shales in the Upper Permian Dalong Formation, Southern Anhui Province in the Lower Yangze Region, China. Geol. J. China Univ. 2016, 22, 138–151. [Google Scholar]
- Chu, C.L.; Chen, Q.L.; Zhang, B. Influence on formation of Yuertusi source rock by hydrothermal activities at Dongergou Section, Tarim Basin. Acta Sedimentol. Sin. 2016, 34, 803–810. [Google Scholar]
- Slack, J.F.; Grenne, T.; Bekker, A. Suboxic Deep Seawater in the Late Paleoproterozoic, Evidence from Hematitic Chert and Iron Formation Related to Seafloor—Hydrothermal Sulfide Deposits, Central Arizona, USA. Earth Planet. Sci. Lett. 2007, 255, 243–256. [Google Scholar] [CrossRef]
- Yao, C.; Ma, D.; Ding, H. Trace Elements and Stable Isotopic Geochemistry of an Early Cambrian Chert-Phosphorite Unit from the Lower Yurtus Formation of the Sugetbrak Section in the Tarim Basin. Sci. China Earth Sci. 2014, 57, 454–464. [Google Scholar] [CrossRef]
- Zou, Y.; Wei, H.Y. Geochemical Constraints on the Hydrothermal Chert of the Kuhfeng Formation in the Middle Permian in the Lower Yangtze and Its Significance. Acta Sedimentol. Sin. 2024, 42, 799–811. [Google Scholar]
- Rimmer, S.M.; Thompson, J.A.; Goodnight, S.A. Multiple controls on the preservation of organic matter in Devonian-Mississippian marine black shales, Geochemical and petrographic evidence. Palaeogeogr. Palaeoclimatol. Palaeoecol. 2004, 215, 125–154. [Google Scholar] [CrossRef]
- Rimmer, S.M. Geochemical paleoredox indicators in Devonian-Mississippian black shales, Central Appalachian Basin (USA). Chem. Geol. 2004, 206, 373–391. [Google Scholar] [CrossRef]
- Redfeld, A.C. The biological control of chemical factors in the environment. Am. Sci. 1958, 46, 205–221. [Google Scholar]
- Scheller, E.L.; Dickson, A.J.; Canfeld, D.E.; Korte, C.; Kristiansen, K.K.; Dahl, T.W. Ocean redox conditions between the snowballs–Geochemical constraints from Arena Formation, East Greenland. Precambrian Res. 2018, 319, 173–186. [Google Scholar] [CrossRef]
- Wei, H.; Chen, D.; Wang, J.; Yu, H.; Tucker, M.E. Organic accumulation in the lower Chihsia Formation (Middle Permian) of South China: Constraints from pyrite morphology and multiple geochemical proxies. Palaeogeogr. Palaeoclimatol. Palaeoecol. 2012, 353−355, 73–86. [Google Scholar] [CrossRef]
- Algeo, T.J.; Lyons, T.W. Mo-total organic carbon covariation in modern anoxic marine environments, implications for analysis of paleoredox and paleohydrographic conditions. Paleoceanography 2006, 21, 1–23. [Google Scholar] [CrossRef]
- Algeo, T.J.; Rowe, H. Paleoceanographic applications of trace–metal concentration data. Chem. Geol. 2012, 324, 6–18. [Google Scholar] [CrossRef]
- Hatch, J.R.; Leventhal, J.S. Relationship between inferred redox potential of the depositional environment and geochemistry of the Upper Pennsylvanian (Missourian) Stark Shale Member of the Dennis Limestone, Wabaunsee County, Kansas, U.S.A. Chem. Geol. 1992, 99, 65–82. [Google Scholar] [CrossRef]
- Kimura, H.; Watanabe, Y. Oceanic anoxia at the Precambrian–Cambrian boundary. Geology 2001, 29, 995–998. [Google Scholar] [CrossRef]
- Abou El-Anwar, E.; Salman, S.; Makled, W.; Mousa, D.; Gentzis, T.; Shazly, T.F. Depositional mechanism of Duwi Formation organic-rich rocks in anoxic Campanian-early Maastrichtian condensed sections in the Qusseir–Safaga region in Eastern Desert of Egypt and their economic importance. Mar. Pet. Geol. 2024, 163, 106759. [Google Scholar] [CrossRef]
- Du, X.B.; Song, X.D.; Zhang, M.Q.; Lu, Y.C.; Lu, Y.B.; Chen, P.; Liu, Z.H.; Yang, S. Shale gas potential of the Lower Permian Gufeng Formation in the western area of the Lower Yangtze Platform, China. Mar. Pet. Geol. 2015, 67, 526–543. [Google Scholar] [CrossRef]


Disclaimer/Publisher’s Note: The statements, opinions and data contained in all publications are solely those of the individual author(s) and contributor(s) and not of MDPI and/or the editor(s). MDPI and/or the editor(s) disclaim responsibility for any injury to people or property resulting from any ideas, methods, instructions or products referred to in the content. |
© 2025 by the authors. Licensee MDPI, Basel, Switzerland. This article is an open access article distributed under the terms and conditions of the Creative Commons Attribution (CC BY) license (https://creativecommons.org/licenses/by/4.0/).
Share and Cite
Shen, W.; Shen, W.; Xiao, X.; Shen, S. Evolution of Permian Sedimentary Environment in South China: Constraints on Heterogeneous Accumulation of Organic Matter in Black Shales. Minerals 2025, 15, 296. https://doi.org/10.3390/min15030296
Shen W, Shen W, Xiao X, Shen S. Evolution of Permian Sedimentary Environment in South China: Constraints on Heterogeneous Accumulation of Organic Matter in Black Shales. Minerals. 2025; 15(3):296. https://doi.org/10.3390/min15030296
Chicago/Turabian StyleShen, Weibing, Weibin Shen, Xiao Xiao, and Shihao Shen. 2025. "Evolution of Permian Sedimentary Environment in South China: Constraints on Heterogeneous Accumulation of Organic Matter in Black Shales" Minerals 15, no. 3: 296. https://doi.org/10.3390/min15030296
APA StyleShen, W., Shen, W., Xiao, X., & Shen, S. (2025). Evolution of Permian Sedimentary Environment in South China: Constraints on Heterogeneous Accumulation of Organic Matter in Black Shales. Minerals, 15(3), 296. https://doi.org/10.3390/min15030296