Article

Geochemical Evidence of Organic Matter Enrichment and Depositional Dynamics in the Lower Cambrian Yurtus Formation, NW Tarim Basin: Insights into Hydrothermal Influence and Paleoproductivity Mechanisms

1
Research Institute of Petroleum Exploration and Development, Tarim Oilfield Company, Korla 841000, China
2
R&D Center for Ultra-Deep Complex Reservoir Exploration and Development, China National Petroleum Corporation, Korla 841000, China
3
Engineering Research Center for Ultra-Deep Complex Reservoir Exploration and Development, Xinjiang Uygur Autonomous Region, Korla 841000, China
4
Xinjiang Key Laboratory of Ultra-deep Oil and Gas, Korla 841000, China
5
Key Laboratory of Gas Reservoir Formation and Development, China National Petroleum Corporation, Korla 841000, China
6
Sinopec Petroleum Exploration and Production Research Institute, Beijing 102206, China
7
Hubei Key Laboratory of Petroleum Geochemistry and Environment (Yangtze University), Yangtze University, Wuhan 430100, China
8
Exploration and Development Research Institute, PetroChina Daqing Oilfield Company Ltd., Daqing 163712, China
*
Authors to whom correspondence should be addressed.
Minerals 2025, 15(3), 288; https://doi.org/10.3390/min15030288
Submission received: 18 October 2024 / Revised: 27 February 2025 / Accepted: 10 March 2025 / Published: 12 March 2025

Abstract

:
The lower Cambrian Yurtus Formation (Є1y) in the Tarim Basin, characterized by its high organic matter content, serves as a critical source rock for oil and gas exploration in the platform basin. This study presents a high-resolution geochemical analysis of a geological section located near the Aksu Cement Plant in the northwest margin of the Tarim Basin. The focus is on elucidating the sedimentary environment, mechanisms of organic matter enrichment, and the depositional history of the Є1y source rock. The Є1y exhibits distinctive geochemical signatures, including elevated concentrations of Mo, Ba, and U, with an average rare earth element (REE) content of 155.75 μg/g. The formation shows significant light REE enrichment (LREE/HREE = 1.74–5.57), a moderate Ce negative anomaly (δCe = 0.4–0.71), and a notable Eu positive anomaly (δEu = 0.94–2.14), indicative of a unique depositional environment influenced by hydrothermal processes. Geochemical evidence suggests that the Є1y siliceous shales were deposited in a highly reducing, anoxic, and sulfide-rich environment, promoting organic matter preservation and enhancing sedimentary productivity. The presence of hydrothermal trace elements, likely introduced by hydrothermal fluids from volcanic activity along fractures and faults, played a critical role in enriching the sedimentary system, preserving organic matter, and boosting paleoproductivity. The model of organic matter enrichment proposed in this study underscores the dynamic interplay between hydrothermal influences and high primary productivity. These findings provide important insights into the formation of high-quality source rocks and have significant implications for the exploration of deep and ultra-deep oil and gas reserves in the Tarim Basin.

1. Introduction

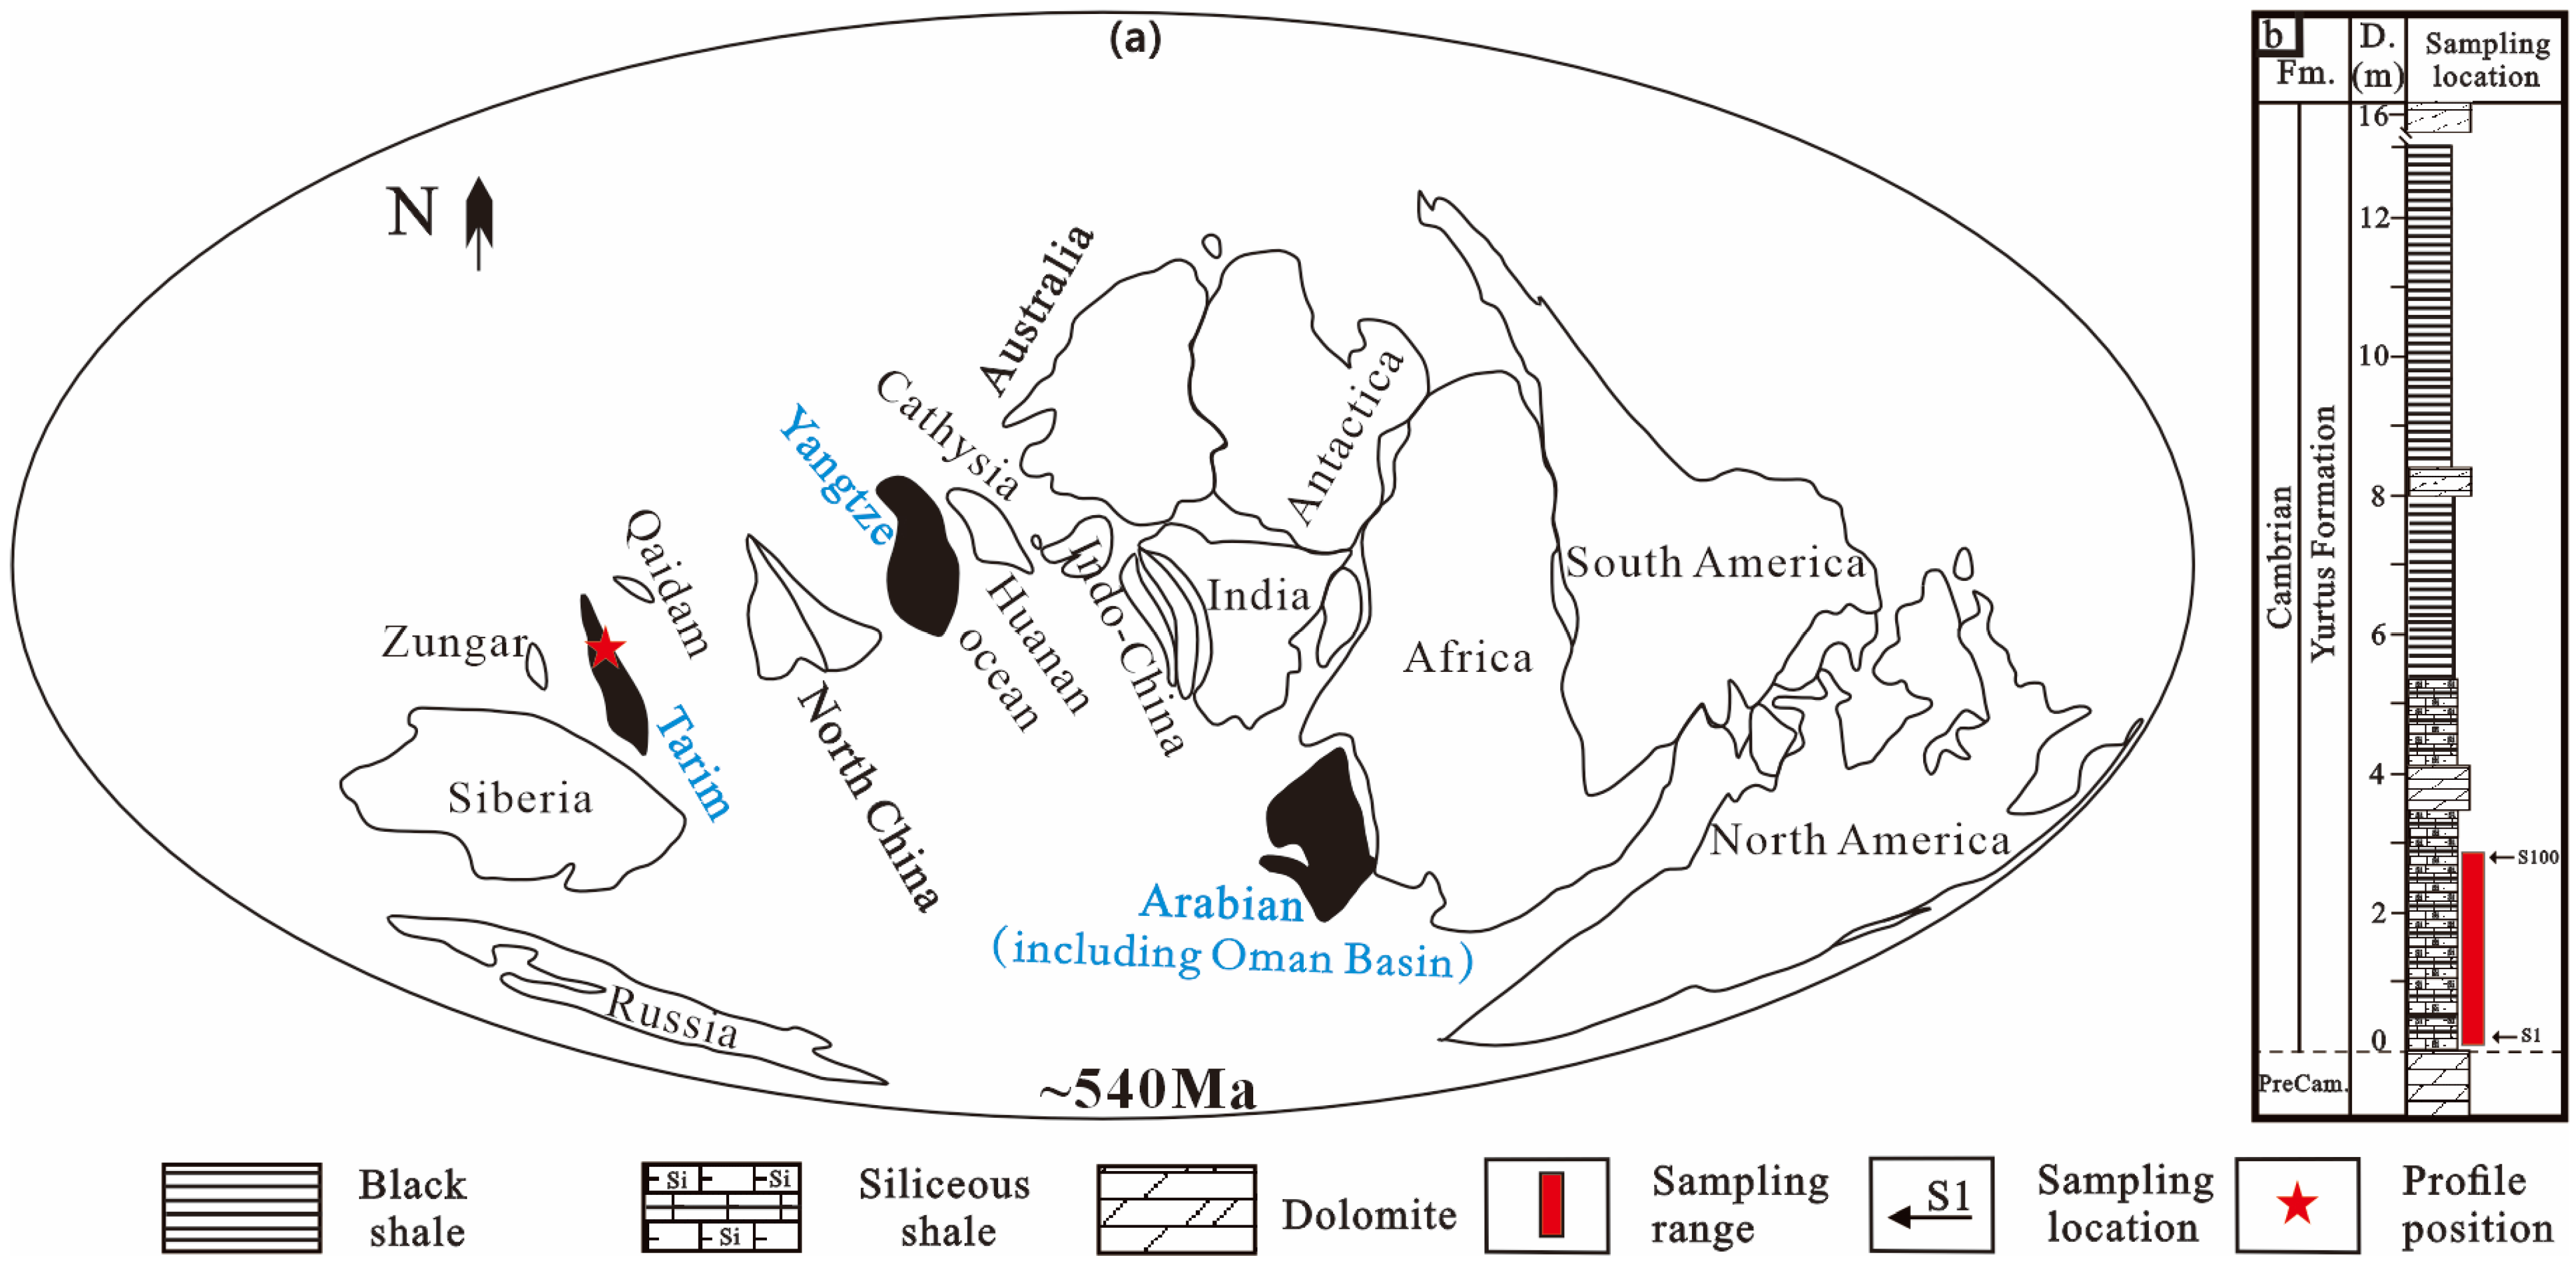
The transition from the Precambrian to the Early Cambrian is a critical period in Earth’s history, marked by significant tectonic and environmental shifts. This era witnessed extensive marine transgressions, hydrothermal activity, and persistent anoxic conditions, shaping global biogeochemical cycles (Figure 1a) [1,2,3]. The widespread deposition of Lower Cambrian black shales globally serves as a key record of marine evolution during this time, offering insights into paleoenvironmental conditions [4]. In the Tarim Basin, the Early Cambrian Yurtus Formation (Є1y), predominantly composed of siliceous rocks and siliceous shales (Figure 1b), provides a unique opportunity to explore the paleo-marine environment of this period. Notably, the organic carbon content of the Є1y represents the highest concentrations of marine source rocks in China [5], making it a significant subject of study, especially with the growing focus on deep and ultra-deep strata exploration in the basin [5,6].
The Є1y is overlain by the Xiaoerbulake Formation, which features reef-shoal facies dolomites with numerous fractures and cavities, while the Wusonger Formation consists of thick mudstones and paste rocks. These strata form an important source-reservoir-caprock system, critical for oil and gas exploration in the Tarim Basin [7]. However, the complex and heterogeneous nature of the basal black rock series in the Є1y presents significant challenges in understanding its genesis, depositional processes, and sedimentary background. Despite some progress, research on the mechanisms of organic matter enrichment in this series remains limited and debated [8,9]. The Є1y outcrop in the northwest of the Tarim Basin is thought to have been deposited in environments ranging from restricted shallow shelves to deep-water basins, with the subsurface Є1y forming in semi-restricted or coastal environments [10,11]. These findings have implications for the exploration of Lower Paleozoic organic-rich source rocks in the basin.
Figure 1. Global palaeogeography during the Early Cambrian (a) and locations of the sections and samples (b) (Fm., Formation; D., Depth; S1, Sample number; PreCam., Precambrian) [10].
Minerals 15 00288 g001
Organic matter enrichment in sedimentary rocks is primarily controlled by high primary productivity, which is often enhanced by anoxic conditions that facilitate organic matter preservation [12,13,14]. The abundance of organic matter is largely governed by anoxic or sulfidic reducing environments, where preservation potential is high [15]. However, neither the “productivity model” nor the “preservation model” alone fully explains the mechanisms of organic matter enrichment. It is likely that these factors interact to produce the observed organic richness. Current models explaining the development of high-quality source rocks include: (1) the “hydrothermal activity-upwelling-anoxic event model,” which posits that stratification of the water column allows for oxygenated surface waters with high productivity, while the bottom waters are anoxic and reducing [16]; (2) the combined influence of hydrothermal activity, coastal upwelling, sea-level fluctuations, and organic matter preservation conditions on source rock development [17]; (3) the effect of sea-level changes, topography, hydrothermal events, upwelling, and periodic anoxia on organic matter enrichment [18]; and (4) the interplay between redox conditions and productivity, where the dominant control on organic matter enrichment varies by sedimentary period [19].
This study focuses on a geological section near the Aksu area in the northwest Tarim Basin, where detailed geochemical analyses are employed to reconstruct the depositional environment and sedimentary conditions of the Є1y Formation. The goal is to provide new insights into the mechanisms of organic matter accumulation, preservation, and enrichment, as well as to explore the tectonic evolution of the region.

2. Geological Setting

Geologically, the Tarim Basin is divided into three uplifts, four depressions, and seven first-order structural units (Figure 1b and Figure 2). The Aksu area is located on the northwest margin of the Tarim Basin. The Nanhua strata, comprising gray-green and purplish-red feldspar sandstones and siltstones, are approximately 2000 m thick, exhibiting poor sorting and rounding. The Sinian strata consist mainly of sand-mudstone and carbonate rocks of coastal shallow sea-tidal flat facies.
The Early Cambrian (Є1y) strata were deposited following post-rift subsidence and a large-scale transgression, resulting in the extensive development of black strata across the northwestern region of the Tarim Basin. Recognized as the largest hydrocarbon-bearing basin in China, these strata are primarily composed of black siliceous shales and other dark-colored shales [20], and are situated in the lower section of the Є1y. With a thickness ranging from 10 to 15 m and spanning approximately 26,000 km2, these strata reflect the unique paleoenvironmental conditions of the Early Cambrian. The extensive development of these black strata across the basin has made them a focal point in petroleum geology, particularly in understanding the genesis and distribution of Lower Paleozoic marine hydrocarbons. Previous studies have highlighted that the organic matter within these shales predominantly consists of Type II kerogen, which is highly effective in generating oil under appropriate thermal maturity conditions. Consequently, these strata are pivotal for current hydrocarbon exploration and production efforts and offer valuable insights into the broader paleoenvironmental and tectonic evolution of the Tarim Basin during the Early Cambrian period.

3. Materials and Methods

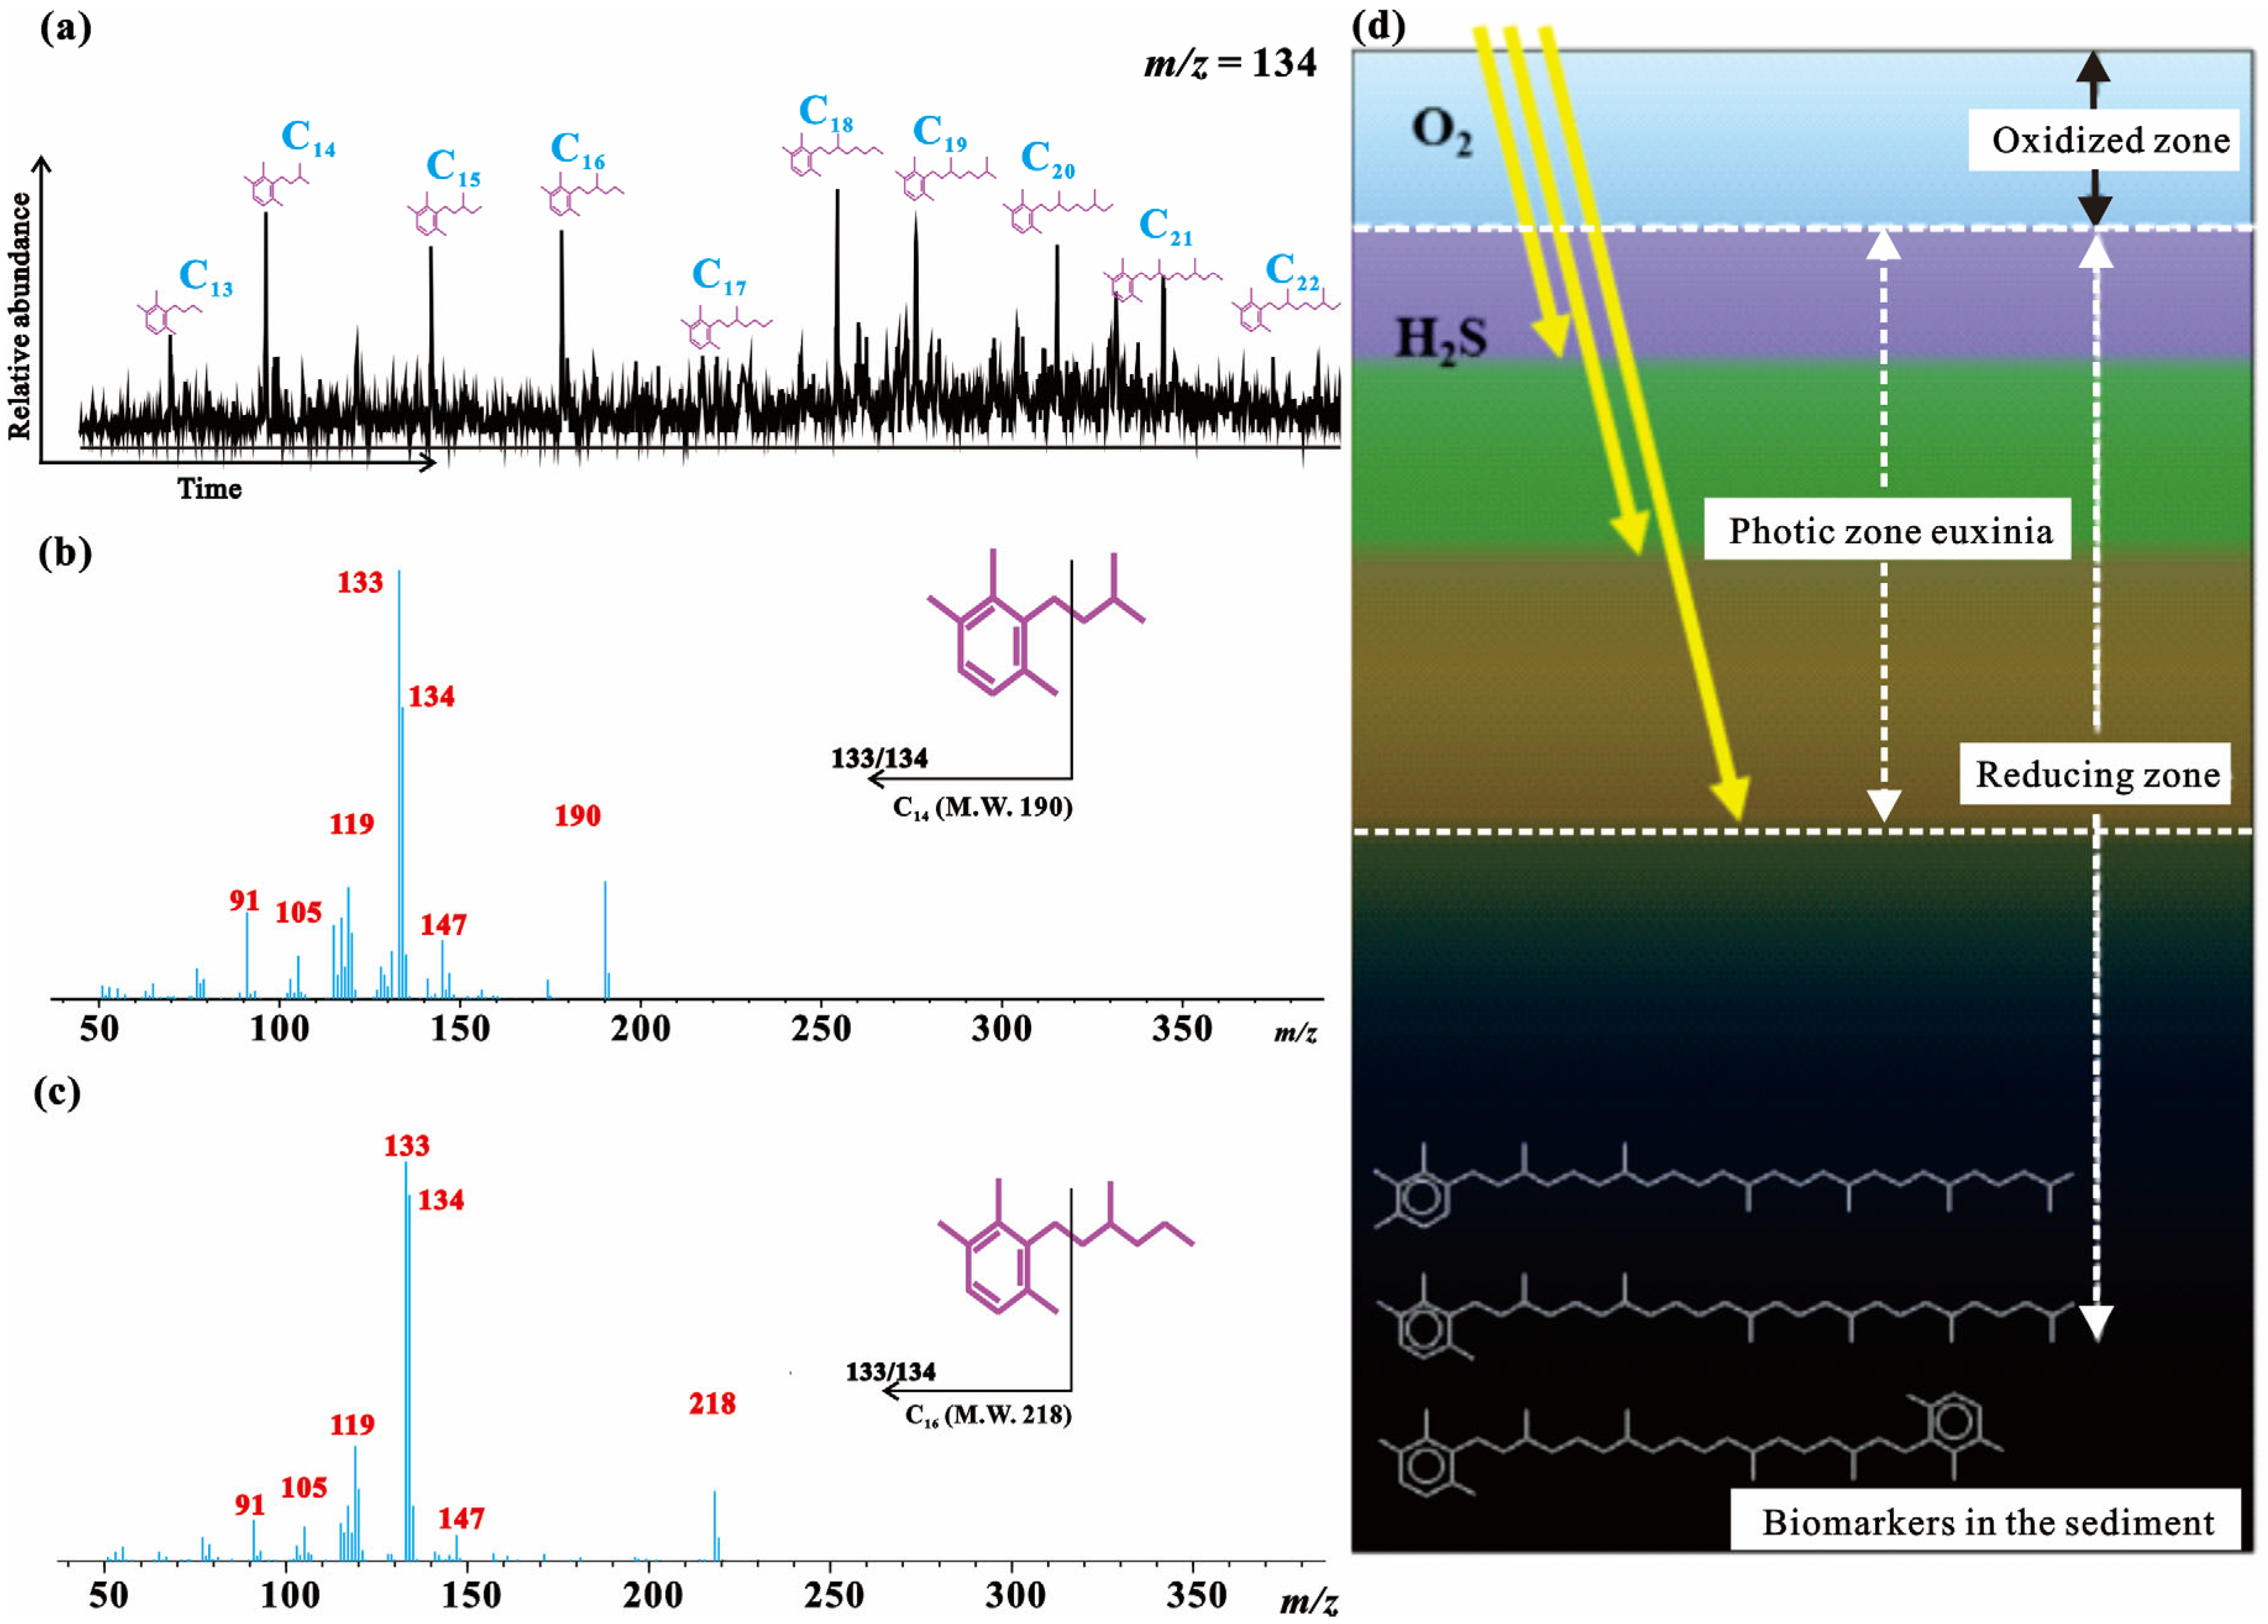
This study collected high-resolution samples from Cambrian outcrops in geological profiles near the Aksu Cement Plant, located in the northwest Tarim Basin. Sampling intervals ranged from 0.01 to 0.03 m, yielding a total of 100 samples, labeled Cam1y-1 through Cam1y-100 (Figure 1b), which were subsequently analyzed. To meet space constraints, this paper presents the results for every fifth sample and discusses their geochemical significance. 1-alkyl-2,3,6-trimethylbenzene compounds (ATMBs) from aromatic fractions of typical source rock samples are analyzed with m/z 133/134 to reveal their critical role in the relationship between Cam1y source rocks and major hydrocarbons in the Tarim Basin. Pre-processing and testing procedures for biomarker detection and total organic carbon (TOC) testing can be found in our early work [10].
Major and trace element analyses were performed at the Analytical Laboratory of the Beijing Research Institute of Uranium Geology, China National Nuclear Corporation, following the procedures outlined in previous studies [21]. Major elements were quantified using an AB104L Axioma X-ray fluorescence (XRF) spectrometer, with a relative standard deviation (RSD) of less than 1%. Accuracy was confirmed using shale standard material (GBW 03014) measured alongside the samples [21,22]. Trace elements and REE concentrations were determined following multiple rounds of acid digestion, involving HNO3, HClO4, and HF. Samples were diluted with 5% HNO3 to 50 mL before measurement on an ELEMENT XR inductively coupled plasma mass spectrometer (ICP-MS), with an RSD of less than 1.5% for each element. The calculation methods for δCe and δEu are as follows: δCe = [Ce/(La × Pr)1/2]Post-Archean Australian Shale (PAAS) and δEu = [Eu/(Sm × Gd)1/2]PAAS.

4. Results

4.1. Major Elements

The experimental results (Table 1) show considerable variation in the silica content across the profile, with SiO2 mass fractions ranging from 21.61% to 96.42%, averaging 71.56%. This distribution generally follows a consistent fluctuation pattern. Notably, in samples Cam1y-10, Cam1y-35, Cam1y-45, and Cam1y-55, the average SiO2 content is consistent at 71.56%, while in sample Cam1y-95, the SiO2 content is exceptionally high, surpassing 90%. The TOC content ranges from 0.2% to 20.28%, with an average of 5.40%. Interestingly, the average TOC content for these five samples is 3.12%, significantly lower than the overall average of 5.40%. Among the other major elements, Al2O3 content varies from 0.26% to 10.91%, with an average of 3.85%. In the five samples mentioned, the average Al2O3 content is only 0.38%, much lower than the general average. Fe2O3 content ranges from 0.15% to 7.46%, with an average of 2.15%. MgO content ranges from 0.064% to 1.9%, with an average of 0.774%, while CaO content varies significantly from 0.11% to 31.92%, with an average of 3.09%. MnO content is generally low and mostly falls below the detection limit. TiO2 mass fractions range from 0.02% to 0.68%, with a mean value of 0.22%.

4.2. Trace Elements

Table 2 presents the trace element compositions of the samples. Notably, the samples show elevated concentrations of Mo, Ba, and U. Mo levels range from 2.29 to 283 μg/g, with an average concentration of 43.85 μg/g. Ba concentrations range from 743 to 3734 μg/g, with an average of 524.71 μg/g, while U content varies from 2.47 to 187 μg/g, with an average of 52.34 μg/g. Moreover, V/(V + Ni) is generally greater than 0.85, indicating a hypoxic sulfurization condition. These elevated trace element levels are indicative of specific geochemical processes influencing the sedimentary environment, and further analysis may reveal insights into the hydrothermal contributions and redox conditions during deposition.

4.3. REEs

REE concentrations, normalized to PAAS standards [23], are shown in Table 3, with the distribution pattern illustrated in Figure 3. The average ΣREE value is 155.75 μg/g, with the LREE/HREE ratio averaging 3.24, ranging from 1.74 to 5.57. The Y/Ho ratio averages 45.01, and the mean δCe and δEu values are 0.5 (ranging from 0.4 to 0.71) and 1.10 (ranging from 0.94 to 2.14), respectively. These REE characteristics are consistent with a geochemical signature influenced by hydrothermal fluids [24], suggesting that the trace element and REE distributions reflect both the depositional environment and the hydrothermal processes that affected the region during the Early Cambrian.

4.4. Biomarkers

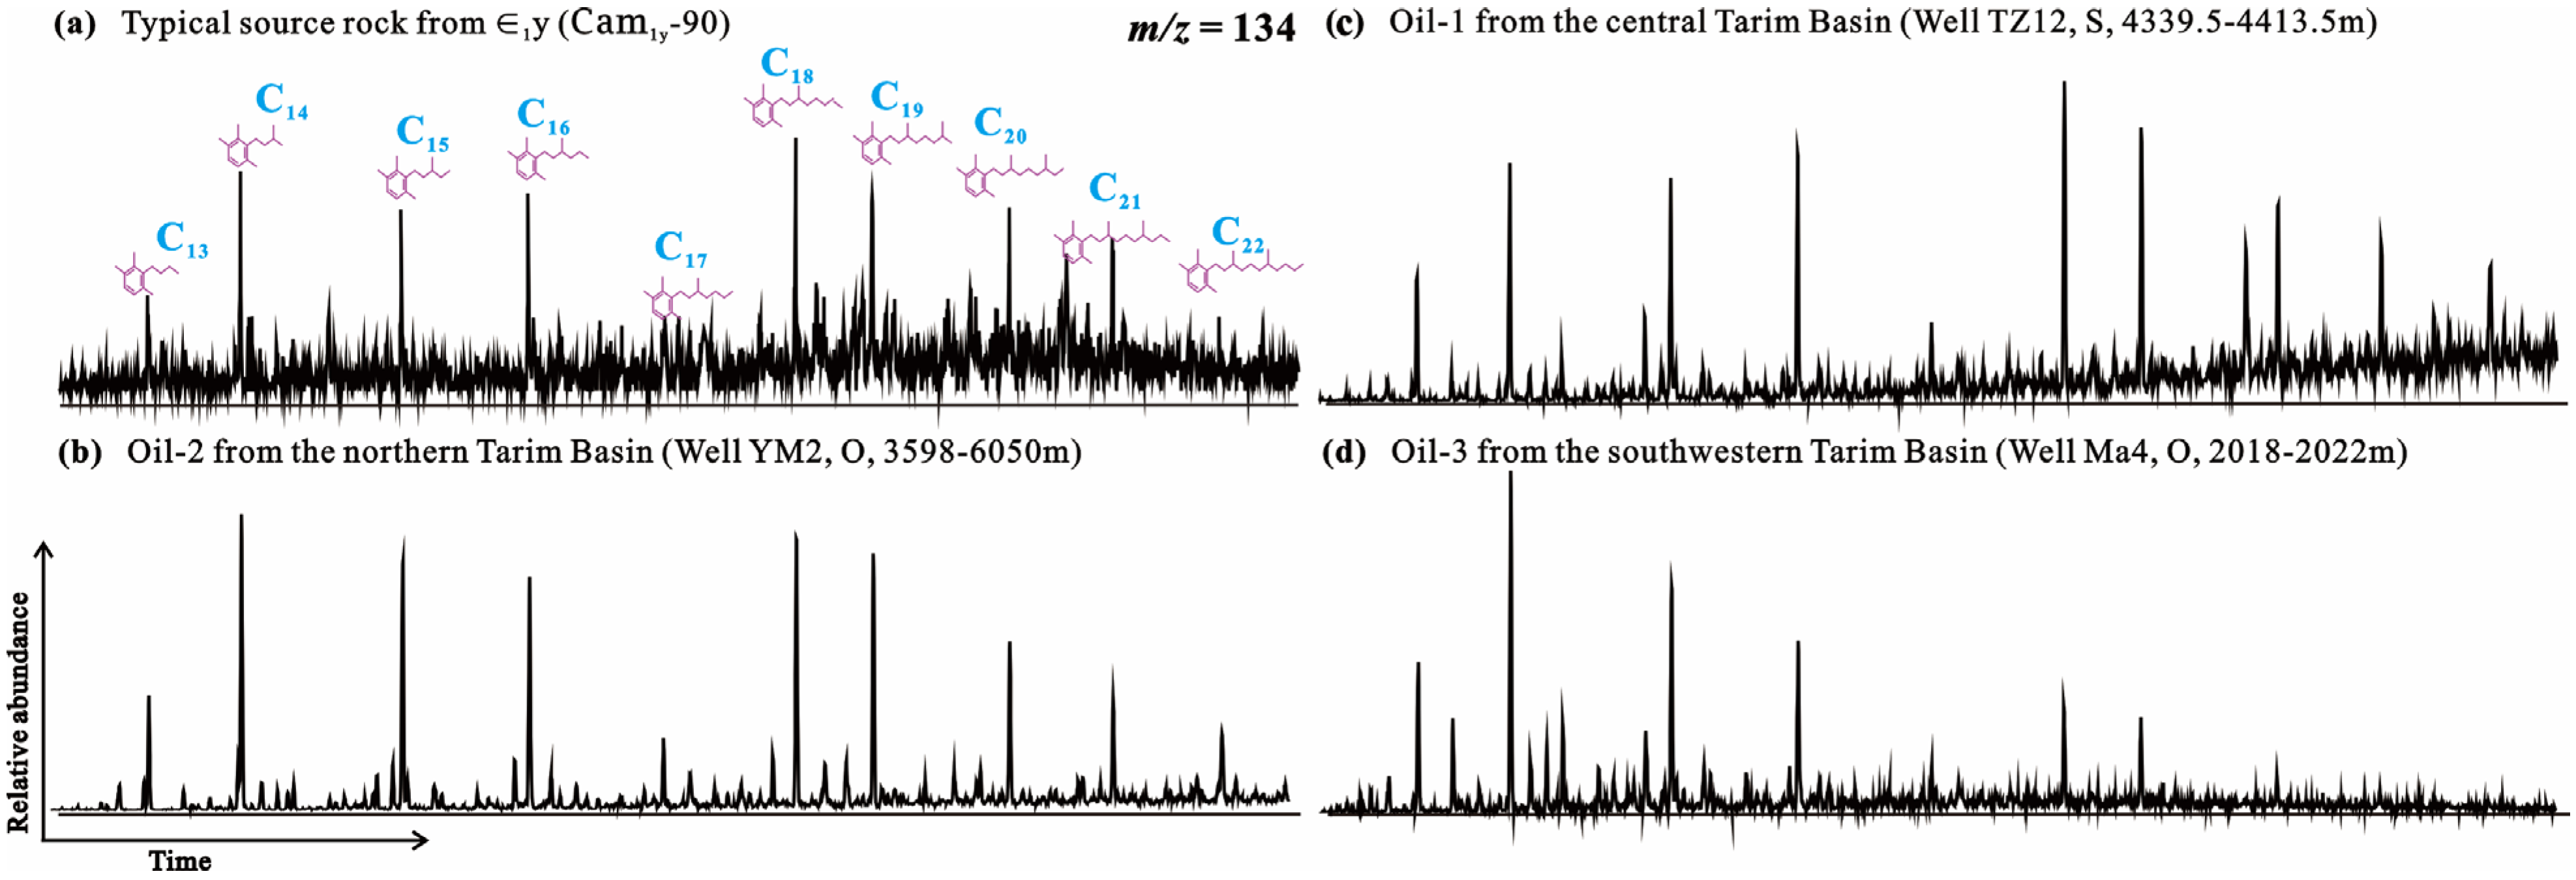
ATMB represents an extremely unique compound of aromatic biomarkers that are highly resistant to secondary alterations. These biomarkers are particularly significant in geochemical studies because they indicate a distinct source, namely green sulfur bacteria, and are associated with photic zone euxinia (PZE) environments. Such environments are known to enhance the enrichment and preservation of organic matter [10,18]. In this study, these compounds were identified through gas chromatography-mass spectrometry (GC-MS) analysis, where they exhibited characteristic mass spectral patterns (Figure 4). The structural confirmation of these compounds was achieved by comparing them with synthetic standards of 1-alkyl-2,3,6-trimethylbenzenes (C13–C22), as established by pioneering researchers in the field [18,24]. This analysis provides valuable insights into the sedimentary environment and the organic matter preservation processes, reinforcing the significance of hydrothermal and anoxic conditions in the Early Cambrian.

5. Discussion

5.1. Role of Terrigenous Influx

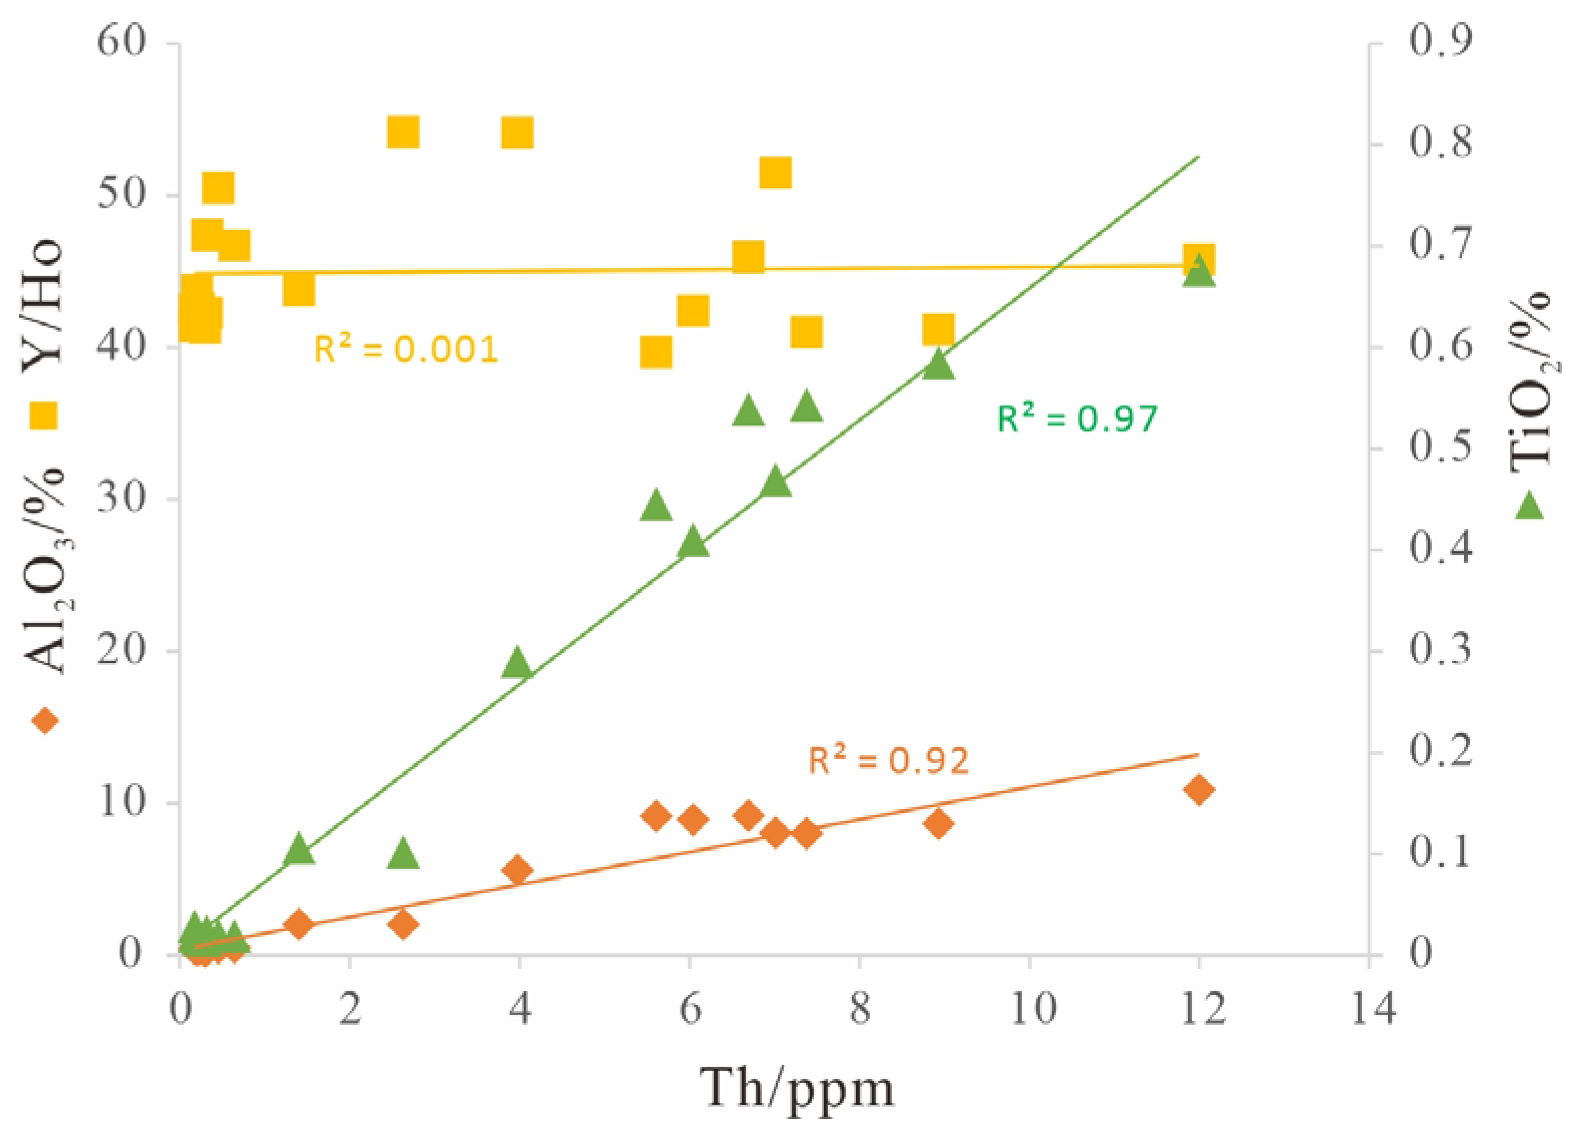
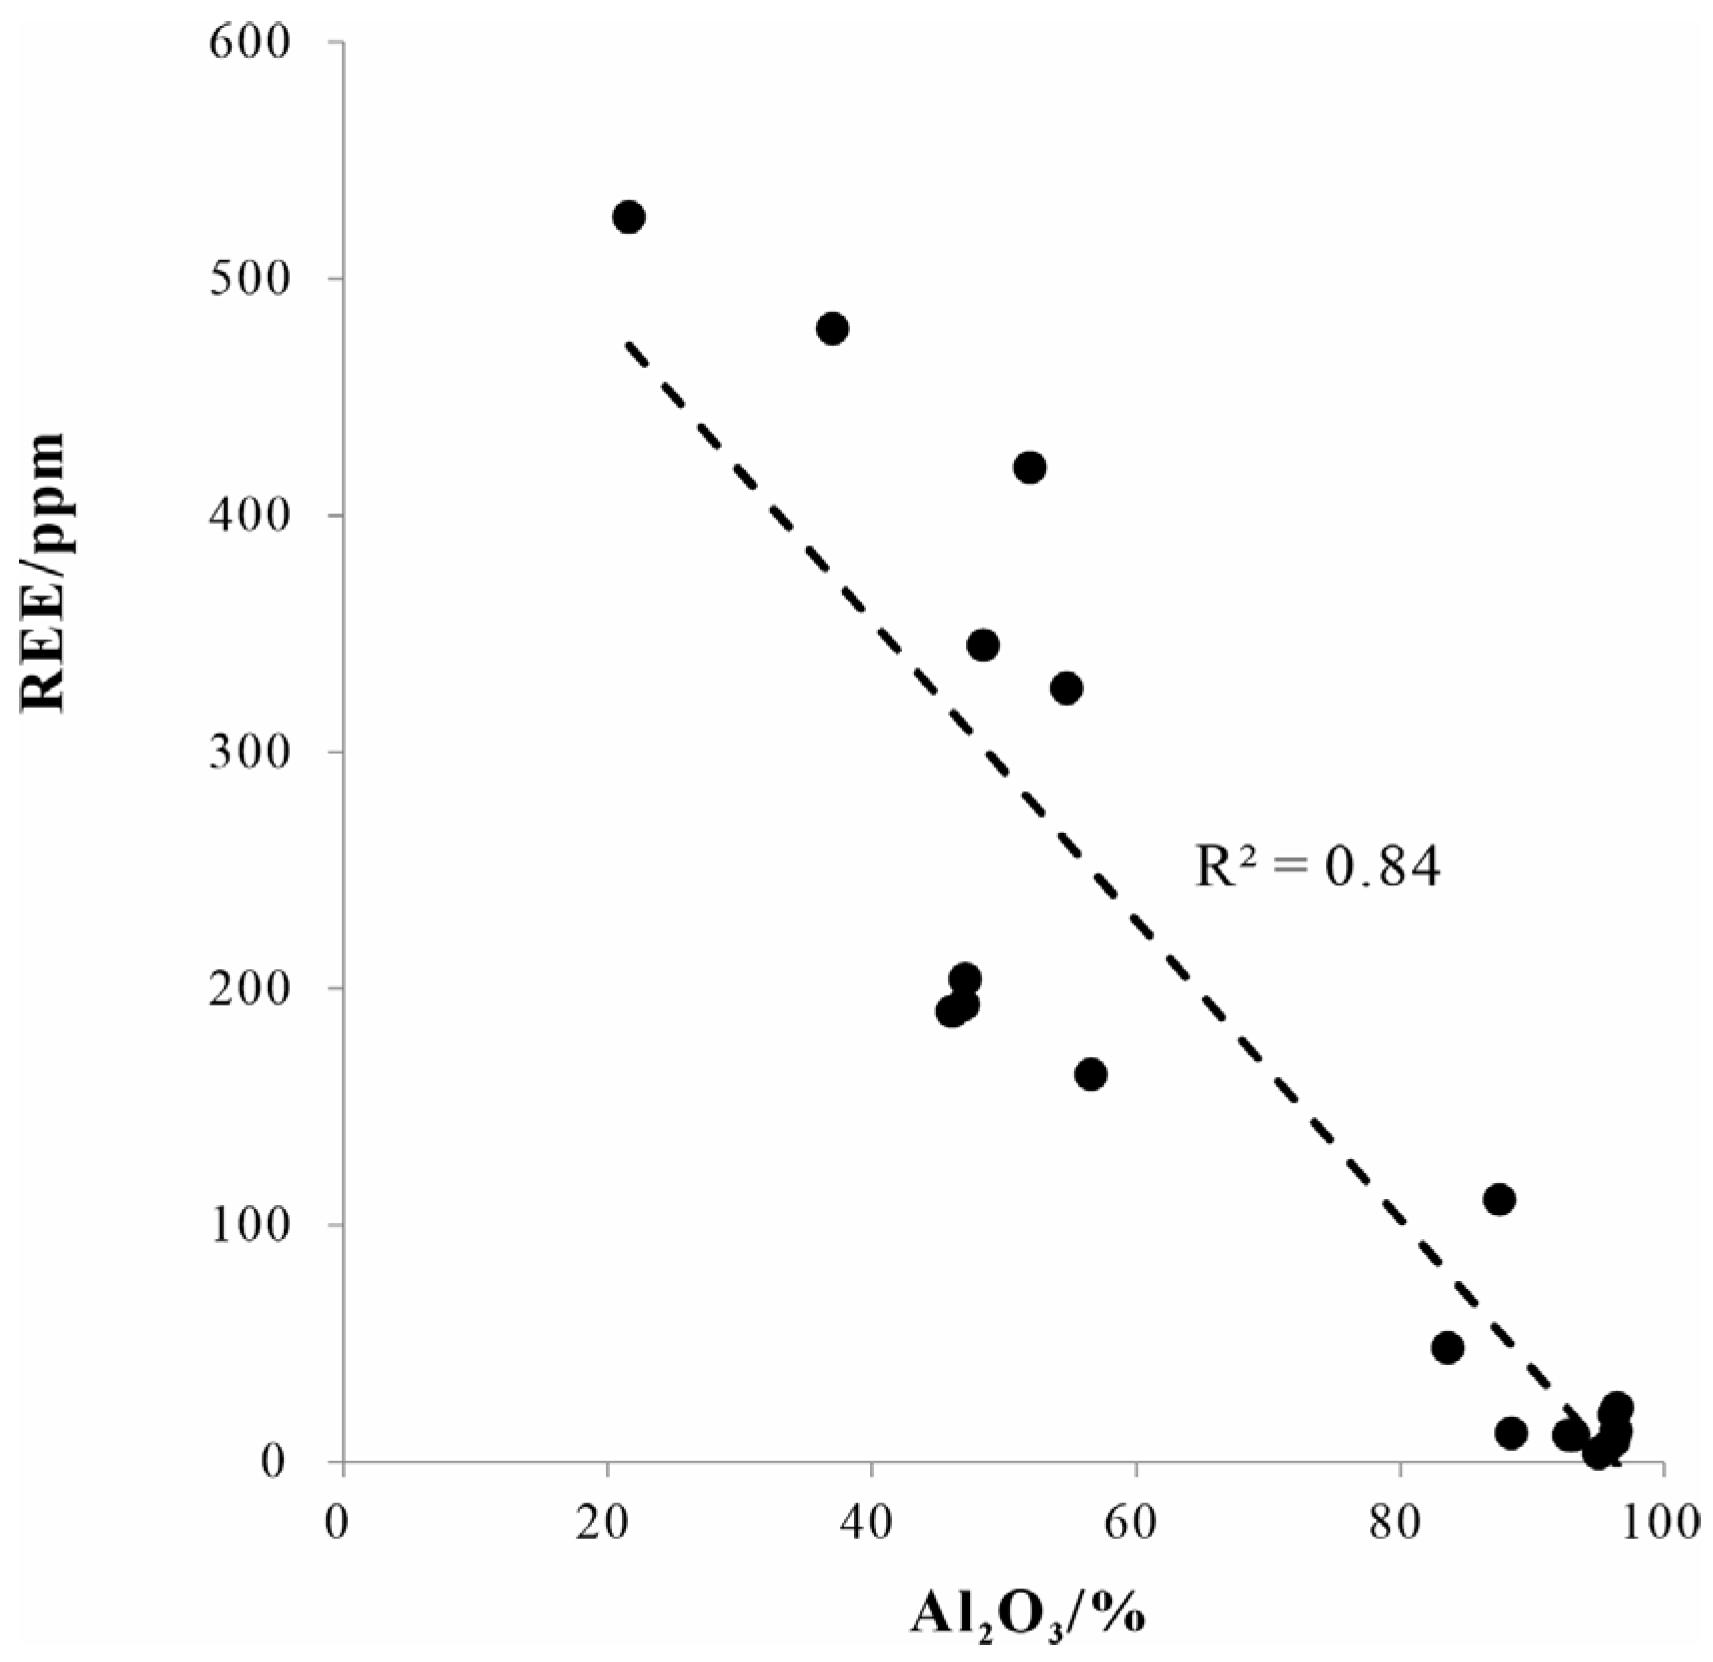
To explore factors such as paleoproductivity and redox conditions, it is necessary to assess whether the samples were influenced by terrigenous clastic components. In this study, thorium (Th) was employed as an index to measure terrigenous clastic input [25]. Additionally, Th, Al, Y/Ho, and Ti were used to assess the contribution of terrigenous detritus to diagenesis [16]. The results reveal a strong correlation between Th and Al, as well as Th and Ti (Figure 5, R2 = 0.92 and 0.97, respectively), but no correlation with Y/Ho (Figure 5, R2 = 0.001), indicating that the chemical composition of the samples was influenced by terrigenous detrital input [26]. The correlation between Al and ΣREE (Figure 6, R2 = 0.84) further corroborates the presence of terrigenous material input [27].
The Ti content in sediments is used to calculate the amount of terrigenous detritus with the formula: terrigenous (T, %) = (Tisample/Tishale) × 100, where Tishale = 5995 ppm (PAAS) [28]. The T values range widely, from a minimum of 1.5% to a maximum near 70%, with an average of 21.80%. This indicates that terrigenous input in the target section should be considered, as it may exert a dilution effect on organic matter enrichment, leading to a decrease in TOC.

5.2. Paleoproductivity

Paleoproductivity refers to the amount of organic matter produced per unit area and time during a specific geological period. Geochemical indices serve as reliable tools for quantitatively evaluating paleoproductivity [29], with barium (Ba) being a particularly representative element [7,30]. Ba in marine sediments can originate from terrigenous detrital, biogenic, and hydrothermal sources. However, due to the influence of terrigenous detrital components, Ba cannot directly indicate productivity. Thus, it is necessary to remove the terrigenous Ba component. Typically, titanium (Ti) or aluminum (Al), which have a singular terrigenous origin, are used to eliminate the influence of terrigenous detritus [30]. The formula used to calculate the non-terrestrial Ba content is as follows:
w(Banon-terrestrial) = w(Batotal) − w(Titotal) × (w(Batotal)/w(Ti))PAAS
where w(Banon-terrestrial) represents the content of Ba from non-terrestrial sources, w(Batotal) is the total Ba content in sediments, w(Titotal) is the total Ti content, and (w(Batotal)/w(Ti))PAAS is the mid-continental Ba/Ti ratio of the PAAS, which is 0.11. The results indicate that the non-terrestrial Ba content in samples Cam1y-5 to Cam1y-45 ranges from 21.7 to 417.9 μg/g, indicating a higher supply of nutrients.
Moreover, the ratio of Zn/Ti is increasingly recognized as a reliable proxy for paleo-productivity, reflecting nutrient availability and primary productivity in ancient oceans [31]. A higher Zn/Ti ratio is often indicative of nutrient-rich environments conducive to enhanced biological activity. For instance, when the Zn/Ti ratio exceeds 0.2, it typically signals abundant nutrients, favoring biological productivity and organic matter accumulation. This is supported by studies suggesting that elevated Zn concentrations, linked with high productivity zones, correlate well with the growth of primary producers in nutrient-rich marine environments. The results indicate that the Zn/Ti ratio of the tested samples is generally greater than 0.2, with an average value of 0.67 and a maximum value of 1.82, which also reflects that the relevant source rocks are developed in water bodies with sufficient nutrient supply.

5.3. Sedimentary Environment

The sedimentary environment plays a critical role in the enrichment of organic matter. Various geochemical indicators have been proposed to identify the sedimentary environment of organic matter (Table 4) [26,32,33]. In this study, the U/Th ratios range from 7.58 to 73.98 (average 25.84), V/Cr ratios from 1.07 to 11.31 (average 4.73), Ni/Co ratios from 5.67 to 76.11 (average 23.25), and V/(V + Ni) ratios from 0.78 to 1.00 (average 0.94), along with high Mo content and a Ce negative anomaly (δCe < 1). These characteristics suggest that the deposition environment of the samples was an anoxic sulfide-rich environment. The Rb/K ratio, indicative of sedimentary water depth [32], ranges from 11.97 to 36.08, with an average of 23.91. These values are lower than those of the source rocks from the Heituao Formation in semi-deep sea facies deposits on the northeastern margin of Tarim, where the Rb/K ratio ranges from 37.28 to 50.48 (average 44.98). This suggests that the black rock series of the Є1y was deposited in shallower waters than those of the Heituao Formation.
Furthermore, evidence for anoxic, sulfide-rich conditions is supported by our earlier organic geochemistry studies, which identified ATMBs indicative of PZE [24,34,35,36,37,38]. ATMBs are derived from isorenieratene, a pigment in green sulfur bacteria (Chlorobiaceae), and are well-preserved in sediments [38]. These compounds serve as reliable biomarkers for PZE in geological records, as green sulfur bacteria perform anoxygenic photosynthesis in environments where light and hydrogen sulfide (H2S) coexist. The presence of ATMBs indicates H2S was present in the water column during sediment deposition, with light reaching anoxic layers, thereby confirming PZE conditions. This biomarker distinguishes the source rocks of the Є1y from other formations [39] and is prevalent in deep to ultra-deep crude oil deposits in the central, northern, and southwestern Tarim Basin (Figure 7). This suggests that the Є1y source rocks containing these compounds significantly contribute to the deep to ultra-deep oil and gas reserves in the Tarim Basin [10,39,40,41]. Additionally, it indirectly confirms that the Є1y source rocks, although relatively thin (10–15 m), have exceptionally high TOC content (exceeding 20% in this study and reaching 29.8% in the well LT1 [42]), which developed under PZE conditions favorable for organic matter enrichment.

5.4. Hydrothermal Activity

Hydrothermal activity plays a crucial role in the enrichment of organic matter, with REE partition patterns and parameters serving as powerful tools for its investigation. A positive Eu anomaly is widely recognized as a significant indicator of hydrothermal fluid activity, though it is essential to account for false positives caused by Ba [23]. Correlation analysis between δEu and Ba or Al reveals no significant correlation, indicating that the positive Eu anomaly in these samples is not due to terrigenous detrital influence.
Additionally, samples influenced by hydrothermal solutions typically exhibit Fe/Ti ratios greater than 15 [10], and Y/Ho ratios close to modern seawater values (~45). In contrast, samples affected by terrigenous debris show lower Y/Ho ratios (Y/Ho = 28). The Fe/Ti ratio of the studied samples ranges from 8.50 to 68.25 (average 32.14), and Y/Ho from 39.7 to 54.2 (average 45.0), indicating the influence of hydrothermal activity. Analysis of samples Cam1y-5 to Cam1y-45 shows that non-continental Ba content varies from 21.7 to 417.9 μg/g, with a significant correlation with δEu (Figure 8a, R2 = 0.53). Using Al as a control index for terrigenous detritus yields similar results (Figure 8b, R2 = 0.53). These findings suggest that hydrothermal activity enhanced paleoproductivity. Additionally, correlations between δEu and V/Cr or Ni/Co (Figure 9, R2 = 0.49 and 0.48, respectively) indicate that hydrothermal fluids influenced the preservation environment of organic matter, though their contribution to paleoproductivity was more significant. This is consistent with the conclusions drawn from previous mercury isotope analyses [43].

5.5. Organic Matter Enrichment Mechanism

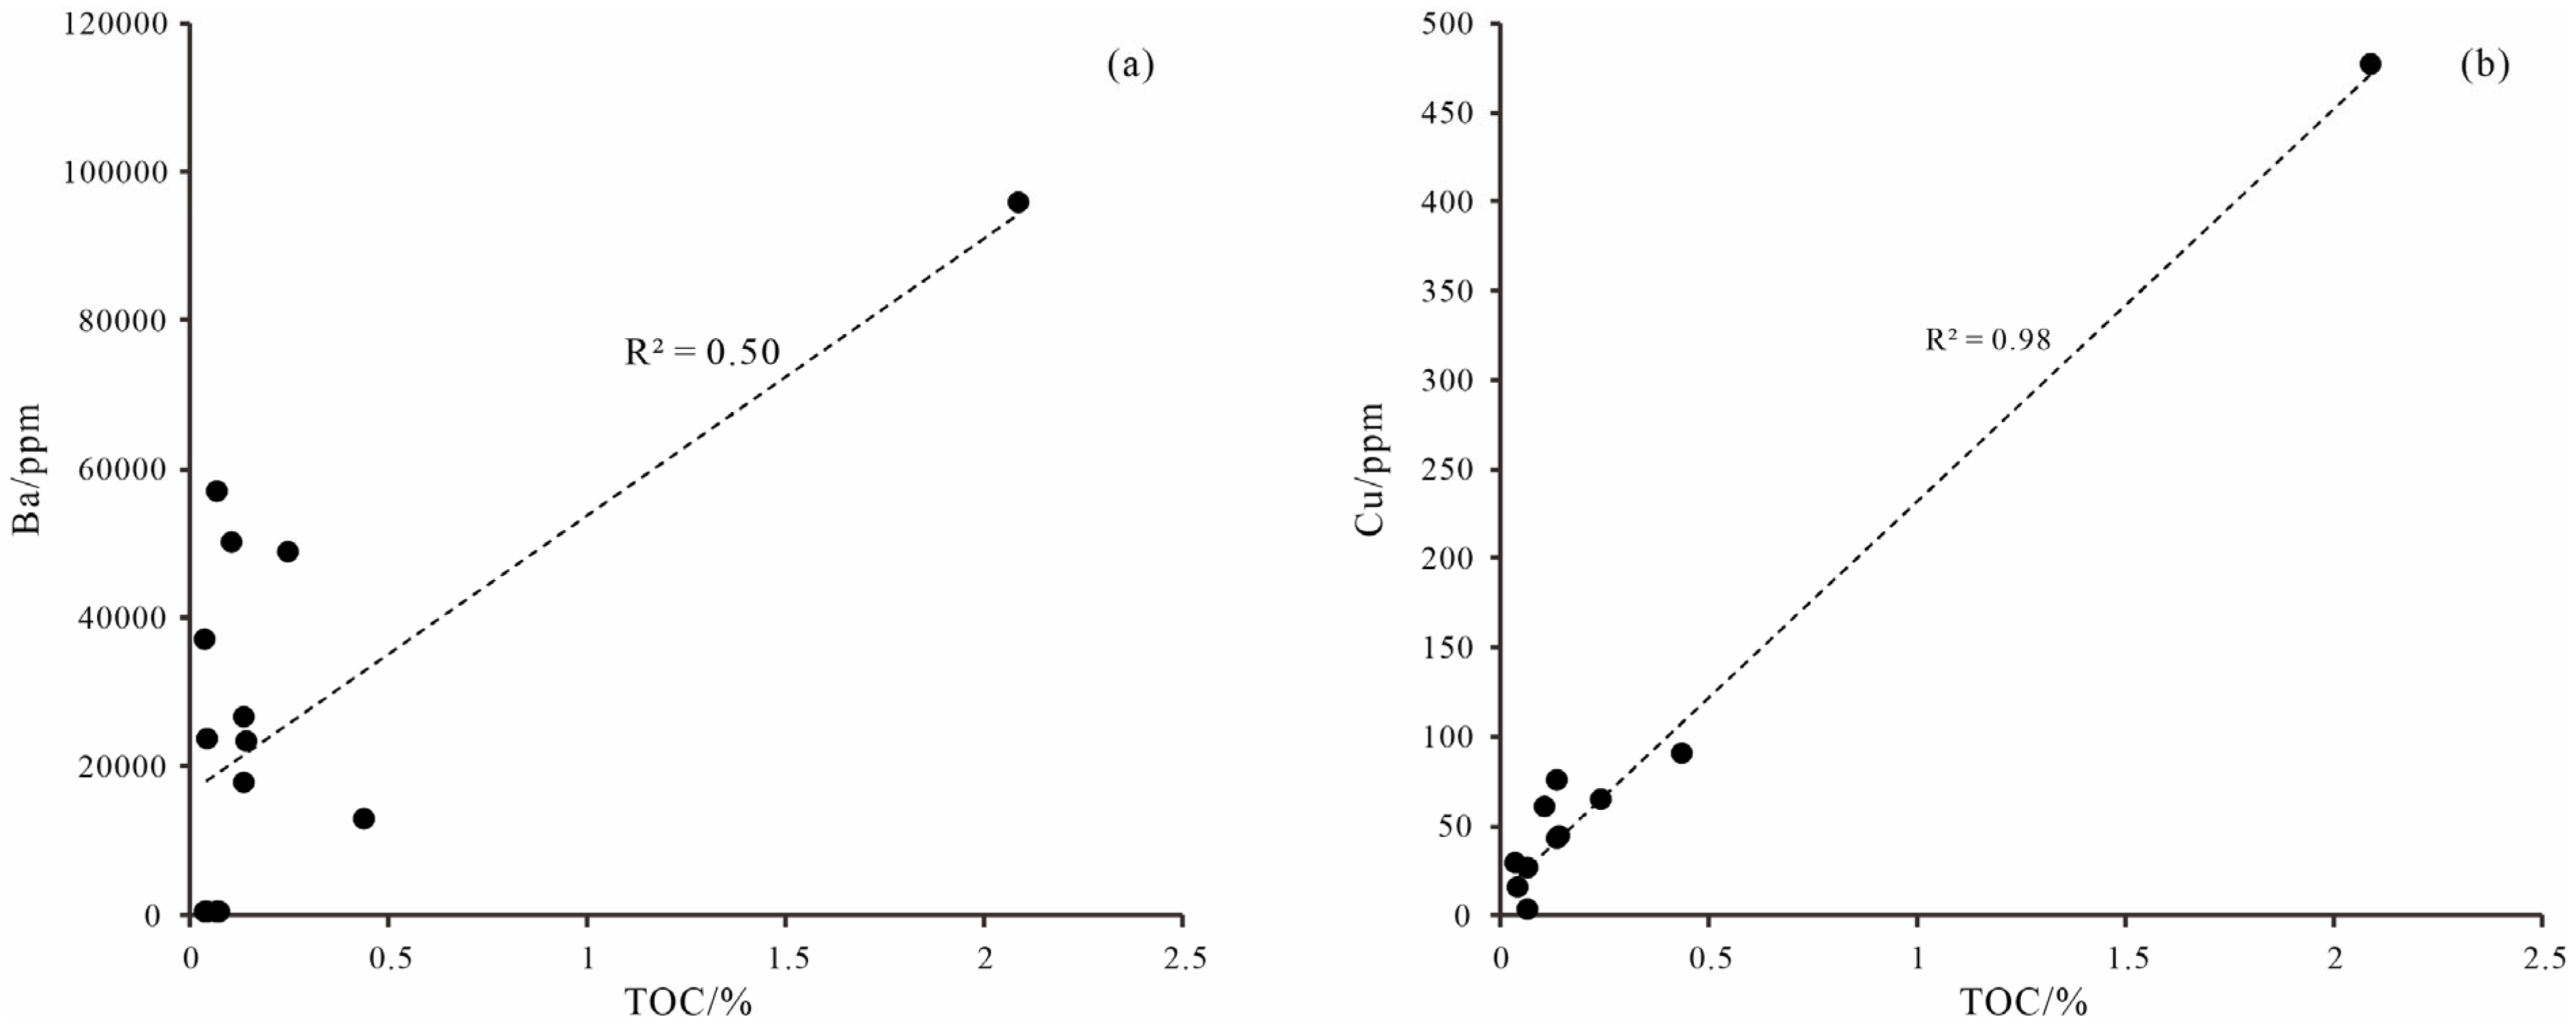
Two primary models for source rock development include the preservation model, which emphasizes an anoxic environment, and the productivity model, which highlights high paleoproductivity. The prevailing model is still debated [9]. A pioneering study [44] analyzed and summarized the Cd/Mo ratio across various marine basins with different retention degrees, establishing 0.1 as the threshold between the two models. When Cd/Mo > 0.1, organic matter enrichment is dominated by high productivity; when Cd/Mo < 0.1, an anoxic preservation environment prevails. The Cd/Mo ratio in most samples from this study exceeds 0.1, with only two samples falling below this threshold, indicating that paleoproductivity primarily governs organic matter enrichment. Furthermore, analysis of the relationship between TOC and paleoproductivity indicators Ba and Cu, as well as preservation environment indicators V/Cr and Ni/V, shows a strong correlation with paleoproductivity indicators Ba and Cu (R2 = 0.50 and 0.98, respectively) (Figure 10) and a weak correlation with preservation environment indicators V/Cr and Ni/V (R2 = 0.01 and 0.03, respectively). This further supports the conclusion that paleoproductivity, with hydrothermal activity playing a significant role, is the dominant mechanism for organic matter enrichment in the Є1y in the Keping area.
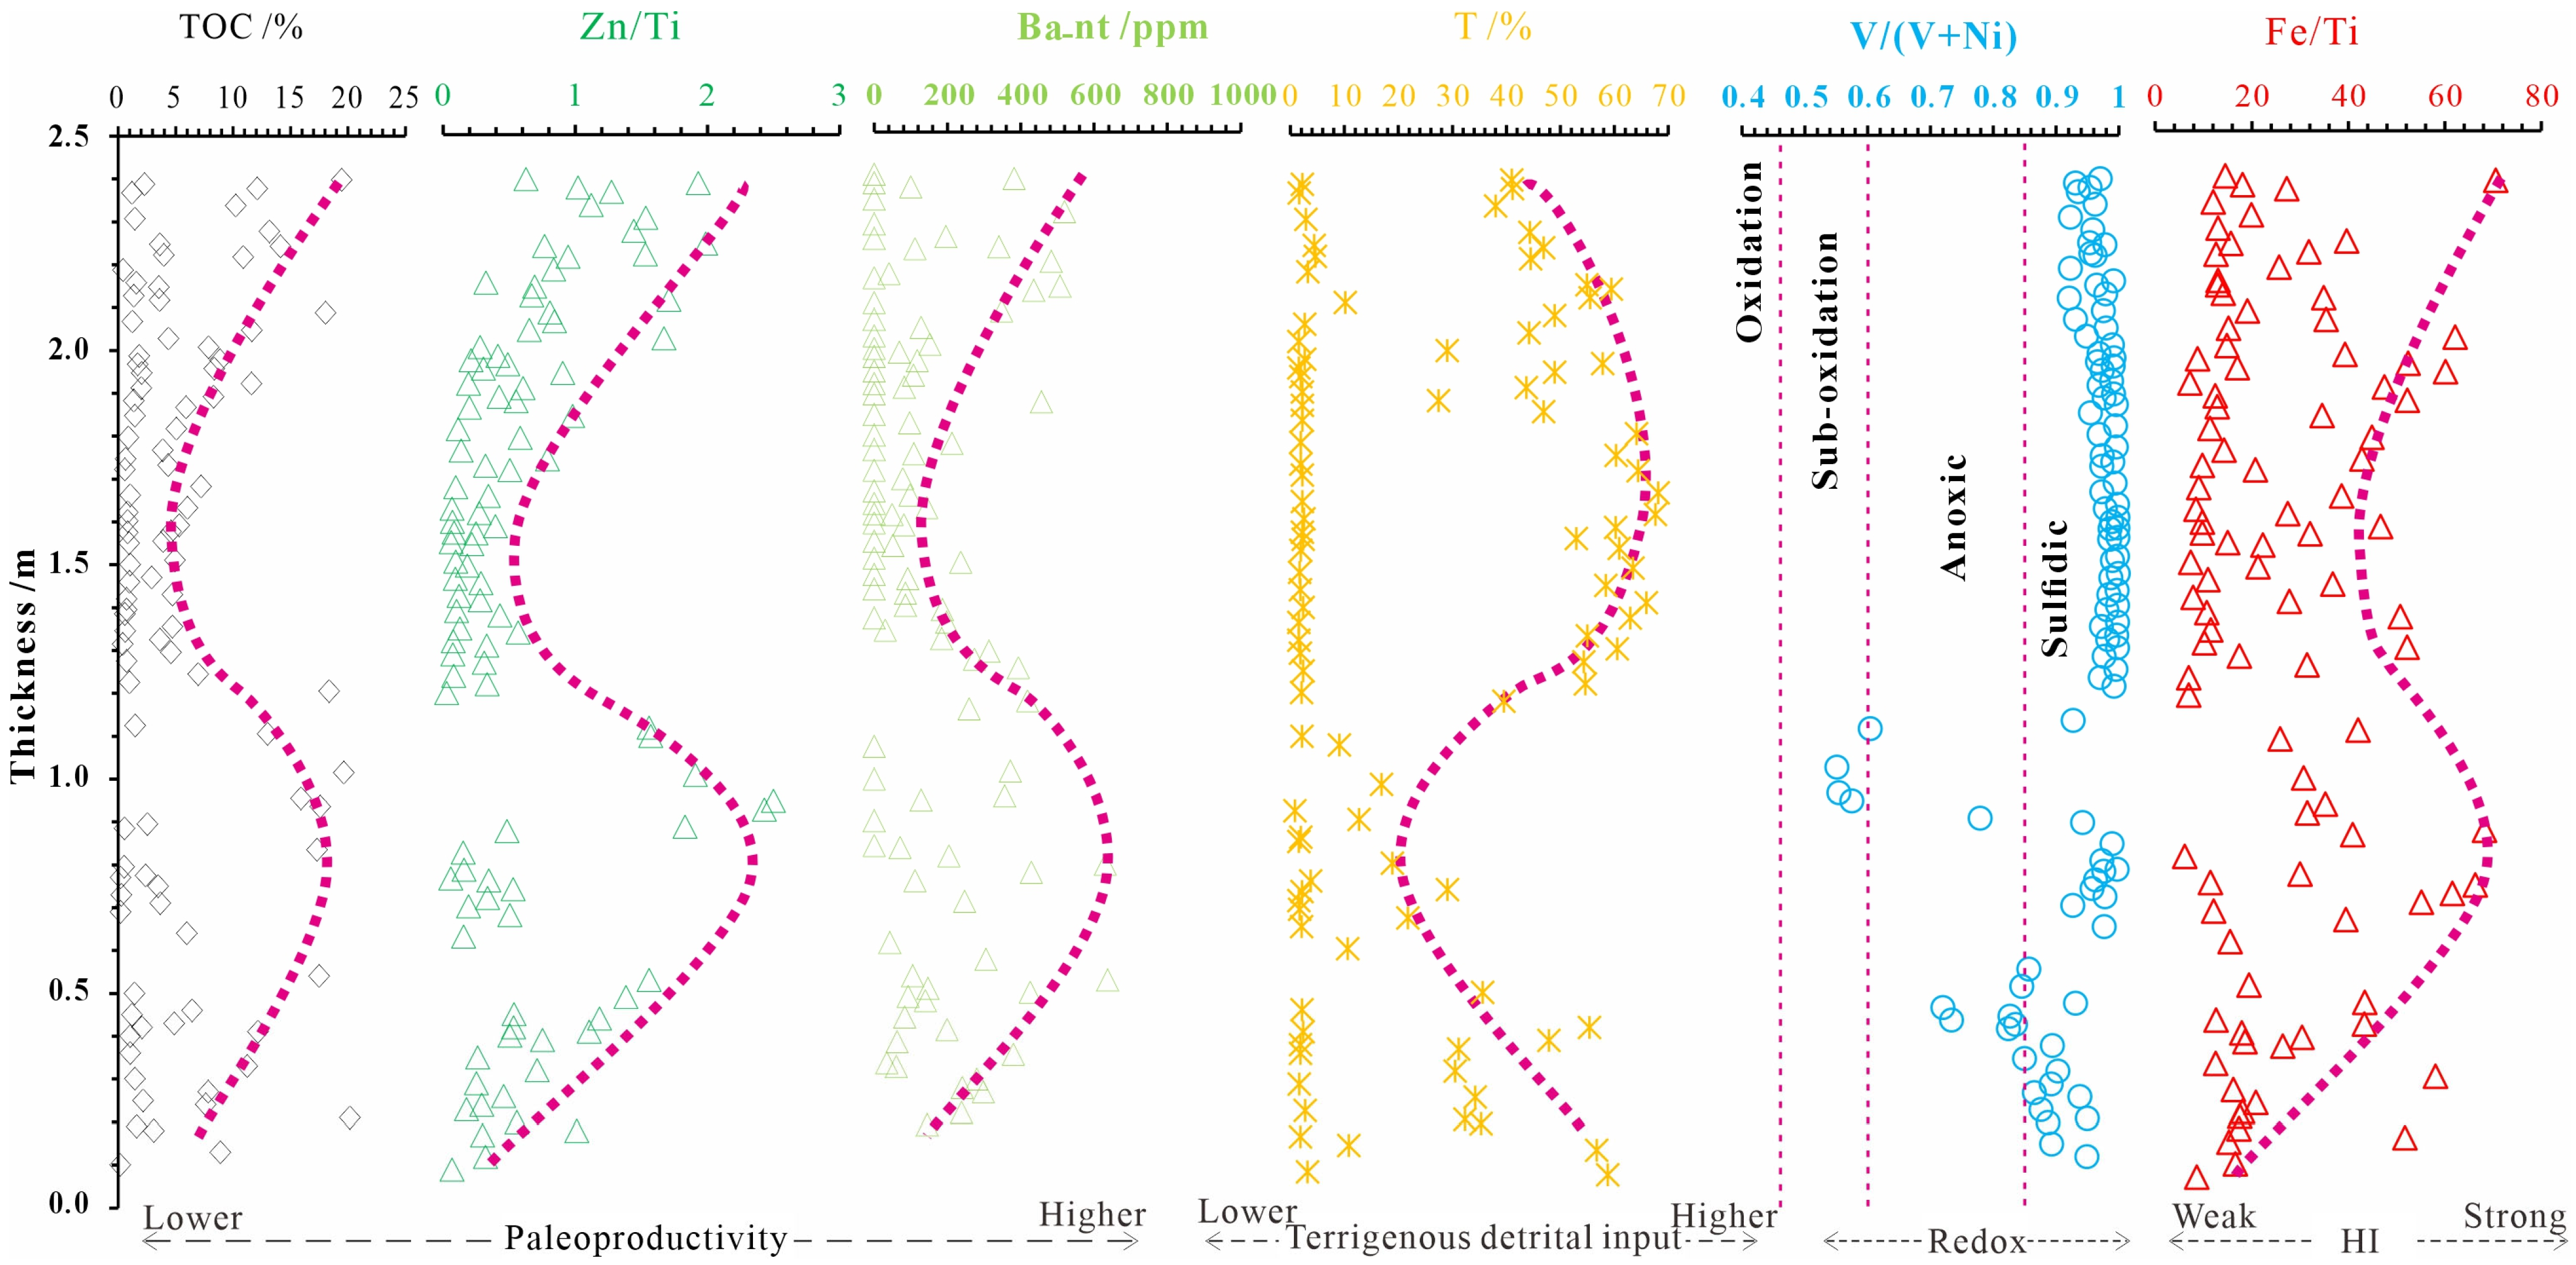
The presented composite bar chart (Figure 11) summarizes the high-resolution geochemical data from 100 densely sampled points across a 2.4 m thick siliceous rock layer, which includes both siliceous rocks and siliceous shale interlayers. The chart highlights key geochemical trends that reveal the mechanisms behind organic matter enrichment in the study area. From the bottom to the top of the section, Total Organic Carbon (TOC) displays two prominent features. First, the siliceous rocks are characterized by low organic matter content, with TOC generally less than 2%. In contrast, the siliceous shale interlayers, located in the middle of the siliceous rocks, exhibit much higher TOC values, with some reaching over 20%. The siliceous shale interlayers show two distinct high TOC intervals: one in the lower section (0 to 1.4 m) and another in the upper section (1.4 to 2.4 m). TOC increases at the bottom, decreases in the middle, and then increases again towards the top, which corresponds well with ancient environmental conditions and hydrothermal events.
As TOC increases, several other key geochemical parameters show parallel trends: (1) nutrient elements (Zn/Ti and w(Banon-terrestrial)): these indicators also exhibit an increasing trend, suggesting that the rise in TOC is significantly influenced by paleoproductivity; terrigenous detrital input; conversely, parameters related to terrigenous input (T) show a decreasing trend, implying that the organic matter enrichment might have been subject to dilution effects from terrigenous sources; (2) V/(V + Ni) ratio: this ratio is consistently greater than 0.85, indicating a sulfur-deficient anoxic environment, which is highly favorable for the preservation of organic matter; (3) hydrothermal activity intensity (Fe/Ti): the Fe/Ti ratio also increases, indicating stronger hydrothermal activity, which further suggests that hydrothermal processes played a significant role in the organic matter enrichment of the siliceous shale.
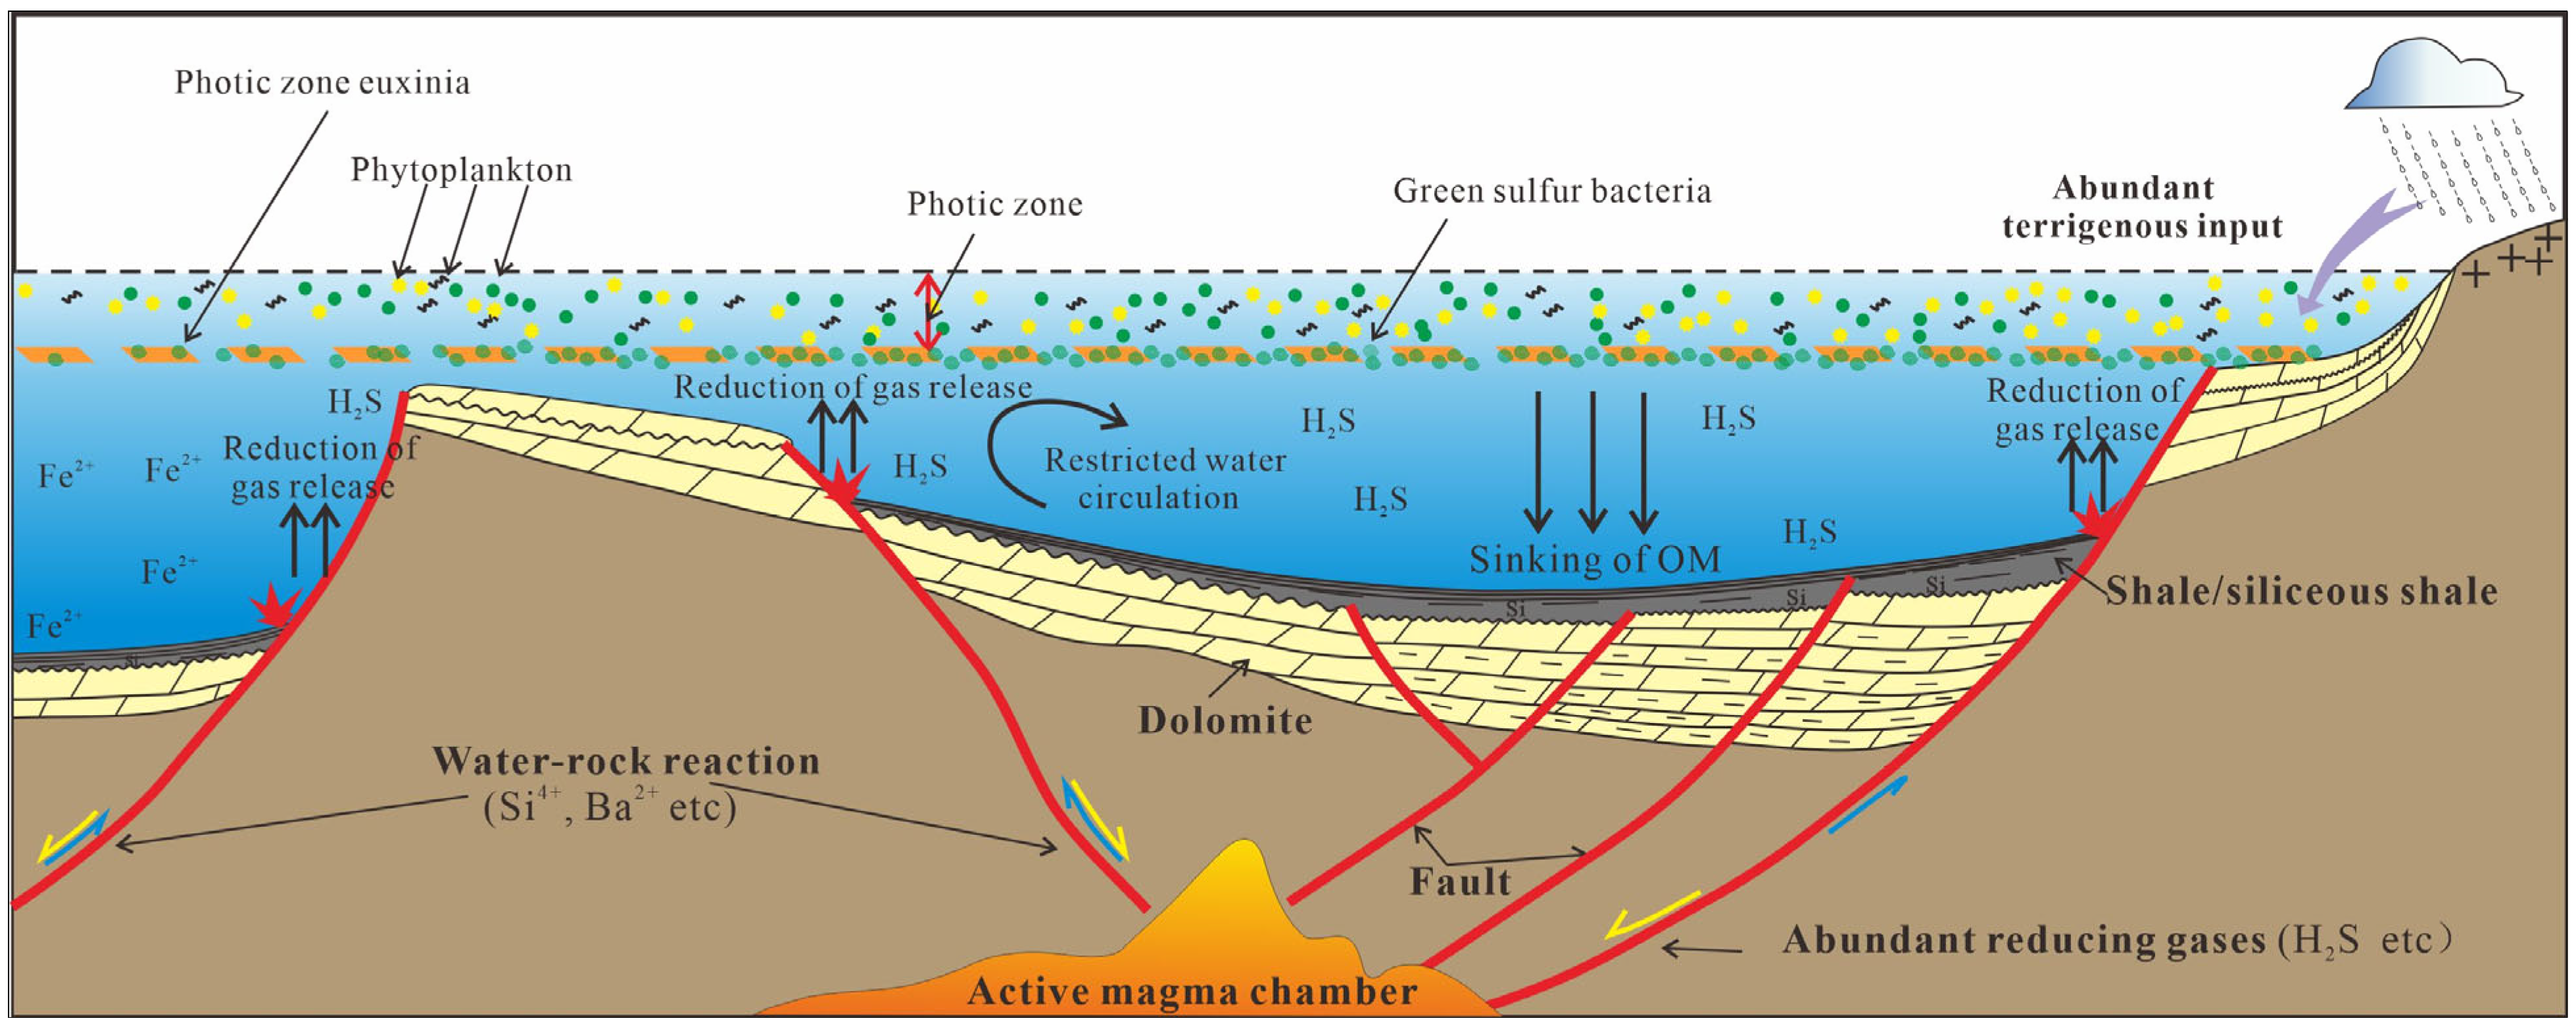
Thus, the organic matter enrichment mechanism in the siliceous shale can be inferred as follows: Hydrothermal activity induced a sulfur-deficient anoxic environment, which facilitated the preservation of organic matter. The nutrients brought by hydrothermal fluids enhanced ancient productivity, while the increased input of hydrothermal substances relative to terrigenous material led to a reduction in the terrigenous dilution effect. As a result, hydrothermal activity created an optimal environment for organic matter accumulation by promoting a coupling of high ancient productivity, sulfur-deficient anoxia, and low terrigenous dilution. This triple coupling mechanism ultimately contributed to the high organic matter content observed in the siliceous shale, with TOC values exceeding 20%.

5.6. Depositional Model

The Th/U ratio (<0.1) of the studied samples is significantly lower than that observed in previous studies, indicating the incorporation of deep-sea materials during the deposition of siliceous rocks [10]. The Cambrian sedimentary environment in Wells Yingdong 2, Tadong 1, and Tadong 2 was characterized by anoxic conditions and high gamma-ray anomalies, with barite nodules observed in the Keping fault uplift [20], suggesting the presence of upwelling currents. Siliceous rocks of hydrothermal origin were deposited not only in the northwest platform, which was characterized by shallow water and gentle slopes, but also in the northeast basin in a deep-water sedimentary environment. This suggests that the Tarim block experienced extensive fracturing during the Early Cambrian, allowing hydrothermal fluids to erupt along these fractures and contemporaneous faults [43]. These hydrothermal fluids introduced reducing gases (H2, CH4, H2S, etc.) into the water, creating anoxic stratification that facilitated the preservation of organic matter. They also transported large quantities of metals and essential elements for life, promoting the growth of thermophilic communities. However, excessive hydrothermal H2S could lead to the poisoning of deep-water fauna and flora, accelerating the death of marine organisms and enhancing paleoproductivity. The trace elements introduced by these fluids also increased the rate and extent of organic matter decomposition during subsequent evolutionary processes, catalyzing hydrocarbon generation in source rocks [45]. Hydrothermal activity played a significant catalytic role in enhancing paleoproductivity, preserving and generating organic matter, and developing source rocks in the Early Cambrian Tarim block. Thus, combined with the exploration of the organic matter enrichment mechanism in Section 5.5. Organic matter enrichment mechanism, a developmental model of the Early Cambrian source rock was established (Figure 12).

6. Conclusions

(1)
The Є1y Formation exhibits notable geochemical signatures, including elevated concentrations of Mo, Ba, and U, and a ΣREE of 155.75 μg/g, with a strong enrichment of light rare earth elements (LREE/HREE = 1.74–5.57), moderate Ce negative anomaly (δCe = 0.4–0.71), and a significant Eu positive anomaly (δEu = 0.94–2.14), indicating a unique depositional environment influenced by hydrothermal processes;
(2)
Geochemical parameters, including trace element and rare earth element distributions, point to the deposition of the Є1y black shales in a highly reducing, anoxic, and sulfide-rich environment, which was conducive to organic matter preservation and enhanced sedimentary productivity;
(3)
The presence of hydrothermal trace elements, introduced via hydrothermal fluids, suggests a critical role in enriching the sedimentary system, preserving organic matter, and boosting the overall paleoproductivity in the shallow marine environment of the Tarim Basin during the Early Cambrian;
(4)
Hydrothermal fluids, likely emanating from volcanic activities along fractures and faults during the Early Cambrian, were instrumental in enhancing marine primary productivity, fostering the accumulation of organic matter, and contributing to the formation of high-quality source rocks in the Є1y Formation. The organic matter enrichment model has been established;
(5)
The integrated geochemical findings suggest that the Early Cambrian period in the Tarim Basin experienced a dynamic interplay between hydrothermal influences and organic productivity, laying the foundation for significant oil and gas reserves in the deep and ultra-deep strata of the basin.

Author Contributions

Conceptualization and writing—original draft, W.C.; funding acquisition and writing—original draft, T.H.; supervision and resources, C.S.; writing—review and editing, R.W.; methodology and formal analysis, J.H. and Q.Z.; visualization, H.T.; data curation and formal analysis, Y.Z.; software and visualization, J.Z. and Y.Y.; and investigation and software, J.L. All authors have read and agreed to the published version of the manuscript.

Funding

This research was funded by the Major Science and Technology Special Project of China National Petroleum Corporation “Research on Increasing Storage and Production of Marine Carbonate Rock Oil and Gas and Exploration and Development Technology” (No. 2023ZZ16YJ01) and the Open Fund of Key Laboratory of Exploration Technologies for Oil and Gas Resources (Yangtze University), Ministry of Education (NO. K202307).

Data Availability Statement

The data that support the findings of this study are available from the corresponding author upon reasonable request.

Conflicts of Interest

Authors W.C., C.S., H.T., J.Z., J.L. and Y.Y. were employed by the Research Institute of Petroleum Exploration and Development, Tarim Oilfield Company; author W.C., C.S., H.T. and J.Z. was employed by the company R&D Center for Ultra-Deep Complex Reservoir Exploration and Development, China National Petroleum Corporation; author W.C. and C.S. was employed by the company Key Laboratory of Gas Reservoir Formation and Development, China National Petroleum Corporation; author R.W. was employed by the Sinopec Petroleum Exploration and Production Research Institute; and author J.L. was employed by the company Exploration and Development Research Institute, PetroChina Daqing Oilfield Company Ltd. The remaining authors declare that the research was conducted in the absence of any commercial or financial relationships that could be construed as a potential conflict of interest.

References

  1. Goldberg, T.; Poulton, S.W.; Strauss, H. Sulphur and oxygen isotope signatures of late Neoproterozoic to early Cambrian sulphate, Yangtze Platform, China: Diagenetic constraints and seawater evolution. Precambrian Res. 2005, 137, 223–241. [Google Scholar] [CrossRef]
  2. Wang, J.; Chen, D.; Yan, D.; Wei, H.; Xiang, L. Evolution from an anoxic to oxic deep ocean during the Ediacaran–Cambrian transition and implications for bioradiation. Chem. Geol. 2012, 306–307, 129–138. [Google Scholar] [CrossRef]
  3. Fike, D.A.; Grotzinger, J.P.; Pratt, L.M.; Summons, R.E. Multi-stage Ediacaran ocean oxidation and its impact on evolutionary radiation. Geochim. Cosmochim. Acta 2006, 70, A173. [Google Scholar] [CrossRef]
  4. Chen, J.; Xu, J.; Wang, J.; Liu, P.; Chen, F.; Li, M. Paleo-environmental variation and its control on organic matter enrichment in the black rock series, Cambrian Yuertusi Formation in the northwestern Tarim Basin. Earth Sci. Front. 2023, 30, 150–161, (In Chinese with English abstract). [Google Scholar]
  5. Zhu, G.; Chen, F.; Chen, Z.; Zhang, Y.; Xing, X.; Tao, X.; Ma, D. Discovery and basic characteristics of high-quality source rocks found in the Yuertusi Formation of the Cambrian in Tarim Basin, China. J. Nat. Gas Geosci. 2016, 1, 21–33. [Google Scholar] [CrossRef]
  6. Zhu, G.; Zhang, Z.; Zhou, X.; Li, T.; Han, J.; Sun, C. The complexity, secondary geochemical process, genetic mechanism and distribution prediction of deep marine oil and gas in the Tarim Basin, China. Earth Sci. Rev. 2019, 198, 102930. [Google Scholar] [CrossRef]
  7. Zhang, C.; Guan, S.; Wu, L.; Ren, R.; Wang, L.; Wu, X. Depositional environments of early Cambrian marine shale, northwestern Tarim Basin, China: Implications for organic matter accumulation. J. Petrol. Sci. Eng. 2020, 194, 107497. [Google Scholar] [CrossRef]
  8. Li, W.; Wang, J.; Jia, C.; Lu, S.; Li, J.; Zhang, P.; Wei, Y.; Song, Z.; Chen, G.; Zhou, N. Carbon isotope fractionation during methane transport through tight sedimentary rocks: Phenomena, mechanisms, characterization, and implications. Geosci. Front. 2024, 15, 101912. [Google Scholar] [CrossRef]
  9. Wang, X.; Zhang, S.; He, K.; Wang, H.; Mi, J.; Su, J.; Ye, Y. OMZ and euxinic sulfidic environments dominating hydrocarbon generation poential of organic matter1.4 billion years ago. Chin. Sci. Bull. 2021, 66, 3005–3017. [Google Scholar] [CrossRef]
  10. He, T.; Li, W.; Lu, S.; Pan, W.; Ying, J.; Zhu, P.; Yang, E.; Wang, X.; Zhang, B.; Sun, D. Mechanism and geological significance of anomalous negative δ13Ckerogen in the Lower Cambrian, NW Tarim Basin, China. J. Petrol. Sci. Eng. 2022, 208, 109384. [Google Scholar] [CrossRef]
  11. Li, Y.; Xiong, Y.; Liang, Q.; Fang, C.; Chen, Y.; Wang, X.; Liao, Z.; Peng, P.A. The application of diamondoid indices in the Tarim oils. AAPG Bull. 2018, 102, 267–291. [Google Scholar] [CrossRef]
  12. Tribovillard, N.; Algeo, T.; Lyons, T.; Riboulleau, A. Trace metals as paleoredox and paleoproductivity proxies: An update. Chem. Geol. 2006, 232, 12–32. [Google Scholar] [CrossRef]
  13. Mansour, A.; Wagreich, M.; Gentzis, T.; Ocubalidet, S.; Tahoun, S.; Elewa, A. Depositional and organic carbon-controlled regimes during the Coniacian-Santonian event: First results from the southern Tethys (Egypt). Mar. Petrol. Geol. 2020, 115, 104285. [Google Scholar] [CrossRef]
  14. Mansour, A.; Wagreich, M. Earth system changes during the cooling greenhouse phase of the Late Cretaceous: Coniacian-Santonian OAE3 subevents and fundamental variations in organic carbon deposition. Earth-Sci. Rev. 2022, 229, 104022. [Google Scholar] [CrossRef]
  15. Tyson, R. Sedimentation rate, dilution, preservation and total organic carbon: Some results of a modelling study. Org. Geochem. 2001, 32, 333–339. [Google Scholar] [CrossRef]
  16. Liu, J.; Liu, Q.; Zhu, D.; Meng, Q.; Liu, W.; Qiu, D.; Huang, Z. The role of deep fluid in the formation of organic-rich source rocks. J. Nat. Gas Geosci. 2018, 3, 171–180. [Google Scholar] [CrossRef]
  17. Zhang, B.; Zhang, S.; Bian, L.; Jin, Z.; Wang, D. Developmental modes of the Neoproterozoic-Lower Paleozoic marine hydrocarbon source rocks in China. Chin. Sci. Bull. 2007, 52, 77–91. [Google Scholar] [CrossRef]
  18. Gao, Z.; Shi, J.; Lv, J.; Chang, Z. High-frequency sequences, geochemical characteristics, formations, and distribution predictions of the lower Cambrian Yuertusi Formation in the Tarim Basin. Mar. Petrol. Geol. 2022, 146, 105966. [Google Scholar] [CrossRef]
  19. Zhou, L.; Algeo, T.J.; Shen, J.; Hu, Z.; Gong, H.; Xie, S.; Huang, J.; Gao, S. Changes in marine productivity and redox conditions during the Late Ordovician Hirnantian glaciation. Palaeogeogr. Palaeoclimatol. Palaeoecol. 2015, 420, 223–234. [Google Scholar] [CrossRef]
  20. Zhou, X.; Chen, D.; Dong, S.; Zhang, Y.; Guo, Z.; Wei, H.; Yu, H. Diagenetic barite deposits in the Yurtus Formation in Tarim Basin, NW China: Implications for barium and sulfur cycling in the earliest Cambrian. Precambrian Res. 2015, 263, 79–87. [Google Scholar] [CrossRef]
  21. Zhang, S.; Wang, X.; Hammarlund, E.; Wang, H.; Costa, M.; Bjerrum, C.; Connelly, J.; Zhang, B.; Bian, L.; Canfield, D.E. Orbital forcing of climate 1.4 billion years ago. Proc. Natl. Acad. Sci. USA 2015, 112, E1406–E1413. [Google Scholar] [CrossRef] [PubMed]
  22. Wang, X.; Zhao, W.; Zhang, S.; Wang, H.; Su, J.; Canfield, D.E.; Hammarlund, E.U. The aerobic diagenesis of Mesoproterozoic organic matter. Sci. Rep. 2018, 8, 13324. [Google Scholar] [CrossRef] [PubMed]
  23. Taylor, S.R.; McClennan, S.M. The Continental Crust: Its Composition and Evolution; Blackwell Scientific Publications: Oxford, UK, 1985; Volume 21, p. 312. [Google Scholar]
  24. He, T.; Lu, S.; Li, W.; Sun, D.; Pan, W.; Zhang, B.; Tan, Z.; Ying, J. Paleoweathering, hydrothermal activity and organic matter enrichment during the formation of earliest Cambrian black strata in the northwest Tarim Basin, China. J. Petrol. Sci. Eng. 2020, 189, 106987. [Google Scholar] [CrossRef]
  25. Xu, L.; Lehmann, B.; Zhang, X.; Zheng, W.; Meng, Q. Trace element distribution in black shales from the Kunyang phosphorite deposit and its geological significances. Acta Petrol. Sin. 2014, 30, 1817–1827, (In Chinese with English abstract). [Google Scholar]
  26. Goldberg, E.D.; Arrhenius, G. Chemistry of Pacific pelagic sediments. Geochim. Cosmochim. Act. 1958, 13, 153–212. [Google Scholar] [CrossRef]
  27. Zhou, X.; Chen, D.; Qing, H.; Qian, Y.; Wang, D. Submarine silica-rich hydrothermal activity during the earliest Cambrian in the Tarim Basin, northwest China. Int. Geol. Rev. 2014, 56, 1906–1918. [Google Scholar] [CrossRef]
  28. Li, W.; Lu, S.; Tan, Z.; He, T. Lacustrine Source Rock Deposition in Response to Coevolution of the Paleoenvironment and Formation Mechanism of Organic-Rich Shales in the Biyang Depression, Nanxiang Basin. Energy Fuels 2017, 31, 13519–13527. [Google Scholar] [CrossRef]
  29. Rahman, S.; Henderson, G.M.; Rickaby, R.E.M. Biogenic barium as a productivity proxy in the South Pacific Ocean. Paleoceanogr. Paleoclimatol. 2022, 37, e2021PA004291. [Google Scholar]
  30. Zhu, G.; Wang, P.; Li, T.; Zhao, K.; Yan, H.; Li, J.; Zhou, L. Nitrogen geochemistry and abnormal mercury enrichment of shales from the lowermost Cambrian Niutitang Formation in South China: Implications for the marine redox conditions and hydrothermal activity. Global Planet. Change 2021, 199, 103449. [Google Scholar] [CrossRef]
  31. Moghaddam, M.; Hadavi, F. Changes in productivity in the boundary between Abderaz and Abtalkh Formations (East Kopet Dagh, NE Iran) evidenced by calcareous nannofossils and elements (Zn, Cu, Cd, Pb and CaCO3). Arab. J. Geosci. 2014, 7, 5309–5320. [Google Scholar] [CrossRef]
  32. Algeo, T.J.; Maynard, J.B. Trace-element behavior and redox facies in core shales of Upper Pennsylvanian Kansas-type cyclothems. Chem. Geol. 2004, 206, 289–318. [Google Scholar] [CrossRef]
  33. Algeo, T.J.; Hinnov, L.; Moser, J.; Maynard, J.B.; Elswick, E.; Kuwahara, K.; Sano, H. Changes in productivity and redox conditions in the Panthalassic Ocean during the latest Permian. Geology 2010, 38, 187–190. [Google Scholar] [CrossRef]
  34. He, T.; Zeng, Q.; Lu, S.; Li, W.; Li, M.; Wen, Z.; Yang, E.; Jing, T.; Ying, J.; Zhu, P.; et al. Aryl isoprenoids from the Lower Paleozoic in the Tarim Basin, NW China: Insight into deep ancient hydrocarbon exploration. Geoenergy Sci. Eng. 2023, 225, 211666. [Google Scholar] [CrossRef]
  35. He, T.; Li, W.; Lu, S.; Yang, E.; Jing, T.; Ying, J.; Zhu, P.; Wang, X.; Pan, W.; Chen, Z. Distribution and isotopic signature of 2-alkyl-1,3,4-trimethylbenzenes in the Lower Paleozoic source rocks and oils of Tarim Basin: Implications for the oil-source correlation. Petrol. Sci. 2022, 19, 2572–2582. [Google Scholar] [CrossRef]
  36. Connock, G.T.; Nguyen, T.X.; Philip, R.P. The development and extent of photic-zone euxinia concomitant with Woodford Shale deposition. AAPG Bull. 2018, 102, 959–986. [Google Scholar] [CrossRef]
  37. Hays, L.; Beatty, T.; Henderson, C.; Love, G.; Summons, R. Evidence for photic zone euxinia through the end-Permian mass extinction in the Panthalassic Ocean (Peace River Basin, Western Canada). Palaeoworld 2007, 16, 39–50. [Google Scholar] [CrossRef]
  38. Schwark, L.; Frimmel, A. Chemostratigraphy of the Posidonia Black Shale, SW-Germany: II. Assessment of extent and persistence of photic-zone anoxia using aryl isoprenoid distributions. Chem. Geol. 2004, 206, 231–248. [Google Scholar] [CrossRef]
  39. Xu, J.; He, T.; Zeng, Q.; Zhao, Y.; Wen, Z. Compound-Specific C/H Isotopic Signature of Ultra-Deep Hydrocarbon Fluids from the Shuntuoguole Area in the Tarim Basin, Northwestern China. Energies 2024, 17, 1211. [Google Scholar] [CrossRef]
  40. He, T.; Li, W.; Lu, S.; Yang, E.; Jing, T.; Ying, J.; Zhu, P.; Wang, X.; Pan, W.; Zhang, B.; et al. Quantitatively unmixing method for complex mixed oil based on its fractions carbon isotopes: A case from the Tarim Basin, NW China. Petrol. Sci. 2023, 20, 102–113. [Google Scholar] [CrossRef]
  41. Sun, Y.; Xu, S.; Lu, H.; Cuai, P. Source facies of the Paleozoic petroleum systems in the Tabei uplift, Tarim Basin, NW China: Implications from aryl isoprenoids in crude oils. Org. Geochem. 2003, 34, 629–634. [Google Scholar] [CrossRef]
  42. Zhu, G.; Milkov, A.V.; Li, J.; Xue, N.; Chen, Y.; Hu, J.; Li, T.; Zhang, Z.; Chen, Z. Deepest oil in Asia: Characteristics of petroleum system in the Tarim basin, China. J. Petrol. Sci. Eng. 2021, 199, 108246. [Google Scholar] [CrossRef]
  43. Zhao, K.; Zhu, G.; Meng, X.; Yan, H.; Li, T.; Wang, P. Enrichment of mercury in the Lower Cambrian sedimentary successions by submarine hydrothermal venting. J. Asian Earth Sci. 2022, 240, 105439. [Google Scholar] [CrossRef]
  44. Sweere, T.; van den Boorn, S.; Dickson, A.J.; Reichart, G.-J. Definition of new trace-metal proxies for the controls on organic matter enrichment in marine sediments based on Mn, Co, Mo and Cd concentrations. Chem. Geol. 2016, 441, 235–245. [Google Scholar] [CrossRef]
  45. Jin, Z.; Yang, L.; Zeng, J.; Zhang, L. Deep fluid activitities and their effects on generation of hydrocarbon in Dongying depression. Pet. Explor. Dev. 2002, 2, 42–44. [Google Scholar]
Figure 2. Tectonic unit of Tarim Basin and geological profile location of cement plant.
Minerals 15 00288 g002
Figure 3. Normalized distribution of REE, normalized value after PAAS. Serial numbers 1–20 in the figure represent samples Cam1y-5, Cam1y-10, …, Cam1y-95, Cam1y-100.
Minerals 15 00288 g003
Figure 4. Identification of ATMB (ac) and their precursor’s habitats (d) [10]. (a), GC-MS of ATMB; (b,c), mass spectrogram of ATMB with C14 and C16; (d), habitats of green sulfur bacteria).
Minerals 15 00288 g004
Figure 5. The correlation graph of Th with Al2O3, Ti and Y/Ho.
Minerals 15 00288 g005
Figure 6. The correlation graph of Al2O3 with ΣREE.
Minerals 15 00288 g006
Figure 7. Partial mass chromatograms of ATMBs for typical Cam1y source rocks and crude oil in the Tarim Basin [10]. ((a), mass chromatograms of ATMBs for Cam1y-90 source rocks; (bd), mass chromatograms of ATMBs for oils from wells of TZ12, YM2, and Ma4).
Minerals 15 00288 g007
Figure 8. The correlation graph of δEu with Banon-continental. ((a), correlation graph of δEu with Banon-continental(Ti); (b), correlation graph of δEu with Banon-continental(Al)).
Minerals 15 00288 g008
Figure 9. The correlation graph of δEu with V/Cr and Ni/Co. (a), the correlation graph of δEu with V/Cr; (b), the correlation graph of δEu with and Ni/Co.
Minerals 15 00288 g009
Figure 10. The correlation graph of TOC and paleoproductivity indicators Ba and Cu in the Keping area. (a), the correlation graph of TOC and Ba; (b), the correlation graph of TOC and Cu).
Minerals 15 00288 g010
Figure 11. Geochemical composite profile of the black rock series in the Lower Cambrian Yuertusi Formation (Ba-nt.: w(Banon-terrestrial); T: terrigenous (%) = (Tisample/Tishale) × 100 (PAAS with Tishale = 5995 ppm); HI: Hydrothermal intensity).
Minerals 15 00288 g011
Figure 12. Developmental model of the Early Cambrian source rock, NW Tarim Basin.
Minerals 15 00288 g012
Table 1. Major elements (%) of geological profile samples near the Aksu area in the Tarim Basin.
NumberIntervalHorizonLithologySiO2
/%
Al2O3
/%
Fe2O3
/%
MgO
/%
CaO
/%
MnO
/%
TiO2
/%
P2O5
/%
LOI
/%
FeO
/%
TOC
/%
Cam1y-50.21Є1ySiliceous shale93.090.5390.1460.4261.21-0.0180.4513.870.1120.18
Cam1y-100.33Є1ySiliceous shale95.560.3870.4080.1310.177-0.0160.0193.080.3511.25
Cam1y-150.43Є1ySiliceous rock54.729.197.461.372.060.0050.5381.0315.240.724.87
Cam1y-200.64Є1ySiliceous shale83.612.040.7580.3580.452-0.1060.20810.710.595.96
Cam1y-250.77Є1ySiliceous rock96.130.4260.6180.1150.328-0.0210.1731.820.520.2
Cam1y-300.895Є1ySiliceous shale88.380.4490.5680.9932.010.0060.0190.0686.60.492.54
Cam1y-351.125Є1ySiliceous rock92.720.3990.5010.0690.752-0.0210.0294.760.431.49
Cam1y-401.295Є1ySiliceous shale48.418.046.311.61.26-0.5431.122.251.634.6
Cam1y-451.385Є1ySiliceous rock96.320.2610.4120.0660.112-0.0150.0652.040.360.58
Cam1y-501.47Є1ySiliceous shale37.018.674.431.715.60.0040.5842.0925.030.952.93
Cam1y-551.575Є1ySiliceous rock96.160.4620.3220.0870.126-0.0230.0642.40.280.85
Cam1y-601.632Є1ySiliceous shale51.9510.913.581.60.662-0.6761.518.851.216.04
Cam1y-651.747Є1ySiliceous rock96.420.3750.3650.0640.193-0.0190.0662.260.30.64
Cam1y-701.867Є1ySiliceous shale47.038.074.81.671.680.0040.4691.9421.60.345.92
Cam1y-751.947Є1ySiliceous rock87.510.5050.5140.0742.88-0.0191.715.990.422.05
Cam1y-802.007Є1ySiliceous shale56.555.592.780.9613.95-0.292.6420.790.827.88
Cam1y-852.117Є1ySiliceous rock21.612.031.580.28831.92-0.10123.449.561.33.6
Cam1y-902.217Є1ySiliceous shale46.939.173.921.752.990.0070.4451.7923.430.810.88
Cam1y-952.307Є1ySiliceous rock95.010.4380.2470.2480.379-0.0280.023.310.211.46
Cam1y-1002.397Є1ySiliceous shale46.048.953.361.93.10.0060.411.6126.511.5814.04
Note: “-” indicates that the element content is lower than the detected value; LOI: Loss on ignition; TOC: Total organic carbon.
Table 2. The characteristics of trace elements of geological profile samples near Aksu Cement Plant.
NumberMo
/ppm
Ba
/ppm
U
/ppm
Ba/SrV/(V + Ni)Th/UU/ThZn/TiNi/CoRb/KTh/ScY/HoCd/Mo
Cam1y-52.2930010.13.750.880.0615.680.555.6730.803.3246.701.19
Cam1y-1072164.114.330.850.0518.770.715.9635.260.9842.600.26
Cam1y-152837301132.870.830.0616.890.5317.3911.970.6445.970.08
Cam1y-209.92362233.380.980.0616.430.1525.7016.760.7443.770.37
Cam1y-257.9893.86.753.570.980.0333.920.3413.9019.930.7843.810.11
Cam1y-3015.937712.86.780.780.0172.731.8211.5513.560.8342.500.36
Cam1y-3515.444114.57.160.930.0173.981.5512.7914.670.5141.890.21
Cam1y-401766191872.361.000.0425.340.0721.2320.390.7441.020.07
Cam1y-4514.91029.426.460.980.0331.820.4211.2028.350.8141.300.10
Cam1y-501443081211.491.000.0713.550.0917.8129.480.5541.200.13
Cam1y-55774.311.23.830.990.0335.110.2425.3223.980.6642.290.30
Cam1y-6025.65191732.391.000.0714.420.0621.3127.220.7545.820.51
Cam1y-65112336.777.240.970.0521.160.7830.7336.080.6247.390.16
Cam1y-7054.637680.21.571.000.0911.440.1932.9225.710.6651.490.82
Cam1y-757.3713814.62.110.970.0332.520.928.2725.610.7250.501.51
Cam1y-8017.130645.51.740.990.0911.460.2738.9422.490.6154.153.27
Cam1y-858.0237341014.240.920.0338.401.726.8819.180.7154.187.63
Cam1y-9050.559464.52.930.960.0911.500.9431.6123.770.4839.723.29
Cam1y-954.575502.4718.150.920.0714.031.5312.7630.750.4841.404.18
Cam1y-10014.842145.81.520.970.137.580.6273.1122.200.6442.457.64
Average43.85524.7152.344.390.940.0625.840.6723.2523.910.8145.011.61
Table 3. The characteristics of REE of geological profile samples near Aksu Cement Plant.
NumberLa
/ppm
Ce
/ppm
Pr
/ppm
Nd
/ppm
Sm
/ppm
Eu
/ppm
Gd
/ppm
Tb
/ppm
Dy
/ppm
Ho
/ppm
Er
/ppm
Tm
/ppm
Yb
/ppm
Lu
/ppm
Y/Ho
Cam1y-52.863.620.501.940.370.100.400.080.460.100.300.050.290.0446.70
Cam1y-101.411.880.261.030.200.060.190.040.220.050.160.030.160.0242.60
Cam1y-157385.515.468.914.13.0415.73.07194.2211.71.8410.21.3945.97
Cam1y-2011.110.92.269.971.960.452.130.432.870.712.190.402.420.3643.77
Cam1y-251.861.820.381.80.380.090.430.080.600.140.460.090.500.0843.81
Cam1y-302.663.090.572.480.510.130.550.100.660.160.440.080.420.0642.50
Cam1y-352.292.440.582.620.460.140.540.100.650.160.500.090.520.0841.89
Cam1y-4092.168.817.174.714.83.27162.9919.44.5113.62.3813.61.8841.02
Cam1y-452.432.480.592.770.590.140.680.150.980.250.770.130.790.1241.30
Cam1y-5090.580.222.811426.46.0931.96.2940.29.03253.83202.6941.20
Cam1y-553.813.530.994.70.970.231.110.281.430.351.10.191.090.1542.29
Cam1y-6094.181.519.284.517.13.9020.84.37307.6624.24.28253.7245.82
Cam1y-653.533.51.005.021.160.291.540.312.190.541.660.301.560.2247.39
Cam1y-7051.846.29.5138.67.101.528.071.6511.83.0310.11.86111.6651.49
Cam1y-7520.721.45.8227.35.881.306.891.338.381.815.150.743.660.4750.50
Cam1y-8037.636.77.6534.46.631.487.981.5610.42.537.551.256.91.0154.15
Cam1y-8512110424.811423.55.5129.35.636.68.4925.74.0220.62.8954.18
Cam1y-9042.444.19.1640.78.341.99.541.85122.828.481.58.931.3639.72
Cam1y-950.760.780.150.640.130.070.160.030.210.050.170.030.250.0441.40
Cam1y-10043.946.99.2340.18.121.758.811.6810.82.457.141.217.11.0442.45
Table 4. The trace element ratio criteria of sedimentary environment.
RatiosOxidationSub-OxidationAnoxic
U/Th<0.750.75–1.25>1.25
V/Cr<22–4.25>4.25
Ni/Co<55–7>7
V/(V + Ni)<0.460.46–0.60.6–0.85
(>0.85: sulfidic)
Disclaimer/Publisher’s Note: The statements, opinions and data contained in all publications are solely those of the individual author(s) and contributor(s) and not of MDPI and/or the editor(s). MDPI and/or the editor(s) disclaim responsibility for any injury to people or property resulting from any ideas, methods, instructions or products referred to in the content.