Abstract
Characterizing alteration and its geochemical signature provides critical information relevant to ore-deposit genesis and its related footprint; for porphyry-type deposits, zoned potassic-phyllic-propylitic alteration and metal enrichment are critical features. Here we integrate earlier lithological and mineralogical studies of the (10+ Moz Au) Archean Côté Gold porphyry-type Au(-Cu) deposit (Ontario, Canada) with identified alteration types to provide exploration vectors. The ca. 2740 tonalite-quartz diorite-diorite intrusive complex and co-temporal Au(-Cu) mineralization as disseminations, breccias and veins are co-spatial with ore-related alteration types (amphibole, biotite, muscovite). An early, locally developed amphibole event coring the deposit is followed by emplacement of a Au(-Cu) mineralized biotite-rich magmatic-hydrothermal breccia body and broad halo of disseminated biotite and quartz veining. These rocks record gains via mass balance calculations of K, Fe, Mg, LILE, and LREE with Au, Cu, Mo, Ag, Se and Bi. Later muscovite alteration is enriched in K, Rb, Cs, Ba, CO2, and LOI with varied Au, Cu, Mo, Te, As, and Bi values. A strong albite overprint records extreme Na gains with the loss of most other elements, including ore metals (i.e., Au, Cu). Together these data define an Au-Cu-Mo-Ag-Te-Bi-Se core co-spatial with biotite breccia versus a peripheral stockwork and sheeted vein zone with a Te-Se-Zn-Pb-As association. These features further support the posited porphyry-type model for the Côté Gold Au(-Cu) deposit.
1. Introduction
Alteration types and related geochemistry can define and distinguish different ore-deposit types, such as magmatic-hydrothermal versus metamorphic-hydrothermal types (e.g., [1,2,3]). That these parameters vary both among and within different deposits (e.g., porphyry Cu-Au-, Au-, and Mo-types [3,4]) are used to both constrain the nature and origin of deposits, but importantly also to define exploration vectors; the chemical signature of green-rock in porphyry settings being an excellent example of such application [5,6]. Additionally, elemental associations and their gains and losses are also used to constrain the nature and source of fluids. For example, these parameters have long been used to differentiate among Au deposits of metamorphic versus magmatic affinity (e.g., [2,7]). In this paper, we describe the alteration geochemistry of the recently discovered (2009/2010; [8]) world class ca. 2740 Ma Côté Gold Au(-Cu) deposit. It is a low-grade, large-tonnage, intrusion-related deposit located in the Swayze greenstone belt (SGB) of northern Ontario, Canada. The deposit has a total resource (i.e., measured and indicated) estimated at 365.5 Mt at 0.87 g/t Au (10.2 Moz Au) [9]. The mineralization, which occurs as veins, disseminations, and breccias, is hosted by a tonalite-quartz diorite-diorite intrusive complex and is temporally and spatially related to magmatic-hydrothermal alteration (amphibole, biotite, muscovite, albite) linked to the intrusive system. The well-documented features of the deposit, such as the oxidized hydrous nature of the causative magma, nature and types of mineralization and related alteration, strongly suggest it represents an Archean analogue to younger porphyry-type deposits dominant in the Phanerozoic [10,11,12]. Thus, henceforth the deposit is referred to as porphyry or porphyry-type. Importantly, the recognition of biotite-bearing veins and fractures overprinted by muscovite alteration coincident with Au mineralization at the deposit scale was instrumental in the exploration and discovery in 2019 of the geologically similar Gosselin Au(-Cu) deposit located adjacent and to the northeast of Côté Gold. The Gosselin Au(-Cu) deposit has a resource (measured and indicated) of 3.4 Moz (124.5 Mt @ 0.84 g/t; [9]). The Côté Gold and Gosselin deposits are important as they are the most significant Au deposits to date in the SGB, which is the southwestern extension of the exceptional Au endowed Abitibi greenstone belt (AGB; +300 Moz Au past production and current reserves/resources [13]. The Côté Gold deposit is also significant for defining a new metallogenic event in the Abitibi Subprovince [10,11,13]. Given the significance of this Au setting, here the focus is on characterizing the geochemical footprint of the alteration in order to constrain the deposit genesis and better define exploration parameters. Other relevant aspects of the nature of the fluids, as constrained from fluid inclusion and stable isotopes [11,14], which strongly favor a magmatic-hydrothermal origin.
Previous studies of this deposit setting focused on documenting the nature and timing of the host rocks, the hydrothermal alteration and related mineralization, age of mineralization, and a genetic model [10,11,12]. Although certain geochemical aspects were discussed by Kontak et al. [11], a detailed investigation of its alteration geochemistry and elemental mass balance were needed to improve the understanding of the ore system. Thus, to better characterize these aspects, a lithogeochemical study of 460 drill core samples from within the ore deposit envelope were collected for detail petrographic and lithogeochemical studies. These samples were used to expand on earlier work to provide a comprehensive documentation of the mineralogy, lithogeochemistry, and mass balance of the different styles of hydrothermal alteration in the Côté Gold deposit.
2. Regional Geological Setting
The Côté Gold deposit is located in the southeastern limb of the SGB, which is part of the Au-rich Abitibi Subprovince (Figure 1). The SGB is considered to be western extension of the AGB as it has a similar stratigraphy and structural history based on lithological and geochronological criteria [12,15,16]. Volcanic and plutonic rocks are diverse and include ultramafic to felsic types, as well as both chemical and clastic sedimentary rock types. These rock units range in age from 2750 to 2670 Ma [15,17] with six supracrustal groups recognized which, from oldest to youngest, are the Chester, Marion, Biscotasing, Trailbreaker, Swayze and Ridout [18]. The correlative assemblages within the southern AGB are respectively named the Pacaud, Deloro, Kidd-Munro, Tisdale, Blake River and Timiskaming assemblages [13,15,16].
The Côté Gold deposit is hosted by the ca. 2741 to 2739 Ma Chester Intrusive Complex (CIC [12]), a laccolith-shaped, subvolcanic, composite tonalite-quartz diorite-diorite intrusion. The CIC intruded the Chester Group (2750–2735 Ma; equivalent to the Pacaud episode in the AGB; Figure 2). The Arbutus Formation forms the lower formation in the Chester Group and earliest known rocks within the SGB. It is composed of mafic massive to pillowed flows ([18]) with sparse units of felsic tuff [19]. One U-Pb zircon age was obtained from the Arbutus Formation at 2748.2 ± 1.1 Ma [19].
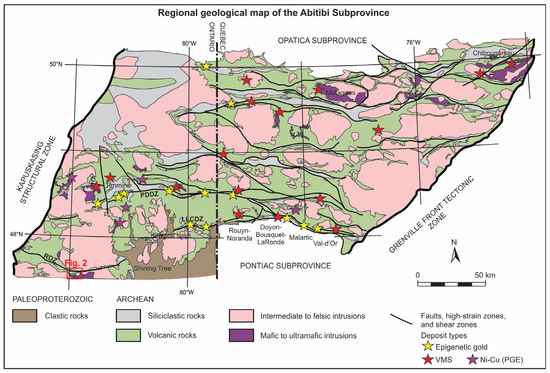
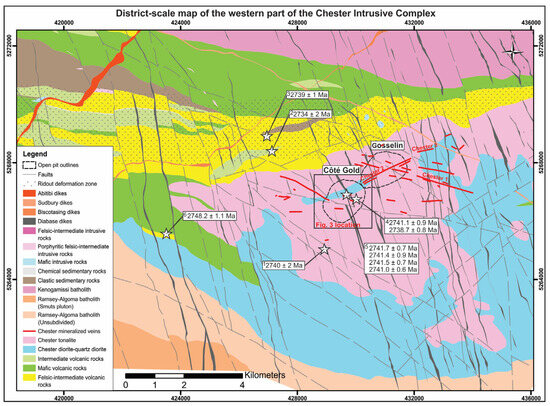
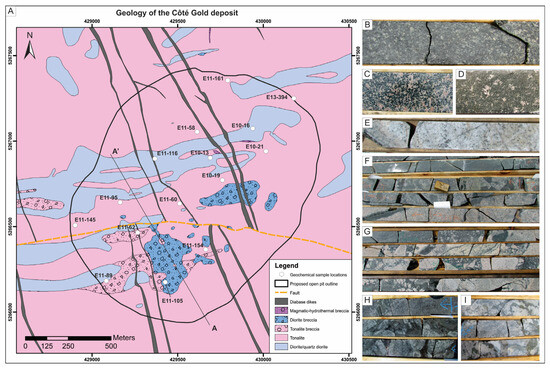
Figure 1.
Regional geological map of the Abitibi Subprovince showing the distribution of major deposits and also the main structural features, in particular the Porcupine-Destor and Larder Lake-Cadillac deformation zones (PDDZ and LLCDZ, respectively; modified after [20]). The Ridout deformation zone (RDZ), located in the Swayze greenstone belt, occurs towards the bottom left of the map and the red outline represents the location of the district-scale map of the western part of the Chester Intrusive Complex where the Côté Gold deposit is located.
Figure 2.
Simplified geological map of the western half of the Chester Intrusive Complex in the southeastern arm of the Swayze greenstone belt (modified after [19]). The white stars and related numbering show sample locations and ages for U-Pb zircon geochronology from 1 [21], 2 [22,23], 3 [16], 4 [11]), 5 [12] and 6 [19] and Figure 3 location is shown by the black solid outline.
Figure 3.
Geological map of the Côté Gold deposit (see location in Figure 2) and drill core photos (4.5 cm width) of host rocks. (A) Simplified geological map of Côté Gold deposit modified after Katz et al. ([10]) with the proposed open pit outline as of 2022 [9]. The deposit map was created using the first bedrock collared in 506 diamond drill holes and dozens of mapped outcrops in the deposit area. The white circles show the drill holes selected for geochemical analyses. (B) Melanocratic diorite with plagioclase phenocrysts. (C) Example of quartz diorite. (D) Melanocratic quartz porphyritic diorite. (E) Tonalite with minor fracturing and alteration. (F) Tonalite breccia along tonalite-diorite contact. (G) Diorite breccia with diorite matrix and biotite fracture-fill tonalite fragments. (H) Magmatic-hydrothermal biotite breccia with fine- to coarse-grained biotite-quartz-carbonate-chalcopyrite-pyrite matrix. (I) Magmatic-hydrothermal biotite breccia with in-situ texture that contains chalcopyrite-pyrite in the matrix and is overprinted by albite alteration.
The Yeo Formation (Figure 2), which is the upper formation of the Chester Group and overlies the CIC, is comprised of intercalated felsic and intermediate, massive to tuffaceous volcanic rocks, clastic sedimentary rocks and iron formations [18,19]. Two U-Pb zircon dates were obtained from felsic lapilli tuffs at 2734 ± 2 Ma [22,23] and 2739 ± 1 Ma [16], indicating this formation is broadly co-temporal with the CIC.
The SGB has a complex structural history of polyphase folding with development of multiple foliations, ductile high-strain zones, and late brittle faulting [16]. The preserved map pattern within the SGB formed during D2 orogen-wide shortening (2696–2675 Ma; [16]), which contains several, regionally extensive, D2 high-strain zones, such as the Ridout deformation zone (see RDZ in Figure 2) that are similar to the high-strain zones in the ABG (i.e., Larder Lake-Cadillac deformation zone) and constrained to <2670 Ma [13]. Importantly, as in the AGB, the D2 event in the SGB is inferred to have been synchronous with the generation of orogenic-style gold mineralization [16,18,24,25].
In the past, the potential for Au gold mineralization in the SGB has been considered favorable based on both its proximity to and similar geology with the AGB [16,25], hence it is not surprising that many prospects and occurrences have been documented [26,27]. A few of these occurrences were developed into small past gold producers, such as the Jerome (56,897 oz Au) and Joburke (50,150 oz) deposits [28]. The Chester 1-Zone (Figure 2) or Chester Mine, located approximately 2 km east-northeast of the Côté Gold deposit, was exploited for high-grade, narrow, sheeted quartz-sulfide vein mineralization that was considered orogenic in origin, although this was reconsidered as intrusion-related by Kontak et al. [11]; these veins are noted for locally high Cu grades (i.e., 10 wt. % Cu). The Chester Mine was, however, eclipsed by the discovery of the Côté Gold deposit in 2009/2010 [8] and also, as noted above, by the more recent 2019 discovery of the Gosselin deposit, located near the former Chester Mine and just northeast of the Côté Gold deposit (Figure 2).
Metamorphic grade within the southern AGB ranges from sub-greenschist to greenschist grade; it is best seen as a pervasive saussuritization of calcic plagioclase (An30–50) throughout the tonalite and diorite units of the CIC. Higher amphibolite grade conditions were locally attained next to large syn-volcanic and syn-tectonic intrusions. Peak metamorphism is estimated to have occurred from 2677 to 2643 Ma [29]. U-Pb dating of rutile in the Côté Gold deposit also helps constrains the age of metamorphism to ca. 2667 Ma [10].
3. Deposit Geology and Alteration Stages
3.1. Magmatic and Magmatic-Hydrothermal Phases of the Chester Intrusive Complex
The Côté Gold deposit, located in the northwestern part of the CIC, is hosted in a composite sill-like intrusive complex composed of tonalite, quartz diorite and diorite (Figure 3A). In the deposit, these rocks are intruded by breccias of both magmatic and magmatic-hydrothermal origin.
At the deposit, as well as the surrounding region, intrusive phases of the CIC exhibit complex crosscutting relationships and textures suggesting their coeval emplacement [12,18,23,30,31]. These features include: (1) abundant fragments of diorite, quartz diorite, and tonalite of variable size (<1 cm to more than tens of meters) and texture (i.e., fine- to coarse-grain size) hosted in tonalite; (2) fragments of tonalite, and rarely diorite, hosted in diorite matrix; (3) tonalite bodies or dikes intruding diorite; (4) rounded, subrounded, or angular fragments of diorite with sharp to diffuse margins hosted in diorite; and (5) cuspate or lobate contacts (rare) between tonalite and diorite. Coeval emplacement of these felsic and mafic phases is supported by U-Pb ID TIMS dating of the dioritic (2741.5 ± 0.7 and 2741.0 ± 0.6 Ma) and tonalitic (2741.4 ± 0.9 and 2741.7 ± 0.7 Ma) bodies [12] and their inferred high-level setting is supported by Al-hornblende geobarometry (≤1.3 ± 0.6 kbars; [12]). That dates for tonalite of 2740 ± 2 Ma [21] and 2741.1 ± 0.9 [11] and tonalite breccia at 2738.7 ± 0.8 Ma [11] overlap indicate their co-temporal emplacement. Details and photos of the magmatic and magmatic-hydrothermal phases were described in elsewhere [10,12] and below is a brief summary of the main magmatic and magmatic-hydrothermal phases.
Diorite and quartz diorite: In the deposit, several dioritic intrusions occur, including diorite (Figure 3B), quartz diorite (Figure 3C,D) and minor hornblende-plagioclase ± quartz pegmatite, all of which contain melanocratic to leucocratic phases. Diorite and quartz diorite bodies occur as few meters to <150 m thick intrusions. The hornblende-plagioclase ± quartz pegmatite can form either as pegmatitic segregations in diorite and quartz diorite or as distinct bodies that intrude diorite, quartz diorite and more rarely tonalite. The diorite is fine- to coarse-grained and dominated by subequal amounts of hornblende and plagioclase with minor titanite, ilmenite and magnetite with accessory apatite, zircon and tourmaline; rarely plagioclase phenocrysts occur. The quartz diorite, which is also amphibole-rich, is fine- to coarse-grained, commonly quartz and/or plagioclase porphyritic and contains the same minor and accessory phases as the diorite. These units are of tholeiitic to transitional nature [12].
Tonalite: The most common unit in the deposit forms numerous bodies of centimeter to >100 m in apparent width. It is a fine- to medium-grained leucocratic rock with equigranular quartz and plagioclase (Figure 3E) and rare quartz or plagioclase phenocrysts; accessory minerals include primary biotite, titanite, ilmenite, zircon, monazite and xenotime. The unit equates to a calc-alkaline to transitional, low-Al tonalite [32].
Tonalite breccia: This breccia occurs along the margins of tonalite and diorite and therefore is considered to be an intrusive breccia (Figure 3F). This unit contains angular to rounded fragments (<1 cm to several meters) of diorite or quartz diorite and rarely tonalite.
Diorite breccia: The second type of magmatic breccia is the result of a later injection of diorite that brecciates diorite, quartz diorite, tonalite and tonalite breccia, although tonalite is the most common fragment type (Figure 3G). The matrix is variable, occurring as medium- to coarse-grained melanocratic diorite or fine- to medium-grained quartz diorite or rarely a fine-grained evolved diorite. The unit occurs as an irregular-shaped body (500 m in length and 350 m in width; Figure 4) in the southern and central part of the deposit that dips moderately to steeply to the northwest [10].
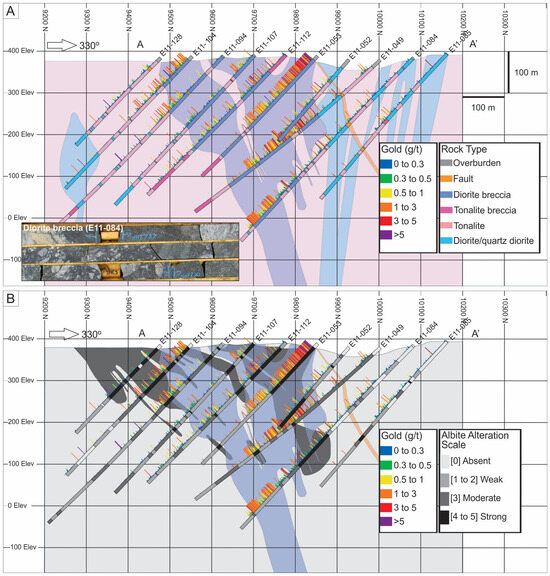
Figure 4.
Vertical cross section of grid line 87+00 (A-A’) from the Côté Gold deposit modified after [12]. The location of the section is shown in Figure 3. (A) Simplified geological cross section showing the major rock types with gold values. (B) Simplified cross section showing the distribution and intensity of albite alteration with strong albite alteration depicted by dark grey shapes and the shape of diorite breccia (from A) depicted in blue.
Magmatic-hydrothermal breccias: Two types of magmatic-hydrothermal breccia are recognized based on their matrices: (1) magmatic-hydrothermal with an amphibole-rich matrix; and (2) magmatic-hydrothermal with a biotite-rich matrix (Figure 3H,I). As these bodies are rarely exposed on surface (Figure 3), much of their extent and features are based on our detailed core logging.
The magmatic-hydrothermal amphibole-rich breccia contains fragments of tonalite with rare diorite fragments. Its black to dark-green matrix is fine- to coarse-grained and consists of amphibole-quartz ± biotite ± carbonate ± pyrite ± chalcopyrite. It is the least abundant of the breccia types, forming meter-sized bodies, and appears to be restricted to the southern and central parts of the deposit.
The deposit is centered on several volumetrically significant breccia bodies, which include a magmatic-hydrothermal biotite breccia and the aforementioned diorite breccia. The magmatic-hydrothermal biotite breccia is the largest of the breccias, occurs in the central and northern parts of the deposit, is moderately-to-steeply northwest-dipping, and is up to approximately 600 m in length and 400 m in width at its largest [10]. It contains rounded to angular tonalite fragments and its matrix is subdivided into three assemblages based on the abundance of biotite, magnetite and carbonate: (1) fine-grained biotite-quartz ± epidote ± calcite ± pyrite ± chalcopyrite ± magnetite ± allanite ± titanite ± fluorite; (2) fine- to coarse-grained biotite-magnetite-quartz-ankerite-chalcopyrite-pyrite ± sphalerite ± allanite ± bastnaesite ± apatite ± titanite with rarely up to 50% magnetite; or (3) biotite-ankerite/calcite-quartz-pyrite ± allanite ± apatite ± magnetite ± chalcopyrite ± pyrrhotite with the coarse biotite hosted in finer-grained quartz and carbonate.
3.2. Alteration Stages, Breccia Cement and Mineralization
The hydrothermal alteration and related mineralization developed in several stages with six alteration assemblages identified (see Table 1). Following on the nomenclature defined in Katz et al. [10], the alteration types from early to late are: amphibole (calcic), biotite (potassic), muscovite (phyllic), epidote (propylitic), albite (sodic) and chlorite. Representative photos of alteration assemblages are shown in Figure 5. The timing of intrusions, alteration stages, and mineralization all overlap at ca. 2740 Ma based on U-Pb (zircon, titanite) and Re-Os (molybdenite) dating [10,11,12]. A brief summary of the features of these different assemblages is shown in Figure 6 and discussed below from Katz et al. [10]. This summary is critical as it gives context to understanding the lithogeochemistry.

Table 1.
Summary of alteration assemblages at the Côté Gold deposit.
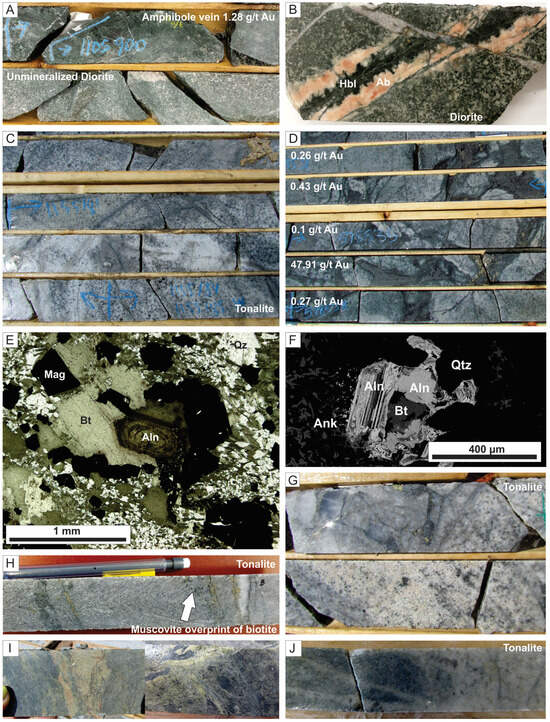
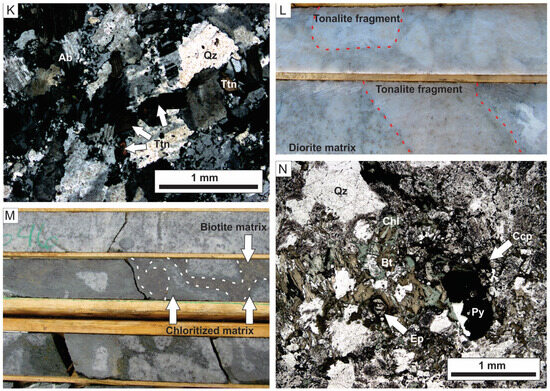
Figure 5.
Photographs showing representative examples of different alteration types at Côté Gold deposit. Note all drill core is 4.5 cm width. (A) Mineralized amphibole vein (1.28 g/t Au) cutting barren diorite in lower part of the photo. (B) Amphibole vein in diorite bordered by albite. (C) Disseminated and fracture-controlled biotite in tonalite with albite alteration exploiting the biotite stockwork. (D) Gold-bearing magmatic-hydrothermal biotite breccia hosting biotite and muscovite altered tonalite fragments. (E) Thin section in plane-polarized light (PPL) of matrix in magmatic-hydrothermal biotite breccia unit with biotite-quartz-magnetite-allanite assemblage. (F) Backscatter electron image of allanite and biotite with quartz and ankerite. (G) Muscovite alteration overprinting biotite-sulfide fractures in tonalite. (H) Pervasive muscovite alteration in tonalite overprinting sheeted quartz-biotite-pyrite veins and fractures. (I) Two examples of vein-controlled epidote alteration in diorite. (J) Pervasive muscovite altered tonalite overprinted by semi-pervasive albite alteration. (K) Thin section in crossed-polarized light of albite alteration with albite after primary calcic (An30) plagioclase. (L) Pervasive albite alteration in diorite breccia with the fragment/matrix boundary still visible. Note some tonalite fragments are outlined by red-dashed lines and the abundance of secondary leucoxene in the matrix. (M) Chlorite alteration of magmatic-hydrothermal biotite breccia. Note presence of chlorite reaction rim around some fragments and presence of disseminated chlorite (after biotite) in tonalite fragments. (N) Thin section in PPL of magmatic-hydrothermal biotite breccia matrix with chlorite partially replacing biotite. Abbreviations: Ab = albite, Aln = allanite, Ank = ankerite, Bst = bastnaesite, Bt = biotite, Ccp = chalcopyrite, Chl = chlorite, Ep = epidote, Hbl = hornblende, Mag = magnetite, Py = pyrite, Qz = quartz, Ttn = titanite.
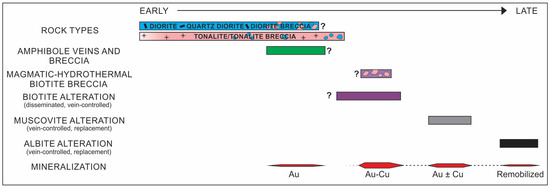
Figure 6.
Simplified schematic paragenetic diagram showing the relative age relationships among the host rocks, hydrothermal alteration types, and mineralization at the Côté Gold deposit. Note that “?” refers to the unknown extent of the paragenesis.
Amphibole vein and breccia stage: This occurs as rare amphibole-bearing veins and breccias of cm- to m width with a variable hornblende ± apatite ± titanite ± magnetite ± quartz ± albite ± pyrite ± chalcopyrite assemblage (Figure 5A,B; Table 1). Titanite of this stage was dated at 2745 ± 3 Ma [10].
These veins and breccias may cut barren diorite and tonalite and are typically Au-bearing (Figure 5A) but sulfide-poor. These veins and breccias appear to be localized to the central and southern parts of the deposit and their paucity, combined with a lack of continuity, precludes their significance in terms of the overall Au budget.
Biotite stage: The term biotite stage is used herein in contrast to the common terms of potassic or K-silicate alteration (e.g., [33]). The mineral assemblage varies with biotite ± quartz ± epidote ± calcite ± ankerite ± magnetite ± allanite ± pyrite ± chalcopyrite ± pyrrhotite ± apatite ± titanite ± ilmenite ± bastnaesite ± fluorite ± molybdenite ± sphalerite ± galena. It is the most widespread alteration and developed as disseminations, lining fractures (Figure 5C) and in veins (Table 1), in addition to cementing breccias (Figure 5D).
This stage also includes LREE-bearing minerals, such as allanite (Figure 5E,F) and bastnaesite, that occur as fine- to medium-grained, anhedral to euhedral crystals intergrown with biotite, epidote and titanite. They have been observed in disseminated biotite alteration, vein-controlled biotite, and the matrix of the magmatic-hydrothermal biotite breccia. These minerals were seen in 10 of 19 biotite-rich samples studied using SEM-EDS.
In drill core, black or brown spots of biotite occur as disseminations (typically 3–12 vol.%) replacing primary plagioclase and amphibole and also after secondary amphibole. Disseminated biotite occurs throughout the deposit, as well as outside the deposit. Veins and veinlets occur as stockwork (Figure 5C,G), discrete features, or subparallel sheeted sets with varied assemblages (Table 1); the sheeted veins cut and thus post-date the biotite breccia. The sheeted quartz ± carbonate ± biotite ± chalcopyrite ± pyrite ± pyrrhotite ± molybdenite veins form conjugate vein sets that consist of moderately to steeply dipping to the north, north-northeast, and northwest veins and moderately to steeply dipping to the south, southeast and southwest veins (Figure 2); these veins also occur outside the deposit area in the CIC and can be mineralized (e.g., Gosselin deposit). These veins define zones that are typically <5 to rarely >42 m in true width and the veins can be densely to widely spaced (i.e., few cm apart to >1 m spacing; [10]). They are typically overprinted by the muscovite stage with distinct muscovite haloes (Figure 5H).
The magmatic-hydrothermal biotite breccia is closely associated with Au and Cu with an Au ± Cu ± Mo ± Ag ± Te association, which is also noted in the sheeted veins when proximal the breccia ([10] and see below). In general, mineralization is typically rare in disseminated biotite altered tonalite and diorite samples. However, gold mineralization is spatially associated with diorite breccia (Figure 4A and inset photo), which contains disseminated biotite alteration in the matrix and fragments. The main sulfides are pyrite and chalcopyrite with gold intergrown locally with the chalcopyrite. Magnetite may be abundant in magmatic-hydrothermal biotite breccia, particularly in assemblage 2 (up to 50 vol.%), but rare in disseminated and vein-controlled samples (<1%).
Muscovite stage: This assemblage consists of muscovite ± quartz ± calcite ± pyrite ± chalcopyrite ± pyrrhotite ± chlorite ± rutile ± molybdenite ± tourmaline, thus analogous to phyllic alteration in porphyry deposits (e.g., [3,4]). It occurs as both fracture- and vein-controlled (Figure 5G,H) and replacement (e.g., plagioclase, amphibole), partially to wholly overprinting the biotite stage.
Muscovite alteration is most intense in the core of the deposit as a pervasive and fracture-controlled zone (~900 m long with an apparent width up to 400 m that dips shallowly to steeply to the northwest; [10]). The alteration zone is discordant to the two mineralized breccia bodies, with parts of biotite/chlorite altered diorite breccia in the south and magmatic-hydrothermal biotite breccia in the north of the deposit that contain little to no overprinting muscovite alteration.
This stage often spatially coincides with Au mineralization and has an Au ± Cu association, but Au grades are inconsistent. Sheeted veins with muscovite haloes are often mineralized (Figure 5H), however, as they have an original biotite assemblage some of the Au ± Cu ± Mo ± Ag may be inherited.
Epidote stage: Weakly developed patchy epidote occurs throughout the deposit that has been related to regional greenschist facies metamorphism. However, a zone of disseminated, vein-controlled and rarely strongly pervasive replacement epidote (Figure 5I) contains an epidote ± quartz ± calcite ± chlorite. Where veins occur, they often exhibit drusy textures.
This epidote zone is considered to be syn-intrusion in timing and occurs as relatively continuous alteration in a confined area (~900 m long and 150 m wide) found north-northeast of the magmatic-hydrothermal biotite breccia. It is cautiously interpreted to be analogous to epidosite alteration formed in high-temperature reaction zones due to the ascent of previous down-welling paleo-seawater heated by an underlying magmatic body [34]. This stage is not associated with Au mineralization, but one such epidote-quartz vein did contain visible gold.
Albite stage: This assemblage overprints and destroys all earlier alteration types (Figure 5C,J). The assemblage consists of albite ± quartz ± calcite ± titanite ± rutile ± chlorite. It is characterized by albite replacing calcic plagioclase (Figure 5K), destruction of magmatic textures, and strong white/grey bleaching (Figure 5L) that pervasively alters the rock. It commonly exploits preexisting fractures (Figure 5J) and occurs as haloes around veins. Where most intense (i.e., albitite; 10 to 11 wt.% Na2O) is the development of light-pink to brown-red porous zones, typically <15 m wide. In such cases the secondary albite is accompanied by dissolution of quartz with the new porosity lined by a later generation of clear fluid-inclusion rich albite with trace titanite, hematite, rutile, apatite, zircon, and chlorite. This intense sodic alteration type is similar to episyenite rocks (i.e., sub-solidus quartz deficient alkali-feldspar rich rocks) widely recognized elsewhere and associated with a variety of mineralization types (e.g., U, Sn-W, Au [35]).
Near surface, the white/grey bleaching occurs discontinuously in the central and southeastern part of the deposit, whereas at depth it is strongest toward the center of the deposit and forms an alteration front of ~200 m wide that dips moderately to steeply to the northwest. Its timing is constrained by three U-Pb titanite ages averaging ca. 2740 Ma [10].
Although some zones of moderate to strong albite alteration contain gold, on the deposit-scale the gold is centered on the diorite breccia and magmatic-hydrothermal biotite breccia [10]. The association of Au with albite alteration is inconsistent and, thus, it is considered to overprint previously Au mineralized zones. Sulfides are generally not present in this stage where it is most strong and pervasive.
Chlorite stage: Chlorite is ubiquitous throughout the deposit area and occurs as disseminations, replacement and veins. Petrographically it is seen to partially to wholly replace primary plagioclase and amphibole, secondary amphibole, and particularly biotite (Figure 5M,N). Chlorite does not form its own alteration assemblage but may appear to when it wholly replaces biotite in areas. Thus, it is considered to relate to retrograde after biotite or regional greenschist facies metamorphism [10]. Where Au mineralization is spatially associated with chlorite, it is attributed to overprinting earlier higher-temperature hydrothermal biotite alteration.
In summary, there are several distinct alteration stages noted but the Au is only associated with specific stages in the evolution of the system: (1) matrix of the magmatic-hydrothermal biotite breccia; (2) in the matrix of biotite altered diorite breccia; and (3) areas with a higher density of biotite-bearing veins. Thus disseminated biotite altered tonalite or rocks lacking veining (i.e., diorite) are not going to be prospective for gold mineralization.
3.3. Post-Emplacement Dikes and Deformation
Several types of dike rocks are recognized in drill core and outcrops [12]. They have sharp contacts with all units of the CIC, vary in width (centimeters to several meters), and are distinguished based on macroscopic, petrographic and geochemical features. These intermediate to mafic dikes are typically Au barren and contain assemblages related to D2 deformation and metamorphism.
Several small (<3 m wide), late-stage, east-west trending D2-related deformation zones associated with the regional RDZ, which occurs approximately 3 km north of the Côté Gold deposit, overprint the major rock types, alteration types, and dike rocks. In addition, a west-striking, moderately to steeply dipping brittle deformation zone of about 55 m width cuts through the center of the deposit (Figure 3).
4. Methodology
4.1. Petrography
Petrographic analysis in both transmitted and reflect light of approximately 600 sections mainly from drill core (± outcrops) was used to identify alteration types and diagnostic hydrothermal minerals of each alteration stage in addition to the ore mineralogy and their textural relationships. Of these samples, 310 have complete whole-rock geochemical analyses.
4.2. Laser Ablation-Inductively Coupled Plasma-Mass Spectrometry
The trace element chemistry of chalcopyrite was determined using LA ICP-MS with results given in Table 2. It is noted that as the abundances of Co, Ni, Pd and Pt were at or below detection limits, these are not included in the data.
Table 2.
Results of LA ICP-MS analyses of chalcopyrite.
Analyses were done at the Chemical Fingerprinting laboratory of Laurentian University (Sudbury, Canada) using a 20 ns pulse duration, 193 nm wavelength ArF excimer laser (Resonetics RESOlution M-50) employing a two-volume Laurin Technic sample cell ([36]) coupled to a Ar plasma quadrupole ICP-MS (Thermo X Series II). Ablation took place in He (650 mL/min) which was combined with Ar (800 mL/min) and N2 for enhanced sensitivity (6 mL/min) prior to ionization. Traverse mode was used with a beam diameter (26–90 µm) and speed (10–35 µm/s) adjusted according to the grain size to provide adequate sampling time and maximum signal intensities; the one sample (CL-10-03) analyzed in spot mode used a beam diameter of 66 µm. For all analyses, laser repetition rate and fluence were 6 Hz and 5 J/cm2, respectively, with each analysis typically consisting of 30 s of background followed by 30 s of ablation or longer (for traverses). The ICP-MS was operated with a forward power of 1450 W and an oxide production rate of <0.4% as determined by measuring ThO+/Th+ while ablating NIST SRM 612. Dwell times were set at 10 ms per analyte for all measurements. Data reduction was done with the Iolite software package (v. 2.5; [37]) using NIST SRM 610 (bracketing and between every 7 or fewer analyses) as an external reference and Cu (34.6%) as internal references for chalcopyrite. Mass 108 was used to determine Pd concentrations after being corrected for 108Cd by the measured 111Cd and assuming 108Cd/111Cd = 0.06953. Reference materials BHVO-2g and Po725 [38] were also analyzed periodically and typically return concentrations within 15% of their accepted values. Segments of the data displaying abnormal behavior (e.g., cracks or inclusions) were omitted during data reduction.
4.3. Lithogeochemistry
A total of 434 samples were collected from 15 drill holes throughout the deposit (see locations in Figure 2) with an additional 26 samples come from specifically selected drill intersections. Samples included all rock types in the deposit, including dike rocks. However, only least-altered and altered host rocks are discussed here. All of the geochemical data, in addition to location (drill collar, depth), a representative photo of the sample and a brief hand sample description can be found in a Geological Survey of Canada Open File Report 8040 ([39]). These data were used to assess down-hole changes in lithogeochemistry commensurate with the presence of the different alteration stages.
Analyses were done in two batches at Activation Laboratories in Ancaster, Ontario. Major elements were determined by lithium metaborate-tetraborate fusion and ICP-MS, whereas trace- and rare earth elements (REE) were determined by a combination of fusion ICP, fusion ICP-MS and total digestion ICP-MS. For As, Sb, Bi Se and Te, abundances were determined by a combination of aqua regia ICP-MS and nitric peroxide fusion ICP-MS, whereas Au, Pd and Pt were measured by fire assay. The FeO was determined using titration. For the anions, Cl was determined by instrumental neutron activation, B by prompt gamma neutron activation and F by ion selective method. Both S and CO2 were determined by infrared analysis and Hg by cold vapor flow injection mercury technique.
4.4. Mineral Characterization
Numerous samples were studied using a JEOL 6400 scanning electron microscope (SEM) with a mounted Oxford Sight energy dispersive spectrometer (EDS) detector at the Mineral Analysis Centre, Laurentian University (Sudbury, Canada). Data was acquired using an accelerating voltage of 20 kV, 1.005 nA beam current, counting times of 5 to 10 s, and a working distance of 15 mm. Data were processed using Oxford Instrumentation AZTEC (v.4.0) software.
4.5. Mass Balance
To quantify changes in rock mass and elemental abundances in the different alteration types, the Grant [40] isocon method was performed on 115 samples collected along 14 logged drill holes and one outcrop sample. For these calculations, least-altered samples were first identified on the basis of petrographic and geochemical criteria and a group of five tonalite, four diorite and six quartz diorite samples selected from among the several hundred analyses to define the average compositions of these precursors; these data are given in Table 3 (tonalite) and Table 4 (diorite, quartz diorite). Using the latter averages, mass balance was done using representative samples for the specific alteration stages. In general, the elements used to define the isocons were Al2O3, TiO2, Zr, and SiO2. From this the average gains and losses for the specific units and alterations were calculated and are summarized in Table 5.
Table 3.
Average composition of least-altered and altered tonalite samples from the Côté Gold deposit for mass balance calculations.
Table 4.
Average composition of least-altered and altered dioritic samples from the Côté Gold deposit for mass balance calculations.
Table 5.
Calculated gains and losses for different alteration types averaged for tonalite and diorite.
5. Results
In order to illustrate the distribution of the alteration and their diagnostic geochemical signature and use for discriminating the different stages, alteration geochemistry and mass balance are presented. Three down-hole geochemical profiles are presented in Figure 7 to show the diagnostic elements associated with a particular rock type or alteration. In addition, these geochemical profiles show which rock and/or alteration is spatially associated with the Au mineralization. Chondrite-normalized rare earth element (REECN) diagrams and several binary element plots are also used to geochemically fingerprint these stages. The trace-element chemistry of chalcopyrite is also used to see what possible insight it might provide in regard to ore-forming processes as until recently this has not been widely applied in porphyry settings (e.g., [41]). Lastly, mass balance calculations provide the elemental gains and losses and thus geochemical signature for fluids responsible for the different alteration stages (i.e., biotite, muscovite, albite, and chlorite) and related mineralization. Although the hydrothermal amphibole is spatially coincident with elevated Au, due to its overall general paucity it was not included as part of the mass balance, but the nature of its geochemistry is addressed.
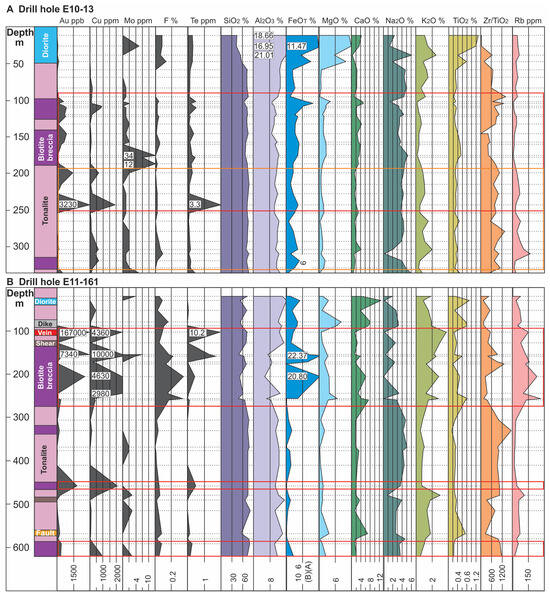
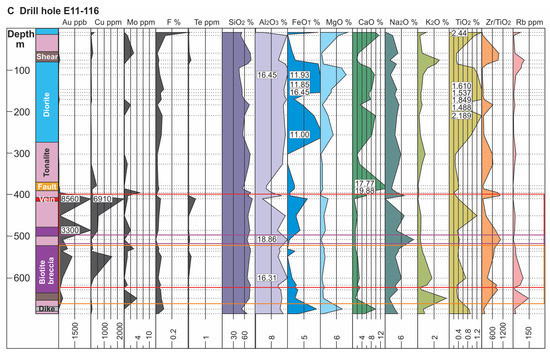
Figure 7.
Lithological logs and corresponding geochemical profiles for selected elements from drill holes E10-13 (A), E11-161 (B) and E11-116 (C); see Figure 3 for locations. For each profile locations of analyzed samples are indicated by dashed horizontal lines with numbers in the profiles indicating off-scale values. Note scales for FeO and Na2O (in wt. %) change between drill hole profiles. Red outline delineates the ore zone, the orange outline zones of muscovite alteration, and the purple outline zones of albite alteration.
5.1. Alteration Geochemistry and Elemental Behavior and Trends
Amphibole stage: The nature of the amphibole (i.e., veins and breccias) makes it difficult to geochemically characterize this stage using bulk methods, however, analyses of magmatic and hydrothermal amphibole provided in Katz et al. [10] are used to assess its signature. These data reveal that hydrothermal amphibole types contain higher SiO2 and CaO than the magmatic equivalent, whereas TiO2 is the reverse. In addition, although amphibole from the veins were found to contain similar Mg# (Mg values (100 × Mg/(Mg + Fe) in apfu) as the diorite and quartz diorite (Mg# 40 to 50) due to wallrock buffering, the breccia contained higher Mg# (i.e., 55 to 70), which coincided with higher F (0.2 to 0.5 wt. %) than in magmatic amphibole (F < 0.3 wt. %).
Biotite stage: The specific mineralogy of this alteration type provides some basis to geochemically fingerprint it with LREE- (e.g., allanite, bastnaesite) and F-rich phases (e.g., biotite, fluorite, apatite, titanite) being particularly useful. For the former, the presence of LREE-rich phases result in La/YbN > 4 for biotite altered tonalite (Figure 8A), whereas for the latter a strong correlation is manifested between F and K2O due to the presence of biotite (Figure 8B with R = 0.93) with F most enriched in the magmatic-hydrothermal biotite breccia whereas the biotite altered tonalite and least-altered tonalite lack this F enrichment (Figure 8B). Biotite altered tonalite has a strong positive correlation between K2O and Ba (r = 0.79; Figure 8C) and Rb (figure is not shown; r = 0.66), however the magmatic-hydrothermal biotite breccia shows a distinctly different trend between K2O and Ba and poorer correlation (r = 0.45; Figure 8C). The latter observation may reflect changes in Ba partitioning in biotite through the paragenesis as it depends on the chemistry of the host rock (e.g., [42]), which here can be related to the change in Mg/(Mg + Fe) ratios of biotite (see [10]). Thus, the data suggest the increase La/YbN ratio and elevated K, Rb and Ba values can serve as proxies for the introduction of secondary biotite in the host rocks, whereas F is useful in identifying the magmatic-hydrothermal biotite breccia.
Geochemical profiles for drill holes E10-13, E11-161 and E11-116 (Figure 7A–C, respectively) demonstrate the spatial association of Au with magmatic-hydrothermal biotite breccia. Not only is there a strong association of Au with the breccia bodies, but these profiles also highlight a Au-Cu ± Te association. The latter is particularly evident in E11-161 which represents the least-altered of the profiles. This hole also shows clear increases in the abundances of K2O, F, FeOT, and Rb with the breccia (Figure 7B). Furthermore, a plot of Cu versus Au shows a positive correlation in the biotite breccia (r = 0.63) that is lacking in the biotite altered tonalite and diorite (red box area in Figure 8D).
Muscovite stage: This alteration type is relatively simple compared to the biotite stage in terms of its mineralogy and associated chemical signature (e.g., Rb, Ba, and F). For example, the profile for hole E11-116 (Figure 7C), which has a muscovite zone overprinting magmatic-hydrothermal biotite breccia and tonalite at 530 to 650 m depth, shows increases in K2O and Rb. This latter feature is better illustrated in Figure 9A, a binary plot of Rb versus K2O that shows a strong positive correlation (r = 0.89; Figure 9A) in addition to the muscovite-bearing samples being more Rb enriched. Additionally, the same zone shows weak to moderate positive correlations, respectively, between K2O and F (r = 0.47; Figure 9B) and Ba (r = 0.60; Figure 9C). Again, we note that in some cases this alteration type locally overprints biotite alteration which may affect the correlations.
Although a correlation between Au and Cu is lacking in this alteration type, these zones are often coincident with Au ± Cu mineralization. For example, in hole E10-13 (Figure 7A) the Au-Cu mineralization continues from the footwall of the magmatic-hydrothermal biotite breccia into biotite and muscovite altered tonalite. Gold-only mineralization has been noted to be associated with zones having intense development of muscovite, however, such mineralization not as inconsistent and usually of lower grade [10,11] than the diorite breccia and magmatic-hydrothermal biotite breccia.
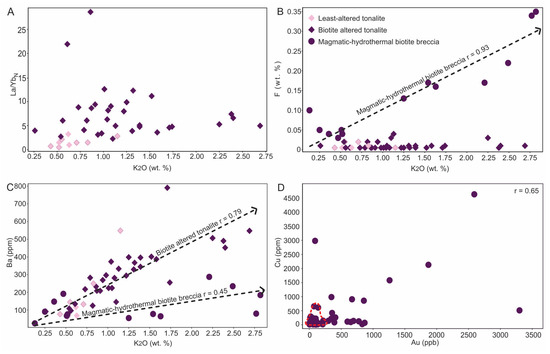
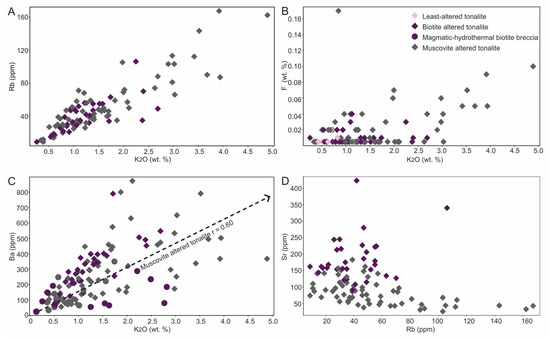
Figure 8.
Binary element plots showing geochemical characterization of least-altered tonalite, biotite altered tonalite and magmatic-hydrothermal biotite breccia. (A) La/YbN versus K2O showing increase in La/YbN for biotite altered tonalite (n = 32) compared to least-altered tonalite (n = 9). Chondrite normalizing values from [43]. (B) F versus K2O showing strong positive correlation (r = 0.93) in magmatic-hydrothermal biotite breccia (n = 13), but no correlation for both least-altered and biotite altered tonalite samples. Note that two breccia samples are not included due to scale. (C) Ba versus K2O showing strong positive correlation for biotite altered tonalite (r = 0.79) versus weaker correlation for magmatic-hydrothermal biotite breccia (r = 0.45). (D) Plot of Cu versus Au for the biotite breccia (n = 41), which shows a positive correlation (r = 0.65), and biotite altered tonalite that is outlined by the dashed red line in lower left. Note two samples with highest Au and Cu values plot off the diagram but are included in the regression.
Figure 9.
Binary element plots showing geochemical characterization of the muscovite altered tonalite. (A) Rb versus K2O (n = 64) with r = 0.89 which compares to r = 0.66 for biotite altered tonalite (not shown). (B) F versus K2O. (C) Ba versus K2O showing different trends for biotite altered tonalite and magmatic-hydrothermal biotite breccia versus muscovite altered tonalite. (D) Sr versus Rb showing that biotite and muscovite altered tonalite define separate fields.
Since both the muscovite and biotite alteration equates to development of K-silicates, in addition to their respective mineralogical differences, some geochemical parameters are needed to further discriminate them. Thus, we note that whereas biotite altered tonalite lacks an apparent correlation between K2O and F, a weak to moderate correlation is noted for sericite altered tonalite (Figure 9B). Additionally, in the Ba versus K2O plot two trends are defined for biotite versus muscovite altered tonalites, which suggests Ba can be a discriminator (Figure 9C). Finally, the plot of Sr versus Rb (Figure 9D) shows Sr is relatively enriched in biotite versus muscovite altered tonalite.
Albite stage: This stage of alteration, recognized by its characteristic white bleaching and texturally destructive nature (Figure 10A–C), resulted in albite almost complete replacing primary minerals (e.g., plagioclase, hornblende, quartz), which thereby complicates the identification of the protolith (e.g., tonalite versus diorite). Thus, geochemistry can potentially provide the means to differentiate between the units. Although it is not uncommon for the high field strength element (HFSE), such as Zr, Ti, and Cr, to be conserved during hydrothermal alteration (e.g., [42,44,45]), this immobility must be first demonstrated. This immobility issue is addressed below.
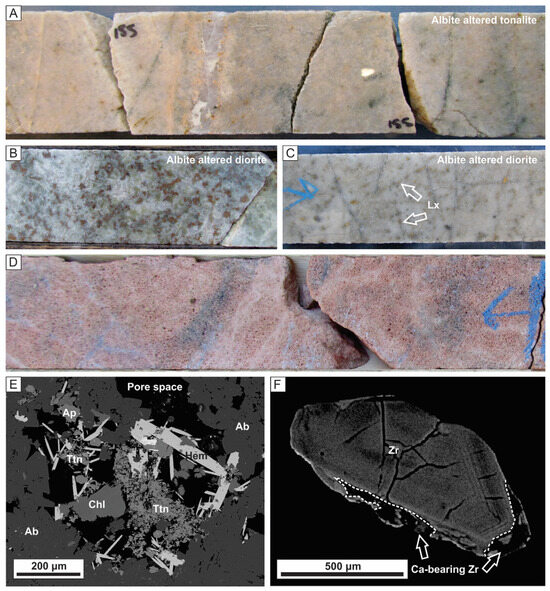
Figure 10.
Drill core photos and backscatter electron (BSE) images used to illustrate the mobility of Ti and Zr during alteration. (A) Pervasive albite altered tonalite. (B) Pervasive albite altered diorite with albite replacing primary amphibole and calcic plagioclase with primary titanite or ilmenite pseudomorphed by brown rutile. (C) Strongly albite altered diorite with leucoxene after primary titanite or ilmenite; some of the leucoxene has been mobilized along the fractures. (D) An example of intense albite alteration (i.e., episyenite) with pore space created due to dissolution of quartz. (E) A BSE image of an episyenite where titanite, apatite, chlorite and hematite developed in pore space. (F) A BSE image of a zoned zircon in tonalite with dissolution-precipitation along rims, which have trace amounts of Ca.
For albite altered rocks, there is macro- and micro-scale evidence for variable mobility of the HFSE. Strong pervasive albite altered tonalite and dioritic rocks are usually distinguished by the presence/abundance of leucoxene; tonalite contains little to no leucoxene (Figure 10A) whereas diorite can have several percent (Figure 10B). Leucoxene, an alteration product of titanite and ilmenite, can be seen to be locally developed along fractures in albite altered diorite (Figure 10C). Similarly, in the rare occurrence of episyenite (Figure 10D) Ti-bearing minerals re-precipitate in the pore space developed from dissolution of primary quartz (Figure 10D,E). Zircon shows dissolution-precipitation textures along its margins and these areas contain trace Ca, P, Na, and F (Figure 10F); hydrothermal zircons have been documented to be enriched in Al, P, Y, Ca, REE, HFSE and F [46,47,48,49,50]. Although these textures suggest remobilization, it appears that dissolution and re-precipitation occurred only on a local scale with overall conservation of elements.
Based on the above, both Zr and Ti are considered to be relatively immobile and thus effective in distinguishing tonalite and diorite; this is illustrated in Figure 11A with a binary plot of SiO2 versus Zr/TiO2. In the latter it is apparent that Zr/TiO2 > 500 separates the two lithologies using least altered samples, as indicated by the black dashed ellipses. In Figure 11B, different types of diorites are compared to tonalite with all having much lower Zr/TiO2.
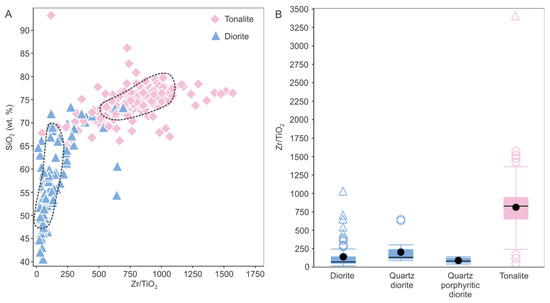
Figure 11.
(A) Plot of SiO2 versus Zr/TiO2 used to discriminate between altered tonalite and diorite rocks. For comparison, the dashed black ellipses outline fields for least-altered tonalite (n = 9) and dioritic rocks (n = 16) and data falling outside these areas reflect scatter due to alteration. Note that a single outlier was removed from this diagram. (B) Box and whisker plots showing different Zr/ TiO2 ratios for tonalite (n = 209), diorite (n = 78), quartz diorite (n = 23) and quartz porphyritic diorite (n = 9). Black circle is the mean and central box the middle 50% of the data from Q1 to Q3. Circles are outliers and triangles far outliers.
Although tonalite and diorite are both altered by albite, their compositional difference results in different chemical changes. Tonalite is characterized by extreme enrichment in Na2O accompanied by a decrease in SiO2 (Figure 12A). Overall, it reflects a combination of the change in plagioclase composition (i.e., from An30–50 to An0) with variable loss of quartz. Thus for the tonalite a simple trend is defined in Figure 12A towards albite, whereas for the altered diorite a different trend is defined due to an increase in both Na2O and SiO2 owing to the partial to complete destruction of mafic minerals (e.g., hornblende) and change of plagioclase composition. Due to strong development of albite, the La/YbN ratio versus Na2O can also be used to discriminate between biotite and albite altered rocks (Figure 12B).
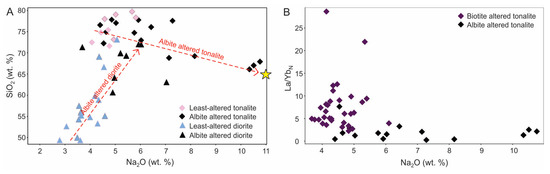
Figure 12.
Geochemical characterization of the albite altered tonalite and diorite units. (A) Binary plot showing an increase in Na2O and loss of silica for albite altered tonalite (n = 15) compared to an increase of Na2O and SiO2 silica in albite altered diorite (n = 9). Note that tonalitic samples plot towards pure albite (shown by the yellow star). The red dashed lines show a general trend of albite alteration inferred from the data. (B) Plot of La/YbN versus Na2O that distinguishes albite altered samples from biotite altered samples. Chondrite normalizing values used are after [43].
Katz et al. [10] discussed the spatial relationship between Au mineralization and albite alteration as seen in both outcrop and drill core and noted its inconsistency. In addition, there is no correlation of Au with Cu in albite altered samples.
5.2. Rare Earth Element Geochemistry
The rare earth elements (REE) are typically found to be immobile in many hydrothermal ore systems, even when subjected to intense hydrothermal alteration, but exceptions occur (e.g., [45,51,52,53,54,55,56,57,58,59]). Thus, it is relevant to note here that in both the tonalite and diorite the REE concentrations, in particular the LREE, change dramatically in altered equivalents (Figure 13). Here we show that REECN patterns can be used to differentiate between some of the alteration stages.
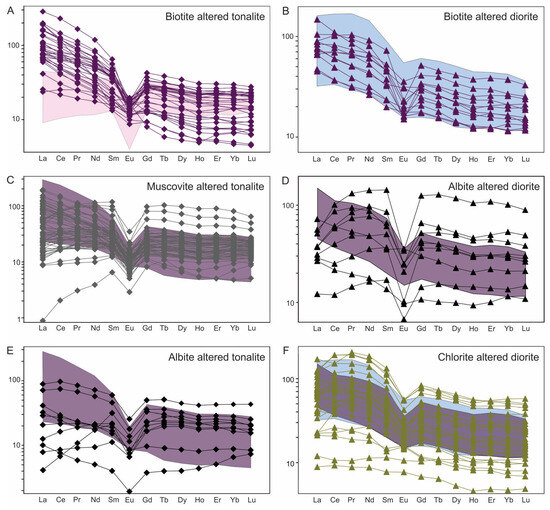
Figure 13.
Chondrite-normalized REE diagrams (values from [43]) used to characterize different alteration stages. (A) Flat, unfractionated pattern typical of least-altered tonalite (n = 9) in shaded pink compared to LREE-enriched biotite altered tonalite (n = 32). (B) Comparison of least-altered diorite (n = 16) in the shaded blue with biotite altered diorite (n = 12). (C) Muscovite altered tonalite (n = 64) showing two REE patterns: (1) LREE-enriched with a negative slope (i.e., LREE > HREE); and (2) relatively flat slope with depletion from La to Pr, as seen in albite altered samples (see (D)). Note REE pattern for biotite altered tonalite (from (A)) is shown in purple shaded area. (D) Albite altered diorite (n = 9) showing depletion in LREE, especially La, Ce and Pr, compared to biotite altered diorite in purple shaded area (from B). (E) Selected samples of strong albite altered tonalite (n = 10) showing overall REE depletion, but particularly of LREE compared to biotite altered tonalite in the purple field (from (A)). (F) Chlorite altered diorite (n = 36) with concave-shaped LREE profile typical of the least-altered diorite, but also showing depletion of ∑REE. Shown for comparison are least-altered and biotite altered diorite in light-blue and purple shaded areas from (B), respectively.
Biotite altered samples have straight, negatively-sloped and strongly fractionated LREE patterns (i.e., La/SmN >> 1; Figure 13A) due to the presence of LREE-bearing minerals, such as allanite and bastnaesite (noted above, Figure 5E,F), which are LREE sinks (e.g., [60]). These patterns contrast markedly with the flatter REE patterns and lower ∑LREE exhibited by least-altered tonalite (pink shaded area in Figure 13A). The latter contrast for altered tonalite is less pronounced between least-altered and biotite altered diorite whereby a convex LREE pattern and negative slope characterizes the protolith (blue shaded area in Figure 13B) with the altered equivalent having similar ∑REE but straighter fractionation patterns. Thus, regardless of the LREE concentration it is apparent the straight negative-sloped LREE signature characterizes the biotite alteration and reflects the REE patterns of new mineral phases (e.g., bastnaesite, allanite).
Muscovite alteration is superimposed on biotite alteration zones, hence both muscovite altered tonalite and diorite are compared to biotite altered samples. Weak-to-moderate muscovite altered samples have negative-sloped LREE patterns similar to that in the biotite altered samples (shaded area in Figure 13C), whereas many of the moderate-to-intensely muscovite altered samples show flatter REE patterns with some distinctly LREE depleted. These contrasting patterns in the same alteration type suggest the elevated LREE signature was inherited from the earlier biotite alteration and survives where muscovite is weakly developed, but where more intense these minerals are destroyed, in particular with depletion of La and Ce. Muscovite altered samples are also characterized by larger negative Eu anomalies than for the biotite stage, which is consistent with destruction of plagioclase. In contrast, the HREE appear to be relatively unaffected by this alteration, except for a few samples (n = 3) with HREE enrichment.
The REE patterns for albite alteration also suggest mobilization of the REE (Figure 13D,E). Where biotite altered diorite is overprinted by albite alteration, there is a marked change in its patterns with a strong depletion of LREE and development of a positive slope from La to Sm, excepting for two samples that retain similar patterns to the diorite. There is also development of more negative Eu anomalies in most sample (Figure 13D), which is likely due to replacement of calcic plagioclase by albite. The REE patterns are consistent with the general abundance of secondary titanite in these albite altered rocks as hydrothermal titanite often has similar REECN patterns, in particular LREE enrichment with a convex profile (e.g., [61,62,63]). Similarly, albite altered tonalite typically has lower concentrations of LREE and flatter patterns compared to biotite altered tonalite (Figure 13E) but lacks the overall REE enrichment as in altered diorites due to a lack of titanite.
Chlorite altered diorite also shows some REE mobility compared to both least-altered and biotite altered diorite (Figure 13F). In general, the chlorite altered diorite samples display a similarly LREE enrichment as the least-altered diorite except for a few samples that contain the straight-sloped LREE pattern characteristic of biotite alteration, but the altered samples have the distinct convex patterns typical of titanite. In addition, a few samples with low ∑REE that have straight, slightly sloped to flat patterns with no Eu anomaly. In general, therefore, the REE abundance and patterns for chlorite altered diorite reflect that of the precursor diorite whether it be least-altered or biotite altered.
5.3. Whole-Rock Lithogeochemistry and Metal Associations
The summary for the whole rock data is presented in box and whisker plots in Figure 14, which highlight aspects already noted, such as: (1) enrichment of F in the magmatic-hydrothermal biotite breccia; (2) overall enrichment of all units in CO2; (3) LREE enrichment (i.e., high La/YbN) in biotite altered tonalite; (4) Ba and Rb enrichment in both biotite and muscovite altered tonalite and diorite; and (5) higher Zr/TiO2 values for the tonalite versus diorite.
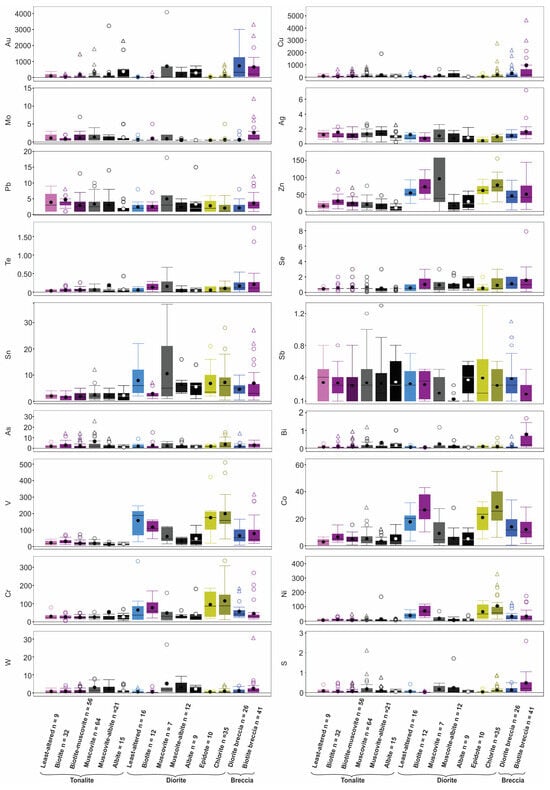
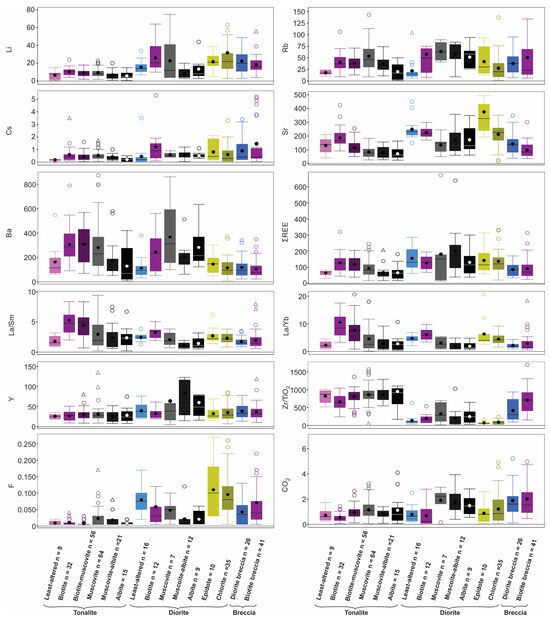
Figure 14.
Box and whisker plots showing abundance of selected trace elements (ppm, but ppb for Au), volatiles (wt. %; F, S, and CO2), and elemental ratios for different lithologies and alteration types. Note the use of different colours to discriminate the lithologies. The bottom of each box is Q1, the top is Q3 and the whiskers are the extreme values that are not outliers. An outlier (circle) is further than 1.5 × (Q3 − Q1), whereas a far outlier is further than 3 × (Q3 − Q1); outliers were omitted for several plots (Zn, Ag, Se, V, Cr, S, Rb, Sr, La, Lu, Cs, Y, Zr/TiO2, La/Yb, F, La/Sm) and far outliers were also omitted for several plots (Au, Ag, Te, W, Cu, Ni, Pb, CO2, Sn, Bi, Li, La/Yb, F) for clarity.
The whole-rock data are also used to assess different metal associations in the host and various altered equivalents. Overall, there is a lack of correlation of elemental enrichment in tonalite and diorite (Figure 14), but some generalizations are noted. The diorite unit is enriched compared to the tonalite in cafemic (i.e., Sr, Co, Cr, Ni, V, Zn) and lithophile (Li, Sn) elements, which reflects its abundance of primary amphibole and oxides versus secondary biotite and muscovite (e.g., [42]). For Au and Cu their enrichment is most evident in the two main breccias (e.g., diorite breccia and biotite breccia) and sheeted veins, as discussed below. Noted also is the overall depletion of all samples in As, Sb, Bi, and W.
Both the magmatic-hydrothermal biotite breccia and sheeted veins have an Au, Cu, Mo, Ag, Te, Bi, and Se signature (Figure 14 and Figure 15). The geochemical profiles presented previously (Figure 7) also show the Au-Cu association in the breccia, along with variable Mo and Te. A well-developed ore shell and close correlation of Au and Cu grades suggests deposition of these metals synchronously with the magmatic-hydrothermal breccia event. In addition, a positive correlation between Bi and Te in the breccia is noted and consistent with the rare presence of tellurobismuthite (Bi2Te3). Ternary plots show the higher Te and Bi values correspond to higher Au grades in the breccia unit and sheeted veins (Figure 15A,B), but no such association is seen for the tonalite or dioritic rocks which indicates this is a hydrothermal signature. Higher Mo contents occur almost exclusively in the magmatic-hydrothermal biotite breccia versus diorite breccia, but in general the highest Mo does not equate to higher Au grades (Figure 15C).
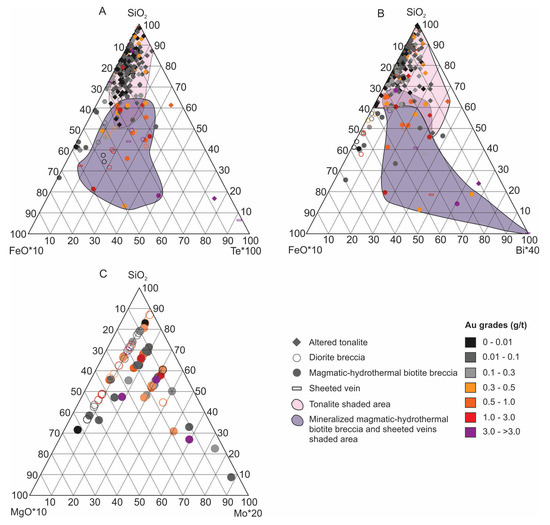
Figure 15.
Ternary diagrams showing metal associations for diorite and magmatic-hydrothermal breccias. (A) SiO2-FeO*10-Te*100 diagram showing enrichment of Te, as well as Fe, in both Au-bearing magmatic-hydrothermal biotite breccia and sheeted veins compared to tonalite. Note that diorite samples are not shown for clarity. (B) SiO2-FeO*10-Bi*40 diagram showing Bi enrichment in Au-bearing magmatic-hydrothermal biotite breccia and sheeted veins. Some of the altered tonalite trends towards Bi and these samples are typically muscovite altered. (C) SiO2-MgO*10-Mo*20 diagram showing regardless of Au grade the magmatic-hydrothermal breccia is enriched in Mo, whereas the diorite breccia is not.
5.4. Chalcopyrite Chemistry
A total of 70 analyses of chalcopyrite from nine samples are summarized in Table 2 and relevant binary plots in Figure 16. Eight samples representing the three styles of mineralization (i.e., breccia, disseminated, and vein) plus a high-grade Cu vein sample outside of the deposit envelope from the former Chester Mine were used. The data reveals highly variable amounts of Zn (28 to 1900 ppm), Ag (0.1 to 259.2 ppm), Se (30.36 to 214.8 ppm), Pb (1 to 127 ppm), Bi (1.7 to 119 ppm), Sn (0.72 to 114 ppm), In (5.025 to 100.3 ppm), Au (0.0041 to 17.2 ppm), Cd (0.45 to 47.9 ppm), Te (0 to 6.8 ppm) and Sb (0.04 to 0.81 ppm). Of these elements, Se, In, and Sb did not show correlations.
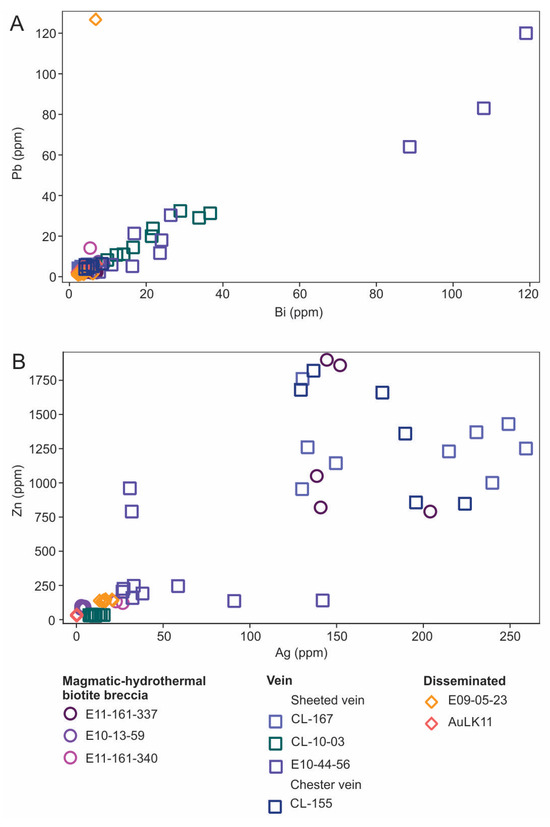
Figure 16.
Bivariate plots showing abundances of selected trace elements in chalcopyrite for a variety of settings. (A) Pb versus Bi with a positive correlation (r = 0.77). (B) Zn versus Ag with a positive correlation with increases of Zn and Ag in magmatic-hydrothermal biotite breccia, sheeted veins, and Chester vein samples (r = 0.83).
Elevated Au in vein samples corresponds to enrichment of Bi and Pb with these two elements strongly correlated (r = 0.77; Figure 16A). Gold contents are low and variable within and among samples. Notably, chalcopyrite from the Au-bearing (above cut-off at >0.3 g/t Au) magmatic-hydrothermal biotite breccia samples have the lowest Au values (0.0041 to 0.258 ppm) suggesting it occurs either as micro-inclusions or as free gold. Likewise, Te is lowest in the breccia, which given its enrichment in this unit noted above (Figure 15A), suggests discrete Te-bearing phases. Interestingly, Te and Bi correlate moderately in vein and breccia material (R = 0.68 and 0.49, respectively), but no such correlation is noted in disseminated-type mineralization. Silver and Zn are strongly correlated (r = 0.83; Figure 16B) with the most elevated concentrations in chalcopyrite from breccia and vein material (i.e., sheeted vein and Chester vein), but not for disseminated chalcopyrite. Similarly, Cd is strongly correlated with Ag and Zn (note these plots are not included here).
5.5. Mass Balance
The geochemical data were used to quantify mass change and elemental gains and losses attending the different alteration types using the Grant method ([40]) Figure 17 shows that some combination of TiO2, Zr, Al2O3 and SiO2 defined the isocons for the various alteration types, thus these elements were conserved or immobile (i.e., black dots in Figure 17; see also the Zr/TiO2 ratios in Figure 14). Additionally, as all the isocons have slopes of unity, except for chlorite altered samples, little if any mass or volume change occurred during alteration. Elemental changes (i.e., % gains/losses) for each alteration type per host rock are given in Table 5 and summarized in Figure 18. Note that for the isocon plots averages for each alteration type are used, but for the summaries of elemental changes presented in Figure 18 all samples are shown.
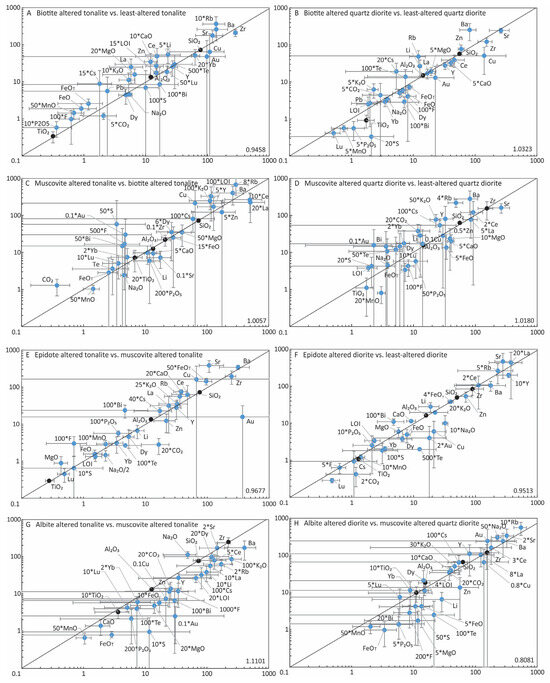
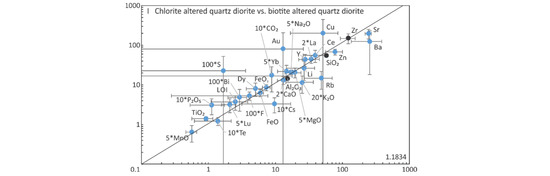
Figure 17.
Summary of representative isocon diagrams using the most relevant elements for the different alteration types. Note data for various elements have been multiplied or divided to fit a common scale of the diagram. Black lines equate to the isocons, as defined by ratios of various immobile elements denoted by black circles, which were used for calculating the gains and losses (see Figure 18 and Table 5). The grey error bar lines represent the standard deviation.
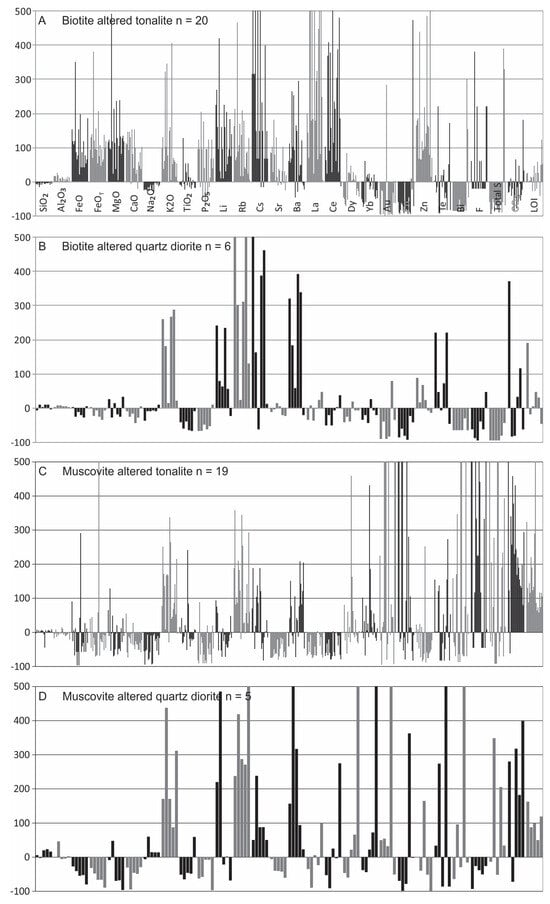
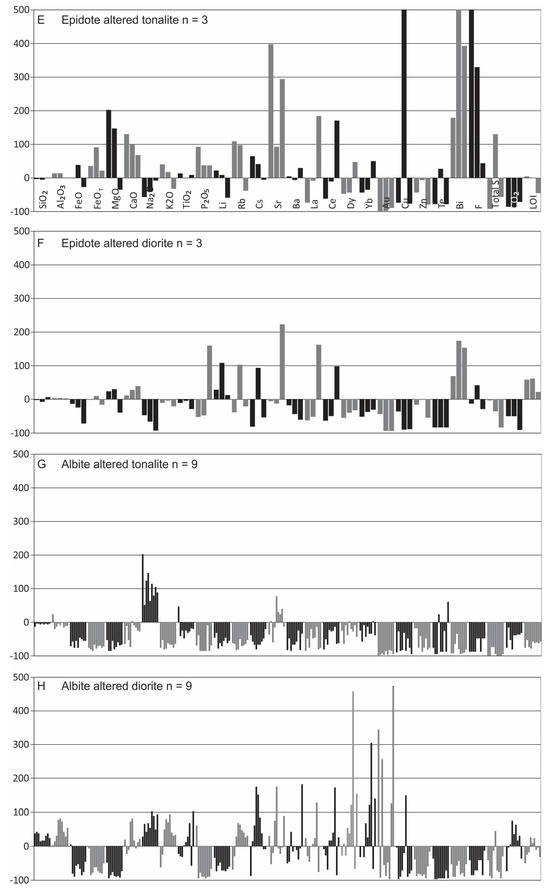
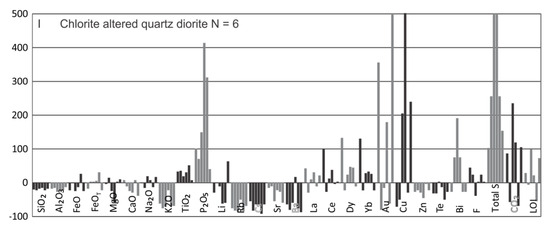
Figure 18.
Summary diagrams for the gains and losses of major and trace elements in the main alteration types using the Grant-type isocon method (see Figure 17). Note that all gains are cut-off at 500%.
Biotite stage: Given that biotite alteration is early and widespread, unlike the rare and localized amphibole stage, altered samples are compared to least-altered tonalite and quartz diorite. Biotite altered tonalite samples include disseminated/stockwork types, whereas biotite altered quartz diorite samples used include only disseminated type.
For disseminated biotite altered tonalite (n = 20), most major elements (K2O, FeO, FeOT, MgO, MnO, CaO, P2O5) and LOI show gains, but for Na2O there is minor loss (Figure 17A and Figure 18A). The trace elements show moderate to strong gains for Li, Rb, Cs, Sr, Ba, La, Ce, and Zn, and F, with overall losses for Au, Cu, Bi, S, and CO2. Several elements (e.g., Dy, Yb, Te, F, CO2, and LOI) are variable with regard to gains and/or losses (Figure 18A).
For biotite altered quartz diorite (n = 6), there is consistent gain in K2O, variable gains in CO2 and LOI, overall weak losses for FeO, FeOT, CaO, MnO, Na2O with a pronounced loss for P2O5; MgO is variable (Figure 17B and Figure 18B). For the trace elements, there are overall strong to moderate gains in Li, Rb, Cs, Ba, Zn, and Te, with strong to weak losses for Cu, Bi, and S (Figure 17B and Figure 18B). Gold, Sr, Ce, Dy, Lu, and F display overall losses with individual samples displaying some gains, whereas La, CO2 and LOI display overall gains, but individual samples may display losses (Figure 17B and Figure 18B).
Both biotite altered tonalite and quartz diorite contain gains in K2O, but the overall variable gains and losses for the other major oxides (i.e., FeO, FeOT, MgO, CaO and P2O5) between the tonalite and quartz diorite are attributed to differences in their initial geochemistry. Thus, the lower initial abundances for most of these elements in tonalite is reflected in their substantial gains and the formation of secondary biotite, epidote, magnetite, apatite, and calcite. The noted and expected gains of K2O, Li, Rb, Cs, Ba, Zn, F (tonalite only), and LOI in both units reflects the high partitioning of these elements in biotite (e.g., [42,64,65]). For the same reason, the gain of Sr in biotite altered tonalite is commensurate with gains of CaO and Fe2O3 (note this plot is not included) and reflects the addition of epidote, as well as some calcite, which is not seen for altered quartz diorite samples. Lesser and variable gains in Pb, Se, and As (Table 5) are also attributed to their partitioning into biotite [64].
The strong gains of La and Ce in biotite altered tonalite (also seen in REE plots; Figure 13) reflects the addition of LREE-bearing minerals (i.e., bastnaesite, allanite). In contrast, minor losses of LREE occur in biotite altered quartz diorite is attributed to initially higher abundances of LREE in the quartz diorite compared to tonalite.
Although individual samples show gains for Au, Cu, Bi, and S, there are overall losses of these elements for disseminated and stockwork biotite altered samples which relates to the general paucity of sulfides in the samples, as is also seen in the box and whisker plots (Figure 14). Lastly, gains in Te, similar to that seen in magmatic-hydrothermal biotite breccia, occur but not of the degree to constitute correlations with tonalite or dioritic rocks as noted above (Figure 15B).
Muscovite stage: The muscovite altered tonalite was compared to average biotite altered tonalite, its inferred precursor based on overprinting relationships (Figure 17C). In contrast, fracture-controlled and pervasive muscovite altered quartz diorite are compared to least-altered quartz diorite (Figure 17D).
The muscovite altered tonalite (n = 19) records overall addition of K2O, F, CO2, LOI, and variable S, whereas FeO, FeOT, MnO, CaO, Na2O, and P2O5 record losses (Figure 17C and Figure 18C); however, both FeO and MgO are noted to vary with some individual samples recording gains. For the trace elements, strong to moderate overall gains are noted for Rb, Cs, and Ba, whereas losses occur for Sr, La, Ce, and Zn (Figure 17C and Figure 18C). For several trace elements, both gains and losses are noted, as shown by Li, Dy, Yb, Au, Cu, Te, and Bi (Figure 18C).
The muscovite altered quartz diorite (n = 5) shows gains in K2O, CO2, LOI, and typically S and Na2O, with overall losses of FeO, FeOT, MgO, MnO, CaO, and P2O5 (Figure 17D and Figure 18D). The trace elements show strong to moderate overall gains in Rb, Cs, and Ba, as does Au, but Sr, La, and F show overall losses (Figure 17D and Figure 18D). Many trace elements variably show gains and losses, such as Li, Ce, Dy, Yb, Cu, Zn, Te, and Bi (Figure 17D).
As expected, K2O, Rb, Cs, Ba, LOI, and CO2 all show strong to weak gains in both muscovite altered tonalite and quartz diorite, which reflects addition of muscovite and carbonate during alteration, with loss of CaO and Sr due to muscovite replacing calcic plagioclase. In addition, loss of FeO, MgO, and P2O5 in muscovite altered tonalite is due to the breakdown of secondary biotite and apatite, whereas loss of FeO, MgO, CaO, TiO2, P2O5, and F in muscovite altered quartz diorite is the result of replacement of the primary mineralogy (i.e., hornblende, plagioclase, titanite, ilmenite, and apatite) by muscovite. The overall strong gain of F in the altered tonalite reflects addition of muscovite, whereas overall loss of F in altered quartz diorite is due to its abundance in primary titanite and apatite. The inconsistency of Li (i.e., gains and losses) in both tonalite and quartz diorite rocks likely reflects it being inherited from early biotite alteration, which is supported by losses of Li concomitant with Mg. The consistent loss of both La and Ce in muscovite altered tonalite reflects destruction of LREE-bearing minerals originally present in the biotite altered samples. Conversely, the variability (i.e., gains and losses) of La and Ce in muscovite altered quartz diorite samples is attributed to some samples having inherited LREE-bearing minerals from earlier biotite alteration and destruction of these minerals in other samples.
The overall significant gains in Au and Cu associated with muscovite alteration is noted, but Au gains are not always commensurate with gains in Cu. In addition, this alteration stage is characterized by enrichments Mo, Ag, Te, Se, As, Pb, W and Sn. Gains of Fe may reflect the abundance of pyrite and corresponds to large gains in S in some samples.
Epidote stage: The averaged fracture-controlled and pervasive epidote altered tonalite were compared to average fracture-controlled muscovite altered tonalite as this is the inferred precursor (Figure 17E). In contrast, the averaged epidote altered diorite is compared to the average least-altered diorite (Figure 17F).
For the epidote altered tonalite (n = 3), the major elements show enrichments in FeO, FeOT, MgO, MnO, CaO, K2O, and P2O5, whereas weak to moderate losses for Na2O (Figure 17E and Figure 18E). Strong gains are noted for Sr, Bi, and F with inconsistent but overall gains in Rb, Cs, and Ba, whereas there are strong losses for Au and CO2. Variable gains and losses are evident for Li, La, Ce, Dy, Yb, Cu, S and LOI (Figure 18E) depending on the sample.
Compared to the average least-altered diorite, the average epidote altered diorite (n = 3) shows overall gains in MgO, CaO, and P2O5, and LOI with minor to strong losses in FeO, Na2O, K2O, and CO2 (Figure 17F and Figure 18F); overall FeOT is conserved. For the trace elements, there are typically weak to strong overall gains in Li, Rb, Sr, F, and Bi, whereas Ba, Dy, Yb, Au, Cu, Zn, and Te show losses. Cs, La, and Ce are variable, displaying both gains and losses (Figure 18F).
The inherent differences in geochemistry between the two host rocks partly accounts for notable differences in gains and losses (e.g., FeOT, MgO, CaO). As expected, both epidote altered tonalite and diorite show enrichment CaO, however, FeO and FeOT are on average conserved in altered diorite reflecting their higher original abundance compared to tonalite. Overall gains of FeO and MgO in tonalite samples may reflect accompaniment of chlorite with epidote. Addition of MgO and loss of K2O in altered diorite samples reflects the addition of chlorite and the replacement of hornblende, respectively, whereas the gain of LOI in this unit relates to the abundance of epidote. The substantial gains of Sr in altered tonalite result from its substitution for Ca in epidote. In contrast, loss of Na2O in both altered units reflects replacement of calcic plagioclase by epidote. The overall loss of LOI in tonalite samples is attributed to its LOI-rich precursor (muscovite altered tonalite) rock, whereas this is not the case for altered diorite. The general increase in Bi in both tonalite and diorite suggests an association of Bi in this alteration assemblage. The overall loss of Au and Cu reflects the general lack of mineralization in this alteration stage.
Albite stage: It is important to emphasize that the strong pervasive degree of this alteration in many cases precluded identification of the precursor unit, which was explored below with the precursor based on best fit according to field observations (see above and [10]).
For albite altered tonalite, it was compared to an inferred muscovite altered precursor based on crosscutting relationships. Samples were also compared to least-altered tonalite for comparison, but as results indicate gains in K2O, Rb, Ba, LOI, CO2, and Bi, which contradict petrographic observations, this supports use of the muscovite altered tonalite as the precursor unit. As for the diorite, muscovite altered quartz diorite is the preferred least-altered precursor even though it is not possible to choose between the quartz diorite or diorite. Despite large changes in several constituents, including losses and variability for most of the major oxides, particularly in the diorite, Al2O3, SiO2, TiO2, and Zr yield isocons with a slope of unity (Figure 17G,H) which validates use of the selected precursors.
In pervasive albite altered tonalite, there is strong enrichment in Na2O and overall moderate to strong depletions in the other major oxides, including all the volatiles (F, S, CO2, LOI; Figure 17G and Figure 18G). Notably, all the trace elements are also depleted except for Sr (Figure 18G).
In albite altered diorite, a different pattern of elemental change is noted. Whereas a weak to moderate enrichment of Na2O is seen, strong losses in FeO, FeOT, MgO, MnO, and P2O5 and all the volatiles (F, S, LOI) except CO2 (Figure 17H and 18H) occur. Both gains and losses occur for CaO and K2O and is sample dependent. Strong overall losses in trace elements include Li, Cu, Zn, Te, and Bi (Figure 17H and Figure 18H), whereas Rb and Cs show overall gains. Many trace elements are variable and display gains or losses, such as Sr, Ba, La, Ce, Dy, Yb and Au (Figure 18H).
As expected, there is addition of Na2O in the albite altered samples due to pervasive replacement of primary and secondary minerals, the latter from biotite and muscovite alteration with commensurate losses of FeO, FeOT, MgO, MnO, P2O5, Li, Zn, Te, Bi, F, S and LOI. The overall loss of the REE is consistent with REECN patterns for albite altered samples. Gains of CaO and CO2 in the altered diorite likely reflects carbonate, whereas enrichment in K2O, Rb and Cs in the diorite reflects remnant muscovite and correlates with petrographic observations. In albite altered tonalite, CaO, K2O, Rb, Cs, Ba, La, Ce, Dy, Yb, Au, Cu and CO2 display consistent losses, whereas in albite altered diorite samples these elements display both gains and losses. The variability in the diorite compared to the consistent losses in the tonalite may relate to variability of the former samples as noted above or be inherited from earlier alteration. The strong decrease of S in both lithologies is due to the absence of sulfides in albite altered rocks. As for Au, its overall loss in the tonalite and gain in diorite reflects the inconsistent association of Au mineralization in albite altered rock samples, whereas the overall losses of most metals (i.e., Cu, Zn, Te, Bi, etc.) is due to the strong leaching capability of the fluids.
Chlorite stage: Only quartz diorite samples are included for this alteration. When compared to the precursor biotite altered quartz diorite, Al2O3, SiO2 and Zr define an isocon indicating slight mass loss (Figure 17I). Based on the latter, samples show large losses for K2O, large gains for P2O5 and S, and small variable changes for other major elements (FeO, FeOT, MgO, CaO, Na2O) and volatiles (LOI, CO2) (Figure 17I and Figure 18I). Losses for trace elements include Li, Rb, Cs, Sr, Ba, Zn, and Te. Several trace elements with variable changes but with overall gains are La, Ce, Dy, Yb, Au, Cu, and Bi (Figure 18I).
Overall losses of K2O, Li, Rb, Cs and Ba reflects replacement of biotite by chlorite. Interestingly, gains in La and Ce in some samples occur and are probably due to remnant LREE-bearing minerals in chlorite altered samples inherited from earlier biotite alteration, but may also reflect in part newly formed phosphates, although not documented, as seen in strong addition of P2O5. This latter observation demonstrates that LREE-bearing minerals can be robust in chlorite altered samples (Figure 13F), which is consistent with petrographic observations [10]. Again, as expected gains in Au are not consistently associated with gains in Cu.
6. Discussion
The use of geochemistry in ore deposit studies is an important tool, not only for addressing ore genesis and related exploration (e.g., [66,67,68,69,70,71,72,73,74]), but also for ore deposit classification [7,69,70]. However, paramount in using geochemistry is identifying the true elemental gains and losses from mass balance, as noted above (e.g., [68]). In this particular case, the use of geochemistry can be helpful in discriminating between intrusion-related, which here we equate to porphyry-type for Côté Gold [10,11], versus orogenic deposit types.
It is well established that porphyry deposits have a spatial, temporal, and genetic link to fluids released from contemporaneous intermediate to felsic hydrous magmas [3,4,72,75]. Consequently, a zonal distribution of alteration types develop due to cooling and chemical equilibration of the fluids with the host intrusion and enveloping rocks [4]. This zonal alteration is typically manifested by a central potassic zone that gives way to a phyllic zone bordered by a narrow argillic zone; this is surrounded by a larger alteration halo of green rock, the propylitic zone that exceeds the limit of the orebody. In contrast, orogenic type deposits, generated during or immediately after the main phase of shortening and post-peak regional metamorphism, are characterized by a more focused and restricted alteration footprint, which lack the signature of magmatic-derived fluid [2,7,76,77,78,79]. In such orogenic deposits, the alteration (Fe-carbonatization, sericitization, and sulfidation) is focused along structural conduits (i.e., faults, shear zones) with a lateral and vertical zonation versus a zonation centered on the causative magmatic intrusive complex. Accordingly, these two deposit types have distinct characteristics that can be used to distinguish them, the porphyry-type being distinguished by: (1) an overlap of hydrothermal activity with magmatism; (2) a proven genetic association of the hydrothermal alteration with the causative intrusion; (3) distinct metal association and zonation; (4) fluid chemistry as reflected by lithogeochemistry, fluid inclusion types, and isotopic signatures; and (5) a contrasting chronology relative to the main phase of deformation (shortening). Even using these five parameters, the correct assignment of a deposit to an ore system, especially where overprinted by deformation and regional metamorphism, can prove difficult (cf. [80]). For example, this has been particularly challenging where others have argued in favor of Archean porphyry-type deposits, such as at Lac Troilus [81,82] and Malartic [83,84], as well as Phanerozoic reduced intrusion-related deposits [69,85,86].
6.1. Classification of the Côté Gold Deposit
The first two criteria noted above, which are partly based on geochronology, have been addressed previously [10,11,12]. Results for U-Pb dating of magmatic zircon and titanite and hydrothermal titanite in addition to Re-Os dating of molybdenite from auriferous veins and alteration zones all overlap at ca. 2740 Ma. Furthermore, these ages are significantly older than the known time (i.e., <2670 Ma) for orogenic-type mineralization in the AGB (see recent summary in [13]). This absolute timing of events is also supported by independent structural observations which have shown that regional main-phase of shortening deformation in the SGB (~2696 to 2675 Ma) overprints the veins and alteration related to the early magmatic-hydrothermal system at the Côté Gold deposit [87,88].
A porphyry-type model was suggested based on an inferred genetic link of the alteration types (i.e., amphibole, biotite, muscovite) to the causative dioritic intrusion [10]. The hydrothermal amphibole stage has been attributed to volatile exsolution of a causative dioritic magma based on a similar mineralogy (e.g., amphibole, apatite, titanite, magnetite, and quartz) and mineral chemistry for both magmatic and hydrothermal amphiboles. For the biotite stage, a genetic relationship is inferred based on the similar REECN patterns for the matrix of the magmatic-hydrothermal biotite breccia and diorite. In addition, in calcic systems derived from an original dioritic rock, epidote occurs as an integral component of the biotite alteration assemblage [4,89], as occurs at Côté Gold. Katz et al. [10] also attribute the muscovite and epidote alteration to the same processes as in porphyry systems, this being the result of mixing of acidic, magmatic sourced fluids with an external fluid of more neutral chemistry [3,4].
Although this is the first study to fully examine the alteration lithogeochemistry of the deposit, some aspects of the fluid chemistry were previously presented. Kontak et al. [11] addressed the nature of the fluids using stable isotopes (O, C, S) for vein- and disseminated-style mineralization, as well as vein samples from the Chester vein system (i.e., former Chester Mine). The results for all samples are consistent with a dominantly magmatic source, but the data, in particular the calculated δ18OH2O values, also indicated input of a second fluid, either meteoric and/or seawater. More recently, Gourcerol et al. [14] showed that the fluid inclusions throughout the paragenesis is dominated by aqueous-carbonic fluids of variable XCO2, salinity (7–35 wt. % eq. NaCl), and chemistry (i.e., Na- dominant with Ca, Fe, S, and F) with maximum homogenization values of 350 °C. These fluid properties were interpreted to indicate a magmatic origin and consistent with the summary of fluids associated gold deposit across the Abitibi greenstone belt [90,91]. Interestingly, Crépon et al. [92] have also documented a similar fluid chemistry (i.e., saline, aqueous-carbonic, Na-Ca-Fe-F) for a deposit setting in the Archean Chibougamau Cu-Au Camp located in the eastern part of the ABG interpreted to be of porphyry-type origin.
Proper classification of the Côté Gold deposit is critical, as its genesis has important implications for understanding the formation of and exploration for Au deposits in the Abitibi greenstone belt and Archean greenstone belts in general. Thus, further discussion below focuses on the nature of the fluids responsible for the observed hydrothermal alteration in terms of elemental gains and losses, REE mobility, and elemental associations. These data are also used to evaluate the porphyry-related model. The results from this study are fully examined and integrated with previous observations in order to establish a comprehensive genetic model for the deposit and geochemical criteria for exploration.
6.2. Chemical Signatures of Alteration Stages
Amphibole stage: Differences between the chemistry of magmatic and hydrothermal amphibole provides chemical information regarding the nature of the hydrothermal fluid. A fluctuating but general increase in fO2 (i.e., higher Mg#) from magmatic to hydrothermal conditions has been noted in both amphibole and biotite from porphyry deposits [93,94] with amphibole noted to have higher Si, Mn, and Ca, but depletion in Fe, Ti, Na, K and Cl relative to less oxidized magmatic domains [94]. In Côté Gold, Katz et al. [10] showed hydrothermal amphibole in the breccia is zoned with Mg# increasing from core to rim which suggests relatively more oxidized conditions compared to the magmatic stage. In addition, these Mg-rich domains contain higher Si, Ca and F contents and lower Ti and Cl than magmatic amphiboles, which is also consistent with the change in fluid chemistry documented by Chivas ([94]). Thus, the documented change in mineral chemistry supports a genetic relationship from an early magmatic system which evolved to a hydrothermal-dominated system that records an increase in fO2.
Biotite stage: Mass balance indicates a difference in the elemental enrichment of tonalite versus diorite, which likely reflects the different bulk chemistry of the host rocks. As the tonalite host is more sensitive to the changes, it best reflects the chemical signature of this alteration stage, which is enriched in Fe, Mg, Mn, Ca K, P, Li, Rb, Cs, Ba, LREE, Zn, Pb, Te, F, and LOI. That this signature is similar for different types of biotite assemblages (i.e., disseminated, veins, breccias) suggests a common fluid. Importantly, as the trace element signature of secondary biotite [10] shows appreciable quantities of Li (58 to 134 ppm), Rb (250 to 1408 ppm), Cs (7 to 70 ppm), Ba (22 to 3600 ppm), Mn (244 to 1594 ppm), and Zn (140 to 648 ppm), this validates the calculated gains noted above which are therefore related to this hydrothermal stage.
Both Rb and Cs readily substitute for K due to similar geochemical characteristics, thus such coupling has been noted in other alteration settings (e.g., [95]). Similarly, Li is known to substitute for Mg [95,96,97], which accounts for its enrichment in the Mg-rich biotite at Côté Gold (see [10]). In contrast, Ba is more enigmatic in potassic alteration zones in porphyry systems where both losses (e.g., Bajo de la Alumbrera [98] and Batu Hijau [99]) and gains (e.g., Sierrita [100]) are reported. Loss of Ba in some systems may reflect its compatible nature in regard to fractionation (e.g., [101]) or also relate to variable (i.e., lower) Kd values for hydrothermal versus magmatic biotite (e.g., [42]). Conversely, Ba may substitute for K in K-silicates [95,96]. Thus, the noted gain of Ba in both altered tonalite and diorite likely reflects a combination of Ba released from alteration of calcic plagioclase in the host rocks and addition from the fluids with subsequent sequestering in hydrothermal biotite and muscovite.
As with Ba, the geochemical behavior of Sr reflects the abundance of Ca [102], thus it should decrease with increasing fractionation. Consequently, Sr is usually depleted in potassic alteration zones of porphyry systems, and this is even more pronounced with extensive replacement of Ca-bearing minerals (i.e., plagioclase [102,103]). However, in this case the local gains of Sr noted (i.e., epidote altered diorite) likely reflects the coupled breakdown of calcic plagioclase in the biotite altered host and formation of epidote.
The noted addition of Zn is attributed not only to its incorporation into biotite, but also to sphalerite in the alteration assemblage. Enrichments in Zn and Pb in disseminated and stockwork-type biotite alteration outwards from the high-temperature breccia is consistent with base-metal zonation in porphyry systems (e.g., [4,104]). Zinc has been documented to be initially enriched in potassic alteration zones, but then subsequently remobilized outward (e.g., Panguna [93]); in the case of Côté Gold, Zn remains enriched in the biotite alteration stage relative to other alteration types but is a minor component of this stage.
Potassic alteration, as reflected by biotite and/or K-feldspar, is ubiquitous in porphyry systems and forms early in high-temperature core zones [3,4]. In contrast, these assemblages are not typical of orogenic gold deposits [2,76] and rarely documented for orogenic deposits hosted in granitoid rocks [7]. Additionally, that the biotite alteration is widespread and zoned (i.e., magmatic-hydrothermal biotite breccia core with peripheral veins and disseminations) at Côté Gold is thus wholly inconsistent with an orogenic setting. Furthermore, the Fe-Mg-K-Ca-bearing fluids, and also F, responsible for development of the biotite stage is more aligned with a magmatic fluid having exsolved from a co-spatial and contemporaneous diorite magma, albeit at depth. Lastly, the elemental gains associated with the biotite stage are similar to those widely documented in potassic alteration zones in porphyry deposits (e.g., Panguna [93], Sierrita [100], Bajo de la Alumbrera [98], and Batu Hijau [99]).
Muscovite stage: Mass balance indicates that for both tonalite and diorite host rocks this alteration stage has a similar geochemical signature with enrichment in K along with Rb, Cs, Ba, CO2, and LOI with additional, albeit inconsistent, overall enrichment of Au, Cu, Bi, W, and S; moderate to weak enrichment is also noted for Te, As, Pb, Sn, Mo and Ag. Rubidium, Cs and Ba substitutes for K, whereas Sr is controlled by Ca [102,103], resulting in losses of both Ca and Sr due to replacement of calcic plagioclase by muscovite. No Sn- or W-bearing minerals have been noted, thus their gains are attributed to substitution into muscovite [97,105], which has been documented at Ann-Mason [106] and in many rare-metal granite settings (e.g., [107,108,109]).
Muscovite is common as part of alteration assemblages in both porphyry deposits, where it is represented by the phyllic zone [3,4], and also orogenic systems [2,7,76]. Gains and losses for the muscovite stage presented above are similar to those reported in porphyry systems (e.g., Bajo de la Alumbrera [98], Ann-Mason [106], and Darrehzar [110]), however, many of the elements are not discriminatory with respect to porphyry versus orogenic deposits. In fact, many orogenic deposits are also characterized by enrichments in LILE (K, Rb, Ca, Li, Cs, Ti), As, S, and volatiles (H2O, CO2 [7]), thus not helpful in terms of discriminating a fluid source. The latter simply reflects the compatible behavior of these lithophile elements in muscovite (e.g., [95]). In contrast, the association of base metals (i.e., Cu, Mo, Ag, Bi, Te, Sn and W) is less characteristic of orogenic deposits [7,76,111,112]. Thus, this latter aspect, in addition to widespread formation of muscovite in the deposit versus being localized to faults and shears, and isotopic data [11] are together more indicative of a magmatic origin for these fluids.
Due to the typical addition of Rb and loss of Sr in phyllic alteration in porphyry systems, both these elements have been advocated as potential pathfinders for porphyry deposits enveloped by volcanic rocks, but inadequate where hosted in altered granites [102]. It is suggested that Rb and Sr are useful at Côté Gold as the loss of Sr in muscovite assemblages demonstrated above (Figure 9D) can be used to distinguish between it and biotite altered rocks.
Epidote stage: The most prominent geochemical features of this stage are addition of Ca accompanied by gains of FeOT, Sr and Bi. Propylitic alteration in porphyry deposits is characterized not only by chlorite and epidote, both of which are sinks for Fe, but also of calcite and loss of albite [113]. Although chlorite and calcite accompany this alteration at Côté Gold, albite is not stable based on Na loss. The main chemical changes in propylitic alteration zones of porphyry systems is the addition of volatiles such as CO2, H2O ± S [3,33,113,114]. However, the lack of CO2 addition likely reflects a lack cafemic elements in previously altered rocks due to their stripping out (i.e., see strong depletions of Fe and Ca in Figure 18C,D) that therefore precludes uptake CO2 with alteration. Conversely, the noted gains in Bi is a feature not uncommon for porphyry or intrusion-related deposits [86,115,116], suggesting that magmatic fluids may have contributed to this signature [66]. The latter is further supported by the fact that Bi is the only element common to the biotite, muscovite, and epidote alteration zones, but this must be interpreted cautiously since inheritance may be a factor.
Albite stage: This alteration is characterized by gains in Na2O and strong depletions in the other major oxides, trace elements, and metals. Thus in the progression from biotite to muscovite alteration into the albite stage there is a commensurate decrease in Ca, Fe, Mg, and the LREE that reflects albitization of the calcic plagioclase, mafic minerals, and destruction and remobilization of LREE-bearing minerals. Although albitization of precursor plagioclase is common in greenschist facies metamorphism and orogenic gold deposits [7], U-Pb dating of hydrothermal titanite at ca. 2740 Ma constrains this alteration stage to being syn-intrusion and mineralization.
Albite alteration in porphyry systems is attributed to low-temperature metasomatism, but its origin can be complex [3,4] owing to possible involvement of variable fluid types of either magmatic origin (e.g., [117]) or regionally sourced, non-magmatic, saline fluids [114,118]. For Côté Gold, Katz et al. [10] argued development of the albite stage related to Fe- and Mg-depleted, but Na-rich fluids originating from tonalitic melts co-temporal with the diorite. This Na-rich fluid is consistent with the Ca- and metal-deficient nature of the albite alteration.
Hydrothermal fluids responsible for sodic-calcic alteration in porphyry deposits are capable of leaching and transporting components from the precursor rock [3] or mobilizing what was added in earlier potassic alteration, as reflected by K, Fe, Cu, and S depletion in the Ann-Mason porphyry deposit [118]. The latter observation is thus consistent with the results of this study. Although drill core and outcrop assay results indicate that some strongly albite altered rocks may be Au-bearing [10], the overall loss of metals compared to the precursor rock (i.e., muscovite altered), as constrained from mass balance calculations, suggests metals were in fact leached and explains therefore the erratic nature of Au in this alteration type.
Chlorite stage: This stage of alteration was previously interpreted as an overprinting event given it inherits the mineral assemblage and sulfides of the biotite alteration, in addition to the Mg# of the precursor biotite [10]. The loss of K2O, FeO, MgO, CaO, Li, Rb, Cs, Ba, Zn, and Te is consistent with chlorite overprinting and destroying the biotite assemblage. Further support for a replacement origin of the chlorite stage is suggested from: 1) similar REE patterns for chlorite altered diorite as its biotite altered precursor; and 2) the elemental signature of the chlorite altered rocks with gains in P2O5, Sn, S, Bi, CO2, LOI, Au, and Cu, which is similar to that for muscovite altered rocks. That the presence of chlorite towards the core of the deposit, specifically in areas where albite alteration overprints earlier biotite and muscovite alteration, is further evidence of replacing earlier alteration assemblages.
6.3. Implications of REE Enrichments and Depletions
It was shown above that ∑REE and REECN profiles for the different alteration stages varied during ore system evolution. Mobility of trace elements, such as the REEs, during fluid-rock interaction is of interest because, in some cases, they are used to interpret hydrothermal processes. In this context, several studies have documented alteration related mobilization of the REE [45,56,57,58,59,119] in a variety of deposit types, including porphyry [51,52,53,54,55,120], greenstone-hosted orogenic gold [111,121], and hydrothermal U-REE [52,122,123]. The mobility of REE has been reported to be favored by several factors, such as low pH, changing temperature, high fluid/rock ratios, and importantly the abundance and type of ligand which stabilizes the REE complexes (CO32−, F−, Cl−, P2O52−, SO42−) in fluids [51,124,125,126].
Where alteration is related to an inferred magmatic fluid, such as the potassic zone of porphyries, the REE abundances and fluid signature relates to the magma chemistry [124,127]. Here biotite alteration resulted in apparent LREE enrichment for the tonalite, but not the diorite; this difference is likely due to the lower original ∑REE in tonalite compared to diorite and also fluid:rock exchange. In addition, the similarity of ∑REE in altered versus least-altered diorite supports its inherited magmatic origin for the biotite alteration.
In porphyry systems, phyllic alteration is accompanied by a decrease in temperature and lower pH with increasing fluid/rock ratios [3,128] with involvement of external fluids also occurring at this stage (e.g., seawater or meteoric fluids [129]. Under these conditions, the REE are variably noted to be progressively leached [51,52,53,55,130] or enriched [54,126] as alteration intensity increases. Depletion of LREE concomitant with alteration intensity has been documented in phyllic alteration zones of some porphyry systems (e.g., Bakircay and Ulutas prospects [51] and Murgul [55]), which is consistent with their mobility under intense fluid/rock interaction [125,131] and low pH conditions [51,52,53]. For Côté Gold, LREE depletion, in particular La, Ce and Pr, in muscovite altered samples is attributed to a similar change in fluid conditions with incursion of an external fluid, likely seawater [10,11,14] that occurred during this alteration stage.
Similar to the muscovite stage, strong depletion of LREE in the albite stage is favored by high fluid/rock ratios. In addition, the leaching nature of the fluid appears to have affected the stability of the secondary LREE-bearing phases (i.e., bastnaesite, allanite). Also relevant in the albite stage is the presence of secondary titanite, which has a low affinity for the LREE, and that when combined with high fluid/rock ratios attending this alteration resulted in the noted depletion of the LREE.
6.4. Metal Associations and Zoning
By virtue of the different processes in which porphyry and orogenic deposit types form, the nature of their fluids, and consequently, their metal associations differ. Thus, porphyry deposits are noted to typically have a Cu-Mo-Au-Ag-Pd-Te-Se-Bi-Zn-Pb signature [4] and also contain a distinct metal zoning with Cu ± Mo ± Au cores that give way outwards to enrichment in base metals such as Zn ± Pb ± Ag [4,104,132]. It is also noted, however, that both the metals present and their zoning can vary from system to system [3]. Conversely, the metallogenic geochemical signature of orogenic Au deposits has Au variably coupled to a broad range of metals (e.g., Ag, As, W, B, Sb, Te, Mo, and Bi) and notably with relatively low Cu, Zn and Pb contents; additionally, is the lack of a distinct deposit-scale zoning [7,76,77,111,112].
The magmatic-hydrothermal biotite breccia and sheeted veins are characterized by an Au-Cu-Mo-Ag-Te-Bi-Se association, whereas biotite disseminations/stockworks have a Te-Se-Zn-Pb-As association, although both Te and Se concentrations are generally on average lower than the breccia. In Au-rich porphyry deposits, magmatic-hydrothermal breccias that are generated early in the system are co-temporal with potassic alteration and have been documented to contain higher Au and Cu than the surrounding stockwork and disseminated zones (e.g., Panguna [133]; Endeavour 27 at Goonumbla [134]). Notably, the same zonation is documented at Côté Gold with an Au- and Cu-rich magmatic-hydrothermal biotite breccia and lesser well mineralized stockworks and disseminations extending outward and therefore, the zonation is consistent with Au-rich porphyry systems.
The muscovite alteration, which partially overprints the biotite alteration in the central part of the deposit and has an Au-Cu-Mo-Ag-Te-Bi-Se-Pb-As-W-Sn association similar to that of the breccia, but notably its Au, Cu, Mo, Ag, Te, and Bi concentrations are lower on average in the former compared to the latter. In porphyry deposit models, phyllic alteration is traditionally depicted as peripheral to the mineralized potassic alteration zone [4,135]. However, where this alteration is Au-bearing the zone has been documented to be within versus peripheral to the potassic alteration at several deposits (e.g., Granisle and Bell [136], Far Southeast [137], and Alumbrera [138]). The overall increase in Au ± Cu compared to disseminated/stockwork biotite altered samples, along with additional gains in S, Bi, W and Sn, suggest that some primary mineralization accompanied formation of the muscovite stage alteration.
Chalcopyrite trace element data is consistent with the metal associations noted above in both biotite and muscovite alteration stages. These data show an association of Te and Bi for chalcopyrite in both the magmatic-hydrothermal biotite breccia and sheeted veins but is lacking for the disseminated type. Elevated Ag and Zn values occur for some breccias and sheeted veins, and also the Chester vein sample. Thus, this association is not only just restricted to the deposit, but also extends distally outside the deposit area, which lends support to earlier interpretations that sheeted veins, both inside and outside the deposit, were part of the early hydrothermal system and associated with biotite alteration rather than later orogenic origin [11]. As highlighted before, the sheeted veins have muscovite alteration haloes that are characterized by elevated Bi and Pb and suggest the metal association is inherited from overprinting the earlier biotite alteration.
In summary, the metal associations and their zonation in the deposit are considered to more closely resembles those of porphyry systems rather than of orogenic gold deposits, which again supports a magmatic origin for the ore fluid versus a metamorphic one.
6.5. Genetic Model and Exploration Implications
The results and interpretations presented support Côté Gold having resulted from coupled magmatic-hydrothermal processes, consistent with our earlier interpretations [10,11]. Collectively these studies suggest the deposit shares attributes with Phanerozoic porphyry-type magmatic hydrothermal settings with respect to the nature of the host rocks (i.e., oxidized causative magma), overlap of magmatic and hydrothermal events, association of Au mineralization with a hydrous breccia body, distribution and nature of alteration types (i.e., potassic and phyllic), presence of stockwork and planar veins, and both temporal overlap and inferred genetic relationship of alteration with magmatism. Most recently, Meng et al. [139] have shown that the oxidation state of the causative intrusive complex at Côté Gold (i.e., CIC in Figure 2) overlaps with that of arc magmas (i.e., ΔFMQ = +1 to +2), whereas Mole et al. [140] document similar FMQ values characterize many Archean intrusive complexes across the southern Super Craton. Most recently, Crépon et al. [92] characterized a similar oxidized intermediate magma of dioritic nature related to the Archean (ca. 2720 Ma) Cu-Au mineralized Chibougamau Camp of the AGB, a plausible analogue to Côté Gold in regard to nature of mineralization, alteration, and fluid chemistry. Thus, an important conclusion from these few examples is that redox appears not to be a limiting factor in regard to forming porphyry-type mineralized intrusive settings in the Archean.
Importantly, the hydrothermal alteration and mineralization at Côté Gold is interpreted to result from magmatic fluids migrating upwards and outwards from the cooling and fractionating magma source at depth. In the deposit and surrounding area, the extent of hydrothermal biotite is widespread [10] with evidence for the area of infiltration of a similar magmatic fluid to be much larger. For example, a similar fluid chemistry is documented for sheeted veins in and around the deposit and in the former Chester Mine area based on metal associations and similar trace element abundances of chalcopyrite presented above, as well as isotopic signatures (δ34S, δ18O; [11]) and fluid inclusion thermometric and chemical data [14]. In addition, preliminary work on the Gosselin deposit, located just northeast from Côté Gold (Figure 2), indicates it shares similar host-rock types, alteration (e.g., biotite, muscovite), Au-Cu association, and fluid type (our unpublished observations; [9,141]). Thus, important for exploration is that the imprint of magmatic-sourced fluids extends well beyond the economic ore envelope of the Côté Gold deposit (i.e., open pit and resource shell) and strongly suggests the prolong extraction of mineralizing fluids from an evolving magma body at depth which is part of the generalized porphyry-deposit model [3].
The sequence of alteration types, their zonation in the deposit and their chemistry (i.e., gains and losses, REE patterns, metal associations, and isotopes) is consistent with the early hydrothermal stages (i.e., amphibole and biotite) having formed from high-temperature magmatic-derived fluids sourced at depth from an evolving hydrous dioritic magma with later alteration types (i.e., muscovite and epidote) reflecting dilution of the cooling magmatic fluids with down-welling oxidized surficial (i.e., seawater) fluids, as discussed by Katz et al. [10]. Our current of understanding of this world class Au deposit setting supports a magmatic origin (i.e., intrusion-related) specifically with an affinity to porphyry-type systems. This implies, therefore, the composition of the intrusions (e.g., diorites) and presence of and related geochemical indices of related alteration (e.g., biotite-bearing breccias, fracture-controlled biotite, and muscovite) are key exploration features.
7. Conclusions
This contribution follows on our earlier work that strongly suggests Côté Gold represents an Archean analogue to Phanerozoic oxidized intrusion-related ore (Au-Cu) deposits referred to as porphyry-type systems. Here we add to this by characterizing mineralogically and geochemically the distinct alteration types present in the deposit which overlap with those typical of porphyry-type deposit systems. Commencing with the early amphibole stage, its chemistry (e.g., Mg- and F-rich) reflects a hydrothermal versus magmatic origin. Using mass balance, the subsequent alteration stages were characterized. The biotite stage, manifest as magmatic-hydrothermal biotite breccia in addition to disseminated and vein-controlled biotite, is characterized by gains of Fe, Mg, Mn, Ca, K, P, Li, Rb, Cs, Ba, LREE, Zn, Pb, Te, F, and LOI, with additional enrichment of Au, Cu, Mo, Ag, Se and Bi noted in the magmatic-hydrothermal biotite breccia that, along with the diorite breccia, is the main host of the ore. The following muscovite stage shows gains in K, Rb, Cs, Ba, CO2, and LOI with inconsistent but overall enrichments in Au, Cu, Bi, W, S, Te, As, Pb, Sn, Mo, and Ag. These gains represent both primary features of this alteration type, but some elemental inheritance due to earlier biotite alteration cannot be excluded. The locally developed epidote alteration is characterized by gains in Ca, FeO, Sr, and Bi, whereas the latest alteration stage involving strong development of albite is reflected in gains of Na with depletion of most other elements except for the HREE. Chlorite-bearing rocks are characterized by gains of P2O5, Sn, S, Bi, CO2, LOI and Au and considered to reflect the overprinting the earlier biotite alteration assemblage. The metal associations and elemental ratios (i.e., La/YbN and Rb/Sr), along with the above geochemical criteria, provides vectors towards favorable alteration types that can be used in the exploration for similar intrusion-related deposits in Archean greenstone terranes.
The aforementioned alteration types are reflected in the behavior of the REE with their abundance and chondritic patterns reflecting the nature of the fluid. Thus, from an early high-temperature magmatic fluid to a later cooler fluid with lower pH (e.g., ingress of seawater) played an increasingly important role, which is supported by lithogeochemistry and published isotopic data. This study shows that the behavior of REE during different hydrothermal stages can effectively monitor changing fluid conditions and may be a useful tool to help constrain the genesis of hydrothermal ore deposits.
Significantly, all the geochemical data presented is consistent with our earlier and ongoing studies in which a porphyry-type deposit model for the Côté Gold deposit has and continues to be considered most plausible. The deposit is intrusion-related in the sense that Au mineralization is co-spatial and co-temporal to a magmatic center, in this case a dioritic intrusion, and that the hydrothermal system can be genetically related to this causative intrusion. Hence the nature and origin of the mineralization is considered to be dominantly magmatic and formed at ca. 2740 Ma more than 70 Ma before the main phase of shortening and regional metamorphism in the AGB.
Supplementary Materials
The lithogeochemical databased used in this study is found at Geological Survey of Canada, Open File 8040, p. 1–5 (https://geochem.nrcan.gc.ca/cdogs/content/pub/pub03684_e.htm, accesed on 15 February 2025).
Author Contributions
Conceptualization, L.R.K., D.J.K. and B.D.; methodology, L.R.K. and D.J.K.; software, L.R.K.; validation, L.R.K., D.J.K. and B.D.; formal analysis, L.R.K.; investigation, L.R.K. and D.J.K.; resources, L.R.K. and D.J.K.; data curation, L.R.K. and D.J.K.; writing—original draft preparation, L.R.K.; writing—review and editing, D.J.K. and B.D.; funding acquisition, D.J.K. and B.D. All authors have read and agreed to the published version of the manuscript.
Funding
This study was in part financed through the financial support of first Trelawney Mining and Exploration Inc. and then continued with IAMGOLD Corporation. Additional funding was also provided by the Geological Survey of Canada as part of the TGI-4 Lode Gold Project.
Data Availability Statement
Data are available as Supplementary material referred to in this contribution.
Acknowledgments
This contribution represents a portion the senior author’s Ph.D. thesis at Laurentian University. The project was initiated by D. J. Kontak with Trelawney Mining and Exploration Inc. via D. Beilhartz and continued with IAMGOLD Corporation. Financial support was also provided by the Geological Survey of Canada as part of the TGI-4 Lode Gold Project. J. Petrus is thanked for his assistance in collecting the LA ICP-MS trace element data. Lastly, we thank the input and suggestions of reviewers which improved aspects of this contribution.
Conflicts of Interest
The authors declare no conflict of interest.
References
- Černý, P.; Blevin, P.L.; Cuney, M.; London, D. Granite-Related Ore Deposits. In One Hundredth Anniversary Volume; Society of Economic Geologists: Littleon, CO, USA, 2005; pp. 337–370. ISBN 978-1-887483-01-8. [Google Scholar]
- Goldfarb, R.J.; Baker, T.; Dubé, B.; Groves, D.I.; Hart, C.J.R.; Gosselin, P. Distribution, Character, and Genesis of Gold Deposits in Metamorphic Terranes; Society of Economic Geologists: Littleton, CO, USA, 2005; pp. 407–450. [Google Scholar]
- Seedorff, E.; Dilles, J.H.; Proffett, J.M., Jr.; Einaudi, M.T.; Zurcher, L.; Stavast, W.J.A.; Johnson, D.A.; Barton, M.D. Porphyry Deposits: Characteristics and Origin of Hypogene Features; Society of Economic Geologists: Littleton, CO, USA, 2005. [Google Scholar]
- Sillitoe, R.H. Porphyry Copper Systems. Econ. Geol. 2010, 105, 3–41. [Google Scholar] [CrossRef]
- Baker, M.J.; Wilkinson, J.J.; Wilkinson, C.C.; Cooke, D.R.; Ireland, T. Epidote trace element chemistry as an exploration tool in the Collahuasi district, northern Chile. Economic Geology 2020, 115, 749–770. [Google Scholar] [CrossRef]
- Wilkinson, J.J.; Baker, M.J.; Cooke, D.R.; Wilkinson, C.C. Exploration targeting in porphyry Cu systems using propylitic mineral chemistry: A case study of the El Teniente deposit, Chile. Economic Geology 2020, 115, 771–791. [Google Scholar] [CrossRef]
- McCuaig, T.C.; Kerrich, R. P—T—T—Deformation—Fluid Characteristics of Lode Gold Deposits: Evidence from Alteration Systematics. Ore Geol. Rev. 1998, 12, 381–453. [Google Scholar] [CrossRef]
- Rogers, J.R.; Beilhartz, D.; Kontak, D.J.; Katz, L.; Dubé, B.; McNicoll, V. The Côté Gold Deposit: Discovery of a New Generation Low-Grade, Multi-Million Ounce Gold Resource in the Archean Superior Province of Canada. In Proceedings of the NewGenGold Conference, Perth, Australia, 26–27 November 2013; pp. 159–174. [Google Scholar]
- IAMGOLD. Technical Report on the Côté Gold Project; Report for NI 43-101; Iamgold: Toronto, ON, Canada, 2022. [Google Scholar]
- Katz, L.R.; Kontak, D.J.; Dubé, B.; McNicoll, V.; Creaser, R.; Petrus, J.A. An Archean Porphyry-Type Gold Deposit: The Côté Gold Au(-Cu) Deposit, Swayze Greenstone Belt, Superior Province, Ontario, Canada. Econ. Geol. 2021, 116, 47–89. [Google Scholar] [CrossRef]
- Kontak, D.J.; Creaser, R.A.; Hamilton, M.A. Geological and Geochemical Studies of the Côté Lake Au(-Cu) Deposit Area, Chester Township, Northern Ontario. In Results from the Shining Tree, Chester Township and Matachewan Gold Projects and the Northern Cobalt Embayment Polymetallic Vein Project; Ontario Geological Survey: Sudbury, ON, Canada, 2013; pp. 1–38. [Google Scholar]
- Katz, L.R.; Kontak, D.J.; Dubé, B.; McNicoll, V. The Geology, Petrology, and Geochronology of the Archean Côté Gold Large-Tonnage, Low-Grade Intrusion-Related Au(–Cu) Deposit, Swayze Greenstone Belt, Ontario, Canada. Can. J. Earth Sci. 2017, 54, 173–202. [Google Scholar] [CrossRef]
- Dubé, B.; Mercier-Langevin, P. Chapter 32: Gold Deposits of the Archean Abitibi Greenstone Belt, Canada. In Geology of the World’s Major Gold Deposits and Provinces; Sillitoe, R.H., Goldfarb, R.J., Robert, F., Simmons, S.F., Eds.; Society of Economic Geologist: Littleton, CO, USA, 2020; pp. 669–708. ISBN 978-1-62949-312-1. [Google Scholar]
- Gourcerol, B.; Kontak, D.J.; Thurston, P.C.; Tuba, G.; Katz, L. Reconstruction of the Pressure-Temperature-Composition Conditions of an Archean Porphyry-Type Deposit: The 2740 Ma Cóté Gold Au(-Cu) Deposit, Canada. In Proceedings of the Program with Abstracts, Nancy, France, 23–29 June 2017. [Google Scholar]
- Ayer, J.; Amelin, Y.; Corfu, F.; Kamo, S.; Ketchum, J.; Kwok, K.; Trowell, N. Evolution of the Southern Abitibi Greenstone Belt Based on U–Pb Geochronology: Autochthonous Volcanic Construction Followed by Plutonism, Regional Deformation and Sedimentation. Precambrian Res. 2002, 115, 63–95. [Google Scholar] [CrossRef]
- van Breemen, O.; Heather, K.B.; Ayer, J.A. U-Pb Geochronology of the Neoarchean Swayze Sector of the Southern Abitibi Greenstone Belt; Geological Survey of Canada: Ottawa, ON, Canada, 2006. [Google Scholar]
- Thurston, P.C.; Ayer, J.A.; Goutier, J.; Hamilton, M.A. Depositional Gaps in Abitibi Greenstone Belt Stratigraphy: A Key to Exploration for Syngenetic Mineralization. Econ. Geol. 2008, 103, 1097–1134. [Google Scholar] [CrossRef]
- Heather, K.B. The Geological Evolution of the Archean Swayze Greenstone Belt, Superior Province, Canada. Ph.D. Thesis, University of Keele, Keele, UK, 2001. [Google Scholar]
- Gemmell, T.P.; MacDonald, P.J. Precambrian Geology of the Yeo and Chester Townships Area. Chester Intrusive Complex, Southern Abitibi Greenstone Belt: Ontario Geological Survey, Preliminary Map. 2017. Available online: https://www.geologyontario.mines.gov.on.ca/publication/P3817 (accessed on 15 February 2025).
- Monecke, T.; Mercier-Langevin, P.; Dubé, B.; Frieman, B.M. Geology of the Abitibi Greenstone Belt. In Archean Base and Precious Metal Deposits, Southern Abitibi Greenstone Belt, Canada; Monecke, T., Mercier-Langevin, P., Dubé, B., Eds.; Society of Economic Geologists: Littleton, CO, USA, 2017; pp. 7–49. ISBN 978-1-62949-220-9. [Google Scholar]
- Heather, K.B.; van Breemen, O. An Interim Report on Geological, Structural, and Geochronological Investigations of Granitoid Rocks in the Vicinity of the Swayze Greenstone Belt, Southern Superior Province, Ontario. Geol. Surv. Can. Pap. 1994, 259–268. [Google Scholar] [CrossRef]
- Heather, K.B.; Shore, G.T. Geology, Swayze Greenstone Belt, Ontario. Open File; Ontario Geological Survey: Sudbury, ON, Canada, 1999. [Google Scholar]
- Heather, K.B.; Shore, G.T. Geology, Gogama, Swayze Greenstone Belt, Ontario. Open File; Ontario Geological Survey: Sudbury, ON, Canada, 1999. [Google Scholar]
- Hastie, E.C.G.; Kontak, D.J.; Lafrance, B. Gold remobilization: Insights from gold deposits in the Archean Swayze greenstone belt, Abitibi Subprovince, Canada. Econ. Geol. 2020, 115, 241–277. [Google Scholar] [CrossRef]
- Hastie, E.C.G.; Kontak, D.J.; Lafrance, B.; Petrus, J.A.; Sharpe, R.; Fayek, M. Evaluating geochemical discriminants in Archean Au deposits: A Superior Province perspective with an emphasis on the Abitibi greenstone belt. Econ. Geol. 2023, 118, 123–155. [Google Scholar] [CrossRef]
- Siragusa, G.M. Geology, Geochemistry and Mineralization of the Southern Margin of the Swayze Belt; Ontario Geological Survey: Sudbury, ON, Canada, 1993; pp. 1–144. [Google Scholar]
- Fumerton, S.; Houle, K. Mineral Showings, Occurrences, Deposits and Mines of the Swayze Greenstone Belt, Interim Report; Open File Report 5871; Ontario Geological Survey: Sudbury, ON, Canada, 1993; 112p. [Google Scholar]
- Heather, K.B.; Percival, J.A.; Moser, D.; Bleeker, W. Tectonics and Metallogeny of Archean Crust in the Abitibi-Kapuskasing-Wawa Region; Geological Survey of Canada: Ottawa, ON, Canada, 1995; pp. 1–148. [Google Scholar]
- Powell, W.G.; Carmichael, D.M.; Hodgson, C.J. Conditions and Timing of Metamorphism in the Southern Abitibi Greenstone Belt, Quebec. Can. J. Earth Sci. 1995, 32, 787–805. [Google Scholar] [CrossRef]
- Heather, K.B. Regional Geology, Structure, and Mineral Deposits of the Archean Swayze Greenstone Belt, Southern Superior Province, Ontario; Current Research, Part C; Geological Survey of Canada: Ottawa, ON, Canada, 1993; pp. 295–305. [Google Scholar]
- Berger, B.R. Geological investigations south of Gogama. In Summary of Field Work and Other Activities 2011; Open File Report 6270; Ontario Geological Survey: Sudbury, ON, Canada, 2011; pp. 1–7. [Google Scholar]
- Barker, F. Trondhjemites, Dacites and Related Rocks; Elsevier: New York, NY, USA, 1979. [Google Scholar]
- Meyer, C.; Hemley, J.J. Wall Rock Alteration. In Geochemistry of Hydrothermal Ore Deposits; Holt: Winston, NY, USA, 1967; pp. 166–235. [Google Scholar]
- Galley, A.G.; Hannington, M.D.; Jonasson, I.R. Volcanogenic Massive Sulphide Deposits. In Mineral Deposits of Canada: A Synthesis of Major Deposit-Types, District Metallogeny, the Evolution of Geological Provinces, and Exploration Methods; Special Publication; Geological Association of Canada: St. John’s, NL, Canada, 2007; pp. 141–161. [Google Scholar]
- Suikkanen, E.; Rämö, O.T. Episyenites—Characteristics, Genetic Constraints, and Mineral Potential. Min. Metall. Explor. 2019, 36, 861–878. [Google Scholar] [CrossRef]
- Müller, W.; Shelley, M.; Miller, P.; Broude, S. Initial Performance Metrics of a New Custom-Designed ArF Excimer LA-ICPMS System Coupled to a Two-Volume Laser-Ablation Cell. J. Anal. At. Spectrom. 2009, 24, 209–214. [Google Scholar] [CrossRef]
- Paton, C.; Hellstrom, J.; Paul, B.; Woodhead, J.; Hergt, J. Iolite: Freeware for the Visualisation and Processing of Mass Spectrometric Data. J. Anal. At. Spectrom. 2011, 26, 2508–2518. [Google Scholar] [CrossRef]
- Sylvester, P.J.; Cabri, L.J.; Tubrett, M.N.; McMahon, G.; Laflamme, J.H.G.; Peregoedova, A. Synthesis and Evaluation of a Fused Pyrrhotite Standard Reference Material for Platinum Group Element and Gold Analysis by Laser Ablation-ICPMS; Geological Survey of Finland: Oulu, Finland, 2005; pp. 16–20. [Google Scholar]
- Katz, L.R.; Kontak, D.J.; Dubé, B.; Mercier-Langevin, P.; Bécu, V.; Lauzière, K. Whole-Rock Lithogeochemistry of the Archean Intrusion-Related Côté Gold Au(-Cu) Deposit, Ontario, Canada; Geological Survey of Canada: Ottawa, ON, Canada, 2016; pp. 1–5. [Google Scholar]
- Grant, J.A. The Isocon Diagram; a Simple Solution to Gresens’ Equation for Metasomatic Alteration. Econ. Geol. 1986, 81, 1976–1982. [Google Scholar] [CrossRef]
- Brodbeck, M.; McClenaghan, S.H.; Kamber, B.S.; Redmond, P.B. Metal(Loid) Deportment in Sulfides from the High-Grade Core of the Bingham Canyon Porphyry Cu-Mo-Au Deposit, Utah. Econ. Geol. 2022, 117, 1521–1542. [Google Scholar] [CrossRef]
- Rollinson, H.R. Using Geochemical Data: Evaluation, Presentation, Interpretation; Longman Geochemistry Series; Taylor and Francis: Hoboken, NJ, USA, 2014; ISBN 978-0-582-06701-1. [Google Scholar]
- Sun, S.-S.; McDonough, W.F. Chemical and Isotopic Systematics of Oceanic Basalts: Implications for Mantle Composition and Processes; Geological Society: London, UK, 1989; Volume 42, pp. 313–345. [Google Scholar] [CrossRef]
- Petersen, M.D. The Use of the “Immobile” Elements Zr and Ti in Lithogeochemical Exploration for Massive Sulphide Deposits in the Precambrian Pecos Greenstone Belt of Northern New Mexico. J. Geochem. Explor. 1983, 19, 615–617. [Google Scholar] [CrossRef]
- Petersson, J.; Eliasson, T. Mineral Evolution and Element Mobility during Episyenitization (Dequartzification) and Albitization in the Postkinematic Bohus Granite, Southwest Sweden. Lithos 1997, 42, 123–146. [Google Scholar] [CrossRef]
- Corfu, F.; Hanchar, J.M.; Hoskin, P.W.O.; Kinny, P. Atlas of Zircon Textures. Rev. Mineral. Geochem. 2003, 53, 469–500. [Google Scholar] [CrossRef]
- Putnis, A. Mineral replacement reactions: From macroscopic observations to microscopic mechanisms. Mineral. Mag. 2002, 66, 689–708. [Google Scholar] [CrossRef]
- Hoskin, P.W.O.; Schaltegger, U. The composition of zircon and igneous and metamorphic petrogenesis. Rev. Mineral. Geochem. 2003, 53, 27–62. [Google Scholar] [CrossRef]
- Schaltegger, U. Hydrothermal zircon. Elements 2007, 3, 51–79. [Google Scholar] [CrossRef]
- Toscano, M.; Pascual, E.; Nesbitt, R.W.; Almodóvar, G.R.; Sáez, R.; Donaire, T. Geochemical discrimination of hydrothermal and igneous zircon in the Iberian Pyrite Belt, Spain. Ore Geol. Rev. 2014, 56, 301–311. [Google Scholar] [CrossRef]
- Taylor, R.P.; Fryer, B.J. Multiple-Stage Hydrothermal Alteration in Porphyry Copper Systems in Northern Turkey: The Temporal Interplay of Potassic, Propylitic, and Phyllic Fluids. Can. J. Earth Sci. 1980, 17, 901–926. [Google Scholar] [CrossRef]
- Taylor, R.P.; Fryer, B.J. Rare Earth Element Geochemistry as an Aid to Interpreting Hydrothermal Ore Deposits. In Metallization Associated with Acid Magmatism; John Wiley: New York, NY, USA, 1982; pp. 57–65. [Google Scholar]
- Taylor, R.P.; Fryer, B.J. Rare Earth Element Lithogeochemistry of Granitoid Mineral Deposits. Bull. Can. Inst. Mine Metall. 1983, 76, 74–84. [Google Scholar]
- Palacios, C.M.; Hein, U.F.; Dulski, P. Behaviour of Rare Earth Elements during Hydrothermal Alteration at the Buena Esperanza Copper-Silver Deposit, Northern Chile. Earth Planet. Sci. Lett. 1986, 80, 208–216. [Google Scholar] [CrossRef]
- Schneider, H.J.; Oezguer, N.; Palacios, C.M. Relationship between Alteration, Rare Earth Element Distribution, and Mineralization of the Murgul Copper Deposit, Northeastern Turkey. Econ. Geol. 1988, 83, 1238–1246. [Google Scholar] [CrossRef]
- Ward, C.D.; Mcarthur, J.M.; Walsh, J.N. Rare Earth Element Behaviour During Evolution and Alteration of the Dartmoor Granite, SW England. J. Petrol. 1992, 33, 785–815. [Google Scholar] [CrossRef]
- Poitrasson, F.; Pin, C.; Duthou, J.-L. Hydrothermal Remobilization of Rare Earth Elements and Its Effect on Nd Isotopes in Rhyolite and Granite. Earth Planet. Sci. Lett. 1995, 130, 1–11. [Google Scholar] [CrossRef]
- Fulignati, P.; Gioncada, A.; Sbrana, A. Rare-Earth Element (REE) Behaviour in the Alteration Facies of the Active Magmatic–Hydrothermal System of Vulcano (Aeolian Islands, Italy). J. Volcanol. Geotherm. Res. 1999, 88, 325–342. [Google Scholar] [CrossRef]
- Parsapoor, A.; Khalili, M.; Mackizadeh, M.A. The Behaviour of Trace and Rare Earth Elements (REE) during Hydrothermal Alteration in the Rangan Area (Central Iran). J. Asian Earth Sci. 2009, 34, 123–134. [Google Scholar] [CrossRef]
- Al-Ani, T.; Ahtola, T.; Kuusela, J.; Al-Ansari, N. Mineralogical and Petrographic Characteristics of Indium and REE-Bearing Accessory Phases in the Kymi Granite Stock, Southern Finland. Nat. Resour. 2018, 9, 23–41. [Google Scholar] [CrossRef]
- Kontonikas-Charos, A.; Ciobanu, C.L.; Cook, N.J. Albitization and Redistribution of REE and Y in IOCG Systems: Insights from Moonta-Wallaroo, Yorke Peninsula, South Australia. Lithos 2014, 208–209, 178–201. [Google Scholar] [CrossRef]
- Song, S.; Mao, J.; Xie, G.; Chen, L.; Santosh, M.; Chen, G.; Rao, J.; Ouyang, Y. In situ LA-ICP-MS U–Pb geochronology and trace element analysis of hydrothermal titanite from the giant Zhuxi W (Cu) skarn deposit, South China. Miner. Depos. 2019, 54, 569–590. [Google Scholar] [CrossRef]
- Bruand, E.; Fowler, M.; Storey, C.; Laurent, O.; Antoine, C.; Guitreau, M.; Heilimo, E.; Nebel, O.; Bruand, E.; Fowler, M.; et al. Accessory mineral constraints on crustal evolution: Elemental fingerprints for magma discrimination. Geochem. Perspect. Lett. 2020, 13, 7–12. [Google Scholar] [CrossRef]
- Johnson, C.A. Partitioning of Zinc among Common Ferromagnesian Minerals and Implications for Hydrothermal Mobilization. Can. Miner. 1994, 32, 121–132. [Google Scholar]
- Foster, M.D. Interpretation of the Composition of Trioctahedral Micas; Professional Paper; US Geological Survey: Reston, VA, USA, 1960; Volume 354-B, pp. 1–146. [Google Scholar]
- Prendergast, K. Application of Lithogeochemistry to Gold Exploration in the St Ives Goldfield, Western Australia. Geochem. Explor. Environ. Anal. 2007, 7, 99–108. [Google Scholar] [CrossRef]
- Harris, J.R.; Wilkinson, L.; Grunsky, E.; Heather, K.; Ayer, J. Techniques for Analysis and Visualization of Lithogeochemical Data with Applications to the Swayze Greenstone Belt, Ontario. J. Geochem. Explor. 1999, 67, 301–334. [Google Scholar] [CrossRef]
- Byrne, K.; Lesage, G.; Gleeson, S.A.; Piercey, S.J.; Lypaczewski, P.; Kyser, K. Linking Mineralogy to Lithogeochemistry in the Highland Valley Copper District: Implications for Porphyry Copper Footprints. Econ. Geol. 2020, 115, 871–901. [Google Scholar] [CrossRef]
- Robert, F.; Poulsen, K.H.; Dubé, B. Gold deposits and their geological classification. In Proceedings of the Exploration 97: Fourth Decennial International Conference on Mineral Exploration, Toronto, ON, Canada, 14–18 September 1997; Gubins, A.G., Ed.; Exploration Geochemistry: Toronto, ON, Canada, 1997; pp. 209–220. [Google Scholar]
- Carranza, E.J.M.; Sadeghi, M. Primary geochemical characteristics of mineral deposits – implications for exploration. Ore Geol. Rev. 2012, 45, 1–4. [Google Scholar] [CrossRef]
- Cohen, D.R.; Bowell, R.J. Exploration geochemistry. In Treatise on Geochemistry, 2nd ed.; Holland, H.D., Turekian, K.K., Eds.; Elsevier: Oxford, UK, 2014; Volume 13, pp. 623–649. [Google Scholar] [CrossRef]
- Halley, S.; Dilles, J.H.; Tosdal, R.M. Footprints: Hydrothermal alteration and geochemical dispersion around porphyry copper deposits. Soc. Econ. Geol. Newsl. 2015, No. 100, 11–17. [Google Scholar] [CrossRef]
- Kyser, K.; Barr, J.; Ihlenfeld, C. Applied geochemistry in mineral exploration and mining. Elements 2015, 11, 241–246. [Google Scholar] [CrossRef]
- Gaillard, N.; Williams-Jones, A.E.; Clark, J.R.; Salvi, S.; Perrouty, S.; Linnen, R.L.; Olivo, G.R. The use of lithogeochemistry in delineating hydrothermal fluid pathways and vectoring gold mineralization in the Malartic district, Québec. Ore Geol. Rev. 2020, 120, 103351. [Google Scholar] [CrossRef]
- Williams-Jones, A.E.; Heinrich, C.A. Vapor transport of metals and the formation of magmatic-hydrothermal ore deposits. Econ. Geol. 2005, 100, 1287–1312. [Google Scholar] [CrossRef]
- Dubé, B.; Gosselin, P. Greenstone-Hosted Quartz-Carbonate Vein Deposits. In Mineral Deposits of Canada: A Synthesis of Major Deposit-Types, District Metallogeny, the Evolution of Geological Provinces, and Exploration Methods; Special Publication 5; Geological Association of Canada, Mineral Deposits Division: St. John’s, NL, Canada, 2007; pp. 49–73. [Google Scholar]
- Groves, D.I.; Goldfarb, R.J.; Robert, F.; Hart, C.J.R. Gold Deposits in Metamorphic Belts: Overview of Current Understanding, Outstanding Problems, Future Research, and Exploration Significance. Econ. Geol. 2003, 98, 1–29. [Google Scholar] [CrossRef]
- Goldfarb, R.J.; Phillips, G.N.; Nokleberg, W.J. Tectonic setting of synorogenic gold deposits of the Pacific Rim. Ore Geol. Rev. 1998, 13, 185–218. [Google Scholar] [CrossRef]
- Groves, D.I.; Goldfarb, R.J.; Gebre-Mariam, M.; Hagemann, S.G.; Robert, F. Orogenic gold deposits: A proposed classification in the context of their crustal distribution and relationship to other gold deposit types. Ore Geol. Rev. 1998, 13, 7–27. [Google Scholar] [CrossRef]
- Goldfarb, R.J.; Pitcairn, I. Orogenic gold: Is a genetic association with magmatism realistic? Miner. Depos. 2022, 58, 5–35. [Google Scholar] [CrossRef]
- Goodman, S.; Williams-Jones, A.E.; Carles, P. Structral Controls on the Archean Troilus Gold-Copper Deposit, Quebec, Canada. Econ. Geol. 2005, 100, 577–582. [Google Scholar] [CrossRef]
- Fraser, R.J. The Lac Troilus Gold-Copper Deposit, Northwestern Quebec; a Possible Archean Porphyry System. Econ. Geol. 1993, 88, 1685–1699. [Google Scholar] [CrossRef]
- Helt, K.M.; Williams-Jones, A.E.; Clark, J.R.; Wing, B.A.; Wares, R.P. Constraints on the Genesis of the Archean Oxidized, Intrusion-Related Canadian Malartic Gold Deposit, Quebec, Canada. Econ. Geol. 2014, 109, 713–735. [Google Scholar] [CrossRef]
- De Souza, S.; Dubé, B.; Mercier-Langevin, P.; McNicoll, V.; Dupuis, C.; Kjarsgaard, I. Hydrothermal alteration mineralogy and geochemistry of the Archean world-class Canadian Malartic disseminated-stockwork gold deposit, southern Abitibi greenstone belt, Quebec, Canada. Econ. Geol. 2019, 114, 1057–1094. [Google Scholar] [CrossRef]
- Sillitoe, R.H.; Thompson, J.F.H. Intrusion-Related Vein Gold Deposits: Types, Tectono-Magmatic Settings and Difficulties of Distinction from Orogenic Gold Deposits. Resour. Geol. 1998, 48, 237–250. [Google Scholar] [CrossRef]
- Hart, C.J.R. Reduced Intrusion-Related Gold Systems. In Mineral Deposits of Canada: A Synthesis of Major Deposit-Types, District Metallogeny, the Evolution of Geological Provinces, and Exploration Methods; Special Publication No. 5; Geological Association of Canada, Mineral Deposits Division: St. John’s, NL, Canada, 2007; pp. 95–112. [Google Scholar]
- Smith, J. An Integrated Structural and Geochemical Study of Auriferous Sheeted Quartz Veins within the 2740 Ma Cóté Gold Deposit, Swayze Greenstone Belt, Ontario. Unpublished Thesis, Laurentian University, Sudbury, ON, Canada, 2016. [Google Scholar]
- Smith, J.; LaFrance, B.; Kontak, D.J. A Comparative Study of the Deformation History of Auriferous Quartz Veins in the Archean Côté Gold Deposit and the Structural Evolution of the Spatially-Related Ridout Deformation Zone, Swayze Greenstone Belt, Northern Ontario; Geological Association of Canada: Fredericton, NB, Canada, 2014. [Google Scholar]
- Sillitoe, R.H. Gold-rich porphyry copper deposits: Geological model and exploration implications. In Mineral Deposit Modeling; Kirkham, R.V., Sinclair, W.D., Thorpe, R.I., Duke, J.M., Eds.; Geological Association of Canada: St. John’s, NL, Canada, 1993. [Google Scholar]
- Tuba, G.; Kontak, D.J.; Choquette, B.G.; Pfister, J.; Hastie, E.C.G.; van Hees, E.H.P. Fluid Diversity in the Gold-Endowed Archean Orogenic Systems of the Abitibi Greenstone Belt (Canada) I: Constraining the PTX of Prolonged Hydrothermal Systems. Ore Geol. Rev. 2021, 135, 1–31. [Google Scholar] [CrossRef]
- Kontak, D.J.; Tuba, G. How Can Fluid Inclusion Studies Better Constrain Orogenic Gold Deposit Models: Case Studies from the Superior Province and Meguma Terrane, Canada? In Proceedings of the Society for Geology Applied to Mineral Deposits Annual Meeting, Quebec, QC, Canada, 5 February 2017. [Google Scholar]
- Crépon, A.; Mathieu, L.; Kontak, D.J.; Marsh, J.; Hamilton, M.A. An Archean Porphyry-Type Deposit: Cu-Au Mineralization Associated with the Chibougamau Tonalite–Diorite Pluton, Abitibi Greenstone Belt, Canada. Minerals 2024, 14, 1293. [Google Scholar] [CrossRef]
- Ford, J.H. A Chemical Study of Alteration at the Panguna Porphyry Copper Deposit, Bougainville, Papua New Guinea. Econ. Geol. 1978, 73, 703–720. [Google Scholar] [CrossRef]
- Chivas, A.R. Geochemical Evidence for Magmatic Fluids in Porphyry Copper Mineralization. Part 1. Mafic Silicates from the Koloula Igneous Complex. Contrib. Mineral. Petrol. 1982, 78, 389–403. [Google Scholar] [CrossRef]
- Kerrich, R.; Fryer, B.J. Lithophile-Element Systematics of Archean Greenstone Belt Au–Ag Vein Deposits: Implications for Source Processes. Can. J. Earth Sci. 1988, 25, 945–953. [Google Scholar] [CrossRef]
- Rieder, M.; Cavazzini, G.; D’yakonov, Y.S.; Frank-Kamenetskii, V.A.; Gottardi, G.; Guggenheim, S.; Koval’, P.V.; Müller, G.; Neiva, A.M.R.; Radoslovich, E.W.; et al. Nomenclature of the Micas. Mineral. Mag. 1999, 63, 267–279. [Google Scholar] [CrossRef]
- Shannon, R.D. Revised Effective Ionic Radii and Systematic Studies of Interatomic Distances in Halides and Chalcogenides. Acta Crystallogr. 1976, 32, 751–767. [Google Scholar] [CrossRef]
- Ulrich, T.; Heinrich, C.A. Geology and Alteration Geochemistry of the Porphyry Cu-Au Deposit at Bajo de La Alumbrera, Argentina. Econ. Geol. 2001, 96, 1719–1742. [Google Scholar] [CrossRef]
- Idrus, A.; Kolb, J.; Meyer, F.M. Mineralogy, Lithogeochemistry and Elemental Mass Balance of the Hydrothermal Alteration Associated with the Gold-rich Batu Hijau Porphyry Copper Deposit, Sumbawa Island, Indonesia. Resour. Geol. 2009, 59, 215–230. [Google Scholar] [CrossRef]
- Anthony, E.Y.; Titley, S.R. Patterns of Element Mobility during Hydrothermal Alteration of the Sierrita Porphyry Copper Deposit, Arizona. Econ. Geol. 1994, 89, 186–192. [Google Scholar] [CrossRef]
- Jacobs, D.C.; Parry, W.T. Geochemistry of Biotite in the Santa Rita Porphyry Copper Deposit, New Mexico. Econ. Geol. 1979, 74, 860–887. [Google Scholar] [CrossRef]
- Olade, M.A.; Fletcher, W.K. Primary Dispersion of Rubidium and Strontium around Porphyry Copper Deposits, Highland Valley, British Columbia. Econ. Geol. 1975, 70, 15–21. [Google Scholar] [CrossRef]
- Armbrust, G.A.; Oyarzun, M.J.; Arias, J. Rubidium as a Guide to Ore in Chilean Porphyry Copper Deposits. Econ. Geol. 1977, 72, 1086–1100. [Google Scholar] [CrossRef]
- Catchpole, H.; Kouzmanov, K.; Putlitz, B.; Seo, J.H.; Fontbote, L. Zoned Base Metal Mineralization in a Porphyry System: Origin and Evolution of Mineralizing Fluids in the Morococha District, Peru. Econ. Geol. 2015, 110, 39–71. [Google Scholar] [CrossRef]
- Ahrens, L.H. The Use of Ionization Potentials Part 1. Ionic Radii of the Elements. Geochim. Cosmochim. Acta 1952, 2, 155–169. [Google Scholar] [CrossRef]
- Cohen, J.F. Mineralogy and Geochemistry of Hydrothermal Alteration at the Ann-Mason Porphyry Copper Deposit, Nevada: Comparison of Large-Scale Ore Exploration Techniques to Mineral Chemistry. Unpublished Thesis, University of Oregon, Eugene, OR, USA, 2011. [Google Scholar]
- Dostal, J.; Kontak, D.J.; Gerel, O.; Gregory Shellnutt, J.; Fayek, M. Cretaceous Ongonites (Topaz-Bearing Albite-Rich Microleucogranites) from Ongon Khairkhan, Central Mongolia: Products of Extreme Magmatic Fractionation and Pervasive Metasomatic Fluid: Rock Interaction. Lithos 2015, 236–237, 173–189. [Google Scholar] [CrossRef]
- Kontak, D.J.; Dostal, J.; Petrus, J.A. Muscovite as a Monitor of Primary versus Secondary Rare-Metal Enrichment in Albite-Topaz Keratophyres from Ongon Khairkan, Mongolia. In Proceedings of the GAC-MAC-IAH Québec 2019, Québec City, QC, Canada, 12–15 May 2019. [Google Scholar]
- Yin, R.; Han, L.; Huang, X.-L.; Li, J.; Li, W.-X.; Chen, L.-L. Textural and Chemical Variations of Micas as Indicators for Tungsten Mineralization: Evidence from Highly Evolved Granites in the Dahutang Tungsten Deposit, South China. Am. Mineral. 2019, 104, 949–965. [Google Scholar] [CrossRef]
- Derakhshan, R.; Abdolzadeh, M. Geochemistry, Mineralization and Alteration Zones of Darrehzar Porphyry Copper Deposit, Kerman, Iran. J. Appl. Sci. 2009, 9, 1628–1646. [Google Scholar] [CrossRef]
- Ludden, J.N.; Daigneault, R.; Robert, F.; Taylor, R.P. Trace Element Mobility in Alteration Zones Associated with Archean Au Lode Deposits. Econ. Geol. 1984, 79, 1131–1141. [Google Scholar] [CrossRef]
- Gaboury, D. Parameters for the Formation of Orogenic Gold Deposits. Appl. Earth Sci. 2019, 128, 124–133. [Google Scholar] [CrossRef]
- Djouka-Fonkwe, M.L.; Kyser, K.; Clark, A.H.; Urqueta, E.; Oates, C.J.; Ihlenfeld, C. Recognizing Propylitic Alteration Associated with Porphyry Cu-Mo Deposits in Lower Greenschist Facies Metamorphic Terrain of the Collahuasi District, Northern Chile--Implications of Petrographic and Carbon Isotope Relationships. Econ. Geol. 2012, 107, 1457–1478. [Google Scholar] [CrossRef]
- Seedorff, E.; Barton, M.D.; Stavast, W.J.A.; Maher, D.J. Root Zones of Porphyry Systems: Extending the Porphyry Model to Depth. Econ. Geol. 2008, 103, 939–956. [Google Scholar] [CrossRef]
- Sillitoe, R.H. Intrusion-Related Gold Deposits. In Gold Metallogeny and Exploration; Springer: Boston, MA, USA, 1991; pp. 165–209. ISBN 978-1-4612-7837-5. [Google Scholar]
- Lang, J.R.; Baker, T. Intrusion-Related Gold Systems: The Present Level of Understanding. Miner. Depos. 2001, 36, 477–489. [Google Scholar] [CrossRef]
- John, D.A. Geologic Setting, Depths of Emplacement, and Regional Distribution of Fluid Inclusions in Intrusions of the Central Wasatch Mountains, Utah. Econ. Geol. 1989, 84, 386–409. [Google Scholar] [CrossRef]
- Dilles, J.H.; Einaudi, M.T. Wall-Rock Alteration and Hydrothermal Flow Paths about the Ann-Mason Porphyry Copper Deposit, Nevada; a 6-Km Vertical Reconstruction. Econ. Geol. 1992, 87, 1963–2001. [Google Scholar] [CrossRef]
- Ludden, J.N.; Thompson, G. Behaviour of Rare Earth Elements during Submarine Weathering of Tholeiitic Basalt. Nature 1978, 274, 147–149. [Google Scholar] [CrossRef]
- Norman, D.I.; Kyle, P.R.; Baron, C. Analysis of Trace Elements Including Rare Earth Elements in Fluid Inclusion Liquids. Econ. Geol. 1989, 84, 162–166. [Google Scholar] [CrossRef]
- Kerrich, R.; Fryer, B.J. Archaean Precious-Metal Hydrothermal Systems, Dome Mine, Abitibi Greenstone Belt. II. REE and Oxygen Isotope Relations. Can. J. Earth Sci. 1979, 16, 440–458. [Google Scholar] [CrossRef]
- McLellan, S.M.; Taylor, S.R. Rare Earth Element Mobility Associated with Uranium Mineralisation. Nature 1979, 282, 247–250. [Google Scholar] [CrossRef]
- Metz, M.C.; Brookins, D.G.; Rosenberg, P.E.; Zartman, R.E. Geology and Geochemistry of the Snowbird Deposit, Mineral County, Montana. Econ. Geol. 1985, 80, 394–409. [Google Scholar] [CrossRef]
- Lottermoser, B.G. Rare Earth Elements and Hydrothermal Ore Formation Processes. Ore Geol. Rev. 1992, 7, 25–41. [Google Scholar] [CrossRef]
- Williams-Jones, A.E.; Migdisov, A.A.; Samson, I.M. Hydrothermal Mobilisation of the Rare Earth Elements—A Tale of “Ceria” and “Yttria”. Elements 2012, 8, 355–360. [Google Scholar] [CrossRef]
- Lottermoser, B.G. Rare-Earth Element and Heavy-Metal Behaviour Associated with the Epithermal Gold Deposit on Lihir Island, Papua New Guinea. J. Volcanol. Geotherm. Res. 1990, 40, 269–289. [Google Scholar] [CrossRef]
- Flynn, R.T.; Wayne Burnham, C. An Experimental Determination of Rare Earth Partition Coefficients between a Chloride Containing Vapor Phase and Silicate Melts. Geochim. Cosmochim. Acta 1978, 42, 685–701. [Google Scholar] [CrossRef]
- Gustafson, L.B.; Hunt, J.P. The Porphyry Copper Deposit at El Salvador, Chile. Econ. Geol. 1975, 70, 857–912. [Google Scholar] [CrossRef]
- Pat Shanks, W.C. Stable Isotope Geochemistry of Mineral Deposits. In Treatise on Geochemistry; Elsevier: Amsterdam, The Netherlands, 2014; pp. 59–85. ISBN 978-0-08-098300-4. [Google Scholar]
- Alderton, D.H.M.; Pearce, J.A.; Potts, P.J. Rare Earth Element Mobility during Granite Alteration: Evidence from Southwest England. Earth Planet. Sci. Lett. 1980, 49, 149–165. [Google Scholar] [CrossRef]
- Kerrich, R.; Wyman, D.A. The Trace Element Systematics of Igneous Rocks in Mineral Exploration: An Overview. In Trace Element Geochemistry of Volcanic Rocks: Applications for Massive Sulphide Exploration; Short Course Notes; Geological Association of Canada: St. John’s, NL, Canada, 1996; Volume 12, pp. 1–50. [Google Scholar]
- Jones, B.K. Application of Metal Zoning to Gold Exploration in Porphyry Copper Systems. J. Geochem. Explor. 1992, 43, 127–155. [Google Scholar] [CrossRef]
- Clark, G.H. Panguna Copper-Gold Deposit. Aust. Inst. Min. Metall. 1990, 14, 807–1816. [Google Scholar]
- Jones, G.J. The Goonumbla Porphyry Copper Deposits, New South Wales. Econ. Geol. 1985, 80, 591–613. [Google Scholar] [CrossRef]
- Lowell, J.D.; Guilbert, J.M. Lateral and Vertical Alteration-Mineralization Zoning in Porphyry Ore Deposits. Econ. Geol. 1970, 65, 373–408. [Google Scholar] [CrossRef]
- Wilson, J.W.J.; Kesler, S.E.; Cloke, P.L.; Kelly, W.C. Fluid Inclusion Geochemistry of the Granisle and Bell Porphyry Copper Deposits, British Columbia. Econ. Geol. 1980, 75, 45–61. [Google Scholar] [CrossRef]
- Hedenquist, J.W.; Arribas, A., Jr.; Reynolds, T.J. Evolution of an Intrusion-Centered Hydrothermal System; Far Southeast-Lepanto Porphyry and Epithermal Cu-Au Deposits, Philippines. Econ. Geol. 1998, 93, 373–404. [Google Scholar] [CrossRef]
- Ulrich, T.; Günther, D.; Heinrich, C.A. The evolution of a porphyry Cu-Au deposit, based on LA-ICP-MS analysis of fluid inclusions: Bajo de la Alumbrera, Argentina. Econ. Geol. 2001, 96, 1743–1774. [Google Scholar] [CrossRef]
- Meng, X.; Richards, J.P.; Kontak, D.J.; Simon, A.C.; Kleinsasser, J.M.; Marsh, J.H.; Stern, R.A.; Jugo, P.J. Variable Modes of Formation for Tonalite–Trondhjemite–Granodiorite–Diorite (TTG)-Related Porphyry-Type Cu ± Au Deposits in the Neoarchean Southern Abitibi Subprovince (Canada): Evidence from Petrochronology and Oxybarometry. J. Petrol. 2021, 62, 1–29. [Google Scholar] [CrossRef]
- Mole, D.R.; Frieman, B.M.; Thurston, P.C.; Marsh, J.H.; Jørgensen, T.R.C.; Stern, R.A.; Martin, L.A.J.; Lu, Y.J.; Gibson, H.L. Crustal Architecture of the South-East Superior Craton and Controls on Mineral Systems. Ore Geol. Rev. 2022, 148, 105017. [Google Scholar] [CrossRef]
- Dyer, J. Assessing the Nature of Breccia-Textured Rocks from a Au-Mineralized Porphyry-Type Setting in the Archean Chester Intrusive Complex, Northern Ontario. Unpublished Thesis, Laurentian University, Sudbury, ON, Canada, 2020. [Google Scholar]
Disclaimer/Publisher’s Note: The statements, opinions and data contained in all publications are solely those of the individual author(s) and contributor(s) and not of MDPI and/or the editor(s). MDPI and/or the editor(s) disclaim responsibility for any injury to people or property resulting from any ideas, methods, instructions or products referred to in the content. |
© 2025 by the authors. Licensee MDPI, Basel, Switzerland. This article is an open access article distributed under the terms and conditions of the Creative Commons Attribution (CC BY) license (https://creativecommons.org/licenses/by/4.0/).