


Optimizing Strength Prediction for Cemented Paste Backfills with Various Fly Ash Substitution: Computational Approach with Machine Learning Algorithms

 ,
,  , and
, and 
Abstract
1. Introduction
2. Materials and Methods
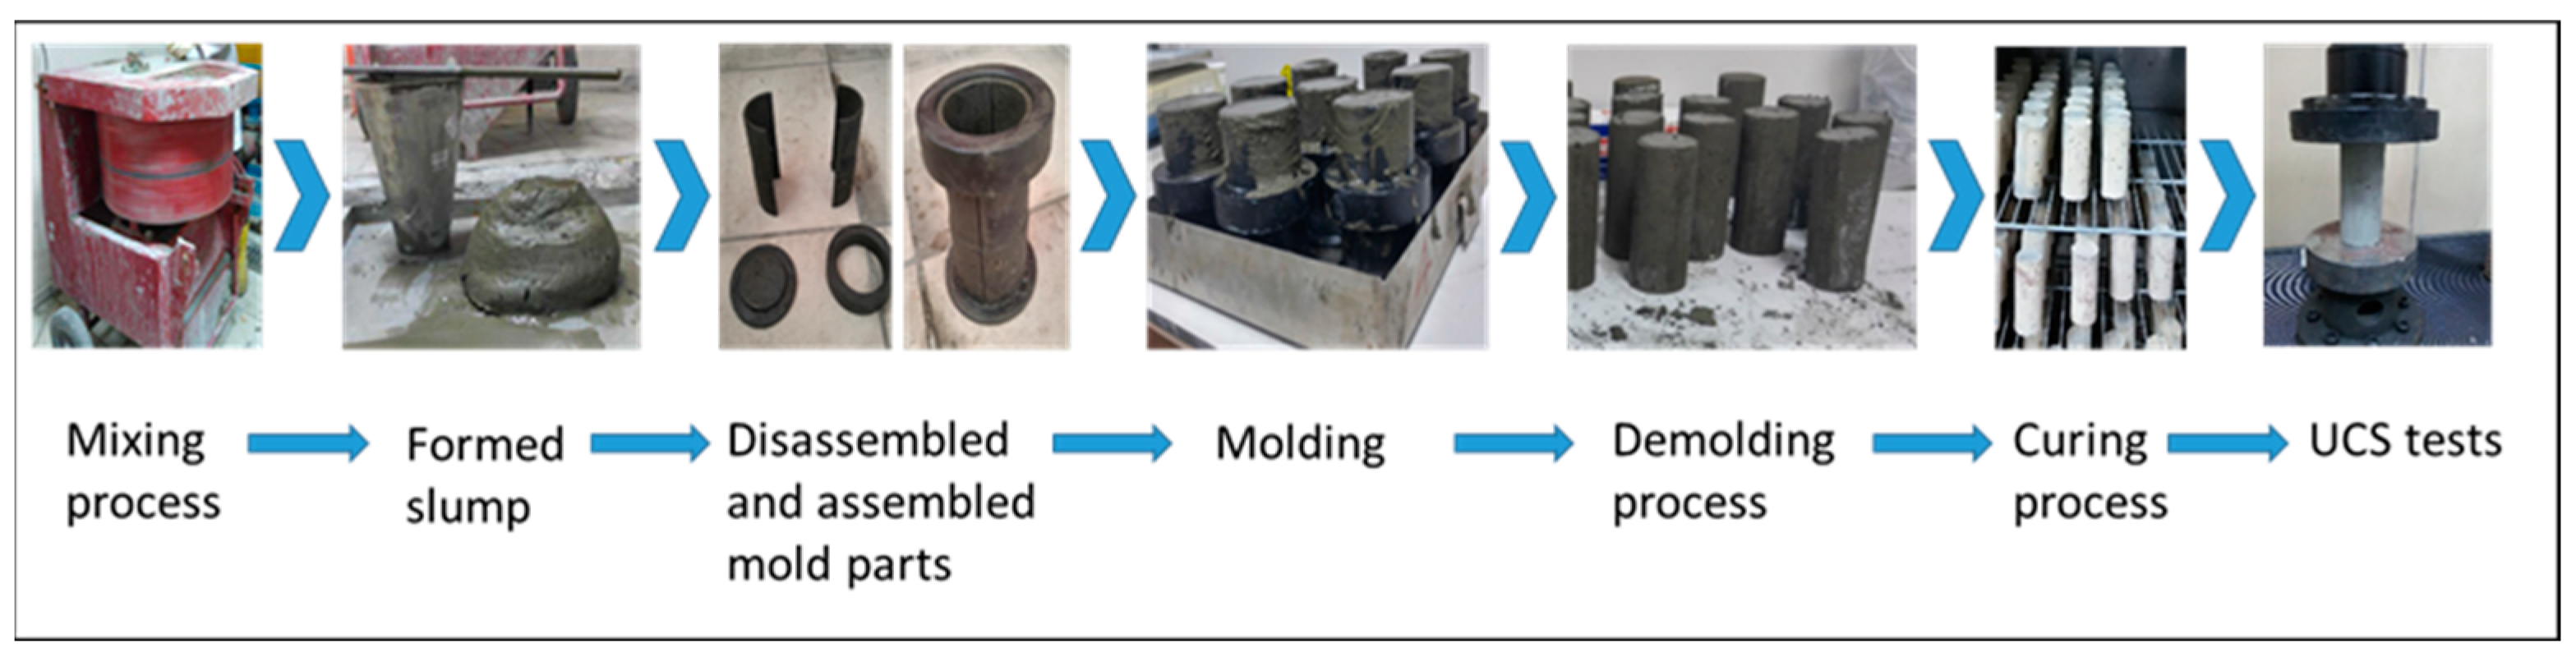
2.1. UCS Tests
2.2. ML Methods
2.2.1. Linear Regression (LR)
2.2.2. Random Forest
- “B” bootstrap samples are created by randomly selecting “n” samples with replacement from the training dataset.
- “n” randomly chosen and replaced data points from the original dataset make up each bootstrap sample.
- Every bootstrap sample is used to train a decision tree “T_bis”.
- Using “m” features selected randomly from the “p” available features, the optimal split is found at each node.
- Every tree makes a prediction, and the model’s ultimate prediction is the class that receives the most votes overall.
2.2.3. Artificial Neural Networks (ANN)
2.2.4. Extreme Gradient Boosting (XGBoost)
2.2.5. Performance Metrics
2.2.6. Dataset Description and Preparation
3. Results and Discussion
3.1. Performance Evaluation of ML Models
3.2. Comparison of Actual and Predicted Values
4. Conclusions
Author Contributions
Funding
Data Availability Statement
Conflicts of Interest
Abbreviations
| ANN | Artificial Neural Network |
| CPB | Cemented Paste Backfill |
| DNN | Deep Neural Network |
| EML | Ensemble Machine Learning |
| FA | Fly Ash |
| LR | Linear Regression |
| MAE | Mean Absolute Error |
| ML | Machine Learning |
| RAE | Relative Absolute Error |
| RF | Random Forest |
| RMSE | Root Mean Squared Error |
| RRSE | Root Relative Squared Error |
| UCS | Uniaxial Compressive Strength |
| XGBoost | Extreme Gradient Boosting |
References
- Can, E.; Kuşcu, Ş.; Kartal, M.E. Effects of mining subsidence on masonry buildings in Zonguldak hard coal region in Turkey. Environ. Earth Sci. 2012, 66, 2503–2518. [Google Scholar] [CrossRef]
- Salmi, E.F.; Phan, T.; Sellers, E.J.; Stacey, T.R. A review on the geotechnical design and optimisation of ultra-long ore passes for deep mass mining. Environ. Earth Sci. 2024, 83, 301. [Google Scholar] [CrossRef]
- Tayebi-Khorami, M.; Edraki, M.; Corder, G.; Golev, A. Re-thinking mining waste through an integrative approach led by circular economy aspirations. Minerals 2019, 9, 286. [Google Scholar] [CrossRef]
- Ali, G.A. Temperature Dependency of the Rheological Properties and Strength of Cemented Paste Backfill That Contains Sodium Silicate. Master’s Thesis, Department of Civil Engineering, University of Ottawa, Ottawa, ON, Canada, 2021. p. 122. [Google Scholar]
- Benato, A.; Gaida, E.; Oggeri, C.; Oreste, P. Analysis of the importance of the filling material characteristics injected around the precast concrete lining in the microtunnelling technology. Geotech. Geol. Eng. 2023, 41, 2775–2785. [Google Scholar] [CrossRef]
- Yilmaz, E.; Belem, T.; Bussière, B.; Benzaazoua, M. Relationships between microstructural properties and compressive strength of consolidated and unconsolidated cemented paste backfills. Cem. Concr. Compos. 2011, 33, 702–715. [Google Scholar] [CrossRef]
- Huang, S.; Xia, K.; Qiao, L. Dynamic tests of cemented paste backfill: Effects of strain rate, curing time, and cement content on compressive strength. J. Mater. Sci. 2011, 46, 5165–5170. [Google Scholar] [CrossRef]
- Li, W.; Fall, M. Sulphate effect on the early age strength and self-desiccation of cemented paste backfill. Constr. Build. Mater. 2016, 106, 296–304. [Google Scholar] [CrossRef]
- Ouattara, D.; Mbonimpa, M.; Yahia, A.; Belem, T. Assessment of rheological parameters of high density cemented paste backfill mixtures incorporating superplasticizers. Constr. Build. Mater. 2018, 190, 294–307. [Google Scholar] [CrossRef]
- Tuylu, S. Effect of different particle size distribution of zeolite on the strength of cemented paste backfill. Int. J. Environ. Sci. Technol. 2022, 19, 131–140. [Google Scholar] [CrossRef]
- Korzeniowski, W.; Poborska-Młynarska, K.; Skrzypkowski, K. The idea of the recovery of municipal solid waste incineration (MSWI) residues in Kłodawa salt mine s.a. by filling the excavations with self-solidifying mixtures. Arch. Min. Sci. 2018, 63, 553–565. [Google Scholar] [CrossRef]
- Mathapati, M.; Amate, K.; Prasad, C.D.; Jayavardhana, M.L.; Raju, T.H. A review on fly ash utilization. Mater. Today Proc. 2022, 50, 1535–1540. [Google Scholar] [CrossRef]
- Sata, V.; Jaturapitakkul, C.; Kiattikomol, K. Influence of pozzolan from various by-product materials on mechanical properties of high-strength concrete. Constr. Build. Mater. 2007, 21, 1589–1598. [Google Scholar] [CrossRef]
- Sharbaf, M.; Najimi, M.; Ghafoori, N. A comparative study of natural pozzolan and fly ash: Investigation on abrasion resistance and transport properties of self-consolidating concrete. Constr. Build. Mater. 2022, 346, 128330. [Google Scholar] [CrossRef]
- Mohsen, M.O.; Aburumman, M.O.; Al Diseet, M.M.; Taha, R.; Abdel-Jaber, M.; Senouci, A.; Abu Taqa, A. Fly ash and natural pozzolana impacts on sustainable concrete permeability and mechanical properties. Buildings 2023, 13, 1927. [Google Scholar] [CrossRef]
- ASTM C 618; Standart Specification for Coal Fly Ash and Raw or Calcined Natural Pozzolan for Use as a Mineral Admixture in Concrete. Annual Book of ASTM Standart. No. 04.02. ASTM: West Conshohocken, PA, USA, 2000. [CrossRef]
- Aydogmus, H.Y.; Erdal, H.I.; Karakurt, O.; Namli, E.; Turkan, Y.S.; Erdal, H. A comparative assessment of bagging ensemble models for modeling concrete slump flow. Comput. Concr. 2015, 16, 741–757. [Google Scholar] [CrossRef]
- Unlu, R. An assessment of machine learning models for slump flow and examining redundant features. Comput. Concr. 2020, 25, 565–574. [Google Scholar] [CrossRef]
- Namlı, E.; Erdal, H.İ.; Erdal, H. Dalgacık dönüşümü ile beton basınç dayanım tahmininin iyileştirilmesi (Turkish) (Improving Prediction Accuracy of Concrete Compressive Strength via Wavelet Transform). J. Polytech. 2016, 19, 471–480. [Google Scholar]
- Shariati, M.; Mafipour, M.S.; Ghahremani, B.; Azarhomayun, F.; Ahmadi, M.; Trung, N.T.; Shariati, A. A novel hybrid extreme learning machine–grey wolf optimizer (ELM-GWO) model to predict compressive strength of concrete with partial replacements for cement. Eng. Comput. 2022, 38, 757–779. [Google Scholar] [CrossRef]
- Hematibahar, M.; Kharun, M. Prediction of concrete mixture design and compressive strength through data analysis and machine learning. J. Mech. Cont. Math. Sci. 2024, 19, 1–21. [Google Scholar] [CrossRef]
- Prakash, S.; Kumar, S.; Rai, B. A new technique based on the gorilla troop optimization coupled with artificial neural network for predicting the compressive strength of ultrahigh performance concrete. Asian J. Civ. Eng. 2024, 25, 923–938. [Google Scholar] [CrossRef]
- Nguyen, N.H.; Nguyen, T.H.T.; Bui, L.G.; Ly, H.B. Enhancing concrete structure maintenance through automated crack detection: A computer vision approach. J. Sci. Technol. 2024, 4, 11–23. [Google Scholar] [CrossRef]
- Sevim, U.K.; Bilgic, H.H.; Cansiz, O.F.; Ozturk, M.; Atis, C.D. Compressive strength prediction models for cementitious composites with fly ash using machine learning techniques. Constr. Build. Mater. 2021, 271, 121584. [Google Scholar] [CrossRef]
- Wadhawan, S.; Bassi, A.; Singh, R.; Patel, M. Prediction of compressive strength for fly ash-based concrete: Critical comparison of machine learning algorithms. J. Soft. Comput. Civ. Eng. 2023, 7, 68–110. [Google Scholar] [CrossRef]
- Fattahi, H.; Ghaedi, H.; Armaghani, D.J. Optimizing fracture toughness estimation for rock structures: A soft computing approach with GWO and IWO algorithms. Measurement 2024, 238, 115306. [Google Scholar] [CrossRef]
- He, Y.; Cheng, Y.; Ma, M.; Li, F.; Song, Y.; Liu, L.; Wang, X.; Huang, J. A novel design concept of cemented paste backfill (CPB) materials: Biobjective optimization approach by applying an evolved random forest model. Materials 2022, 15, 8298. [Google Scholar] [CrossRef]
- Mishra, K.; Paul, P.S.; Ghosh, C.N.; Singh, P.; Behera, S.K.; Mandal, P.K. Predicting and optimising the strength of cemented paste fills through bayesian network model. Min. Metall. Explor. 2022, 39, 2095–2120. [Google Scholar] [CrossRef]
- Qi, C.; Zheng, J.; Yang, X.; Chen, Q.; Wu, M. Application of deep neural network in the strength prediction of cemented paste backfill based on a global dataset. Constr. Build. Mater. 2023, 391, 131827. [Google Scholar] [CrossRef]
- Hu, Y.; Li, K.; Zhang, B.; Han, B. Strength ınvestigation and prediction of superfine tailings cemented paste backfill based on experiments and ıntelligent methods. Materials 2023, 16, 3995. [Google Scholar] [CrossRef]
- Tran, V.Q. Using artificial intelligence approach for investigating and predicting yield stress of cemented paste backfill. Sustainability 2023, 15, 2892. [Google Scholar] [CrossRef]
- Xiong, S.; Liu, Z.; Min, C.; Shi, Y.; Zhang, S.; Liu, W. Compressive strength prediction of cemented backfill containing phosphate tailings using extreme gradient boosting optimized by whale optimization algorithm. Materials 2023, 16, 308. [Google Scholar] [CrossRef] [PubMed]
- Kurniati, E.O.; Zeng, H.; Latypov, M.I.; Kim, H.J. Machine learning for predicting compressive strength of sustainable cement paste incorporating copper mine tailings as supplementary cementitious materials. Case Stud. Constr. Mater. 2024, 21, e03373. [Google Scholar] [CrossRef]
- Tuylu, S. Investigation of the effect of using different fly ash on the mechanical properties in cemented paste backfill. J. Wuhan Univ. Technol.-Mater. Sci. Ed. 2022, 37, 620–627. [Google Scholar] [CrossRef]
- Brackebusch, F.W. Basics of paste backfill systems. Min. Eng. 1994, 46, 1175–1178. [Google Scholar]
- EN 196-6:2018; Methods of Testing Cement—Part 6: Determination of Fineness. European Committee for Standardization: Brussels, Belgium, 2018. Available online: https://cdn.standards.iteh.ai/samples/60528/2c57afb4157d4d53ae2cd3ae8d453e03/SIST-EN-196-6-2019.pdf (accessed on 17 February 2025).
- Görhan, G.; Kahraman, E.; Başpınar, M.S.; Demir, İ. Uçucu kül bölüm I: Oluşumu, sınıflandırılması ve kullanım alanları (Turkish), Teknik Not. Yapı Teknol. Elektron. Derg. 2008, 4, 85–94. [Google Scholar]
- ASTM C143; Standard Test Method for Slump of Hydraulic-Cement Concrete. ASTM International: West Conshohocken, PA, USA, 2020. [CrossRef]
- Ghirian, A.; Fall, M. Coupled behavior of cemented paste backfill at early ages. Geotech. Geol. Eng. 2015, 33, 1141–1166. [Google Scholar] [CrossRef]
- ASTM C39; Standard Test Method for Compressive Strength of Cylindrical Concrete Specimens. ASTM International: West Conshohocken, PA, USA, 2018. [CrossRef]
- Pan, A.; Grabinsky, M. Mechanical characterization of cemented paste backfill. Eng 2023, 4, 738–747. [Google Scholar] [CrossRef]
- Belem, T.; Benzaazoua, M. Design and application of underground mine paste backfill technology. Geotech. Geol. Eng. 2008, 26, 147–174. [Google Scholar] [CrossRef]
- Namlı, E.; Ünlü, R.; Gül, E. Fiyat tahminlemesinde makine öğrenmesi teknikleri ve doğrusal regresyon yöntemlerinin kıyaslanması; Türkiye’de satılan ikinci el araç fiyatlarının tahminlenmesine yönelik bir vaka çalışması (Turkish). (A comparative study of machine learning and linear regression in prediction of pricing: A case study of used cars price prediction in Turkey). Konya J. Eng. Sci. 2019, 7, 806–821. [Google Scholar] [CrossRef]
- Breiman, L. Random forests. Mach. Learn. 2001, 45, 5–32. [Google Scholar] [CrossRef]
- Ünlü, R. An assessment of imbalanced control chart pattern recognition by artificial neural networks. In Artificial Intelligence and Machine Learning Applications in Civil, Mechanical, and Industrial Engineering; Bekdaş, G., Nigdeli, S.M., Yücel, M., Eds.; IGI Global: Hershey, PA, USA, 2020; pp. 240–258. [Google Scholar] [CrossRef]
- Ciner, M.N.; Güler, M.; Namli, E.; Samastı, M.; Ulu, M.; Peker, İ.B.; Gülbaz, S. The forecast of streamflow through Göksu stream using machine learning and statistical methods. Water 2024, 16, 1125. [Google Scholar] [CrossRef]
- Güler, M.; Kabakçı, A.; Koç, Ö.; Eraslan, E.; Derin, K.H.; Güler, M.; Ünlü, R.; Türkan, Y.S.; Namli, E. Forecasting of the unemployment rate in Turkey: Comparison of the machine learning models. Sustainability 2024, 16, 6509. [Google Scholar] [CrossRef]
- Namlı, E.; Yücel, M.; Unlu, R.; Tuylu, A.N.A. Smart estimation model for energy performance certificates of residential buildings. J. Eng. Res. 2022, 1–24, in press. [Google Scholar] [CrossRef]
- Han, J.; Kamber, M.; Pei, J. Data Mining: Concepts and Techniques, 3rd ed.; Morgan Kaufmann Publishers: San Mateo, CA, USA; Elsevier: Amsterdam, The Netherlands, 2012; ISBN 978-0-12-381479-1. [Google Scholar] [CrossRef]
- Chen, T.; Guestrin, C. Xgboost: A scalable tree boosting system. In Proceedings of the 22nd ACM SIGKDD İnternational Conference on Knowledge Discovery and Data Mining, San Francisco, CA, USA, 13–17 August 2016; pp. 785–794. [Google Scholar] [CrossRef]
- Freund, Y.; Schapire, R.E. A decision-theoretic generalization of on-line learning and an application to boosting. J. Comput. Syst. Sci. 1997, 55, 119–139. [Google Scholar] [CrossRef]
- Adiguzel Tuylu, A.N.; Eroglu, E. The prediction of product return rates with ensemble machine learning algorithms. J. Eng. Res. 2022, 1–14, in press. [Google Scholar] [CrossRef]


| Component | D10 | D30 | D50 | D60 | D90 | ≤20 μm | >45 μm | >90 μm | Specific Gravity |
|---|---|---|---|---|---|---|---|---|---|
| Balya Tailing | 2.5 | 11.5 | 30 | 45 | 140 | 42% | 40% | 12% | 3.2 |
| Portland Cement | 2.5 | 8.7 | 15 | 20 | 50 | 60% | 13% | 0.1% | 3.1 |
| CFA | 3.5 | 9 | 15 | 20 | 120 | 60% | 22% | 13% | 2.6 |
| SFA | 8 | 15 | 38 | 55 | 145 | 35% | 45% | 25% | 2.4 |
| YFA | 7 | 15 | 20 | 38 | 155 | 50% | 35% | 16% | 2.2 |
| TFA | 5 | 20 | 37 | 45 | 90 | 30% | 40% | 10% | 2.7 |
| Component (%) | SiO2 | Al2O3 | Fe2O3 | CaO | MgO | K2O | Na2O | * S/** SO3 |
|---|---|---|---|---|---|---|---|---|
| Balya Tailings | 36.2 | 8.1 | 13.6 | 23.3 | 2.5 | 2.6 | ≤0.5 | * ~8 |
| Portland Cement | 19.9 | 4.8 | 3.4 | 61.6 | 1.3 | 0.9 | ≤0.5 | ** ~4 |
| CFA | 53.4 | 26.2 | 6.5 | 4.1 | 2.3 | 4.2 | ≤0.5 | ** ~1 |
| SFA | 45.1 | 23.4 | 4 | 19.1 | 1.7 | 1.3 | ≤0.5 | ** ~5 |
| YFA | 46.3 | 23.1 | 6.5 | 13 | 2.8 | 2.4 | ≤0.5 | ** ~3 |
| TFA | 33.7 | 19.8 | 4.5 | 22 | 2.2 | 1.6 | ≤0.5 | ** ~14 |
| Solids Ratio (%) | Cement Ratio (%) | UCS (MPa) over Curing Time | |||
|---|---|---|---|---|---|
| 28 Days | 56 Days | 90 Days | 200 Days | ||
| 80 | 3 | 0.53 | 0.94 | 0.55 | 0.41 |
| 80 | 5 | 1.57 | 1.93 | 2.36 | 1.92 |
| 80 | 7 | 2.55 | 3.31 | 3.88 | 3.37 |
| 80 | 9 | 3.81 | 5.59 | 5.67 | 5.93 |
| 80 | 11 | 4.93 | 8.08 | 6.38 | 6.62 |
| FA Subs. Ratio (%) | UCS (MPa) over Curing Time | |||||||||||
|---|---|---|---|---|---|---|---|---|---|---|---|---|
| 28 Days (Reference UCS = 3.81 MPa) | 56 Days (Reference UCS = 5.59 MPa) | 90 Days (Reference UCS = 5.67 MPa) | ||||||||||
| CFA (MPa) | SFA (MPa) | YFA (MPa) | TFA (MPa) | CFA (MPa) | SFA (MPa) | YFA (MPa) | TFA (MPa) | CFA (MPa) | SFA (MPa) | YFA (MPa) | TFA (MPa) | |
| 20 | 2.14 | 5.27 | 2.14 | 3.79 | 2.31 | 7.26 | 5.94 | 4.18 | 3.25 | 6.96 | 3.95 | 5.9 |
| 30 | 2.56 | 5.44 | 3.2 | 3.78 | 2.38 | 6.22 | 6.33 | 4.07 | 1.69 | 5.35 | 4.63 | 5.81 |
| 40 | 2.46 | 5.74 | 3.4 | 3.07 | 2.65 | 6.23 | 5.78 | 3.54 | 2.57 | 5.49 | 3.81 | 5.75 |
| 50 | 1.75 | 4.85 | 3.14 | 2.47 | 3.66 | 6.09 | 3.32 | 2.87 | 3.66 | 6.14 | 2.82 | 5.73 |
| FA Subs. Ratio (%) | UCS (MPa) over Curing Time | |||||||||||
|---|---|---|---|---|---|---|---|---|---|---|---|---|
| 28 Days (Reference UCS = 4.93 MPa) | 56 Days (Reference UCS = 8.08 MPa) | 90 Days (Reference UCS = 6.38 MPa) | ||||||||||
| CFA (MPa) | SFA (MPa) | YFA (MPa) | TFA (MPa) | CFA (MPa) | SFA (MPa) | YFA (MPa) | TFA (MPa) | CFA (MPa) | SFA (MPa) | YFA (MPa) | TFA (MPa) | |
| 20 | 0.69 | 4.94 | 4.86 | 6.49 | 4.67 | 8.13 | 6.32 | 7.45 | 9.82 | 7.13 | 4.4 | 10.33 |
| 30 | 2.97 | 5.09 | 5.91 | 5.55 | 5.36 | 6.65 | 7.65 | 7.17 | 8.29 | 6.37 | 5.84 | 10 |
| 40 | 2.7 | 5.53 | 4.74 | 6.73 | 5.1 | 9.1 | 6.28 | 6.79 | 6.91 | 7.35 | 4.08 | 9.85 |
| 50 | 1.76 | 5.86 | 4.58 | 6.09 | 1.73 | 7.05 | 6.61 | 6.55 | 6.32 | 6.42 | 4.27 | 9.65 |
| Correlation Coefficient (R): A widely used metric to assess how well the R curve matches the data. When the actual values and the anticipated values coincide perfectly, the values have the same tendency, as indicated by a value of 1. | |
| Mean Absolute Error (MAE): The MAE value is a metric used to assess how well predictions match actual outcomes. By disregarding the direction of the mistakes, it determines the average size of the discrepancies between the expected and actual numbers. | |
| Root Mean Square Error (RMSE): To determine the square root of the total value and the square error of the prediction compared to the actual values, RMSE is computed. Thus, it is the mean distance along a vertical line between a data point and the fixed line. This tool effectively identifies undesirable large differences. | |
| Relative Absolute Error (RAE): The ratio of the absolute difference between the actual and anticipated values to the actual values is known as the RAE value. | |
| Root Relative Squared Error (RRSE): The square root of the sum of the squares of the differences between the actual and predicted values and the sum of the squares of the differences between the actual and mean values is the correct root square error, or RRSE value. |
| Exp. | FA (% of FA + Cement) | FA + Cement (% of Total Mass) | Cement (% of Total Mass) | Water (% of Total Mass) | Tailings (% of Total Mass) | FA (% of Total Mass) | Curing Time (Day) | CFA | SFA | YFA | TFA | Strength (MPa) |
|---|---|---|---|---|---|---|---|---|---|---|---|---|
| 1 | 0 | 3 | 3 | 20 | 77 | 0 | 28 | 0 | 0 | 0 | 0 | 0.53 |
| 2 | 0 | 3 | 3 | 20 | 77 | 0 | 56 | 0 | 0 | 0 | 0 | 0.94 |
| 3 | 0 | 3 | 3 | 20 | 77 | 0 | 90 | 0 | 0 | 0 | 0 | 0.55 |
| 4 | 0 | 3 | 3 | 20 | 77 | 0 | 200 | 0 | 0 | 0 | 0 | 0.41 |
| . | . | . | . | . | . | . | . | . | . | . | . | . |
| . | . | . | . | . | . | . | . | . | . | . | . | . |
| . | . | . | . | . | . | . | . | . | . | . | . | . |
| 112 | 50 | 11 | 5.5 | 20 | 69 | 5.5 | 90 | 0 | 0 | 1 | 0 | 4.27 |
| 113 | 20 | 11 | 8.8 | 20 | 69 | 2.2 | 90 | 0 | 0 | 0 | 1 | 10.33 |
| 114 | 30 | 11 | 7.7 | 20 | 69 | 3.3 | 90 | 0 | 0 | 0 | 1 | 10 |
| 115 | 40 | 11 | 6.6 | 20 | 69 | 4.4 | 90 | 0 | 0 | 0 | 1 | 9.85 |
| 116 | 50 | 11 | 5.5 | 20 | 69 | 5.5 | 90 | 0 | 0 | 0 | 1 | 9.65 |
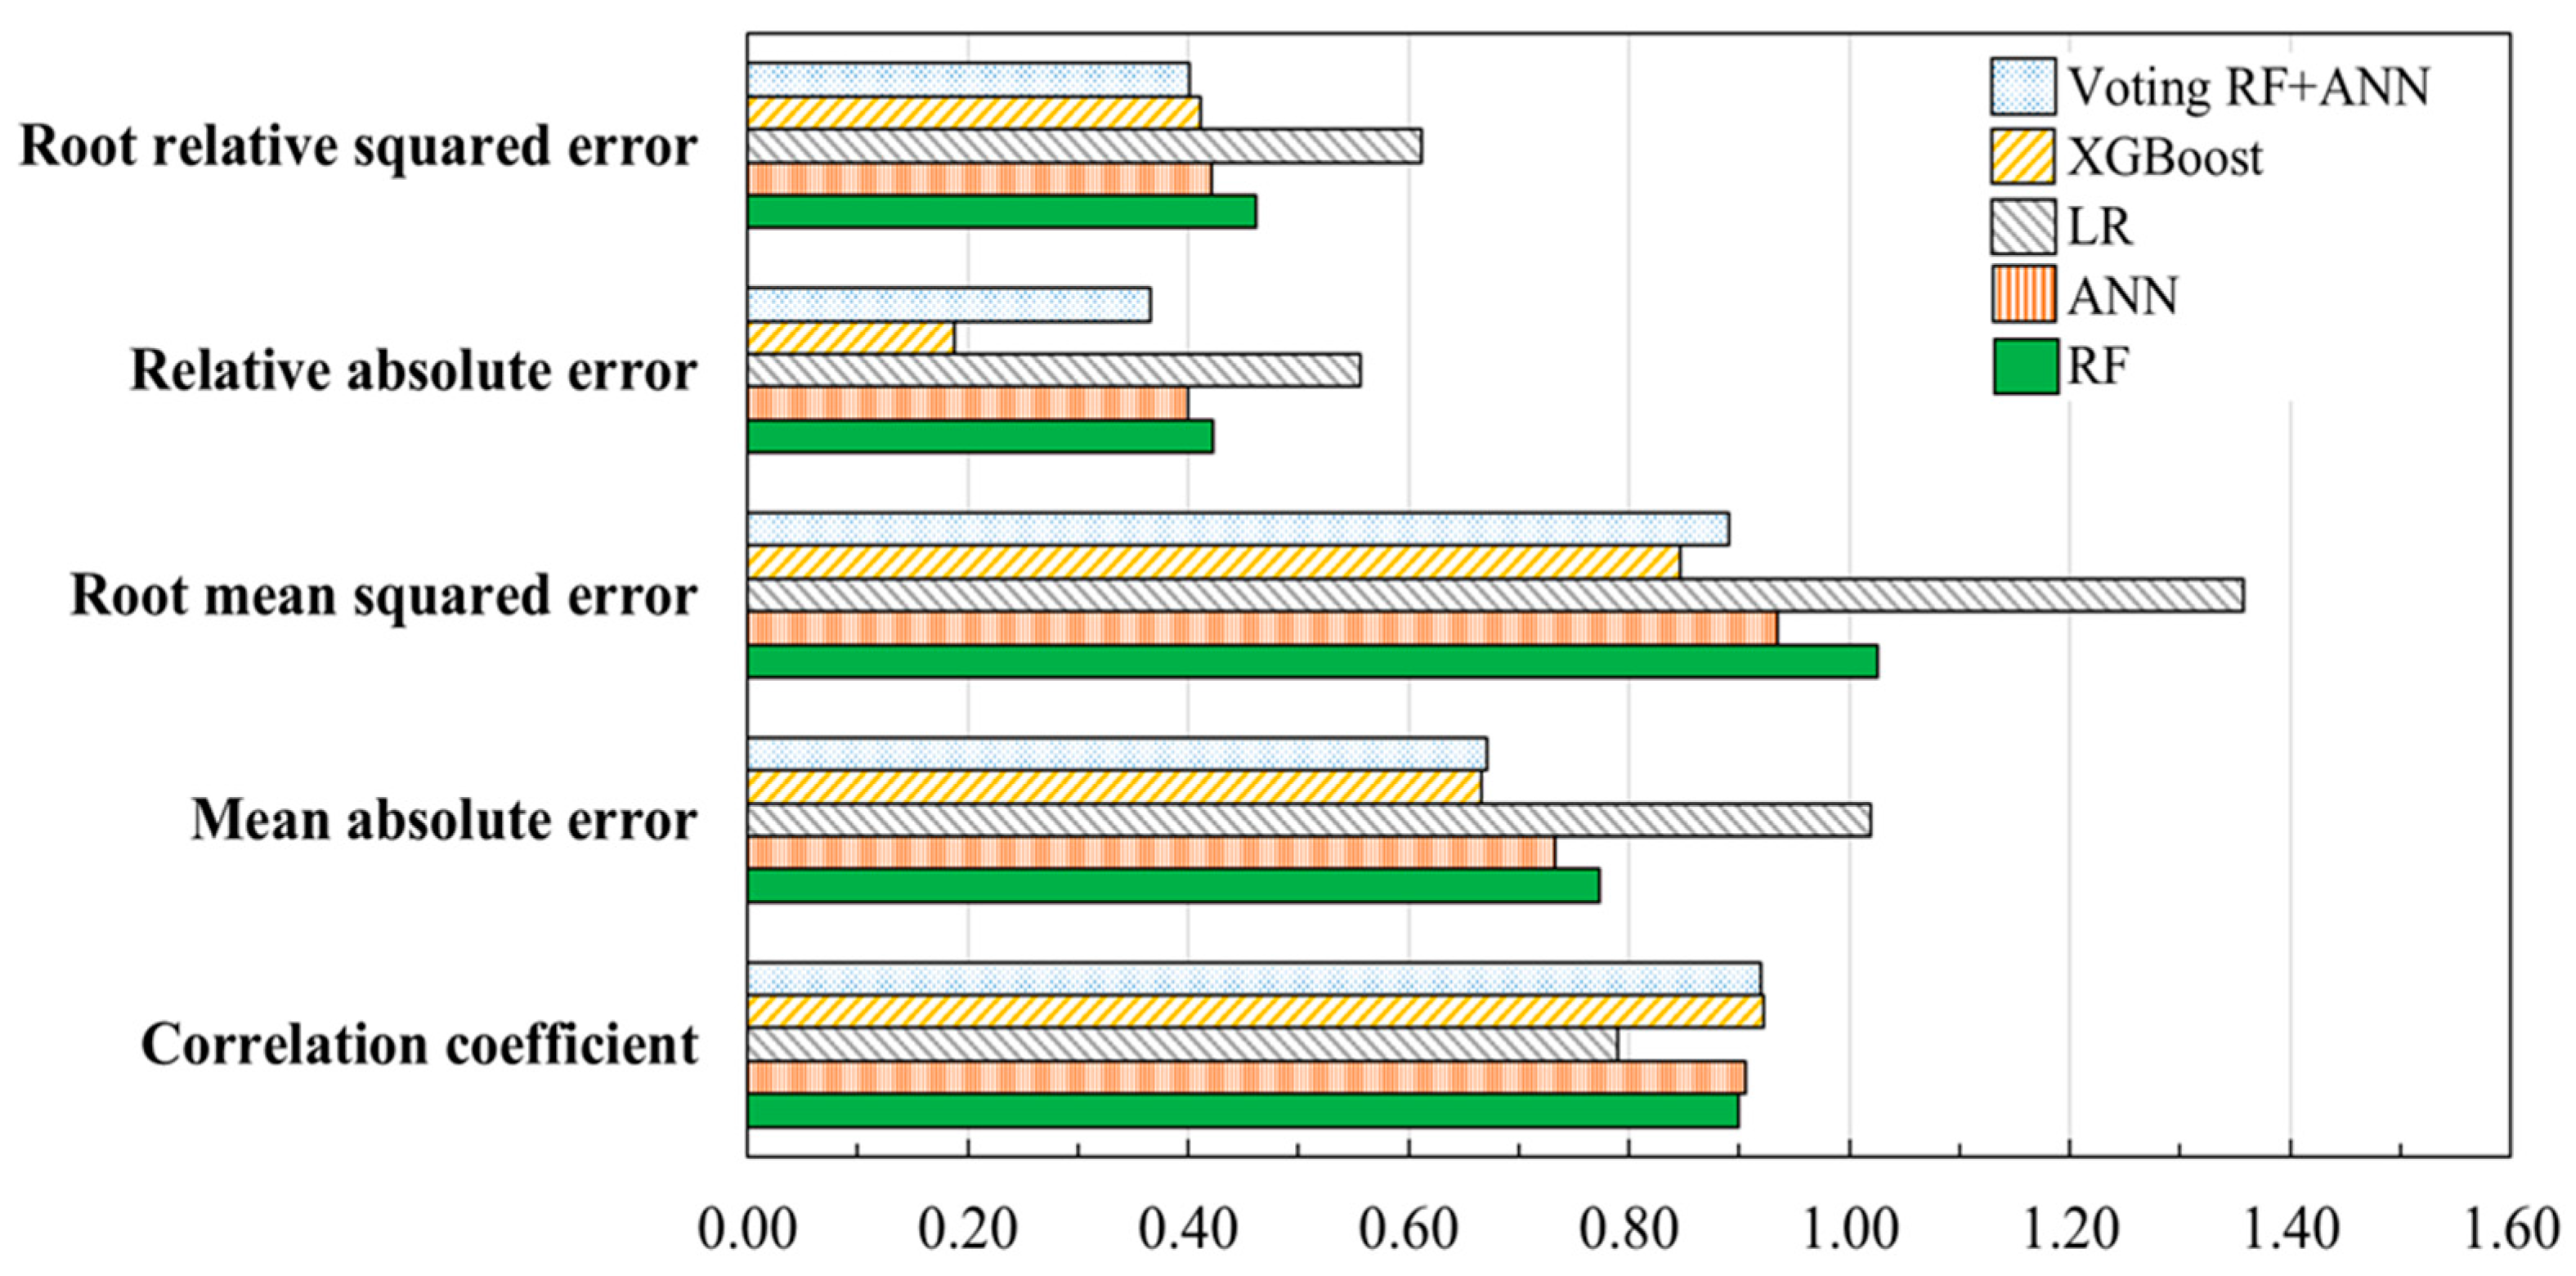
| Performance Metrics | RF | ANN | LR | XGBoost | Voting RF + ANN |
|---|---|---|---|---|---|
| Correlation coefficient | 0.8999 | 0.9065 | 0.7902 | 0.922 | 0.9192 |
| Mean absolute error | 0.7737 | 0.7333 | 1.0198 | 0.666 | 0.6712 |
| Root mean squared error | 1.0263 | 0.935 | 1.3571 | 0.847 | 0.8903 |
| Relative absolute error (%) | 42.23 | 40.03 | 55.67 | 18.81 | 36.64 |
| Root relative squared error (%) | 46.23 | 42.12 | 61.13 | 41.10 | 40.10 |
| Total number of instances | 116 | 116 | 116 | 116 | 116 |
| Parameters | Values |
|---|---|
| tree_method | auto |
| seed | 701,232,104 |
| max_depth | 6 |
| booster | gbtree |
| min_split_loss | 0 |
| objective | eg:squarederror |
| lambda | 1 |
| nthread | 7 |
| alpha | 0 |
| subsample | 1 |
| learning_rate | 0.3 |
| min_child_weight | 1 |
| verbosity | 0 |
| Boosting iterations | 75 |
| Instance | Actual | RF Predicted | ANN Predicted | LR Predicted | Voting RF + ANN Predicted | XGBoost Predicted |
|---|---|---|---|---|---|---|
| 1 | 1.75 | 2.864 | 1.963 | 1.963 | 2.413 | 2.935 |
| 2 | 5.93 | 4.843 | 6.388 | 6.388 | 5.616 | 4.998 |
| 3 | 4.18 | 4.652 | 3.594 | 3.594 | 4.123 | 4.876 |
| 4 | 7.35 | 6.532 | 5.996 | 5.996 | 6.264 | 7.982 |
| 5 | 0.53 | 1.241 | −0.521 | −0.521 | 0.36 | 0.814 |
| . | . | . | . | . | . | . |
| . | . | . | . | . | . | . |
| . | . | . | . | . | . | . |
| 112 | 3.81 | 4.231 | 4.382 | 4.382 | 4.307 | 3.158 |
| 113 | 5.59 | 5.272 | 5.774 | 5.774 | 5.523 | 6.027 |
| 114 | 3.66 | 3.128 | 2.309 | 2.309 | 2.719 | 3.344 |
| 115 | 7.65 | 6.297 | 6.278 | 6.278 | 6.287 | 6.937 |
| 116 | 5.55 | 6.375 | 6.24 | 6.24 | 6.308 | 6.209 |
Disclaimer/Publisher’s Note: The statements, opinions and data contained in all publications are solely those of the individual author(s) and contributor(s) and not of MDPI and/or the editor(s). MDPI and/or the editor(s) disclaim responsibility for any injury to people or property resulting from any ideas, methods, instructions or products referred to in the content. |
© 2025 by the authors. Licensee MDPI, Basel, Switzerland. This article is an open access article distributed under the terms and conditions of the Creative Commons Attribution (CC BY) license (https://creativecommons.org/licenses/by/4.0/).
Share and Cite
Adiguzel Tuylu, A.N.; Tuylu, S.; Adiguzel, D.; Namli, E.; Gungoren, C.; Demir, I. Optimizing Strength Prediction for Cemented Paste Backfills with Various Fly Ash Substitution: Computational Approach with Machine Learning Algorithms. Minerals 2025, 15, 234. https://doi.org/10.3390/min15030234
Adiguzel Tuylu AN, Tuylu S, Adiguzel D, Namli E, Gungoren C, Demir I. Optimizing Strength Prediction for Cemented Paste Backfills with Various Fly Ash Substitution: Computational Approach with Machine Learning Algorithms. Minerals. 2025; 15(3):234. https://doi.org/10.3390/min15030234
Chicago/Turabian StyleAdiguzel Tuylu, Ayse Nur, Serkan Tuylu, Deniz Adiguzel, Ersin Namli, Can Gungoren, and Ismail Demir. 2025. "Optimizing Strength Prediction for Cemented Paste Backfills with Various Fly Ash Substitution: Computational Approach with Machine Learning Algorithms" Minerals 15, no. 3: 234. https://doi.org/10.3390/min15030234
APA StyleAdiguzel Tuylu, A. N., Tuylu, S., Adiguzel, D., Namli, E., Gungoren, C., & Demir, I. (2025). Optimizing Strength Prediction for Cemented Paste Backfills with Various Fly Ash Substitution: Computational Approach with Machine Learning Algorithms. Minerals, 15(3), 234. https://doi.org/10.3390/min15030234