Article

Exploring Pore Structure Features, Crack Propagation and Failure Behavior of Fiber Reinforced Foam Tail Fill by CT Imaging and 3D Reconstruction

1
School of Civil and Resource Engineering, University of Science and Technology Beijing, Beijing 100083, China
2
Department of Civil Engineering, Geotechnical Division, Recep Tayyip Erdogan University, Fener, Rize TR53100, Türkiye
*
Authors to whom correspondence should be addressed.
Minerals 2025, 15(4), 354; https://doi.org/10.3390/min15040354
Submission received: 8 February 2025 / Revised: 24 March 2025 / Accepted: 27 March 2025 / Published: 28 March 2025
(This article belongs to the Special Issue Cemented Mine Waste Backfill: Experiment and Modelling: 2nd Edition)

Abstract

:
Fiber-reinforced foam tail fill (FRFTF) has been widely investigated in the field of foamed backfill because of its high strength and toughness. However, the fiber enhancement and damage mechanism of FRFTF still need to be further explored. The pore crack growth and particle structure distribution features of three kinds of basalt (B), polypropylene (PP), and glass (G) fibers on FRFTF were explored. The porosity, fracture, sphericity, and fractal dimension of FRFTF were quantitatively probed by X-ray micro-computed tomography combined with uniaxial compression (UCS) and SEM, while the spatial distribution of porosity and fracture of FRFTF was analyzed by 3D reconstruction technology. Laboratory findings demonstrate that the porosity of glass fiber increases from 1.46% to 4.74% with the increase of fiber content from 0.3% to 0.9%. This is related to the weak adhesion between the backfill and the fiber. Adding fiber and blowing agents could well enhance the pore distribution and morphology of FRFTF, reduce the number of principal cracks trapped within backfill specimens, and maintain the structure’s integrity. The relationship between FRFTF’s UCS value and porosity/fracture is closely related to the nature and quantity of fibers, and the overall performance of glass fiber is the best among others. As the quality of glass fiber shifts from 0.3% to 0.9%, the fill specimen’s UCS value is adversely correlated with the porosity. In the current study, the internal connection and damage mechanism of FRFTFs are studied microscopically. The combination of macro-mechanical strength and microscopic mechanism provides a new research idea for FRFTF materials during the implementation of the fully mechanized mining technology in hard rock mines.

1. Introduction

With scientific and technological progress as well as renewals in mining [1], the abundant surface mineral resources of the earth have been gradually exhausted [2], and human beings must turn their attention to the more complicated and severe deep underground [3]. Cement-based tailings filling (CTB) plays an extensive role in fully recovering resources [4], governing ground pressure, and ensuring workers’ safety [5] and is widely being employed in underground mines [6]. However, the low concentration of CTB slurry transported by artesian flow leads to fill deposition [7,8,9]. In terms of long-term settlement and the hydrating mechanism, a gap between filling and the roof can be observed [10]. Problems such as roof caving and sheet wall threaten personnel and equipment safety [11,12]. The roof’s firmness is a crucial factor affecting filling mining’s efficiency [13,14]. Therefore, it is urgent to put forward a new technology that can meet the mining and strength criteria for safe production.
Fiber-reinforced foam tailings fill (FRFTF) is a composite product covering fiber, foam, tails, cement, and blending water [15,16,17,18,19]. Foaming agents are widely used in the field of mining filling due to their excellent properties, such as heat preservation [20], thermal insulation [21], and sound insulation [22]. However, copious pores created by a foaming agent have an adverse effect on the fill’s strength property [22,23,24,25]. Fiber can make up for the defects caused by foaming agents, enhance the fill’s strength gain [26,27,28,29], prevent crack propagation, effectively limit cracks’ spread, and improve fills’ durability [30,31]. For example, Li et al. [32] have explored the influence mechanism of fiber on tailings backfill from both macro and micro aspects through an indoor triaxial test combined with numerical simulation. Zhao et al. [33] have established that glass fiber enhances the fill’s ductility, maintaining its structural integrity. Pi et al. [34] have concluded that the addition of 1% basalt fiber gives good shear resistance to CTB specimens. Xue et al. [35] have experimentally shown that the addition of fiber could improve the mechanical properties and porosity of the fills. Wang et al. [36] found that the appropriate fiber content can optimize the pore structure and improve the frost resistance of the tailings fills. Xu et al. [37] have probed fiber impact on strength features of concrete with foaming. Bian et al. [38] have established that carbon fiber could enhance electromagnetic break engagement and bending features of cementitious products covering foaming agents.
It is well known that fiber-reinforced cement-based composites are closely related to fiber content, type, spatial distribution, and microstructure [39,40,41,42]. While uniaxial compressive/flexural strengths and shear properties are limited to macroscopic mechanical properties, the study of fine microstructure is mostly important [43,44]. X-ray computed tomography (CT) has emerged as a key research tool in medical, industrial, and material sciences due to its non-destructive nature and precise capability to explore the internal features of fills and quantitatively analyze fill mechanisms [45,46]. Jiang et al. [47] used the CT technique combined with a bending strength experiment to find that fiber can be optimized to augment the fill’s microstructure and improve the anti-cracking performance. Li et al. [48] used a CT scanning test and three-dimensional reconstruction technology to quantitatively analyze and found that composite fibers could reduce the porosity of fill and reveal the crack distribution law. Hao et al. [49] employed the CT technique to further characterize the 3D crack morphology of cement-based materials and further studied the properties after cracking. At present, researchers mainly focus on the in-depth study of fiber-reinforced tailings backfill. However, the quantitative characterization of the pore-fracture structure in fiber-reinforced foam tailings fill remains limited.
At present, there are few studies on fiber-foamed cement-based materials. In this paper, three-dimensional CT scanning technology is mainly used to quantitatively analyze impacts of polypropylene (PP), basalt (B), and glass (G) fibers on the porosity, sphericity, and fracture of foamed backfill and to reveal the close relationship between the stability of backfill and the pore structure characteristics. The spatial distribution of pores/fractures in FRFTF is analyzed in detail by 3D reconstruction technology, which reveals the close relationship between the stability of backfill and the characteristics of pore structure.

2. Materials and Methods
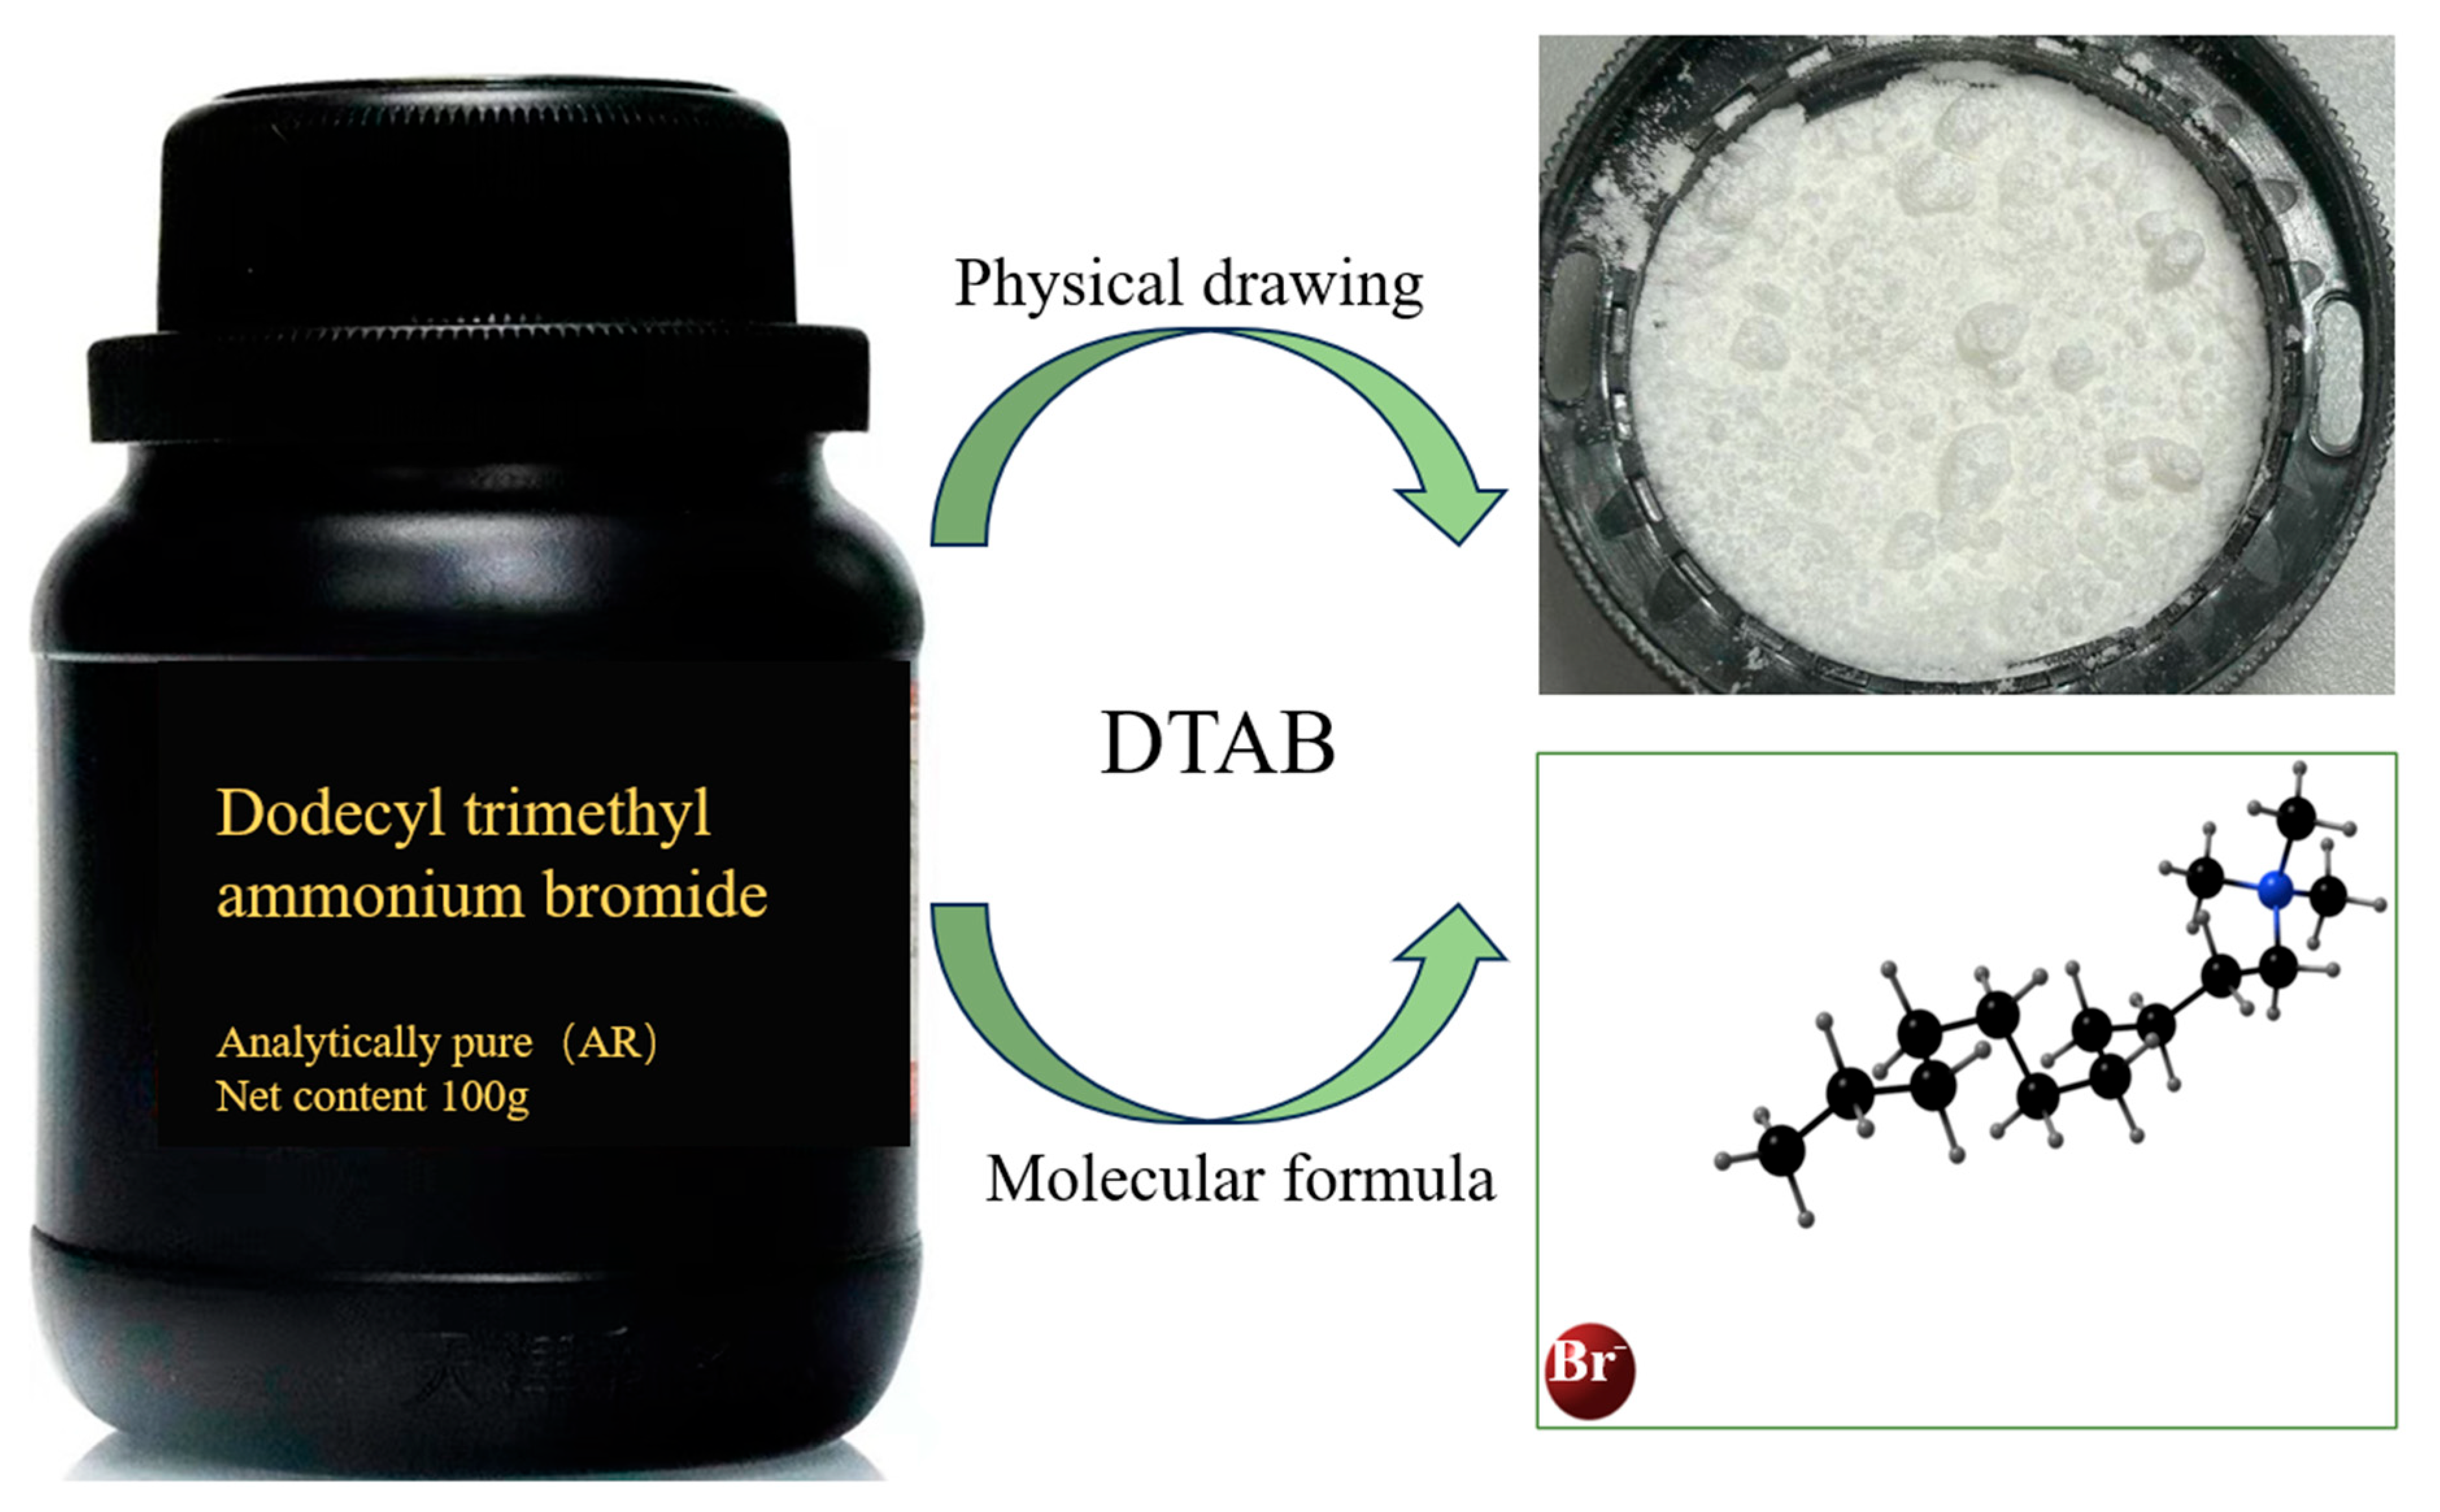
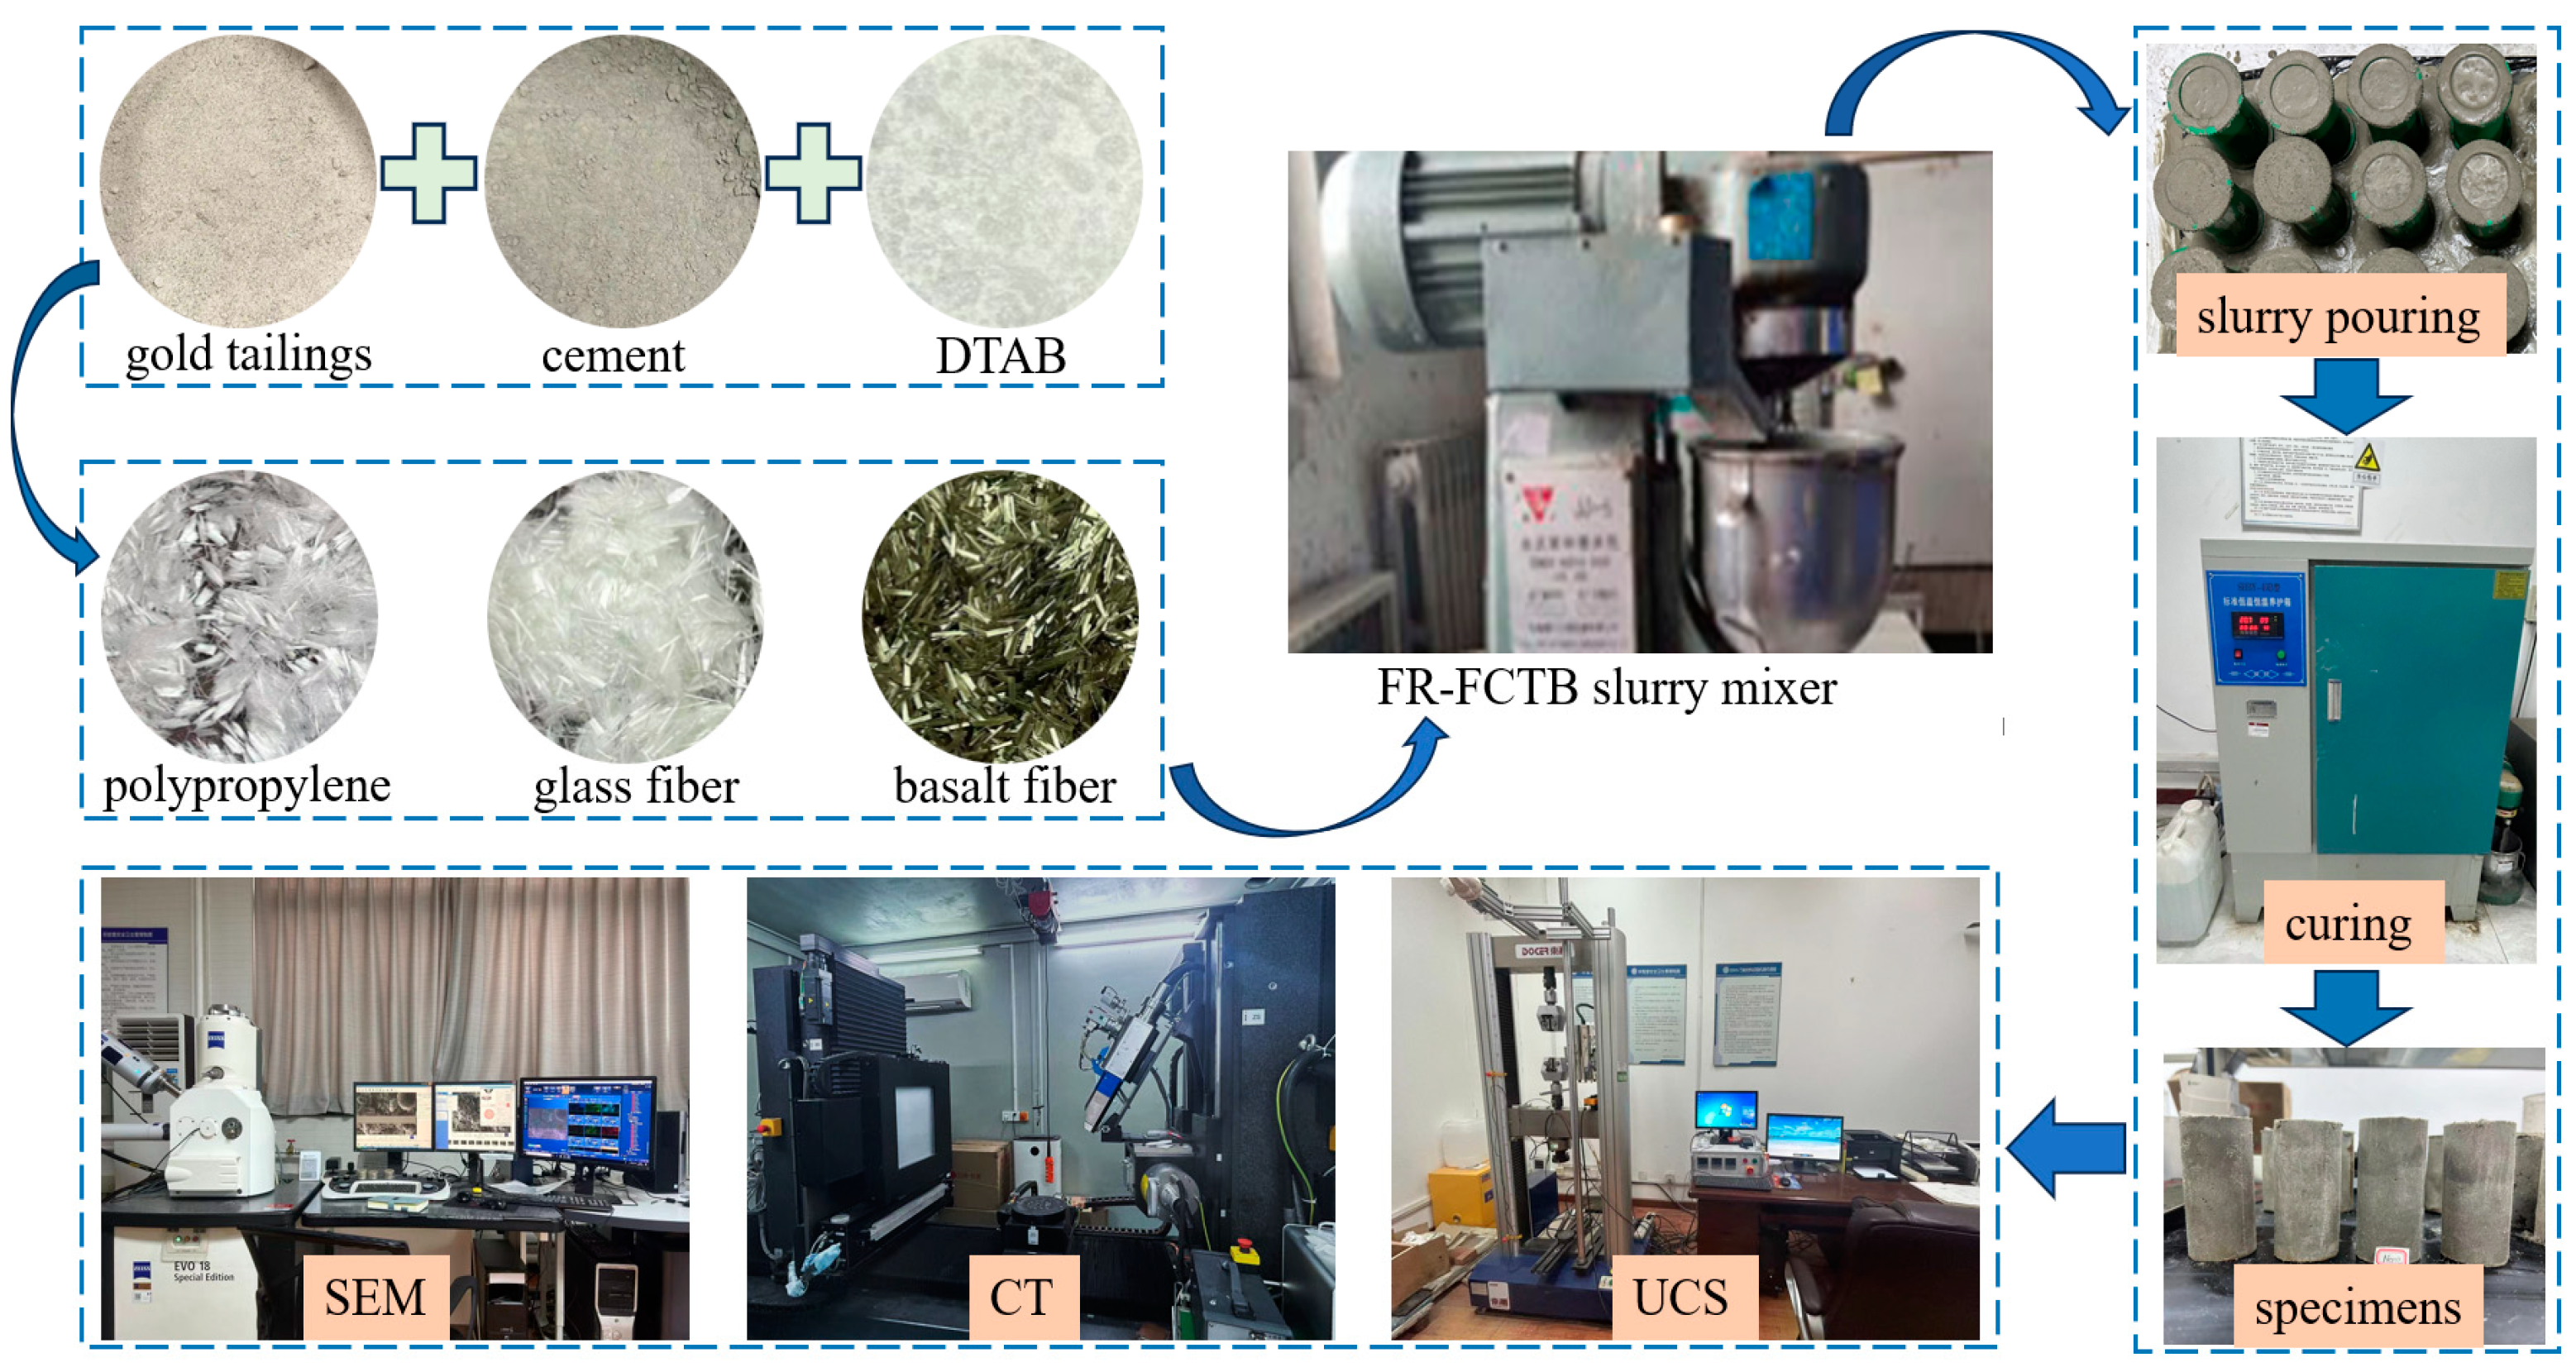
2.1. Resources

The FRFTF specimen was formed by a gold mine (Shandong, China) tailing, general use Portland binding agent (OPC) 42.5R type, a composite fiber reinforcement covering PP-G-B, dodecyl trimethyl ammonium bromide (DTAB) as a foaming agent, and tap water as mixing water. An X-ray fluorescence (XRF) spectrometer from the laboratory of the University of Science and Technology Beijing (Beijing, China) was used to analyze the chemical composition of the tailings and cement accurately. Table 1 reveals the results of the laboratory analysis achieved. Particle size and spreading analyses of experimented materials were undertaken by employing an automatic LS-POP laser analyzer from the Key Laboratory of the University of Science and Technology Beijing. The gold tailings’ specific surface area is 359.7 m2/kg, and the tailings with a grain diameter between 90 and 170 μm account for 80%.
Studies have shown that polypropylene, glass, and basalt fibers as a single cement-based reinforcement material can effectively improve the FRFTF crack growth. In this study, the above three fibers with a length of 6 mm were selected as additives. DTAB (C15H34NBr) is a white powder. This blowing agent belongs to anionic surfactant. Figure 1 displays DTAB’s molecular structure and physical illustration.

2.2. Fill Creating/Curing Environments

FRFTFs were manufactured under the conditions of 70% solid content and binder/tail proportion of 1:8, and fiber mass dosages were set to 0, 0.3%, 0.6%, and 0.9% (percentage of total mass). “G-0.3%” means that 0.3% of the mass percentage of glass fiber is added to the specimen [50]. The cement was first blended with tailings. Subsequently, DTAB and fiber were incorporated into the backfill and thoroughly combined for 3 min. Later, municipal waters were included and combined with a JJ-5 blender from the Key Laboratory of the University of Science and Technology Beijing intended for 3 min. Lastly, evenly mixed slurries were discharged into a 50 × 100 mm tube-shaped container. Following 48 h, the fill specimen was detached from the mold (specimen holder) and continued to be cured in a curing case at a fixed heat of 20 ± 3 °C and a constant moisture of 90 ± 3% for 7 days. Figure 2 confirms the preparation method and test equipment of the FRFTF specimen.

2.3. UCS Testing

FRFTF specimens were subjected to UCS experiments by following the rules of the ASTM C39 standard procedure [51]. Experiments were conducted using a WDW-100 electronic universal press from the Key Laboratory of the University of Science and Technology, Beijing. Uniaxial compression tests were carried out in the laboratory at a low load rate of 1 mm per minute. UCS data covering peak strength, dislocation rate, and elapsed time are automatically captured by ordinary laptops. For a final UCS value, at least four backfill specimens were experimented on in the current research.

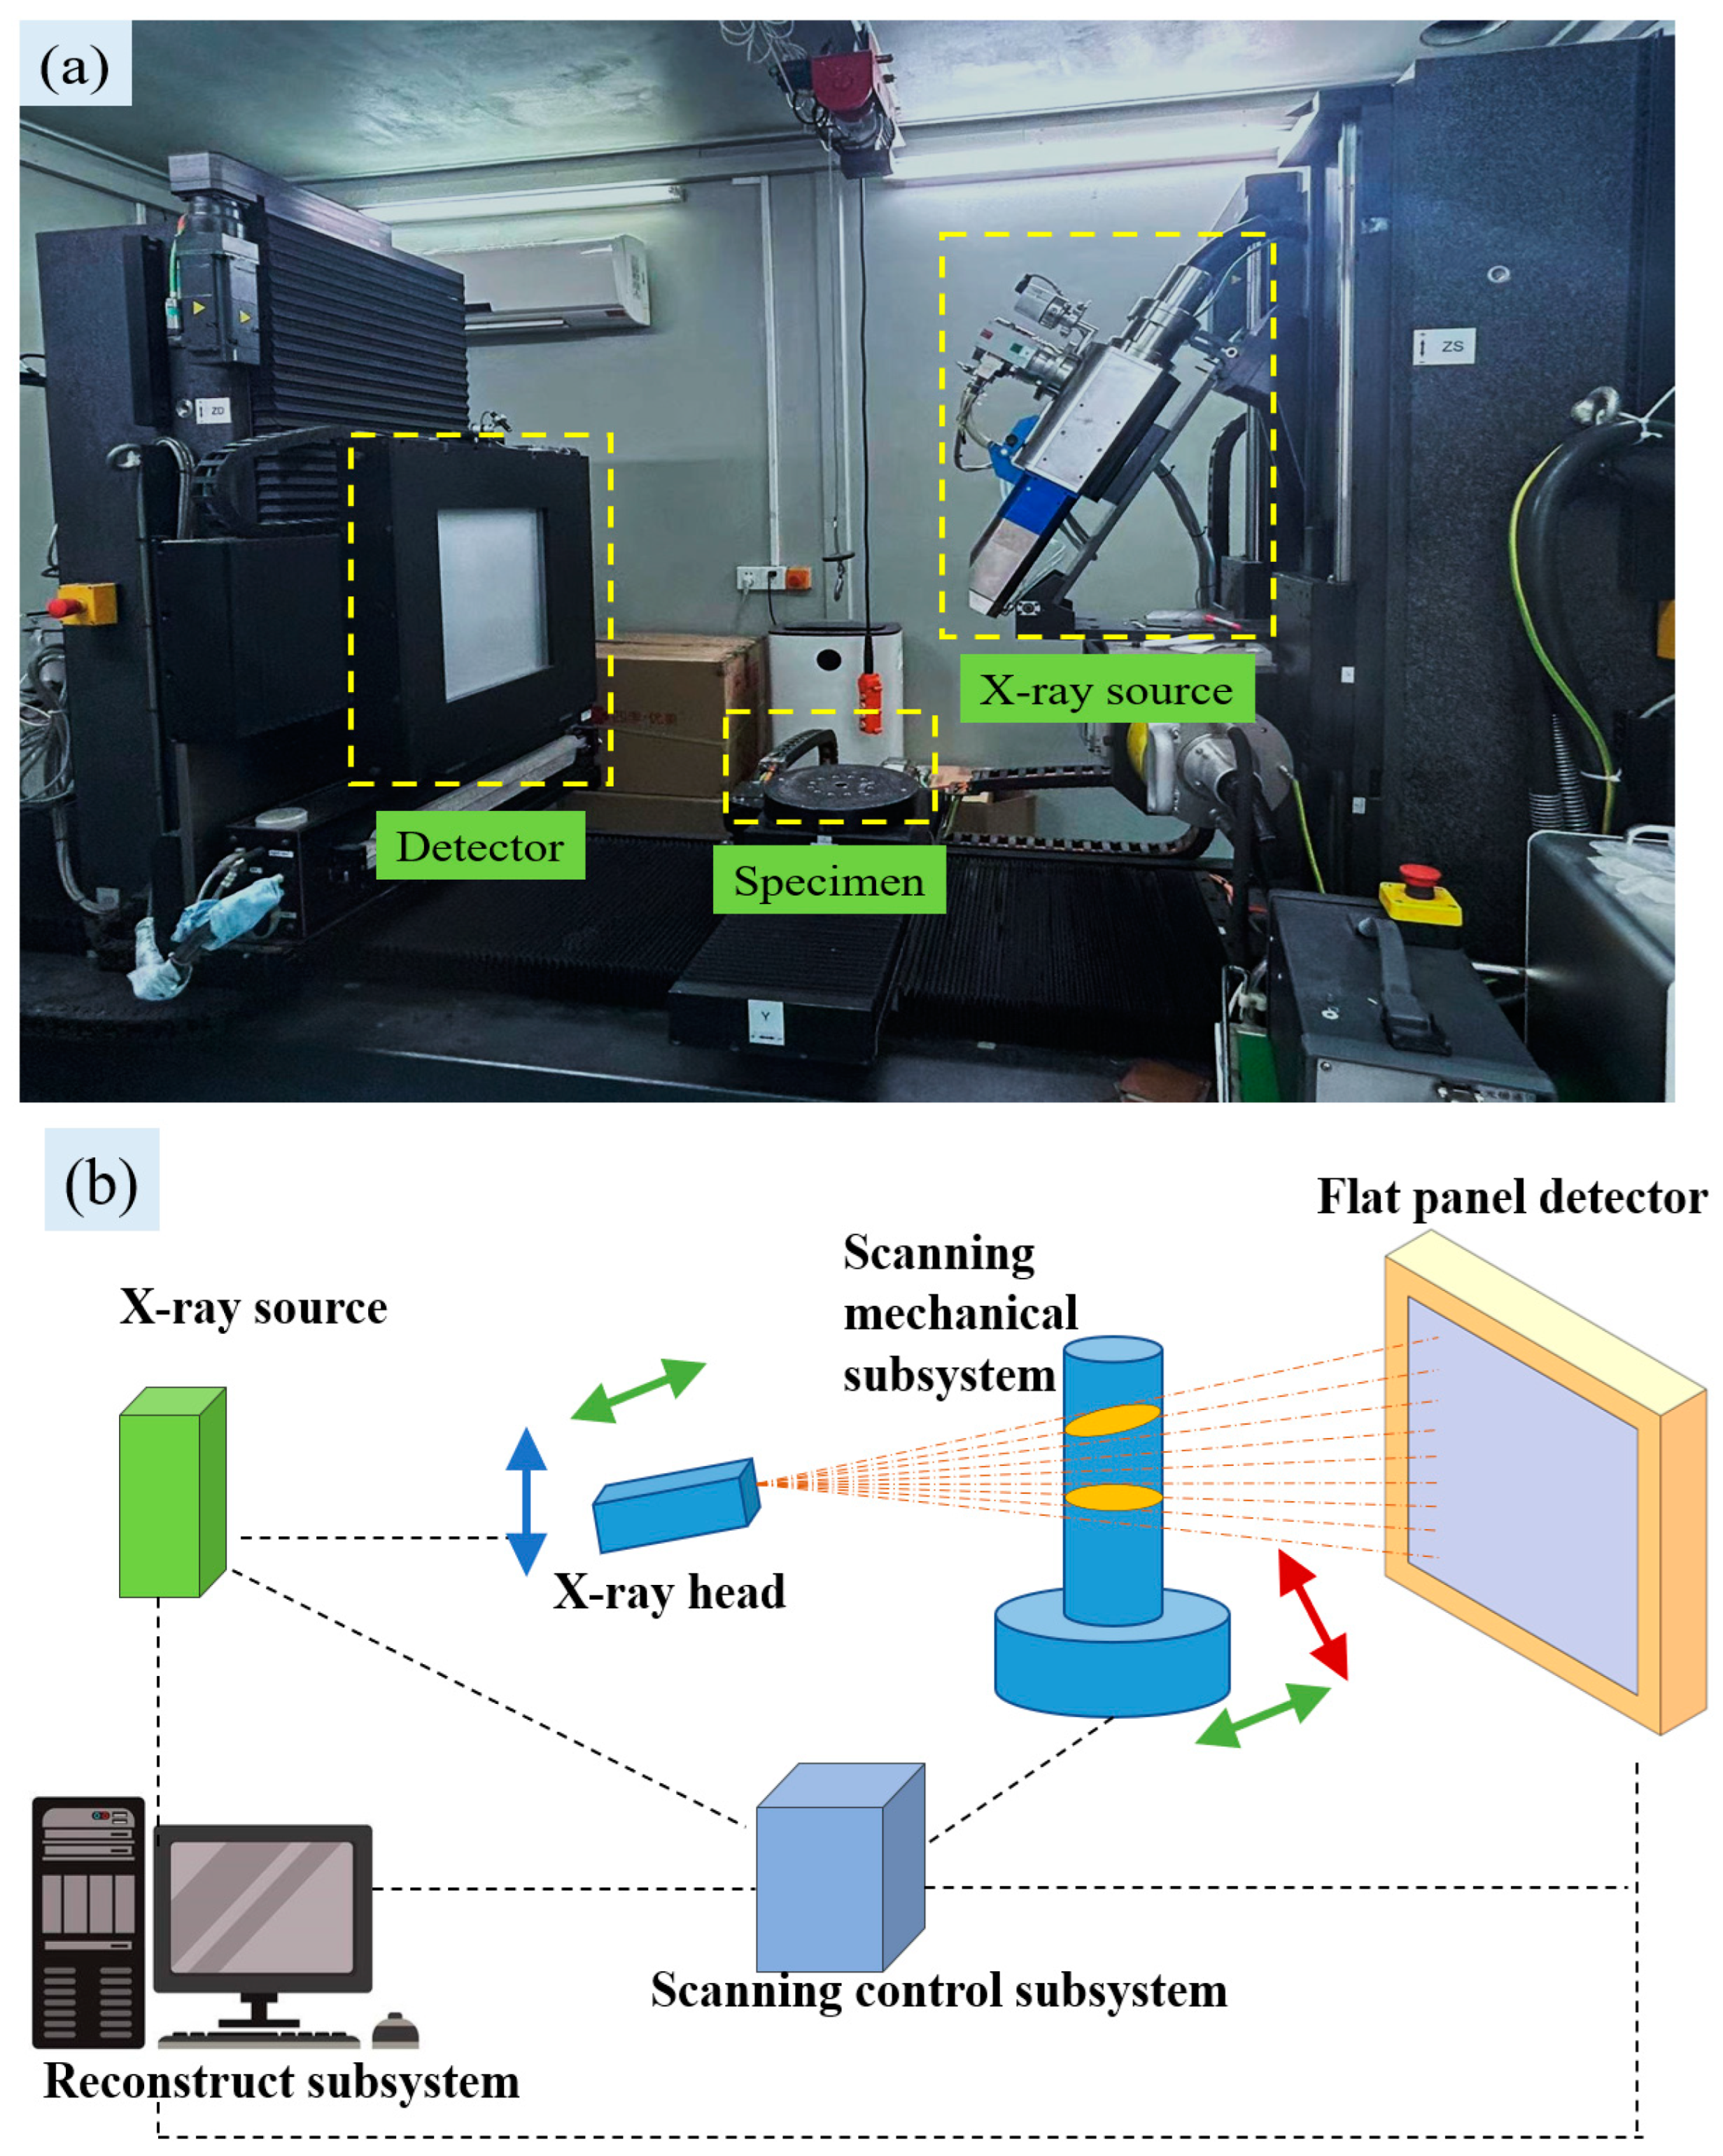
2.4. CT Scan/Image Examinations

CT scanning tests were performed on the FRFTF specimens after the UCS test, including pore size, number, and internal crack propagation mechanism, to explore the microstructure characteristics of backfill, and three samples were scanned as a control or witness specimen. A CT scan experiment was adopted using an X-ray CT detection device supplied by a German brand, YXLON (Hamburg, Germany), as shown in Figure 3. Test parameters are as follows: Detector type: X-ray, voltage: 16,000 kV, current 0.20 mA. X-ray energy and spatial resolution are 6 MeV and 2.5 LP/mm, respectively, with 1024 × 1024 pixels and 109 μm/slice pixel diameter. The 2023 version of the 3D visualization software Avizo was used for the image processing of 2D slices, and the visualization processing of FRFTF was performed based on threshold segmentation and three-dimensional reconstruction technology. Figure 4 demonstrates FRFTF’s 3D reconstruction and cracks/pores segmentation process.

2.5. Pore Structure Observation

They were scanned by Zeiss Evo 18 SEM from the laboratory of the University of Science and Technology Beijing and an energy spectrometer to analyze hydration reaction and action mechanism to observe internal microstructure characteristics of FRFTF specimens after 7 days of curing. The main test conditions of SEM were as follows: Resolution 3 nm, acceleration voltage 20 kV, magnification 5~1 million, and main energy 20 keV. The dried fill specimen needs to be carbon sprayed twice before the experiments to improve the electrical conductivity of the specimen. Figure 5 shows lab-type equipment being utilized during microstructure observations.

3. Results and Discussion

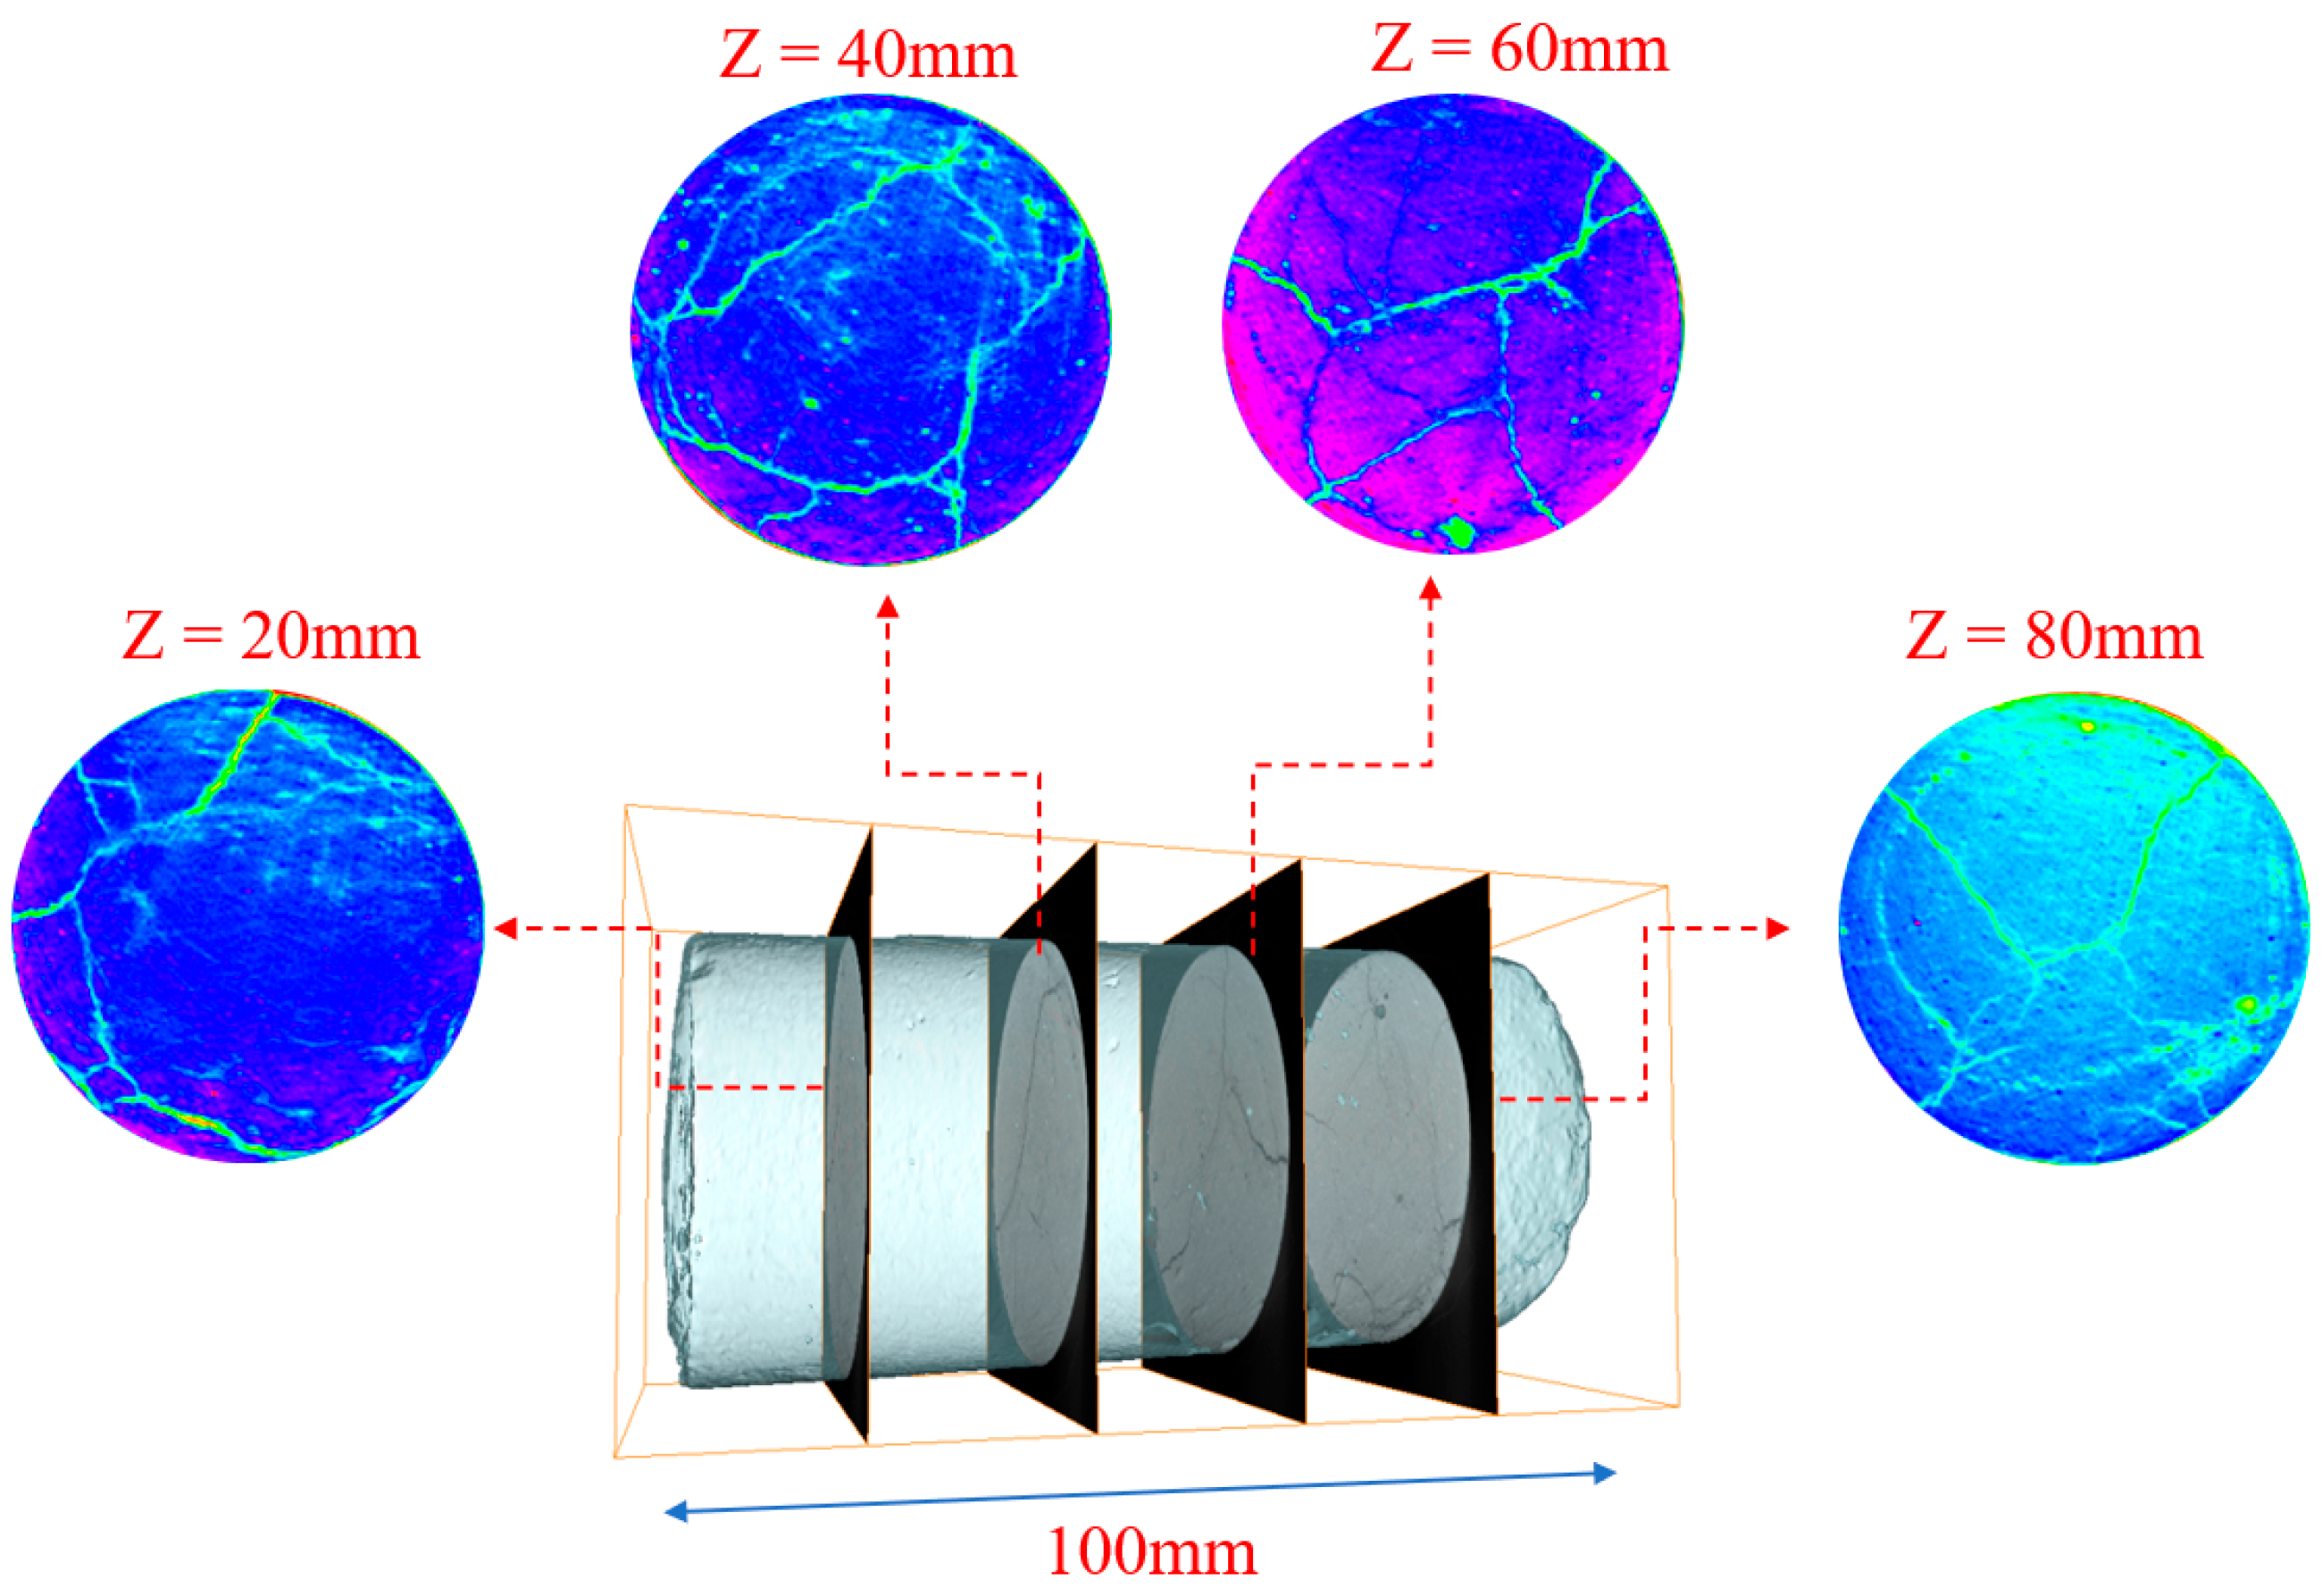
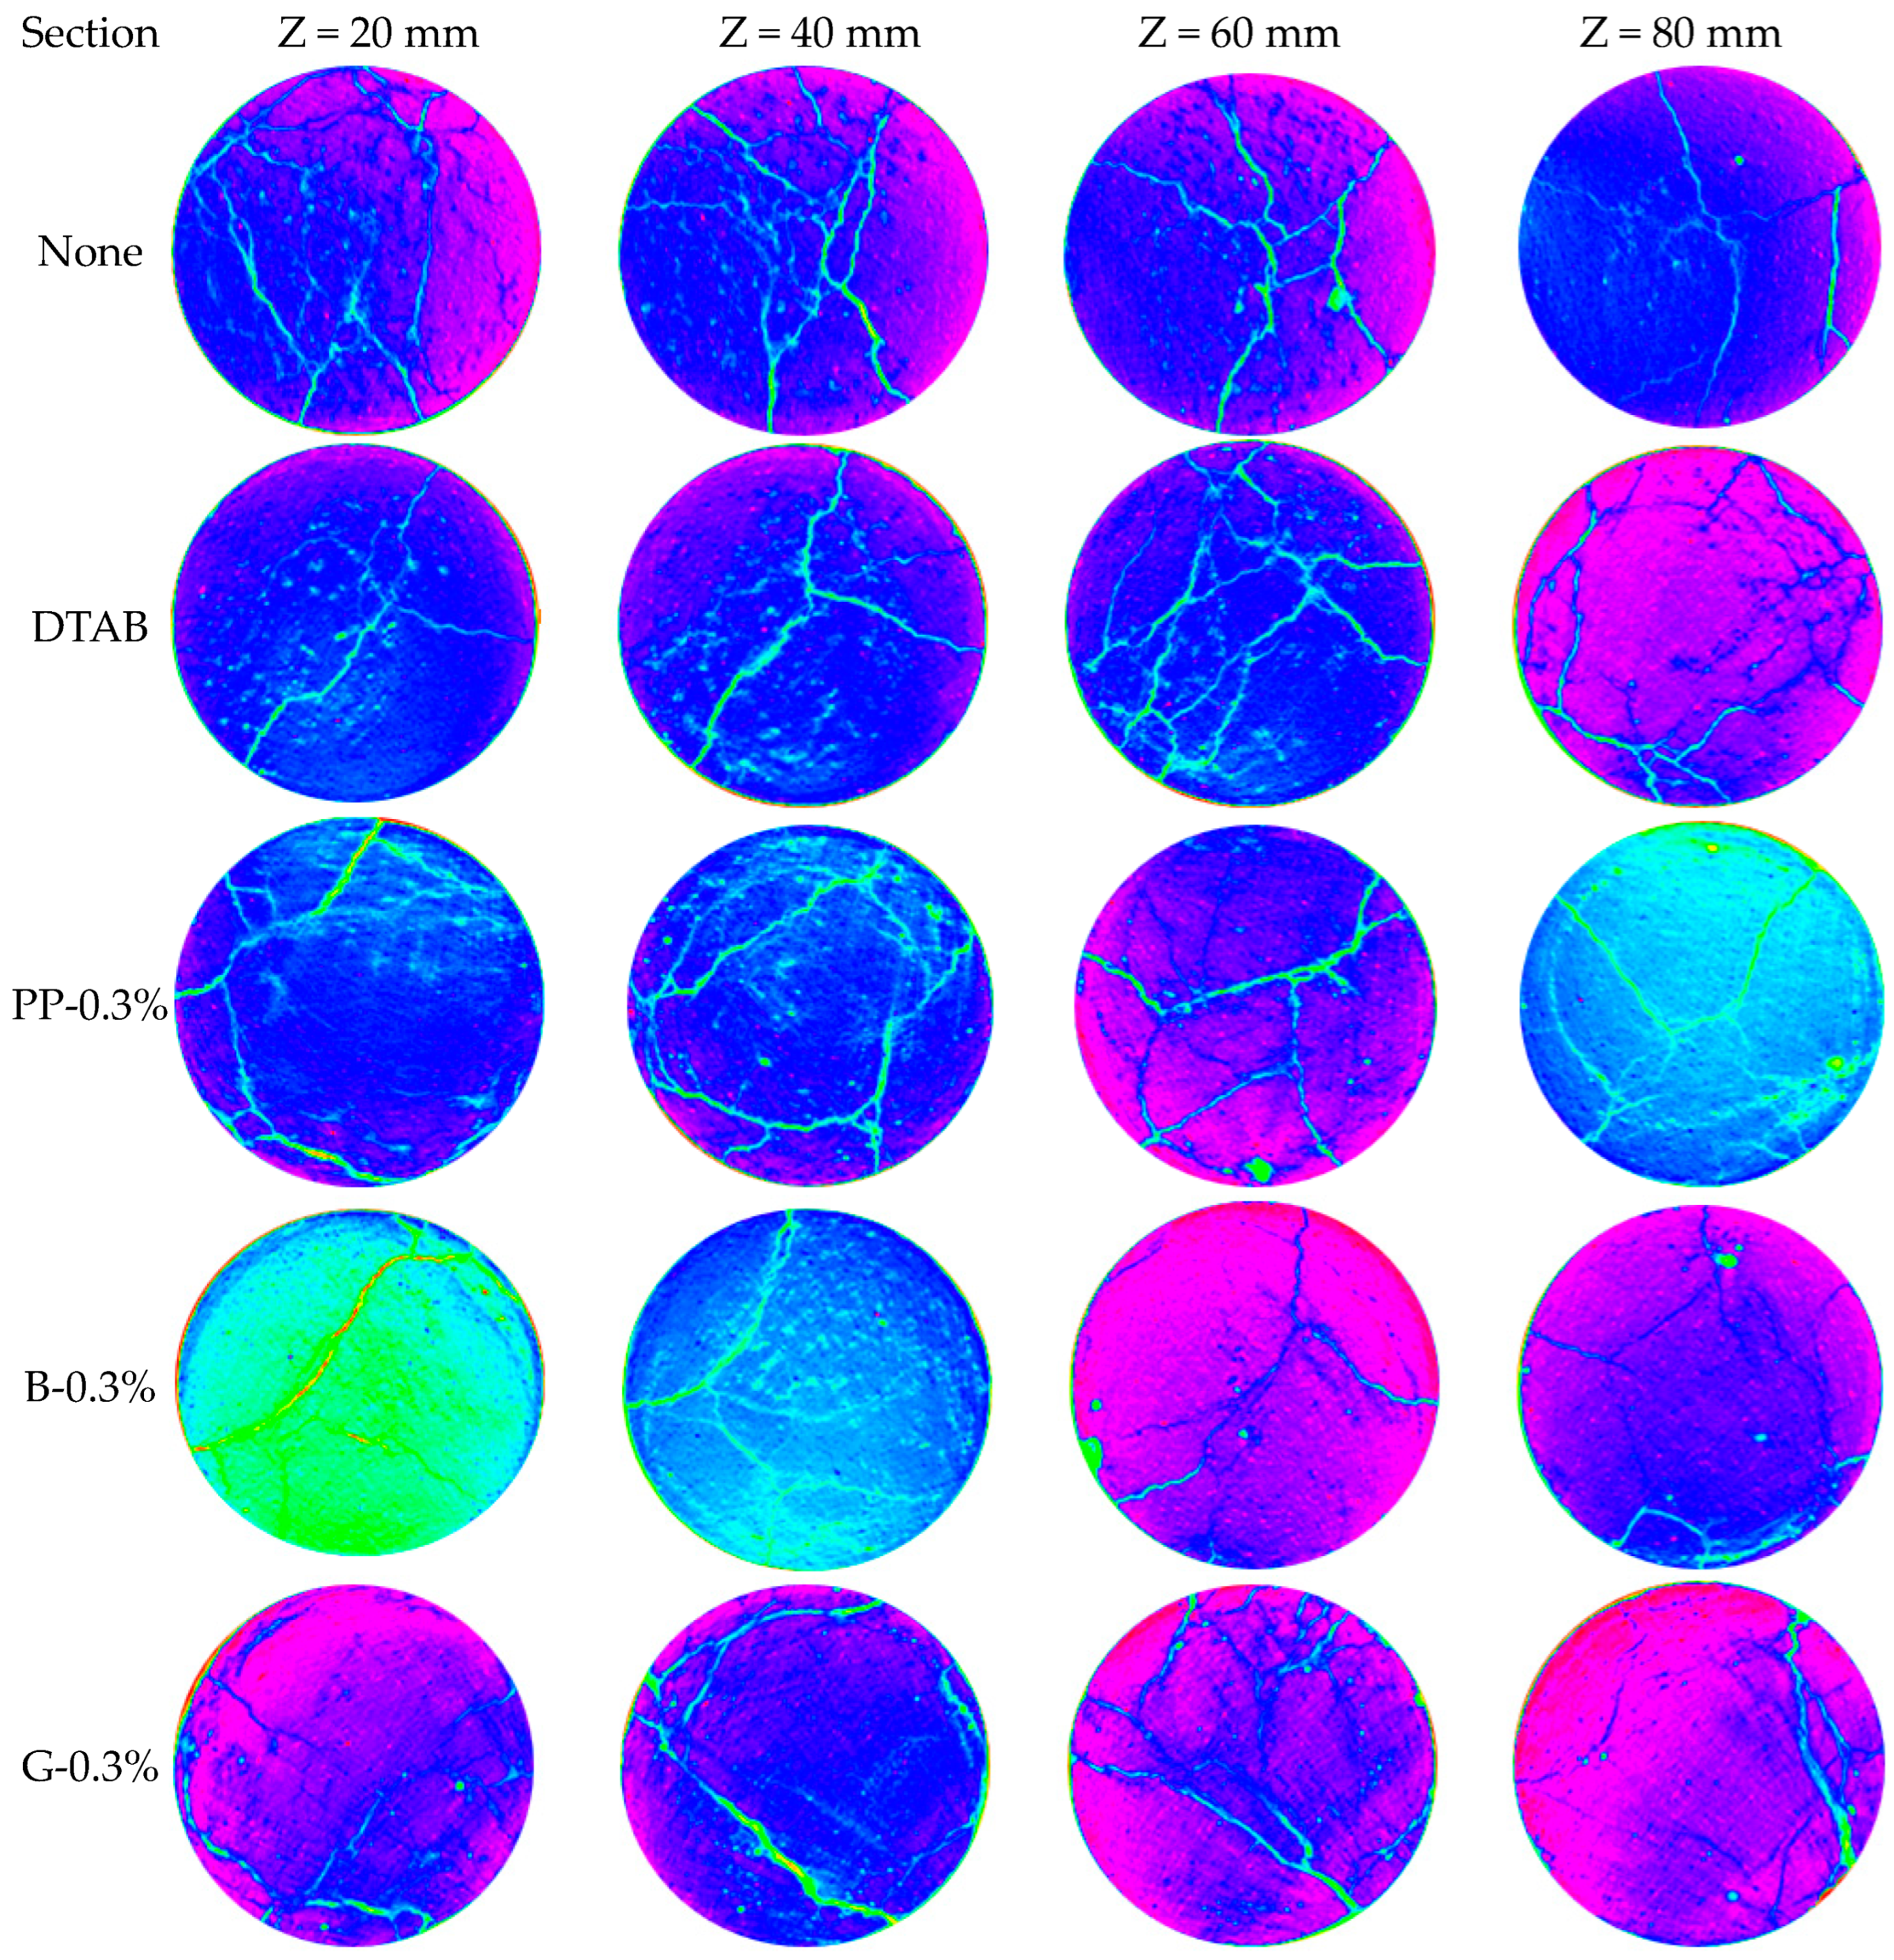
3.1. Two-Dimensional Pore Fissure Distribution

In this study, 2D pores and fractures were analyzed by industrial CT. In the process of test preparation, the fiber mixture was relatively uniform. Due to the low scanning resolution and small fiber size, the fibers could not be completely distinguished from each other in backfill and pore cracks, and the fibers could not be completely extracted from the 2D section. Due to its high density, the incomplete tailings particles inside the fill are black or grayish white, while the pores and cracks on the surface of the slice are black. The 2D slices are processed with false color using the latest edition of Image J software (version 1.53t). Figure 6 shows the 2D section position diagram of the fill specimen. The 2D sections were obtained alongside fill’s Z way, and the 2D pieces having edge raises of 20 mm, 40 mm, 60 mm, and 80 mm were designated to explore the internal fissure failure mechanism of FRFTF. Taking the sample None as an example, blue and purple represent the cross-sectional surface of the backfill, green represents the main cracks and small cracks shaped during fill failure, and the light spots scattered on the slice external represent the pore structure.
The internal crack extraction results of 2D sections of diverse types of foam fill with and without fiber reinforcement are shown in Figure 7. The 2D slices clearly show that as filling is exposed to outside loads, internal deformation and extrusion result in the constant evolution of tiny pores into cracks. It can be found that in filling without adding fiber, fissures are essentially concentrated in the sample’s middle and gradually extend to the four sides. A main crack is distributed longitudinally through the specimen. Due to the existence of internal pores, some pores can form through channels inside the backfill, and micro-cracks begin to occur below outside loads’ action. The number of microcracks increases compared with fiber and non-fiber-reinforced specimens. However, three fiber-reinforced fills showed a substantial decrease in internal crack number. Due to the pores inside the fills, specimens gradually began to crack from the edge but did not enter the fills’ middle, micro-fissures continued to spread around, and no obvious main fissures occurred in the specimen’s center. Results display that fiber bridging effects may capably inhibit the initiation of micro-cracks in fill, and fiber can bear part of the external load, which can reduce the stress concentration phenomenon to a certain extent and prevent the propagation of cracks.

3.2. Pore Characteristics
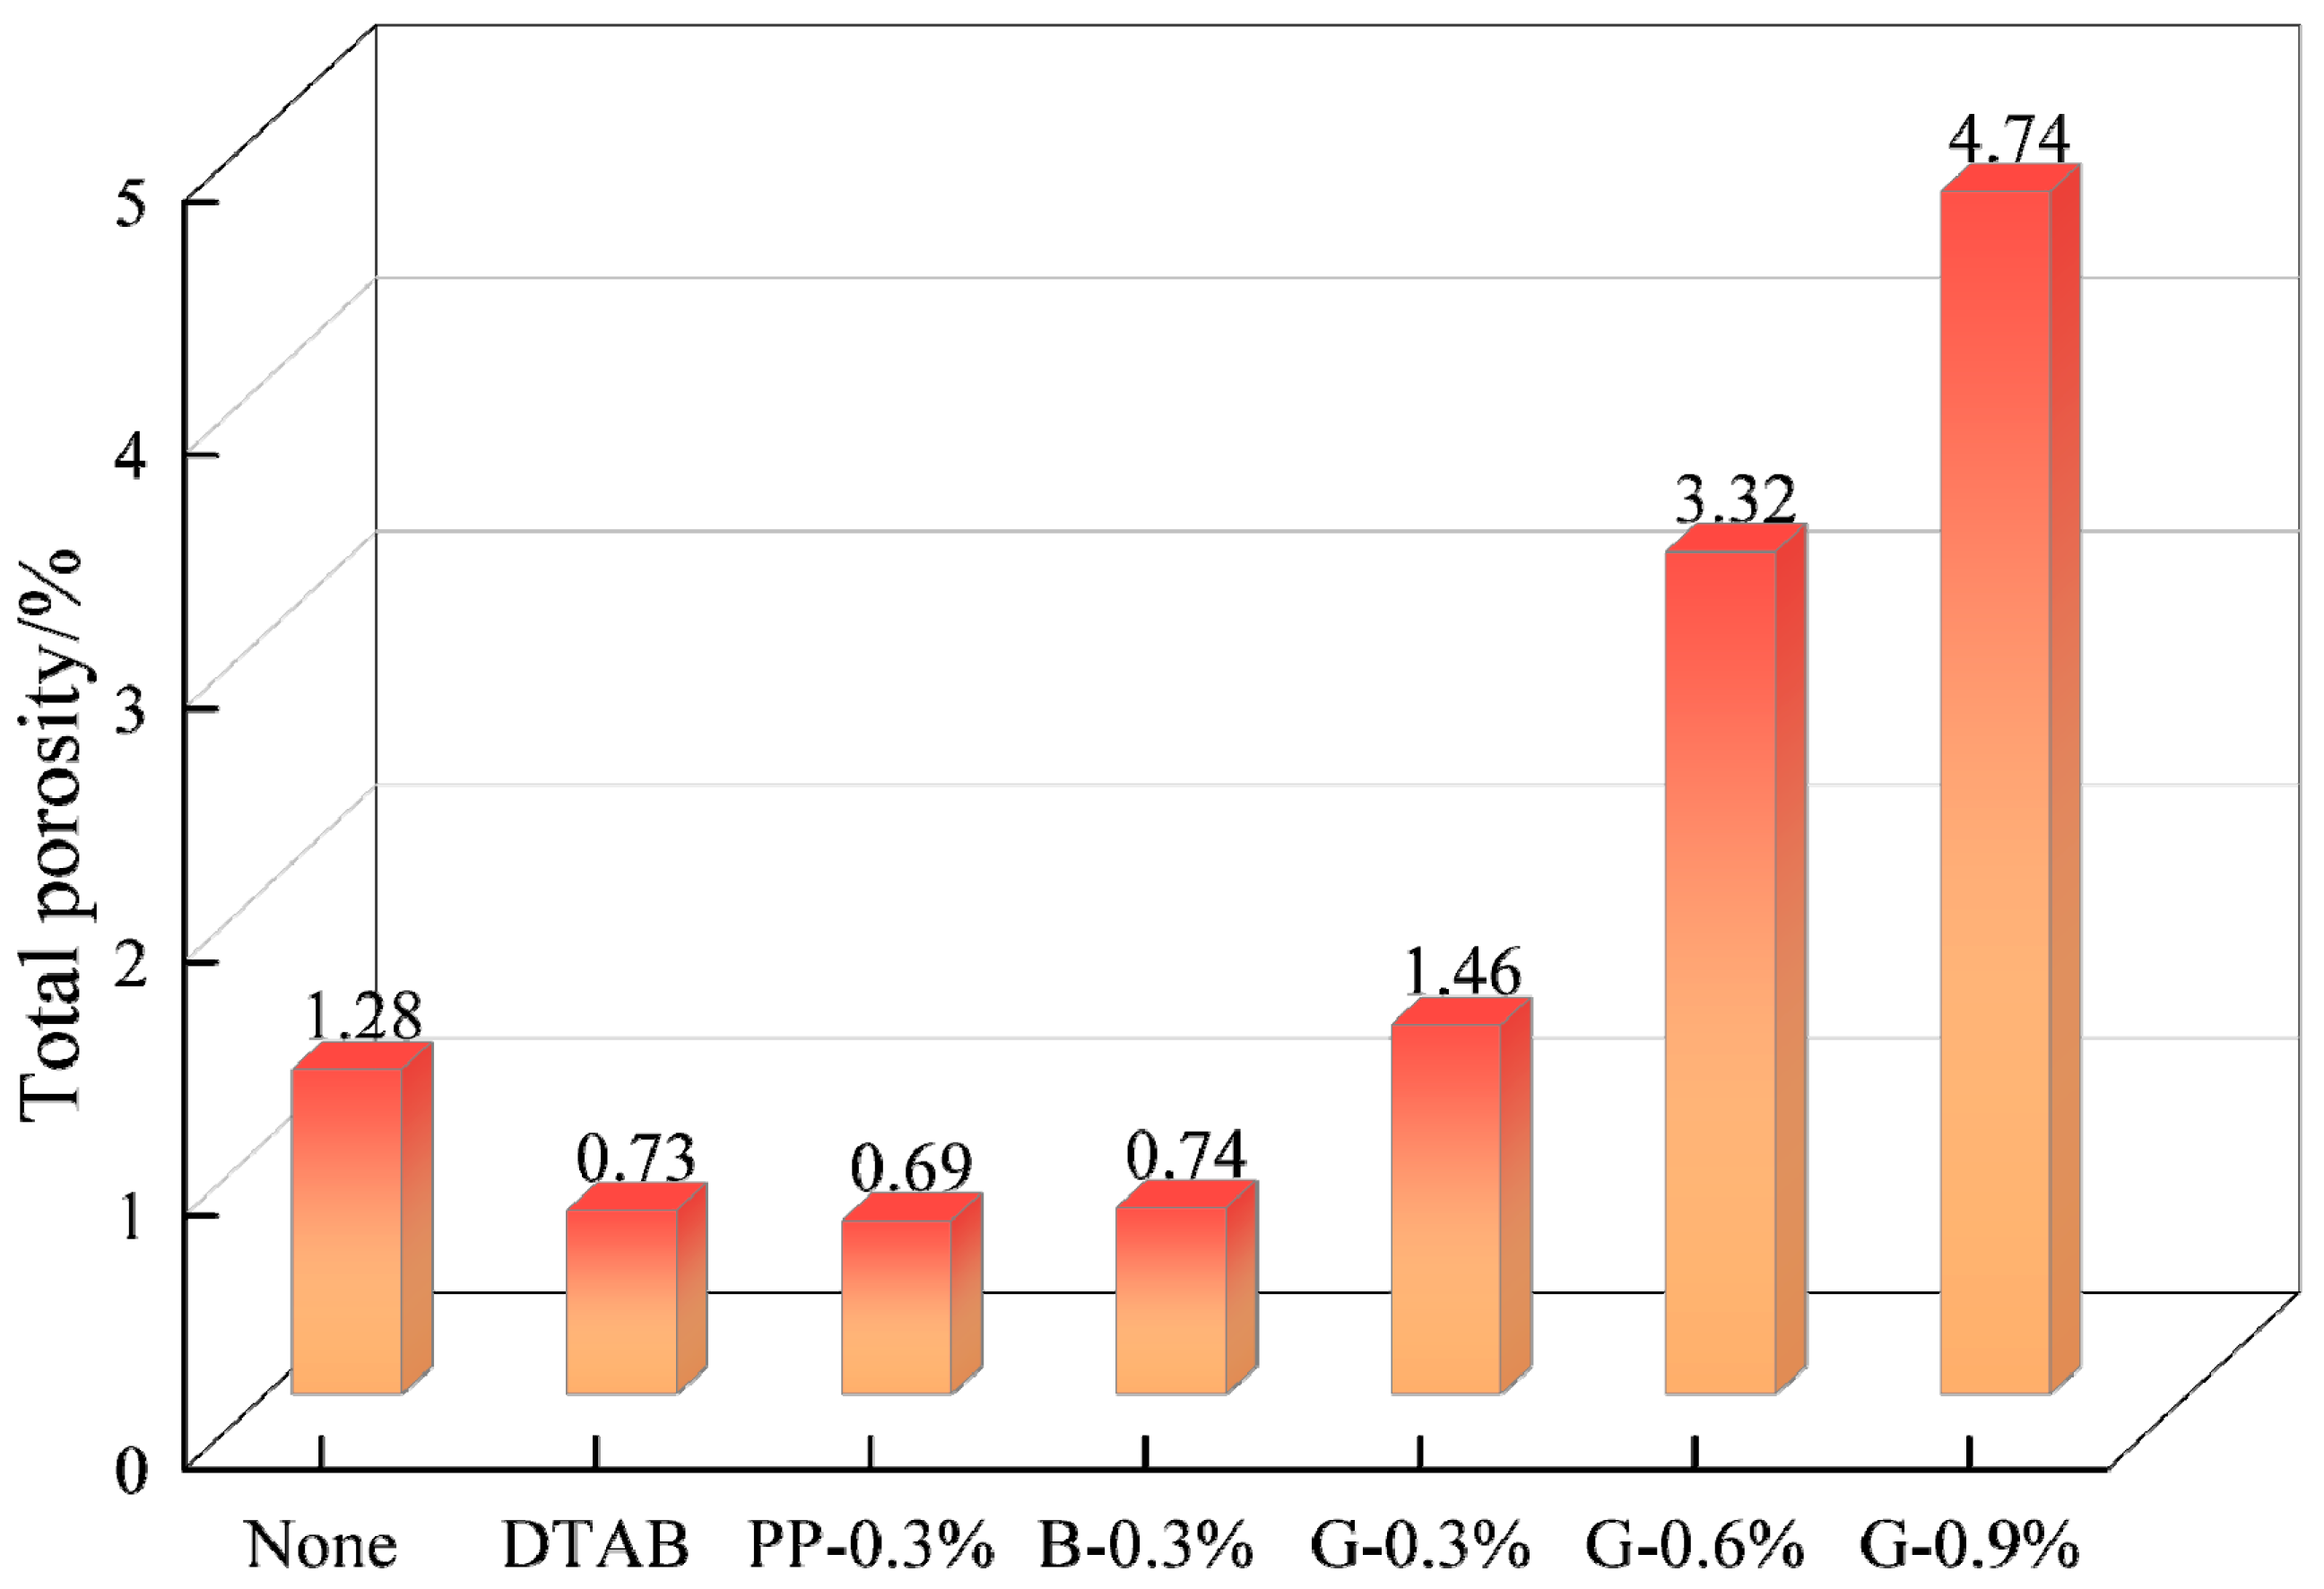
3.2.1. Porosity

The existence of pores affects the fill’s strength and stability. The 3D reconstruction software (Version 1.5) is used to extract the fill’s holes to analyze the microscopic influence of fibers on FRFTF specimens. Porosity is one of the main factors to portray a fill’s internal pore structure. The calculation formula is as follows [52]:
ε = V p o r e V a l l × 100 %
where, ε is the porosity, V p o r e is the vol. of porosity, V a l l is the total vol. of the fill.
Figure 8 reveals the link between the pore area’s percentage and FRFTF’s pore height. The pore area’s part is defined by the part of the total pore zone of each slice. The specimen’s height is 100 mm for the Y-axis. The results show that compared with none, the curves of DTAB, PP-0.3%, B-0.3%, and G-0.3% fluctuate gently. This indicates that the pore distribution in fill with DTAB and fiber is more uniform. Figure 8b,d demonstrate that the fill’s peak value appeared at the top, which was because bubbles were created during the DTAB’s mechanical agitation during preparation, and the bubbles did not completely volatilize and accumulate on the fill’s top. A similar phenomenon is also observed in basalt fiber-reinforced foam fills.
Figure 9 displays FRFTF’s total porosity. One can mention that porosity of None, DTAB, PP-0.3%, B-0.3%, and G-0.3% is 1.28%, 0.73%, 0.69%, 0.74%, and 1.46%, respectively. Among others, glass fiber’s porosity increased alone. As its rate augmented from 0.3% to 0.9%, total porosity was the largest at 4.74%. Under the same conditions, adding glass fiber to the backfill mix will increase its porosity. The porosity of the foamed fill with polypropylene fiber and basalt fiber is not much different from that of foamed fill (DTAB). Thus, not all fiber additions enhance the total porosity of cement-based materials. The glass fiber shows better performance in the foam filling body.

3.2.2. Number of Pores

In the current research, to securitize pore size effect on the fill’s mechanical features, apertures with pore volume < 0.1 mm3 were demarcated as trivial pores, apertures having pore volume between 0.1 and 1 mm3 were demarcated as average pores, and apertures having pore volume > 1 mm3 were defined as large pores. Figure 10 shows the fill’s pore size distribution, and the volume proportion in the figure represents the size of each type of pore volume in the specimen volume.
As can be seen from Figure 10, the proportions of trivial, average, and huge holes in the None are 6.74%, 26.83%, and 66.43%, respectively, while the sizes of trivial, average, and huge holes in the DTAB are 14.74%, 66.58%, and 18.68, respectively. The sizes of trivial, average, and huge holes in the PP-0.3% were 6.07%, 82.48%, and 11.45%, respectively, and the sizes of trivial, average, and huge holes in the B-0.3% were 8.21%, 74.04%, and 17.75%, respectively. The proportion of small, medium, and large holes of the G-0.3% was 9.50%, 13.75%, and 76.56%, respectively. Compared with the None, the small and medium pores of the backfill with the DTAB and fiber increased in different degrees. The pore size of PP-0.3% is the largest, and the pore size of G-0.9% is the smallest. This phenomenon indicates that adding fiber and foaming agents may well improve pore distribution characteristics. Compared with polypropylene, basalt, and glass fiber, reinforced foam backfill has a larger proportion of macro-pores. This suggests that adding glass fiber facilitates greater air incorporation into the backfill, leading to the formation of macro-pores.

3.2.3. Sphericity

Sphericity (S) is used to quantify how similar an object’s shape is to a sphere, with values ranging from 0 to 1. In the case of a completely spherical object, the sphericity reaches a maximum of 1, while the sphericity value gradually decreases as non-spherical features of the object shape increase. The calculation formula is shown in Equation (2) [48,53]:
S = π 1 3 ( 6 V 3 d ) 2 3 A 3 d
where S is the hole’s sphericity, V3d is the hole’s volume, and A3d is the hole’s surface area.
Figure 11 displays the link between sphericity and the volume of pores within FRFTF. One can infer from Figure 11a that the small hole’s sphericity of None ranges from 0.5 to 1, the sphericity of the medium hole ranges from 0.3 to 0.7, and the sphericity of the large hole ranges from 0.2 to 0.3. With the increase of pore size, the sphericity value gradually reduces, and the pore shape becomes irregular. Compared with None, the shape of the middle hole and large hole of filling after fiber addition tends to be more spherical (Figure 11b–d). The sphericity of PP-0.3% small hole is 0.5–1, the sphericity of medium hole is 0.4–1, and the sphericity of large hole is 0.4–0.7. The sphericity of the small hole of B-0.3% is 0.6–1, the sphericity of the medium hole is 0.5–1, and the sphericity of the large hole is 0.5–1. The sphericity of the small hole of G-0.3% is 0.5–1, the sphericity of the medium hole is 0.4–1, and the sphericity of the large hole is 0.4–1. Comparing the sphericity of the three fibers, it is found that the sphericity of B-0.3% is greater than that of PP-0.3% and G-0.3%, and the distribution of the sphericity of the mesopore is denser. With the addition of fibers, the sphericity tends to 1, which improves the pore shape of FRFTF. When the sphericity is closer to 1, the pore structure is more irregular. Thus, the FRFTF’s pore morphology is dominated by irregular pores after loading, and the irregular pores’ large number affects FRFTF’s strength.

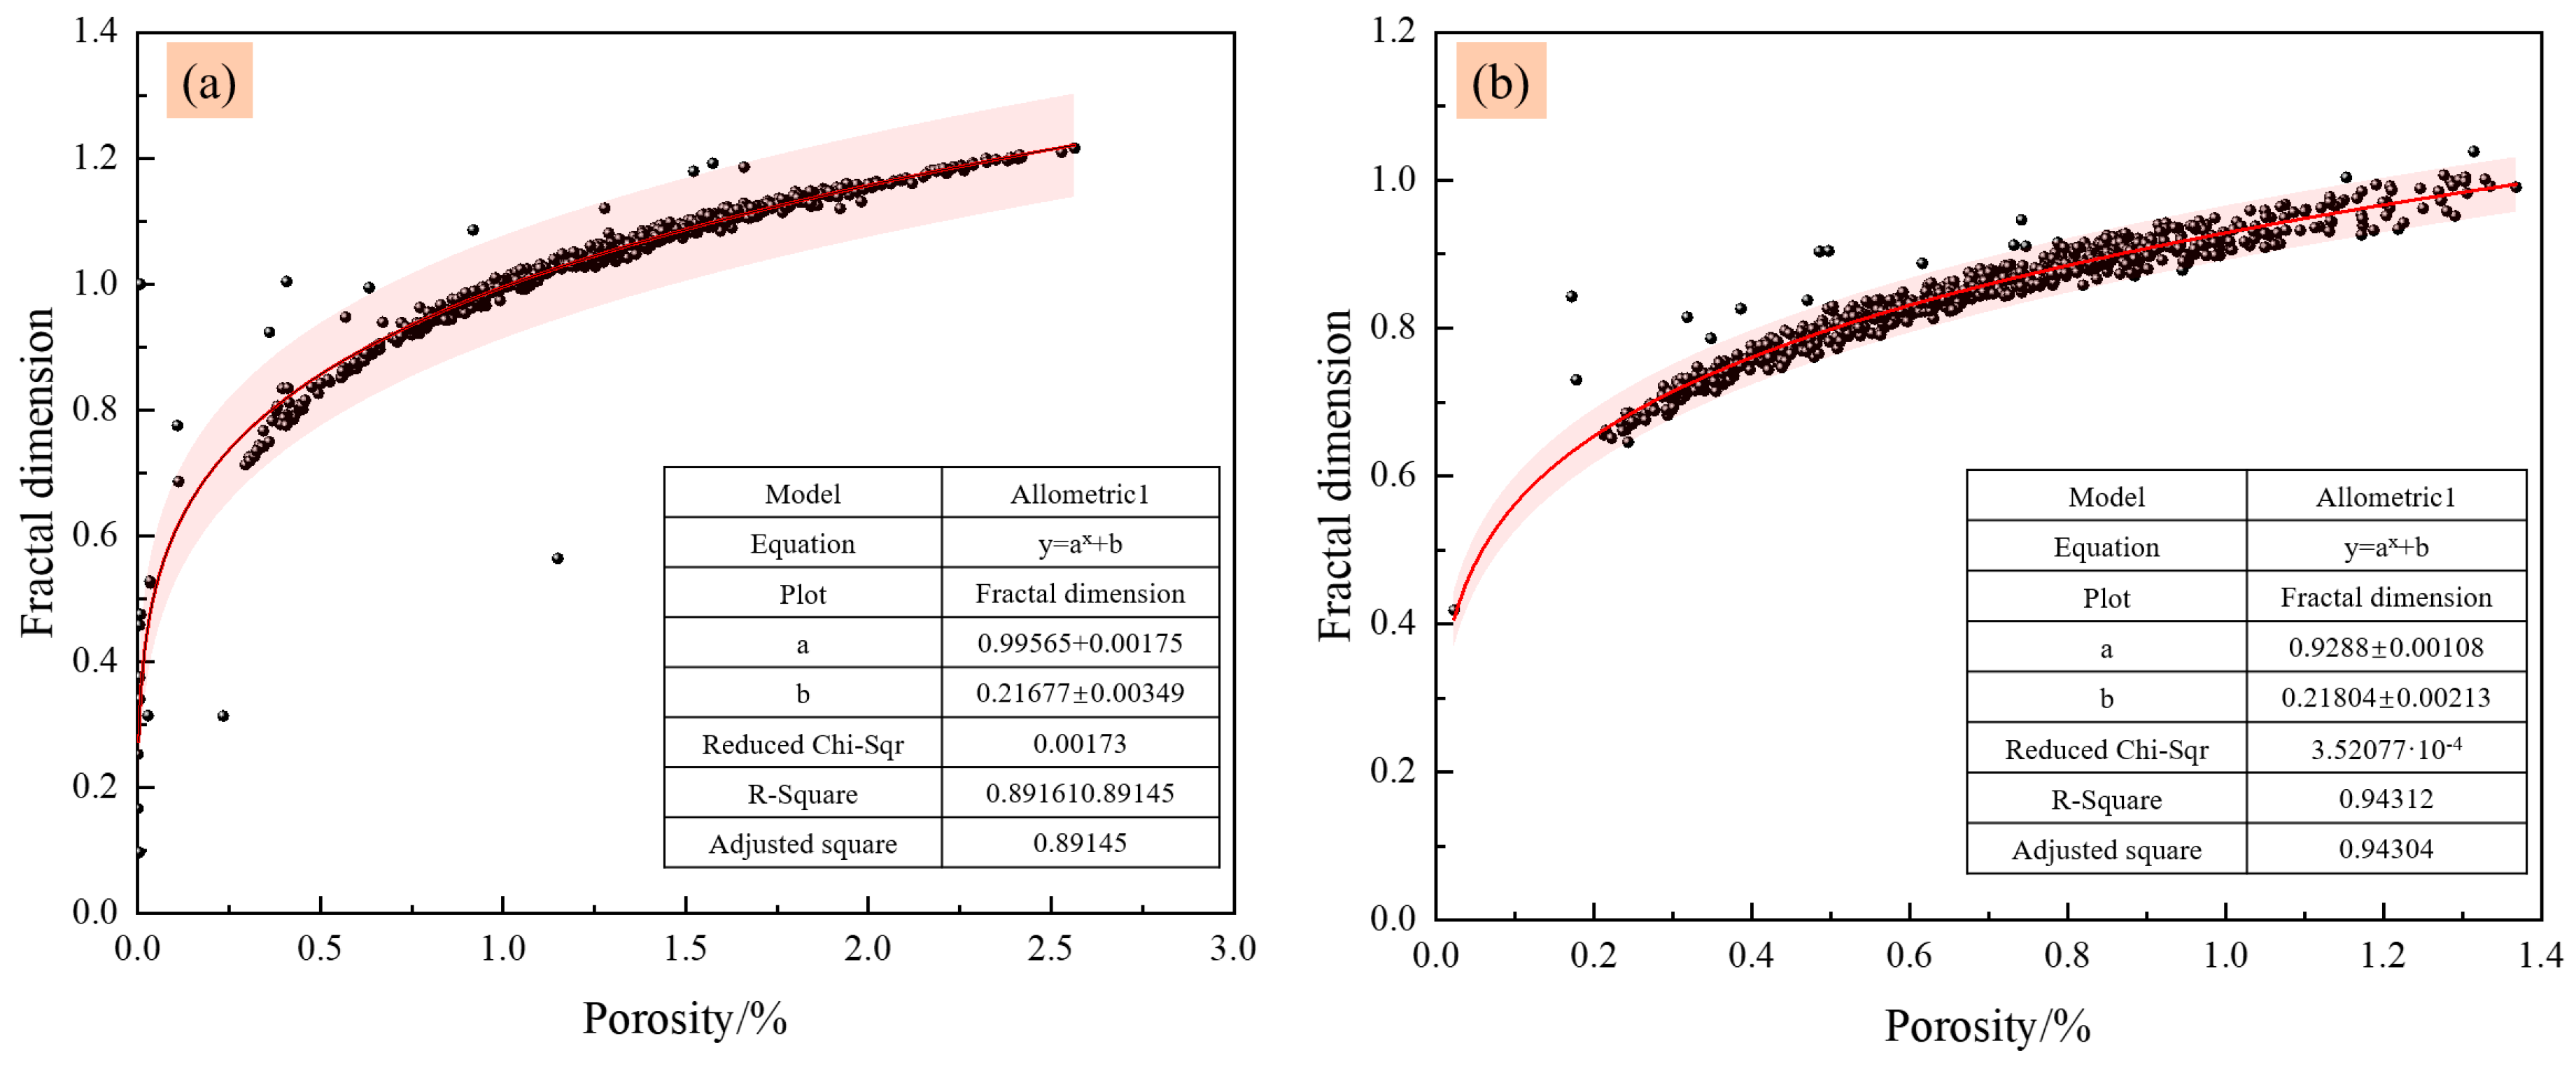
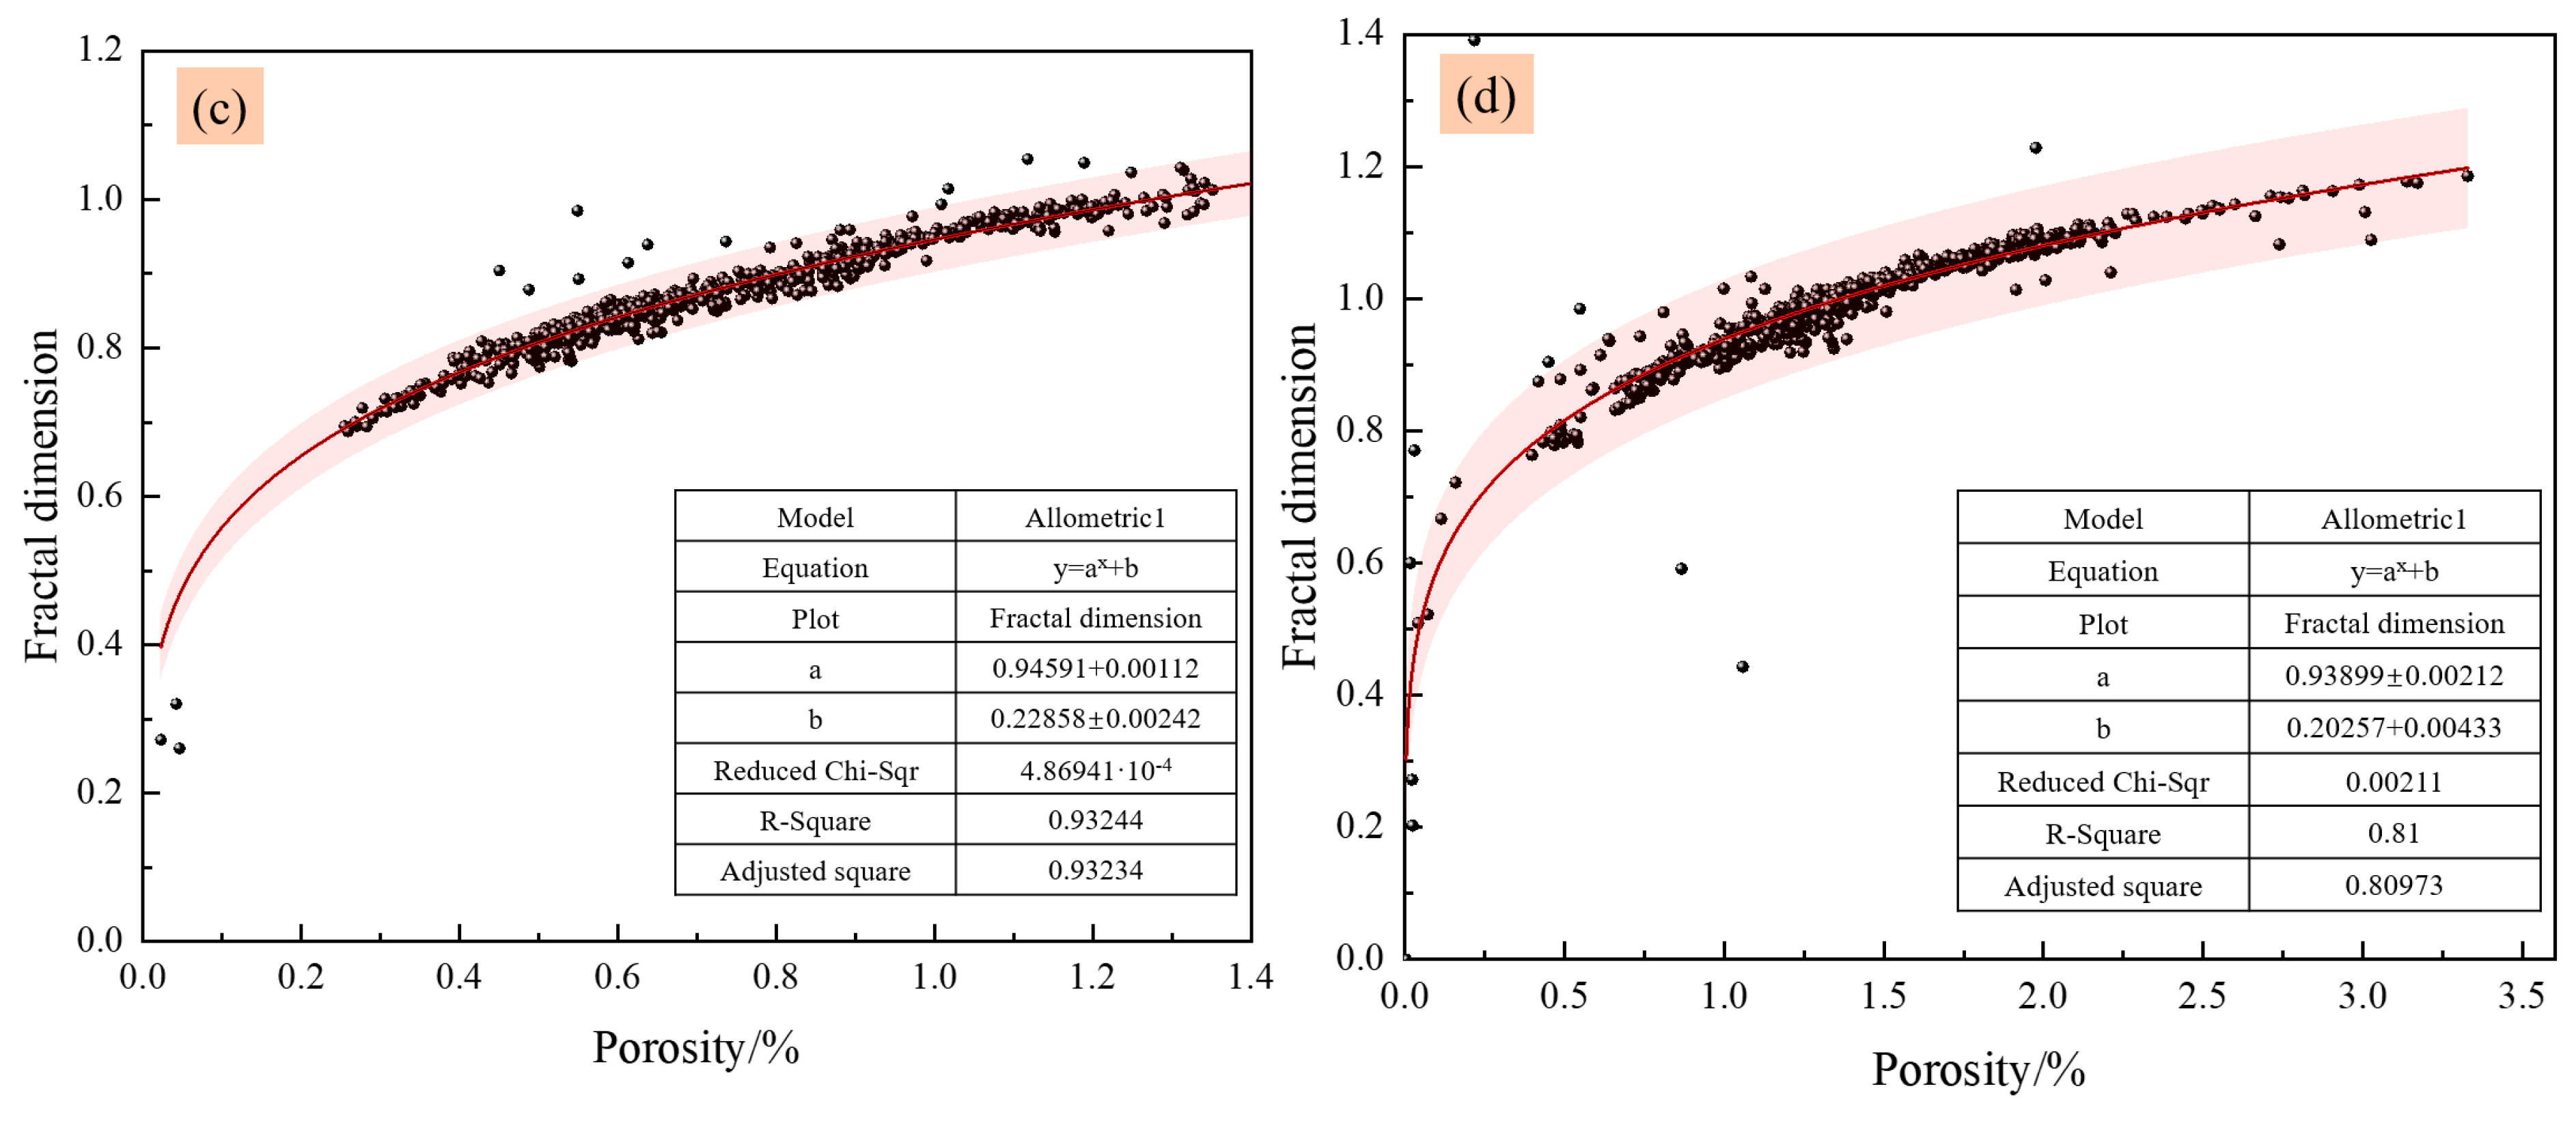
3.2.4. Fractal Dimension

Figure 12 shows the spatial distribution characteristics of pores in FRFTF. Purple particles represent the pores inside the specimen. One can visibly observe that in None, most of the pores are densely packed in the middle of the specimen and belong to the connected holes. The connected holes mainly exist in the middle and large holes, and the sphericity of such holes is less than 0.5, corresponding to the sphericity of None in Section 3.2.3. Figure 12b–d demonstrate that the pores inside the specimen became more evenly dispersed after fiber was added. The pore independence of PP-0.3% and B-0.3% is strong. There is a small number of connected pores in G-0.3%, so the number of large pores in G-0.3% increases, but the pores are evenly distributed in the sample without aggregation.
Under loading, the FRFTF specimen develops micro-cracks, leading to dynamic changes in its internal pore structure. The two-dimensional pore fractal dimension (D) can be employed to characterize the relationship between complex pore space and pore quantity.
Box dimension technique is ordinarily employed to calculate fractal dimension to reveal 2D images or display the surface morphology, pore distribution, and crack growth of a certain research object. First, the tomography image is binarized, and the gray value of the pixel corresponding to the target structure is set to 1, and the pixel of the background area is set to 0. Overlay a grid (box) having lateral span r over binarized image, recording the least sum of boxes N(r) vital to shelter a target area. Change the grid’s side length r and repeat the process to get a series of N(r). Finally, a straight line between ln(N(r)) and ln(1/r) is fitted. The straight line’s slope is fractal dimension D, and the computation equation is displayed by Equation (3) [54].
D = lim r 0 log N ( r ) log r
Figure 13 shows the link between the FRFTF’s 2D fractal dimension and porosity. The disparity trend between fill’s 2D fractal dimension and porosity is identical after loading, and the agreeing fractal dimension also increases with rising porosity. Fractal dimension also lessened after fiber was added to FRFTF, showing that fiber can rally fill’s pore distribution, reduce pores’ complexity, and improve pore distribution’s uniformity.
One can infer from Figure 13 that the link between 2D fractal factor and 2D porosity is fitted, and the curve basically conforms to the nonlinear equation, as shown in Equation (4). The results show that Equation (4) could well reflect a robust link between 2D porosity and fractal dimension; that is, the 2D fractal factor is surely allied with 2D porosity.
y = a x + b
where y is the 2D fractal dimension, and x is the 2D porosity (%).

3.3. Analysis of Crack Propagation Mode and Failure Process of FRFTF Samples

Figure 14 shows the failure processes of None, DTAB, PP-0.3%, B-0.3%, and G-0.3%. One can infer from Figure 14a that, for None, cracks commenced acting at the top end of None by rising load and continued to expand downward. As the load reached the extreme value, fissures prolonged to the lower end, mainly shear cracks, which may be caused by the fill’s uneven surface. One can infer from Figure 14b that as DTAB was added to the fill, due to the uniform and stable pores generated by DTAB, only tiny cracks appeared at the fill’s upper end in the loading process, and no obvious cracks were produced. After the peak load, the tiny cracks along the upper end slowly expanded downward without extending to the lower end of the filling, and the lower layer was not destroyed. Still has a certain ability to bear.
Figure 14c–e show that when fiber is added to FRFTF, the fill is mainly tensile failure. Below the load’s nonstop application, the specimen slowly occurs tensile fissures along the axial direction. These cracks continue to expand internally, eventually forming the main crack. PP-0.3% cracks first occurred at the end and spread to the middle. From the 3D recomposition, one can see that cracks occurred in the specimen’s middle after loading, and there were no apparent fissures. Like PP-0.3, B-0.3% does not have significant cracks at the beginning, and cracks are formed by continuous downward expansion from small cracks. Unlike the above two fibers, there is no crack in the upper part of G-0.3%, and small cracks occur on both sides and in the fill’s middle, and fissures prolong to the lower end with a rising load. The addition of fiber can seal pores among large-particle tails and some pores generated by DTAB and improve the strength of the specimen.

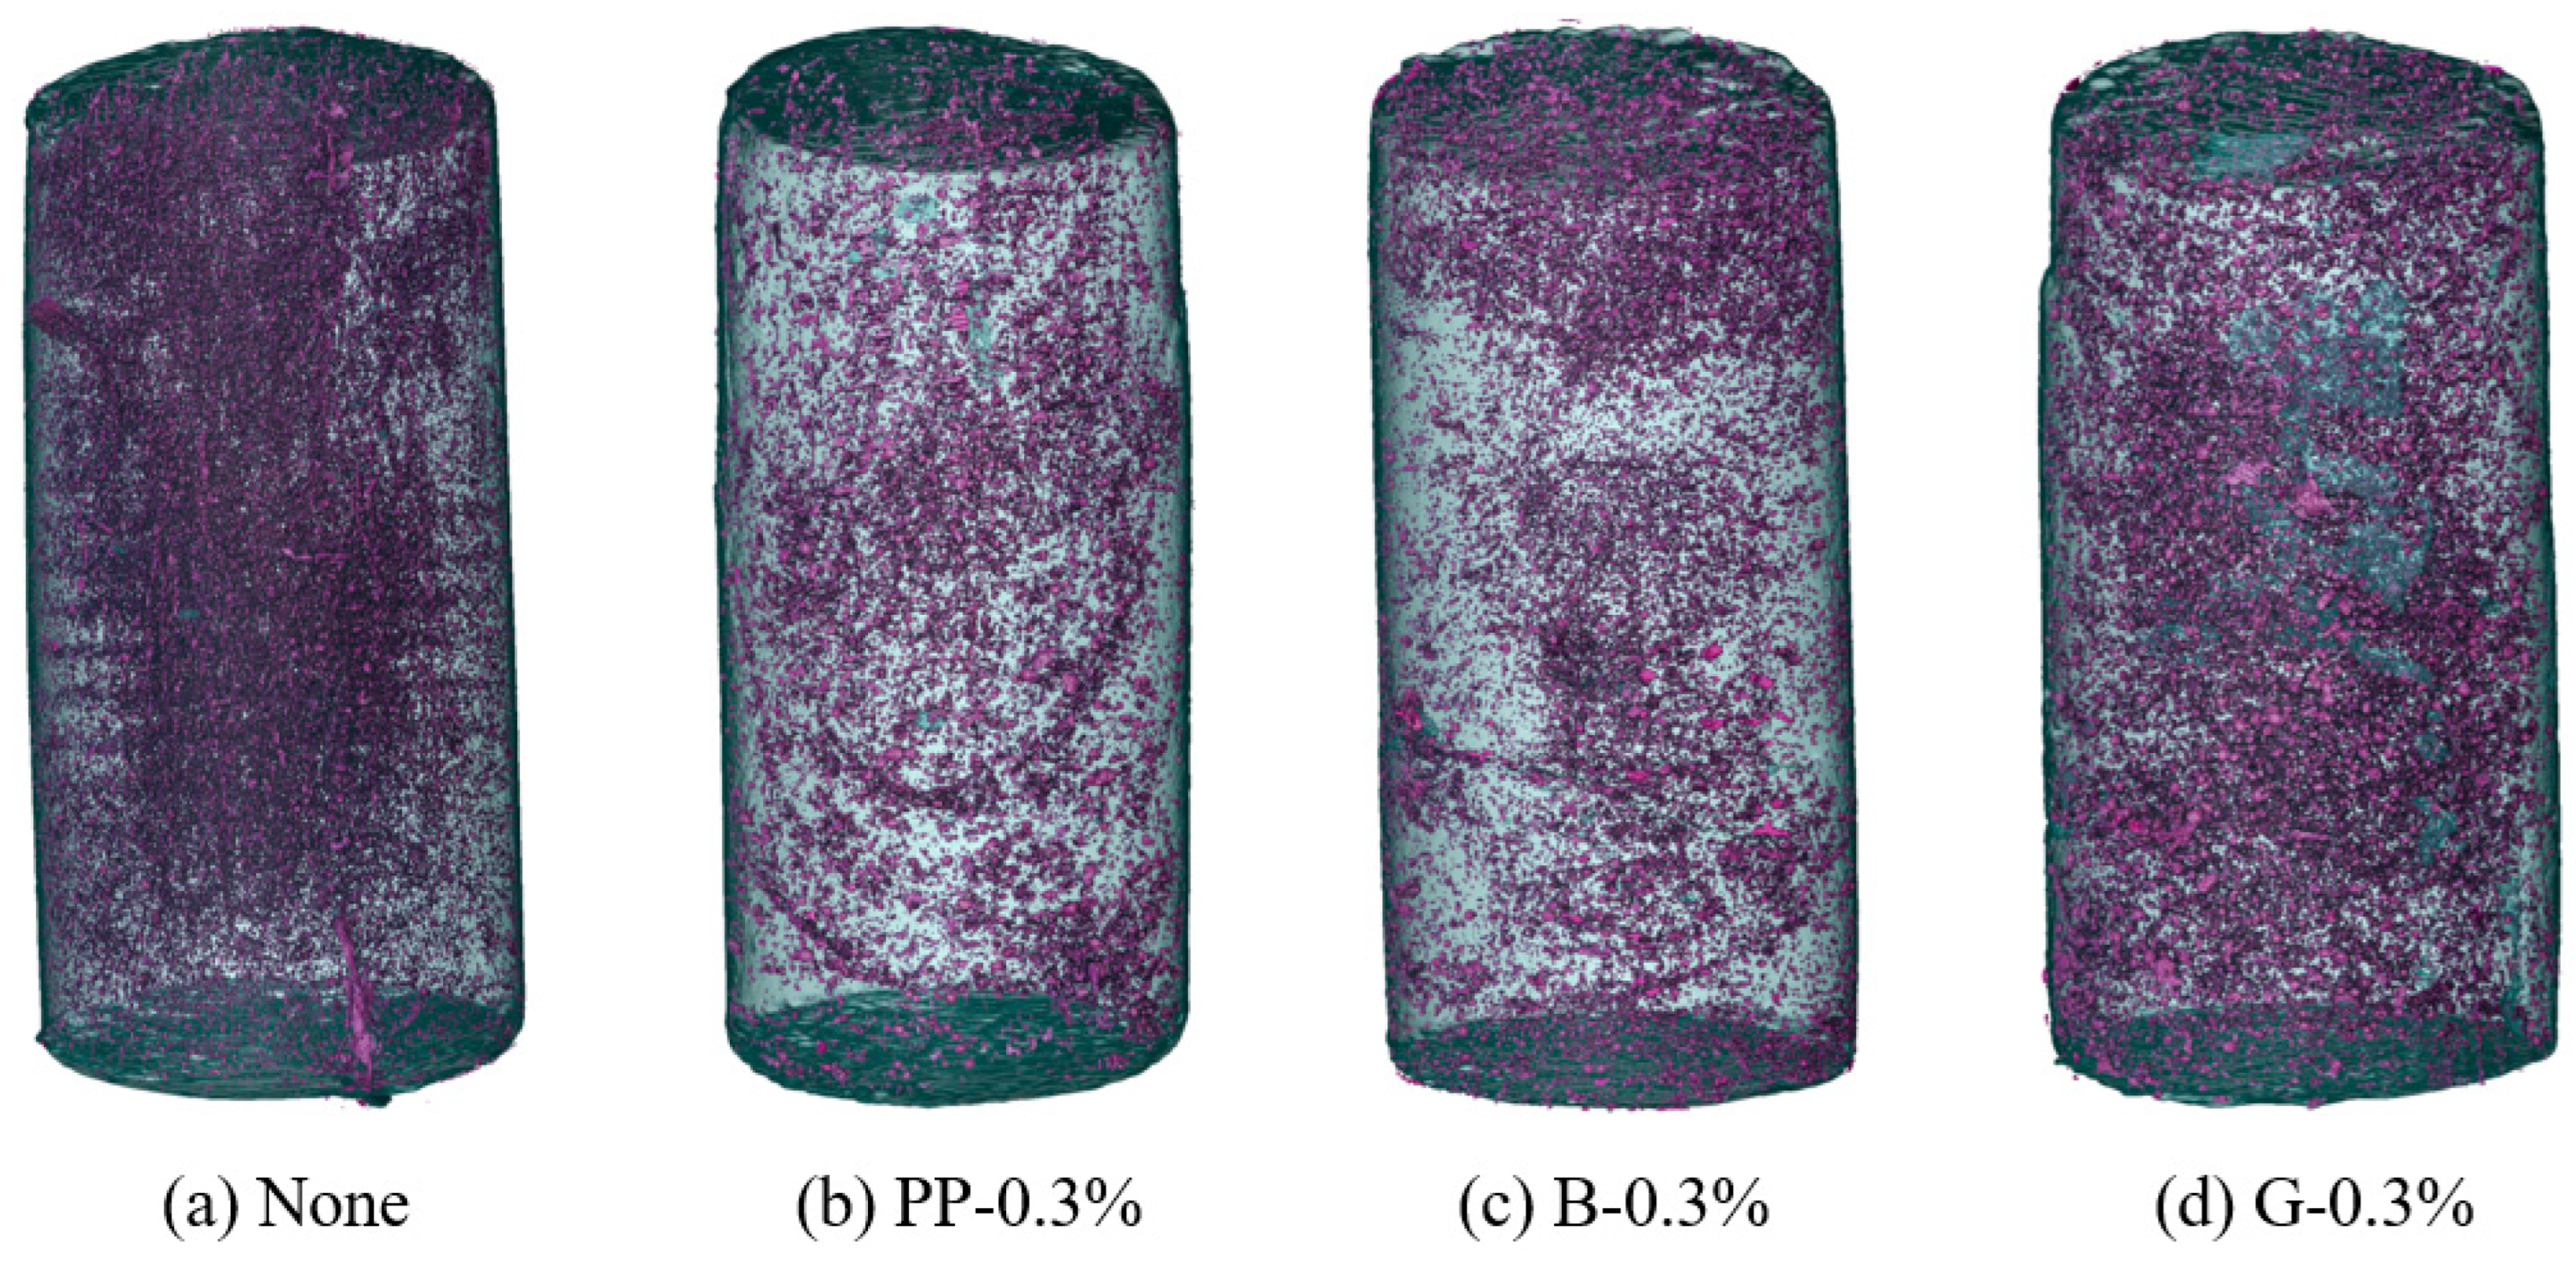
3.4. Characterization of 3D Crack Distribution of FRFTF Samples

The UCS results offer macroscopic mechanical features of filling and cannot deeply study the difference of the mechanical parameters of filling. In view of this limitation, this study analyzed the instability mode of backfill through 2D slice images. In order to further reveal the fill’s failure mechanism, this paper adopted 3D reconstruction technology and imported industrial CT scan data into digital image processing software (Avizo 3D) to accurately extract the crack distribution in fills after the UCS test. It not only enhances the intuitiveness of the study but also provides a more detailed damage analysis basis. Figure 15 reveals a 3D reconstruction image of the fill’s internal fissure. A 90° rotation processing was performed on the 3D reconstructed prototype to visualize the spatial geometric distribution of cracks in fill, and crack pictures under different perspectives of 0°, 90°, 180°, and 270° were captured successively.
The failure of fills presents a typical tension-shear compound failure mode, and its internal crack system includes two types of failure modes: tension-tension and shear. As shown in Figure 15a, None showed a significant 3D crack agglomeration effect, in which the dominant shear crack (main control crack) developed at a θ angle to the loading direction, forming a macroscopic crack spread track along the maximum shear stress’s direction. There are some changes between foamed and ordinary fills after adding fiber. As shown in Figure 15b–d, PP-0.3%, B-0.3%, and G-0.3% have both a central main crack and a shear crack running through the fill longitudinally, and in unison, the crack thickness is quite thin, accompanied by micro cracks. Fiber can tie the defects, such as cracks and pores in FRFTF, which improves the integrity of fills. Figure 15d–f express that when the glass fiber rate augmented from 0.3% to 0.9%, main cracks in the fill decreased, and structural integrity was well maintained.
Figure 16 displays a link between crack and fill total volume ratio increase. The total volume of crack for None, PP-0.3%, 0.3%–0.3%, G-B, G, and G-0.6%–0.9% is 2.13%, 2.65%, 1.91%, 3.18%, 4.35%, and 2.37%, respectively. The crack volume fraction rise of G-0.6% is the largest, while the fissure volume fraction rise of B-0.3% is the smallest. The glass fiber effect on FRFTF crack volume is more sensitive than that of polypropylene/basalt fiber. As the glass fiber rate rises from 0.3% to 0.6%, the fill’s total crack volume rises by 1.17%, and as the content rises from 0.6% to 0.9%, the total crack volume drops by 1.98%. Finally, the fill’s fissure volume fraction is related to fiber type, content, failure mode, and crack width.

3.5. Relationship Between Mechanical and Mesoscopic

To reveal the law of fill crack growth and analyze how porosity, pore distribution, crack, and crack surface roughness impact pore growth and damage evolution in fill, a link between porosity, crack volume, 3D fractal dimension, and macroscopic strength of filling was drawn based on test results. Figure 17 displays the link between the UCS of diverse fiber types, fills and porosity, fracture volume, and 3D fractal dimension.
One can comment that the fill’s strength is positively correlated to the agreeing porosity. The maximum strength value of G-0.3% is 0.85 MPa, and the corresponding porosity is also the highest. At the same time, the link between the strength of the fill and the crack volume is affected by the fiber type, and the crack volume of B-0.3% is the smallest. However, the strength values of different fibers have little effect on 3D fractal dimension, which indicates that the fiber type does not seriously affect the surface roughness of FRFTFs, which is mainly related to the porosity and crack volume of specimens.
Figure 18 demonstrates the links between strength, porosity, fracture volume, and 3D fractal dimension of the FRFTFs with different fiber content. As the amount of glass fiber rose from 0.3% to 0.9%, the fill’s UCS showed a negative link with porosity. The smaller the fill’s UCS, the larger the corresponding porosity. When the amount of glass fiber is 0.6%, the fill’s crack volume is the largest, and the UCS value is 0.71 MPa, while the strength value is the largest as the amount of glass fiber is 0.3%. The 3D fractal dimension of pores rises slowly with rising fiber content. Note that the fitting fiber rate can improve the fill’s strength features, increase the fill’s energy storage limit, and play an effective role in stress transfer and dispersion during loading, thus delaying the fill’s crack expansion and failure.

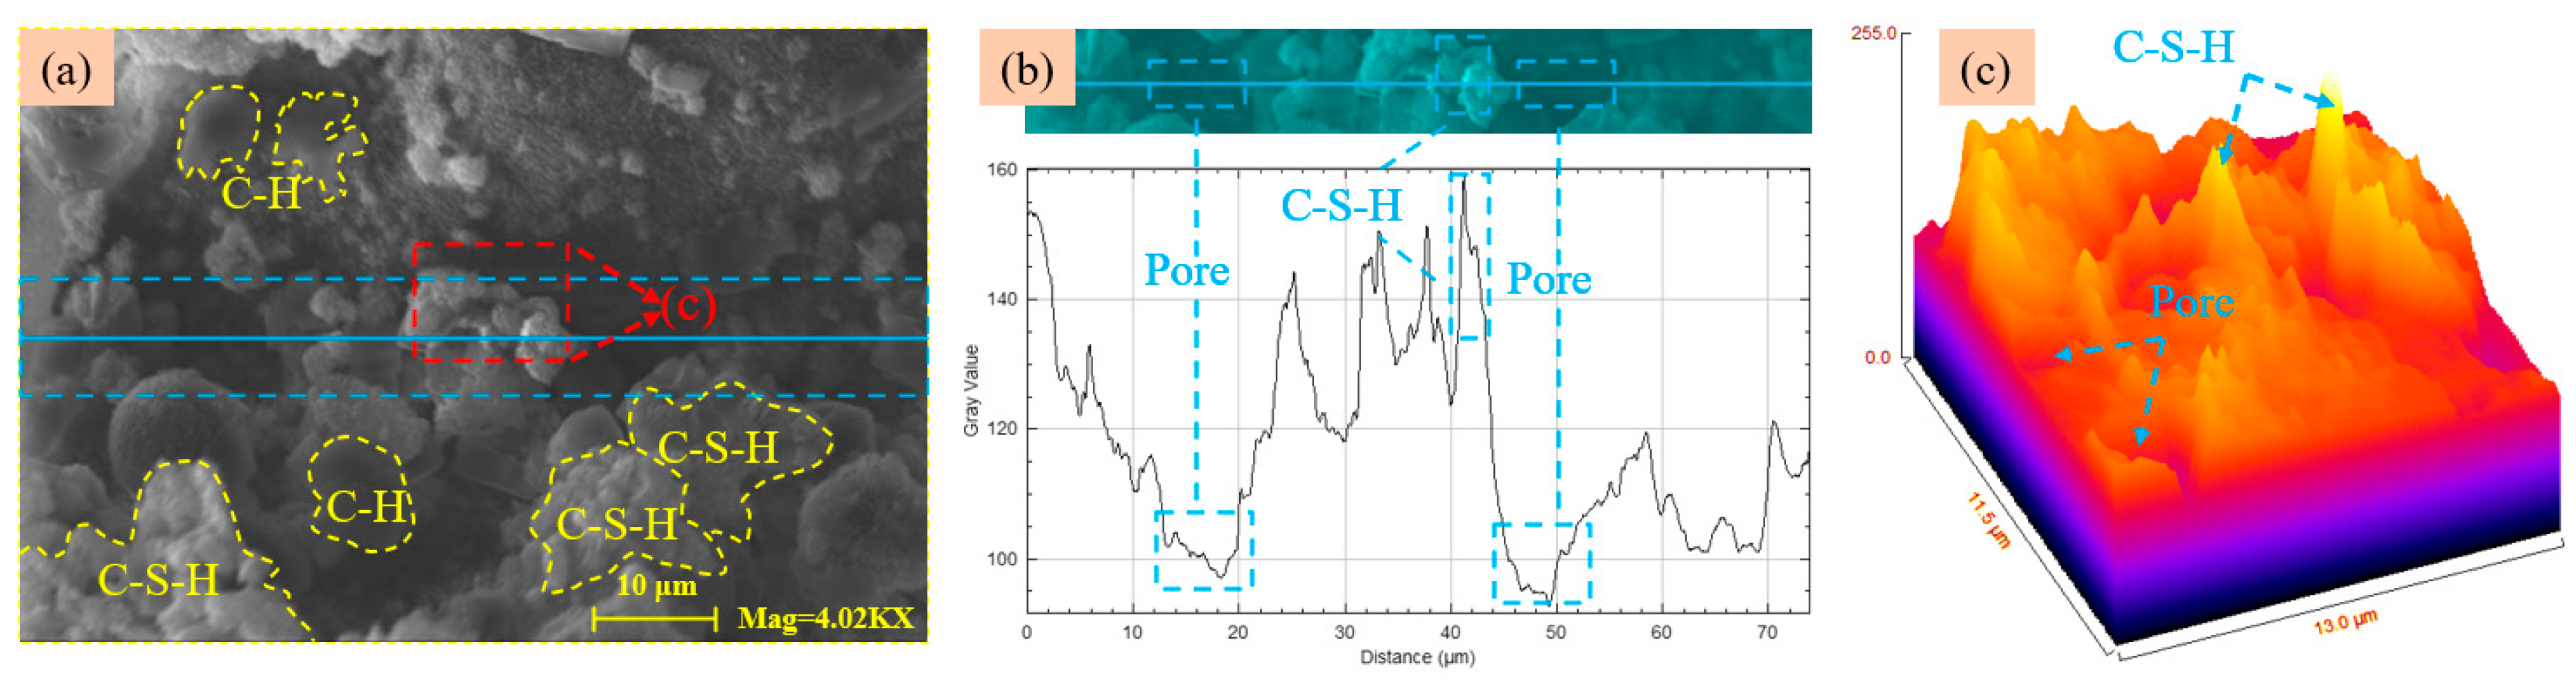
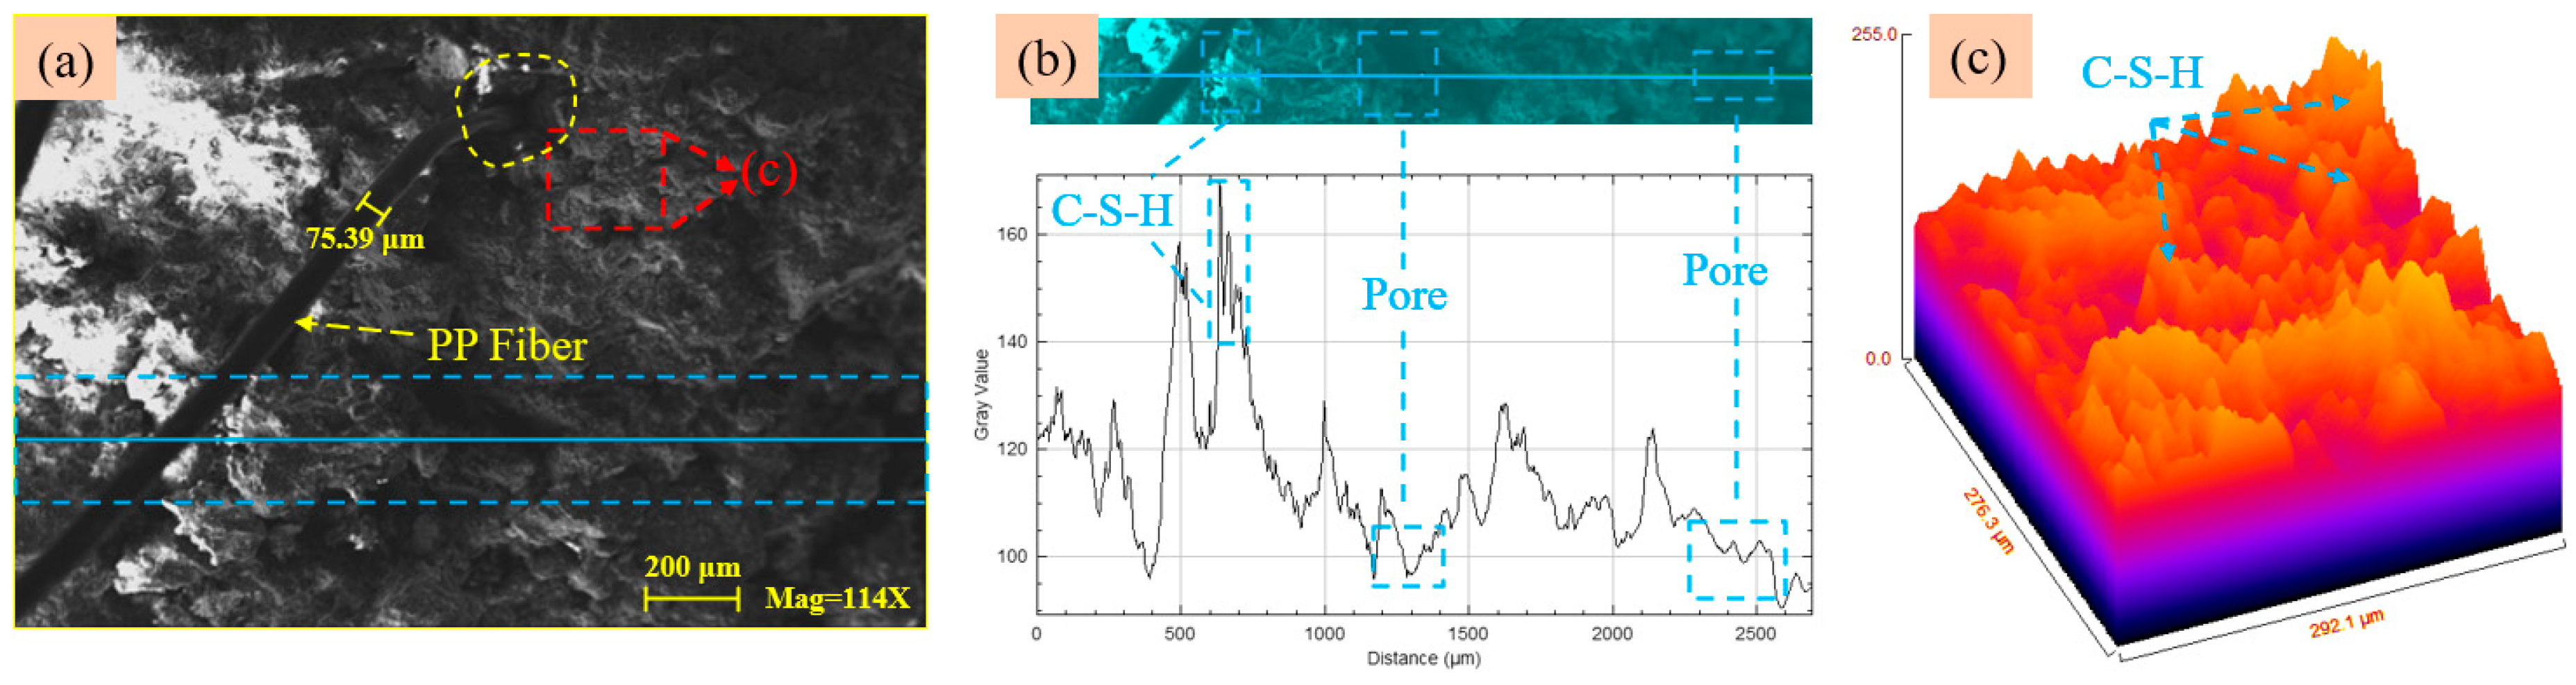
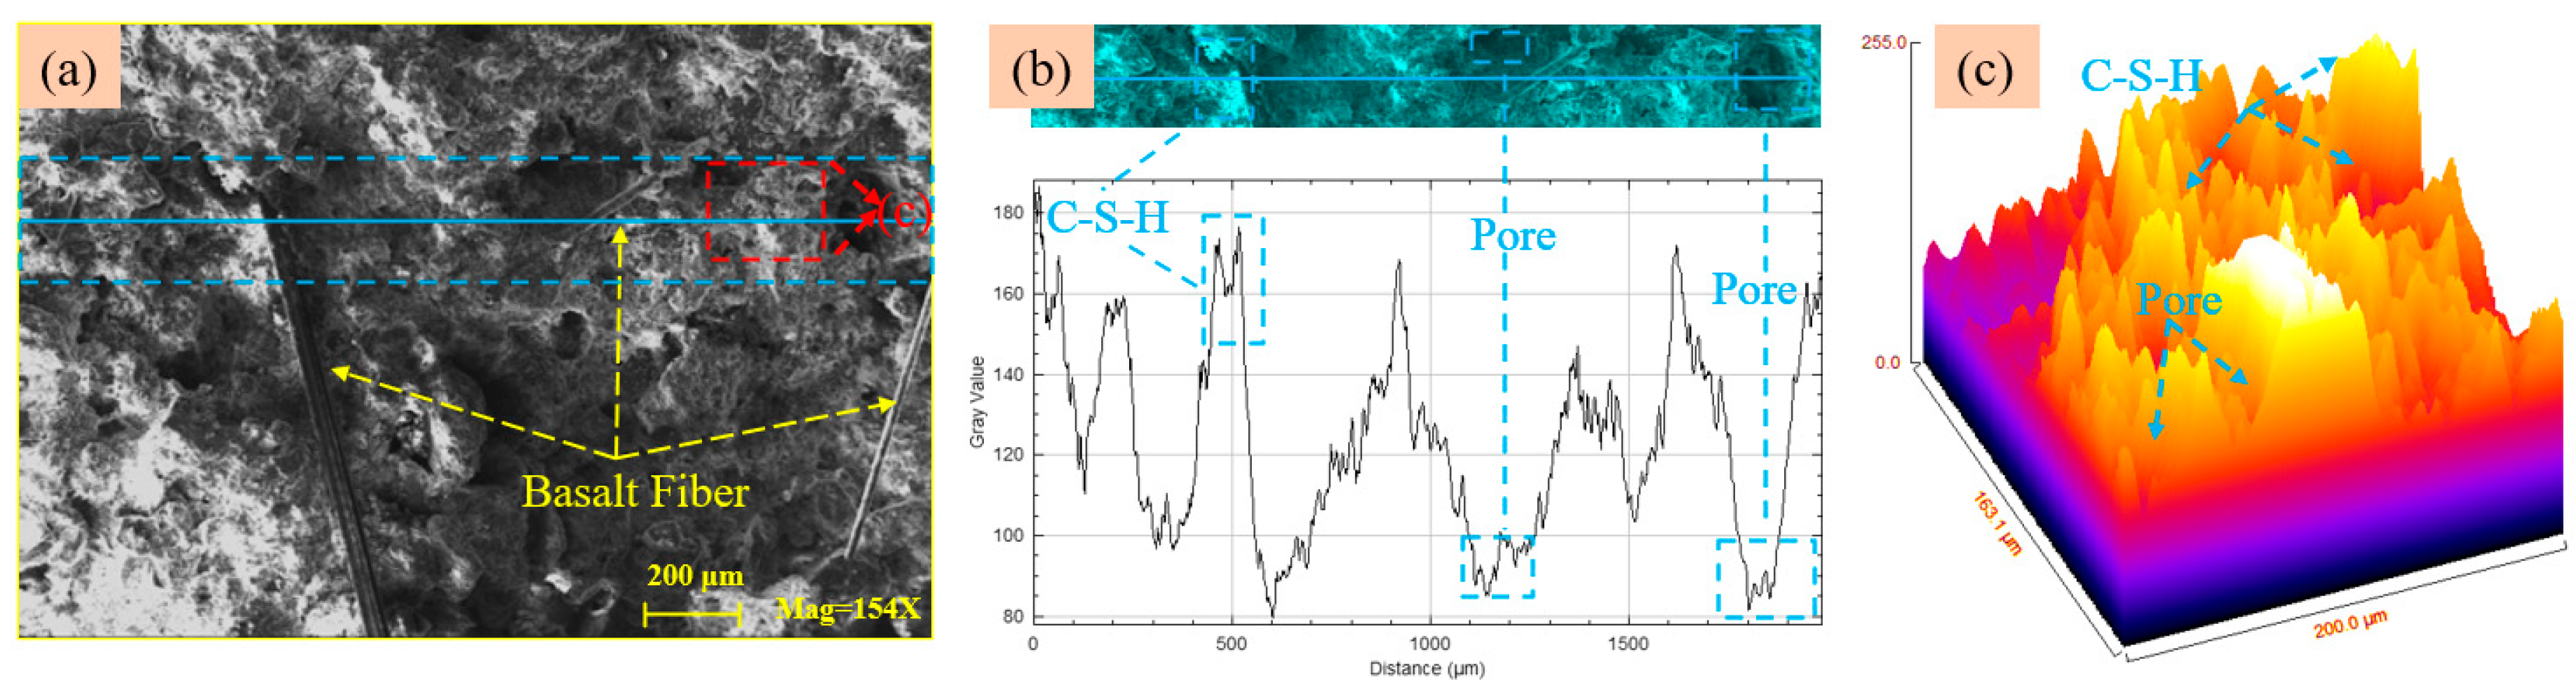
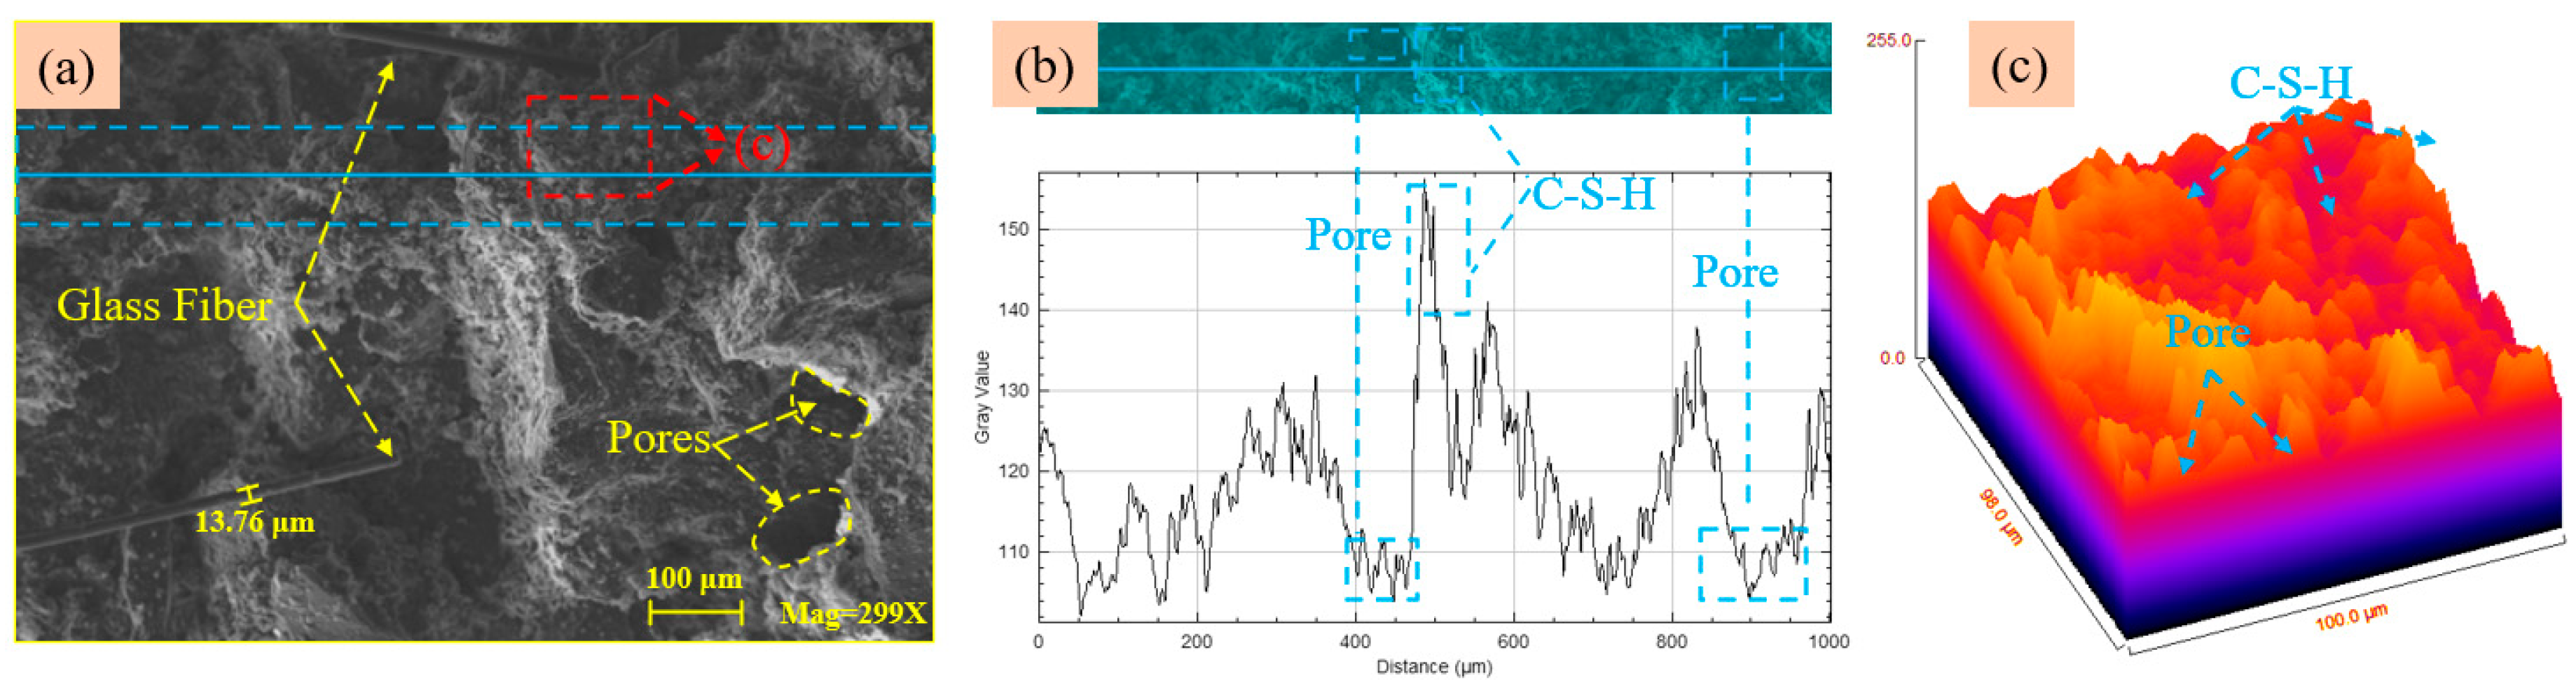
3.6. Micro Analysis of FRFTF Samples

Fill’s strength features are governed by its internal hydration products and hydration mechanism [55]. The loading samples were scanned by SEM to inspect the diverse fibers’ impact on the microstructure of FRFTF. The grayscale value analysis and the 3D Image transformation of the fill’s SEM image were carried out with Image-J software to quantitatively analyze the microscopic pore characteristics of the backfill. Figure 19, Figure 20, Figure 21 and Figure 22 shows the tests’ analysis results: (a) signifies the fill’s microscopic morphology; (b) represents the distribution law of the gray value of the horizontal line within the SEM image; (c) represents the 3D map of the surface roughness corresponding to the red box in the fill’s microscopic morphology.
As illustrated in Figure 19, none of the samples display characteristic hydration products, such as calcium silicate hydrate (C-S-H) and calcium hydroxide (C-H). The gray values in Figure 19b show significant phase differentiation: regions with gray values below 100 (threshold range 0–99) correspond to porous structures with reduced filling density, while higher gray values (typically >150) indicate that the matrix is densified by hydration product accumulation.
Compared with None, the gray value curve of doped fiber samples fluctuated greatly, which may be related to the non-uniformity of fiber dispersion and the modification effect of DTAB. Figure 20 displays that the surface of PP-0.3% is loose and porous, and the PP fiber does not break after loading and is partially buried in the tail sand matrix, showing good toughness. It can be observed from Figure 21 that B-0.3% is on the filled surface and does not take part in the hydration reaction, which is caused by the secure chemical properties of the fibers, which mainly act as a bridge between the tail substrates. As can be seen from Figure 22, when G-0.3% is embedded in the backfill matrix, the mechanical strength of the specimen is the highest despite the high porosity. This also shows that the G-0.3% can make the internal pores of the filler evenly distributed, improve the pore structure, make the filler matrix dense, and increase the strength of the filler.

4. Conclusions

In this study, industrial scanning CT technology combined with UCS and SEM was used to explore the effects of three fibers (PP, B, G) on FRFTF porosity, sphericity, and fractal dimension. The bond between macroscopic strength and microscopic structural parameters is established, utilizing 3D reconstruction techniques and analyzing the spatial distribution of FRFTF pores and cracks. The key conclusions are as follows:
  • Implying fiber increased fill’s porosity, and the porosity of PP-0.3%, B-0.3%, and G-0.3% were 0.69%, 0.74%, and 1.46%, respectively. With the rise of glass fiber dose from 0.3% to 0.9%, the fill’s porosity improves.
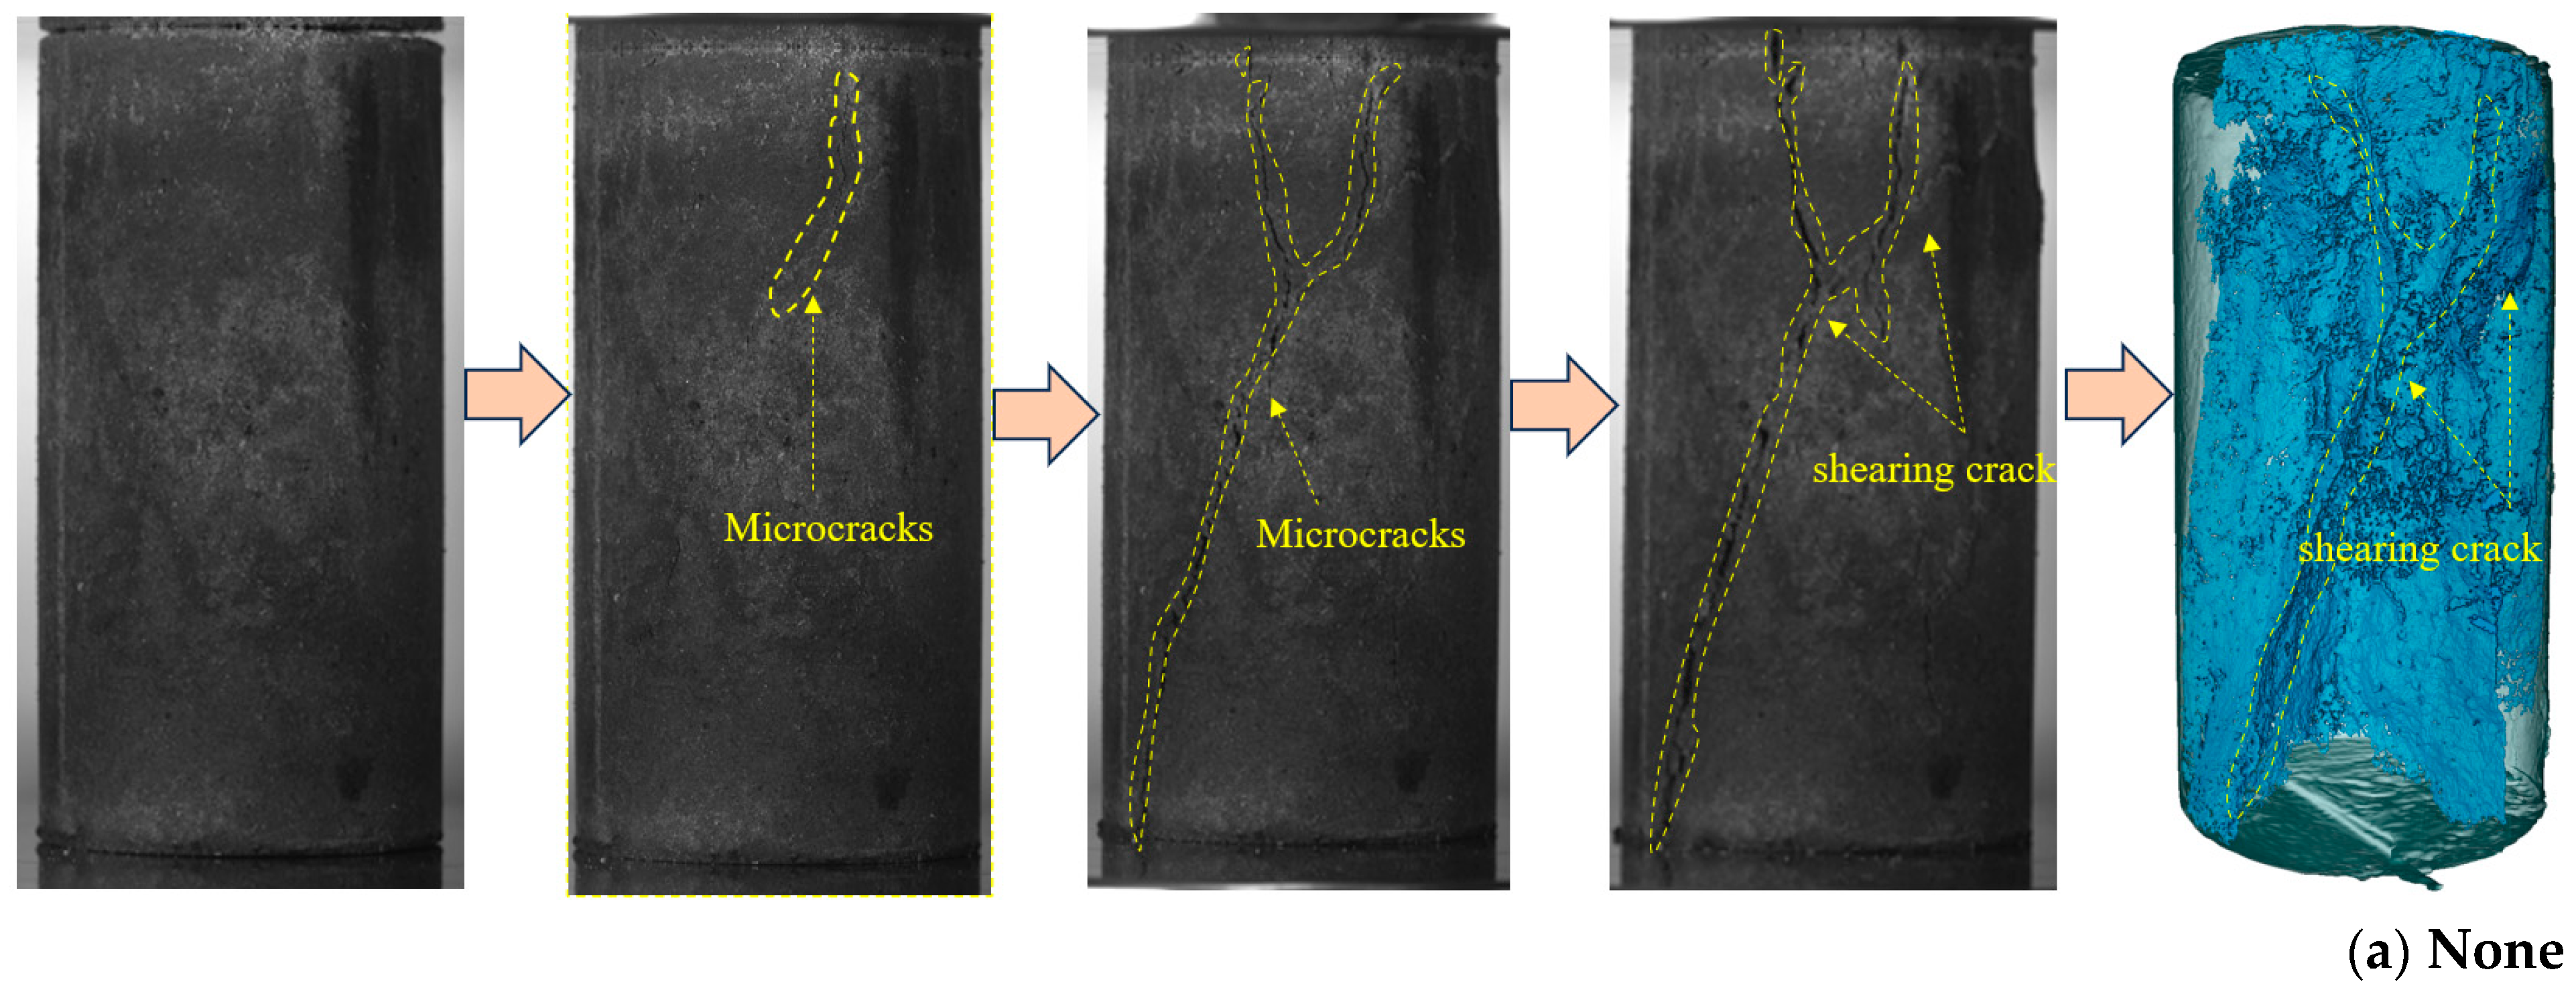
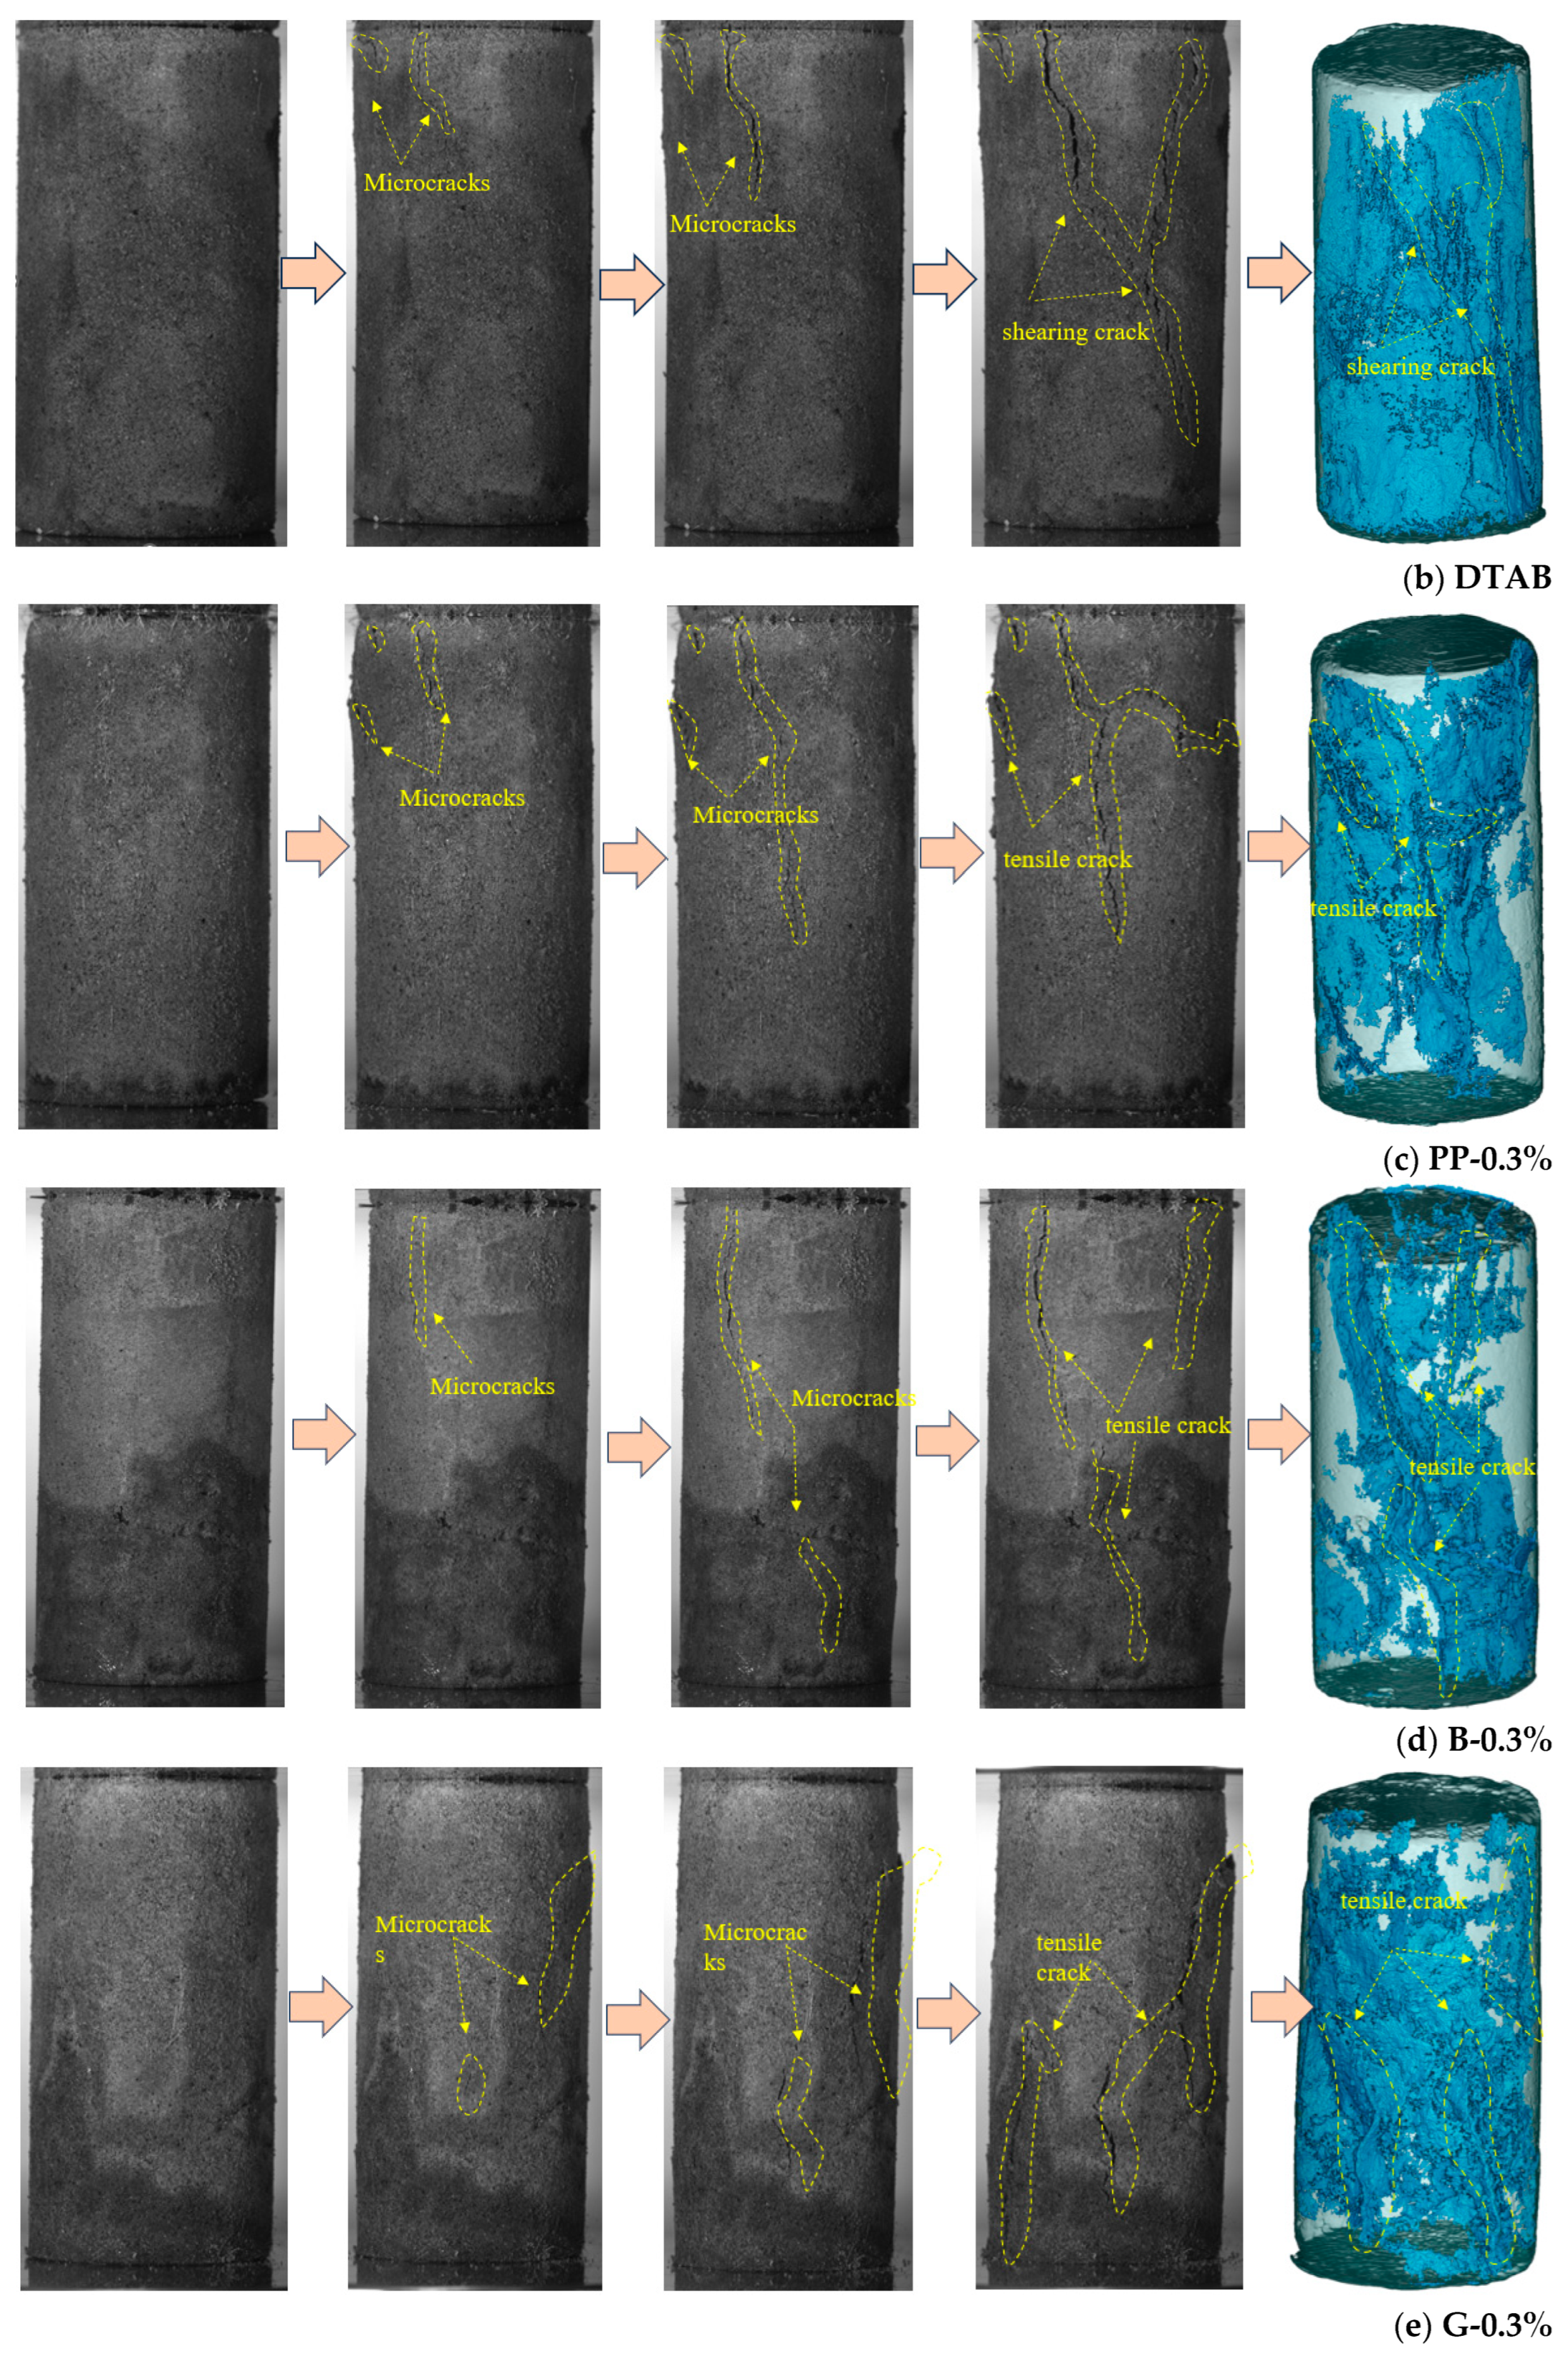
  • The addition of fiber and foaming agents enhanced the pore distribution and morphology of FRFTF. In None, there is a dense accumulation of connected holes in the fill’s middle, the pores in the FRFTF are evenly distributed, and the pores are mainly spherical.
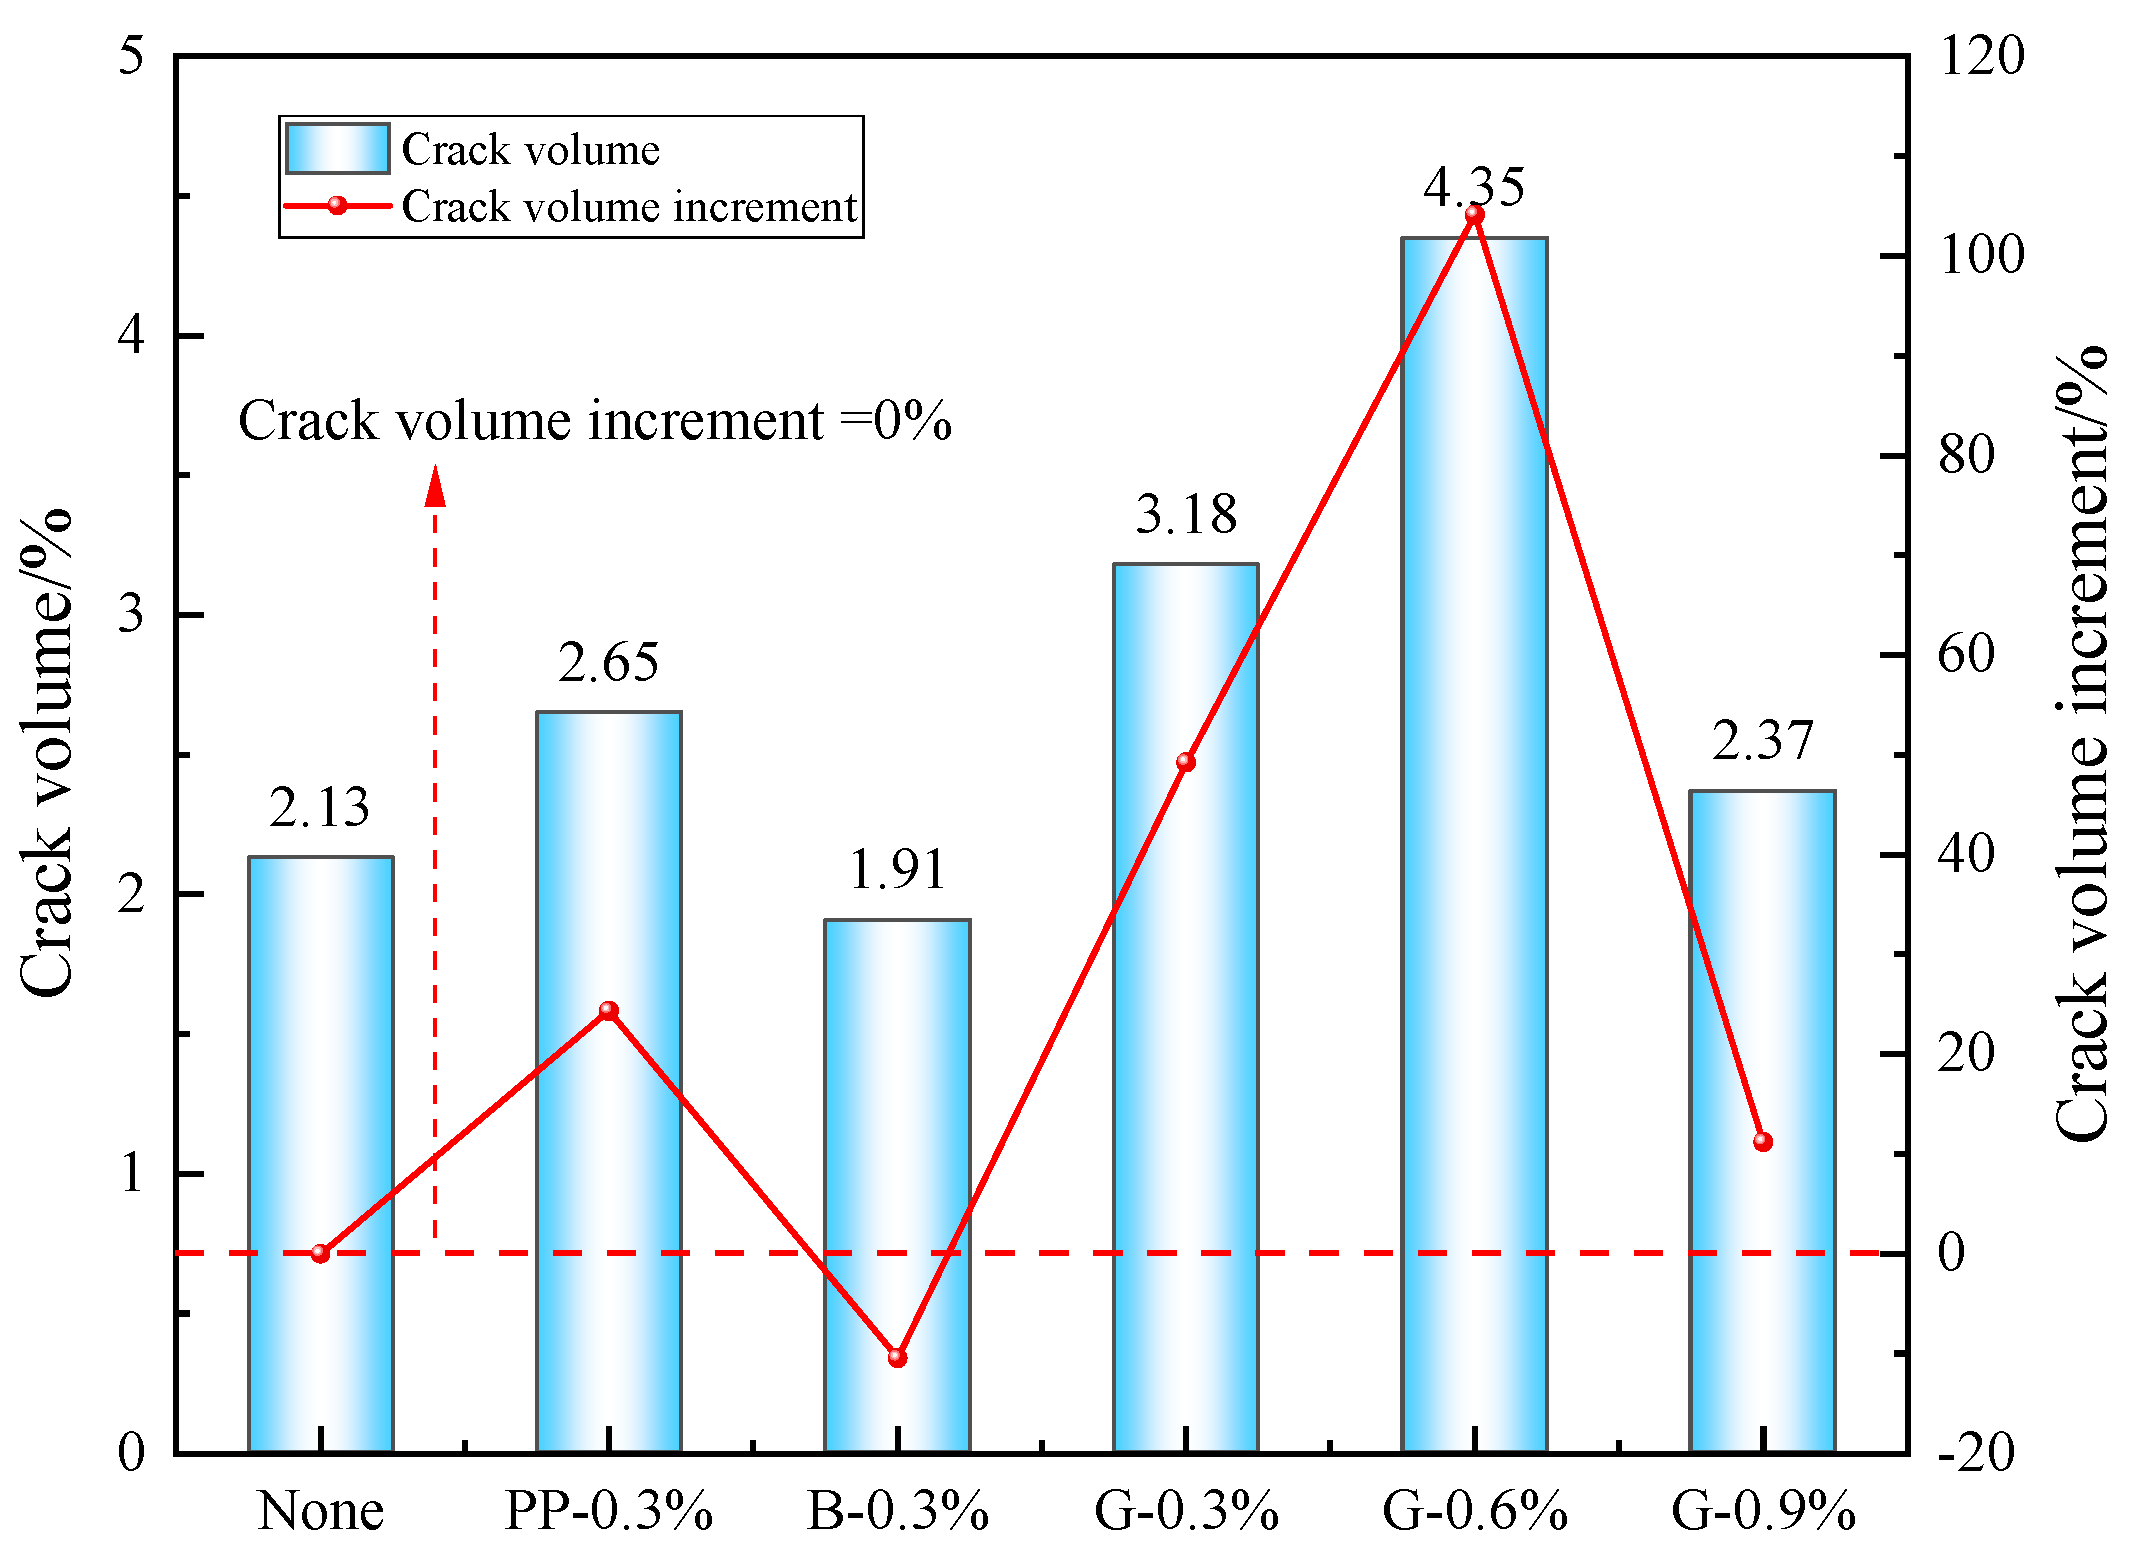
  • FRFTF primarily exhibits a tensile-shear mixed failure mode. The incorporation of fibers effectively reduces the number of primary cracks and enhances structural integrity. The link between fill strength and porosity/fracture rate is related to fiber type/rate.
  • The fiber bridges the fill’s internal defects, with bare fiber surface gradually being encased by hydration yields. This process enhances pore structure, densifies the fill, and ultimately improves its strength.
Lastly, the mechanism of different fiber forms on strength, durability, and crack resistance of fills needs to be further discussed. Future studies can stably evaluate the performance of various fibers under different conditions via a combination of lab and numerical simulation, providing more detailed data support for filling material optimization.

Author Contributions

Writing original draft preparation, T.J.; writing review and editing, S.C.; visualization, E.Y.; supervision, E.Y.; project administration, S.C.; funding acquisition, S.C. All authors have read and agreed to the published version of the manuscript.

Funding

This research was funded by the National Key Research and Development Program of China (2022YFC2905004).

Data Availability Statement

Data will be made available on request.

Acknowledgments

The authors would like to sincerely acknowledge the technical assistance of Gaili Xue in order to realize the present investigation.

Conflicts of Interest

The authors declare no conflicts of interest.

References

  1. He, M.; Wang, Q. Rock dynamics in deep mining. Int. J. Min. Sci. Technol. 2023, 33, 1065–1082. [Google Scholar] [CrossRef]
  2. Guo, X.; Ding, C.; Wei, P.; Yang, R. Theoretical analysis of the interaction between blasting stress wave and linear interface crack under high in-situ stress in deep rock mass. Int. J. Rock Mech. Min. Sci. 2024, 176, 105723. [Google Scholar] [CrossRef]
  3. He, C.; Mishra, B.; Shi, Q.; Zhao, Y.; Lin, D.; Wang, X. Correlations between mineral composition and mechanical properties of granite using digital image processing and discrete element method. Int. J. Min. Sci. Technol. 2023, 33, 949–962. [Google Scholar] [CrossRef]
  4. Jiang, T.; Cao, S.; Yilmaz, E. Structural characteristics of cement-based tail fill with sodium dodecyl sulfate, azodicarbonamide, and dodecyl trimethyl ammonium bromide. Powder Technol. 2025, 452, 120507. [Google Scholar] [CrossRef]
  5. Xie, G.; Liu, L.; Suo, Y.; Zhu, M.; Yang, P.; Sun, W. Study on the green disposal of industrial high salt water and its performance as activator to prepare magnesium-coal based solid waste backfill material for mine. J. Clean. Prod. 2024, 452, 141933. [Google Scholar] [CrossRef]
  6. Zhao, K.; Zhou, Y.; Huang, Q.; Yin, S.; Yan, Y.; Wu, J.; Shen, L.; Zeng, X.; Liu, W. Early properties and modeling of cemented superfine tailings backfill containing sodium dodecyl sulfate: Microstructure, mechanics, and acoustics. Mech. Mater. 2023, 179, 104567. [Google Scholar] [CrossRef]
  7. Hou, Y.; Yin, S.; Yang, S.; Chen, X.; Du, H. Mechanical properties, damage evolution and energy dissipation of cemented tailings backfill under impact loading. J. Build. Eng. 2023, 66, 105912. [Google Scholar] [CrossRef]
  8. Yang, L.; Jia, H.; Jiao, H.; Dong, M.; Yang, T. The mechanism of viscosity-enhancing admixture in backfill slurry and the evolution of its rheological properties. Minerals 2023, 13, 1045. [Google Scholar] [CrossRef]
  9. Li, M.; Peng, Y.; Zhang, J.; Zhao, Y.; Wang, Z.; Guo, Q.; Guo, S. Properties of a backfill material prepared by cementing coal gangue and fly ash through microbial-induced calcite precipitation. Constr. Build. Mater. 2023, 384, 131329. [Google Scholar] [CrossRef]
  10. Zhang, T.; Yang, Y.L. Occurrence characteristics and treatment technologies of mine goaf in China: A comprehensive review. Environ. Earth Sci. 2024, 83, 441. [Google Scholar] [CrossRef]
  11. Guo, J.; Yang, W.; Zhao, Y.; Zhang, W. Stability analysis of a mine wall based on different roof-contact filling rates. Minerals 2024, 14, 673. [Google Scholar] [CrossRef]
  12. Tang, F.; Qin, Y.P.; Guo, M.Y.; Zhang, F.J.; Wang, S.B.; Yan, L.X.; Hao, J.S. Multi-angle research on the performance of self-foaming filling materials and analysis of engineering applications. Constr. Build. Mater. 2024, 449, 138447. [Google Scholar] [CrossRef]
  13. Zhu, T.Y.; Chen, Z.H.; Cao, J.; Nian, G.Q.; Zhang, L.F.; Hao, J.S.; Zhou, Z.H. Investigation of the fracture behavior of cemented waste rock-tailing backfill by digital image correlation technique and discrete element modeling. Constr. Build. Mater. 2024, 428, 136367. [Google Scholar] [CrossRef]
  14. Yin, S.; Yan, Z.; Chen, X.; Yan, R.; Chen, D.; Chen, J.; Li, G. Active roof-contact: The future development of cemented paste backfill. Constr. Build. Mater. 2023, 370, 130657. [Google Scholar] [CrossRef]
  15. Tu, B.; Liu, L.; Ding, X.; Ruan, S. Active roof-contacted combined backfill mining technology based on a modified magnesium slag-based cementitious material. Miner. Eng. 2024, 216, 108916. [Google Scholar] [CrossRef]
  16. Wang, S.; Wang, Z.; Chen, C.; Wu, A. Insight into the active roof-contact of cemented paste backfill: A high-efficient expansion material. Case Stud. Constr. Mater. 2024, 20, e03123. [Google Scholar] [CrossRef]
  17. Wang, Z.; Wu, A.; Wang, S.; Hu, X. Effect and mechanism of time-dependent and economical expansion materials in improving the active roof-contact for cemented paste backfill. Constr. Build. Mater. 2024, 439, 137339. [Google Scholar] [CrossRef]
  18. Yan, B.; Jia, H.; Liu, Y.; Liu, P.; Yilmaz, E. Revealing cooperative load-bearing mechanisms between mine backfill and rock pillar using a bonded-block modeling approach. Minerals 2025, 15, 210. [Google Scholar] [CrossRef]
  19. Gencel, O.; Nodehi, M.; Bozkurt, A.; Sarı, A.; Ozbakkaloglu, T. The use of computerized tomography (CT) and image processing for evaluation of the properties of foam concrete produced with different content of foaming agent and aggregate. Constr. Build. Mater. 2023, 399, 132433. [Google Scholar] [CrossRef]
  20. Liu, S.; Wang, J.; Meng, L.; Hu, C.; Meng, X. Location of the phase-change material layer on thermal performance of light-weight walls. Int. J. Low-Carbon Technol. 2024, 19, 127–134. [Google Scholar] [CrossRef]
  21. Abdellatief, M.; Ahmed, Y.M.; Taman, M.; Elfadaly, E.; Tang, Y.; Abadel, A.A. Physico-mechanical, thermal insulation properties, and microstructure of geopolymer foam concrete containing sawdust ash and egg shell. J. Build. Eng. 2024, 90, 109374. [Google Scholar]
  22. Cheng, A.; Zhou, Y.; Chen, G.; Huang, S.; Ye, Z. Acoustic emission characteristics and fracture mechanism of cemented tailings backfill under uniaxial compression: Experimental and numerical study. Environ. Sci. Pollut. Res. 2023, 30, 55143–55157. [Google Scholar]
  23. Guo, Y.; Chen, X.; Chen, B.; Wen, R.; Wu, P. Analysis of foamed concrete pore structure of railway roadbed based on X-ray computed tomography. Constr. Build. Mater. 2021, 273, 121773. [Google Scholar]
  24. Chen, L.; Chen, X.; Wang, L.; Ning, Y.; Ji, T. Compressive strength, pore structure, and hydration products of slag foam concrete under sulfate and chloride environment. Constr. Build. Mater. 2023, 394, 132141. [Google Scholar]
  25. Zhu, Z.; Huo, W.; Sun, H.; Ma, B.; Yang, L. Correlations between unconfined compressive strength, sorptivity and pore structures for geopolymer based on SEM and MIP measurements. J. Build. Eng. 2023, 67, 106011. [Google Scholar]
  26. Zhao, K.; Lai, Y.; He, Z.; Liu, W.; Zhao, R.; Wang, Y.; Tian, X.; Nie, J. Study on energy dissipation and acoustic emission characteristics of fiber tailings cemented backfill with different ash-sand ratios. Process Saf. Environ. Prot. 2023, 174, 983–996. [Google Scholar]
  27. Gencel, O.; Kazmi, S.M.S.; Munir, M.J.; Kaplan, G.; Bayraktar, O.Y.; Yarar, D.O.; Karimipour, A.; Ahmad, M.R. Influence of bottom ash and polypropylene fibers on the physico-mechanical, durability and thermal performance of foam concrete: An experimental investigation. Constr. Build. Mater. 2021, 306, 124887. [Google Scholar]
  28. Chen, L.; Li, P.; Guo, W.; Wang, R.; Zhang, D.; Gao, M.; Peng, C. Experimental investigation of the dynamic mechanical properties of polypropylene-fiber-reinforced foamed concrete at high temperatures. Polymers 2023, 15, 2544. [Google Scholar] [CrossRef]
  29. Cao, S.; Che, C.; Zhang, Y.; Shan, C.; Liu, Y.; Zhao, C.; Du, S. Mechanical properties and damage evolution characteristics of waste tire steel fiber-modified cemented paste backfill. Int. J. Min. Sci. Technol. 2024, 34, 909–924. [Google Scholar]
  30. Quan, W.; Huang, W.; An, Y.; Miao, X.; Chen, Z. The effect of natural bamboo fiber and basalt fiber on the properties of autoclaved aerated concrete. Constr. Build. Mater. 2023, 377, 131153. [Google Scholar]
  31. Qiu, Y.; Wang, Y.; Liu, Y.; Zhang, L.; Chen, Y.; Li, C.; Wu, T.; Wang, C. Development of fiber compound foaming agent and experimental study on application performance of foamed lightweight soil. Appl. Rheol. 2023, 33, 20230108. [Google Scholar] [CrossRef]
  32. Xu, Y.; Han, Y.J.; Zhao, G.Q.; Meng, S.Y. Enhancing geotechnical reinforcement: Exploring molybdenum tailings and basalt fibre-modified composites for sustainable construction. Constr. Build. Mater. 2024, 411, 134452. [Google Scholar] [CrossRef]
  33. Zhao, K.; Ma, C.; Yang, J.; Wu, J.; Yan, Y.; Lai, Y.; Ao, W.; Tian, Y. Pore fractal characteristics of fiber-reinforced backfill based on nuclear magnetic resonance. Powder Technol. 2023, 426, 118678. [Google Scholar] [CrossRef]
  34. Pi, Z.; Huang, S.; Xu, J.; Chen, Z.; Li, H.; Shen, Y.; Tian, J. The reinforcement mechanism of basalt and polypropylene fibers on the strength, toughness and crack resistance of tailing mortar. Constr. Build. Mater. 2024, 419, 135531. [Google Scholar] [CrossRef]
  35. Zheng, W.B.; Wang, S.L.; Quan, X.Y.; Qu, Y.; Mo, Z.K.; Lin, C.J. Carbonation Resistance and Pore Structure of Mixed-Fiber-Reinforced Concrete Containing Fine Aggregates of Iron Ore Tailings. Minerals. 2024, 15, 8992. [Google Scholar] [CrossRef]
  36. Liu, H.B.; Zhang, C.; Jia, C.; Tao, D.D. Freeze-thaw cycle characteristics of graphite tailing concrete and steel fiber reinforced-graphite tailing concrete. Constr. Build. Mater. 2025, 3462, 140006. [Google Scholar] [CrossRef]
  37. Xu, Y.; Yao, L.; Yu, X. Effect of polypropylene fibers on mechanical and wetting properties of overall superhydrophobic foamed concrete. Constr. Build. Mater. 2024, 448, 138207. [Google Scholar] [CrossRef]
  38. Bian, P.; Yu, Q.; Zhan, B.; Gao, P.; Guo, B.; Hong, L.; Yang, Y.; Han, A. Enhancing electromagnetic wave absorption and flexural properties in carbon fiber-reinforced foamed cement-based composites. Constr. Build. Mater. 2024, 415, 134989. [Google Scholar] [CrossRef]
  39. Shi, X.; Ning, B.; Wang, J.; Cui, T.; Zhong, M. Improving flexural toughness of foamed concrete by mixing polyvinyl alcohol-polypropylene fibers: An experimental study. Constr. Build. Mater. 2024, 400, 132689. [Google Scholar] [CrossRef]
  40. Zhang, S.Y.; Sun, W.; Hou, Z.M.; Wu, A.X.; Li, Z.Y.; He, Y.Y.; Liu, B.; Jiang, M.G.; Wang, S.Y. Research on the strength influence and crack evolution law of layered backfill based on macro and meso mechanical response. Constr. Build. Mater. 2024, 449, 138493. [Google Scholar] [CrossRef]
  41. Song, Q.; Zou, Y.J.; Bao, J.W.; Zhang, P. Disposal of solid waste as building materials: A study on the mechanical and durability performance of concrete composed of gold tailings. J. Mater. Res. Technol. 2024, 30, 2111–2124. [Google Scholar]
  42. Wang, S.; Li, J.; Li, F.; Li, J.; Zhang, C.; Ji, M.; Man, J.; Peng, S. Study on the influential effect of different CaCO3 particle sizes on the internal pore structure of starch/fiber foaming composite materials. Mater. Today Commun. 2024, 38, 107867. [Google Scholar] [CrossRef]
  43. Li, Z.; Sun, W.; Gao, T.; Zhao, J.; Lu, K.; Cheng, H. Experimental study on evolution of pore structure of inclined layered cemented tailings backfill based on X-ray CT. Constr. Build. Mater. 2023, 366, 130242. [Google Scholar]
  44. Li, J.; Han, X.; Li, X.; Diao, H.; He, Z. Investigation of aggregate gradation on air voids distribution in porous asphalt concrete using X-ray CT scanning images. Case Stud. Constr. Mater. 2024, 21, e03710. [Google Scholar] [CrossRef]
  45. Meng, Y.; Pei, J.; Chen, Z.; Guo, F.; Dai, X.; Huang, G. Study on sound absorption characteristic of porous asphalt mixture based on macroscale and mesoscale analysis. Constr. Build. Mater. 2023, 408, 133776. [Google Scholar]
  46. Yang, J.; Chen, B.; Wu, X.; Xu, G. Quantitative analysis of steel fibers on UHPFRC uniaxial tensile behavior using X-CT and UTT. Constr. Build. Mater. 2023, 368, 130349. [Google Scholar] [CrossRef]
  47. Jiang, M.; Cao, S.; Yilmaz, E. Analyzing microscopic structure and macroscopic strength behavior of cement-based tail fills incorporating fiber by X-ray CT scanning technique. Constr. Build. Mater. 2024, 440, 137453. [Google Scholar] [CrossRef]
  48. Li, J.; Cao, S.; Yilmaz, E. Analyzing the microstructure of cemented fills adding polypropylene-glass fibers with X-ray micro-computed tomography. J. Mater. Res. Technol. 2023, 27, 2627–2640. [Google Scholar] [CrossRef]
  49. Hao, Z.; Lu, C.; Dong, B.; Li, V.C. 3D crack recognition in Engineered Cementitious Composites (ECC) based on super-resolution reconstruction and semantic segmentation of X-ray Computed Microtomography. Compos. B Eng. 2024, 285, 111730. [Google Scholar]
  50. Chen, S.; Xiang, Z.G.; Yao, N.; Liu, G.; Hou, C.; Li, Z.P. Effects of superabsorbent polymer on mechanical properties of cemented paste backfill and its mechanism evolution. Constr. Build. Mater. 2024, 445, 137911. [Google Scholar]
  51. Wu, A.X.; Wang, Y.; Ruan, Z.E.; Xiao, B.L.; Wang, J.D.; Wang, L.Q. Key theory and technology of cemented paste backfill for green mining of metal mines. Green Smart Min. Eng. 2024, 1, 27–39. [Google Scholar]
  52. Liu, P.; Yang, K.; Li, C.; Li, C.; Zhang, S. Experimental study on microstructural properties of iron tailings foam concrete and its relationship with macromechanical properties. Constr. Build. Mater. 2025, 462, 139984. [Google Scholar]
  53. Zhao, D.; Xu, J.; Han, Z.; Liu, Y.; Liu, Y.; Yang, X. Study on the correlation between pore structure characterization and early mechanical properties of foamed concrete based on X-CT. Constr. Build. Mater. 2024, 450, 138603. [Google Scholar]
  54. Yang, Z.; Dong, S.; Zhong, Y. Particle packing optimization and pore structure assessment of ternary cementitious system based on X-ray computed tomography and mercury intrusion porosimetry. Constr. Build. Mater. 2024, 413, 134913. [Google Scholar]
  55. Sun, J.L.; Sun, M.; Su, A.S.; Gao, X.J. Influence of graphite tailings on the mechanical performance, of ultra-high performance concrete. Case Stud. Constr. Mater. 2025, 221, e04246. [Google Scholar]
Figure 1. DTAB in the experiment.
Minerals 15 00354 g001
Figure 2. Photos of preparation method and test equipment of FRFTF specimen.
Minerals 15 00354 g002
Figure 3. Computed tomography (CT) experiment: (a) diagram and (b) working principle. The arrows represent the direction of work.
Minerals 15 00354 g003
Figure 4. FRFTF’s 3D reconstruction and dissection process of cracks/pores.
Minerals 15 00354 g004
Figure 5. Photos of fill specimens, vacuum coating chamber, and pore structure observations.
Minerals 15 00354 g005
Figure 6. Two-dimensional slice position of FRFTF.
Minerals 15 00354 g006
Figure 7. Presentation of 2D slice views of FRFTF specimens.
Minerals 15 00354 g007
Figure 8. Pore percentage changes with FRFTF height: (a) None; (b) DTAB; (c) PP-0.3%; (d) B-0.3%; (e) G-0.3%.
Minerals 15 00354 g008
Figure 9. Total porosity of FRFTF.
Minerals 15 00354 g009
Figure 10. Distribution of all pores within FRFTF specimens. The blue arrows reflects small pores in the matrix.
Minerals 15 00354 g010
Figure 11. Relationship between volume and sphericity of pores: (a) None; (b) PP−0.3%; (c) B−0.3%; (d) G−0.3%.
Minerals 15 00354 g011
Figure 12. Pore space distribution of FRFTF samples. (a) None; (b) PP-0.3%; (c) B-0.3%; (d) G-0.3%.
Minerals 15 00354 g012
Figure 13. Link between fill porosity and fractal dimension: (a) None; (b) PP−0.3%; (c) B−0.3%; (d) G−0.3%.
Minerals 15 00354 g013aMinerals 15 00354 g013b
Figure 14. Fill’s crack spread and failure: (a) None; (b) DTAB; (c) PP-0.3%; (d) B-0.3%; (e) G-0.3%.
Minerals 15 00354 g014aMinerals 15 00354 g014b
Figure 15. Crack models: (a) None; (b) PP-0.3%; (c) B-0.3%; (d) G-0.3%; (e) G-0.6%; (f) G-0.9%.
Minerals 15 00354 g015aMinerals 15 00354 g015b
Figure 16. Link between volumetric percentage of total fissures and their raise percentage.
Minerals 15 00354 g016
Figure 17. Link among UCS, porosity, fissure volume, 3D fractal dimension, and fiber types.
Minerals 15 00354 g017
Figure 18. Link among UCS, porosity, fissure volume, 3D fractal dimension, and glass fiber content.
Minerals 15 00354 g018
Figure 19. SEM observations of None samples: (a) None; (b) gray value; (c) surface roughness.
Minerals 15 00354 g019
Figure 20. SEM observations of PP-0.3% samples: (a) PP-0.3%; (b) gray value; (c) surface roughness.
Minerals 15 00354 g020
Figure 21. SEM observations of B-0.3% samples: (a) B-0.3%; (b) gray value; (c) surface roughness.
Minerals 15 00354 g021
Figure 22. SEM observations of G-0.3% samples: (a) G-0.3%; (b) gray value; (c) surface roughness.
Minerals 15 00354 g022
Table 1. XRF results of cement and tailings (wt.%).
MaterialsSiO2Al2O3K2OCaOFe2O3Na2OMgOTiO2P2O5
Tailings74.4311.714.792.892.791.430.970.340.23
Cement21.646.881.2960.003.800.292.570.440.22
Disclaimer/Publisher’s Note: The statements, opinions and data contained in all publications are solely those of the individual author(s) and contributor(s) and not of MDPI and/or the editor(s). MDPI and/or the editor(s) disclaim responsibility for any injury to people or property resulting from any ideas, methods, instructions or products referred to in the content.

