Article

Formation of Core-Rim Magnetite with a Carbonaceous Core in Mid-Archean Banded Iron Formation from the Barberton Greenstone Belt, South Africa

1
Department of Geology, Graduate School of Science and Technology, Niigata University, Niigata 950-2181, Japan
2
Department of Geology, Faculty of Science, Niigata University, Niigata 950-2181, Japan
*
Author to whom correspondence should be addressed.
Minerals 2025, 15(3), 218; https://doi.org/10.3390/min15030218
Submission received: 14 December 2024 / Revised: 19 February 2025 / Accepted: 21 February 2025 / Published: 24 February 2025
(This article belongs to the Special Issue Microbial Biomineralization and Organimineralization)

Abstract

:
Through the analysis of core-rim magnetite, we demonstrate that the core contains carbonaceous materials (CMs) derived from a 3.2-billion-year-old banded iron formation within the Barberton Greenstone Belt in South Africa. Using scanning electron microscopy, energy-dispersive X-ray spectroscopy, and Raman spectroscopy, we establish a direct association between these CMs and the magnetite. Although the possibility that CMs formed from the hydrothermal decomposition of siderite cannot be ruled out, several lines of evidence indicate a likely microbial origin for the CMs. Firstly, Raman spectroscopy reveals that the CMs exhibit characteristics of low-maturity biogenic organic matter (OM) featuring aliphatic carbon chains, which supports the notion that organic carbon compounds mature during burial metamorphism at temperatures below approximately 200 °C. Secondly, phosphorus and sulfur detected in the CMs suggest a microbial origin. Lastly, the formation of the unique texture of core-rim magnetite can be conceptualized as follows: Fe2+ is oxidized through anoxygenic photosynthesis, leading to the precipitation of ferrihydrite. This ferrihydrite is then transformed into magnetite by iron-reducing microorganisms. Subsequently, the magnetite grows larger through oriented attachment, which also confines OM. Ultimately, smooth magnetite rims may have preserved the OM for up to 3.2 billion years.

1. Introduction

Banded iron formations (BIFs) are chemical sedimentary rocks characterized by alternating bands of iron- and silica-rich materials. They primarily occur in Archean and Proterozoic rocks [1]. The iron-bearing minerals found in BIFs commonly include iron oxides such as hematite and magnetite; carbonates like siderite, Fe-dolomite, and ankerite; silicates such as greenalite, minnesotaite, stilpnomelane, and riebeckite; and, locally, iron sulfide such as pyrite [1,2]. These iron-bearing minerals formed during diagenesis and metamorphic processes from a precursor are generally believed to be ferric oxyhydroxides, such as ferrihydrite, although direct precipitation pathways are also considered to be possible [2,3]. Recent studies suggest that nano-scale to submicrometer-sized hematite forms through the dehydration of ferric oxyhydroxide precursors [4,5]. Furthermore, it is estimated that iron silicates, particularly greenalite, are primary minerals precipitated in seawater (e.g., [3,6]).
It is widely accepted that iron precipitation by microorganisms in the ocean is a possible mechanism for the deposition of BIFs [7,8,9,10]. The emergence of oxygenic photosynthesis before the Great Oxidation Event (~2.5 Ga) is supported by several geochemical proxies and phylogenetic analyses which indicate its role in the oxidation of ferrous iron through atmospheric oxygen production (e.g., [11,12,13]). Anoxygenic photosynthesis may have evolved and contributed to iron sequestration before, or even after, the emergence of oxygenic photosynthesis [14,15,16,17]. Several experiments have demonstrated direct iron oxidation coupled with microbial carbon fixation by purple bacteria, purple sulfur bacteria, and green sulfur bacteria (e.g., [8,16,18,19]).
The association of organic matter (OM) with iron minerals is expected in BIFs, based on the assumption that these sediments were precipitated by microorganisms [20]. However, the lack of fossils and the generally low carbon content in BIFs [21,22] challenge this hypothesis. One explanation for this discrepancy is the loss of dissolved carbon resulting from the oxidation of OM coupled with the reduction in iron during burial [20,23]. The microbial oxidation of OM is supported by studies analyzing carbon isotopes in carbonate minerals found in BIFs [23,24]. Furthermore, biological experiments suggest that the dissociation of biomass from iron precipitates prior to sedimentation also contributes to the observed lower carbon-to-iron ratio [22], which is stoichiometrically expected in microbial precipitation processes [8,20].
Carbonaceous particles closely associated with magnetite crystals have been reported from a BIF in the ~3.2 Ga Moodies Group [25]. The close association of these carbonaceous particles with magnetite supports the hypothesis that anoxygenic phototrophic microorganisms oxidize ferrous iron, leading to the precipitation of ferric oxyhydroxide precursors. However, the detailed characteristics of the carbonaceous particles, including their crystalline or amorphous nature and the level of organic maturity if they are of biological origin, remain unknown, as these particles were identified solely through EDS. Additionally, the possibility of an abiotic origin, such as the hydrothermal decomposition of siderite into magnetite and organic carbon compounds, cannot be excluded, as discussed by Bontognali et al. [25].
We identified a unique texture for the core-rim magnetite in a thin section sample of a banded iron formation (BIF) from the Barberton Greenstone Belt (BGB) in South Africa, characterized by a core that contains carbonaceous materials (CMs). We will present the results of our characterization of the CMs using scanning electron microscopy–energy-dispersive X-ray spectroscopy (SEM–EDS) and Raman spectroscopy. Additionally, we will discuss the origins of these CMs and the formation process of the distinctive core-rim magnetite.
In this paper, we use the term ’Carbonaceous Materials’ (CMs) to refer to carbonaceous materials of an unknown origin, whether biogenic or inorganic, and ’Organic Matter’ (OM) to specifically denote biogenic carbonaceous materials.

2. Materials and Methods

2.1. Barberton BIF

The BIF sample examined in this study originates from the BGB in South Africa. It was collected over 25 years ago by Marco Frigerio from Classic Rocks and Gems in Germany at a roadside outcrop, which he identified as belonging to the Moodies Group, a component of the Barberton Supergroup. Unfortunately, the exact location of this sample is unknown. Since we cannot determine the precise location of the collected sample, we are unable to address the criticism that it may have originated from the Fig Tree Group.
The Barberton Supergroup is well known for its exceptional preservation of mid-Archean strata, exhibiting minimal signs of high-grade metamorphic alteration. This supergroup is divided into three primary stratigraphic units: the Onverwacht Group, the Fig Tree Group, and the Moodies Group. As the uppermost and most recent unit, the Moodies Group is a vital part of the volcanic-sedimentary sequence that constitutes the BGB, recognized as the largest and best-preserved greenstone belt in the basement of the Kaapvaal Craton. The Moodies Group extends approximately 110 km in strike length and 40 km in width, with its base defined by the top of the underlying Fig Tree Group or older rocks from the Onverwacht Group; its upper boundary remains unexposed. Predominantly composed of fine- to coarse-grained quartzose sandstones, the Moodies Group reaches thicknesses of up to 3.6 km, interspersed with significant units of conglomerates, siltstones, and minor volcanic rocks and ferruginous sediments, including BIFs. The strata were deposited in a variety of environments, including alluvial, fluvial, deltaic, tidal, and shallow-marine settings, with some deposition occurring syndeformationally [26].
According to Bonnand et al. [27], the deposition of the Moodies Group occurred after the dacitic volcanics that conformably underlie its basal layers, which have been dated at approximately 3225 ± 3 Ma and 3223 ± 1 Ma [28,29]. Additionally, dacitic ash-fall tuffs found in the central BGB near the BIF unit MdI2 have been dated at 3219 ± 3 Ma [28]. This age is consistent with that of a porphyritic dike that cuts through the uppermost layers of the Moodies Group, also dated to 3219 ± 9 Ma [28]. Consequently, it can be inferred that the deposition of the Moodies Group took place approximately between 3223 and 3219 Ma, likely around 3222 Ma ago. The regional metamorphic grade is classified as lower greenschist facies, with evidence of metamorphic overprints occurring during at least three significant events: (1) the emplacement of the Kaap Valley Pluton at 3214 ± 4 Ma, (2) late granite plutonism around 3100 Ma [30], and (3) fluid circulation associated with volcanism from the Ventersdorp Supergroup or the Limpopo orogeny, approximately 2650–2700 Ma ago [31]. The maximum burial temperatures are estimated to be around 220 °C [25,31,32].
According to the previous literature [26,27,33,34], the Moodies Group consists of four distinct, mappable BIFs. The MdI1 and MdI2 BIFs are the most extensively exposed, with MdI2 also being identified south of the Inyoka Fault. In contrast, MdI3 and MdI4 have only been documented within the Saddleback Syncline. MdI1 is situated within tuffaceous sandstones and siltstones of the MdS1 unit, which extend between 400 and 1000 m thick in a below-wavebase prodelta environment. The MdI2 BIF is located above the Moodies basalt lava (MdL), which rests atop the coarse-grained quartz arenite (MdQ2). In the Saddleback Syncline, thick gravelly, cross-bedded sandstone with mud-cracked shale coatings, conglomerate, and minor tuffaceous siltstone (MdS2) overlie the MdI2.
The Fig Tree Group consists of four divisions: the Loenen Formation, the Ngwenya Formation, the Mapepe Formation, and the Auber Villiers Formation. It encompasses various components, including deep- to shallow-water shale, greywacke, BIF, and carbonaceous chert. This sequence exceeds 1200 m in thickness and is exposed as tectonically duplicated yet stratigraphically distinct tectono-stratigraphic units. According to Condie et al. [35], the mineralogy of the Fig Tree Group suggests that these rocks have experienced a maximum metamorphic alteration within the lower greenschist facies. The chemical weathering of the source terrain for the Fig Tree strata was limited. In contrast, the sedimentary rocks experienced significant influence from hydrothermal–metasomatic processes [36]. The Ngwenya Formation, located south of the Inyoka Fault, is characterized by its jaspilitic BIF, which overlies the Loenen Formation, while the Mapepe Formation is situated above the Ngwenya Formation [36]. Zircon dating from the Mapepe Formation ranges from 3260 to 3230 million years ago [29].

2.2. SEM

The polished thin section, which was not carbon coated, was examined using the JEOL IT-100 Scanning Electron Microscope (Tokyo, Japan) at an accelerating voltage of 15 kV. This microscope is equipped with EDS for detailed analysis.

2.3. Raman Spectroscopy

The Raman spectra were acquired from the polished thin section using the NRS-3100 Raman spectrometer (JASCO Corporation, Tokyo, Japan) with an excitation wavelength of 532 nm provided by an argon laser. The spot size was set to 1 µm, employing a 100× objective lens, and the laser power was approximately 0.1 mW to prevent alteration of the iron minerals. Exposure times ranged from 240 to 360 s, with a spectral resolution of about 4 cm−1. Calibration of the Raman shift was conducted using bands of a polypropylene standard. Peak fitting to determine the Raman band parameters was carried out using OriginPro 2024 software (OriginLab Corporation, Northampton, MA, USA). The fitting process commenced with initial peak positions corresponding to the major peak maxima, utilizing a Lorentzian function. To improve fitting accuracy and convergence, use of a Gaussian function and the inclusion of discernible shoulder peaks were evaluated. The adjusted R2 values, which indicate the goodness of fit, were greater than 0.99 for all fitting results presented in this paper.

3. Results

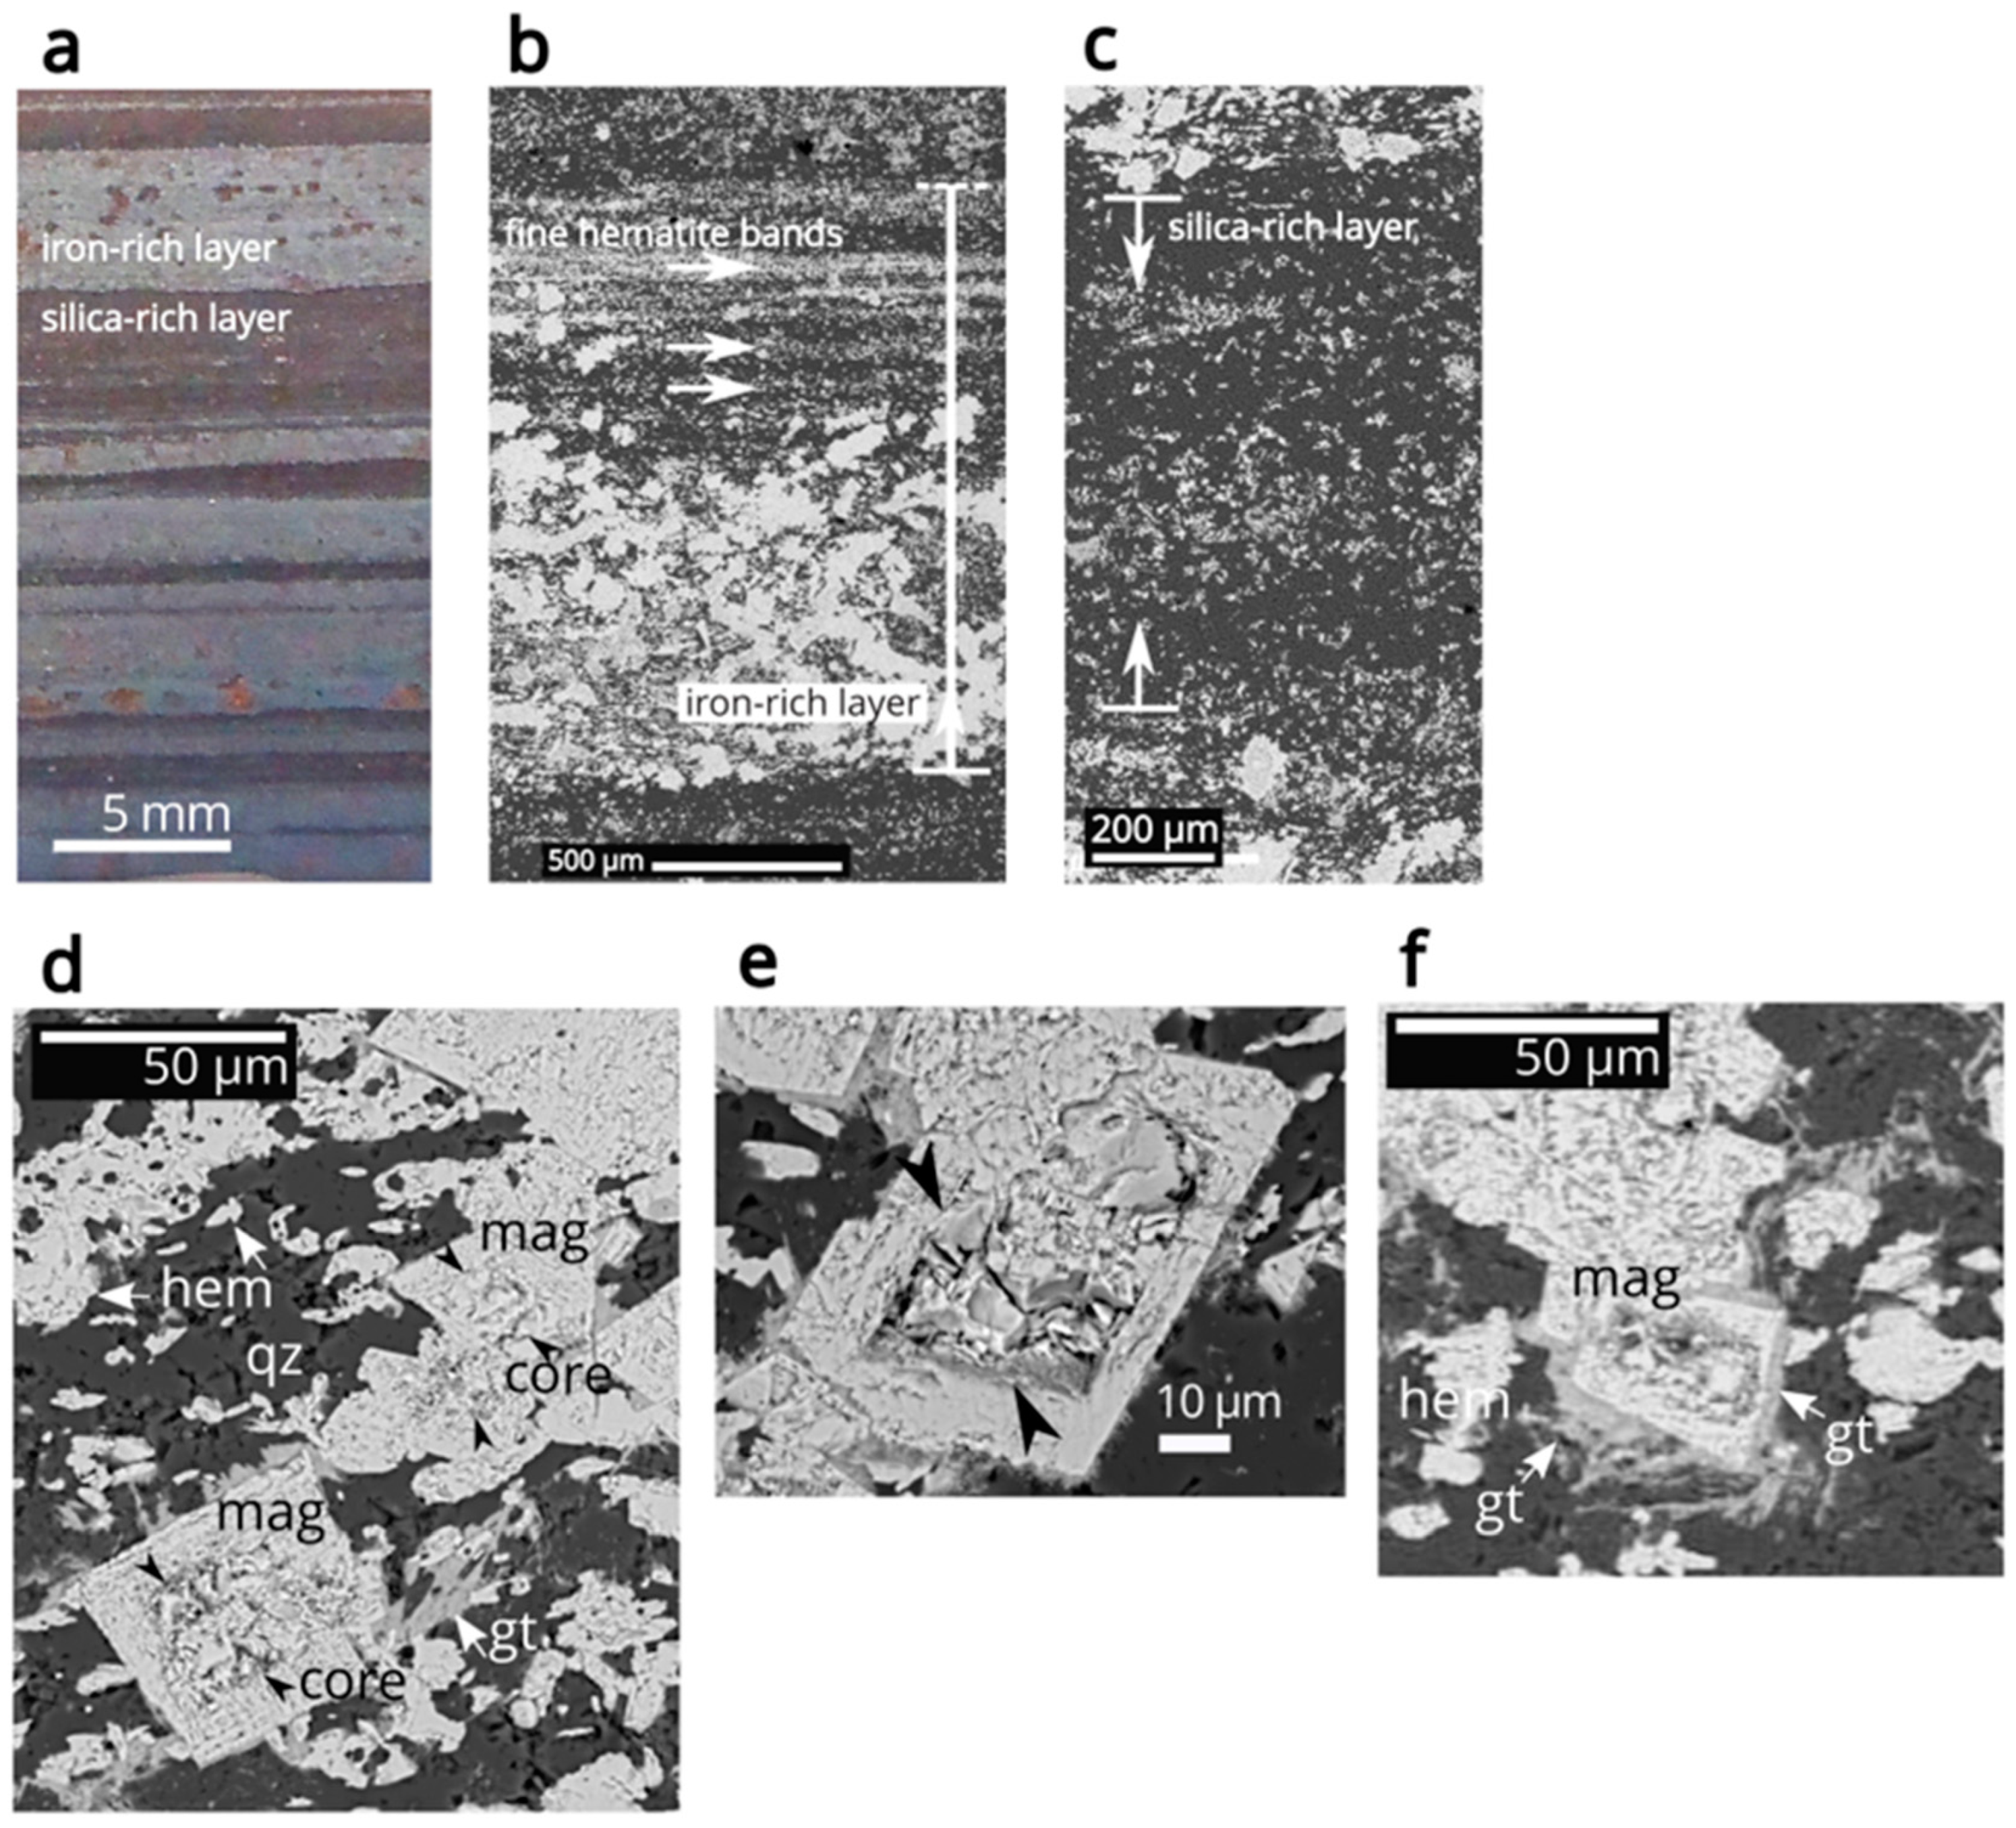
3.1. SEM and Optical Microscopy in Petrography

The thin section reveals alternating darker- and lighter-colored layers when examined with the naked eye and under an optical microscope (Figure 1a). In this figure, iron-rich zones manifest as lighter layers due to the reflection of light from metallic iron minerals, while silica-rich zones appear as darker layers. Thus, we define these layers as iron-rich and silica-rich based on their coloration, as described below.
Dispersed iron oxides form distinct layers within the chert matrix, with thicknesses ranging from tens of micrometers to a few millimeters (Figure 1a,b). The iron-rich layers contain polygonal euhedral crystals identified as oxidized magnetite, as confirmed by the presence of both magnetite and hematite bands in Raman spectroscopic measurements. These euhedral crystals exhibit incomplete oxidation, characterized by a core with a rough surface or cracks, alongside an oxidized rim that has a smooth surface (Figure 1d–f). The oxidized magnetite crystals range in diameter from 5 to 50 µm and are prominently encircled by a thick rim of goethite (Figure 1f). Fibrous goethite typically radiates outward from both the rim of the goethite and the surface of the oxidized magnetite (Figure 1f). This fibrous goethite also overgrows hematite aggregates and disperses throughout the chert matrix.
In the iron-rich layers, hematite particles exhibit elongated or platy shapes, reaching sizes of up to 10 µm, and are distributed independently without any association with magnetite (Figure 1d). These hematite particles often cluster together, forming aggregates that can measure up to tens of micrometers in size. Additionally, hematite microgranules form finer bands, particularly near the boundary between the iron-rich and silica-rich layers (Figure 1b).
The silica-rich layers, composed of chert, gradually transition into the matrix of the iron-rich layers in certain areas, as illustrated in the lower section of the silica-rich layer in the BSE image shown in Figure 1c. Fine anhedral hematite particles are thinly dispersed throughout the silica-rich layer.

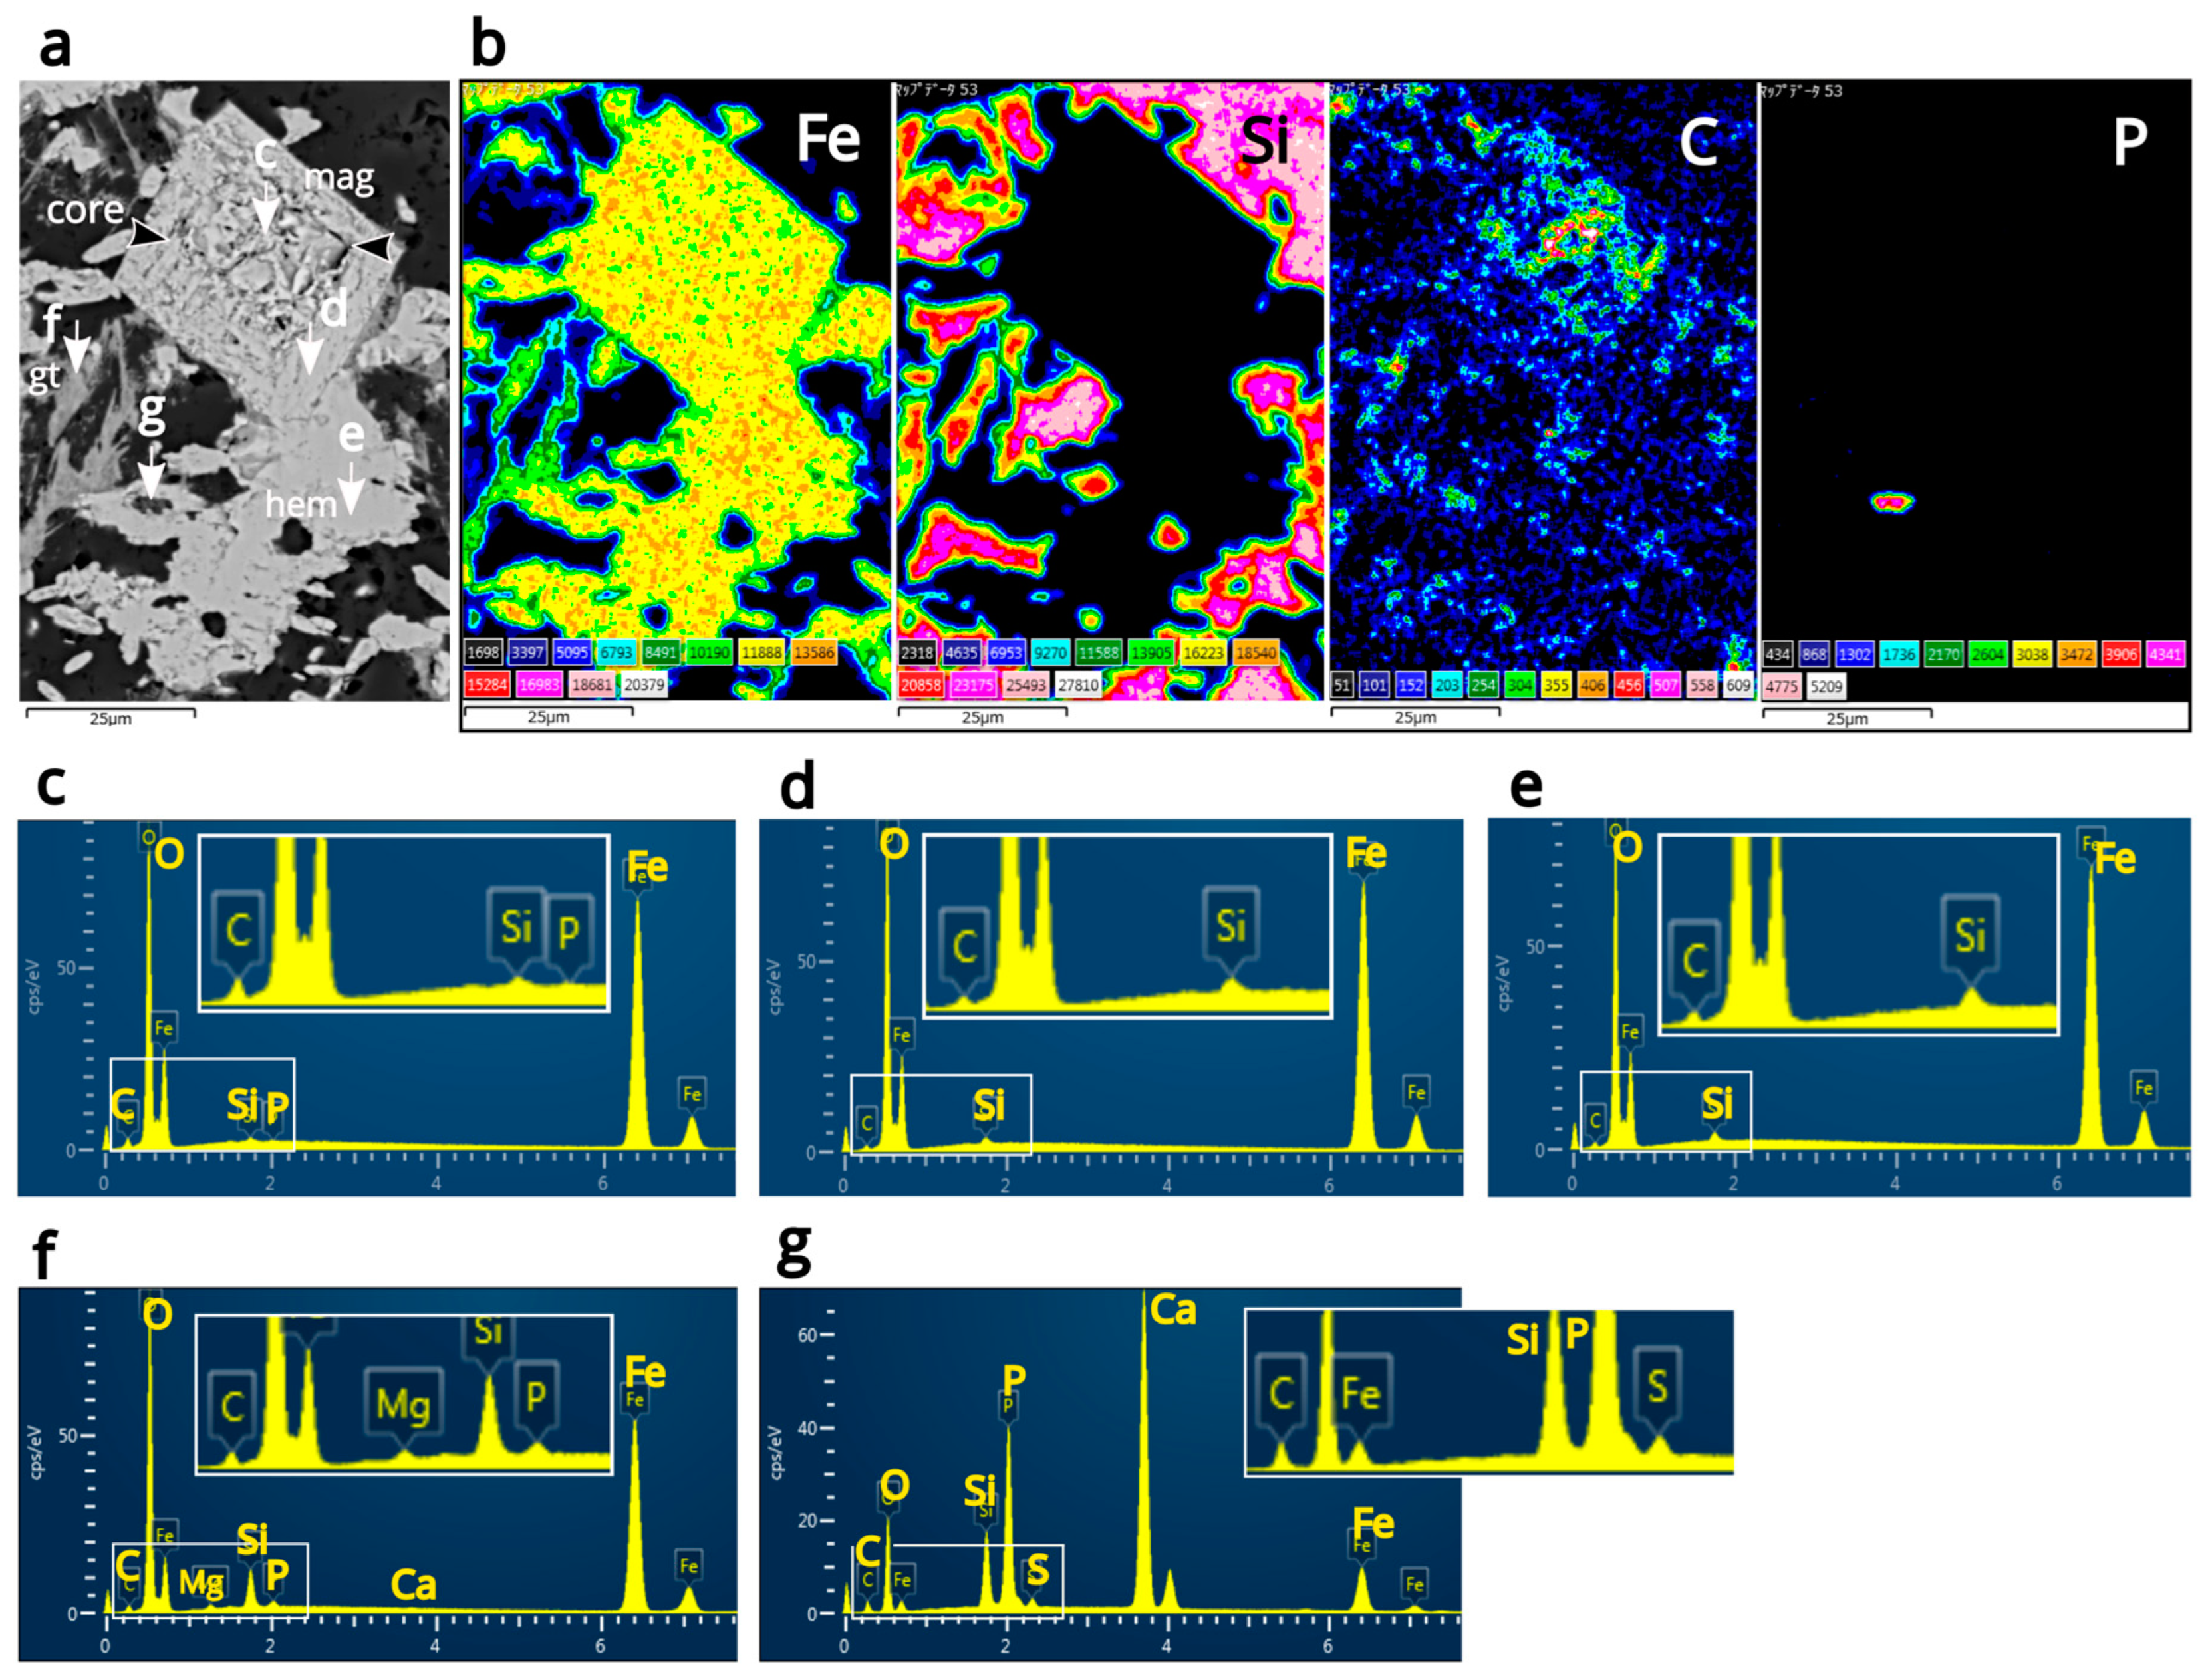
3.2. Elemental Analysis via SEM-EDS
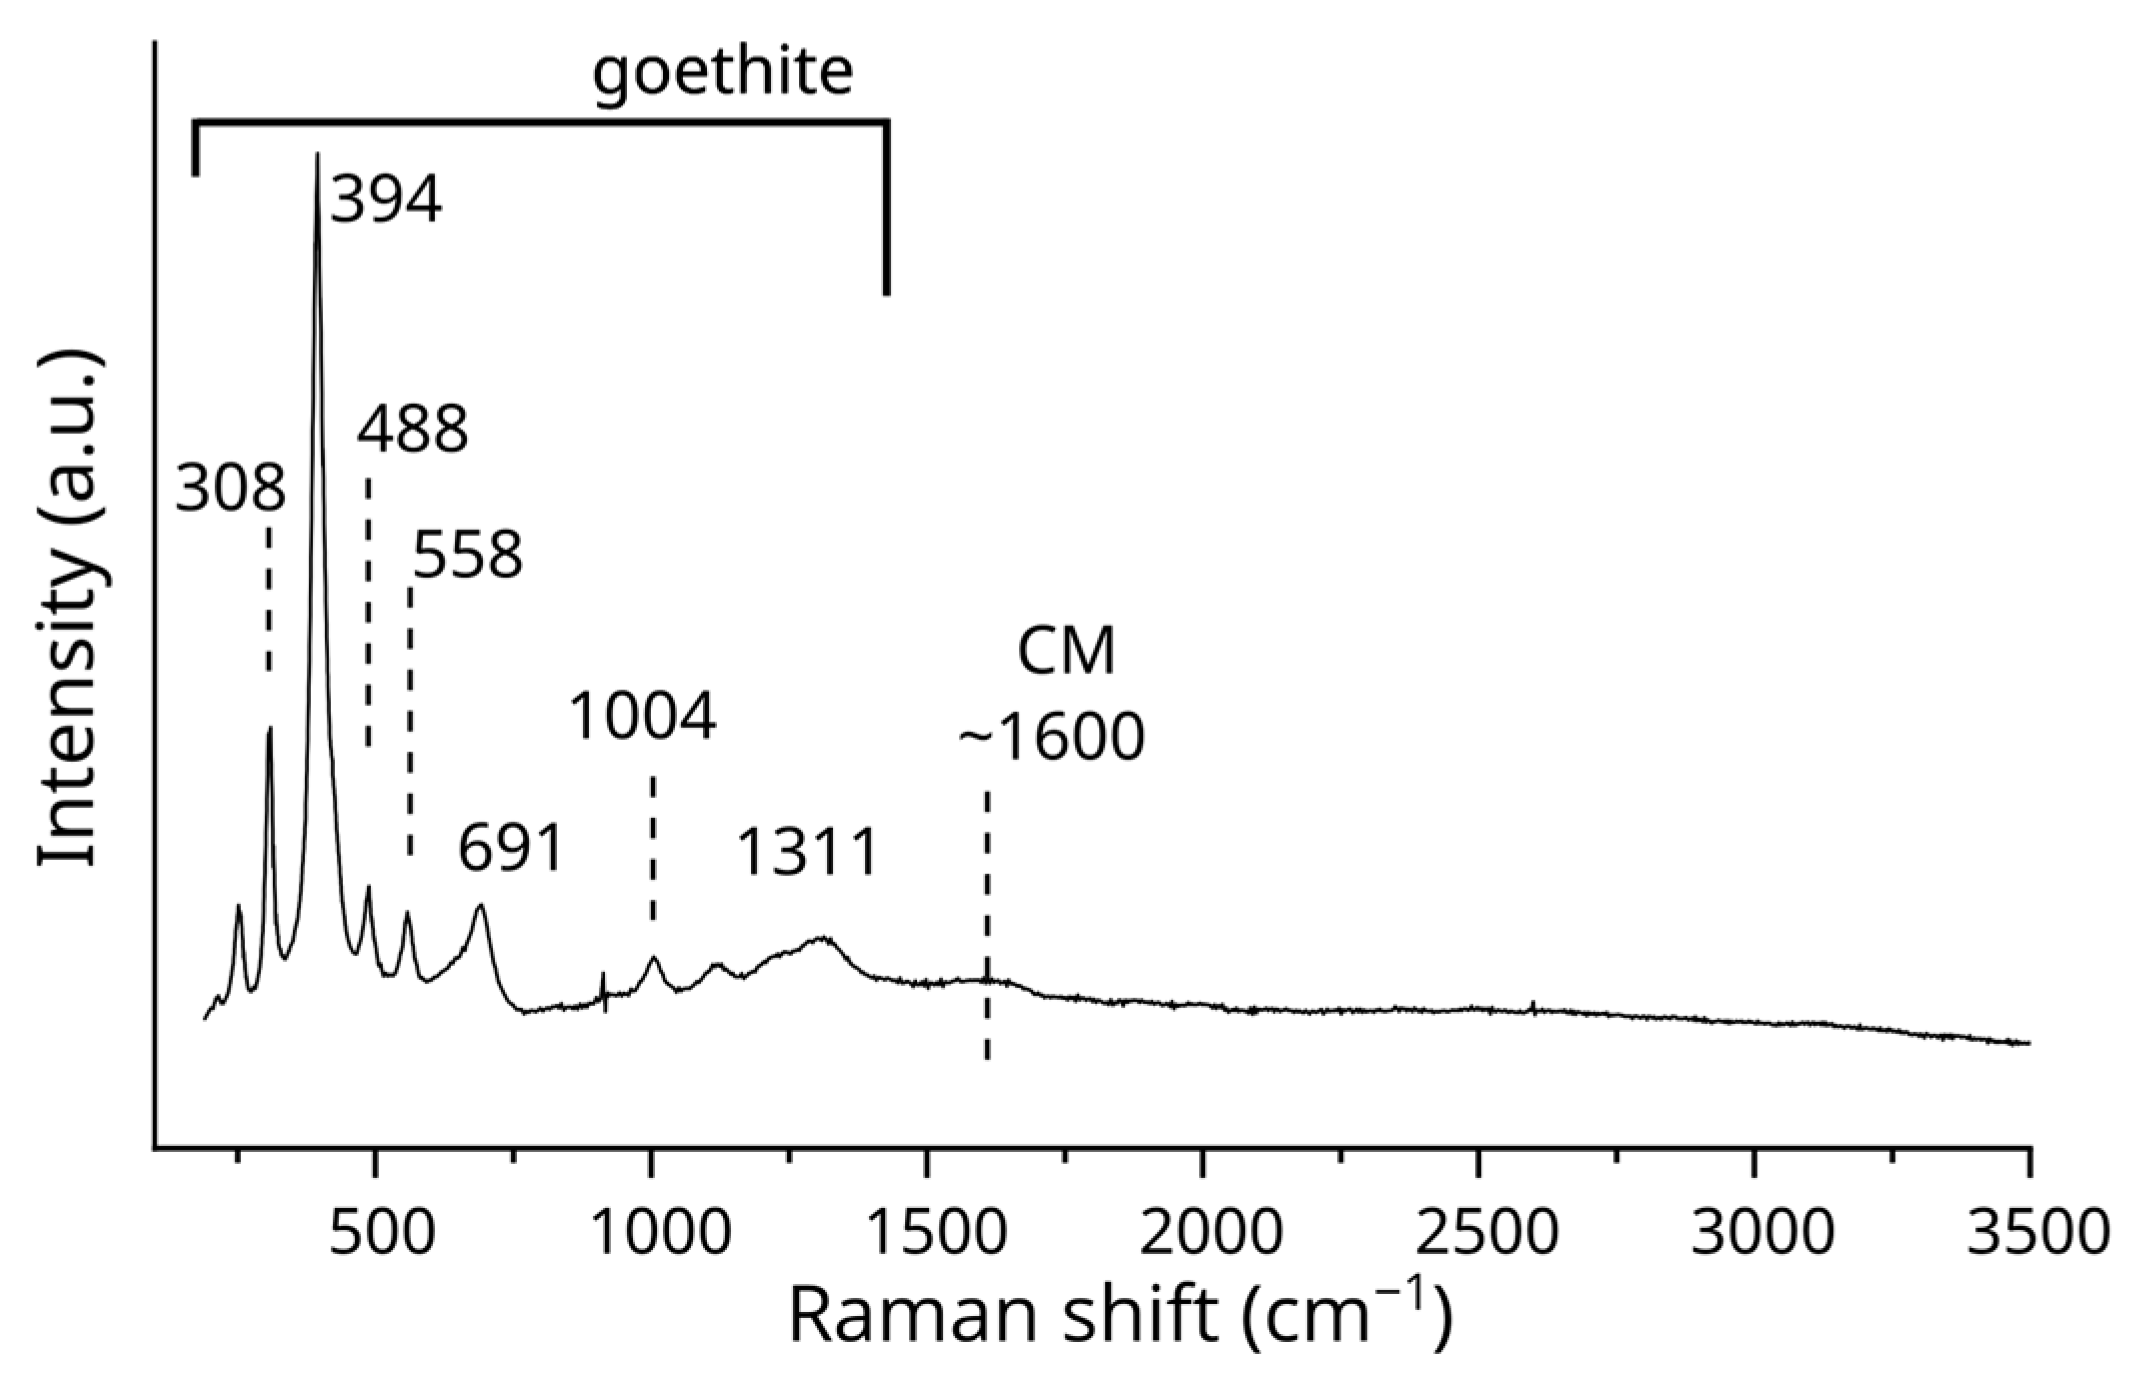
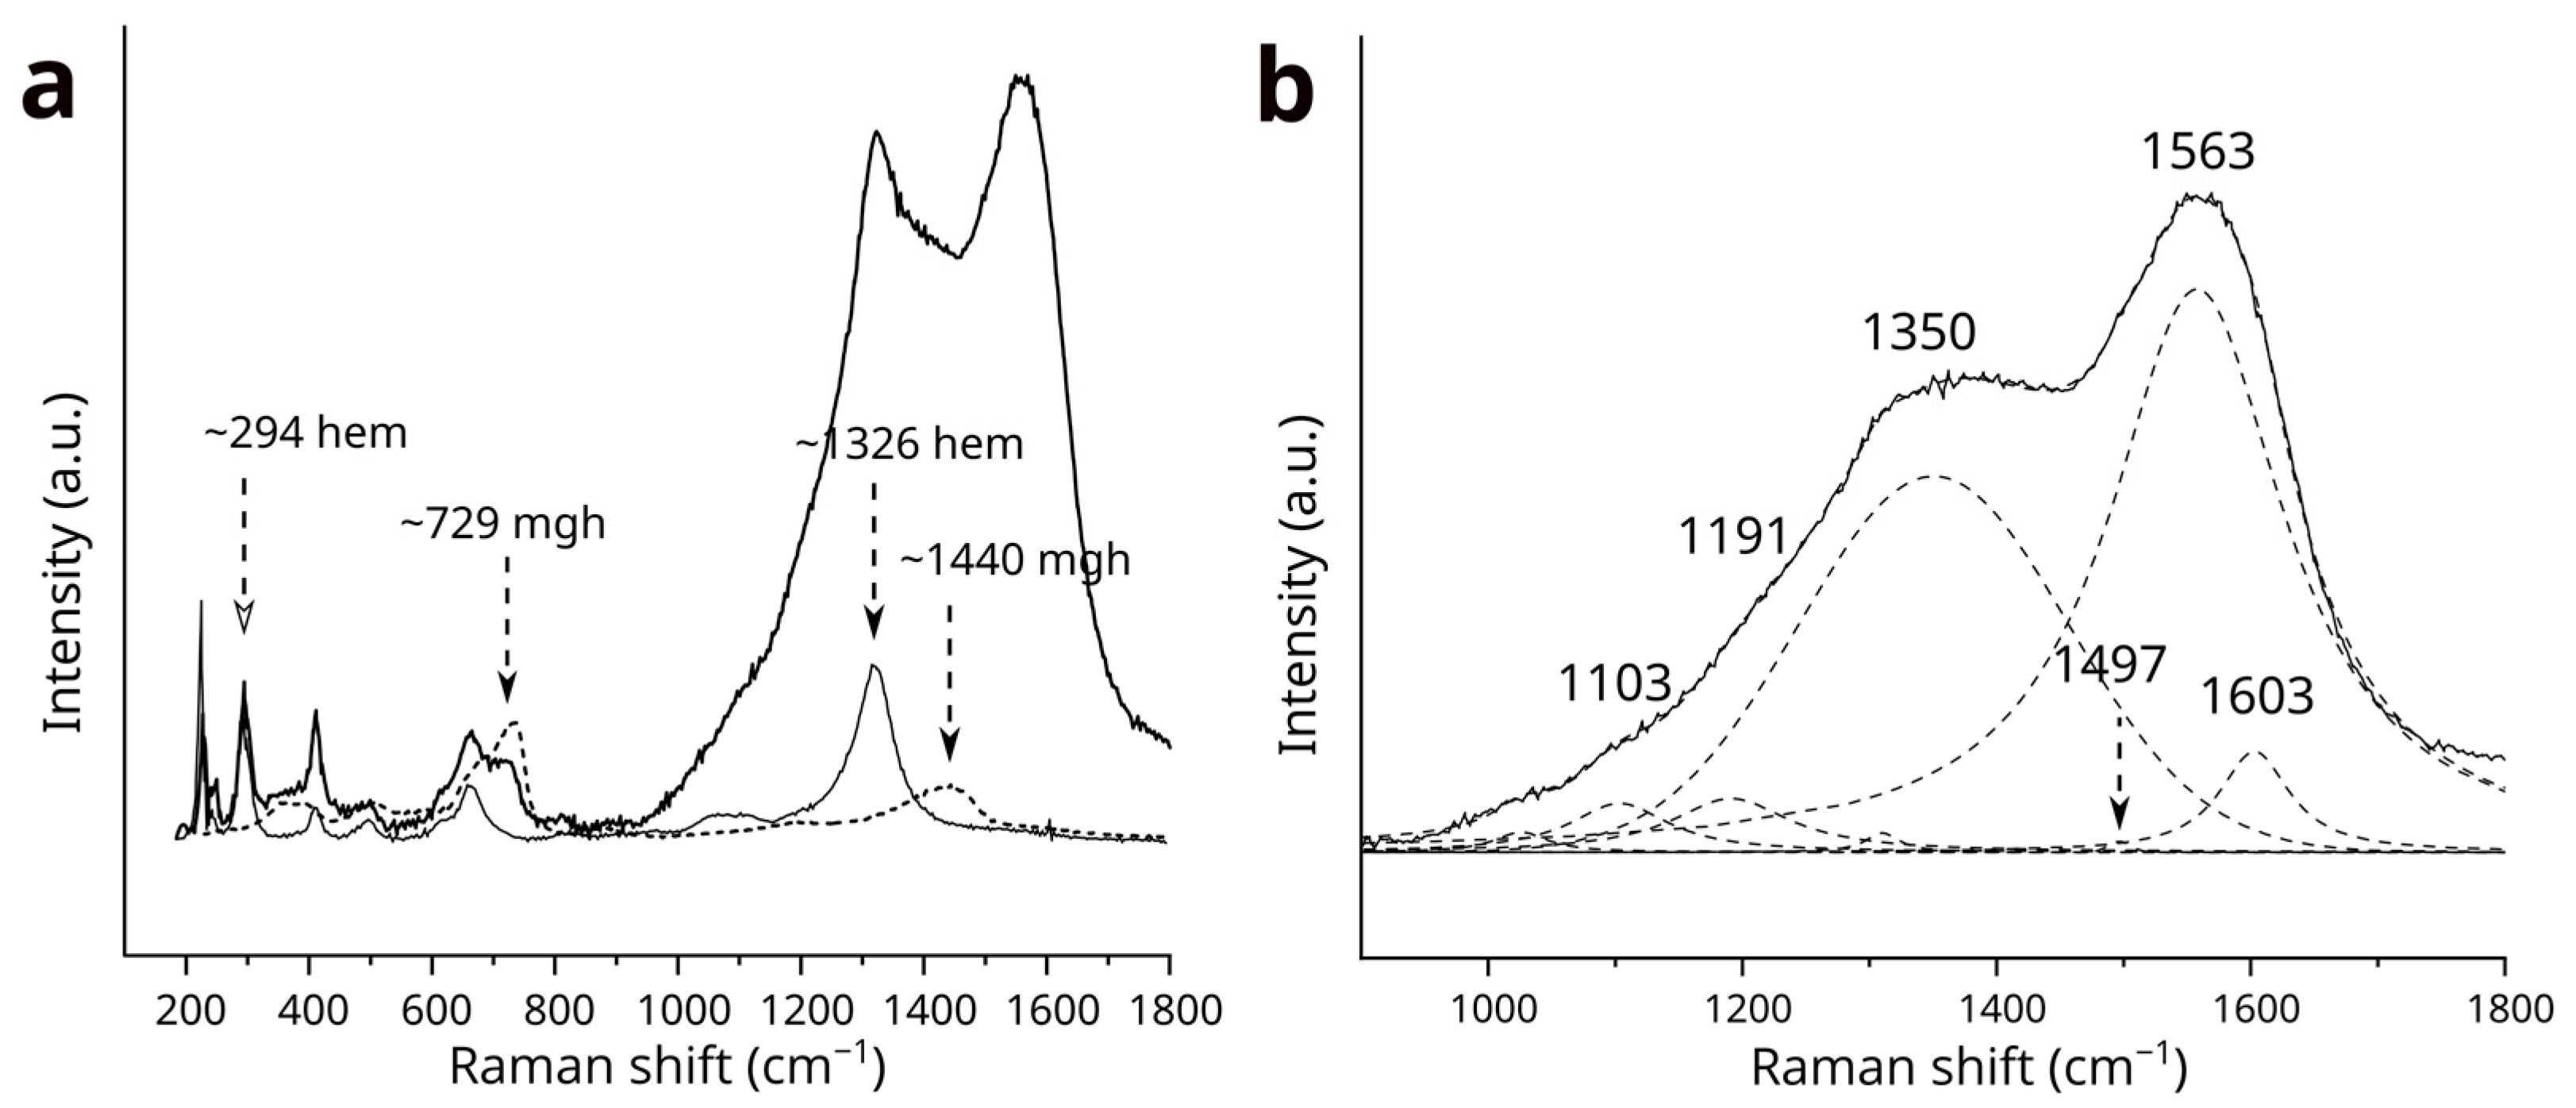
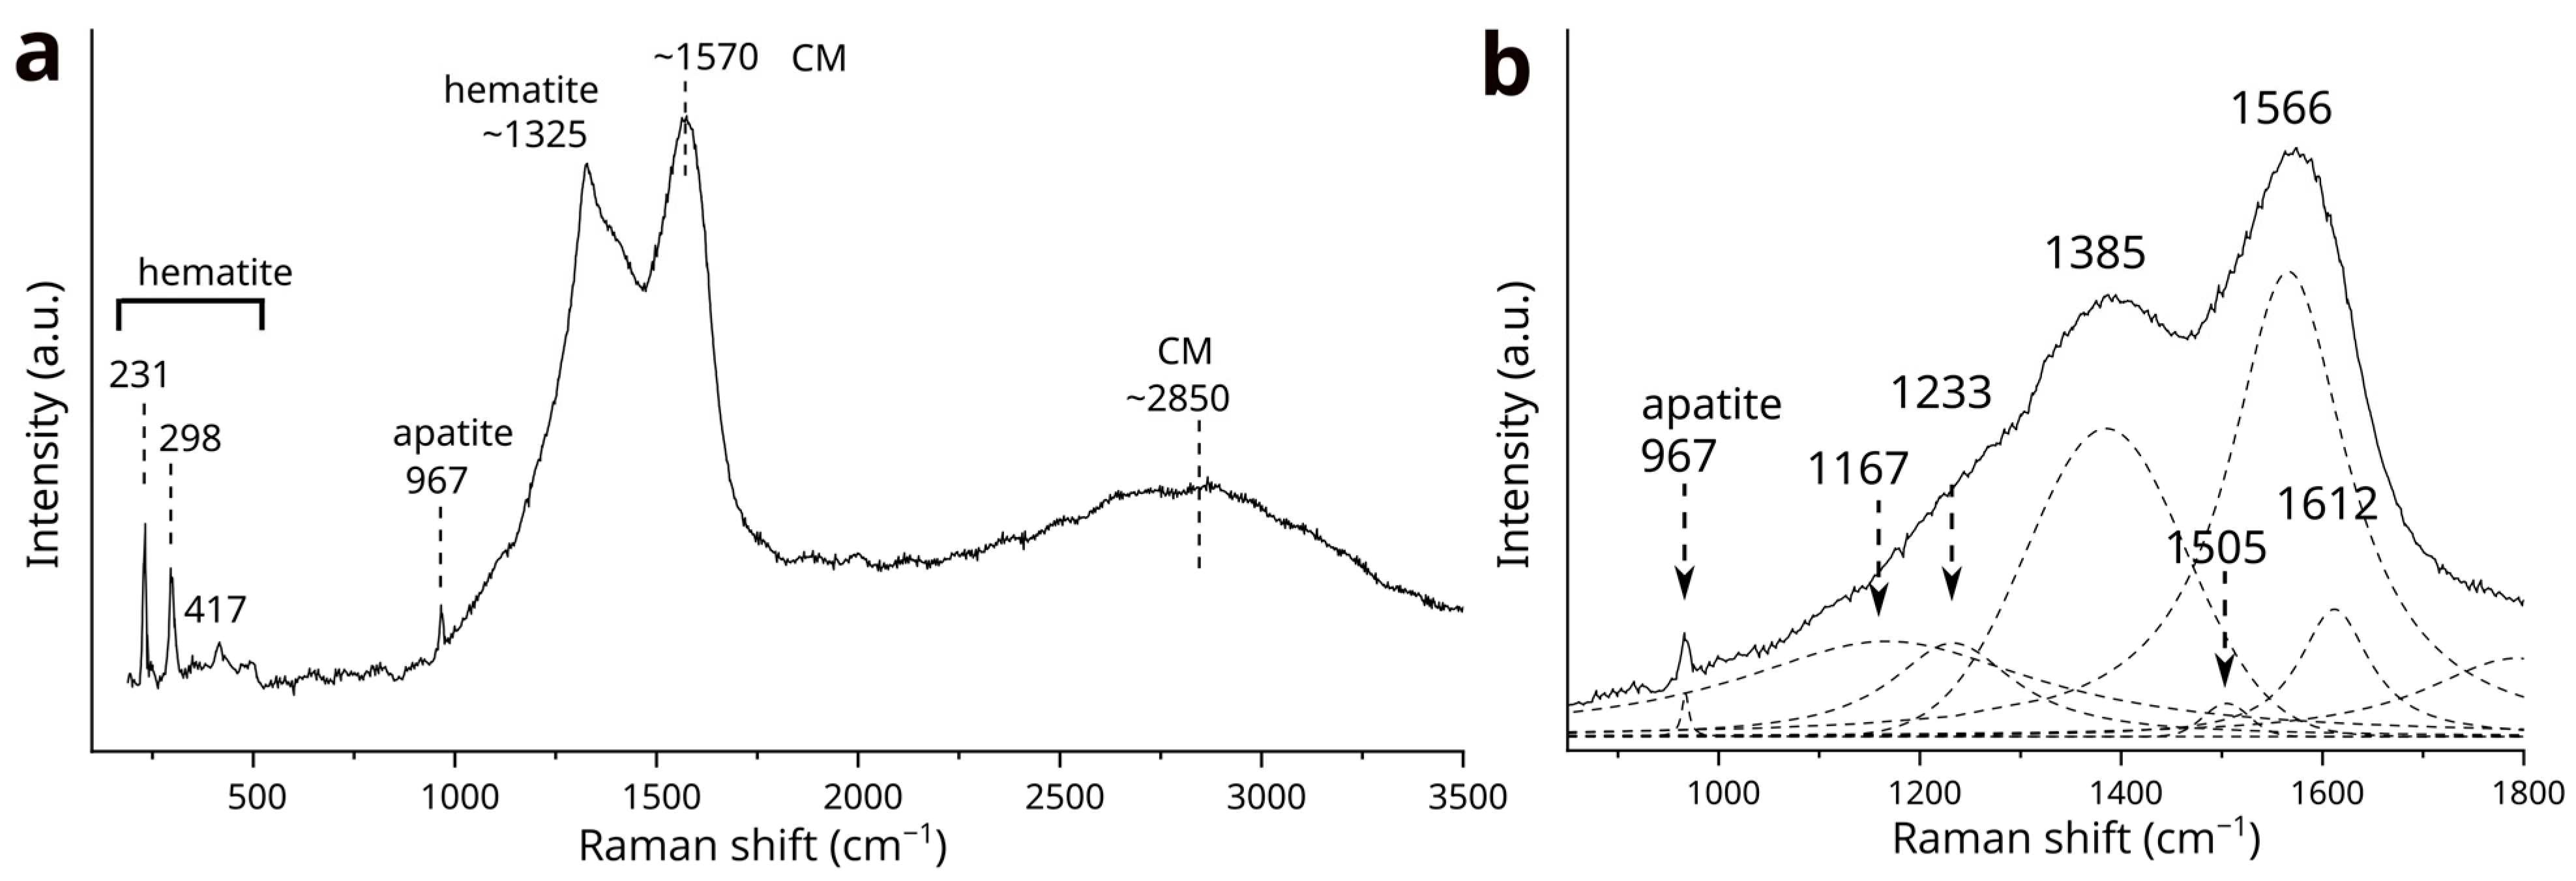
Carbon is primarily concentrated in the oxidized magnetite core, with additional carbon being detected in the oxidized magnetite rim, hematite, and goethite through SEM-EDS mapping and point analyses (Figure 2a,b). Point analyses also revealed the presence of silicon in both the core and rim of the oxidized magnetite (Figure 2c,d). A trace of phosphorus was detected specifically in the core of the magnetite (Figure 2c). Hematite aggregates also showed silicon content (Figure 2e). Additionally, point analyses on goethite detected magnesium, phosphorus, and calcium (Figure 2f). The high intensity of silicon in goethite is attributed to surrounding quartz. Phosphorus and calcium were detected within the iron-rich layer in both mapping and point analyses (Figure 2b,g), further confirming their origin from apatite using Raman spectroscopy. It is unclear whether the apatite is a single crystal or multiple crystals; however, it is surrounded by hematite aggregates, and sulfur has been identified within it (Figure 2g).

3.3. Raman Spectra

Raman spectra reveal distinct compositional differences in iron minerals between the core and rim of oxidized magnetite crystals (Figure 3). The rim of the oxidized magnetite features both magnetite and hematite, with notable magnetite bands at 669 cm−1 and hematite bands at 231, 250, 297, 417, 504, 621, 827, and 1326 cm−1 (Figure 3a). Additionally, a broad component around 1084 cm−1 and a shoulder at 1228 cm−1 have been identified as features associated with hematite bands. In contrast, the spectrum from the oxidized magnetite core displays a magnetite band at 686 cm−1 which overlapped on the maghemite band. Additionally, maghemite bands are observed at 365, 498, 576, 729, 868, 1195, 1383, and 1443cm−1 (Figure 3b). The magnon mode band of maghemite, noted to occur around 1400 cm−1 in several studies (e.g., [37]), exhibits an asymmetric shape in our analysis, with a local maximum at 1430 cm−1. Hematite was also detected in the oxidized magnetite cores in several instances (Figure 3c).
The relative intensity of the band at approximately 1570 cm−1 for CMs, when compared to iron oxides, varies across different analytical points within both the oxidized magnetite core and its rim. The oxidized magnetite core, which displays a concentration of carbon, as indicated by EDS mapping, shows significant intensity in Raman bands at 1325 and 1562 cm−1, along with a broad band near ~2850 cm−1 (Figure 3c). The 1325 cm−1 band overlaps with hematite, as described in the following paragraphs. These features in the first-order region (1000–1800 cm−1) and the second-order region (2400–3500 cm−1) are attributed to CMs. In contrast, the Raman spectrum of goethite displays only a faint band at ~1600 cm−1 corresponding to CMs (Figure 4) despite the presence of carbon, as observed in the goethite through SEM-EDS analysis.
The Raman bands from hematite, maghemite, and CMs in the 1000-1800 cm−1 region show significant overlap (Figure 3). To confirm the significance of the bands attributed to OM and to analyze their parameters, the Raman spectra of hematite (Figure 3a) and maghemite (Figure 3b) were subtracted from the spectrum of the CM-rich oxidized magnetite core (Figure 3c). For this subtraction, the spectra were normalized using the intensity of the well-established fitted band at 294 cm−1 for hematite and the fitted band at 729 cm−1 for maghemite (Figure 5a). The consistency of the band intensity ratios 294 cm−1/1326 cm−1 for hematite and 729 cm−1/1400 cm−1 for maghemite was confirmed through multiple analyses of both the rim and core. The residual spectrum in the 1000–1800 cm−1 region indicates successful removal of the hematite band at 1326 cm−1 (Figure 5b), while the contribution from maghemite is found to be minimal.
The first-order region of the residual spectrum for the oxidized magnetite core was fitted with bands characteristic of OM (Figure 5b), with positions and nomenclature similar to those proposed by Henry et al. [38]. The band at 1350 cm−1 is identified as the D1-band, which corresponds to disordered amorphous OM and is attributed to in-plane defects such as heteroatoms or structural defects [39]. The band fitted at 1557 cm−1 is assigned to the G-band, which is related to the in-plane vibrations of carbon atoms in graphene sheets [38]. The component at 1191 cm−1 is assigned to the D4-band, which corresponds to aliphatic hydrocarbon chains [40]. The band at 1103 cm−1 is referred to as a component of D4–D5 (1100–1300 cm−1) region [40]. The band at 1603 cm−1 is attributed to the D2-band, fitted to identify a slight shoulder on the G-band, indicative of low-ordered CMs [38]. Additionally, the small component at 1497 cm−1 is recognized as the D3-band, which occurs in low-ordered carbons and is attributed to defects outside the plane of aromatic layers, such as tetrahedral carbons [39,41]. The full width at half maximum (FWHM) for the D1-band (D1-FWHM) and the G-band (G-FWHM) are 250 cm−1 and 169 cm−1, respectively. The Raman band separation (RBS) between the D1-and G-bands (G–D1) is 208 cm−1. In the second-order region, the Raman bands show a single broad feature centered at approximately 2850 cm−1.
At the analytical point where phosphorus and calcium were detected by SEM-EDS, the Raman band of apatite at 967 cm−1 was observed (Figure 6a). The spectral features of OM are very similar to those found in the oxidized magnetite core, although no evidence of maghemite is present. Hematite is inevitably detected, with the band at ~1325 cm−1 overlapping the first-order region of OM. The subtracted spectrum (Figure 6b), obtained using the same procedure as for the oxidized magnetite core, yielded fitted bands at 1385 cm−1 (D1), 1566 cm−1 (G), 1612 cm−1 (D2), 1505 cm−1 (D3), and 1167–1233 cm−1 (D4). The FWHM for the D1- and G-bands are 186 cm−1 and 143 cm−1, respectively, while the RBS is 181 cm−1.

4. Discussion

4.1. Raman Spectroscopy Analysis of CMs

The use of Raman spectroscopy to analyze CMs can provide valuable insights into the maturity of CMs. In this study, we characterize the Raman spectra of CMs in our sample and compare these features with published data on organic materials found in sediments. This comparison allows us to estimate the maturity levels and temperature, assuming that the CMs in our sample are of biological origin.
Raman parameters obtained from OM have been shown to correlate with vitrinite reflectance (VR0), which is an important indicator of organic maturity (e.g., [38,42,43]). Henry et al. [38] summarize that, while the absolute values between studies may not be directly comparable, there exists a general trend in the relationships between certain Raman parameters and VR0 values. Specifically, the full width at half maximum (FWHM) of the G-band displays a significant decrease as VR0 increases. The G-band FWHM results of 169 cm−1 from the CMs in the magnetite core and 143 cm−1 from the CMs associated with apatite are comparable to previously reported values of approximately 140 cm−1 for VR0 below 0.5% and around 120 cm−1 for VR0 below 1.0% [42,43]. These values indicate the widest G-band features and the lowest maturity levels reported for Raman parameters of OM [38].
The analysis of FWHM for the D1-band further confirms the trends observed in the G-band; however, this parameter shows less sensitivity to changes in VR0 [38]. Another sensitive parameter, known as Raman band separation (RBS), increases with rising VR0 [38]. Our results indicate RBS values of 208 cm−1 from the CMs in the magnetite core and 181 cm−1 from the CMs associated with apatite. Using the linear correlation established by Bonoldi et al. [44], an RBS value of 208 cm−1 corresponds to a VR0 value of 1.1%, while an RBS value of 181 cm−1 corresponds to 0.14%. These values represent the minimum range of RBS values identified by Bonoldi et al. [44]
The D4 band, identified as a shoulder on the D1 band, is characteristic of low-maturity OM and disappears in more mature graphitic materials. [40]. Additionally, we identified a component centered at 1103 cm−1 that is similar to those reported by Ferralis et al. [40]. The components at 1103 and 1191 cm−1 correspond to the aliphatic carbon chain, as evidenced by significant contributions from C-C stretching in the range of 1060–1180 cm−1 [40,45].
In the second-order region, the Raman spectrum exhibits a single broad band centered at 2850 cm−1, further indicating low-mature OM. As maturation increases, four additional bands (S1-S4 at 2450, 2700, 2950, and 3200 cm−1, respectively) become distinguishable, especially from the anthracite stage (>2.0% VR0) [38].
In summary, both the CMs detected in the magnetite core and those associated with apatite exhibit two reliable Raman parameters, G-FWHM and RBS, which indicate a VR0 value below 1.1% and reflect maturity levels during diagenetic (0–0.6% VR0) and catagenetic (0.6–2.0% VR0) processes [38]. The VR0 value can be directly translated to the peak temperature, based on the concept that the evolution of VR0 is stabilized after about 20–30 million years at a given temperature [46]. Using the model by Barker and Pawlewicz [34], a VR0 value of 1.1% corresponding to an RBS value of 208 cm−1 from the CMs in the magnetite core yields 143 °C for burial heating and 164 °C for hydrothermal metamorphism (at a higher heating rate). Additional features of the Raman spectra, such as D1-FWHM, the presence of D4-band regions, and characteristics in the second-order region, corroborate the results from G-FWHM and RBS.

4.2. Origin of CMs

Bontognali et al. [25] observed that CMs were closely associated with magnetite crystals; however, they could not rule out the possibility that magnetite and organic carbon compounds originated from the hydrothermal decomposition of siderite. This process is crucial for understanding the formation of alkylated polycyclic aromatic hydrocarbons (PAHs). McCollom [47] studied the decomposition of siderite in the presence of water vapor at 300 °C and found that magnetite was produced alongside CO2 and H2 as the primary gas products, along with trace amounts of methane and light hydrocarbons, including alkylated aromatic compounds such as PAHs. Additionally, Milesi et al. [48] indicated that the hydrothermal decomposition of siderite at temperatures of 200 °C and 300 °C produced carbonaceous compounds that were sensitive to electron-beam analysis. These compounds were interpreted as polycyclic aromatic hydrocarbons (PAHs). Smith and Savage [49] demonstrated that further heating of PAHs between 350 °C and 425 °C lead to the loss of alkyl chains. This process is generally expected to occur during oil maturation, suggesting that such chain loss could occur at lower temperatures as well.
The Raman parameters, G-FWHM and RBS, indicate a VR0 value below 1.1%, with a corresponding temperature of 143 °C. This suggests that the maturation temperature did not exceed approximately 200 °C. The estimated temperature supports the assumption that the CMs likely have a microbial origin and attained maturity at temperatures below approximately 200 °C. However, we cannot rule out the possibility that the CMs associated with magnetite are products of the hydrothermal decomposition of siderite, based solely on the characteristics observed in Raman spectroscopy.
Apatite associated with OM provides strong evidence of a biological origin [50,51,52,53]. Phosphorus is a major component of the phosphate mineral apatite, which can result from the decomposition of phosphorus-bearing biomass. Li et al. [50] suggest that the coexistence of apatite and OM indicates that the phosphorus was sourced from the OM rather than being adsorbed onto ferric oxyhydroxide precursors such as ferrihydrite. In our sample, phosphorus was detected in the CMs both within and outside the magnetite core, as well as in goethite but not in hematite. The adsorption of phosphate was compared among magnetite, goethite, ferrihydrite, and hematite. The adsorption capacity of hematite (Qm (mg/g): 1.75) is significantly lower than that of magnetite (Qm (mg/g): 57.8), goethite (Qm (mg/g): 50.5), and ferrihydrite (Qm (mg/g): 66.7) [54]. Therefore, when phosphate-adsorbed ferrihydrite is dehydrated to form hematite, phosphate may be released. The apatite found in the iron-rich layer was closely associated with CMs, as demonstrated by the Raman spectra (Figure 6).
Additionally, the presence of sulfur in the CMs suggests a biological origin, as anoxygenic phototrophs use sulfur and its reduced compounds as electron donors to produce OM [55]. Purple and green sulfur bacteria deposit elemental sulfur, which is converted to sulfate [56,57], and microbial pathways transform sulfur into biomolecules like amino acids [58]. Under reducing conditions, sulfur is incorporated into the functional groups of OM [59].
The aggregation of biomass with ferric oxyhydroxide precursors, such as ferrihydrite, may contribute to the formation of the magnetite, as observed in culture experiments involving anoxygenic photosynthetic bacteria [20,60]. The coexistence of euhedral magnetite and euhedral hematite in iron-rich layers, with no observable interactions such as overgrowth or replacement, indicates that both minerals are formed during the same stage of mineralization. Certain ferrihydrite can accept electrons and transform into magnetite through the activity of iron-reducing bacteria, while other ferrihydrite may simply dehydrate to form hematite. A thermochemical reduction in Fe(III) can also result in the formation of magnetite, hematite, and siderite [61,62]; however, our sample does not contain siderite.
The unique texture of core-rim magnetite, with a core containing CMs, may offer valuable insights into the origin of these CMs. Understanding the formation process of core-rim magnetite can, therefore, help narrow down the potential origins of the CMs. In the following section, we outline the possible formation processes for core-rim magnetite, emphasizing the strong likelihood of a microbial origin for the CMs.

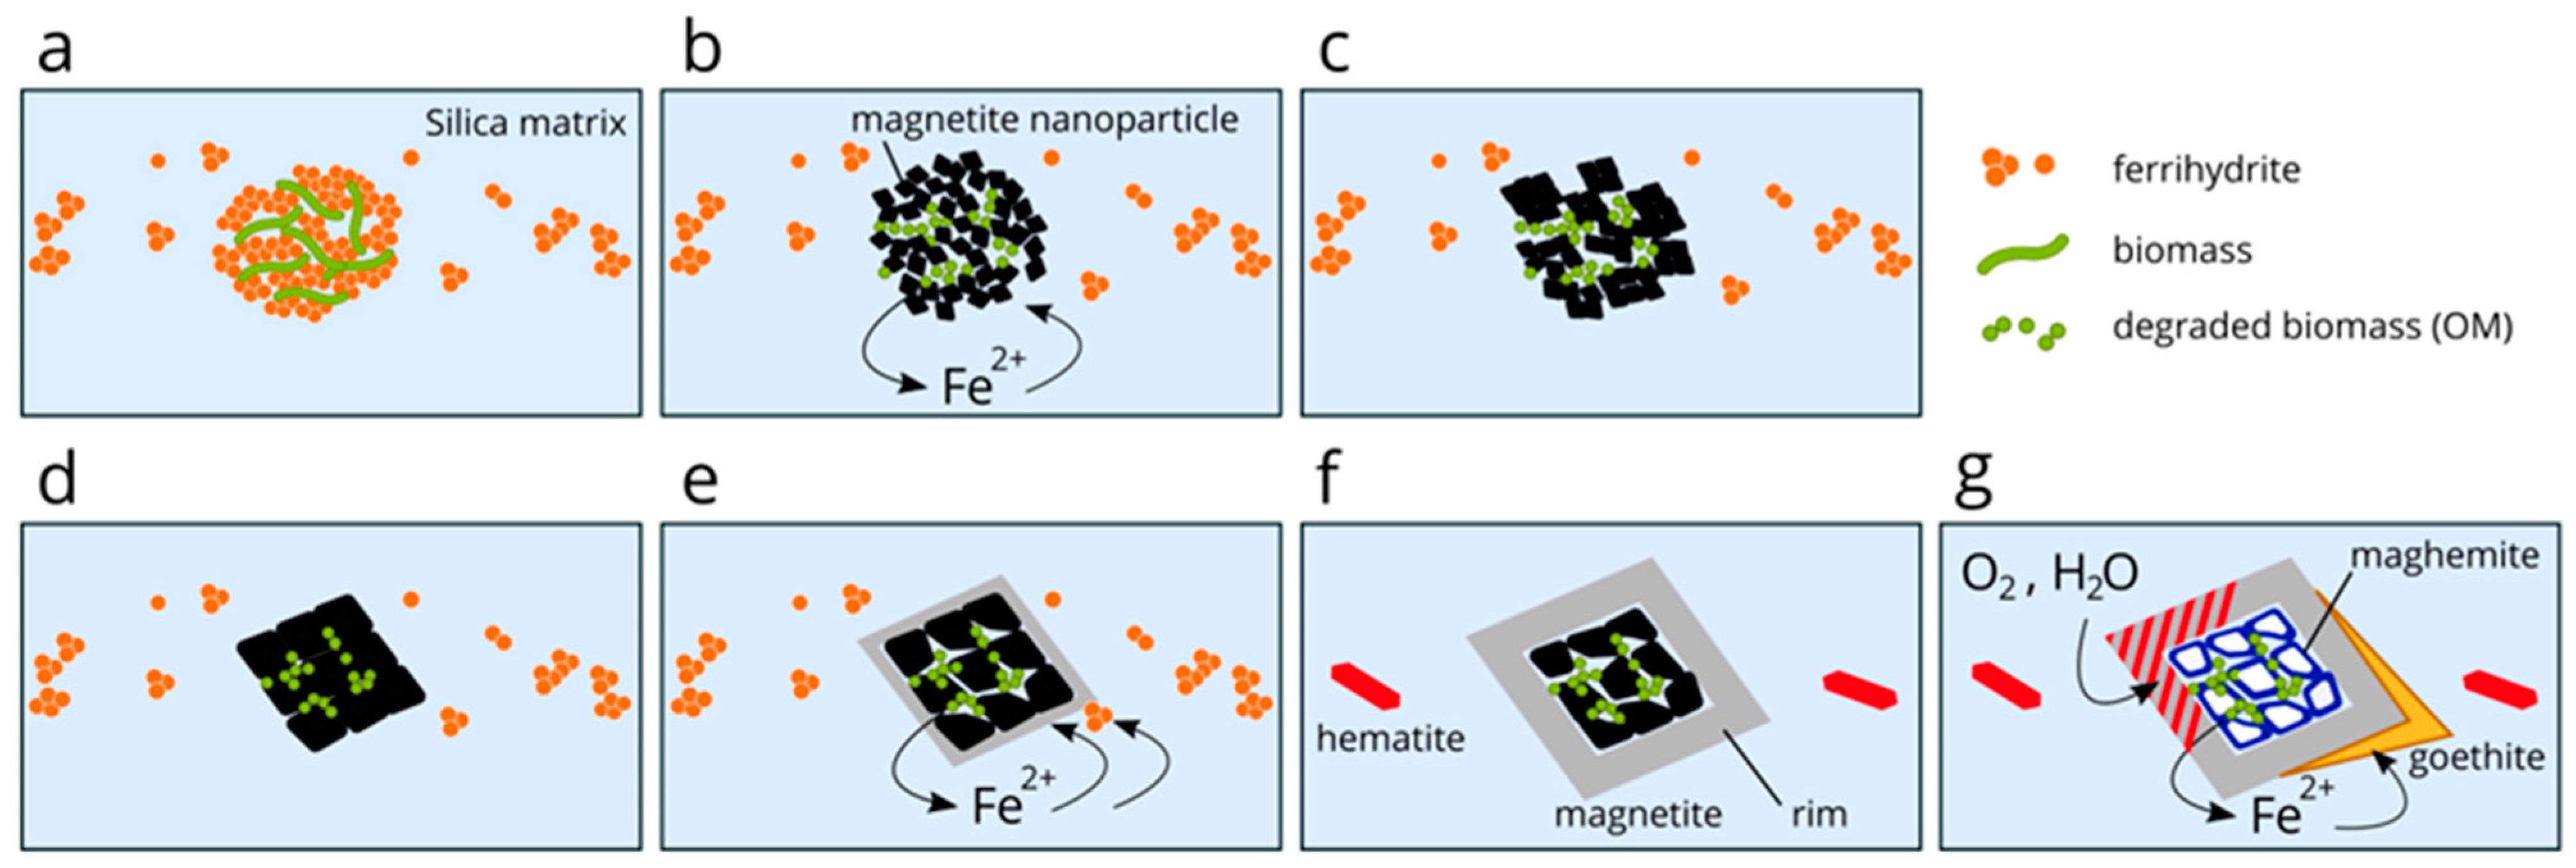
4.3. Formation Process of Core-Rim Magnetite with a Core Containing CMs

The formation of core-rim magnetite, with a core containing CMs, occurs through a series of interconnected processes that begin with the oxidation of Fe2+ in seawater. Initially, Fe2+ is oxidized through anoxygenic photosynthesis or oxygenic photosynthesis and precipitates as ferrihydrite, which then settles on the seabed. Alongside ferrihydrite, OM derived from microbial activity accumulate, with some of the OM being adsorbed onto the ferrihydrite (Figure 7a). Silica also adsorbs onto ferrihydrite.
Under the anoxic conditions of the seabed, certain microorganisms, such as iron-reducing bacteria, oxidize OM and transfer electrons to ferrihydrite, converting it into Si-bearing magnetite (Figure 7b). Although iron-reducing bacteria can also produce siderite [63], it is important to note that not all BIFs contain this mineral, and our thin section does not exhibit the presence of siderite.
The oxidation of OM by iron-reducing bacteria generates CO2, which can produce carbonate ion species in combination with ferrous ions, ultimately leading to the formation of siderite [63,64]. The formation of carbonate species from CO2 and water is pH-dependent, as is the solubility of CO2 [65]. When the pH is too low or too high, CO2 may escape as a gas and be released from the sediments, further hindering the precipitation of siderite. In general, siderite precipitates at neutral pH [66]. While many factors can influence siderite formation in BIFs, pH may play a critical role in both iron reduction and the production of carbonate ion species, ultimately leading to the formation of siderite.
As fine magnetite particles are produced, they aggregate through oriented attachment mechanisms, similar to findings in previous research such as Fadli et al. [67] and Park et al. [68]. This process ultimately leads to the formation of larger crystals, where OM become trapped at the particle boundaries.
This oriented attachment growth is well established for nanocrystals but also applies to microcrystals [69,70,71,72,73,74,75]. The fragments observed in the core of the magnetite range in size from several to tens of microns, while ferrihydrite crystals transform into magnetite crystals sized in the nanometer range (up to 10 nm) (e.g., [76]). These nanometer-sized magnetite crystals can further evolve into magnetite microcrystals through an oriented attachment process. Subsequently, the growth of these magnetite microcrystals into larger crystals may occur via a multistep oriented attachment process (Figure 7c,d) [77,78,79]. The resulting larger crystals can be classified as mesocrystals, characterized by small crystals that exhibit parallel crystallographic alignment [80,81]. Fractures in the magnetite core occur along weak bonding boundaries where building block nanometer-sized magnetite or magnetite microcrystals are attached. Another possibility is that, as reduction progresses, magnetite in contact with OM within these larger crystals may undergo further reduction and reductive dissolution [82,83]. This ongoing reduction process can create voids and spaces within the magnetite crystals (Figure 7e). Additionally, a stronger Raman signal from OM in the magnetite core, compared to that in the magnetite rim, suggests the dissolution of the core and subsequent migration of carbon into the surrounding area.
The inclusion-free rims of magnetite were reported by Teixeira et al. [5], suggesting that the formation mechanism involves the thermochemical reduction in Fe(III) from matrix hematite, following the formation of the early core. Similarly, distinct magnetite rims form as new magnetite grows on the surfaces of existing magnetite crystals during a period when ferrous iron (Fe(II)) in seawater is partially oxidized to ferric iron (Fe(III)) while ferrous iron ions remain present in the seawater. Ferric iron is supplied from the dissolution of any unreduced ferrihydrite, magnetite, or potentially other iron oxides (Figure 7f).
Finally, during the processes of burial diagenesis, and potentially even post-depositional surface weathering, groundwater interacts with the magnetites, leading to their oxidation [84,85]. This reaction transforms the smooth rims into hematite, while goethite forms around these rims. In contrast, the core of the magnetite remains less oxidized and transitions into maghemite (Figure 7g).
As far as we know, core-rim magnetite containing CMs does not occur in other BIFs. This suggests that this particular sample experienced a unique process that enabled the preservation of CMs in the magnetite core. Perhaps during oriented attachment growth, much of the OM segregated from the attachment over time. However, if rapid overgrowth of magnetite occurs, forming a smooth rim, the OM may become confined within the magnetite core. The timing and rate of the thermochemical reduction in Fe(III), as well as the concentration of Fe(II) remaining in seawater, will be key factors in the preservation of OM in magnetite.

5. Conclusions

This study identifies CMs within the cores of euhedral oxidized magnetite crystals, confirming a direct association between the CMs and magnetite. The unique texture of the core-rim magnetite facilitates the reconstruction of the magnetite’s formation history in relation to these CMs.
While we cannot rule out the possibility that CMs were formed through the hydrothermal decomposition of siderite, several lines of evidence suggest a significant likelihood of a microbial origin for the CMs in magnetite. For instance, Raman spectroscopy reveals that the CMs exhibit characteristics of low-maturity OM, particularly the presence of aliphatic carbon chains. This finding supports the notion that organic carbon compounds undergo maturation during the metamorphism of the Moodies BIF at temperatures below approximately 200 °C. Additionally, phosphorus and sulfur were detected in the CMs, indicating a biological contribution. Furthermore, the formation history of the core-rim magnetite aligns well with the hypothesis of OM involvement, as the unique texture may reflect processes associated with the incorporation and preservation of OM.
The formation process of the distinctive core-rim texture involves the oxidation of Fe2+ through anoxygenic photosynthesis, leading to the precipitation of ferrihydrite, which is subsequently converted into magnetite by iron-reducing bacteria. The oriented attachment growth of magnetite results in the formation of larger magnetite crystals, which also serve to confine the OM. Finally, the rapid overgrowth of magnetite creates a smooth rim that may have preserved the OM for up to 3.2 billion years.

Supplementary Materials

The following supporting information can be downloaded at the following link: https://www.mdpi.com/article/10.3390/min15030218/s1. Figure S1: Raman spectrum obtained from glue on thin section.

Author Contributions

Conceptualization, H.K.; Methodology, H.K.; Validation, H.K.; Investigation, T.M.; Data curation, T.M.; Writing—original draft, T.M.; Writing—review & editing, H.K.; Supervision, H.K.; Funding acquisition, H.K. All authors have read and agreed to the published version of the manuscript.

Funding

H.K. acknowledges support from JSPS KAKENHI Grant Number JP26400512.

Data Availability Statement

Data are contained within the article and Supplementary Materials.

Conflicts of Interest

The authors declare no conflicts of interest.

References

  1. Klein, C. Some Precambrian Banded Iron-Formations (BIFs) from around the World: Their Age, Geologic Setting, Mineralogy, Metamorphism, Geochemistry, and Origin. Am. Mineral. 2005, 90, 1473–1499. [Google Scholar] [CrossRef]
  2. Sun, S.; Li, Y.L. Geneses and Evolutions of Iron-Bearing Minerals in Banded Iron Formations of >3760 to ca. 2200 Million-Year-Old: Constraints from Electron Microscopic, X-Ray Diffraction and Mössbauer Spectroscopic Investigations. Precambrian Res. 2017, 289, 1–17. [Google Scholar] [CrossRef]
  3. Hinz, I.L.; Nims, C.; Theuer, S.; Templeton, A.S.; Johnson, J.E. Ferric Iron Triggers Greenalite Formation in Simulated Archean Seawater. Geology 2021, 49, 905–909. [Google Scholar] [CrossRef]
  4. Sun, S.; Konhauser, K.O.; Kappler, A.; Li, Y.L. Primary Hematite in Neoarchean to Paleoproterozoic Oceans. Bull. Geol. Soc. Am. 2015, 127, 850–861. [Google Scholar] [CrossRef]
  5. Teixeira, L.; Carlut, J.; Rego, E.S.; Trindade, R.I.F.; Philippot, P. Crystallization Pathways of Iron Formations: Insights From Magnetic Properties and High-Resolution Imaging of the 2.7 Ga Carajás Formation, Brazil. Geobiology 2024, 22, e70008. [Google Scholar] [CrossRef] [PubMed]
  6. Rasmussen, B.; Muhling, J.R.; Suvorova, A.; Krapež, B. Greenalite Precipitation Linked to the Deposition of Banded Iron Formations Downslope from a Late Archean Carbonate Platform. Precambrian Res. 2017, 290, 49–62. [Google Scholar] [CrossRef]
  7. Cloud, P.E. Significance of the Gunflint (Precambrian) Microflora. Science 1965, 148, 27–35. [Google Scholar] [CrossRef] [PubMed]
  8. Widdel, F.; Schnell, S.; Heising, S.; Ehrenreich, A.; Assmus, B.; Schink, B. Ferrous Iron Oxdation by Anoxygenic Phototrophic Bacteria. Nature 1993, 362, 834–836. [Google Scholar] [CrossRef]
  9. Konhauser, K.O.; Amskold, L.; Lalonde, S.V.; Posth, N.R.; Kappler, A.; Anbar, A. Decoupling Photochemical Fe(II) Oxidation from Shallow-Water BIF Deposition. Earth Planet. Sci. Lett. 2007, 258, 87–100. [Google Scholar] [CrossRef]
  10. Konhauser, K.O.; Robbins, L.J.; Alessi, D.S.; Flynn, S.L.; Gingras, M.K.; Martinez, R.E.; Kappler, A.; Swanner, E.D.; Li, Y.L.; Crowe, S.A.; et al. Phytoplankton Contributions to the Trace-Element Composition of Precambrian Banded Iron Formations. Bull. Geol. Soc. Am. 2018, 130, 941–951. [Google Scholar] [CrossRef]
  11. Pellerin, A.; Thomazo, C.; Ader, M.; Rossignol, C.; Rego, E.S.; Busigny, V.; Philippot, P. Neoarchaean Oxygen-Based Nitrogen Cycle En Route to the Great Oxidation Event. Nature 2024, 633, 365–370. [Google Scholar] [CrossRef] [PubMed]
  12. Planavsky, N.J.; Wang, X.; Reinhard, C.T.; Bekker, A.; Knudsen, A.; Smith, A.J.B.; Johnson, T.M.; Hofmann, A.; Beukes, N.J.; Lalonde, S.V.; et al. Evidence for Oxygenic Photosynthesis Half a Billion Years before the Great Oxidation Event. Nat. Geosci. 2014, 7, 283–286. [Google Scholar] [CrossRef]
  13. Shih, P.M.; Hemp, J.; Ward, L.M.; Matzke, N.J.; Fischer, W.W. Crown Group Oxyphotobacteria Postdate the Rise of Oxygen. Geobiology 2017, 15, 19–29. [Google Scholar] [CrossRef]
  14. Hartman, H. Photosynthesis and the Origin of Life. Orig. life Evol. Biosph. J. Int. Soc. Study Orig. Lifenational Soc. Study Orig. Life 1998, 28, 515–521. [Google Scholar] [CrossRef]
  15. Xiong, J.; William, M.F.; Inoue, K.; Nakahara, M.; Bauer, C.E. Molecular Evidence for the Evolution of Photosynthesis. Trends Plant Sci. 2000, 289, 1724–1730. [Google Scholar] [CrossRef]
  16. Kappler, A.; Pasquero, C.; Konhauser, K.O.; Newman, D.K. Deposition of Banded Iron Formations by Anoxygenic Phototrophic Fe(II)-Oxidizing Bacteria. Geology 2005, 33, 865–868. [Google Scholar] [CrossRef]
  17. Wang, C.; Robbins, L.J.; Planavsky, N.J.; Beukes, N.J.; Patry, L.A.; Lalonde, S.V.; Lechte, M.A.; Asael, D.; Reinhard, C.T.; Zhang, L. Archean to Early Paleoproterozoic Iron Formations Document a Transition in Iron Oxidation Mechanisms. Geochim. Cosmochim. Acta 2023, 343, 286–303. [Google Scholar] [CrossRef]
  18. Heising, S.; Richter, L.; Ludwig, W.; Schink, B. Chlorobium Ferrooxidans Sp. Nov., a Phototrophic Green Sulfur Bacterium That Oxidizes Ferrous Iron in Coculture with a “Geospirillum” Sp. Strain. Arch. Microbiol. 1999, 172, 116–124. [Google Scholar] [CrossRef]
  19. Schädler, S.; Burkhardt, C.; Hegler, F.; Straub, K.L.; Miot, J.; Benzerara, K.; Kappler, A. Formation of Cell-Iron-Mineral Aggregates by Phototrophic and Nitrate-Reducing Anaerobic Fe(Ii)-Oxidizing Bacteria. Geomicrobiol. J. 2009, 26, 93–103. [Google Scholar] [CrossRef]
  20. Konhauser, K.; Newman, D.; Kappler, A. The Potential Significance of Microbial Fe (III) Reduction during Deposition of Precambrian Banded Iron Formations. Geobiology 2005, 3, 167–177. [Google Scholar] [CrossRef]
  21. Klein, C.; Beukes, N.J. Geochemistry and Sedimentology of a Facies Transition from Limestone to Iron-Formation Deposition in the Early Proterozoic Transvaal Supergroup, South Africa. Econ. Geol. 1989, 84, 1733–1774. [Google Scholar] [CrossRef]
  22. Thompson, K.J.; Kenward, P.A.; Bauer, K.W.; Warchola, T.; Gauger, T.; Martinez, R.; Simister, R.L.; Michiels, C.C.; Llirós, M.; Reinhard, C.T. Photoferrotrophy, Deposition of Banded Iron Formations, and Methane Production in Archean Oceans. Sci. Adv. 2019, 5, eaav2869. [Google Scholar] [CrossRef]
  23. Fischer, W.W.; Knoll, A.H. An Iron Shuttle for Deepwater Silica in Late Archean and Early Paleoproterozoic Iron Formation. Bull. Geol. Soc. Am. 2009, 121, 222–235. [Google Scholar] [CrossRef]
  24. Walker, J.C.G. Suboxic Diagenesis in Banded Iron Formations. Nature 1984, 309, 340–342. [Google Scholar] [CrossRef]
  25. Bontognali, T.R.R.; Fischer, W.W.; Föllmi, K.B. Siliciclastic Associated Banded Iron Formation from the 3.2Ga Moodies Group, Barberton Greenstone Belt, South Africa. Precambrian Res. 2013, 226, 116–124. [Google Scholar] [CrossRef]
  26. Heubeck, C. The Moodies Group—A High-Resolution Archive of Archaean Surface Processes and Basin-Forming Mechanisms. In The Archaean Geology of the Kaapvaal Craton, Southern Africa; Springer: Cham, Switzerland, 2019; ISBN 9783319786520. [Google Scholar]
  27. Bonnand, P.; Lalonde, S.V.; Boyet, M.; Heubeck, C.; Homann, M.; Nonnotte, P.; Foster, I.; Konhauser, K.O.; Köhler, I. Post-Depositional REE Mobility in a Paleoarchean Banded Iron Formation Revealed by La-Ce Geochronology: A Cautionary Tale for Signals of Ancient Oxygenation. Earth Planet. Sci. Lett. 2020, 547, 116452. [Google Scholar] [CrossRef]
  28. Heubeck, C.; Engelhardt, J.; Byerly, G.R.; Zeh, A.; Sell, B.; Luber, T.; Lowe, D.R. Timing of Deposition and Deformation of the Moodies Group (Barberton Greenstone Belt, South Africa): Very-High-Resolution of Archaean Surface Processes. Precambrian Res. 2013, 231, 236–262. [Google Scholar] [CrossRef]
  29. Kröner, A.; Byerly, G.R.; Lowe, D.R. Chronology of Early Archaean Granite-Greenstone Evolution in the Barberton Mountain Land, South Africa, Based on Precise Dating by Single Zircon Evaporation. Earth Planet. Sci. Lett. 1991, 103, 41–54. [Google Scholar] [CrossRef] [PubMed]
  30. Toulkeridis, T.; Goldstein, S.L.; Clauer, N.; Kröner, A.; Lowe, D.R. Sm-Nd Dating of Fig Tree Clay Minerals of the Barberton Greenstone Belt, South Africa. Geology 1994, 22, 199–202. [Google Scholar] [CrossRef]
  31. Toulkeridis, T.; Goldstein, S.L.; Clauer, N.; Kröner, A.; Todt, W.; Schidlowski, M. Sm-Nd, Rb-Sr and Pb-Pb Dating of Silicic Carbonates from the Early Archaean Barberton Greenstone Belt, South Africa Evidence for Post-Depositional Isotopic Resetting at Low Temperature. Precambrian Res. 1998, 92, 129–144. [Google Scholar] [CrossRef]
  32. De Ronde, C.E.J.; Channer, D.M.D.; Faure, K.; Bray, C.J.; Spooner, E.T.C. Fluid Chemistry of Archean Seafloor Hydrothermal Vents: Implications for the Composition of circa 3.2 Ga Seawater. Geochim. Cosmochim. Acta 1997, 61, 4025–4042. [Google Scholar] [CrossRef]
  33. Heubeck, C.; Lowe, D.R. Sedimentary Petrography and Provenance of the Archean Moodies Group, Barberton Greenstone Belt. In Geologic Evolution of the Barberton Greenstone Belt, South Africa; Lowe, D.R., Byerly, G.R., Eds.; Geological Society of America: Boulder, CO, USA, 1999; pp. 259–286. [Google Scholar] [CrossRef]
  34. Heubeck, C. Early Archean Surface Processes and Environments: Drilling the Moodies Group, Barberton Greenstone Belt, South Africa. In Proceedings of the Field Workshop, African Rest Lodge, Barberton, South Africa, 5–10 October 2017. Field Handout. [Google Scholar]
  35. Condie, K.C.; Macke John, E.; Reimer, T.O. Petrology and geochemistry of early Precambrian graywackes from the Fig Tree Group, South Africa. Geol. Soc. Am. Bull. 1970, 81, 2759–2776. [Google Scholar] [CrossRef]
  36. Hofmann, A. The Geochemistry of Sedimentary Rocks from the Fig Tree Group, Barberton Greenstone Belt: Implications for Tectonic, Hydrothermal and Surface Processes during Mid-Archaean Times. Precambrian Res. 2005, 143, 23–49. [Google Scholar] [CrossRef]
  37. El Mendili, Y.; Grasset, F.; Randrianantoandro, N.; Nerambourg, N.; Greneche, J.M.; Bardeau, J.F. Improvement of Thermal Stability of Maghemite Nanoparticles Coated with Oleic Acid and Oleylamine Molecules: Investigations under Laser Irradiation. J. Phys. Chem. C 2015, 119, 10662–10668. [Google Scholar] [CrossRef]
  38. Henry, D.G.; Jarvis, I.; Gillmore, G.; Stephenson, M. Raman Spectroscopy as a Tool to Determine the Thermal Maturity of Organic Matter: Application to Sedimentary, Metamorphic and Structural Geology. Earth-Sci. Rev. 2019, 198, 102936. [Google Scholar] [CrossRef]
  39. Beyssac, O.; Goffé, B.; Chopin, C.; Rouzaud, J.N. Raman Spectra of Carbonaceous Material in Metasediments: A New Geothermometer. J. Metamorph. Geol. 2002, 20, 859–871. [Google Scholar] [CrossRef]
  40. Ferralis, N.; Matys, E.D.; Knoll, A.H.; Hallmann, C.; Summons, R.E. Rapid, Direct and Non-Destructive Assessment of Fossil Organic Matter via MicroRaman Spectroscopy. Carbon N. Y. 2016, 108, 440–449. [Google Scholar] [CrossRef]
  41. Beny-Bassez, C.; Rouzaud, J.N. Characterization of Carbonaceous Materials By Correlated Electron and Optical Microscopy and Raman Microspectroscopy. Scan. Electron Microsc. 1985, 1985, 119–132. [Google Scholar]
  42. Kelemen, S.R.; Fang, H.L. Maturity Trends in Raman Spectra from Kerogen and Coal. Energy Fuels 2001, 15, 653–658. [Google Scholar] [CrossRef]
  43. Hinrichs, R.; Brown, M.T.; Vasconcellos, M.A.Z.; Abrashev, M.V.; Kalkreuth, W. Simple Procedure for an Estimation of the Coal Rank Using Micro-Raman Spectroscopy. Int. J. Coal Geol. 2014, 136, 52–58. [Google Scholar] [CrossRef]
  44. Bonoldi, L.; Di Paolo, L.; Flego, C. Vibrational Spectroscopy Assessment of Kerogen Maturity in Organic-Rich Source Rocks. Vib. Spectrosc. 2016, 87, 14–19. [Google Scholar] [CrossRef]
  45. Czamara, K.; Majzner, K.; Pacia, M.Z.; Kochan, K.; Kaczor, A. Raman Spectroscopy of Lipids: A Review. J. Raman Spectrosc. 2015, 46, 4–20. [Google Scholar] [CrossRef]
  46. Barker, C.E.; Pawlewicz, M.J. Calculation of Vitrinite Reflectance from Thermal Histories and Peak Temperatures. In Vitrinite Reflectance as a Maturity Parameter; American Chemical Society: Washington, DC, USA, 1994; pp. 216–229. [Google Scholar] [CrossRef]
  47. McCollom, T.M. Formation of Meteorite Hydrocarbons from Thermal Decomposition of Siderite (FeCO3). Geochim. Cosmochim. Acta 2003, 67, 311–317. [Google Scholar] [CrossRef]
  48. Milesi, V.; Guyot, F.; Brunet, F.; Richard, L.; Recham, N.; Benedetti, M.; Dairou, J.; Prinzhofer, A. Formation of CO2, H2 and Condensed Carbon from Siderite Dissolution in the 200–300 °C Range and at 50 MPa. Geochim. Cosmochim. Acta 2015, 154, 201–211. [Google Scholar] [CrossRef]
  49. Smith, C.M.; Savage, P.E. Reactions of Polycyclic Alkylaromatics: Structure and Reactivity. AIChE J. 1991, 37, 1613–1624. [Google Scholar] [CrossRef]
  50. Li, Y.L.; Konhauser, K.O.; Cole, D.R.; Phelps, T.J. Mineral Ecophysiological Data Provide Growing Evidence for Microbial Activity in Banded-Iron Formations. Geology 2011, 39, 707–710. [Google Scholar] [CrossRef]
  51. Papineau, D.; De Gregorio, B.T.; Stroud, R.M.; Steele, A.; Pecoits, E.; Konhauser, K.; Wang, J.; Fogel, M.L. Ancient Graphite in the Eoarchean Quartz-Pyroxene Rocks from Akilia in Southern West Greenland II: Isotopic and Chemical Compositions and Comparison with Paleoproterozoic Banded Iron Formations. Geochim. Cosmochim. Acta 2010, 74, 5884–5905. [Google Scholar] [CrossRef]
  52. Dodd, M.S.; Papineau, D.; She, Z.B.; Manikyamba, C.; Wan, Y.S.; O’Neil, J.; Karhu, J.A.; Rizo, H.; Pirajno, F. Widespread Occurrences of Variably Crystalline 13 C-Depleted Graphitic Carbon in Banded Iron Formations. Earth Planet. Sci. Lett. 2019, 512, 163–174. [Google Scholar] [CrossRef]
  53. Dodd, M.S.; Papineau, D.; Pirajno, F.; Wan, Y.; Karhu, J.A. Minimal Biomass Deposition in Banded Iron Formations Inferred from Organic Matter and Clay Relationships. Nat. Commun. 2019, 10, 5022. [Google Scholar] [CrossRef] [PubMed]
  54. Bao, T.; Damtie, M.M.; Wang, C.Y.; Li, C.L.; Chen, Z.; Cho, K.; Wei, W.; Yuan, P.; Frost, R.L.; Ni, B.J. Iron-Containing Nanominerals for Sustainable Phosphate Management: A Comprehensive Review and Future Perspectives. Sci. Total Environ. 2024, 926, 172025. [Google Scholar] [CrossRef] [PubMed]
  55. Kushkevych, I.; Bosáková, V.; Vítězová, M.; Rittmann, S.K.M.R. Anoxygenic Photosynthesis in Photolithotrophic Sulfur Bacteria and Their Role in Detoxication of Hydrogen Sulfide. Antioxidants 2021, 10, 829. [Google Scholar] [CrossRef]
  56. Frigaard, N.U.; Dahl, C. Sulfur Metabolism in Phototrophic Sulfur Bacteria. Adv. Microb. Physiol. 2009, 54, 103–200. [Google Scholar] [PubMed]
  57. Dahl, C. Inorganic Sulfur Compounds as Electron Donors in Purple Sulfur Bacteria. In Sulfur Metabolism in Phototrophic Organisms-Advances in Photosynthesis and Respiration; Hell, R., Dahl, C., Knaff, D., Leustek, T., Eds.; Springer: New York, NY, USA, 2008; Volume 27, pp. 289–317. [Google Scholar]
  58. Moran, M.A.; Durham, B.P. Sulfur Metabolites in the Pelagic Ocean. Nat. Rev. Microbiol. 2019, 17, 665–678. [Google Scholar] [CrossRef]
  59. Vandenbroucke, M.; Largeau, C. Kerogen Origin, Evolution and Structure. Org. Geochem. 2007, 38, 719–833. [Google Scholar] [CrossRef]
  60. Kappler, A.; Newman, D.K. Formation of Fe(III)-Minerals by Fe(II)-Oxidizing Photoautotrophic Bacteria. Geochim. Cosmochim. Acta 2004, 68, 1217–1226. [Google Scholar] [CrossRef]
  61. Posth, N.R.; Köhler, I.; Swanner, E.D.; Schröder, C.; Wellmann, E.; Binder, B.; Konhauser, K.O.; Neumann, U.; Berthold, C.; Nowak, M.; et al. Simulating Precambrian Banded Iron Formation Diagenesis. Chem. Geol. 2013, 362, 66–73. [Google Scholar] [CrossRef]
  62. Halama, M.; Swanner, E.D.; Konhauser, K.O.; Kappler, A. Evaluation of Siderite and Magnetite Formation in BIFs by Pressure–Temperature Experiments of Fe(III) Minerals and Microbial Biomass. Earth Planet. Sci. Lett. 2016, 450, 243–253. [Google Scholar] [CrossRef]
  63. Han, X.; Wang, F.; Zheng, S.; Qiu, H.; Liu, Y.; Wang, J.; Menguy, N.; Leroy, E.; Bourgon, J.; Kappler, A. Morphological, Microstructural, and In Situ Chemical Characteristics of Siderite Produced by Iron-Reducing Bacteria. Environ. Sci. Technol. 2024, 58, 11016–11026. [Google Scholar] [CrossRef]
  64. Heimann, A.; Johnson, C.M.; Beard, B.L.; Valley, J.W.; Roden, E.E.; Spicuzza, M.J.; Beukes, N.J. Fe, C, and O Isotope Compositions of Banded Iron Formation Carbonates Demonstrate a Major Role for Dissimilatory Iron Reduction in ~2.5Ga Marine Environments. Earth Planet. Sci. Lett. 2010, 294, 8–18. [Google Scholar] [CrossRef]
  65. Zosel, J.; Oelner, W.; Decker, M.; Gerlach, G.; Guth, U. The Measurement of Dissolved and Gaseous Carbon Dioxide Concentration. Meas. Sci. Technol. 2011, 22, 072001. [Google Scholar] [CrossRef]
  66. Lin, C.Y.; Turchyn, A.V.; Krylov, A.; Antler, G. The Microbially Driven Formation of Siderite in Salt Marsh Sediments. Geobiology 2019, 18, 207–224. [Google Scholar] [CrossRef] [PubMed]
  67. Fadli, A.; Amri, A.; Iwantono, I.; Adnan, A.; Sunarno, S.; Sukoco, S.; Mayangsari, M. The Oriented Attachment Model Applied on Crystal Growth of Hydrothermal Derived Magnetite Nanoparticles. Indones. J. Chem. 2020, 20, 379–385. [Google Scholar] [CrossRef]
  68. Park, B.C.; Ko, M.J.; Kim, Y.K.; Kim, G.W.; Kim, M.S.; Koo, T.M.; Fu, H.E.; Kim, Y.K. Surface-Ligand-Induced Crystallographic Disorder–Order Transition in Oriented Attachment for the Tuneable Assembly of Mesocrystals. Nat. Commun. 2022, 13, 1144. [Google Scholar] [CrossRef] [PubMed]
  69. De Yoreo, J.J.; Gilbert, P.U.P.A.; Sommerdijk, N.A.J.M.; Penn, R.L.; Whitelam, S.; Joester, D.; Zhang, H.; Rimer, J.D.; Navrotsky, A.; Banfield, J.F. Crystallization by Particle Attachment in Synthetic, Biogenic, and Geologic Environments. Science 2015, 349, aaa6760. [Google Scholar] [CrossRef]
  70. Araújo, V.D.; Tranquilin, R.L.; Motta, F.V.; Paskocimas, C.A.; Bernardi, M.I.B.; Cavalcante, L.S.; Andres, J.; Longo, E.; Bomio, M.R.D. Effect of Polyvinyl Alcohol on the Shape, Photoluminescence and Photocatalytic Properties of PbMoO4 Microcrystals. Mater. Sci. Semicond. Process 2014, 26, 425–430. [Google Scholar] [CrossRef]
  71. Viedma, C.; McBride, J.M.; Kahr, B.; Cintas, P. Enantiomer-Specific Oriented Attachment: Formation of Macroscopic Homochiral Crystal Aggregates from a Racemic System. Angew. Chem. 2013, 125, 10739–10742. [Google Scholar] [CrossRef]
  72. Li, Z.; Xu, F.; Sun, X.; Zhang, W. Oriented Attachment in Vapor: Formation of ZnO Three-Dimensional Structures by Intergrowth of ZnO Microcrystals. Cryst. Growth Des. 2008, 8, 805–807. [Google Scholar] [CrossRef]
  73. Zhou, J.; Zhou, C.; Shi, Z.; Xu, Z.; Yan, S.; Zou, Z. Oriented Attachment Growth of Hundred-Nanometer-Size LaTaON2 Single Crystals in Molten Salts for Enhanced Photoelectrochemical Water Splitting. J. Mater. Chem. A 2018, 6, 7706–7713. [Google Scholar] [CrossRef]
  74. Kidalov, S.V.; Shakhov, F.M.; Shvidchenko, A.V.; Smirnov, A.N.; Sokolov, V.V.; Yagovkina, M.A.; Vul’, A.Y. Growth of Diamond Microcrystals by the Oriented Attachment Mechanism at High Pressure and High Temperature. Tech. Phys. Lett. 2017, 43, 53–56. [Google Scholar] [CrossRef]
  75. Wang, J.; Lian, G.; Si, H.; Wang, Q.; Cui, D.; Wong, C.P. Pressure-Induced Oriented Attachment Growth of Large-Size Crystals for Constructing 3D Ordered Superstructures. ACS Nano 2016, 10, 405–412. [Google Scholar] [CrossRef] [PubMed]
  76. Wu, W.; Li, B.; Hu, J.; Li, J.; Wang, F.; Pan, Y. Iron Reduction and Magnetite Biomineralization Mediated by a Deep-Sea Iron-Reducing Bacterium Shewanella piezotolerans WP3. J. Geophys. Res. Biogeosci. 2011, 116, G04034. [Google Scholar] [CrossRef]
  77. Zhang, J.; Lin, Z.; Lan, Y.; Ren, G.; Chen, D.; Huang, F.; Hong, M. A Multistep Oriented Attachment Kinetics: Coarsening of ZnS Nanoparticle in Concentrated NaOH. J. Am. Chem. Soc. 2006, 128, 12981–12987. [Google Scholar] [CrossRef]
  78. Zhuang, Z.; Zhang, J.; Huang, F.; Wang, Y.; Lin, Z. Pure Multistep Oriented Attachment Growth Kinetics of Surfactant-Free SnO2 Nanocrystals. Phys. Chem. Chem. Phys. 2009, 11, 8516–8521. [Google Scholar] [CrossRef] [PubMed]
  79. Xue, X.; Penn, R.L.; Leite, E.R.; Huang, F.; Lin, Z. Crystal Growth by Oriented Attachment: Kinetic Models and Control Factors. CrystEngComm 2014, 16, 1419–1429. [Google Scholar] [CrossRef]
  80. Cölfen, H.; Antonietti, M. Mesocrystals: Inorganic Superstructures Made by Highly Parallel Crystallization and Controlled Alignment. ChemInform 2005, 36, 5576–5591. [Google Scholar] [CrossRef] [PubMed]
  81. Imai, H. Mesostructured Crystals: Growth Processes and Features. Prog. Cryst. Growth Charact. Mater. 2016, 62, 212–226. [Google Scholar] [CrossRef]
  82. Kostka, J.E.; Nealson, K.H. Dissolution and Reduction of Magnetite by Bacteria. Environ. Sci. Technol. 1995, 29, 2535–2540. [Google Scholar] [CrossRef] [PubMed]
  83. Yamazaki, T. Reductive Dissolution of Biogenic Magnetite. Earth Planets Space 2020, 72, 150. [Google Scholar] [CrossRef]
  84. Morris, R.C. Genesis of Iron Ore in Banded Iron-Formation by Supergene and Supergene-Metamorphic Processes—A Conceptual Model. In Handbook of Strata-Bound and Stratiform Ore Deposits; Wolf, K.H., Ed.; Elsevier: Amsterdam, The Netherlands, 1985; Volume 13, pp. 73–235. [Google Scholar]
  85. Perring, C.S. Petrography of Martite–Goethite Ore and Implications for Ore Genesis, South Flank, Hamersley Province, Western Australia. Aust. J. Earth Sci. 2021, 68, 782–798. [Google Scholar] [CrossRef]
Figure 1. Macro photograph and BSE images of the Barberton BIF thin section. (a) Partial macro photograph of the Barberton BIF thin section. (b) BSE image of an iron-rich layer, featuring finer bands of hematite near the boundary between the iron-rich and silica-rich layers. (c) BSE image of a silica-rich layer, where the iron-rich and silica-rich layers gradually transition into one another in some areas, as illustrated in the lower section of the silica-rich layer in the BSE image. (d) BSE image of core-rim magnetite crystals in the iron-rich layer, with the magnetite core being indicated by black arrows. Additionally, euhedral hematite crystals or aggregates of hematite are observed in association with the core-rim magnetite crystals. (e) BSE image of core-rim magnetite. The darker regions within the core and at the boundary between the core and the rim are associated with the rough surface of the core rather than with any differences in material composition. Black arrows indicate the boundary between the core and rim magnetites. (f) BSE image of the core-rim magnetite and goethite, showing goethite (slightly darker contrast) overgrowing on the magnetite rim, with fibrous goethite being dispersed throughout the matrix. Abbreviations: mag—magnetite; hem—hematite; gt—goethite; qz—quartz.
Minerals 15 00218 g001
Figure 2. Results from SEM-EDS analysis. (a) A BSE image of the mapping area, with white arrows indicating analysis points from which EDS spectra were obtained for (cg). The magnetite core is indicated by black arrows. (b) EDS mapping images for Fe, Si, C, and P, with the C mapping clearly showing concentration in the magnetite core. (c) The EDS spectrum from the core of the magnetite. Si and P were detected along with C in the core. (d) EDS spectrum from the rim of the magnetite. Si and C were detected in the rim. (e) The EDS spectrum from hematite aggregates. Si and C were detected in the hematite aggregates, while P was not found in the hematite aggregates, in contrast to the presence of P in goethite. (f) EDS spectrum from goethite. C, P, Si, Mg, and Ca were detected in goethite. (g) EDS spectrum from the point where apatite was detected using Raman spectroscopy. The apatite is associated with CMs, as demonstrated by Raman spectroscopy (further details regarding this can be found in a figure that appears four figures later in this paper). The CMs contain S, and the high concentration of Si may be linked to unidentified silica minerals in proximity to the apatite crystal.
Minerals 15 00218 g002
Figure 3. Raman spectra in the range of 200–3500 cm−1 from the core and rim of an oxidized magnetite crystal. (a) Raman spectrum from the rim of the magnetite, with the analysis point being indicated by an arrow and the laser point being shown in the adjacent reflected light microscopy image. Fitted Raman bands are represented by dashed lines. A very weak band from CMs at 1570 cm−1 was detected alongside the bands of magnetite and hematite. (b) Raman spectrum from the oxidized magnetite core, predominantly detecting maghemite. Fitted Raman bands are indicated by dashed lines. A distinct band from CMs at 1572 cm−1 was detected alongside the bands of magnetite and maghemite. (c) Raman spectrum from the oxidized magnetite core, showing strong bands from CMs, with the analysis point being indicated by an arrow and the laser point being displayed in the adjacent reflected light microscopy image. A band from CMs at approximately 1350 cm−1 overlaps with the hematite band at around 1325 cm−1. Two prominent bands at approximately 1350 cm−1 and 1562 cm−1, along with a broad band at around 2850 cm−1 from CMs, were detected alongside the bands of magnetite, maghemite, and hematite. Further details regarding this in a figure that appears two figures later in this paper. Abbreviations: mag—magnetite; mgh—maghemite; hem—hematite.
Minerals 15 00218 g003
Figure 4. Raman spectrum of goethite. A faint band around 1600 cm−1, attributed to CMs, was observed.
Minerals 15 00218 g004
Figure 5. (a) Raman spectrum of the magnetite core with CMs in the 1000–1800 cm−1 region, including overlapping bands from hematite and maghemite. Fitted lines have been added: the solid line curve indicates hematite, while the dashed line curve represents maghemite. Abbreviations: mgh—maghemite; hem—hematite. (b) The residual Raman spectrum for the 1000–1800 cm−1 region, with fitted bands represented by dashed lines. Bands corresponding to CMs were detected at approximately 1103, 1191, 1350, 1497, 1563 and 1603 cm−1.
Minerals 15 00218 g005
Figure 6. (a) The Raman spectrum of the apatite and CMs from analysis point g in Figure 2. A band from the CMs at approximately 1350 cm−1 overlaps with the hematite band at around 1325 cm−1. Two prominent bands at approximately 1350 cm−1 and 1570 cm−1, along with a broad band at around 2850 cm−1 from CMs, were detected in addition to the bands of apatite and hematite. (b) The residual Raman spectrum for the 1000–1800 cm−1 region, with fitted bands represented by dashed lines. Bands corresponding to CMs were detected at approximately 1167, 1233, 1385, 1505, 1566 and 1612 cm−1.
Minerals 15 00218 g006
Figure 7. Illustration depicting the formation process of core-rim magnetite, progressing from stages a to g. (a) Precipitation of ferrihydrite in association with OM. (b) Ferrihydrite converts to magnetite nanoparticles through microbial reduction. (c) Magnetite microcrystals form via oriented attachment growth. (d) Further development into larger crystals occurs through the multistep oriented attachment process, forming the core of the magnetite. During the oriented attachment growth, OM is trapped at the grain boundaries, and this process continues during subsequent attachments in the multistep oriented attachment growth. In the processes depicted in (e,f), smooth magnetite rims form as new magnetite grows on the surfaces of existing magnetite crystals through further reduction processes, such as the thermochemical reduction of Fe3+. These smooth magnetite rims completely confine the OM within the magnetite core. (g) Oxidation by groundwater transforms magnetite into hematite and maghemite, while goethite grows around the oxidized magnetite.
Minerals 15 00218 g007
Disclaimer/Publisher’s Note: The statements, opinions and data contained in all publications are solely those of the individual author(s) and contributor(s) and not of MDPI and/or the editor(s). MDPI and/or the editor(s) disclaim responsibility for any injury to people or property resulting from any ideas, methods, instructions or products referred to in the content.

