Article

Organic Matter Accumulation Model of Jurassic Lianggaoshan Shale Under Lake-Level Variations in Sichuan Basin: Insights from Environmental Conditions

1
Shale Gas Evaluation and Exploitation Key Laboratory of Sichuan Province, Chengdu 610091, China
2
Technology Innovation Center of Shale Gas Exploration and Development in Complex Structural Areas, Ministry of Natural Resources, Chengdu 610091, China
3
Sichuan Keyuan Testing Center of Engineering Technology Co., Ltd., Chengdu 610091, China
4
Sichuan Institute of Energetical and Geological Survey, Chengdu 610091, China
*
Author to whom correspondence should be addressed.
Minerals 2025, 15(2), 159; https://doi.org/10.3390/min15020159
Submission received: 6 December 2024 / Revised: 20 January 2025 / Accepted: 30 January 2025 / Published: 9 February 2025
(This article belongs to the Special Issue Element Enrichment and Gas Accumulation in Black Rock Series)

Abstract

:
Organic matter (OM) is the primary carrier for the generation and occurrence of shale oil and gas. The combination of sequence stratigraphy and elemental geochemistry plays a crucial role in the study of organic matter enrichment mechanisms in marine shale, but it is rarely applied to terrestrial lacustrine basins. As a product of the last large-scale lake transgression in the Sichuan Basin, the Early Jurassic Lianggaoshan Formation (LGS Fm.) developed multiple organic-rich shale intervals, which is a good example for studying the OM enrichment in lacustrine basins. Based on a high-resolution sequence stratigraphic framework, the evolutionary process of terrestrial debris input, redox conditions, and paleo-productivity during the sedimentary period of the Lianggaoshan Formation lacustrine shale at different stages of lake-level variations has been revealed. The main controlling factors for OM enrichment and the establishment of their enrichment patterns have been determined. Sequence stratigraphy studies have shown that there are three third-order lake transgression-lake regression (T-R) cycles in the LGS Formation. The total organic carbon content (TOC) is higher in the TST cycle, especially in the T-R3 cycle, and lower in the RST cycle. There are differences in the redox conditions, paleo-productivity, terrestrial detrital transport, and OM accumulation under the influence of lacustrine shale deposition in different system tracts. The results indicate that changes in lake level have a significant impact on the reducibility of bottom water and paleo-productivity of surface seawater, but have a relatively small impact on the input of terrestrial debris. In the TST cycle, the reducibility of bottom water gradually increases, and the paleo-productivity gradually increases, while in the RST cycle, the opposite is true. Within the TST cycle, the OM accumulation is mainly influenced by paleo-productivity and redox condition of bottom water, with moderate input of terrestrial debris playing a positive role. In the RST cycle, the redox condition of bottom water is the main inducing factor for OM enrichment, followed by paleo-productivity, while terrestrial input flux plays a diluting role, which is generally not conducive to OM accumulation.

1. Introduction

At present, the academic community generally believes that the accumulation of organic matter (OM) in fine-grained sedimentary rocks, including shale, can be attributed to the influence of three factors: (1) increased supply of OM [1,2], (2) enhanced preservation of OM [3,4], and (3) dilution due to reduced non-OM sediments [5,6]. The accumulation of OM in fine-grained sedimentary rocks is controlled by complex, nonlinear interactions between these three factors [7,8,9,10,11]. The supply of OM is mainly represented by high paleo-productivity, which is usually the result of increased nutrient supply in surface water [12]. Upward flow, increased river runoff, and nutrient cycling are all beneficial for improving productivity [13,14]. In addition, appropriate terrestrial inputs can also directly supply organic matter (OM) [15]. The OM preservation is mainly related to the dysoxic (or anoxic) environment of the bottom water and the sinking rate of OM from the surface to the sedimentary interface. The former can reduce the degree of OM oxidation and decomposition [16], while the latter can reduce the time for OM oxidation and decomposition [17].
The dilution of non-OM is mainly related to sedimentation rate [9]. Moderate sedimentation rate can effectively improve organic carbon preservation and reduce oxidation, without significantly diluting OM [18]. However, excessively high sedimentation rates (enhanced flux of terrestrial debris, carbonate debris, authigenic minerals, etc.) can also dilute organic carbon concentration [19]. In recent years, many reports have suggested that sea-level (or lake-level) fluctuations seem to play a fundamental controlling role in the above three factors, indirectly controlling the accumulation of OM [20,21]. After the application of sequence stratigraphy theory to organic-rich shale formations, the impact of relative lake-level changes on OM enrichment can be better discussed [22].
The thickness of lacustrine shale in the Lianggaoshan Formation (LGS Fm.) of the Sichuan Basin ranges from 60 to 300 m, and the organic-rich interval with a TOC greater than 1% covers an area of approximately 9 × 10⁴ km2, making it a key target for terrestrial shale oil exploration and development in South China [23]. During the depositional process of LGS Fm. lacustrine shale, the depocenter of the lacustrine basin frequently migrated in the Eastern and Central Sichuan Basin. Along with the periodic changes in lake level, various paleo-environmental factors and their influences on OM accumulation in the lacustrine basin exhibit significant cyclicality and zoning [24]. Cheng et al. proposed that the LGS Fm. belongs to a delta-lake sedimentary system, which is divided into a complete 3rd-order sequence and four cycles of lake-level rise and fall (4th-order sequences) [25]. Fang et al. proposed that the OM enrichment in the upper part of the 1st Member and the middle lower part of the 2nd Member of the LGS Fm. is controlled by dysoxic conditions caused by high paleo-productivity and lake-level rise, while the OM enrichment in the upper part of the 2nd Member is controlled by dysoxic caused by terrestrial input and rapid burial [24].
However, there are few results on the differences in OM enrichment characteristics within different system tracts. This study is based on the complete core data of the Lianggaoshan Formation (Figure 1a), focusing on the influence of lake-level changes on OM accumulation. By combining various geochemical indicators related to paleo-redox conditions, paleo-productivity, and terrestrial debris input flux with the sequence stratigraphic framework, the main objectives of this research are: to (i) identify the variation of TOC and geochemical elements in different system tracts; (ii) compare the characteristics of the three factors during lake-level changes; and (iii) determine the influencing factors of OM accumulation and establish the enrichment mode of OM in different system tracts.

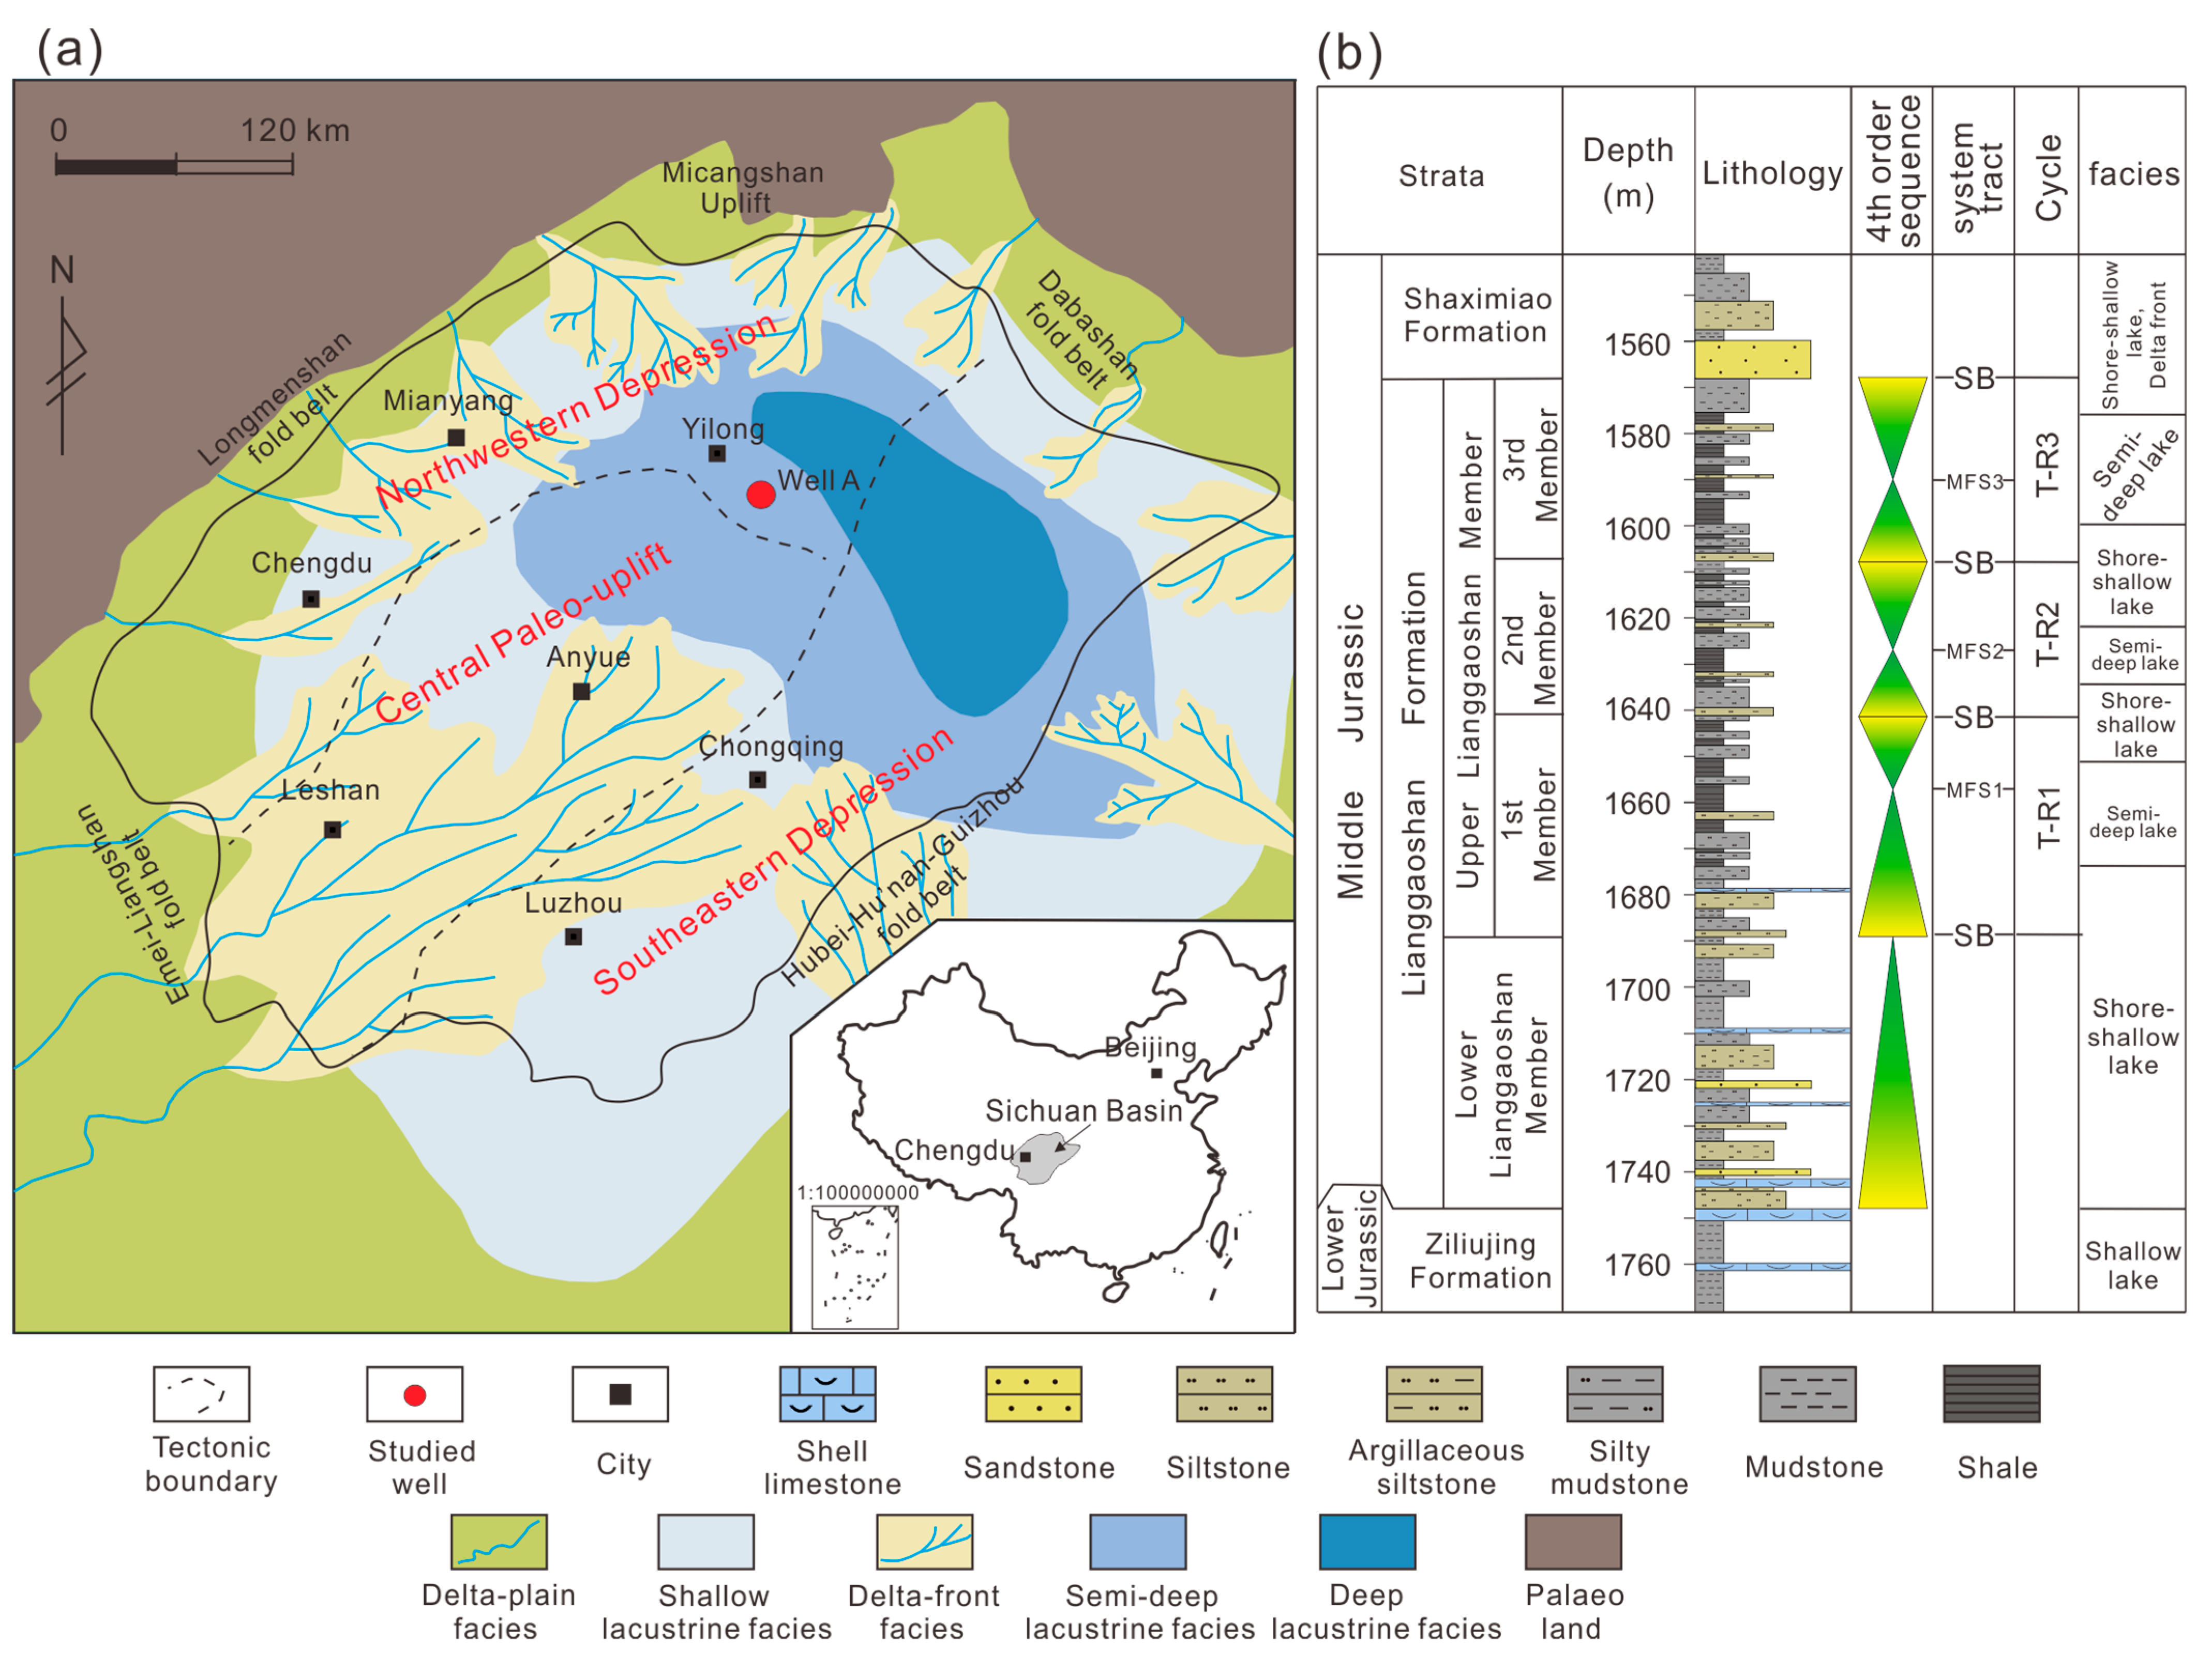
2. Geological Setting

The Lianggaoshan Formation (LGS Fm.) is a sedimentary product of the last large-scale lake transgression in the Jurassic, with a thick layer and extensive development of organic-rich shale [23,24,25]. According to the rock combination and cyclic changes, the LGS Fm. can be divided into the Upper Lianggaoshan Member and Lower Lianggaoshan Member (Figure 1b). The Upper Member can be further divided into three members, corresponding to three lake-level rise and fall cycles [25]. During the depositional period of the Upper Member, the lacustrine basin was in a shallow water state, dominated by oxic conditions, and the lithology was mainly composed of purple–red mudstone interbedded with gray–green sandstone. During the depositional period of the Lower Member, the lacustrine basin deepened, and the sedimentary lithology consisted of dark fine-grained sedimentary rock interbedded with thin sandstone, with a stable distribution throughout the Sichuan Basin. Multiple intervals of organic-rich shale have been identified [23].

3. Methodology

3.1. Sample

Thirty-three lacustrine shale samples were collected from Well A (Figure 1a). During sampling, each sample is only spaced 1.5 m–2.5 m apart to ensure that the sample records continuous variations in the paleo-environmental conditions. The average spacing is 1.9 m, and the relative standard deviation is 0.31 m.

3.2. Experimental Methods

Thirty-three samples were measured for TOC values by a Leco carbon/sulfur analyzer (model CS600, LECO Corporation, San Jose, CA, USA) at the PetroChina Key Laboratory of Unconventional Oil and Gas Resources, with an analytical precision of ±0.5%. Thirty-three samples were measured for bulk mineralogical and <2 μm clay fraction mineralogical analysis by X-ray diffraction (XRD) (model Rigaku Ultima IV, Rigaku Corporation, Tokyo, Japan), performed at the James Hutton Limited Laboratory. A total of 17 samples were measured for Element composition analysis. The concentration of major elements was determined by X-ray fluorescence (XRF) spectroscopy (model PE 5300V, PerkinElmer, Inc., Waltham, MA, USA), with an accuracy better than 1% for all major oxides. Trace and rare elements were measured using inductively coupled plasma-mass spectrometry (ICP-MS) (model 7700 Series ICP-MS, Agilent Technologies Inc., Santa Clara, CA, USA), with analytical uncertainties estimated at 5%.

3.3. Index Calculation

Enrichment factor (XEF) can eliminate the influence of terrestrial debris. Al element is not easily affected by weathering or alteration after sedimentation, so Al is often used for normalization, and its formula is as follows: XEF = (X/Al)sample/(X/Al)standard
Among them, X and Al represent the concentrations of the element and Al in the sediment, respectively. Standard represents the standard for measuring the degree of enrichment, often using PAAS as the standard [24,25,26]. If XEF > 1, it indicates that the element is relatively enriched. If XEF > 3, it indicates that the element is significantly enriched [27].
The calculation method for the content of trace elements in sediments that are not of detrital origin (biogenic or authigenic-enriched) is as follows [28]: Eorg (or Ebio) = Esample − Alsample × (E/Al)detr.
Ebio represents the organic or biological portion of element E that exceeds a specific terrestrial input standard. Esample and Alsample are the abundances of E and Al elements in the sample, respectively. (E/Al)detr is the ratio of the average abundance of E and Al under a specific standard. In this study, (E/Al) detr is the minimum value that crosses the origin in the intersection diagram of E and Al [28,29], and we calculated (P/Al)detr and (Ba/Al)detr are 0.0047 and 0.0058, respectively. The differentiation of rare earth elements (REEs) in sediments is commonly characterized by (La/Yb)N, and its calculation formula is as follows: (La/Yb)N = (La/Yb)sample/(La/Yb)standard. PAAS value applied to REE standardization [26]. The ratio of light and heavy REEs in the total rare earth content can also reflect the degree of REE differentiation, and its calculation formula is as follows: LREE/HREE= Σ (La:Eu)/Σ (Gd:Lu). Corrected chemical index of alteration (CIA*) = [Al2O3/(Al2O3 + CaO* + Na2O + K2O)] × 100% [27]. All oxide units are in moles. This study referred to the method proposed by McLennan et al. to calibrate the CaO content [30].

4. Results

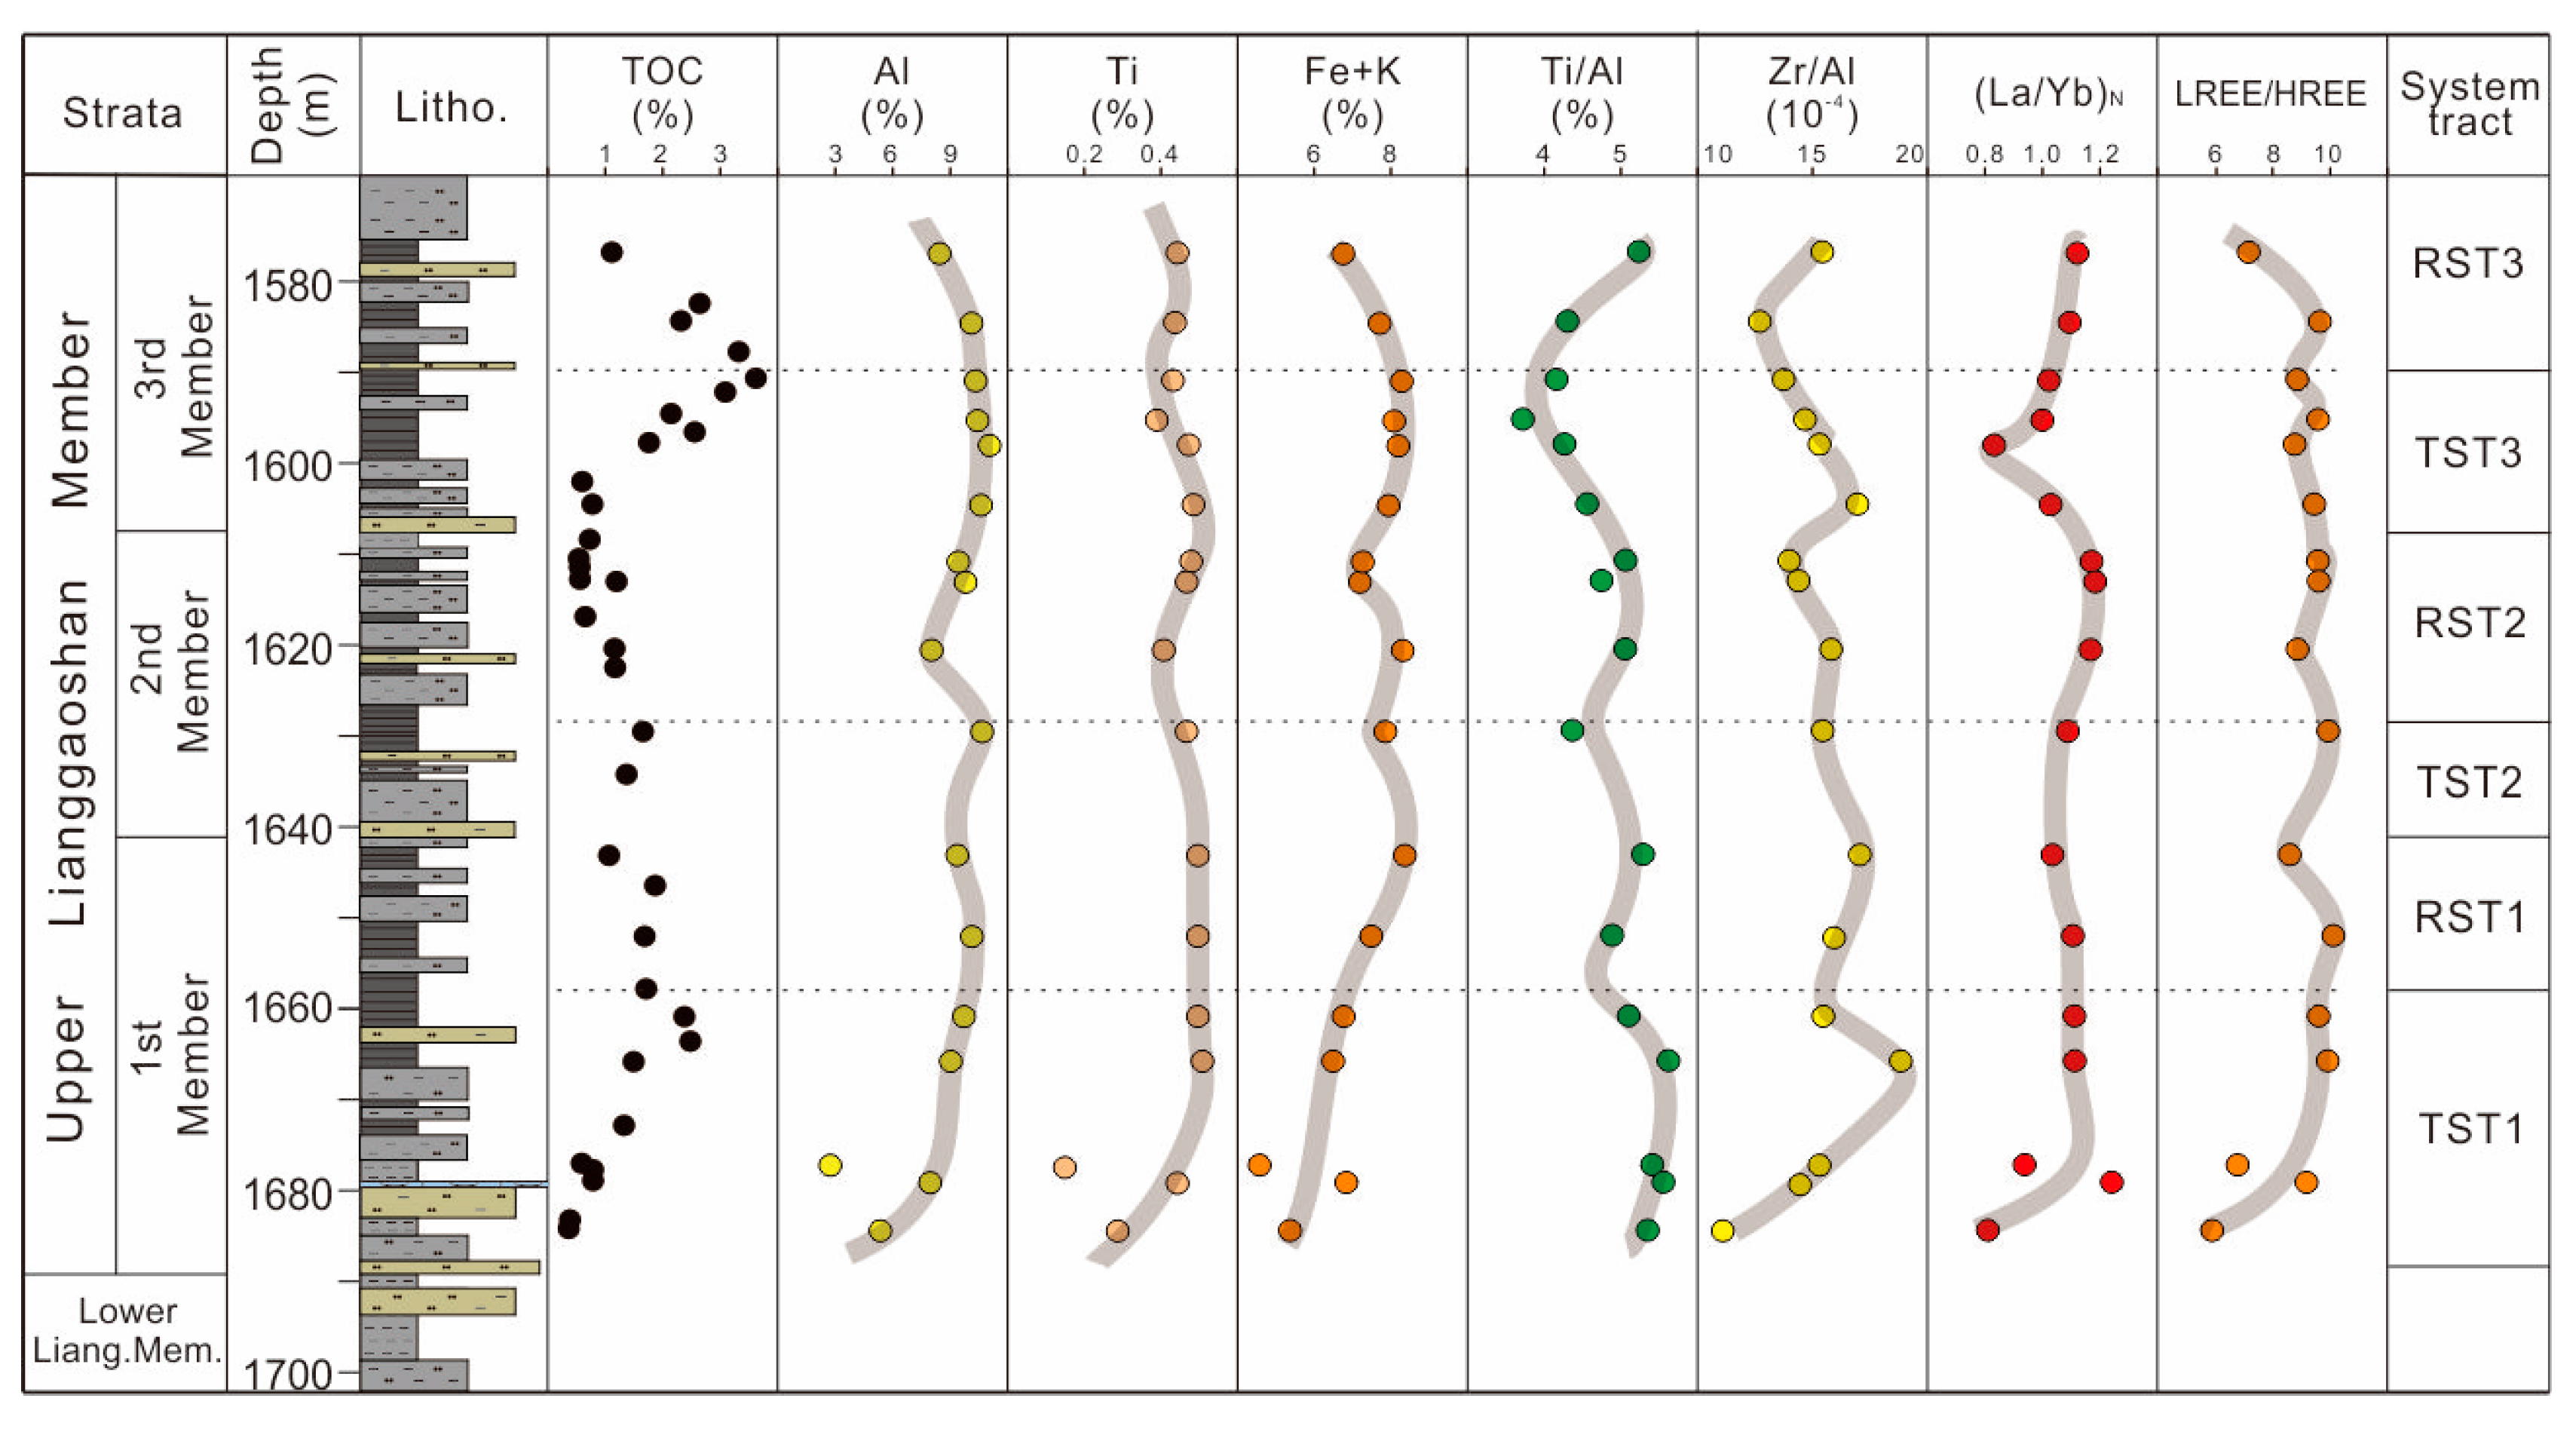
4.1. Mineralogy and Shale Lithofacies

The XRD results indicate that the mineral components of the lacustrine shale in the LGS Fm. are mainly quartz and clay, followed by plagioclase, and basically do not contain K-feldspar (Table 1). The content of siliceous minerals is distributed between 24.5 and 66.2% (average of 51.40%), clay minerals between 13.3 and 57.2% (average of 43.34%), and carbonate minerals between 0 and 15.0% (average of 2.5%, excluding shell limestone samples in TST1). The overall content of pyrite is relatively low, ranging from 0 to 5.4% (average of 1.01%). The changes in mineral composition and lithological triangulation results indicate that the shale lithology of the LGS Fm. is complex, mainly consisting of clayey shale rich in siliceous minerals and siliceous shale rich in clay (Figure 2a). Lithofacies changes reflect the shale interval rich in silt in both the transgression system tract (TST) and the regression system tract (RST). It is suggested that gravity flow was triggered during the low lake-level period, and a small amount of crust and silty debris were brought in by terrestrial input [31]. There are significant differences in mineral content within different system tracts. For example, the TST has a high content of quartz, clay, and pyrite. The content of kaolinite and chlorite in the clay mineral composition of the TST is relatively high (Figure 2b). However, the proportion of plagioclase, carbonate minerals, and illite in the RST is relatively high.

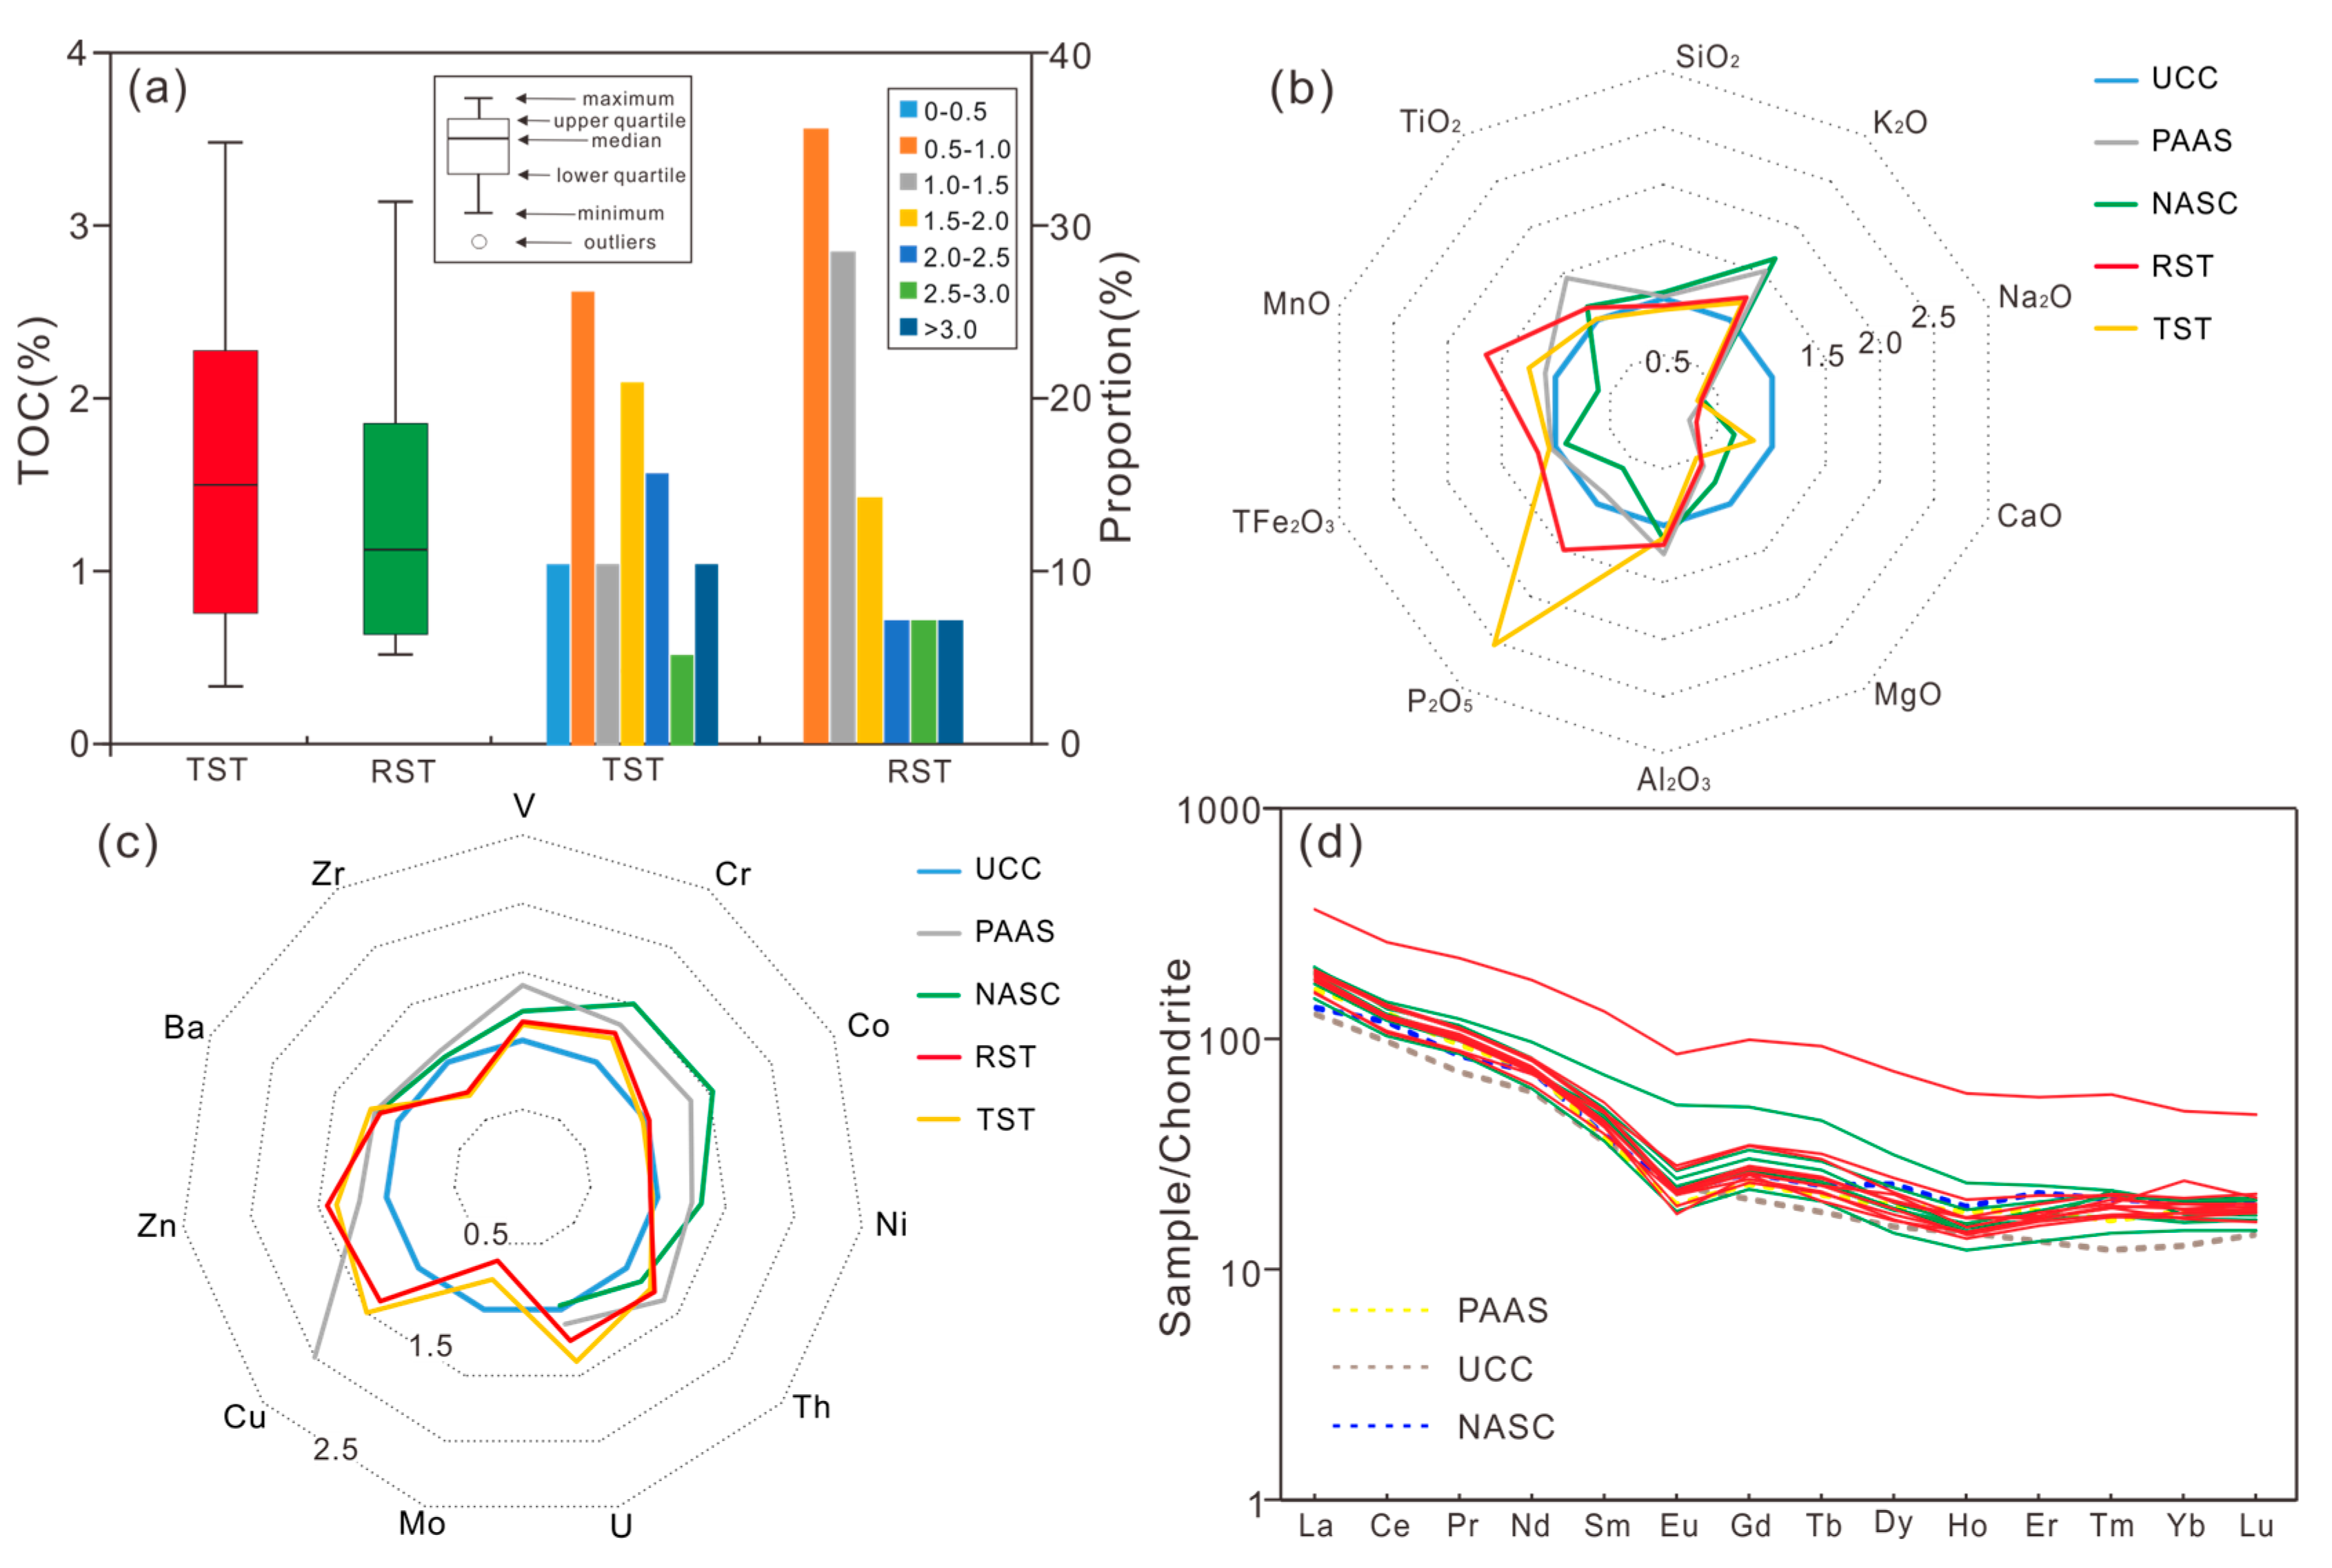
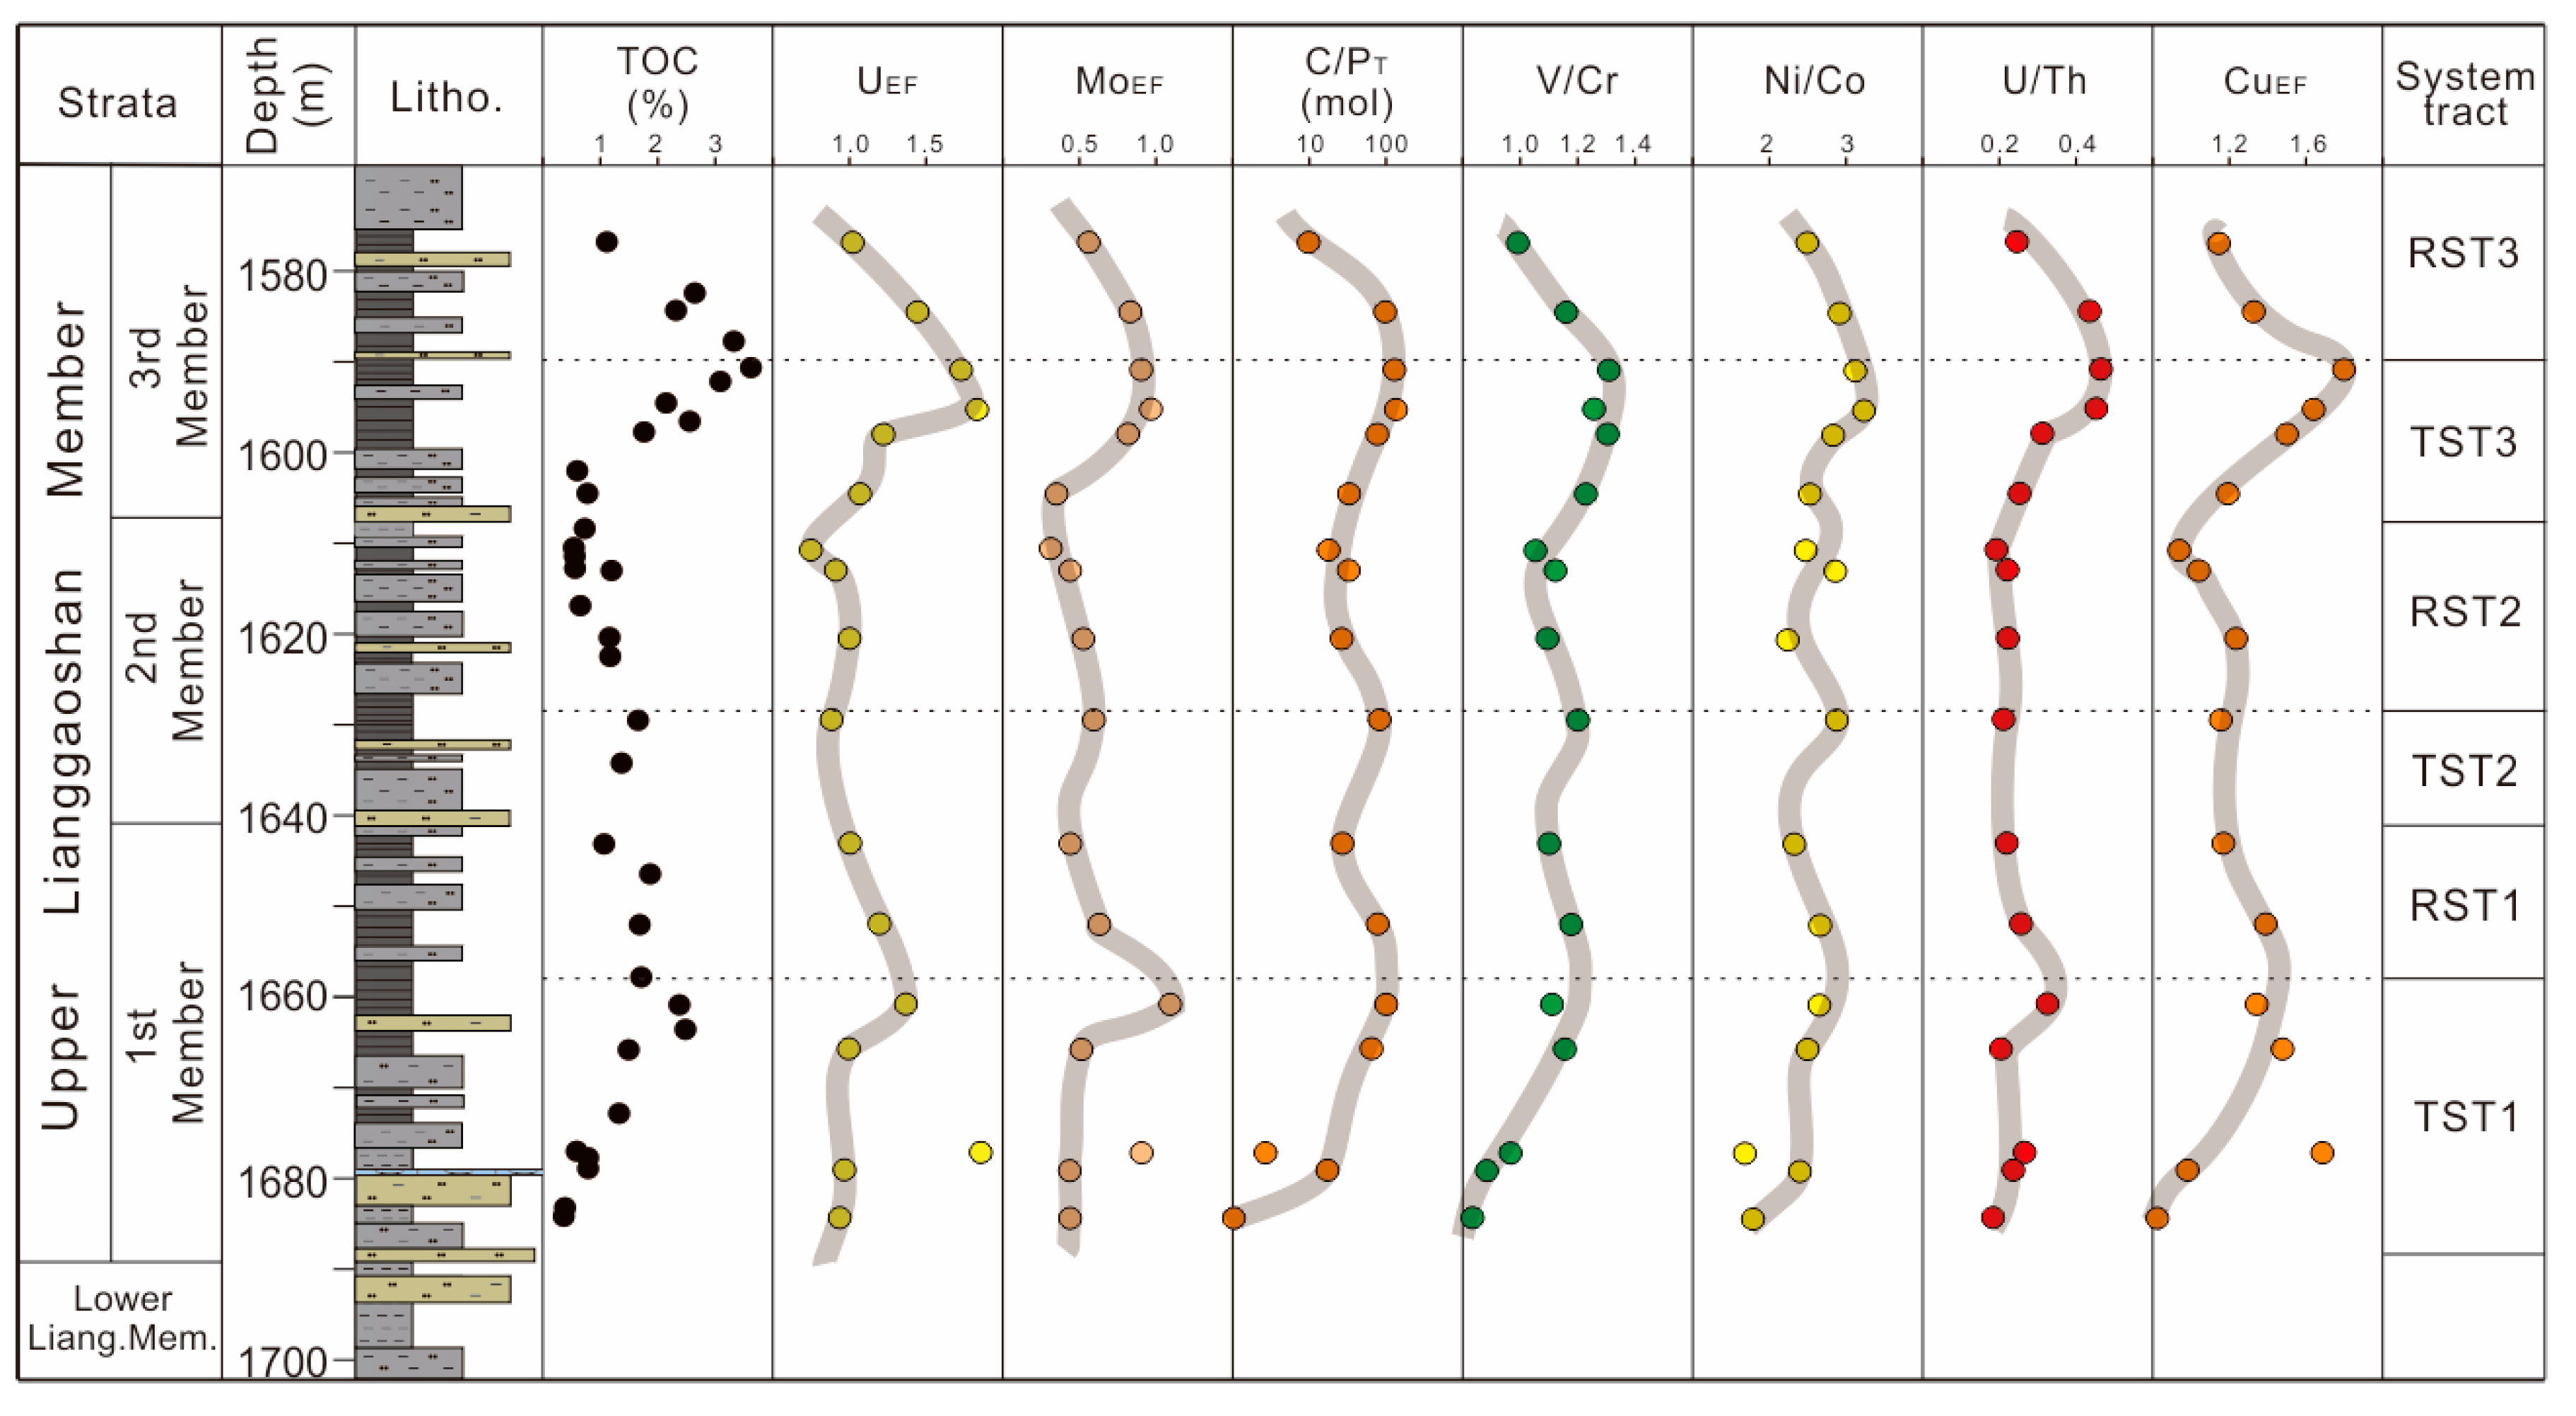
4.2. Organic Carbon Content

The vertical variation of TOC indicates that during different T-R cycles (Figure 3), the TOC content shows a trend of first increasing and then decreasing as it transitions from the TST to the RST. It is worth noting that the TOC in the T-R3 cycle is generally higher than in other cycles. TOC is relatively high within the TST (Figure 4a), distributed between 0.35 and 3.48% (average of 1.58%), while it is relatively low within the RST, distributed between 0.53 and 3.14 (average of 1.37%) (Table 1). Specifically, TOC is mainly distributed in the 0.5%–1.0% and 1.5%–2.5% ranges within the TST, while it is distributed in the 0.5%–2.0% range within the RST (Figure 4a).

4.3. Element Content

The major oxides in LGS Fm. lacustrine shale are SiO2, Al2O3, and Fe2O3, with average values of 56.11%, 17.09%, and 6.91%, respectively. The distribution of major elements after UCC standardization shows significant differences compared to PAAS and NASC (Figure 4b). The CaO content is low and significantly lower than UCC, PAAS, and NASC, with only a few samples enriched in the transgression system tract (TST), which may be related to the high content of shell fossil fragments (Figure 1). The Na2O content is also lower than that of PAAS, NASC, and UCC, suggesting a lower content of plagioclase in the provenance rock, which may be related to the provenance of acidic magmatic rocks. Mg is relatively deficient in various system tracts compared to UCC, but close to PAAS and NASC. P and Mn are more enriched in some samples compared to PAAS, NASC, and UCC. The enrichment of P may be related to higher paleo-productivity or apatite precipitation, while the enrichment of Mn is related to carbonate mineral composition [15,34]. The content of Ti, Al, K, and Fe is close to that of PAAS, NASC, and UCC.
The distribution of trace elements normalized to UCC is basically consistent with PAAS and NASC (Figure 4c), but there is a significant difference in amplitude. The trace element content of a few samples in the TST is low, especially the detrital elements Ti, Zr, and Al from terrestrial inputs is low. It is suggested that the carbonate components are relatively high, while the terrestrial inputs that provide other element supplies are few. After normalization, the distribution of U, Th, Co, and Ni content is shown in the UCC baseline attachment. Mo in lacustrine shale shows a loss relative to UCC. U, Cu, and other elements show relatively high enrichment. The total REE content is between 156.51 and 438.84 ppm, with an average of 207.92 ppm. The REE distribution normalized to Chondrite is similar to that of PAAS, NASC, and UCC, which is characterized by light REE enrichment and Eu negative anomaly (Figure 4d). REE is generally consistent in different system tracts, with poor differentiation, which may be related to the stable and single source of REE during depositional processes [26,32].

4.4. Terrestrial Input Proxies
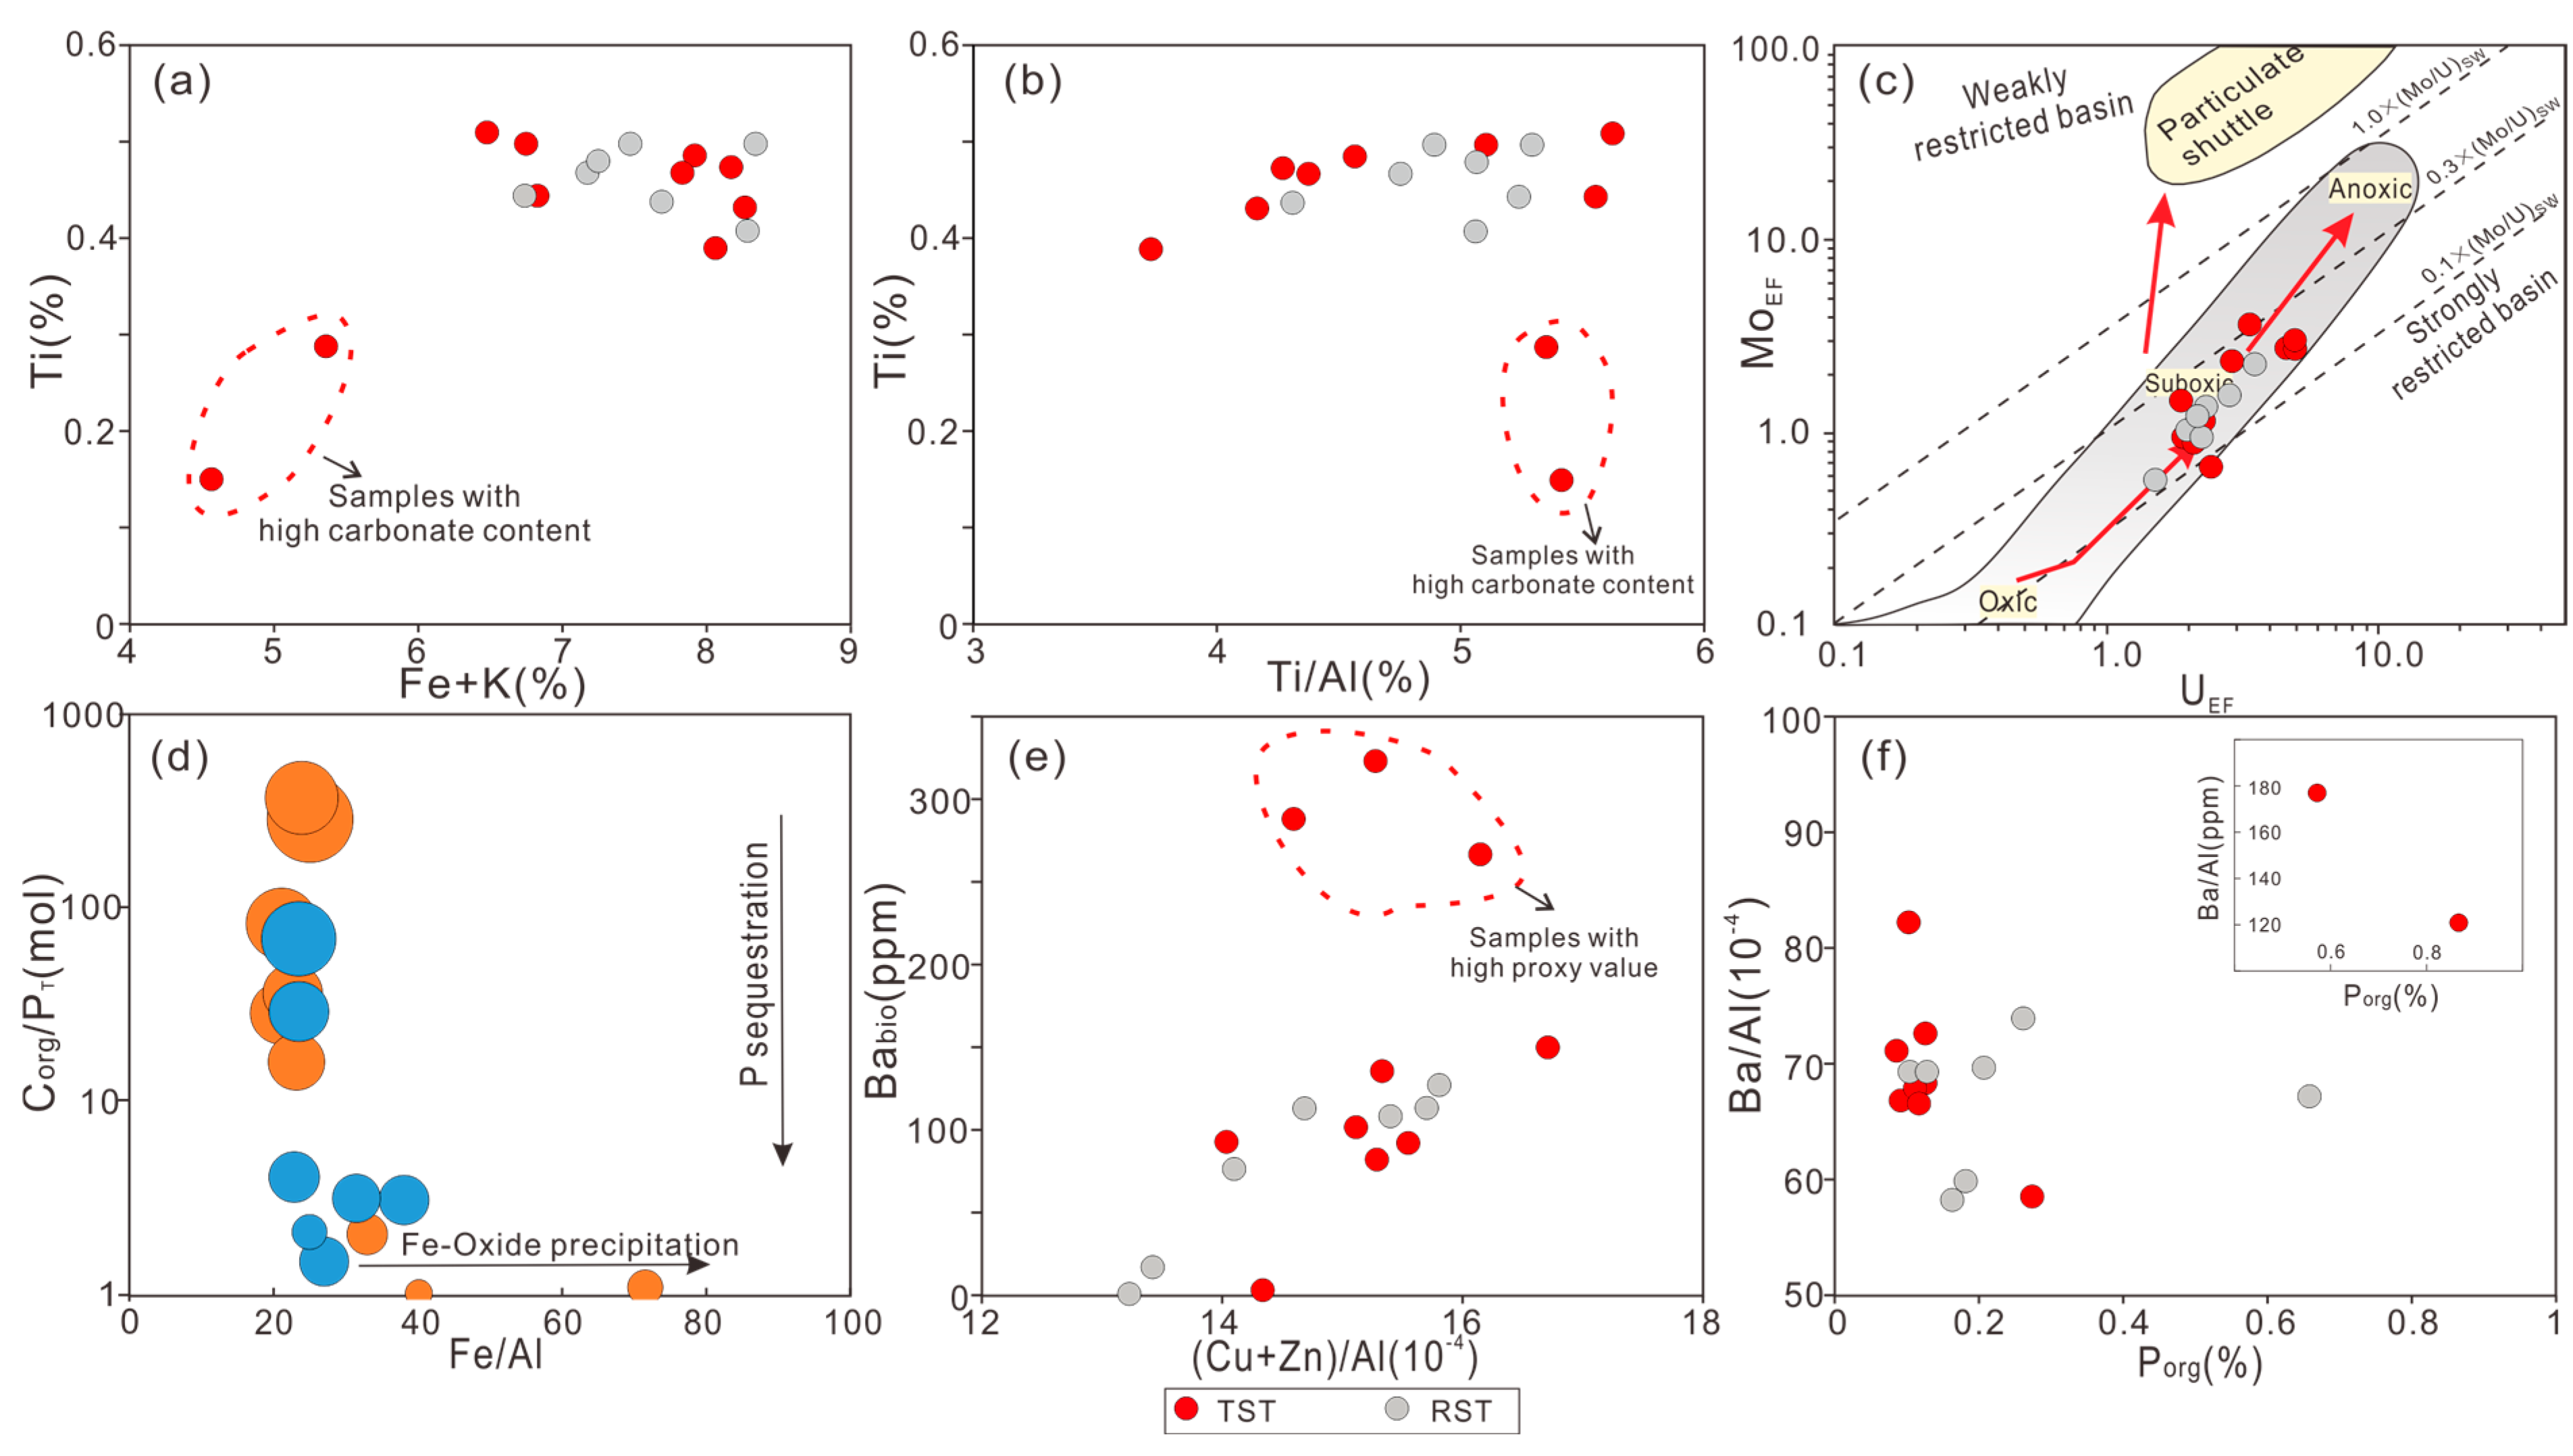
Al, Ti, and Zr are usually difficult to migrate during deposition and diagenesis and are often used as indicators to characterize the flux of terrestrial debris [35]. The vertical variation trend of Al and Ti content is basically consistent (Figure 3), showing a significant increase only in TST1, and little change in other system tracts. Based on the average value, both are slightly higher within the RST (mean of 9.37% and 0.46%, respectively) than HST (mean of 8.82% and 0.41%, respectively). (Fe + K) is also a practical indicator for characterizing the input of terrestrial debris [36]. The average content within the RST (mean of 7.02%) is higher than the TST (mean of 7.56%). Within the T-R1 cycle, (Fe + K) fluctuates significantly and shows a gradually increasing trend (Figure 3).
Ti/Al and Zr/Al are commonly used to determine the strength of debris inflow. High Ti/Al and Zr/Al ratios represent coarse particles and relatively high sedimentation rates [37]. The Ti/Al ratio is slightly lower in the TST (average of 4.81%) than in the RST (average of 4.94%) (Figure 3). After reaching its lowest value during the lake flooding period of the T-R3 cycle, the Ti/Al ratio gradually increases slowly. The vertical variation process of the Zr/Al ratio is basically the same as that of Ti/Al, but the former shows a slowly increasing trend in the early TST1. REE exists in water by binding with debris or suspended solids, and the length of its residence time in water can cause differences in the degree of REE differentiation. When the sedimentation rate is high, the REE sedimentation rate is fast and the contact time with clay minerals is short, resulting in a low differentiation degree [38]. (La/Yb)N and LREE/HREE are reliable indicators for characterizing the degree of REE differentiation. When (La/Yb)N or LREE/HREE is low, it reflects a weak degree of REE differentiation and corresponds to a relatively high sedimentation rate. The (La/Yb)N of LGS Fm. lacustrine shale is distributed between 0.81 and 1.24, with an average of 1.06, and the high value appears within RST2 (Figure 3). The LREE/HREE distribution ranges from 5.89 to 10.14, with little variation in different system tracts, with an average value of 8.93.

4.5. Redox Proxies

Redox-sensitive elements (Mo, U, Ni, V, etc.) exhibit significant enrichment under reducing conditions and can be used to characterize the environmental conditions of bottom water [39,40]. Element enrichment factors and bimetallic ratios are often used to evaluate paleo-redox conditions [41]. In the LGS lacustrine shale, UEF and MoEF range from 0.7 to 1.89 (average of 1.19) and from 0.32 to 1.09 (average of 0.63), respectively. The UEF and MoEF did not show significant enrichment, and their variation trends were consistent (Figure 5). The average content of UEF and MoEF in the TST (1.29 and 0.70) is higher than the RST (1.05 and 0.53), reflecting a trend of enrichment to slight loss. In addition, the content of UEF and MoEF is higher during the T-R3 cycle compared to other periods.
The vertical variation trends of U/Th, V/Cr, and Ni/Co values are similar to the enrichment factors. In different T-R cycles, these values show a trend of first increasing and then decreasing, and reaching their maximum during the lake flooding period of the T-R3 cycle (Figure 5). Similar to the above indicators, C/PT and CuEF also increased within TST1, while slowly decreasing in RST1-RST2. These indicators rapidly increase in TST3 and reach their peak near the maximum lake level before rapidly decreasing (Figure 5).

4.6. Productivity Proxies

P, Ba, Zn, Cu, and other life elements or nutrients are commonly used to form indicators of paleo-productivity [27,40]. However, these elements may be affected by factors such as redox conditions and diagenetic environment during application. P is an essential nutrient for phytoplankton growth, but it has high solubility under reducing conditions and is easily released from sediments into the water column [42]. Most Ba in sediments exists in the form of barite. Ba forms together with sinking and decaying organic matter (OM) but is lost in the form of barium sulfate during strong sulfate reduction. This mechanism may affect the accuracy of the reference standard for Ba [42]. Zn and Cu were initially considered important nutrients for planktonic organisms, which bind to OM in the form of organic metal complexes and are transported to sediments [43]. Due to the release and cycling processes of these elements, their low values do not indicate low paleo-productivity [43].
In the LGS Fm. shale, the P content ranges from 0.05 to 0.89 (average of 0.17). The P content decreases first and then increases in different T-R cycles (Figure 6). However, Cu content first increases and then decreases during the T-R cycles (Figure 6). The Cu content is higher in the TST (average of 40.07) than in the RST (average of 34.88). The Cu content shows an upward trend in TST1 and a downward trend in RST1. The variation trend of P is opposite to that of Cu. The overall distribution of Cu through T-R2 shows a gradually decreasing trend. P increases upwards through TST2 and gradually decreases upwards through RST2. In T-R3, the Cu content first increases and then decreases, while the P content slowly decreases in TST3. In RST3, the P content significantly increased (Figure 6).
In order to eliminate the influence of terrestrial debris input, this study normalized the elemental indicators using the Al element. In the LGS Fm. shale, (Cu+Zn)/Al and Ba/Al range from 13.21 to 16.7 (average of 14.97) and from 58.31 to 175.08 (average of 77.03), respectively. The trend of these two indicators is basically the same, but the magnitude of their increase is different. Vertically, (Cu+Zn)/Al and Ba/Al decrease slightly in the early sedimentary stages and gradually increase in the late stages during the Jurassic Lianggaoshan Formation (Figure 6). The (Cu+Zn)/Al and Ba/Al were significantly higher in the TST (average of 15.23 and 84.15, respectively) than in the RST (average of 14.61 and 66.86, respectively). Without considering outliers, the high values of paleo-productivity indicators are mainly located in the T-R3 period. Porg and Babio were also used to determine paleo-productivity variation in surface lake water. These two indicators have the same trend of change in the T-R1 and T-R2 periods, but their trends of change in the T-R3 period are opposite. Specifically, Babio and Porg decrease upwards through TST1, reach their minimum value at RST2, and gradually increase from TST3 onwards (Figure 6).

5. Discussion

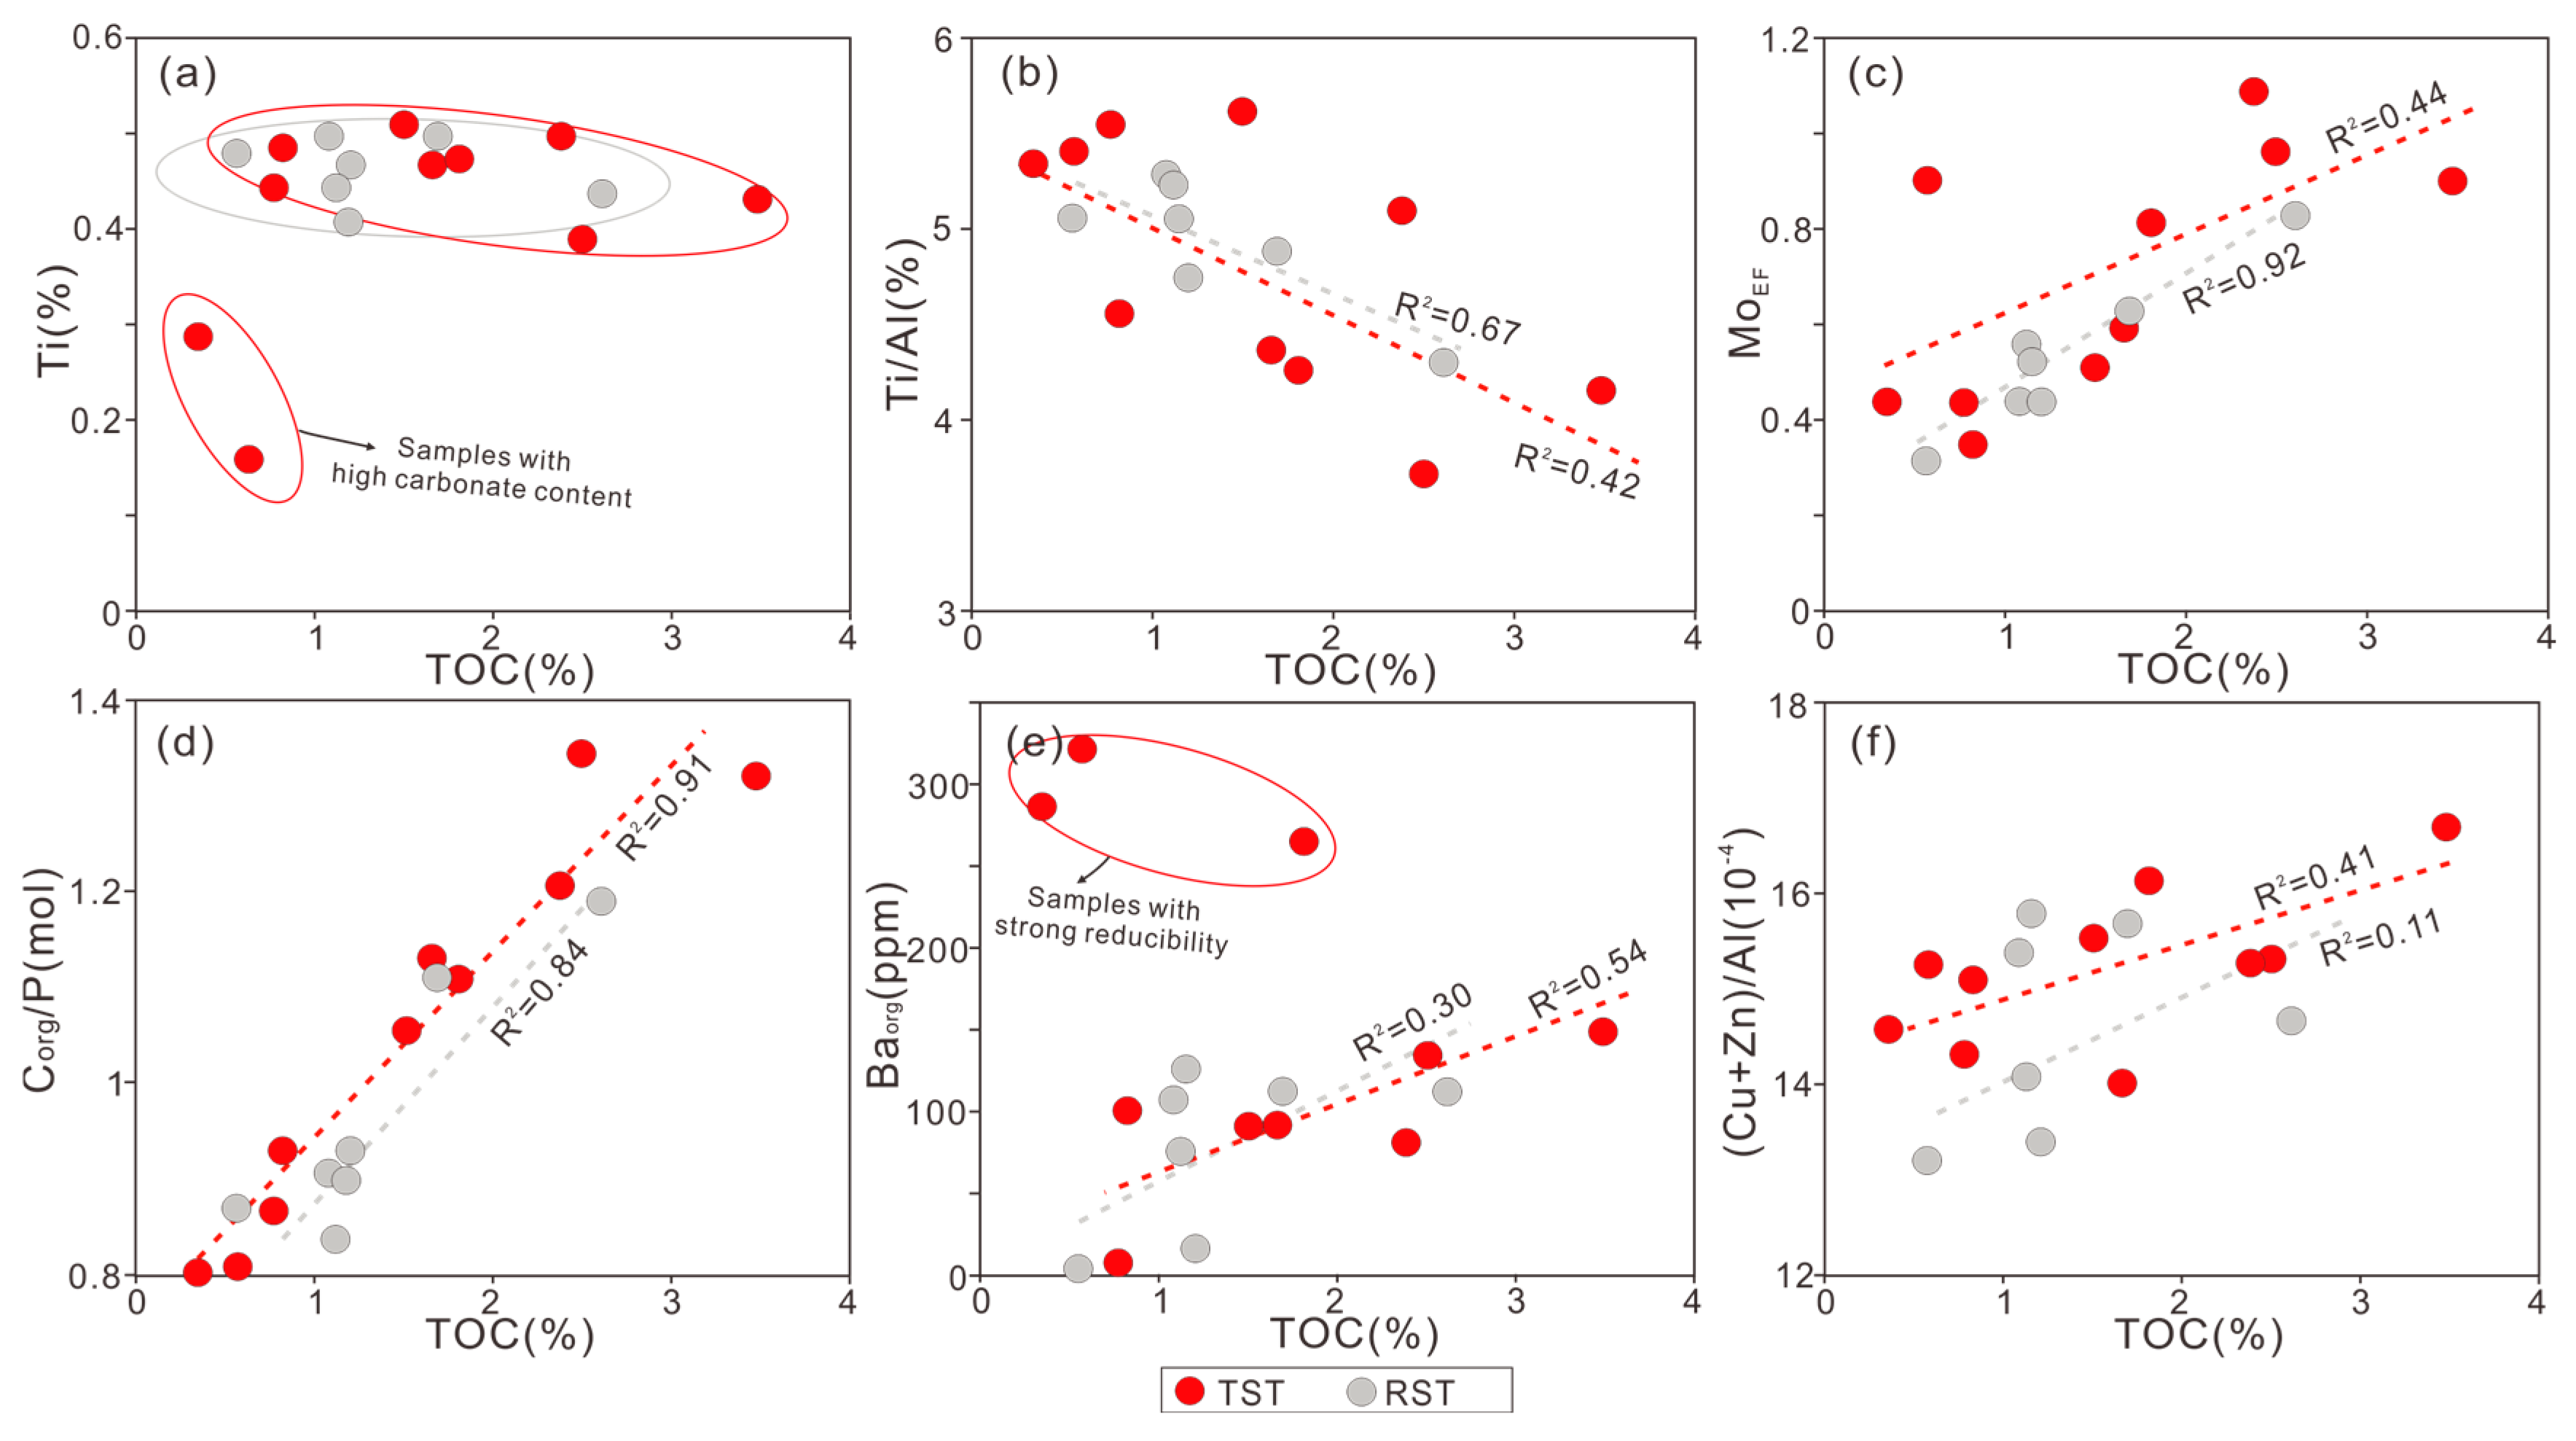
5.1. Effect of Relative Lake-Level Change on Detrital Flux, Redox Conditions, and Productivity

Combining the vertical evolution process of debris flux, redox conditions, and paleo-productivity indicators, the evolutionary characteristics of OM enrichment factors have been restored. The impact of lake-level changes on these factors is evaluated. Ti and (Fe+K) have little difference in different system tracts. The average terrestrial input of the TST is slightly lower than the RST, suggesting that the terrestrial input in the lacustrine basin is small (Figure 7a). As the lake level changes, the fluctuation amplitude of Ti and Al is small (Figure 4). During the high lake-level period, the lacustrine shale in other basins experienced a decrease in terrestrial input [6,21]. However, the Lianggaoshan Fm. did not exhibit the above characteristics. The impact of lake-level changes on debris input is minimal.
The content of Al and Ti reached high values in the lake flooding surfaces of different T-R cycles (Figure 4), reflecting a high level of terrestrial debris input. It is suggested that during the lake flooding period, the humid climate and strong weathering led to an increase in the terrestrial inorganic mineral debris input, while gravity flow events occurred frequently (Figure 8). The small variation of Ti/Al and LREE/HREE in different cycles indicates a relatively low sedimentation rate (Figure 4). The sedimentation rate slowly decreases from TST1 to TST3 and slightly increases to RST3. There is a weak correlation between sedimentation rate and input of terrestrial debris (Figure 7b). The variation curves of Zr/Al and Ti/Al reflect that the sedimentation rate increases with the rise of lake level in different T-R cycles. However, the sedimentation rate slowly decreased in the RST, indicating that the sedimentation rate was affected by the rise and fall of the lake level. The variation trend of Ti/Al is basically consistent with that of Al/Si and Zr/Rb, indicating that the sedimentation rate is significantly influenced by hydrodynamic conditions and particle size, which verifies the controlling effect of lake-level changes on sedimentation rate.
Based on the UEF-MoEF cross-plot [27], the bottom water of the LGS lacustrine basin is dominated by suboxic conditions, and the oxygen content in the bottom water of the TST is lower than that of the RST (Figure 7c). The trend of changes in element enrichment factor and bimetallic ratio is basically consistent, showing an increasing trend in different T-R cycles. These two indicators reach their maximum values during the lake flooding period and then slowly decrease (Figure 5), indicating that the redox conditions of the bottom water are significantly affected by changes in lake level. Especially during the high lake-level period of the T-R3 cycle, the reducibility of bottom water is the strongest (Figure 5). The low values of redox indicators are mainly concentrated in the late RST period with relatively low lake levels, which is attributed to the mixture of oxygenated surface water and bottom water. During the high lake-level period, terrestrial oxygen-rich sediments accompanied by surface runoff have difficulty reaching the bottom of the basin, which is conducive to maintaining low-oxygen conditions. The changes in the redox index and Sr/Ba were not consistent, with the latter reaching its lowest value during the T-R3 lake flooding period. This indicates that deeper brackish water is not conducive to water stratification and preservation under low oxygen conditions [4]. This may be related to low salinity, humid climate, and frequent terrestrial inputs. The Fe/Al-Corg/PT cross plot indicates that there is a significant amount of P dissolution and cycling under reducing conditions during the sedimentation process (Figure 7d), and the positive feedback generated significantly reduces the oxygen content of the TST bottom water [13,44].
Figure 8. Vertical variation characteristics of paleoclimate, paleo-weathering, paleosalinity, hydrodynamic condition, and provenance proxies in the Lianggaoshan Member at well A. Sr/Cu (Paleoclimate) [45], CIA (Paleoweathering) [29], Fe/Mn (Paleoclimate) [46], ln(Al2O3/Na2O) (Paleoweathering), Al/Si (Sediment sorting and particle size) [47], Zr/Rb (Particle size and hydrodynamic conditions) [48], Sr/Ba (Paleosalinity) [49], Co/Th-La/Sc (Provenance) [50].
Minerals 15 00159 g008
The longitudinal evolution of Cu and (Cu+Zn)/Al shows that the accumulation of paleo-productivity in the TST is higher than that in the RST (Figure 6), with paleo-productivity increasing within the TST and decreasing within the RST, indicating that paleo-productivity is influenced by lake level fluctuations. In humid climates, the large input of surface runoff brings abundant terrestrial nutrients, which is beneficial for improving paleo-productivity (Figure 8). The provenance in the study area is relatively stable, and the influence of differences in parent rock composition on paleo-productivity is relatively weak (Figure 8). Ba/Al and Baorg did not change along with the lake level (Figure 6). Ba/Al and Baorg reach their maximum values before approaching the lake flooding surface during the T-R cycle, attributed to the susceptibility of Ba to the influence of oxygen content, resulting in low values due to dissolution at relatively low oxygen levels during lake flooding. The positive correlation between Baorg and (Cu+Zn)/Al also indicates the normal trend of Baorg under weak reduction conditions (Figure 7e). The variation of P is opposite to other indicators, especially during high lake-level periods, which is related to the existence of P cycling processes in the study area. P in sediment can adsorb onto Fe and Mn hydroxides or directly form precipitates and remain under oxidative conditions. At low oxygen levels, P tends to be released from OM and enter the water body [44]. This cyclic process first increases the P content in the water by continuously releasing P, which is beneficial for improving paleo-productivity. Meanwhile, oxidation and decomposition during the decline of paleo-productivity consume oxygen, improving the reducibility of bottom water. The reducibility of bottom water promotes the release of P from sediments into water, further enhancing paleo-productivity and forming a positive feedback loop. As a result, the sediment in the TST reflects high productivity, low oxygen, and high TOC, but corresponds to low P content (Figure 7f).

5.2. Effect of Relative Lake-Level Variation on OM Accumulation

5.2.1. Effect of Single Factor on OM Accumulation

The cross-plot of terrestrial input, redox, and paleo-productivity indicators and TOC is shown in Figure 9. The Ti content showed a weak negative correlation with TOC in the TST (excluding samples with high carbonate content) and the RST (Figure 9a), suggesting that terrestrial debris input has a certain dilution effect on OM accumulation. However, the weak correlation reflects the existence of terrestrial OM supply during the low lake-level period. Ti/Al is negatively correlated with TOC in the TST and RST (Figure 9b), indicating that the sedimentation rate is unfavorable for OM enrichment. It can be reasonably inferred that the terrestrial OM brought by terrestrial debris is not sufficient to compensate for the consumption of oxidative decomposition in water, proving that higher sedimentation rates in lacustrine basins dilute OM.
MoEF showed a positive correlation with TOC within the TST (R2 = 0.92) (Figure 9c), indicating that the redox conditions of bottom water play a key role in OM enrichment. However, MoEF and TOC showed a positive correlation within the RST (R2 = 0.44) (Figure 9c), indicating that OM enrichment is not only influenced by the redox conditions. Overall, the low oxygen level in water has a significant positive effect on the preservation and enrichment of OM. Corg/P and TOC show a good correlation in different system tracts (Figure 9d), indicating that high burial efficiency and P cycling strength are beneficial for OM enrichment. In the TST, there is a positive correlation (R2 = 0.54) between TOC and Baorg (excluding three low-value samples with high reducibility) (Figure 9e), while (Cu+Zn)/Ti is also positively correlated with TOC (R2 = 0.41) (Figure 9f), indicating that productivity changes also play a key role in OM enrichment. In the RST, TOC showed a weak correlation with Baorg and (Cu+Zn)/Ti, indicating that paleo-productivity played a positive role in OM (Figure 9e,f).

5.2.2. Effect of Multiple Factors on OM Accumulation

The scattered distribution of the bubble plot indicates that the aggregation of OM in the lacustrine basin is the result of the synergistic effect of multiple factors and intensities (Figure 10). For the RST, TOC is relatively low, and OM enrichment is mainly influenced by redox conditions (Figure 10d), with dilution effects from terrestrial inputs (Figure 10a). Only under relative reduction conditions does the paleo-productivity of the RST play a certain promoting role (Figure 10e,f). In addition, moderate terrestrial inputs contribute to OM enrichment (Figure 10b) but are affected by the level of paleo-productivity and redox conditions, otherwise, a certain dilution effect will occur (Figure 10b,c). For the TST, the influence of paleo-productivity on OM enrichment is increased (Figure 10e,f). Redox conditions also play a key role in OM aggregation (Figure 10b,d), and OM enrichment is influenced by both redox and paleo-productivity. From the distribution of data points, terrestrial inputs have little negative impact on OM aggregation and even have a positive impact (Figure 10).
To verify the accuracy of the bubble-plot, the principal component (PC) analysis method was used to quantify the influence of various factors on OM aggregation in different system tracts, following the method proposed by Shi et al. [38]. The principal component scores of samples from different system tracts were calculated using indicators of terrestrial detrital input, paleo-productivity, and redox as factors. The PC scores with high correlation with TOC within each system tract were selected (Figure 11a), and the corresponding PC loading coefficients were obtained (Figure 11b). The results show that within the TST, OM enrichment is mainly influenced by paleo-productivity and bottom water redox conditions, with terrestrial debris input also playing a positive role, and higher sedimentation rates being unfavorable factors. In the RST, OM enrichment is influenced by bottom water redox conditions and burial efficiency, followed by paleo-productivity. A higher sedimentation rate is an unfavorable factor, and the input of terrestrial debris has little impact.

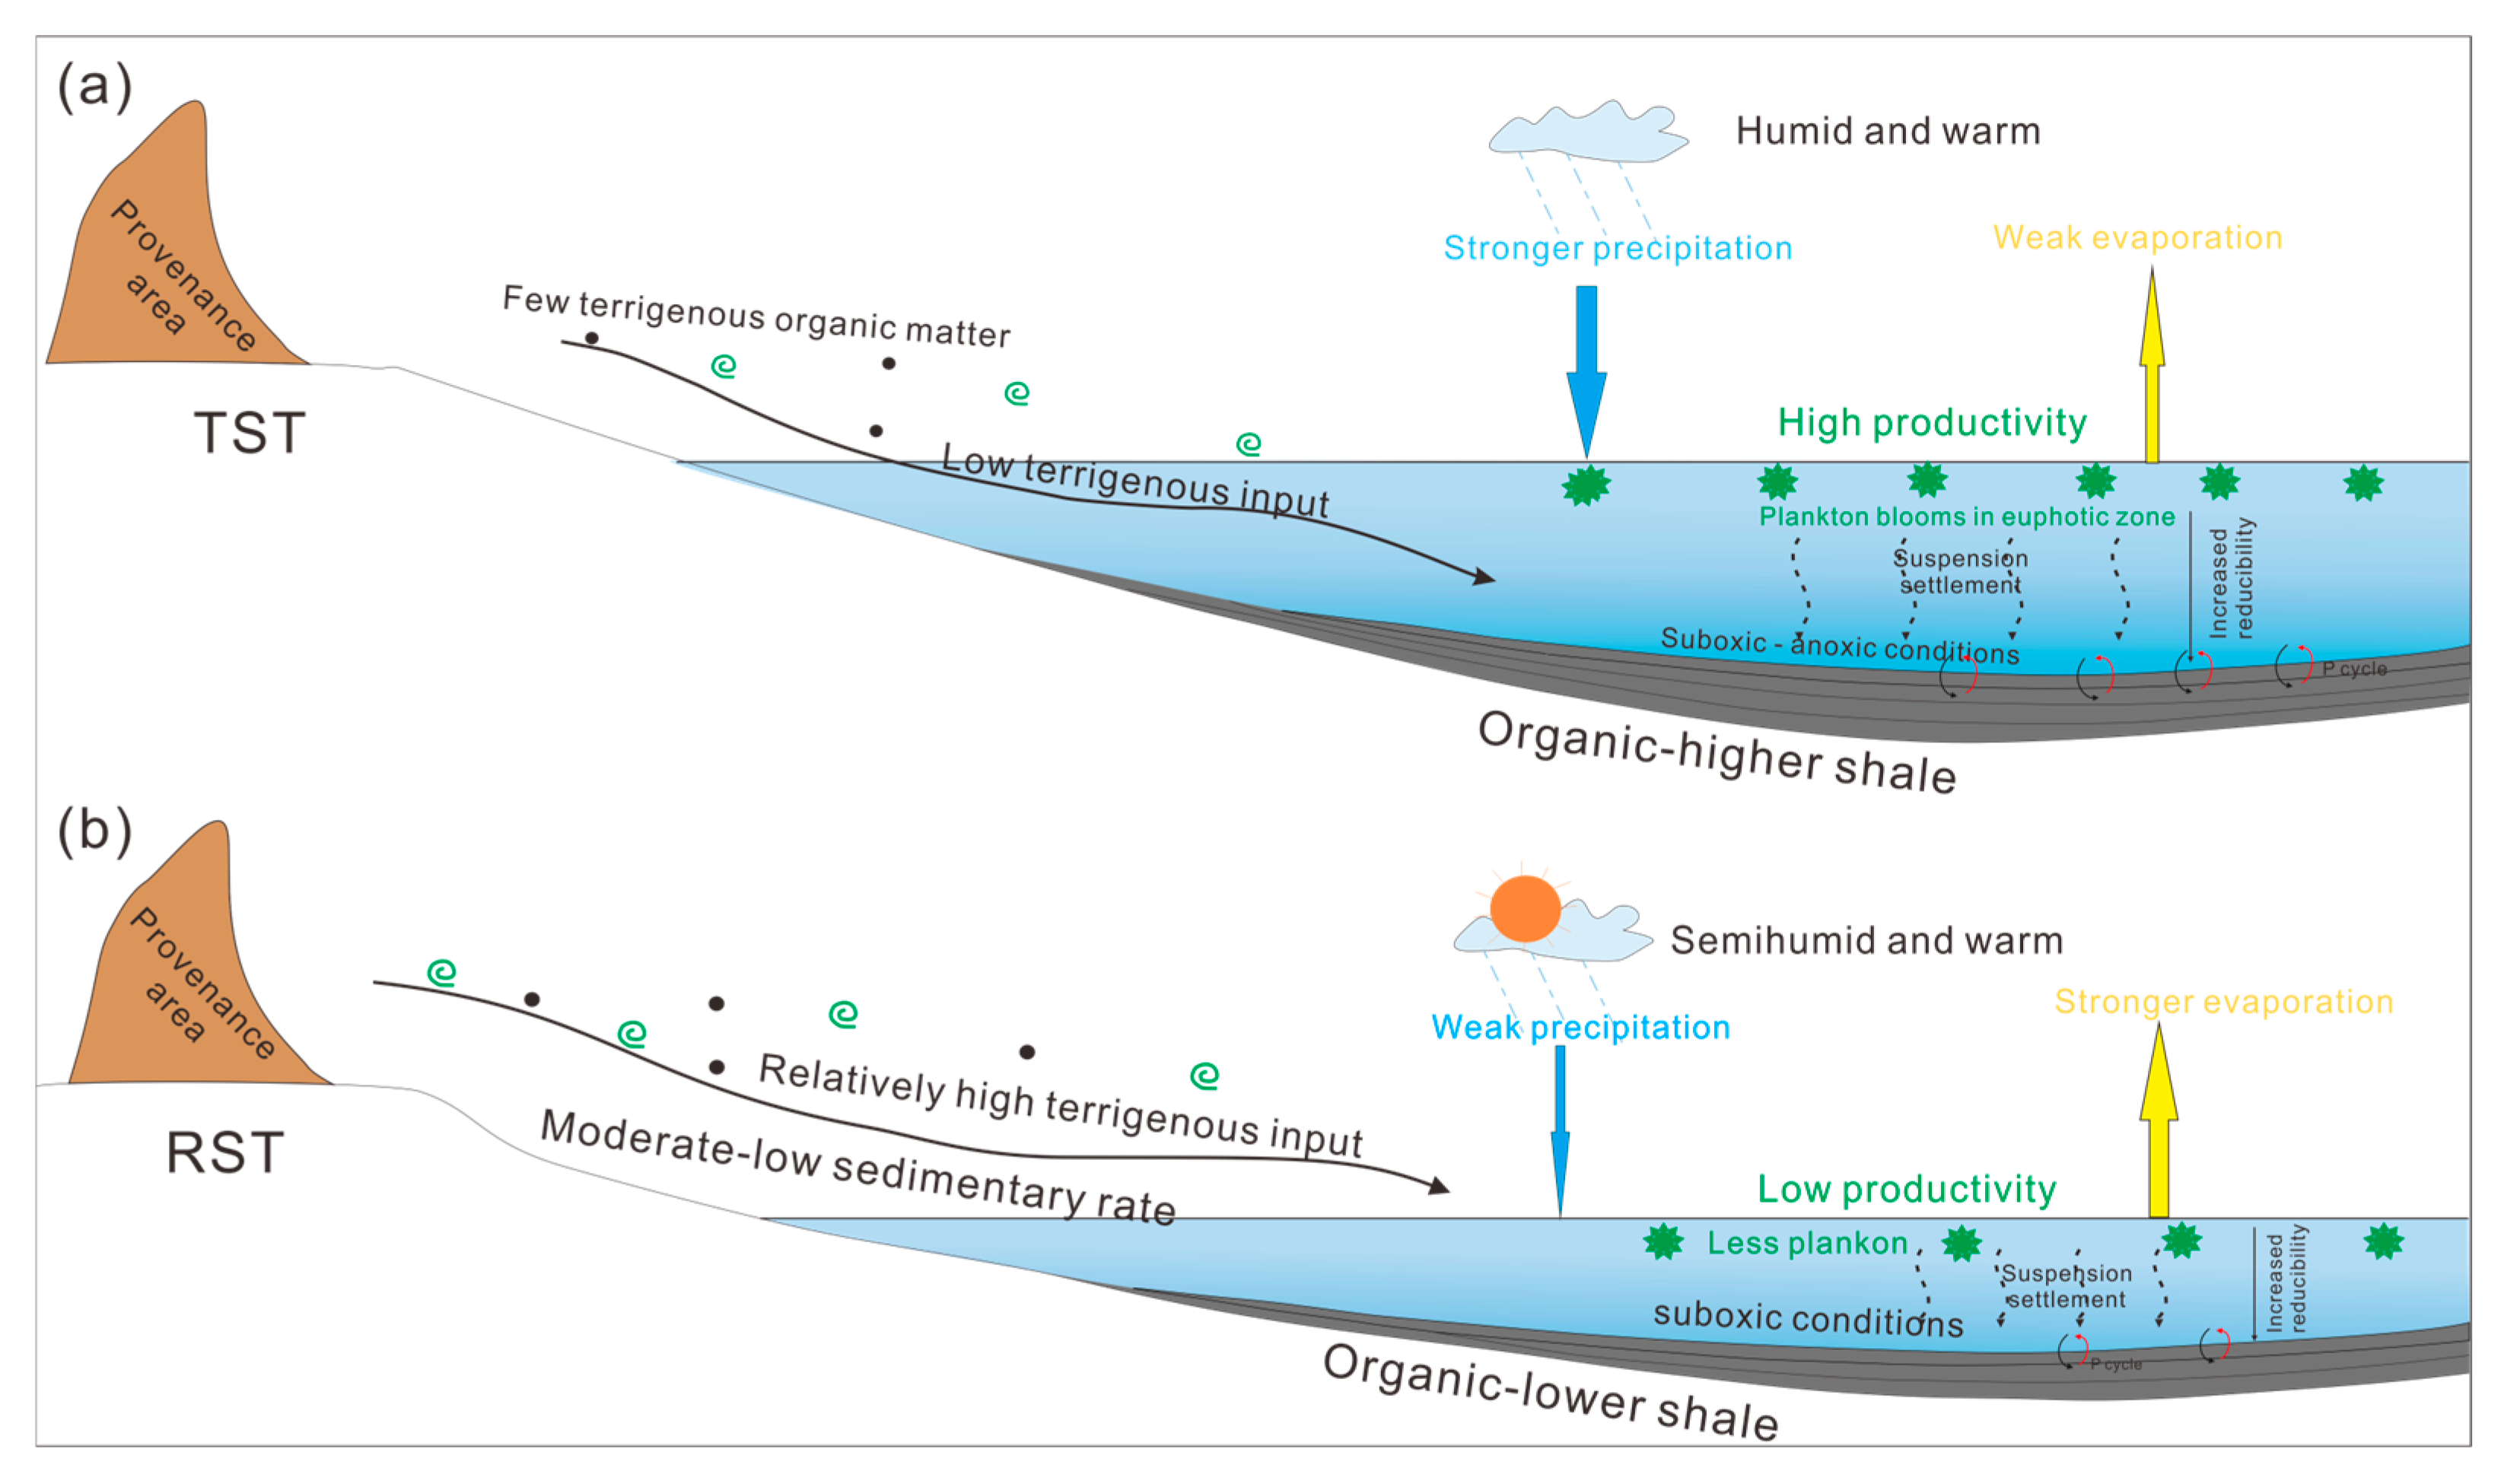
5.3. Organic Carbon Deposition Model in Lianggaoshan Formation

Based on ancient environmental conditions and combined with changes in lake levels, organic carbon deposition models for different system tracts of the Lianggaoshan Formation in the Sichuan Basin have been established (Figure 12).
During the lake transgression period, the climatic condition remained warm and humid, with heavy rainfall leading to strong to moderate weathering intensity. On the one hand, it promotes the development of gravity flow during the high lake-level period and also brings abundant terrestrial nutrients and OM [51,52], with a slight decrease in detrital influx compared to the RST. With the gradual rise of the lake level and the continuous input of terrestrial nutrients, the prosperity of plankton has been promoted, resulting in high primary productivity. Under limited detrital Influx, oxygen-containing debris is difficult to disrupt the bottom water reduction state, and OM is also difficult to dilute. The improvement of paleo-productivity is accompanied by a decrease in bottom water oxygen content, and the reactivation and recycling of nutrients in buried OM further enhance paleo-productivity. Meanwhile, the OM fragments formed by ancient productivity continuously consume oxygen during the depositional process, enhancing the reducibility of bottom water and the cycling of nutrients. Therefore, relatively high primary productivity, favorable low oxygen conditions, and strong nutrient cycling intensity are the factors that lead to the greatest enrichment of OM in the TST.
During the RST, there was a slight increase in detrital influx and input rate. Moderate to low-intensity detrital Influx not only brings limited nutrients but also produces dilution effects as the water becomes shallower and hydrodynamic forces increase. The increase in detrital influx may also bring about a certain amount of terrestrial OM, which may have a promoting effect on OM aggregation. The level of primary productivity and bottom water reduction conditions continue to decrease with the overall decline of the lake level. The ability of OM to decompose and consume oxygen during burial gradually decreases, and the preservation conditions become relatively poor. The preservation degree of OM in the RST is significantly reduced compared to HST, and the low reducibility of water is the main factor inhibiting OM enrichment. Limited paleo-productivity and dilution of terrestrial debris can also weaken OM aggregation.

6. Conclusions

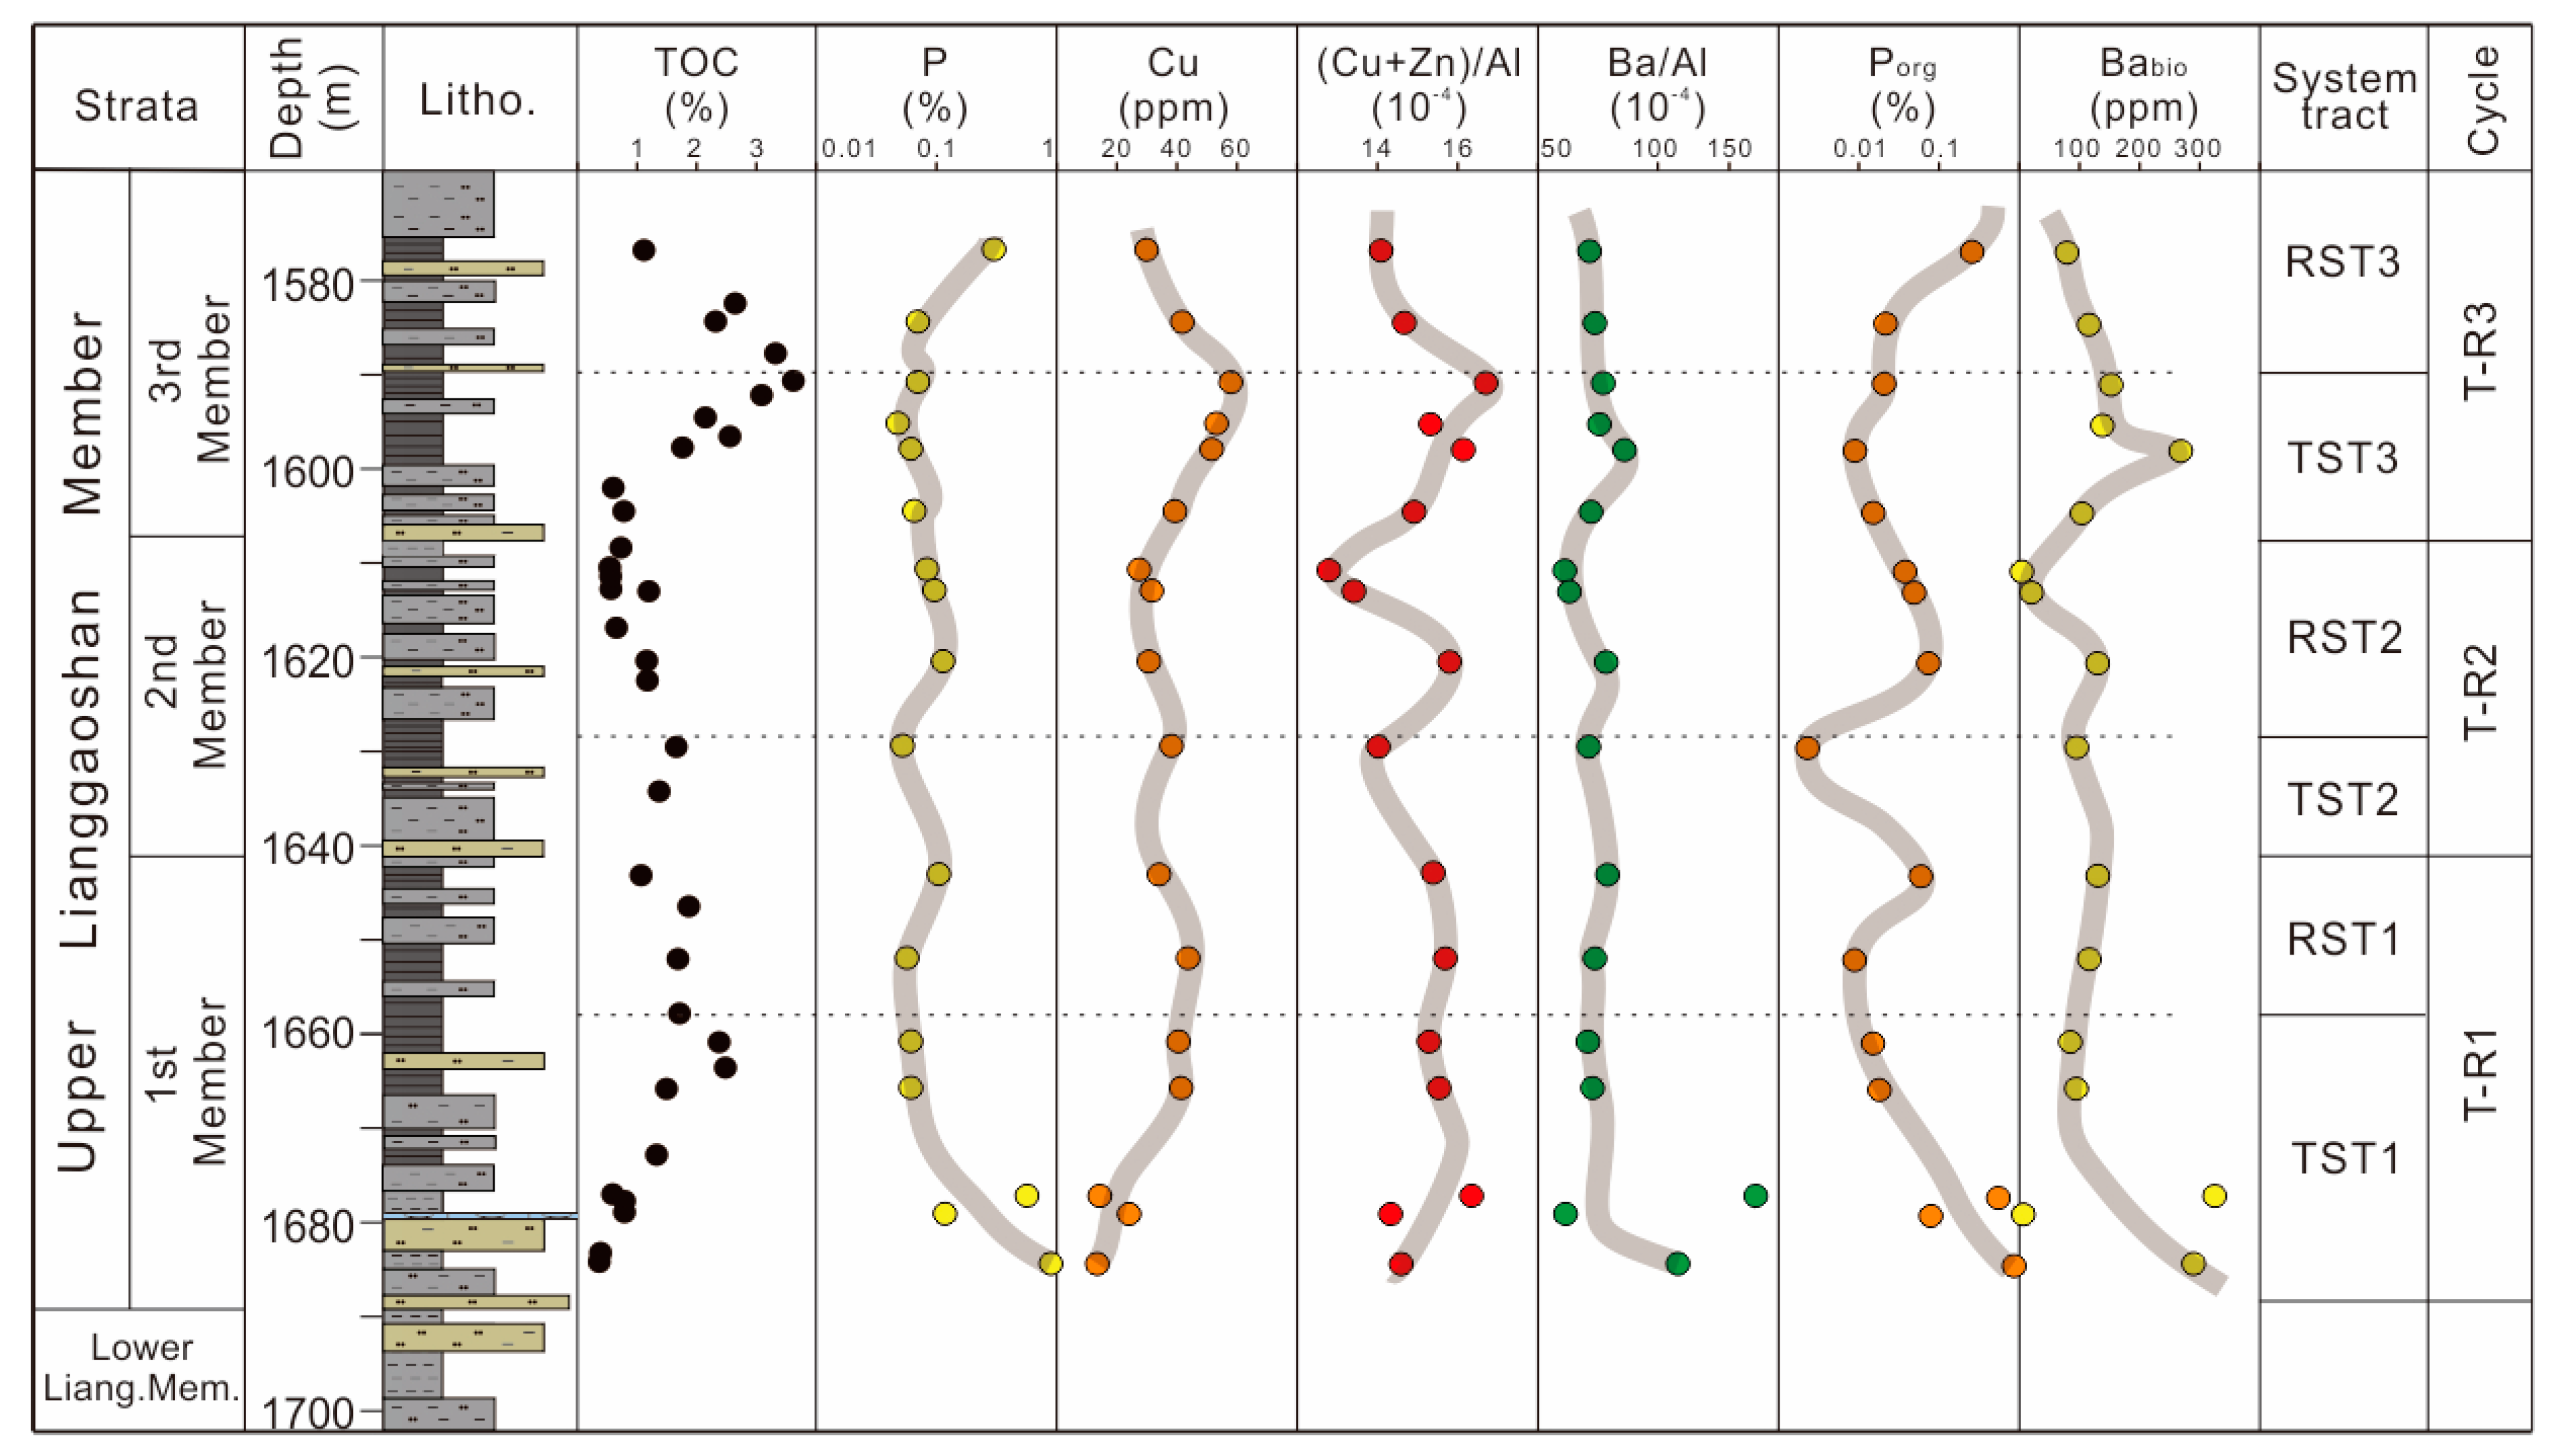
  • The Upper Member of Lianggaoshan Formation consists of three 3rd-order T-R cycles, and the TOC and major and trace element changes in each cycle show regular patterns. Organic matter is more enriched in the TST, especially during the high water level period of the T-R3 cycle, while it accumulates less in the RST.
  • The redox conditions and paleo-productivity undergo regular changes during the T-R cycle. As the lake level rises (TST period), paleo-productivity gradually increases, while the oxygen content in the bottom water gradually decreases. The input differences of terrestrial debris in different system tracts of the Lianggaoshan Formation are small and mainly influenced by ancient climate and weathering conditions.
  • The accumulation of organic matter in the Lianggaoshan Formation is influenced by the redox conditions, paleo-productivity, and the input of terrestrial debris under the constraint of the lake level. The degree of influence varies significantly in different system tracts. In the TST, the organic matter accumulation is mainly controlled by paleo-productivity and bottom water oxidation-reduction. Moderate terrestrial input plays a positive role, while higher sedimentation rates are not conducive to organic matter accumulation. In the RST, bottom water redox condition is the main influencing factor for organic matter preservation in sediments, followed by paleo-productivity. The input flux from terrestrial sources has a diluting effect, which is not conducive to the accumulation of organic matter.

Author Contributions

Conceptualization, D.H. and M.Q.; methodology, X.D.; software, Y.H.; validation, H.W.; formal analysis, X.L.; investigation, D.H.; resources, M.Q.; data curation, X.D.; writing—original draft preparation, D.H.; writing—review and editing, M.Q.; visualization, X.L.; supervision, H.W.; project administration, Y.H. All authors have read and agreed to the published version of the manuscript.

Funding

This research was supported by the National Natural Science Foundation of China (Grant No. 42272171) and the Science and Technology Cooperation Program of the CNPC−SWPU Innovation Alliance (Grant No. 2020CX030101).

Data Availability Statement

The data presented in this study are openly available in article.

Acknowledgments

The authors would like to thank Yuqiang Jiang and Zhanlei Wang for their linguistic assistance during the preparation of this manuscript. Thanks are also extended to the anonymous reviewers for their constructive comments.

Conflicts of Interest

The authors declare no conflicts of interest. Dong Huang, Xiang Deng, Yi Huang, Haibo Wang and Xiawei Li are employees of Sichuan Keyuan Testing Center of Engineering Technology Co., Ltd. The paper reflects the views of the scientists and not the company.

References

  1. Lu, Y.; Jiang, S.; Lu, Y.; Xu, S.; Wang, Y. Productivity or preservation? The factors controlling the organic matter accumulation in the late Katian through Hirnantian Wufeng organic-rich shale, South China. Mar. Petroleum Geol. 2019, 109, 22–35. [Google Scholar] [CrossRef]
  2. Li, Q.; Liu, G.; Song, Z.; Zhang, B.; Sun, M.; Tian, X.; Yang, D.; Wang, Y.; Zhu, L.; Cao, Y. Organic matter enrichment due to high primary productivity in the deep-water shelf: Insights from the lower Cambrian Qiongzhusi shales of the central Sichuan Basin, SW China. J. Asian Earth Sci. 2022, 239, 105417. [Google Scholar] [CrossRef]
  3. Arthur, M.A.; Sageman, B.B. Marine black shales: Depositional mechanisms and environments of ancient deposits. Annu. Rev. Earth Planet. Sci. 1994, 22, 499–551. [Google Scholar] [CrossRef]
  4. Xu, Z.; Wang, Y.; Jiang, S.; Fang, C.; Liu, L.; Wu, K.; Luo, Q.; Li, X.; Chen, Y. Impact of input, preservation and dilution on organic matter enrichment in lacustrine rift basin: A case study of lacustrine shale in Dehui Depression of Songliao Basin, NE China. Mar. Pet. Geol. 2022, 135, 105386. [Google Scholar] [CrossRef]
  5. Tyson, R.V. The “Productivity Versus Preservation” Controversy: Cause, Flaws, and Resolution. In The Deposition of Organic-Carbon-Rich Sediments: Models, Mechanisms, and Consequences; Harris, N.B., Ed.; Society for Sedimentary Geology (SEPM) Special Publication: Claremore, OK, USA, 2005; Volume 82, pp. 17–33. [Google Scholar]
  6. Dong, T.; Harris, N.; Ayranci, K. Relative sea-level cycles and organic matter accumulation in shales of the Middle and Upper Devonian Horn River Group, northeastern British Columbia, Canada: Insights into sediment flux, redox conditions, and bioproductivity. GSA Bull. 2018, 130, 859–880. [Google Scholar] [CrossRef]
  7. Tyson, R.V. Sedimentation rate, dilution, preservation and total organic carbon: Some results of a modelling study. Org. Geochem. 2001, 32, 333–339. [Google Scholar] [CrossRef]
  8. Sageman, B.B.; Murphy, A.E.; Werne, J.P.; Ver Straeten, C.A.; Lyons, T.W. A tale of shales: The relative roles of production, decomposition, and dilution in the accumulation of organic-rich strata, Middle–Upper Devonian, Appalachian basin. Chem. Geol. 2003, 195, 229–273. [Google Scholar] [CrossRef]
  9. Liu, Z.; Chen, D.; Lei, W.; Liu, Y.; Xie, G.; Dang, W.; Lv, X.; Li, S.; Yuan, S. Controls of the paleoenvironment on differential organic matter enrichment of lacustrine fine-grained rocks: A case study of the Jurassic Da’anzhai Member, central Sichuan Basin, SW China. J. Asian Earth Sci. 2022, 236, 105319. [Google Scholar] [CrossRef]
  10. Cramer, B.D.; Brett, C.E.; Melchin, M.J.; Maennik, P.; Kleffner, M.A.; McLaughlin, P.I.; Loydell, D.K.; Munnecke, A.; Jeppsson, L.; Corradini, C.; et al. Revised correlation of Silurian Provincial Series of North America with global and regional chronostratigraphic units and δ13Ccarb chemostratigraphy. Lethaia 2011, 44, 185–202. [Google Scholar] [CrossRef]
  11. Medici, G.; Munn, J.D.; Parker, B.L. Delineating aquitard characteristics within a Silurian dolostone aquifer using high-density hydraulic head and fracture datasets. Hydrogeol. J. 2024, 32, 1663–1691. [Google Scholar] [CrossRef]
  12. Hay, W.W. Paleoceanography of marine organic-carbon-rich sediments. In Paleogeography, Paleoclimate, and Source Rocks; Huc, A.Y., Ed.; American Association of Petroleum Geologists Studies in Geology: Tulsa, Oklahoma, 1995; Volume 40, pp. 21–59. [Google Scholar]
  13. Algeo, T.J.; Ingall, E. Sedimentary Corg: P ratios, paleocean ventilation, and Phanerozoic atmospheric pO2. Palaeogeogr. Palaeoclimatol. Palaeoecol. 2007, 256, 130–155. [Google Scholar] [CrossRef]
  14. Cao, H.; Wang, Z.; Dong, L.; Xiao, Y.; Hu, L.; Chen, F.; Wei, K.; Chen, C.; Song, Z.; Wu, L. Influence of hydrothermal and upwelling events on organic matter accumulation in the gas-bearing lower Cambrian shales of the middle Yangtze Block, South China. Mar. Pet. Geol. 2023, 155, 106373. [Google Scholar] [CrossRef]
  15. Lei, W.; Chen, D.; Liu, Z.; Cheng, M. Paleoenvironment-driven organic matter accumulation in lacustrine shale mixed with shell bioclasts: A case study from the Jurassic Da’anzhai member, Sichuan Basin (China). J. Pet. Sci. Eng. 2023, 220, 111178. [Google Scholar] [CrossRef]
  16. Canfield, D.E. Factors influencing organic carbon preservation in marine sediments. Chem. Geol. 1994, 114, 315–329. [Google Scholar] [CrossRef] [PubMed]
  17. Song, J.M.; Li, X.G. Ecological functions and biogenic element cycling roles of marine sediment/particles. Haiyang Xuebao 2018, 40, 1–13. [Google Scholar]
  18. Ding, X.; Liu, G.; Zha, M.; Huang, Z.; Cao, C.; Lu, X.; Sun, M.; Chen, Z.; Liuzhuang, X. Relationship between total organic carbon content and sedimentation rate in ancient lacustrine sediments, a case study of Erlian basin, northern China. J. Geochem. Explor. 2015, 149, 22–29. [Google Scholar] [CrossRef]
  19. Hu, T.; Pang, X.Q.; Jiang, S.; Wang, Q.F.; Xu, T.W.; Lu, K.; Huang, C.; Chen, Y.; Zheng, X. Impact of paleosalinity, dilution, redox, and paleoproductivity on organic matter enrichment in a saline lacustrine rift basin: A case study of paleogene organic-rich shale in Dongpu Depression, Bohai Bay Basin, Eastern China. Energy Fuels 2018, 32, 5045–5061. [Google Scholar] [CrossRef]
  20. Slatt, R.M.; Rodriguez, N.D. Comparative sequence stratigraphy and organic geochemistry of gas shales: Commonality or coincidence? J. Nat. Gas Sci. Eng. 2012, 8, 68–84. [Google Scholar] [CrossRef]
  21. Peng, J.W.; Hu, Z.Q.; Feng, D.J.; Wang, Q.R. Variations of organic matter content and type within the sequence stratigraphic framework of the lacustrine deep-water Dongyuemiao formation, Sichuan Basin, Western China. Mar. Pet. Geol. 2023, 149, 106104. [Google Scholar] [CrossRef]
  22. Hemmesch, N.T.; Harris, N.B.; Mnich, C.A.; Selby, D. A sequence-stratigraphic framework for the Upper Devonian Woodford Shale, Permian Basin, west Texas. AAPG Bull. 2014, 98, 23–47. [Google Scholar] [CrossRef]
  23. Liu, Z.; Li, Q.; Liu, G.; Li, P.; Chen, F.; Hao, J.; Zhang, W. Source and reservoir characteristics as well as optimization of favorable shale oil and gas enrichment intervals of the Da’anzhai Member in northern Sichuan. Acta Geologica. Sin. 2023, 97, 3421–3437. [Google Scholar]
  24. Fang, R.; Jiang, Y.; Sun, S.; Luo, Y.; Qi, L.; Dong, D.; Lai, Q.; Luo, Y.; Jiang, Z. Controlling factors of organic matter accumulation and lacustrine shale distribution in Lianggaoshan Formation, Sichuan Basin, SW China. Front. Earth Sci. 2023, 11, 1218215. [Google Scholar] [CrossRef]
  25. Cheng, D.; Zhang, Z.; Hong, H.; Zhang, S.; Qin, C.; Yuan, X.; Zhang, B.; Zhou, C.; Deng, Q. Sedimentation and provenance and the basin-mountain relationship of the Jurassic Lianggaoshan Formation in eastern Sichuan Basin, SW China. Pet. Explor. Dev. 2023, 50, 262–272. [Google Scholar] [CrossRef]
  26. McLennan, S.M. Relationship between the trace element composition of sedimentary rocks and upper continental crust. Geochem. Geophys. Geosyst. 2001, 2, 203–236. [Google Scholar] [CrossRef]
  27. Algeo, T.J.; Tribovillard, N. Environmental analysis of paleoceanographic systems based on molybdenum–uranium covariation. Chem. Geol. 2009, 268, 211–225. [Google Scholar] [CrossRef]
  28. Shen, J.; Schoepfer, S.D.; Feng, Q.; Zhou, L.; Yu, J.X.; Song, H.Y.; Wei, H.; Algeo, T.J. Marine productivity changes during the end-Permian crisis and Early Triassic recovery. Earth-Sci. Rev. 2015, 149, 136–162. [Google Scholar] [CrossRef]
  29. Nesbitt, H.; Young, G. Early proterozoic climates and plate motions inferred from major element chemistry of lutites. Nature 1982, 299, 715–717. [Google Scholar] [CrossRef]
  30. McLennan, S.M. Weathering and global denudation. J. Geol. 1993, 101, 295–303. [Google Scholar] [CrossRef]
  31. Peng, J.W.; Hu, Z.Q.; Feng, D.J.; Wang, Q.R. Sedimentology and sequence stratigraphy of lacustrine deep-water fine-grained sedimentary rocks: The Lower Jurassic Dorigyuemiao Formation in the Sichuan Basin, Western China. Mar. Pet. Geol. 2022, 146, 105933. [Google Scholar] [CrossRef]
  32. Condie, K.C. Chemical composition and evolution of the upper continental crust: Contrasting results from surface samples and shales. Chem. Geol. 1993, 104, 1–37. [Google Scholar] [CrossRef]
  33. Lodders, K.; Fegley, B. The Planetary Scientist’s Companion; Oxford University Press: New York, NY, USA, 1998. [Google Scholar]
  34. Fan, Q.; Xia, G.; Li, G.; Yi, H. Analytical Methods and Research Progress of Redox Conditions in the Paleo-Ocean. Acta Sedimentologica Sinica 2022, 40, 1151–1171. [Google Scholar]
  35. Straeten, C.A.V.; Brett, C.E.; Sageman, B.B. Mudrock sequence stratigraphy: A multi-proxy (sedimentological, paleobiological and geochemical) approach, Devonian Appalachian Basin. Palaeogeogr. Palaeoclimatol. Palaeoecol. 2011, 304, 54–73. [Google Scholar] [CrossRef]
  36. Arthur, M.A.; Dean, W.E. Organic-matter production and preservation and evolution of anoxia in the Holocene Black Sea. Paleoceanography 1998, 13, 395–411. [Google Scholar] [CrossRef]
  37. Ross, D.J.K.; Bustin, R.M. Investigating the use of sedimentary geochemical proxies for paleoenvironment interpretation of thermally mature organic-rich strata: Examples from the Devonian–Mississippian shales, Western Canadian Sedimentary Basin. Chemi. Geol. 2009, 260, 1–19. [Google Scholar] [CrossRef]
  38. Shi, J.; Zou, Y.R.; Cai, Y.L.; Zhan, Z.W.; Sun, J.N.; Liang, T.; Peng, P. Organic matter enrichment of the Chang 7 member in the Ordos Basin: Insights from chemometrics and element geochemistry. Mar. Pet. Geol. 2022, 135, 105404. [Google Scholar] [CrossRef]
  39. Jones, B.; Manning, D.A.C. Comparison of geochemical indices used for the interpretation of palaeoredox conditions in ancient mudstones. Chem. Geol. 1994, 111, 111–129. [Google Scholar] [CrossRef]
  40. Tribovillard, N.; Algeo, T.J.; Lyons, T.; Riboulleau, A. Trace metals as paleoredox and paleoproductivity proxies: An update. Chem. Geol. 2006, 232, 12–32. [Google Scholar] [CrossRef]
  41. Algeo, T.J.; Liu, J.S. A re-assessment of elemental proxies for paleoredox analysis. Chem. Geol. 2020, 540, 119549. [Google Scholar] [CrossRef]
  42. Schoepfer, S.D.; Shen, J.; Wei, H.Y.; Tyson, R.V.; Ingall, E.; Algeo, T.J. Total organic carbon, organic phosphorus, and biogenic barium fluxes as proxies for paleomarine productivity. Earth-Sci. Rev. 2015, 149, 23–52. [Google Scholar] [CrossRef]
  43. Wei, H.Y. Productivity and redox proxies of palaeo-oceans: An overview of elementary geochemistry. Sediment. Geol. Tethyan Geol. 2012, 32, 13. [Google Scholar]
  44. Xu, S.C.; Hu, H.B.; Zhang, P.; Wang, Q.C.; Kang, J.; Miao, Q. Major and trace elements in mid-Eocene lacustrine oil shales of the Fushun Basin, NE China: Concentration features and paleolimnological implications. Mar. Pet. Geol. 2020, 121, 104610. [Google Scholar] [CrossRef]
  45. Ekoko Eric, B.; Adama, A.; Etutu, M.E.; Njinto Kwankam, F.; Salomon Betrant, B.; Esue, M.F. Paleoclimate characteristics of source area weathering and metallogenic implication of cretaceous black shales in the Mamfe basin, (SW Cameroon): Evidence from lithogeochemistry. Heliyon 2023, 9, e17142. [Google Scholar] [CrossRef] [PubMed]
  46. Yan, K.; Wang, C.L.; Mischke, S.; Wang, J.Y.; Shen, L.J.; Yu, X.C.; Meng, L. Major and trace-element geochemistry of Late Cretaceous clastic rocks in the Jitai Basin, southeast China. Sci. Rep. 2021, 11, 13846. [Google Scholar] [CrossRef] [PubMed]
  47. Lupker, M.; France-Lanord, C.; Galy, V.; Lavé, J.; Kudrass, H. Increasing chemical weathering in the Himalayan system since the Last Glacial Maximum. Earth Planet. Sci Let. 2013, 365, 243–253. [Google Scholar] [CrossRef]
  48. Dypvik, H.; Harris, N.B. Geochemical facies analysis of fine-grained siliciclastics using Th/U, Zr/Rb and (Zr+Rb)/Sr ratios. Chem. Geol. 2001, 181, 131–146. [Google Scholar] [CrossRef]
  49. Wei, W.; Algeo, T.J. Elemental proxies for paleosalinity analysis of ancient shales and mudrocks. Geochim. Cosmochim. Ac. 2020, 287, 341–366. [Google Scholar] [CrossRef]
  50. Zhu, M.; Chen, H.L.; Zhou, J.; Yang, S.F. Provenance change from the Middle to Late Triassic of the southwestern Sichuan basin, Southwest China: Constraints from the sedimentary record and its tectonic significance. Tectonophysics 2017, 700–701, 92–107. [Google Scholar] [CrossRef]
  51. Zhang, X.; Zhao, X.; Ge, J.; Li, S.; Zhang, T. Karst topography paces the deposition of lower Permian, organic-rich, marine– continental transitional shales in the southeastern Ordos Basin, northwestern China. AAPG Bull. 2024, 108, 849–875. [Google Scholar] [CrossRef]
  52. Zhang, X.; Zhang, T.; Zhao, X.; Zhu, H.; Mihai, E.P.; Chen, L.; Yong, J.; Xiao, Q.; Li, H. Effects of astronomical orbital cycle and volcanic activity on organic carbon accumulation during Late Ordovician–Early Silurian in the Upper Yangtze area, South China. Pet. Explor. Dev. 2021, 48, 850–863. [Google Scholar] [CrossRef]
Figure 1. (a) Paleogeography of Lianggaoshan Formation and the location of studied well in Sichuan Basin (modified from [24]). (b) Stratigraphic column of Jurassic Lianggaoshan Formation of Well A in Sichuan Basin.
Minerals 15 00159 g001
Figure 2. (a) Lithofacies changes of TST and RST shale sample in Jurassic Lianggaoshan Formation. (b) Mineral composition changes of TST and RST shale sample in Jurassic Lianggaoshan Formation.
Minerals 15 00159 g002
Figure 3. Vertical variation characteristics of terrigenous clastic input proxies in the Jurassic Lianggaoshan Formation at Well A.
Minerals 15 00159 g003
Figure 4. (a) Box diagram of TOC distribution within Lianggaoshan Formation. (b) Concentration coefficient distribution of the major element after UCC-normalization. (c) Concentration coefficient distribution of the trace element after UCC-normalization. (d) Chondrite normalized REE distribution curves for REEs. PAAS, UCC, NASC, and Chondrite values are from [26,32,33].
Minerals 15 00159 g004
Figure 5. Vertical variation characteristics of redox proxies in the Jurassic Lianggaoshan Formation at Well A.
Minerals 15 00159 g005
Figure 6. Vertical variation characteristics of productivity proxies in the Jurassic Lianggaoshan Formation at Well A.
Minerals 15 00159 g006
Figure 7. Cross-plot of terrigenous input, redox, and productivity proxies in TST and RST of Liangshan Formation. (a) Fe+K vs. Ti content, (b) Ti/Al vs. Ti content, (c) UEF vs. MoEF, (d) Fe/Al vs. Corg/PT, (e) (Cu+Zn)/Al vs. Babio, (f) Porg vs. Ba/Al. The bubble area represents the TOC content in (d).
Minerals 15 00159 g007
Figure 9. Cross-plot of paleo-environmental indicators and TOC value in Jurassic Liangshan Formation. (a) TOC content vs. Ti content, (b) TOC content vs. Ti/Al, (c) TOC content vs. MoEF, (d) TOC content vs. Corg/P, (e) TOC content vs. Baorg, (f) TOC content vs. (Cu+Zn)/Al.
Minerals 15 00159 g009
Figure 10. The bubble-plot was drawn to analyze the main accumulation factors of OM. (a) Ti content vs. Ti/Al, (b) Ti content vs. MoEF, (c) Ti content vs. (Cu+Zn)/Al, (d) MoEF vs. C/P, (e) (Cu+Zn)/Al vs. C/P, (f) MoEF vs. (Cu+Zn)/Al. The size of the bubbles reflects TOC content, and the horizontal and vertical coordinates represent different dual factors. The bubble area represents the TOC content.
Minerals 15 00159 g010
Figure 11. (a) The relationship between TOC and the score of PC in different system tracts. The score indicates the best correlation with TOC among PC scores. (b) Loading plot of PCs in different system tracts vs. three influencing factors of OM enrichment.
Minerals 15 00159 g011
Figure 12. Schematic diagram of OM enrichment model in Jurassic Lianggao Formation of Sichuan Basin. (a) OM enrichment model during TST. (b) OM enrichment model during RST.
Minerals 15 00159 g012
Table 1. Mineralogical and TOC analyses of TST and RST shale sample in Jurassic Lianggaoshan Formation.
System TractValuesTOC (%)Quartz (%)Plagioclase (%)Siliceous (%)Carbonate (%)Pyrite (%)Clay (%)Illite (%)Kaolinite (%)Chlorite (%)
TSTMin0.3629.70 5.90 35.60 00 37.20 32.00 7.00 18.00
Max3.4845.40 15.60 57.90 9.00 4.60 56.40 51.00 20.00 33.00
Average1.5840.20 11.31 51.51 2.93 0.92 44.64 40.79 13.57 26.07
RSTMin0.5317.50 5.70 24.50 0013.30 25.00 8.00 21.00
Max3.1449.40 17.80 66.20 62.20 5.40 57.20 50.00 28.00 38.00
Average1.3740.72 10.60 51.32 5.28 1.08 42.38 39.79 15.68 28.00
Disclaimer/Publisher’s Note: The statements, opinions and data contained in all publications are solely those of the individual author(s) and contributor(s) and not of MDPI and/or the editor(s). MDPI and/or the editor(s) disclaim responsibility for any injury to people or property resulting from any ideas, methods, instructions or products referred to in the content.

