
Advancing Iron Ore Grade Estimation: A Comparative Study of Machine Learning and Ordinary Kriging
 , , ,
, , ,  , and
, and
Abstract
1. Introduction
2. Materials and Methods
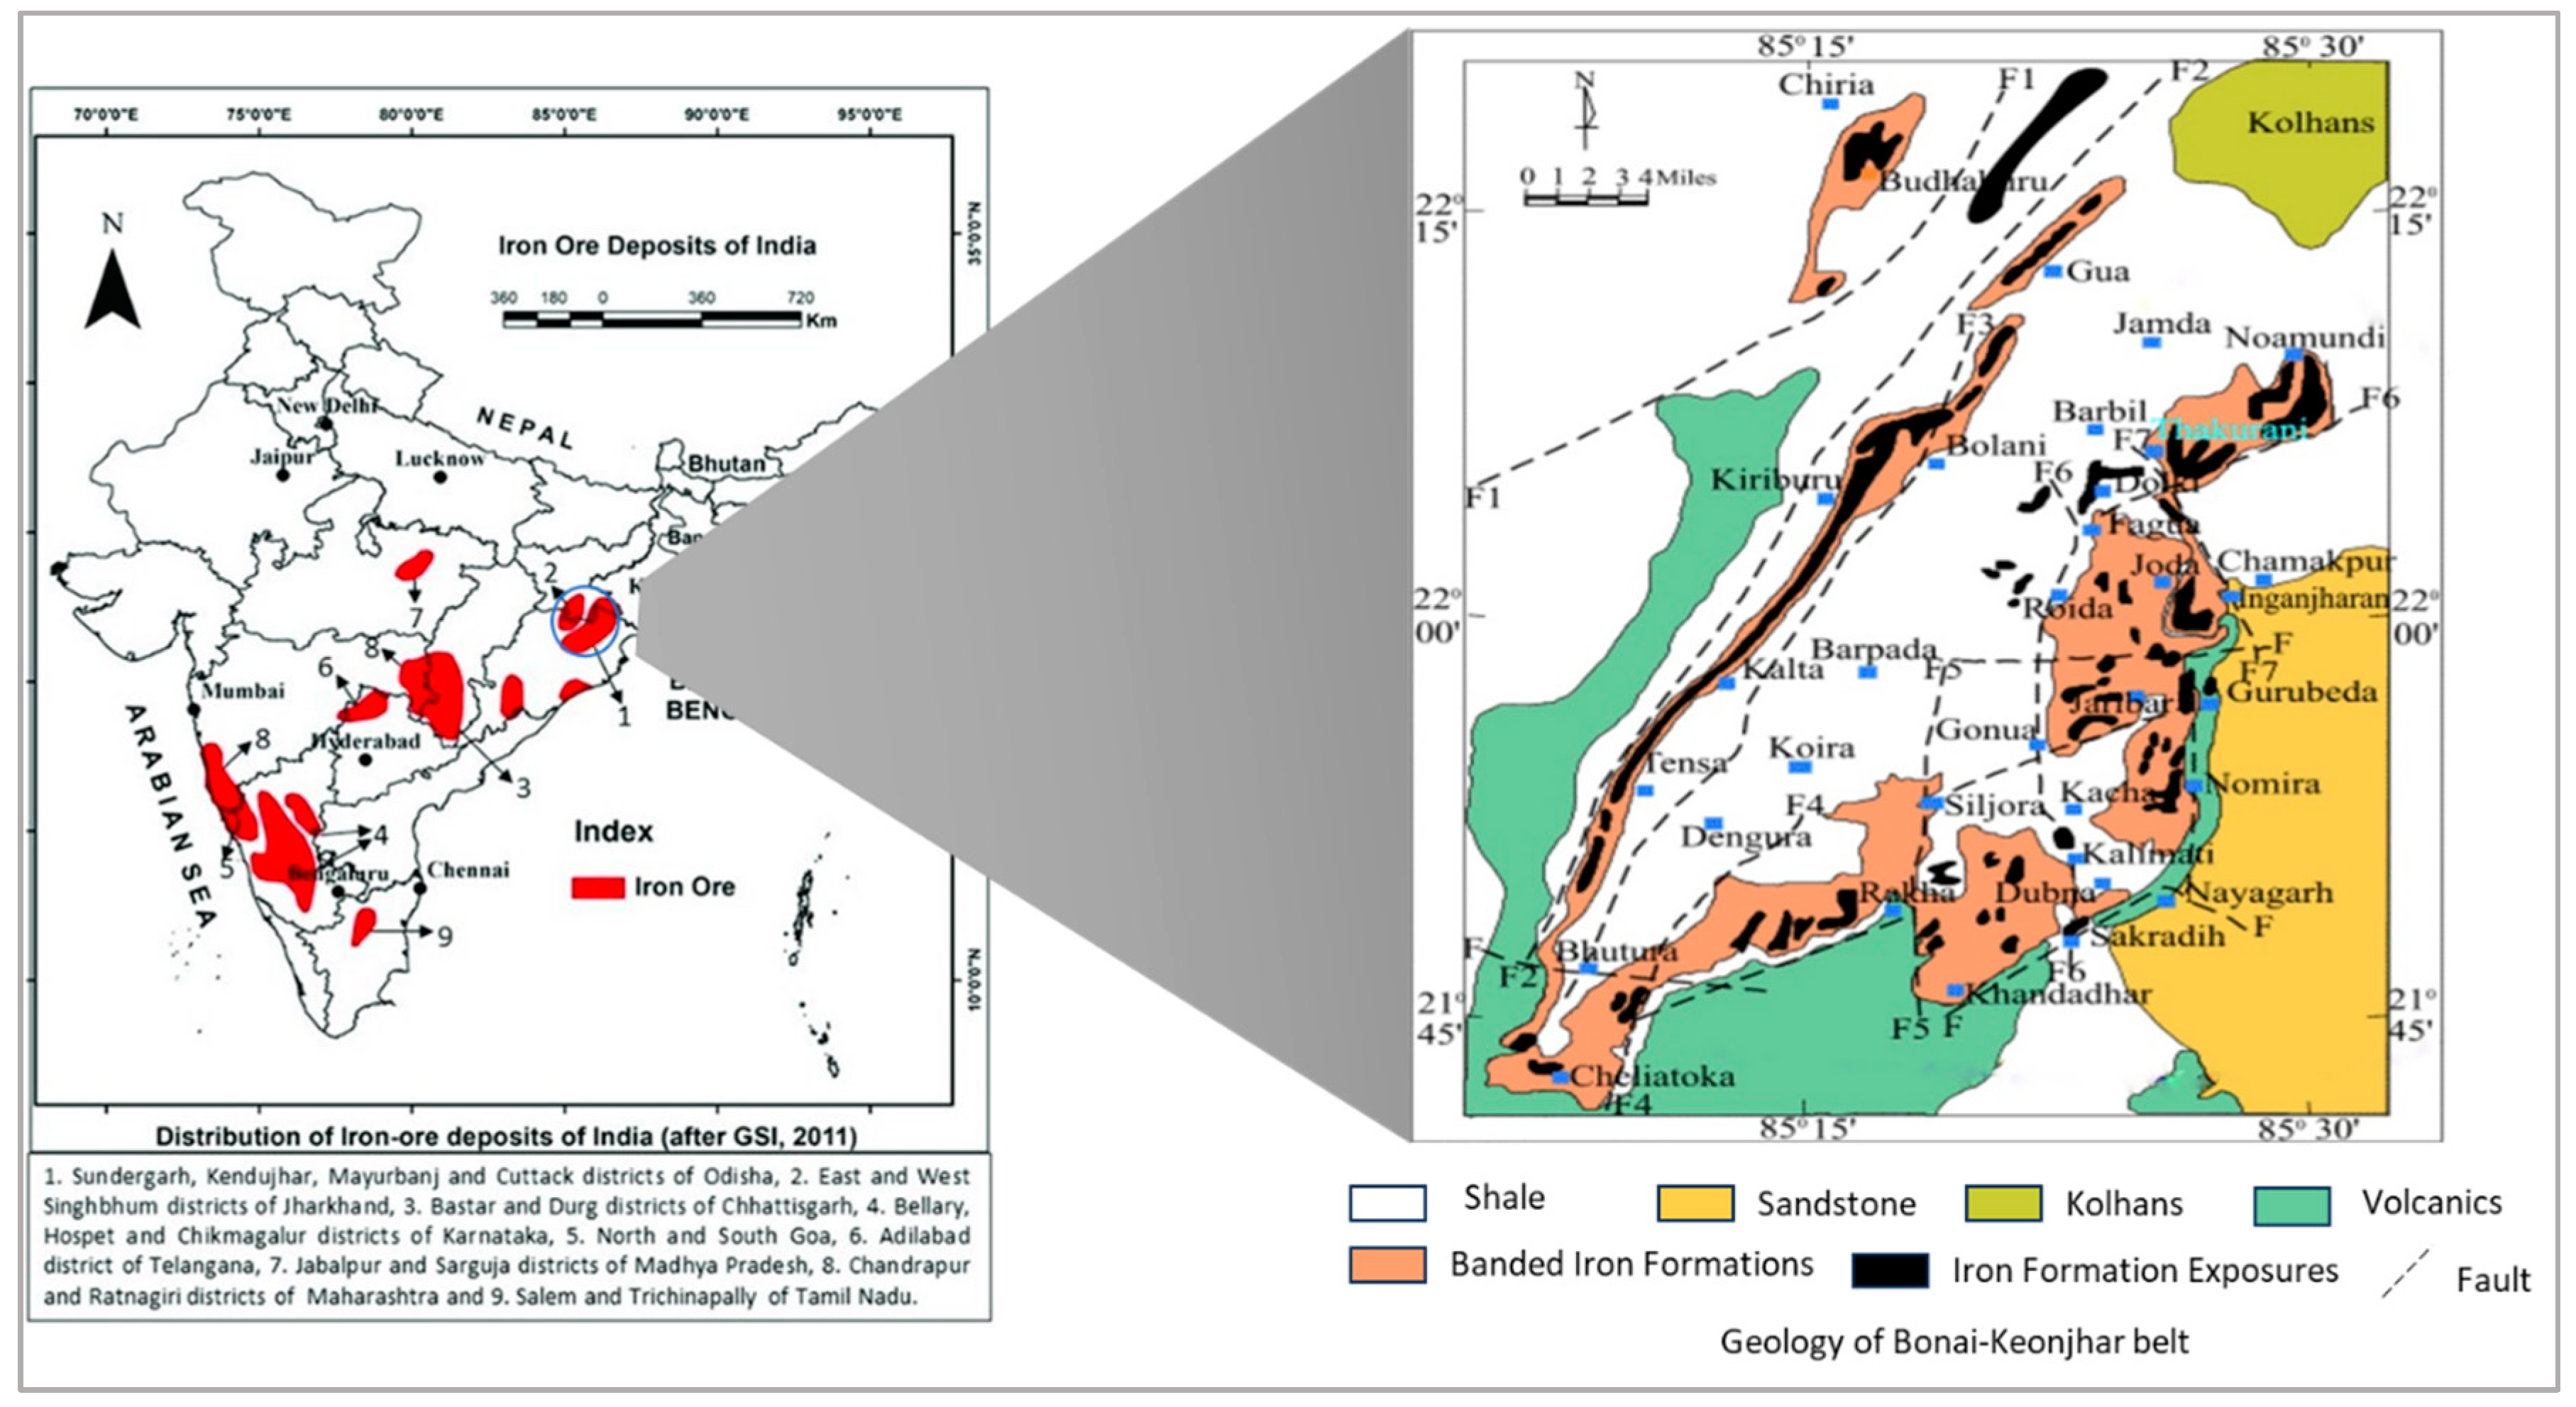
2.1. Geology of the Deposit
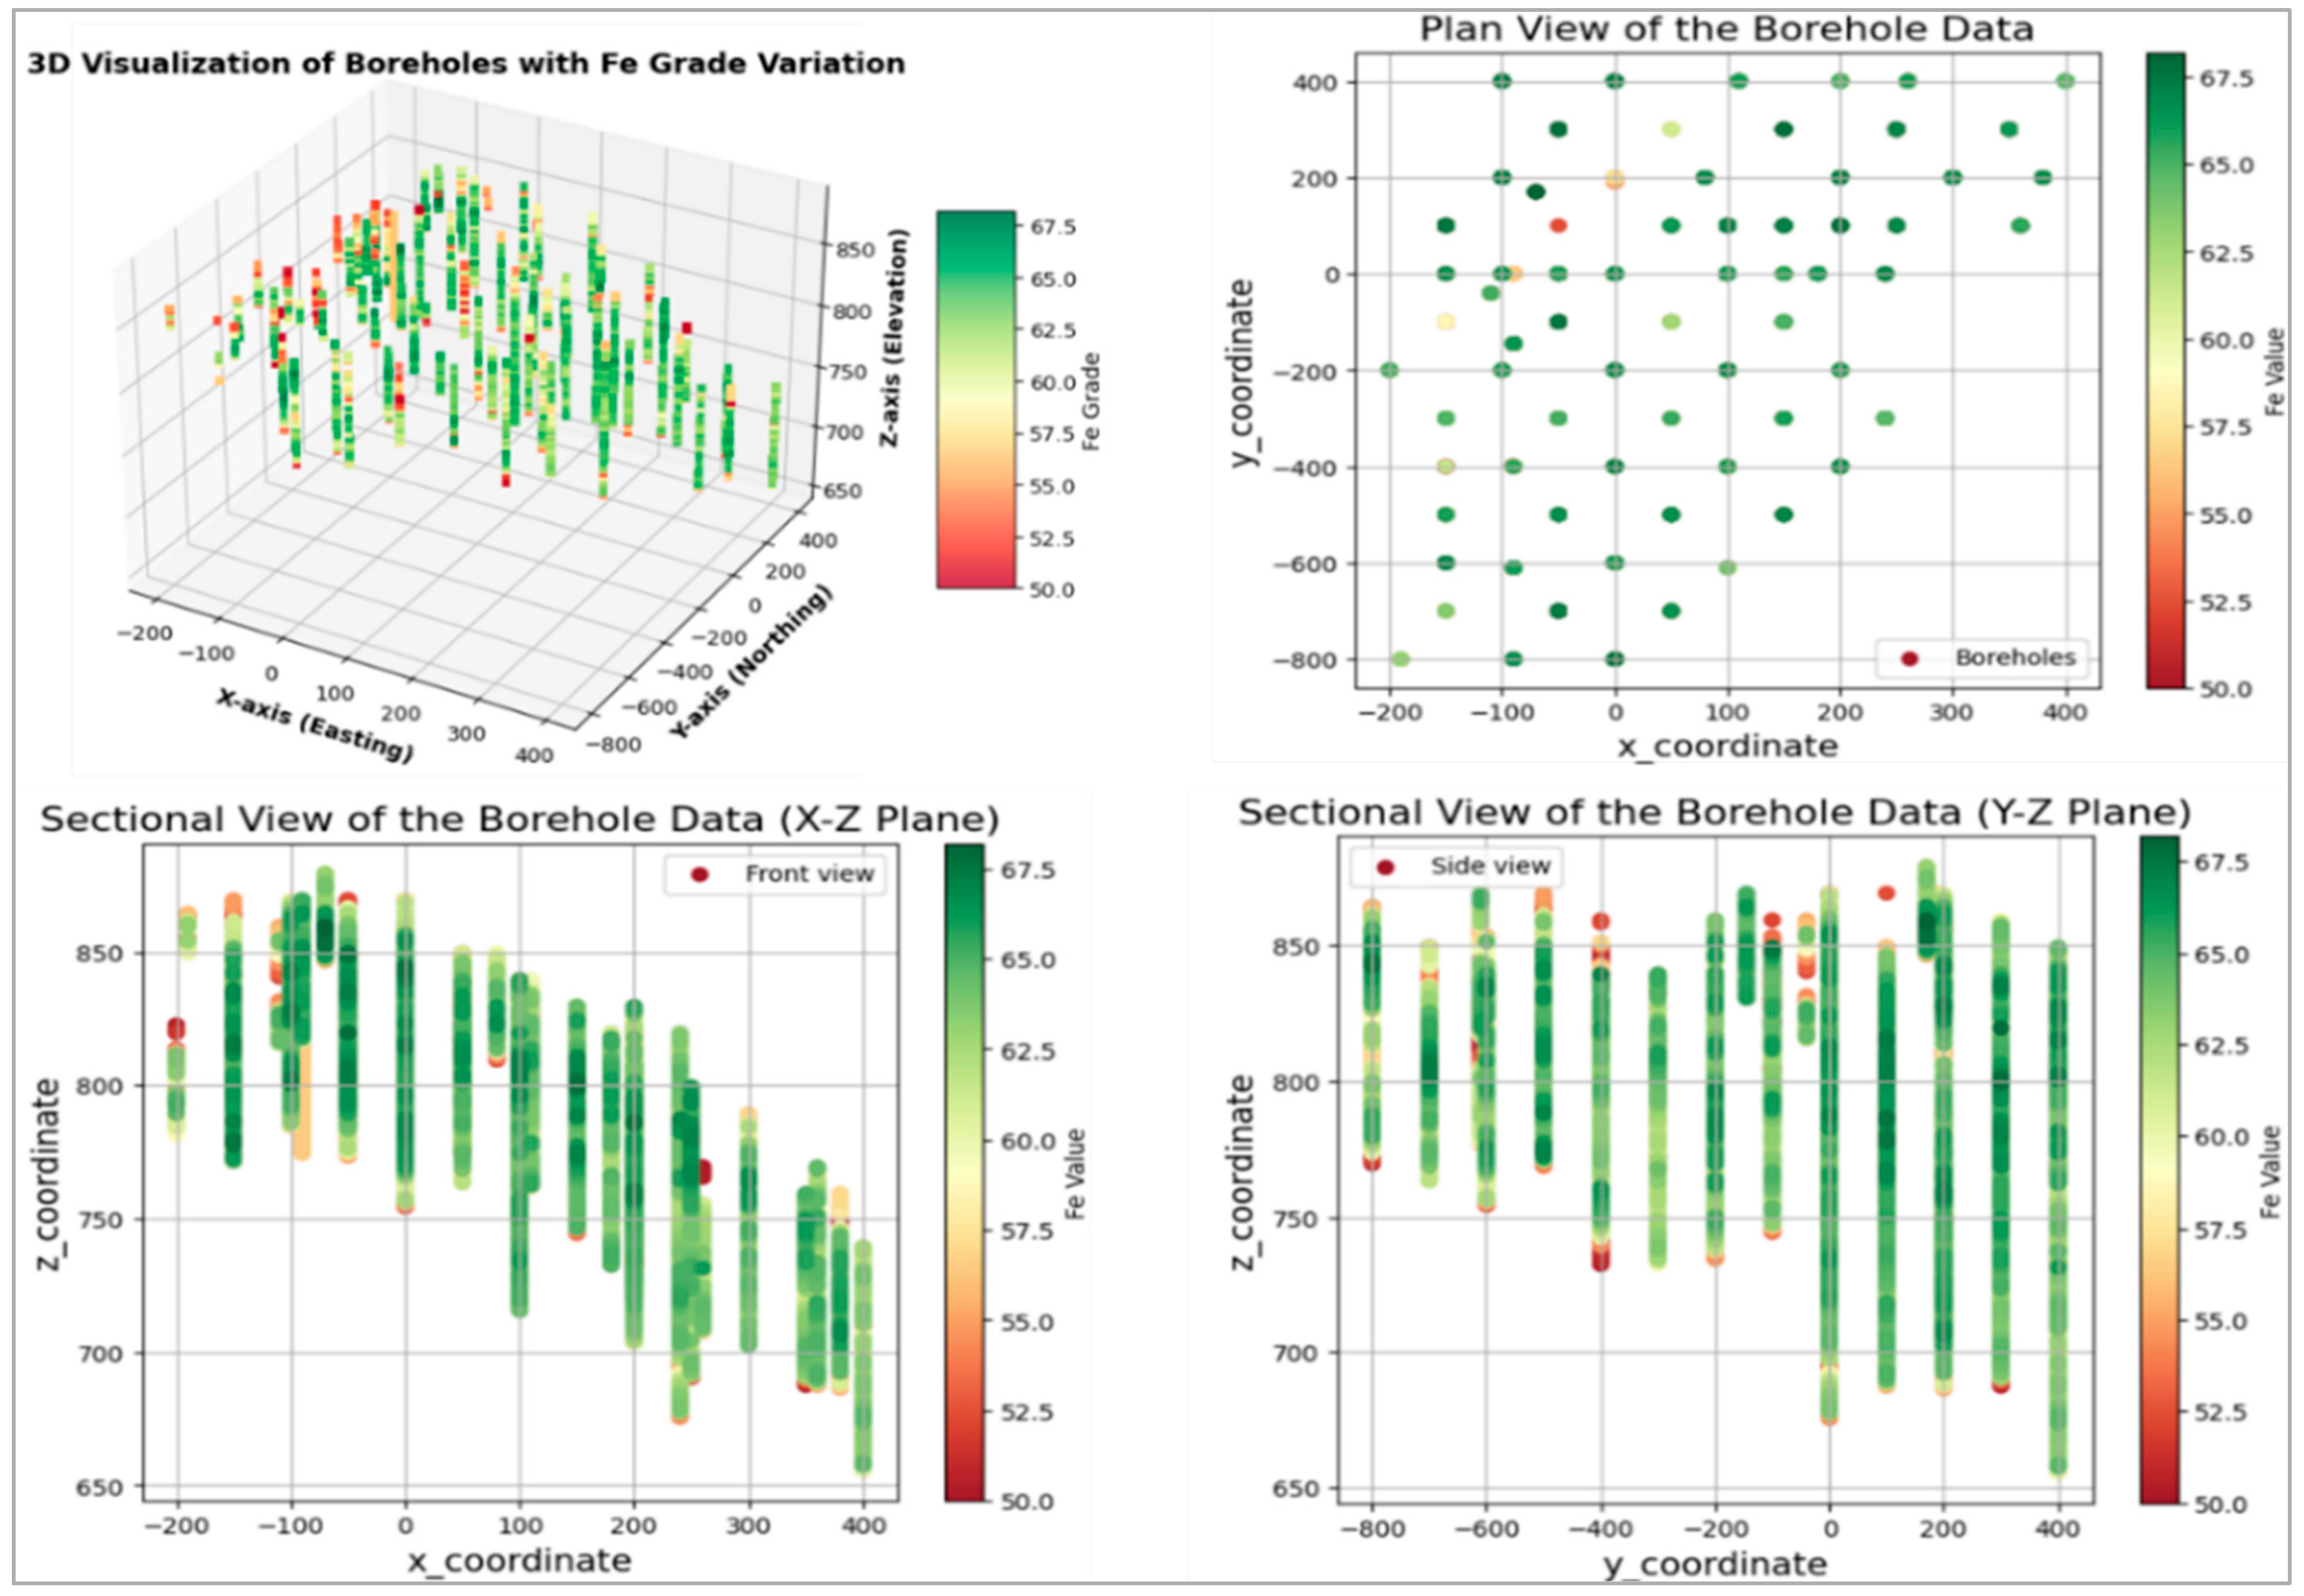
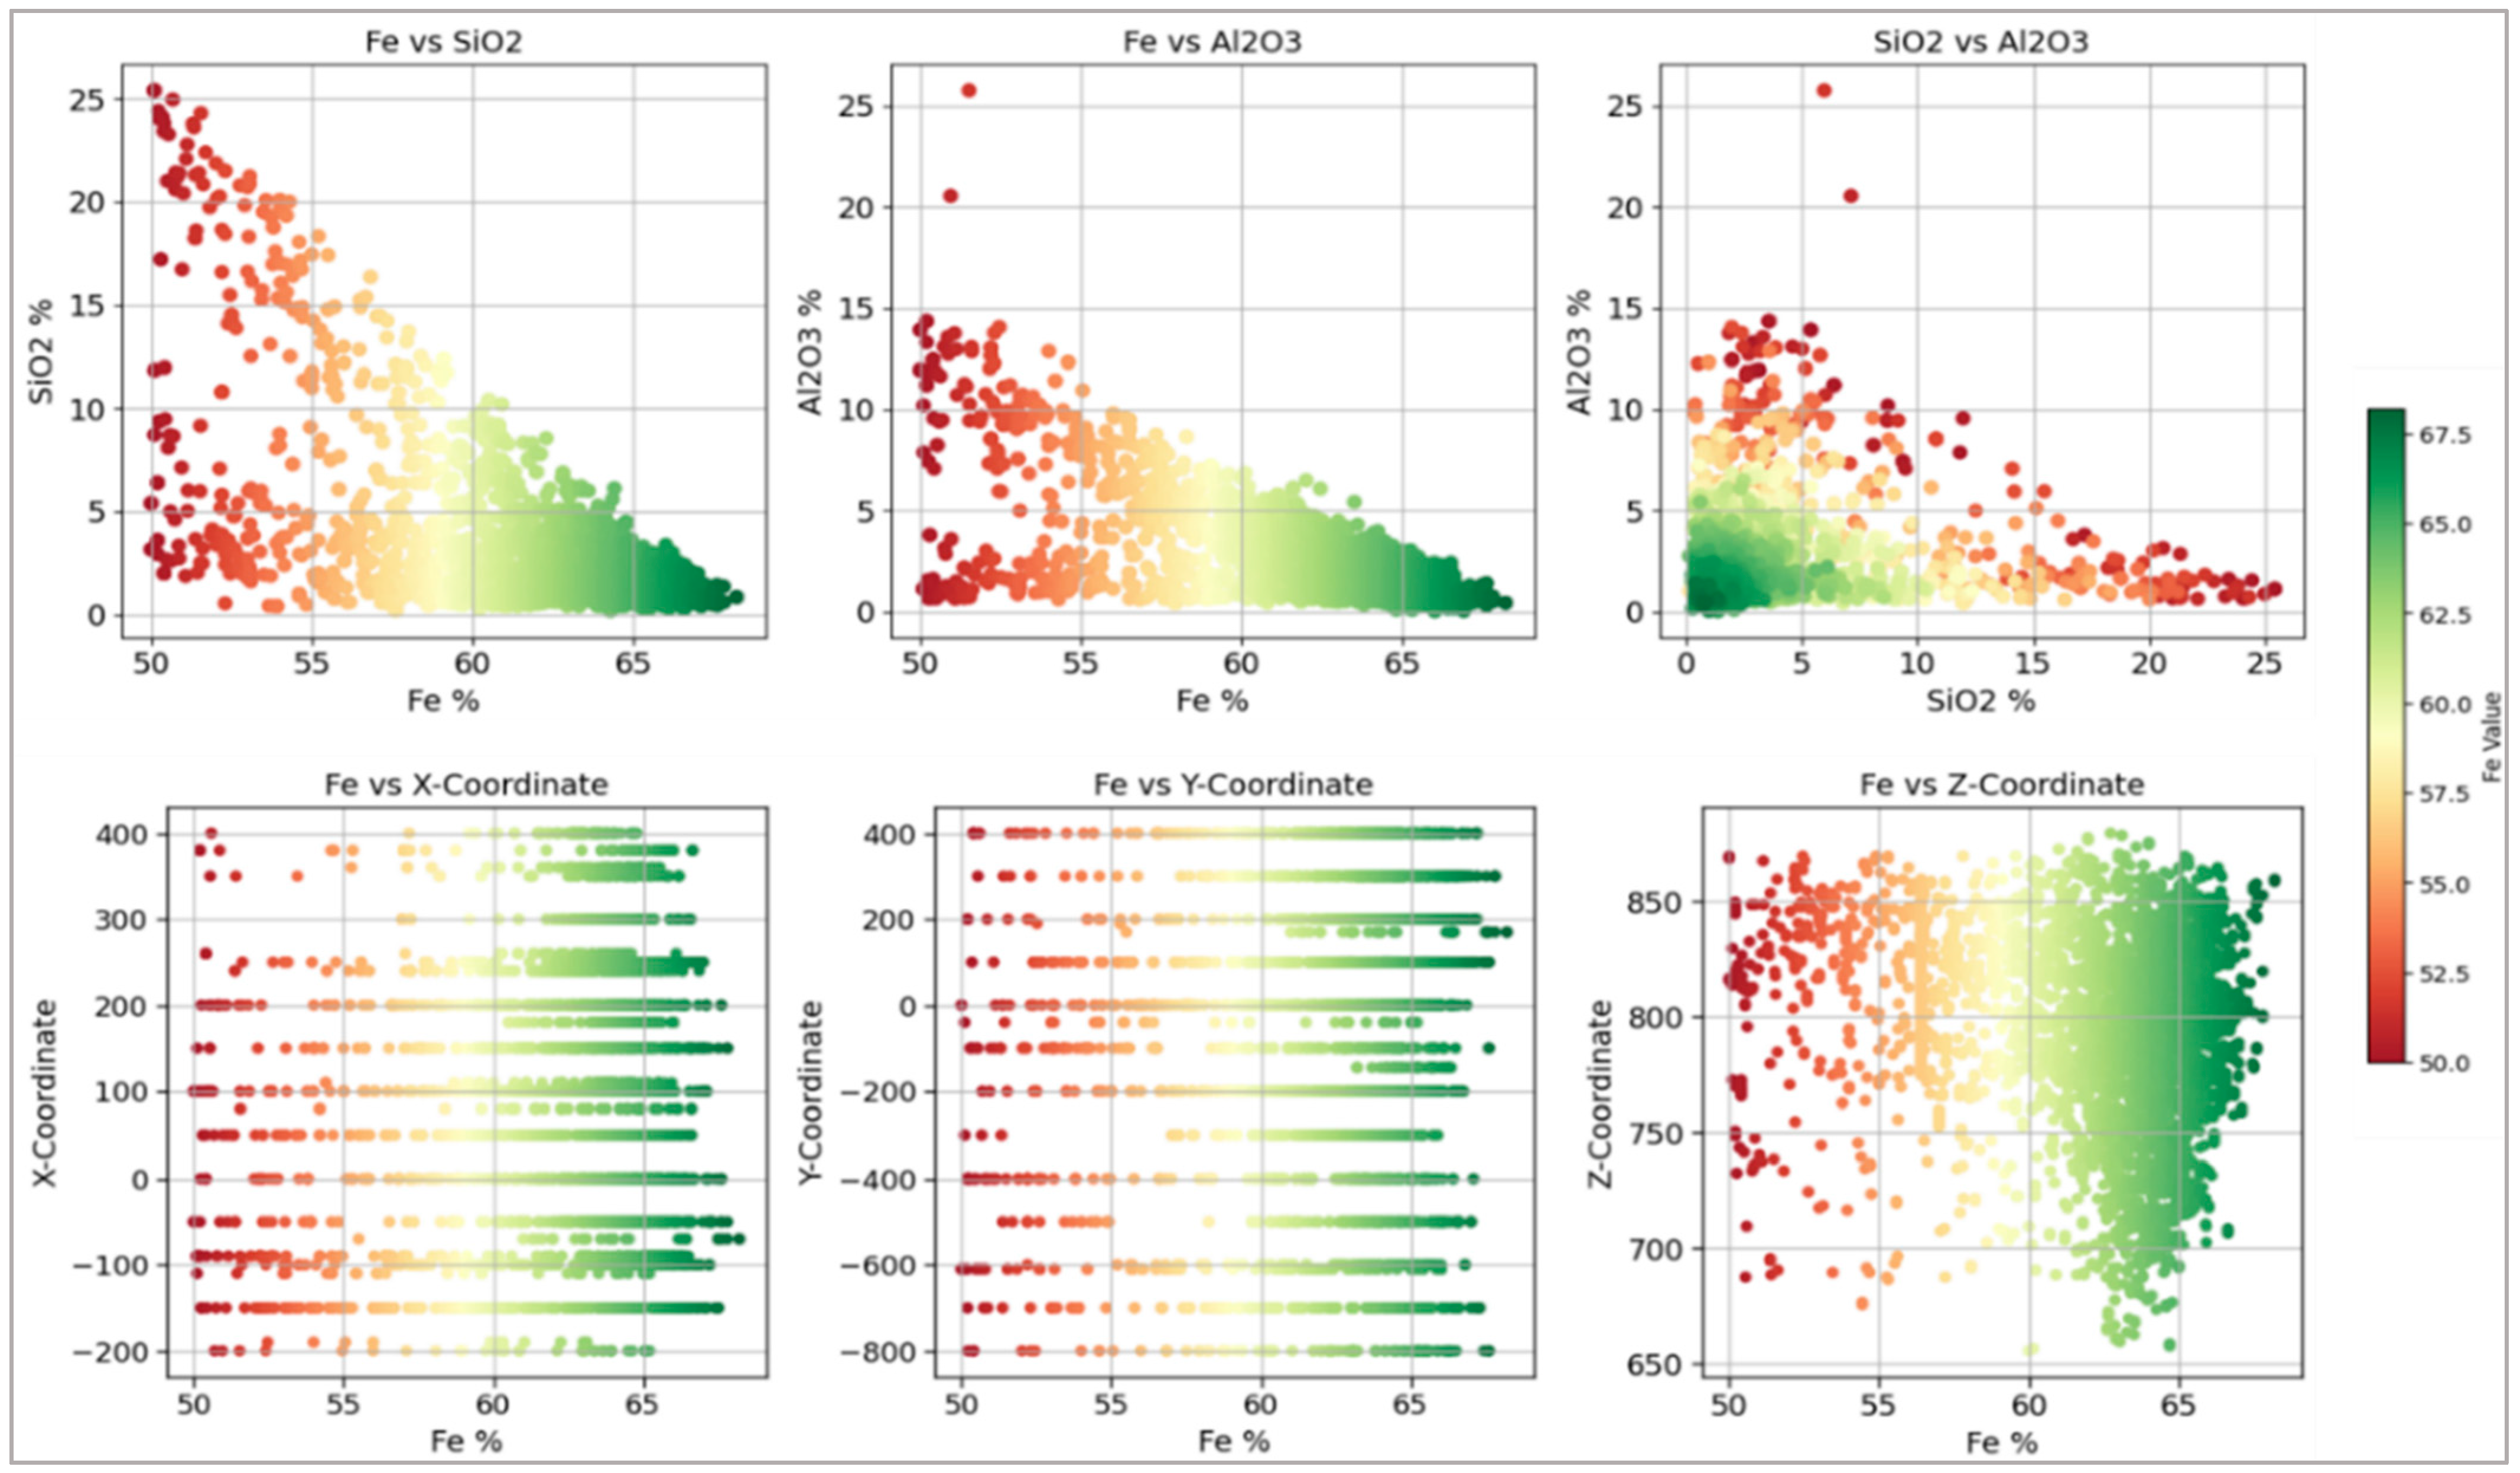
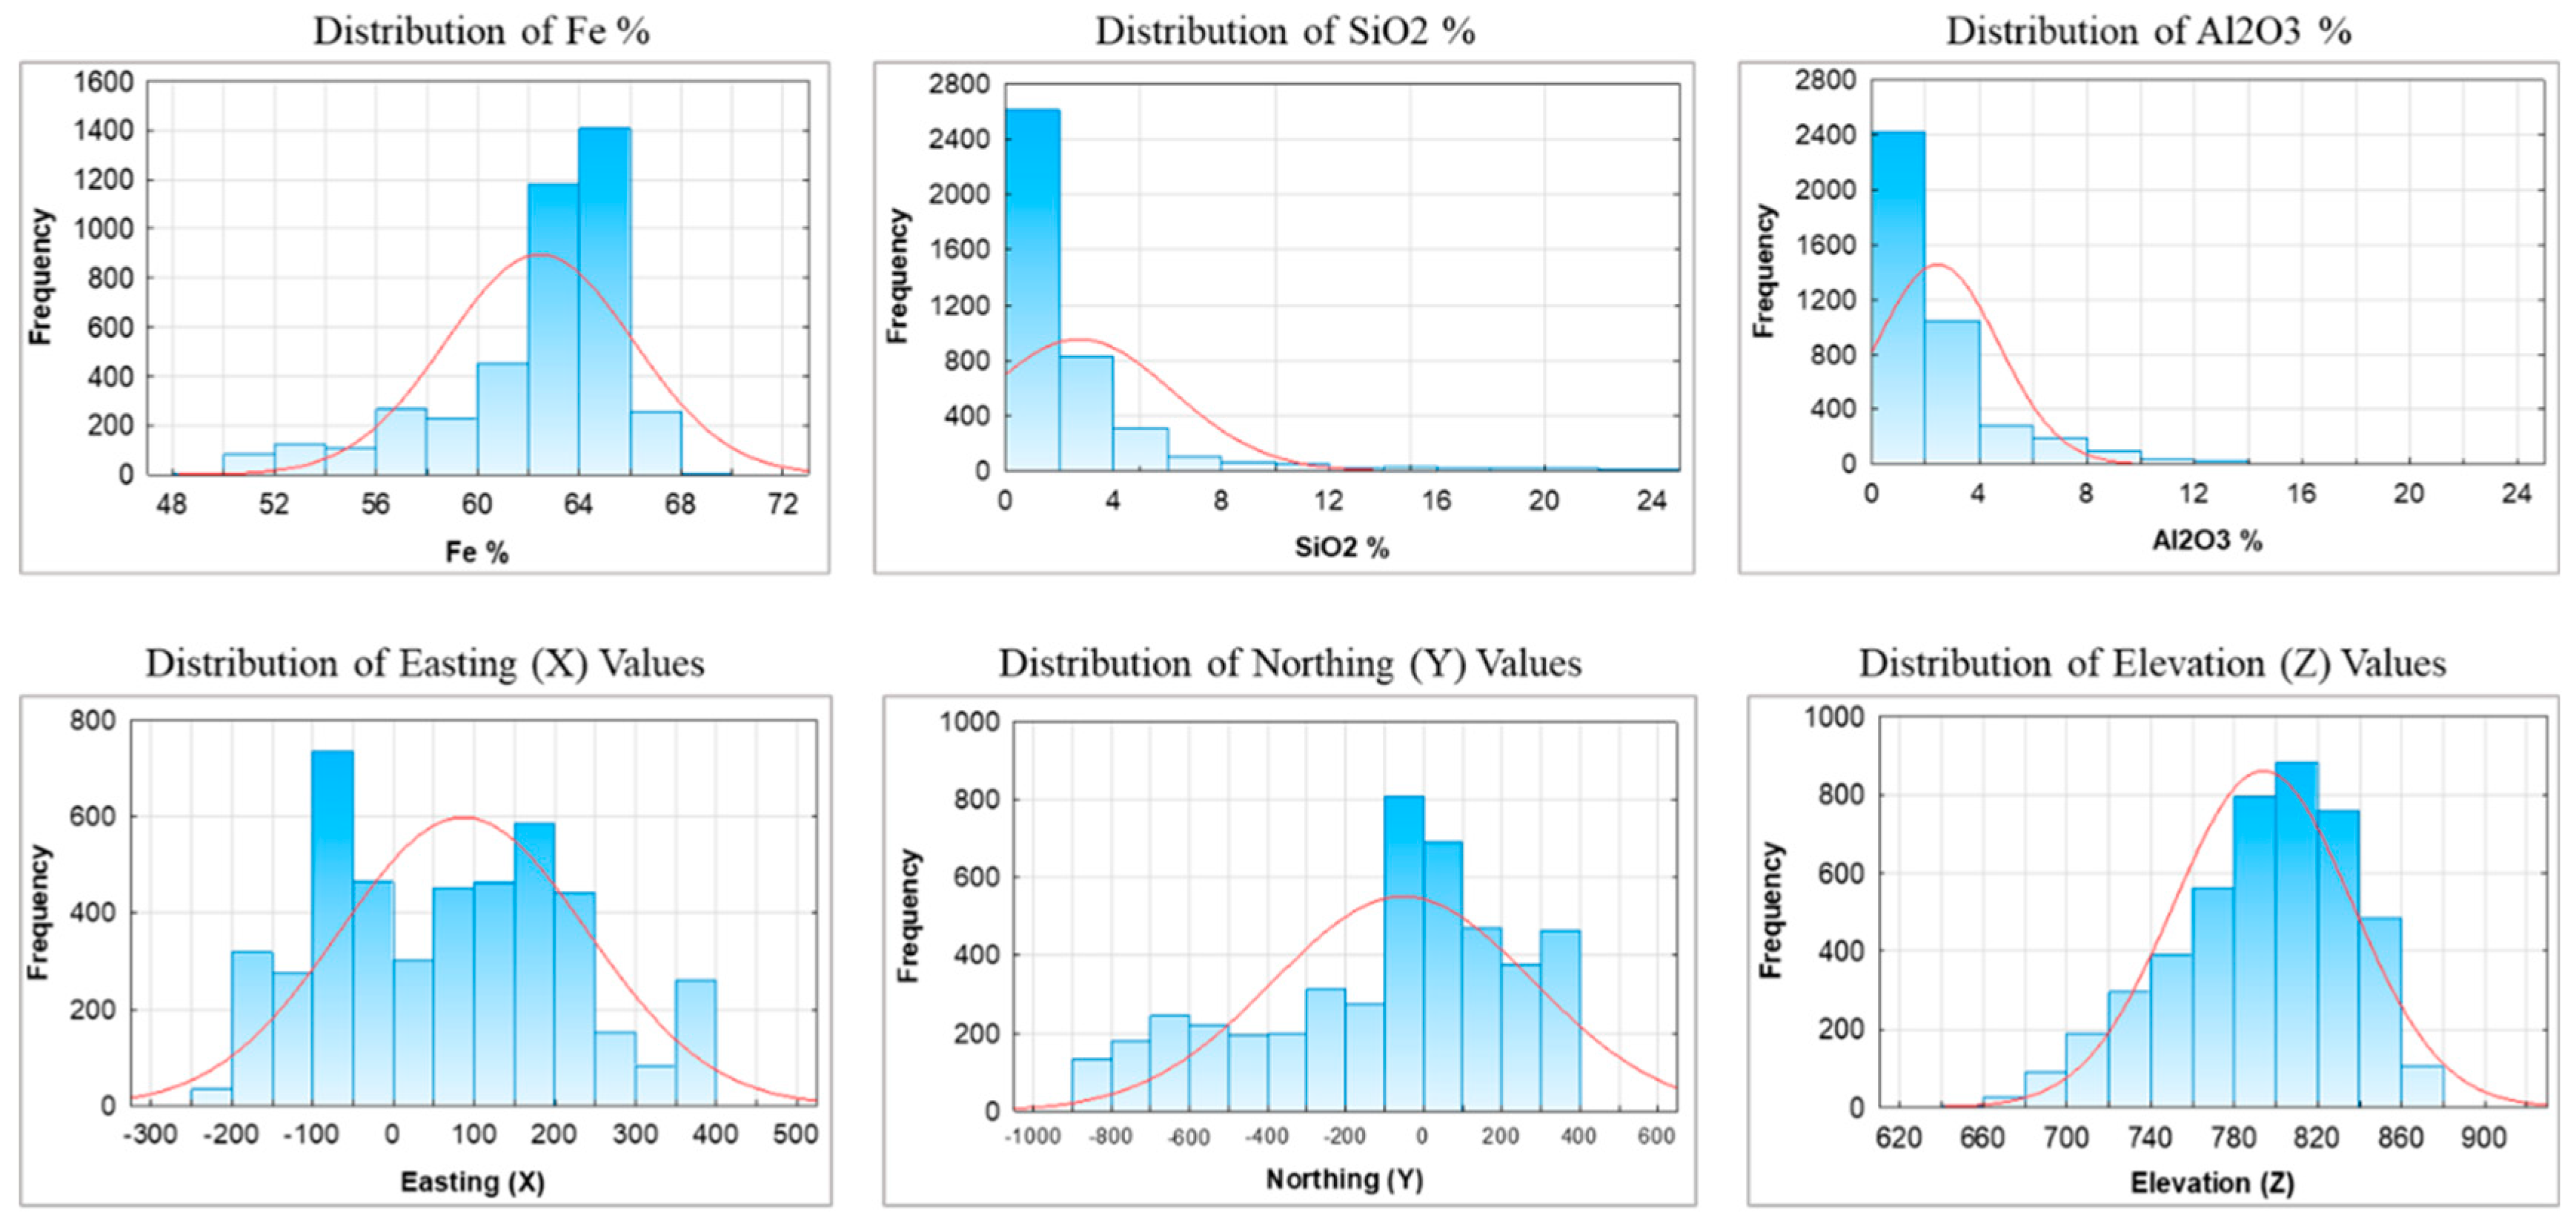
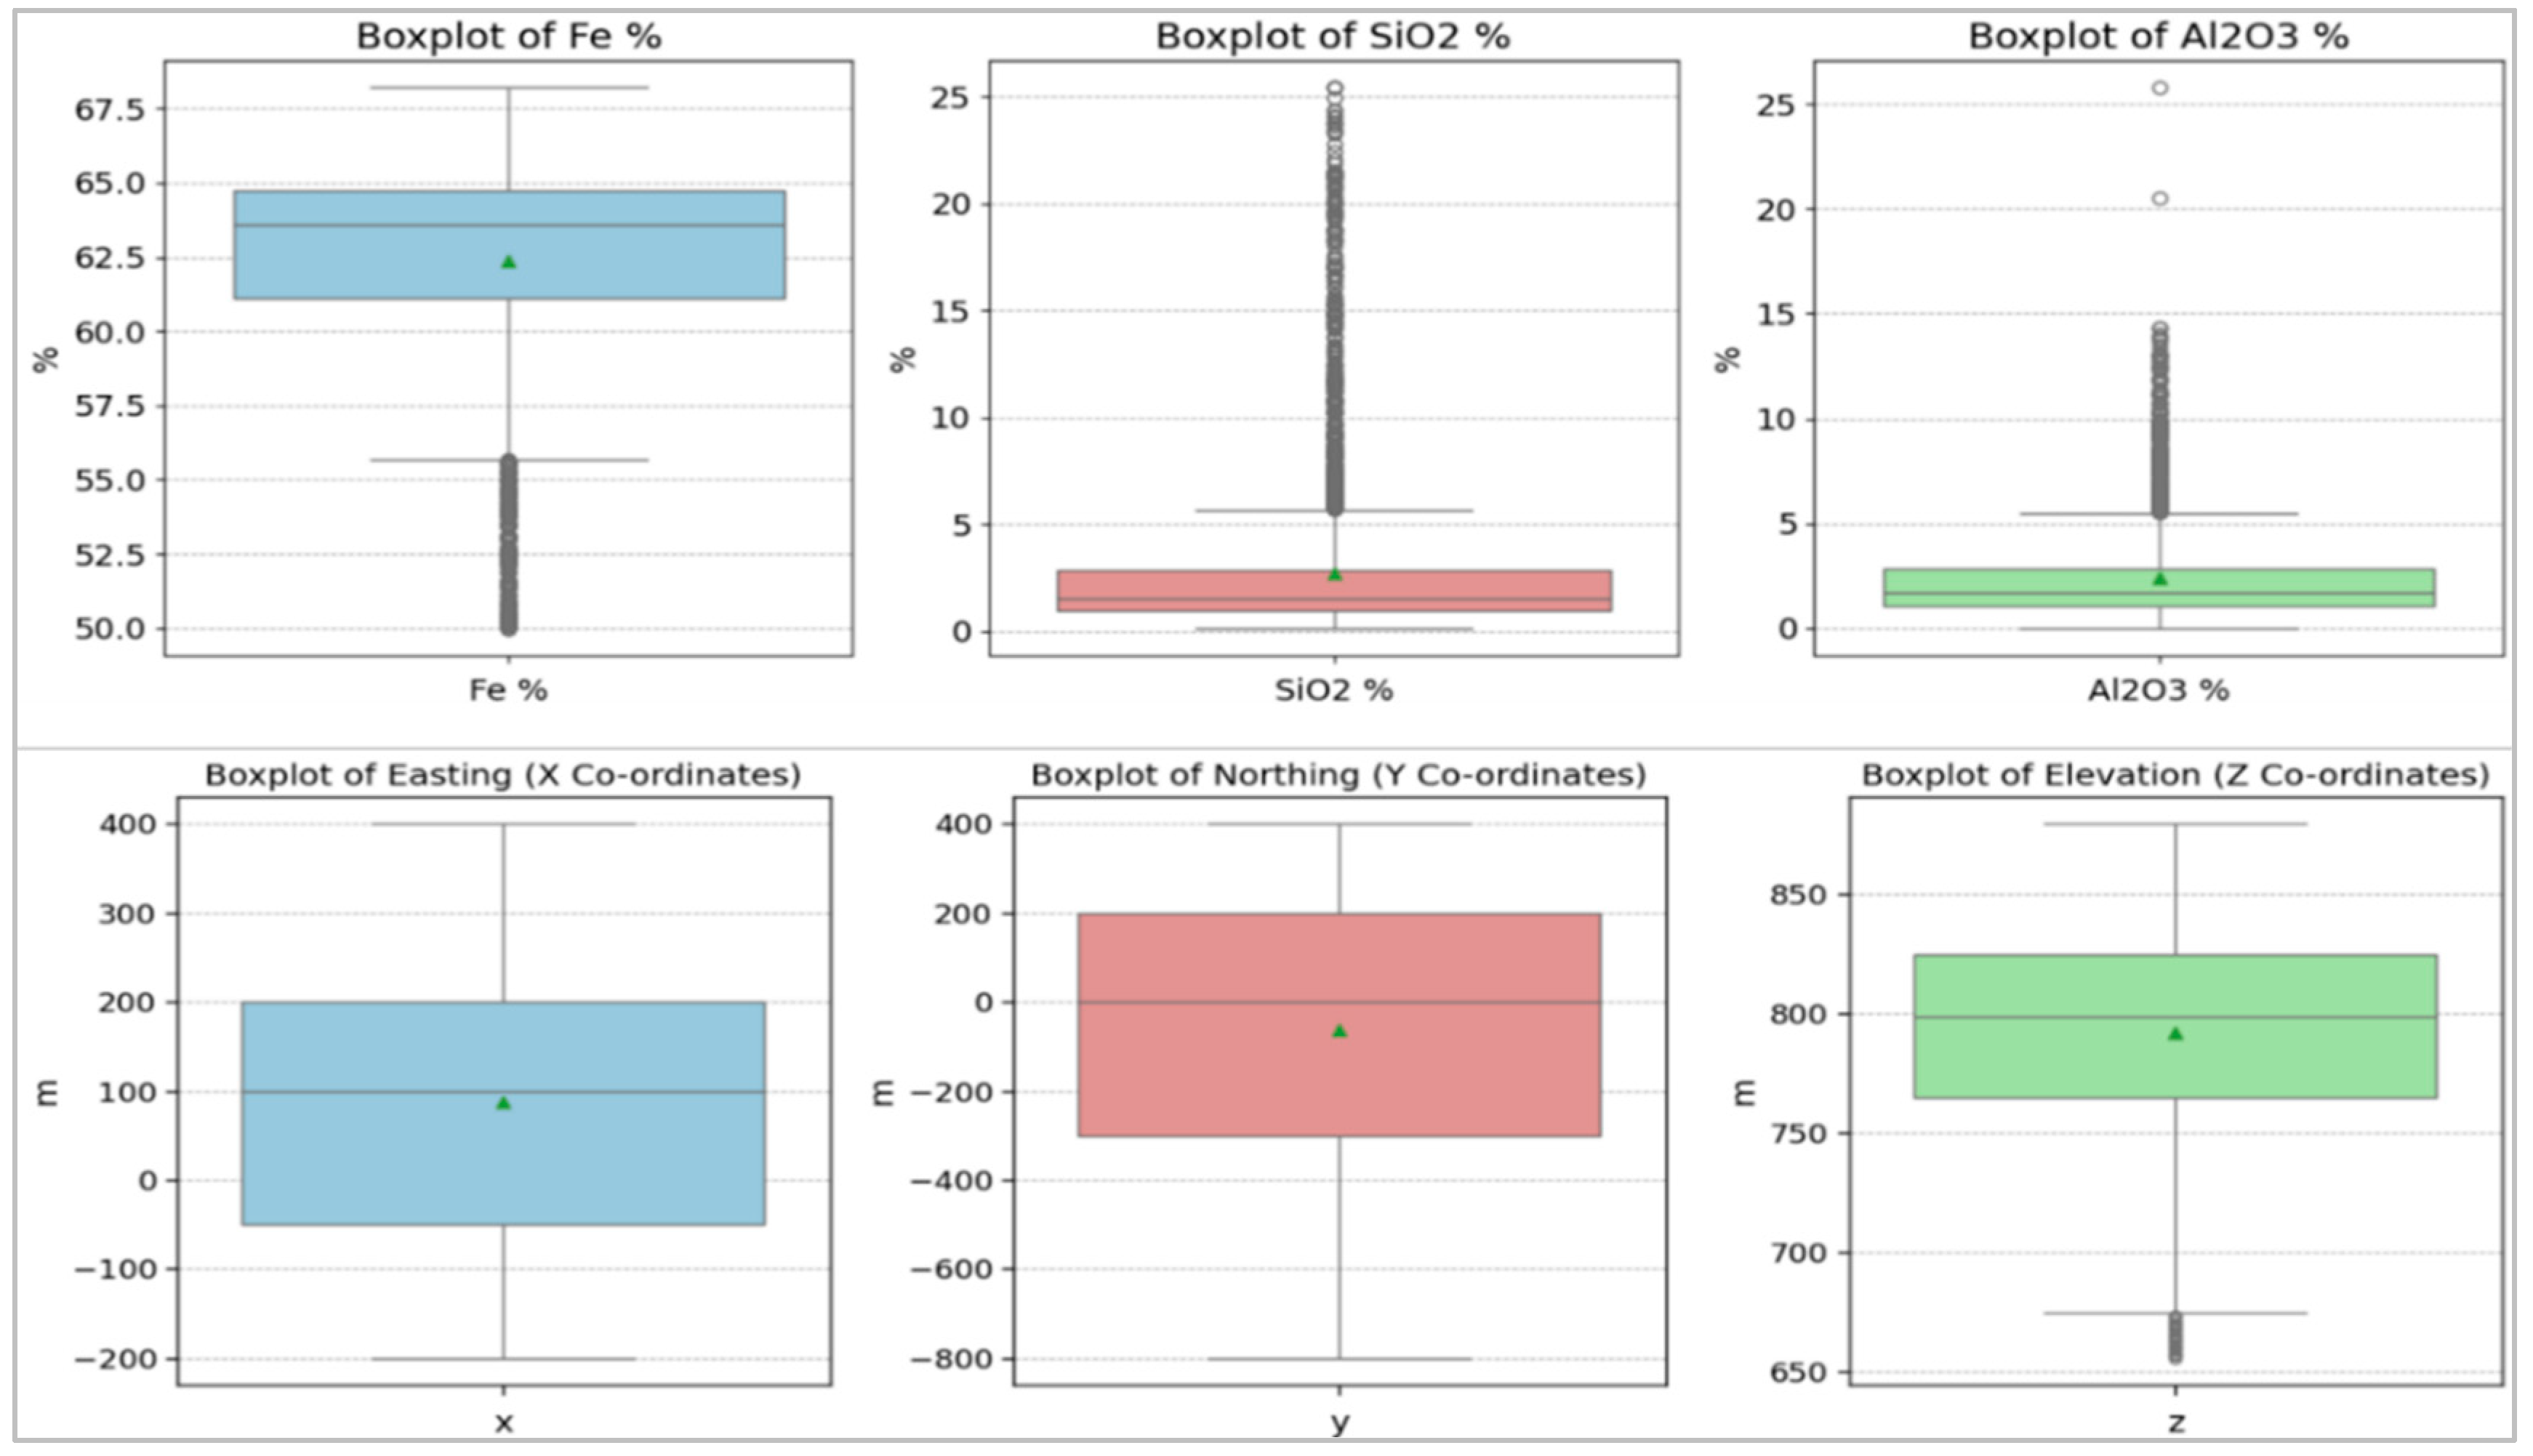
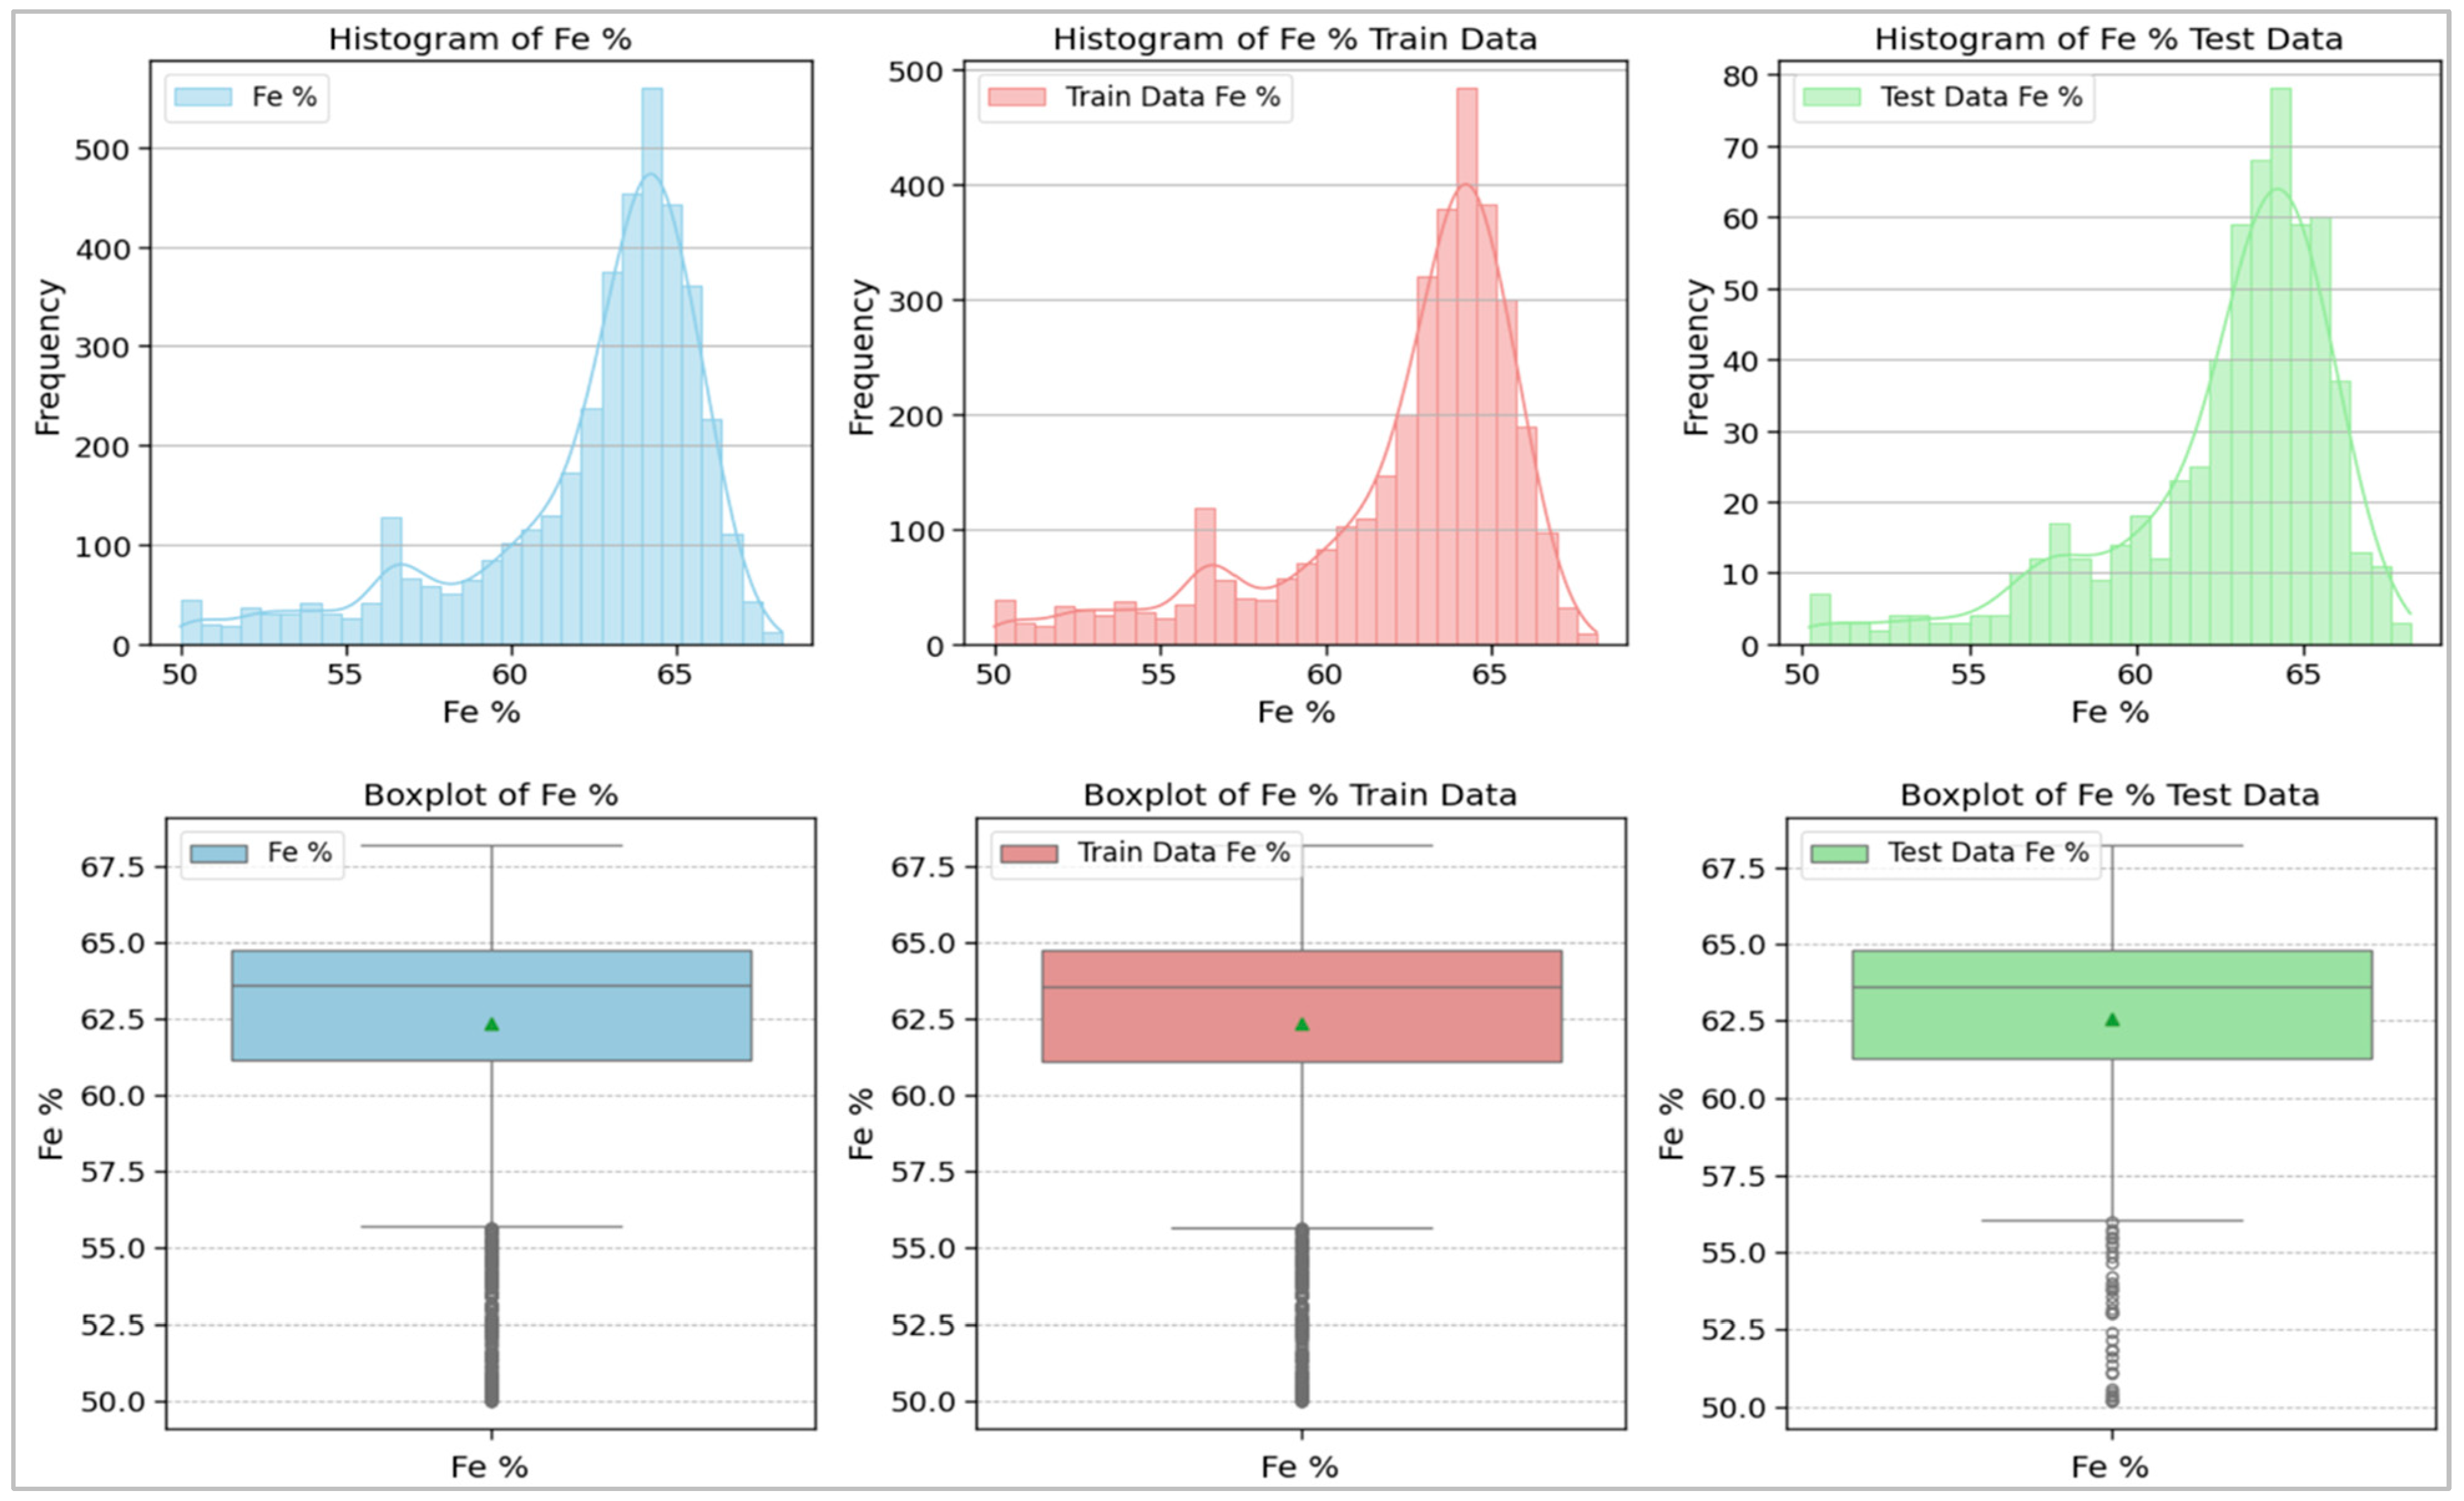
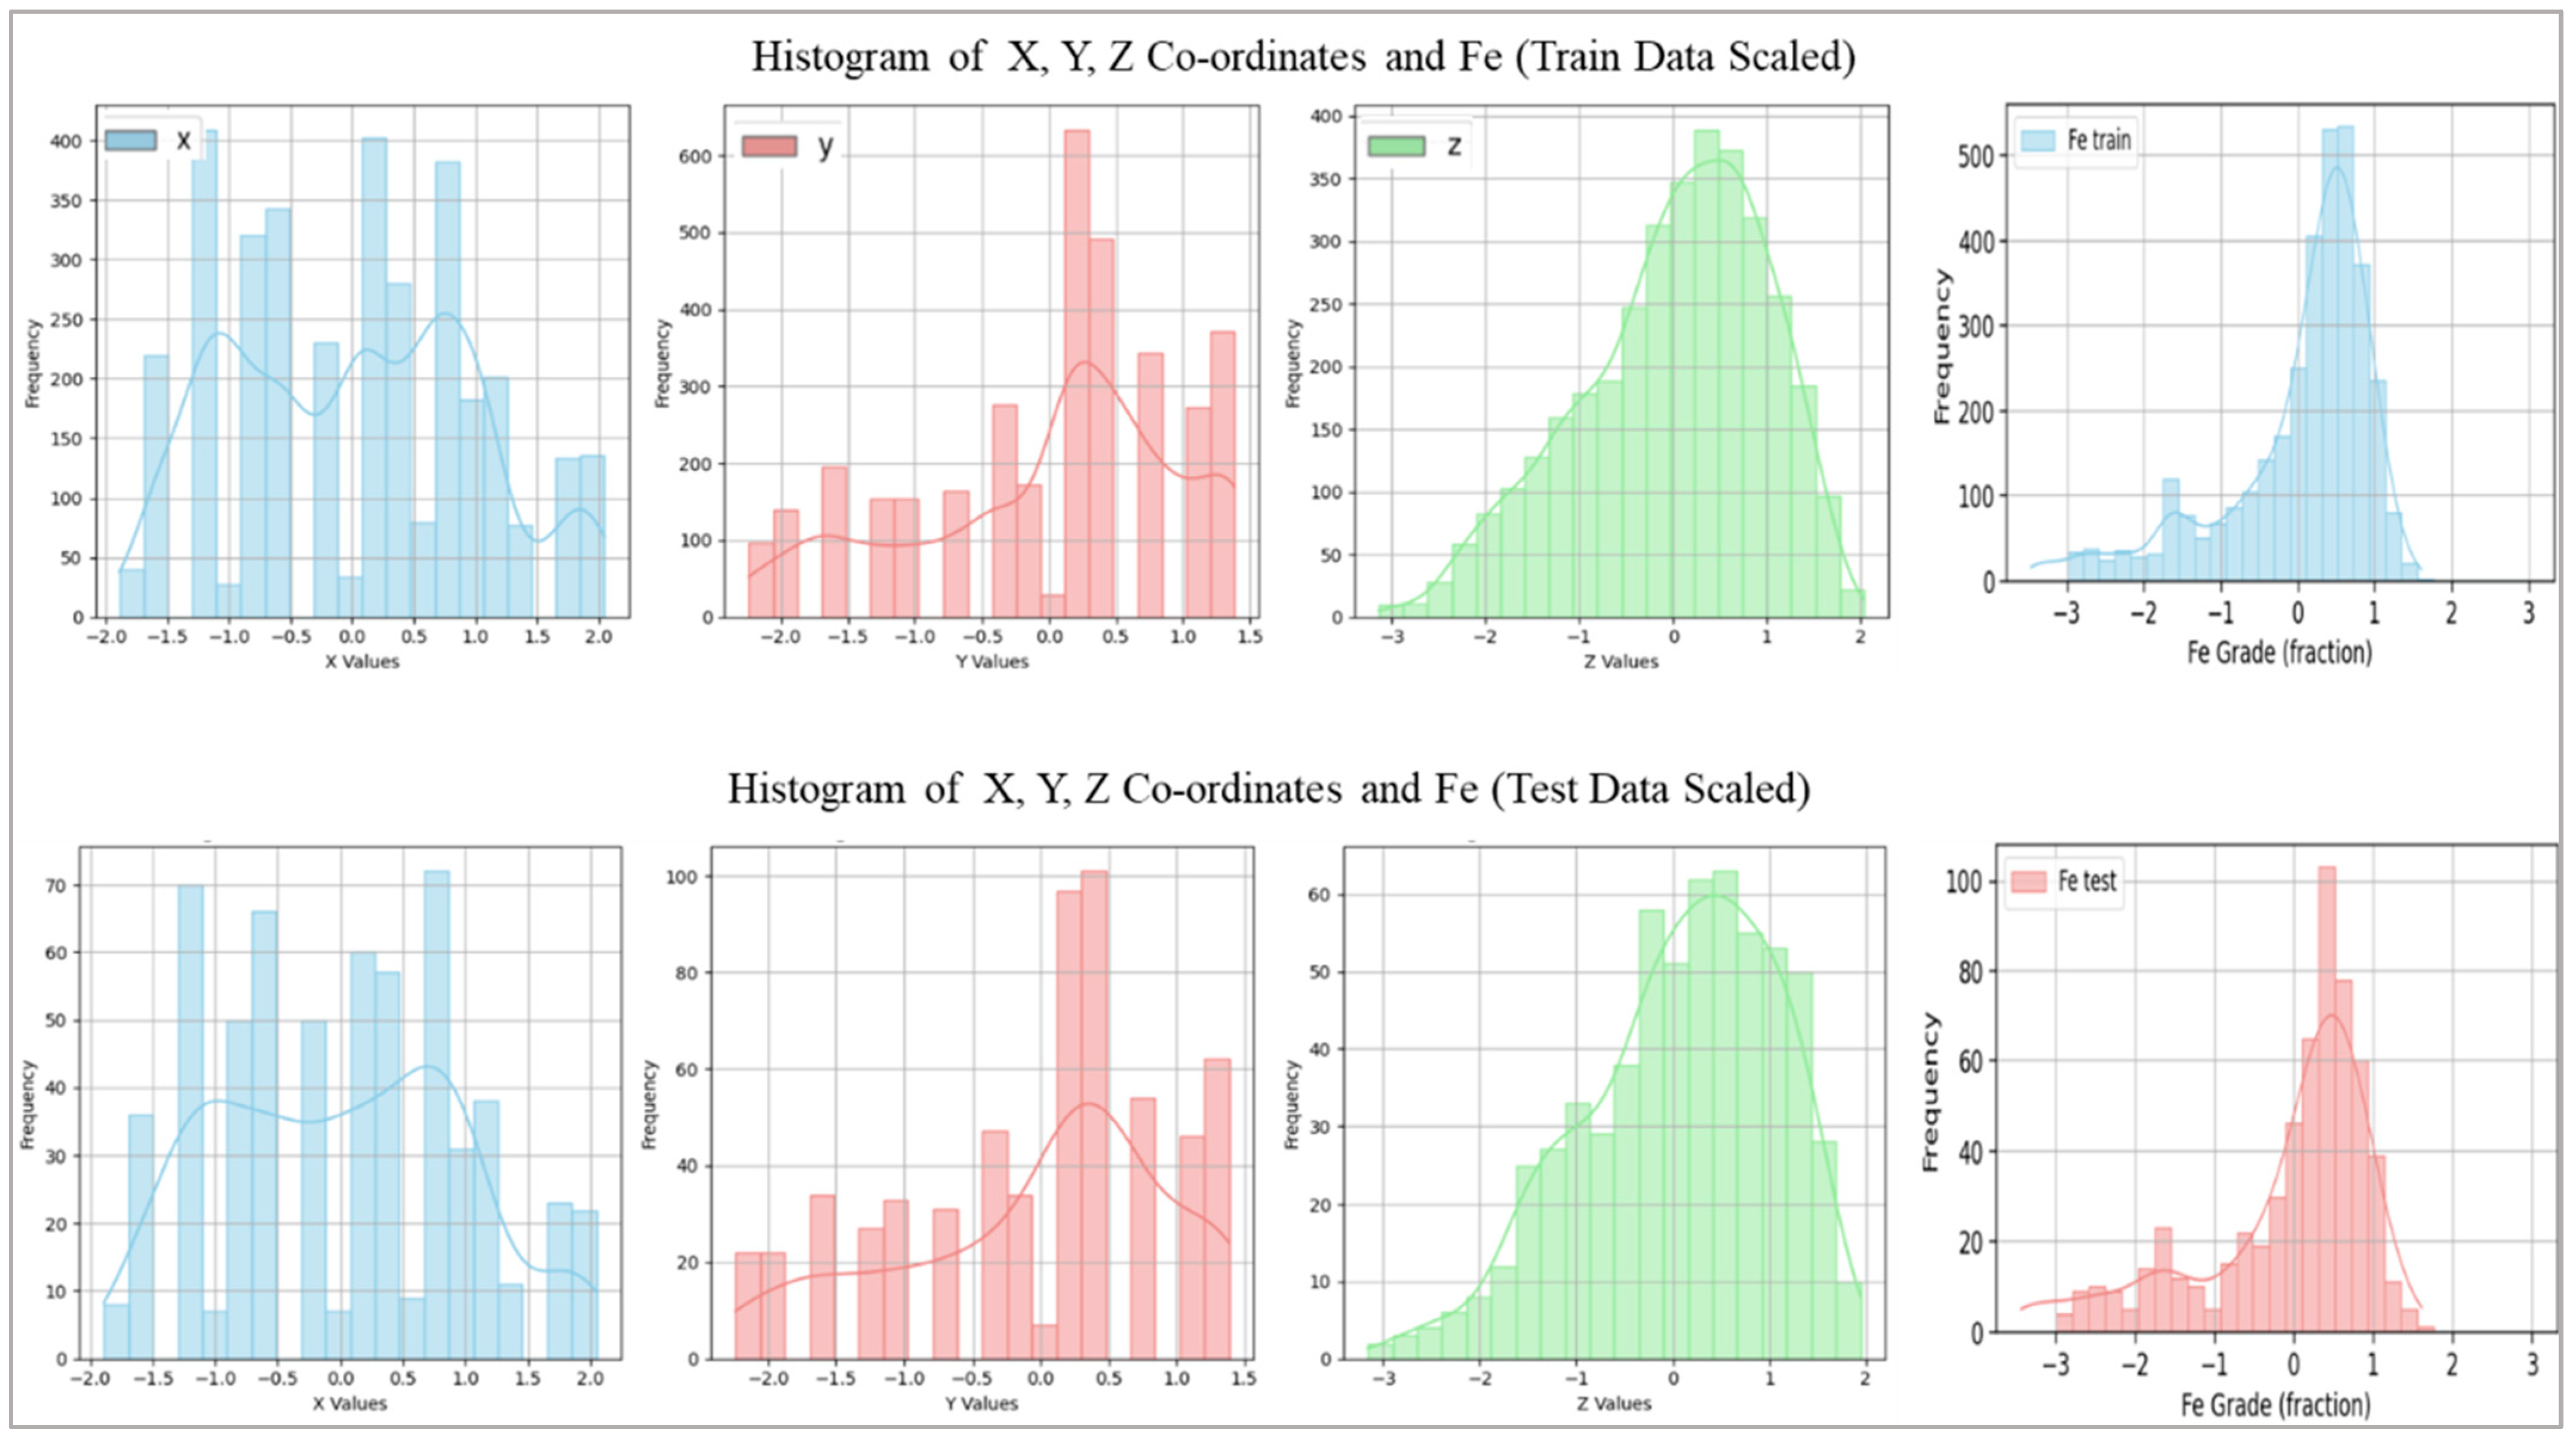
2.2. Data Collection, Preprocessing, and Analysis
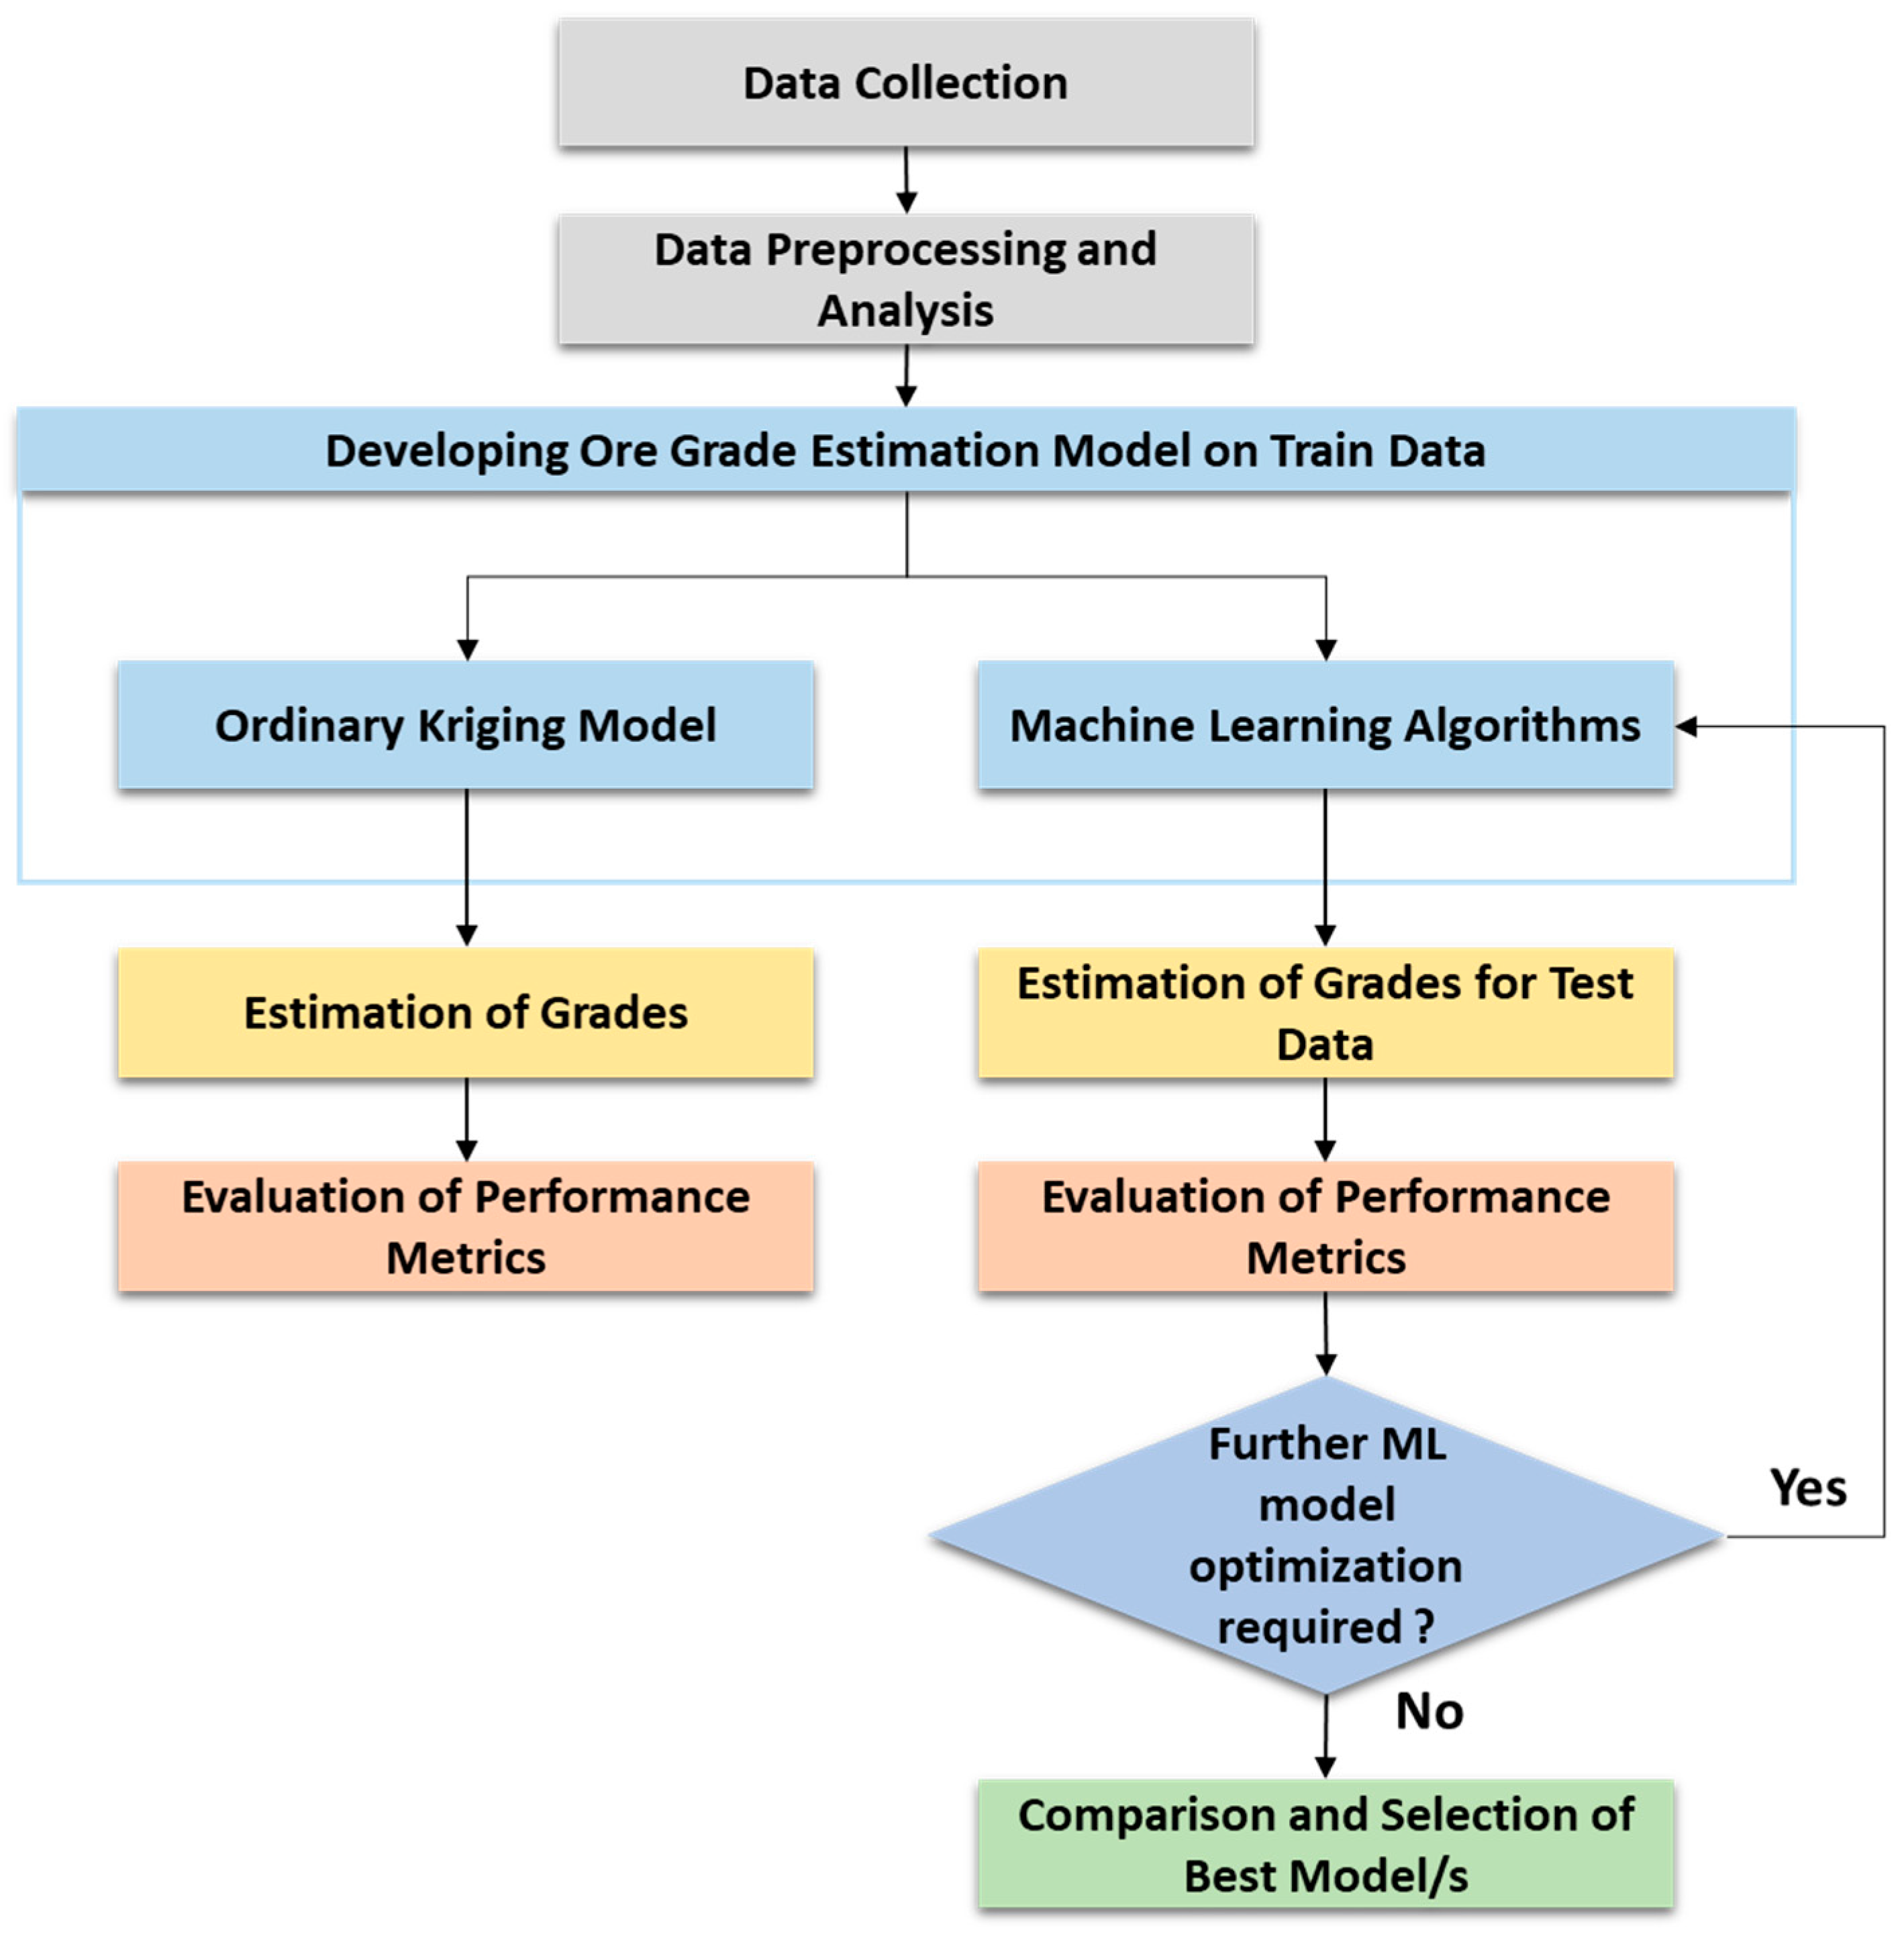
3. Ore Grade Estimation Models
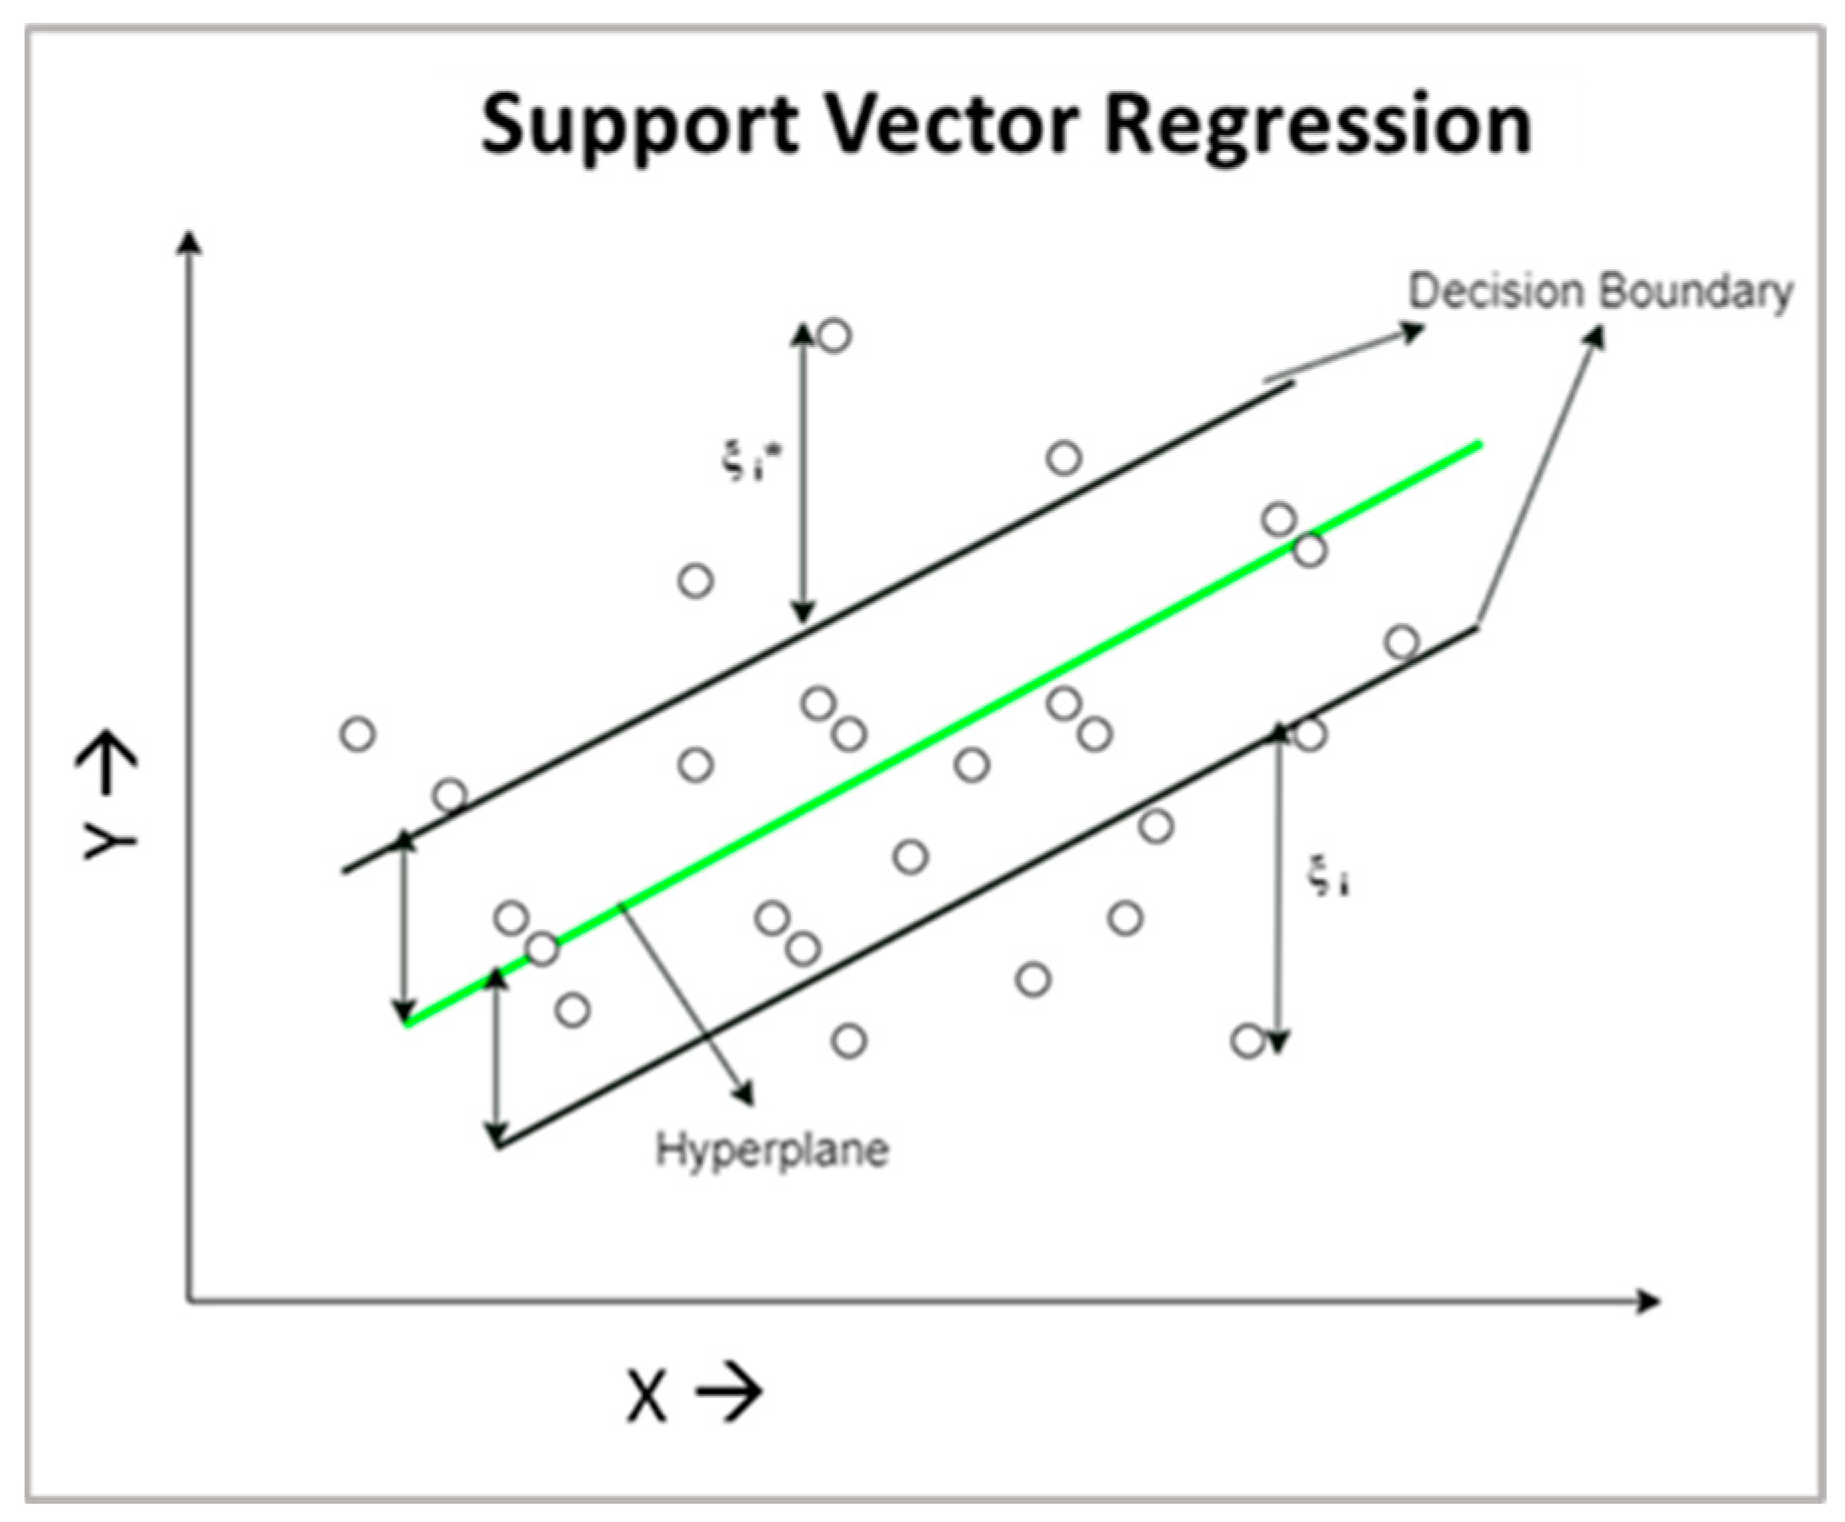
3.1. Support Vector Regression (SVR)
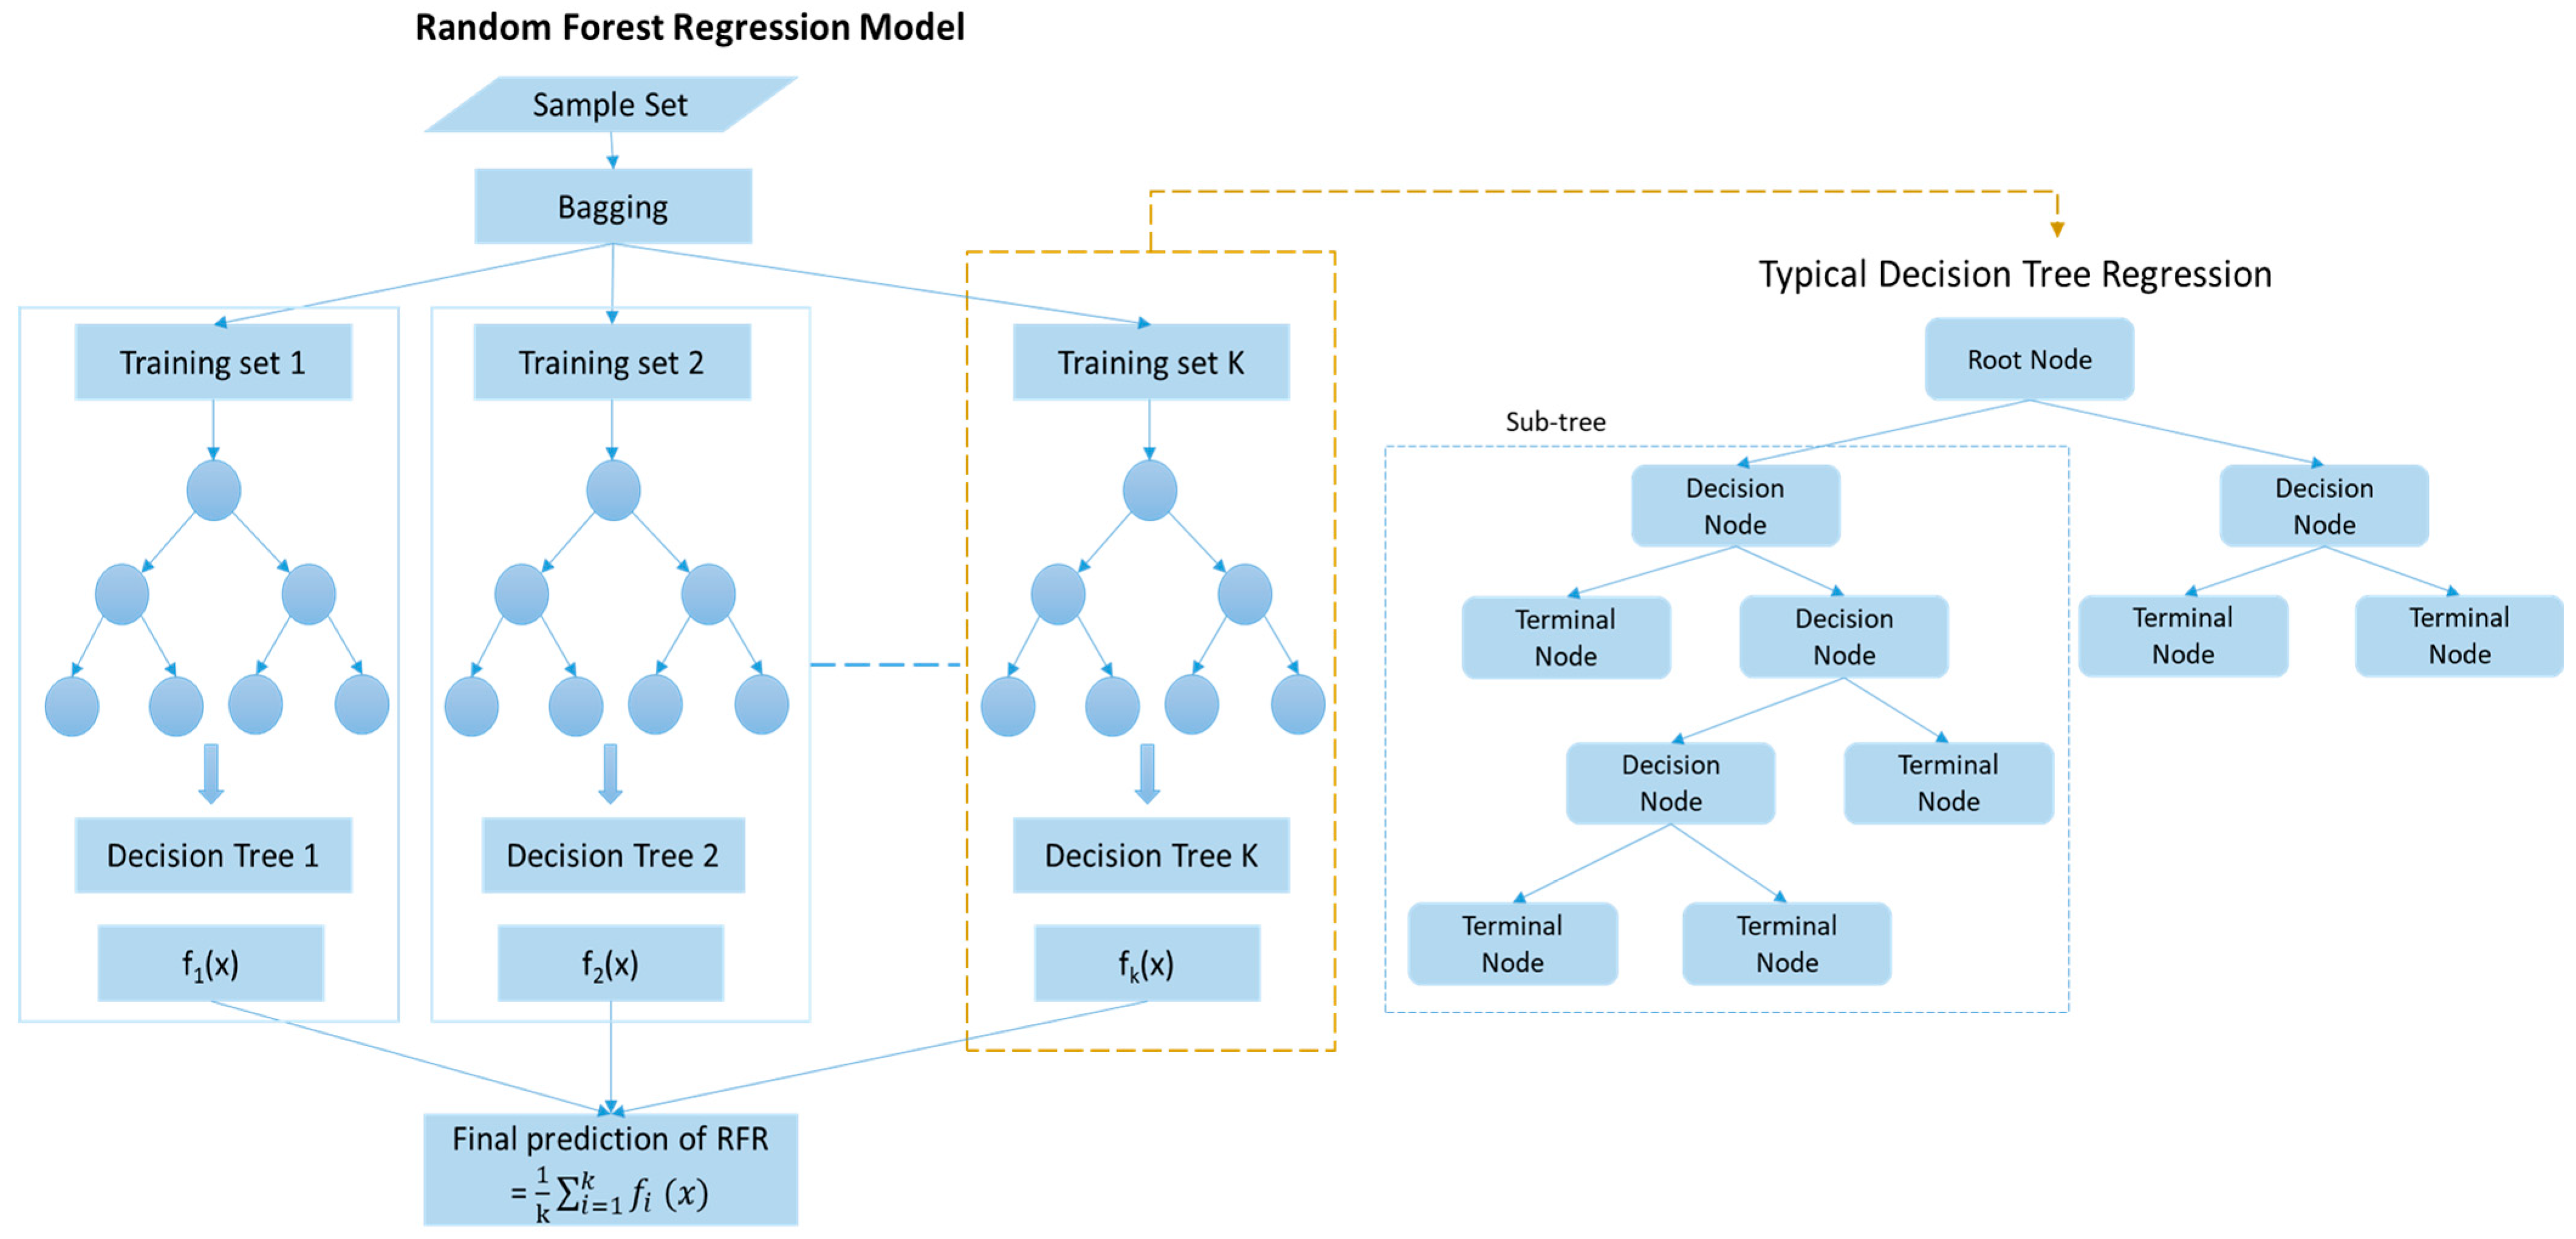
3.2. Random Forest Regression (RFR)
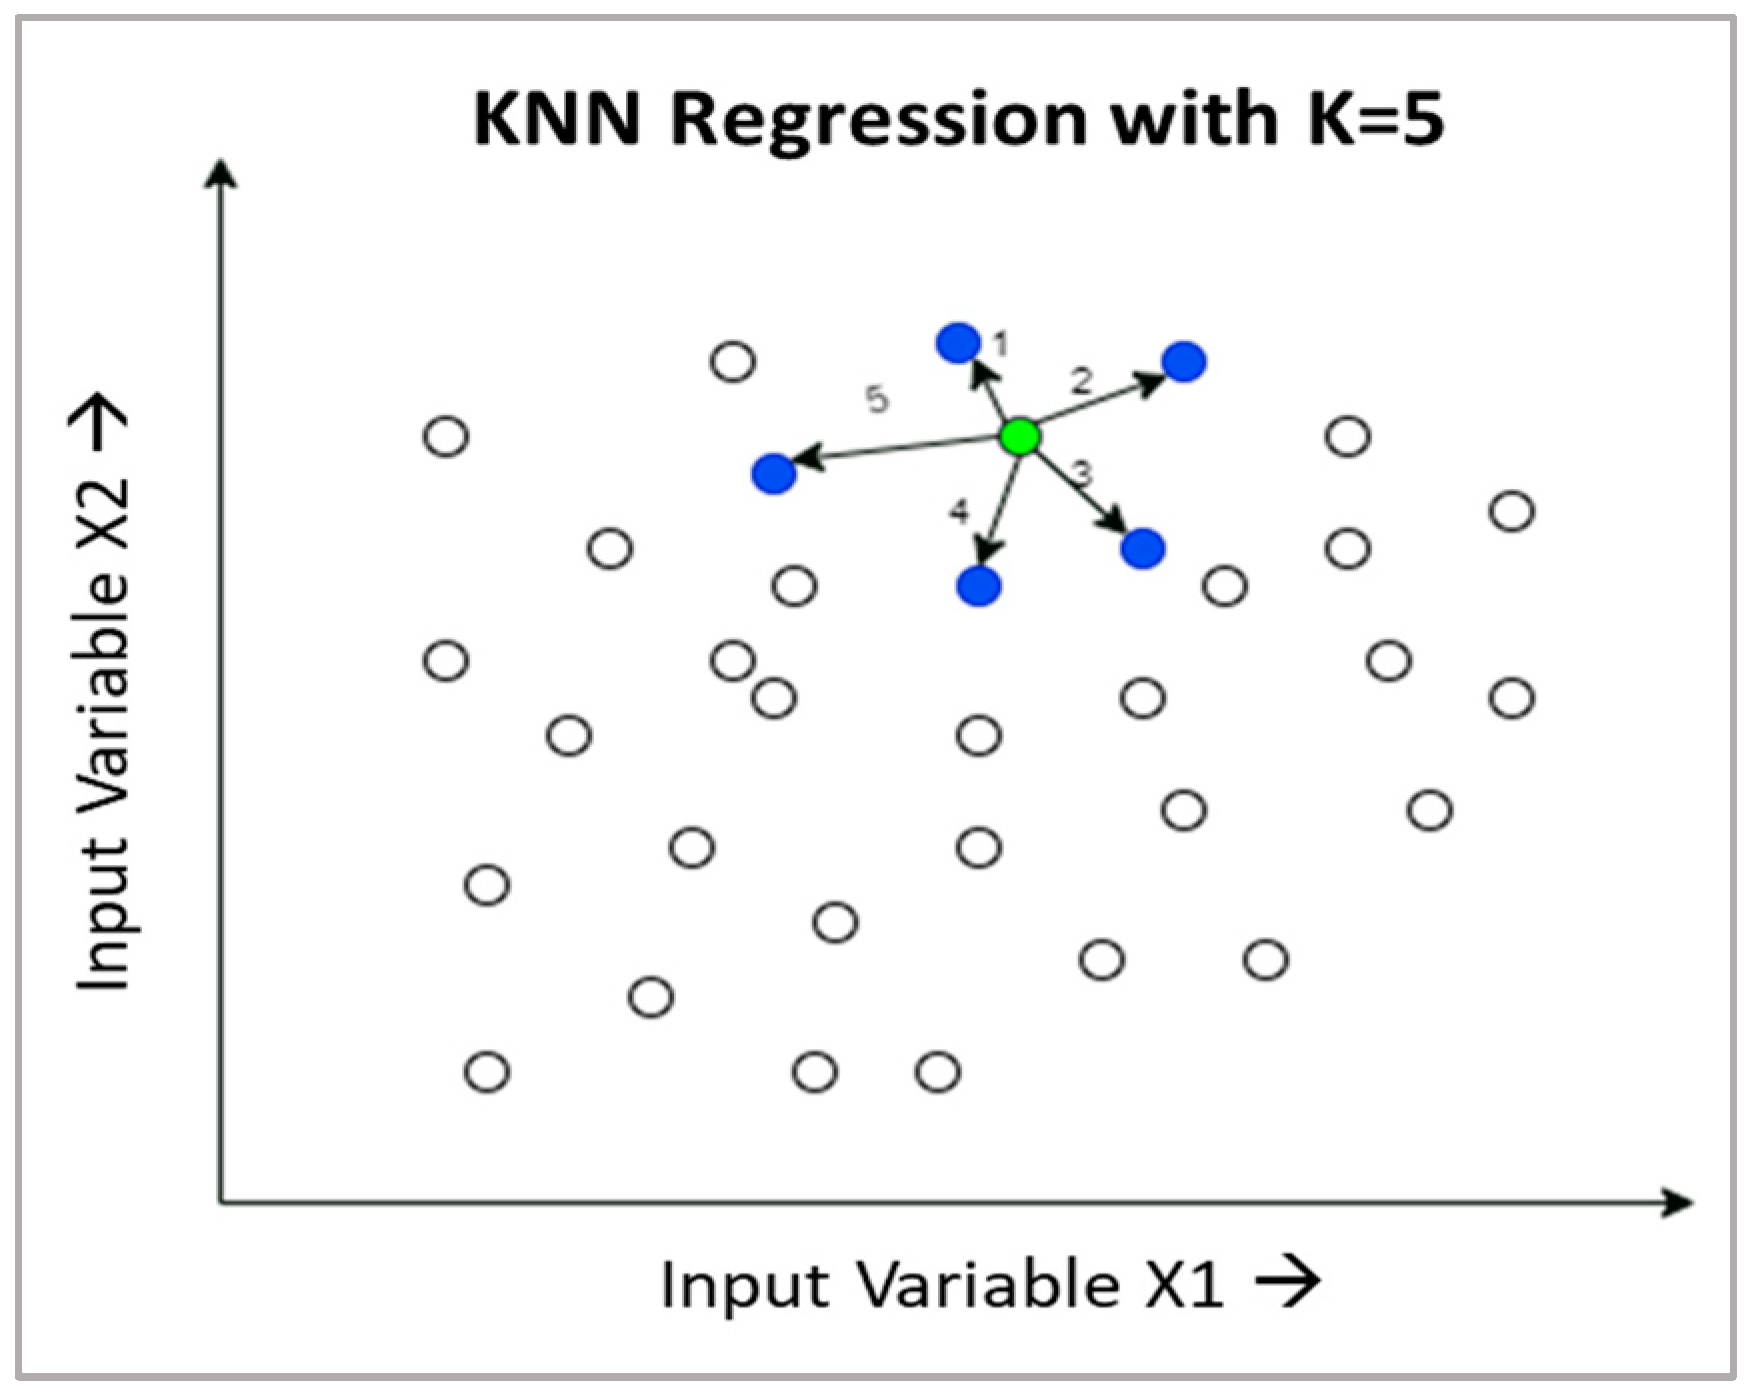
3.3. K-Nearest Neighbour (KNN) Regression
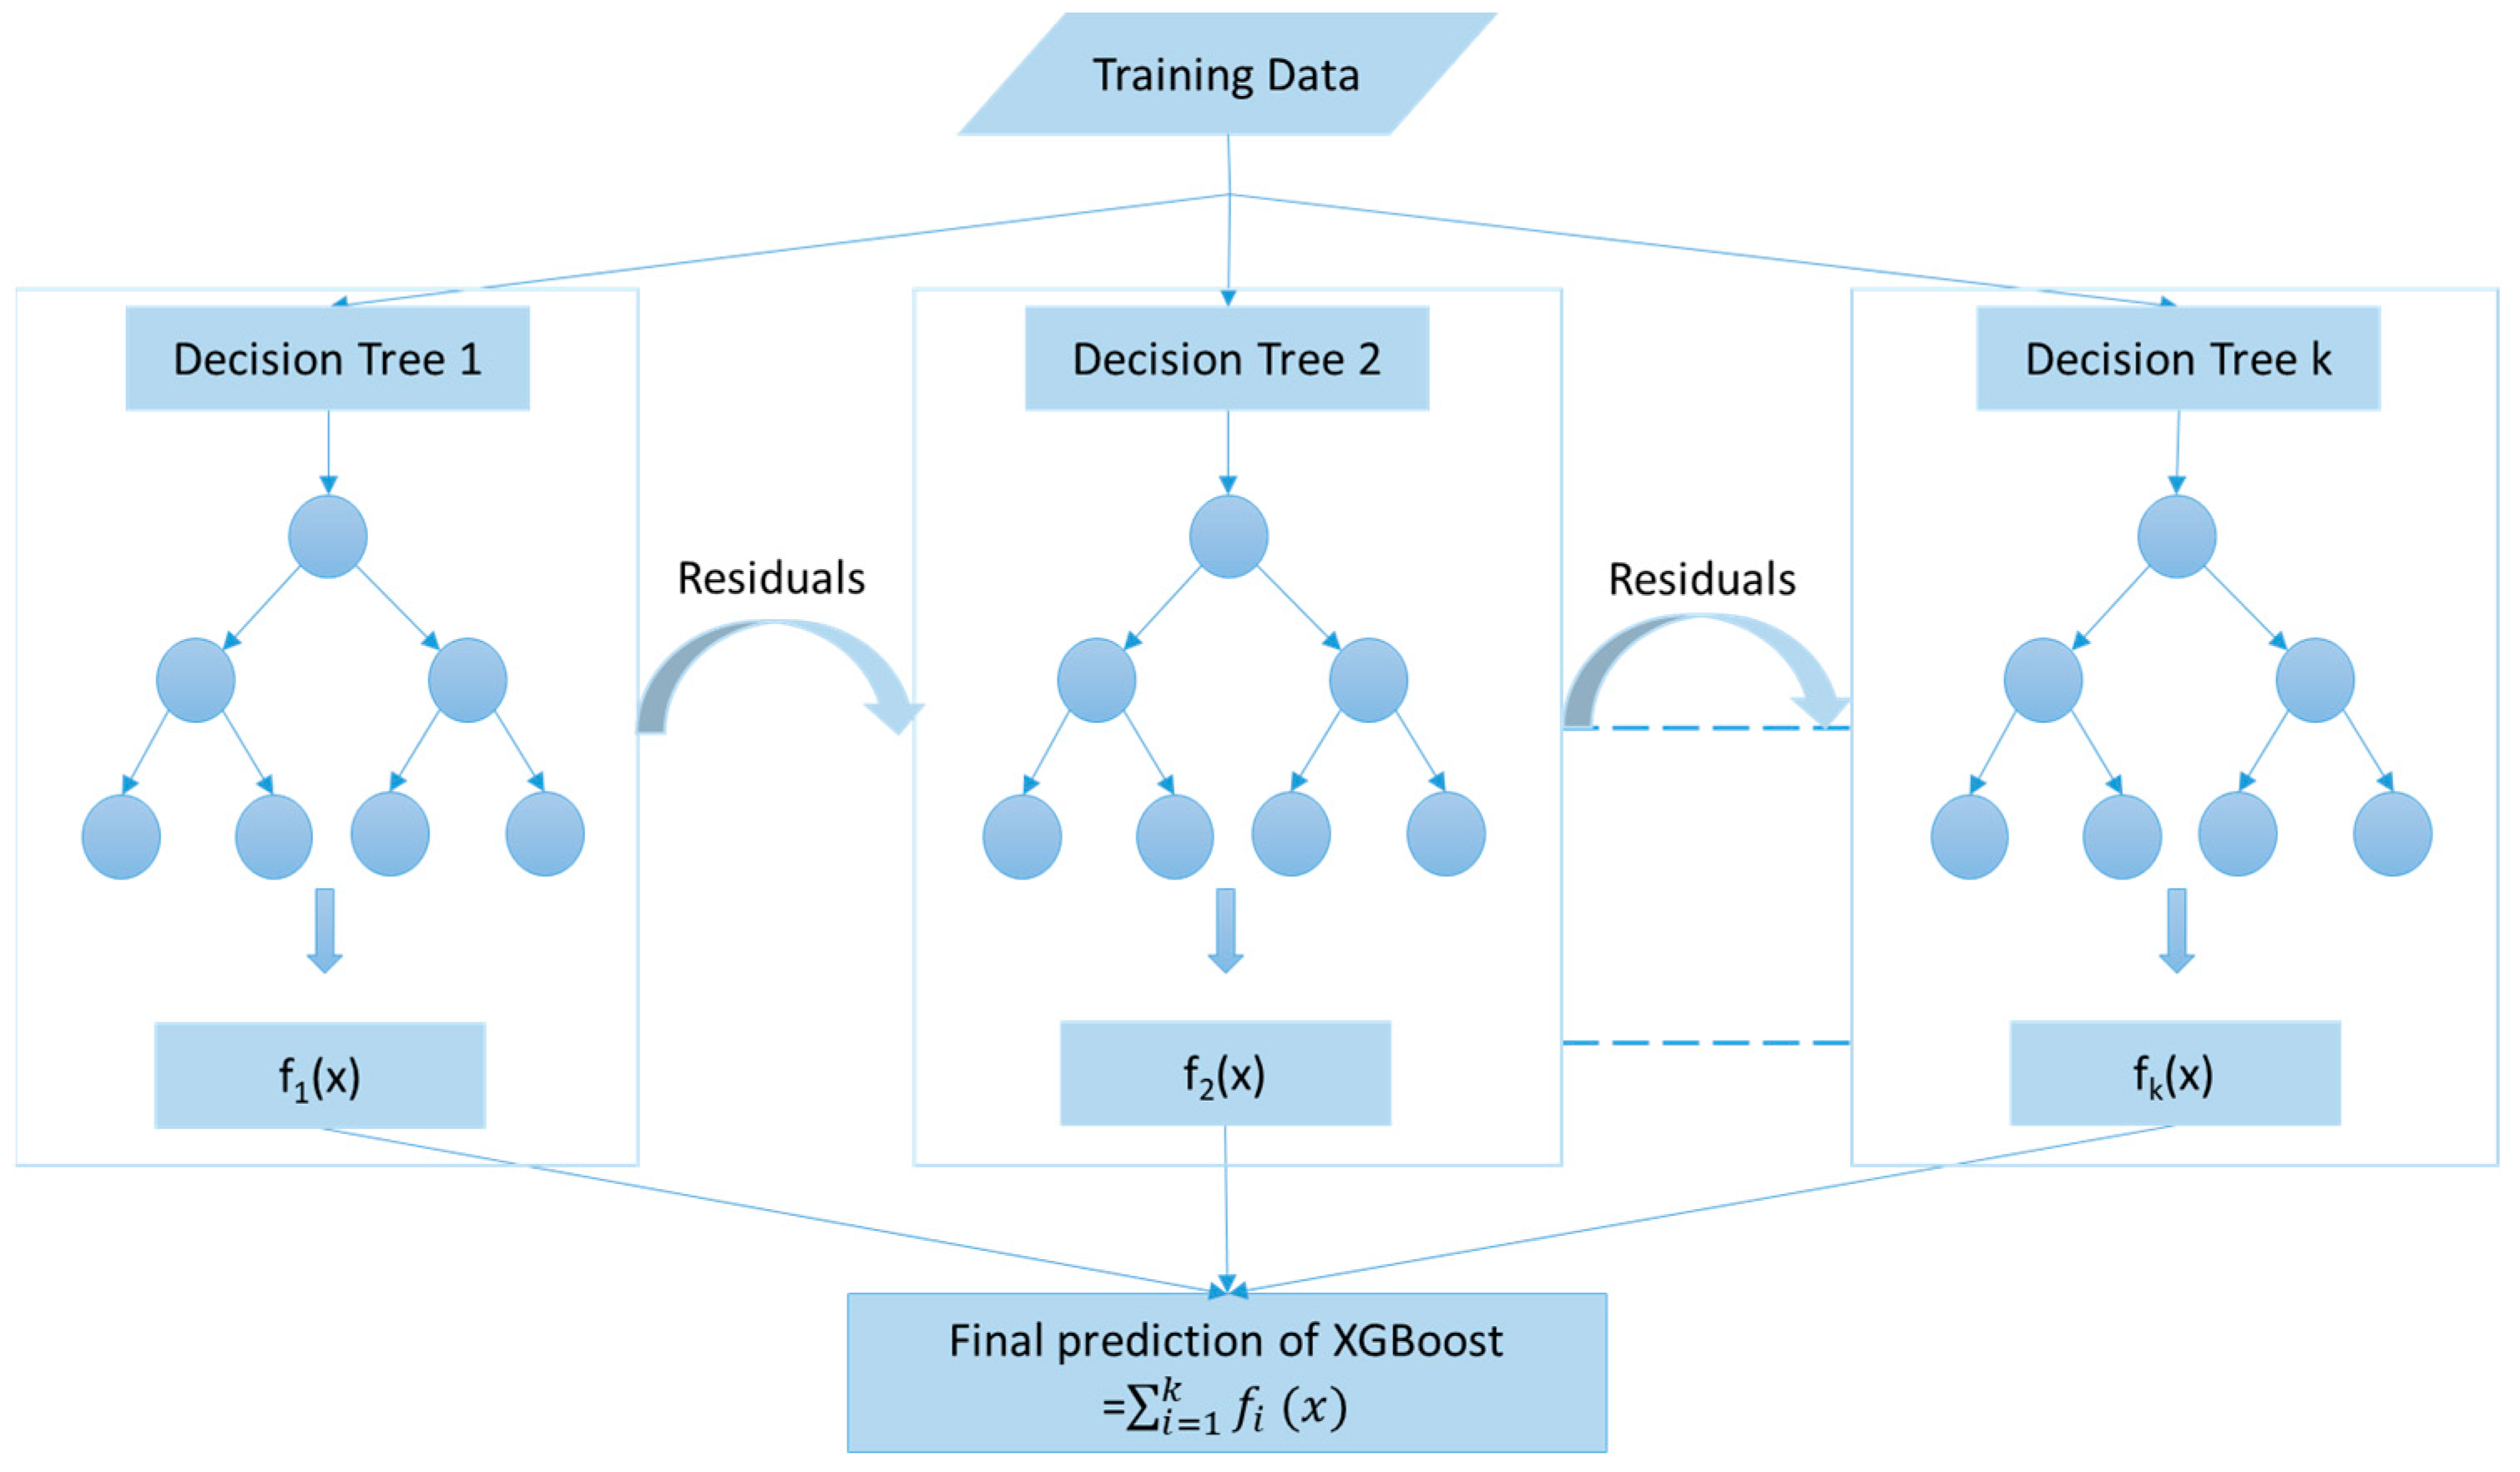
3.4. XGBoost Regression
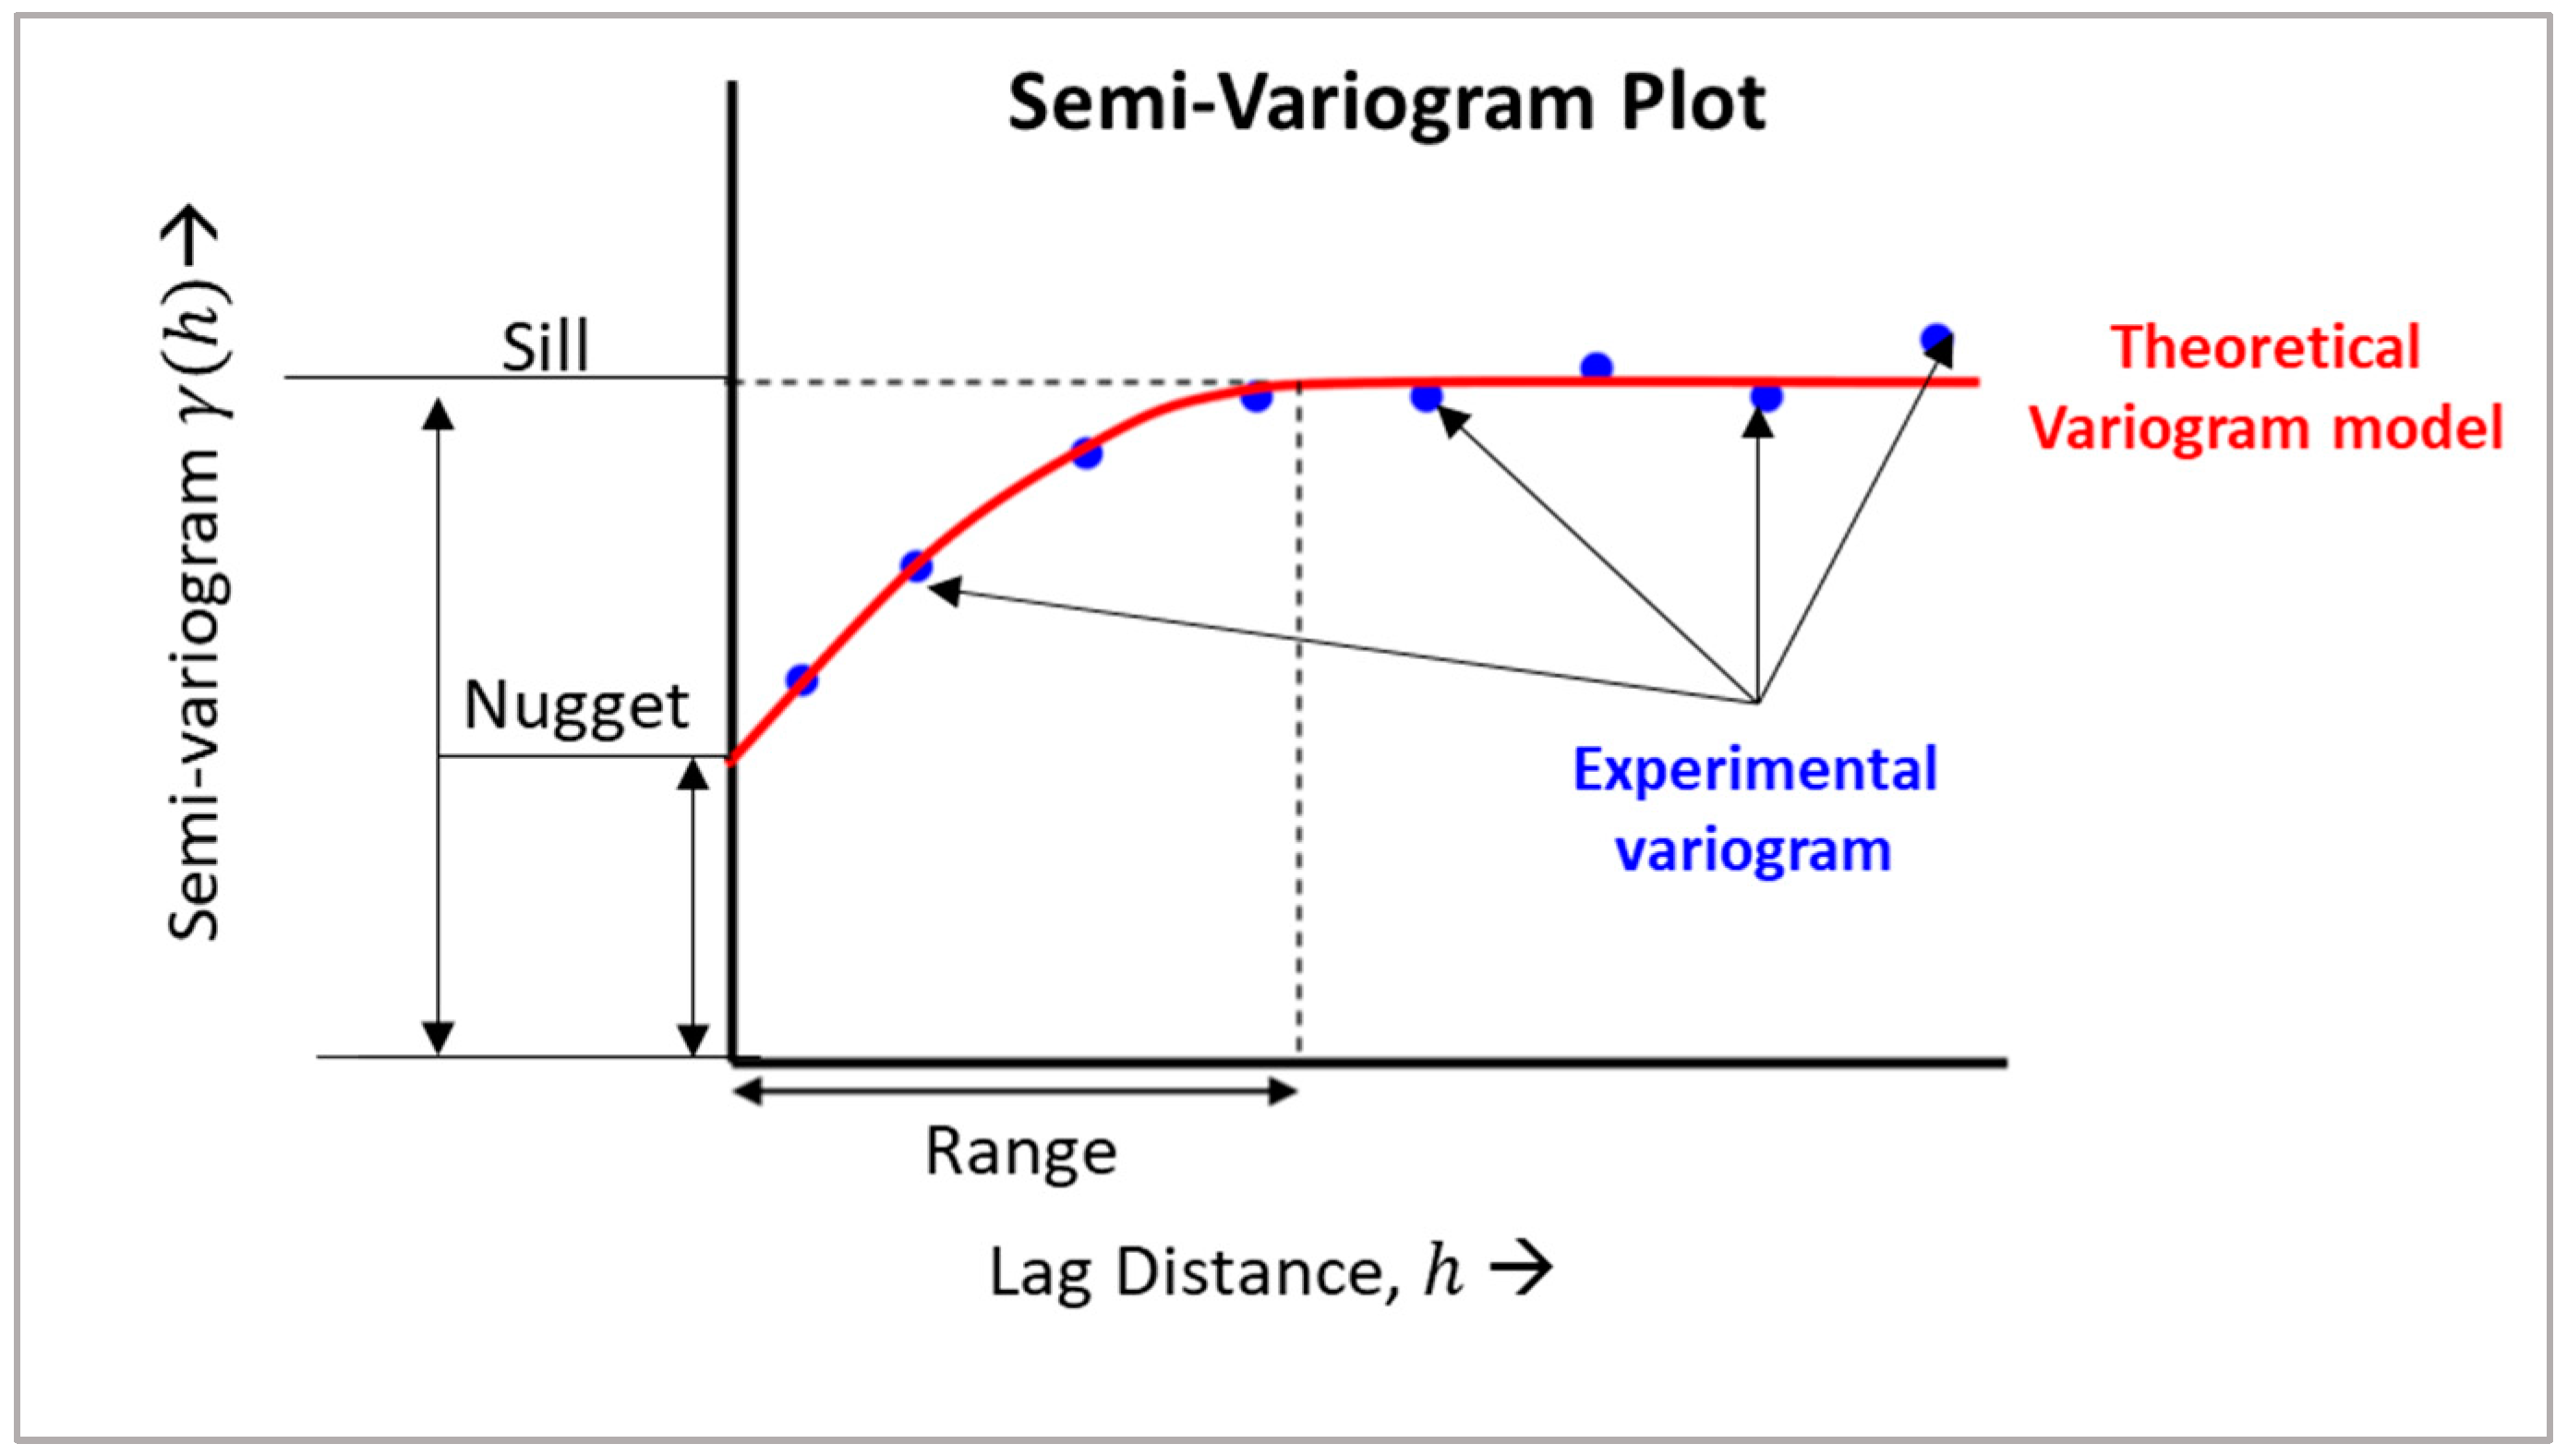
3.5. Geostatistical Ordinary Kriging Method
4. Results and Discussion
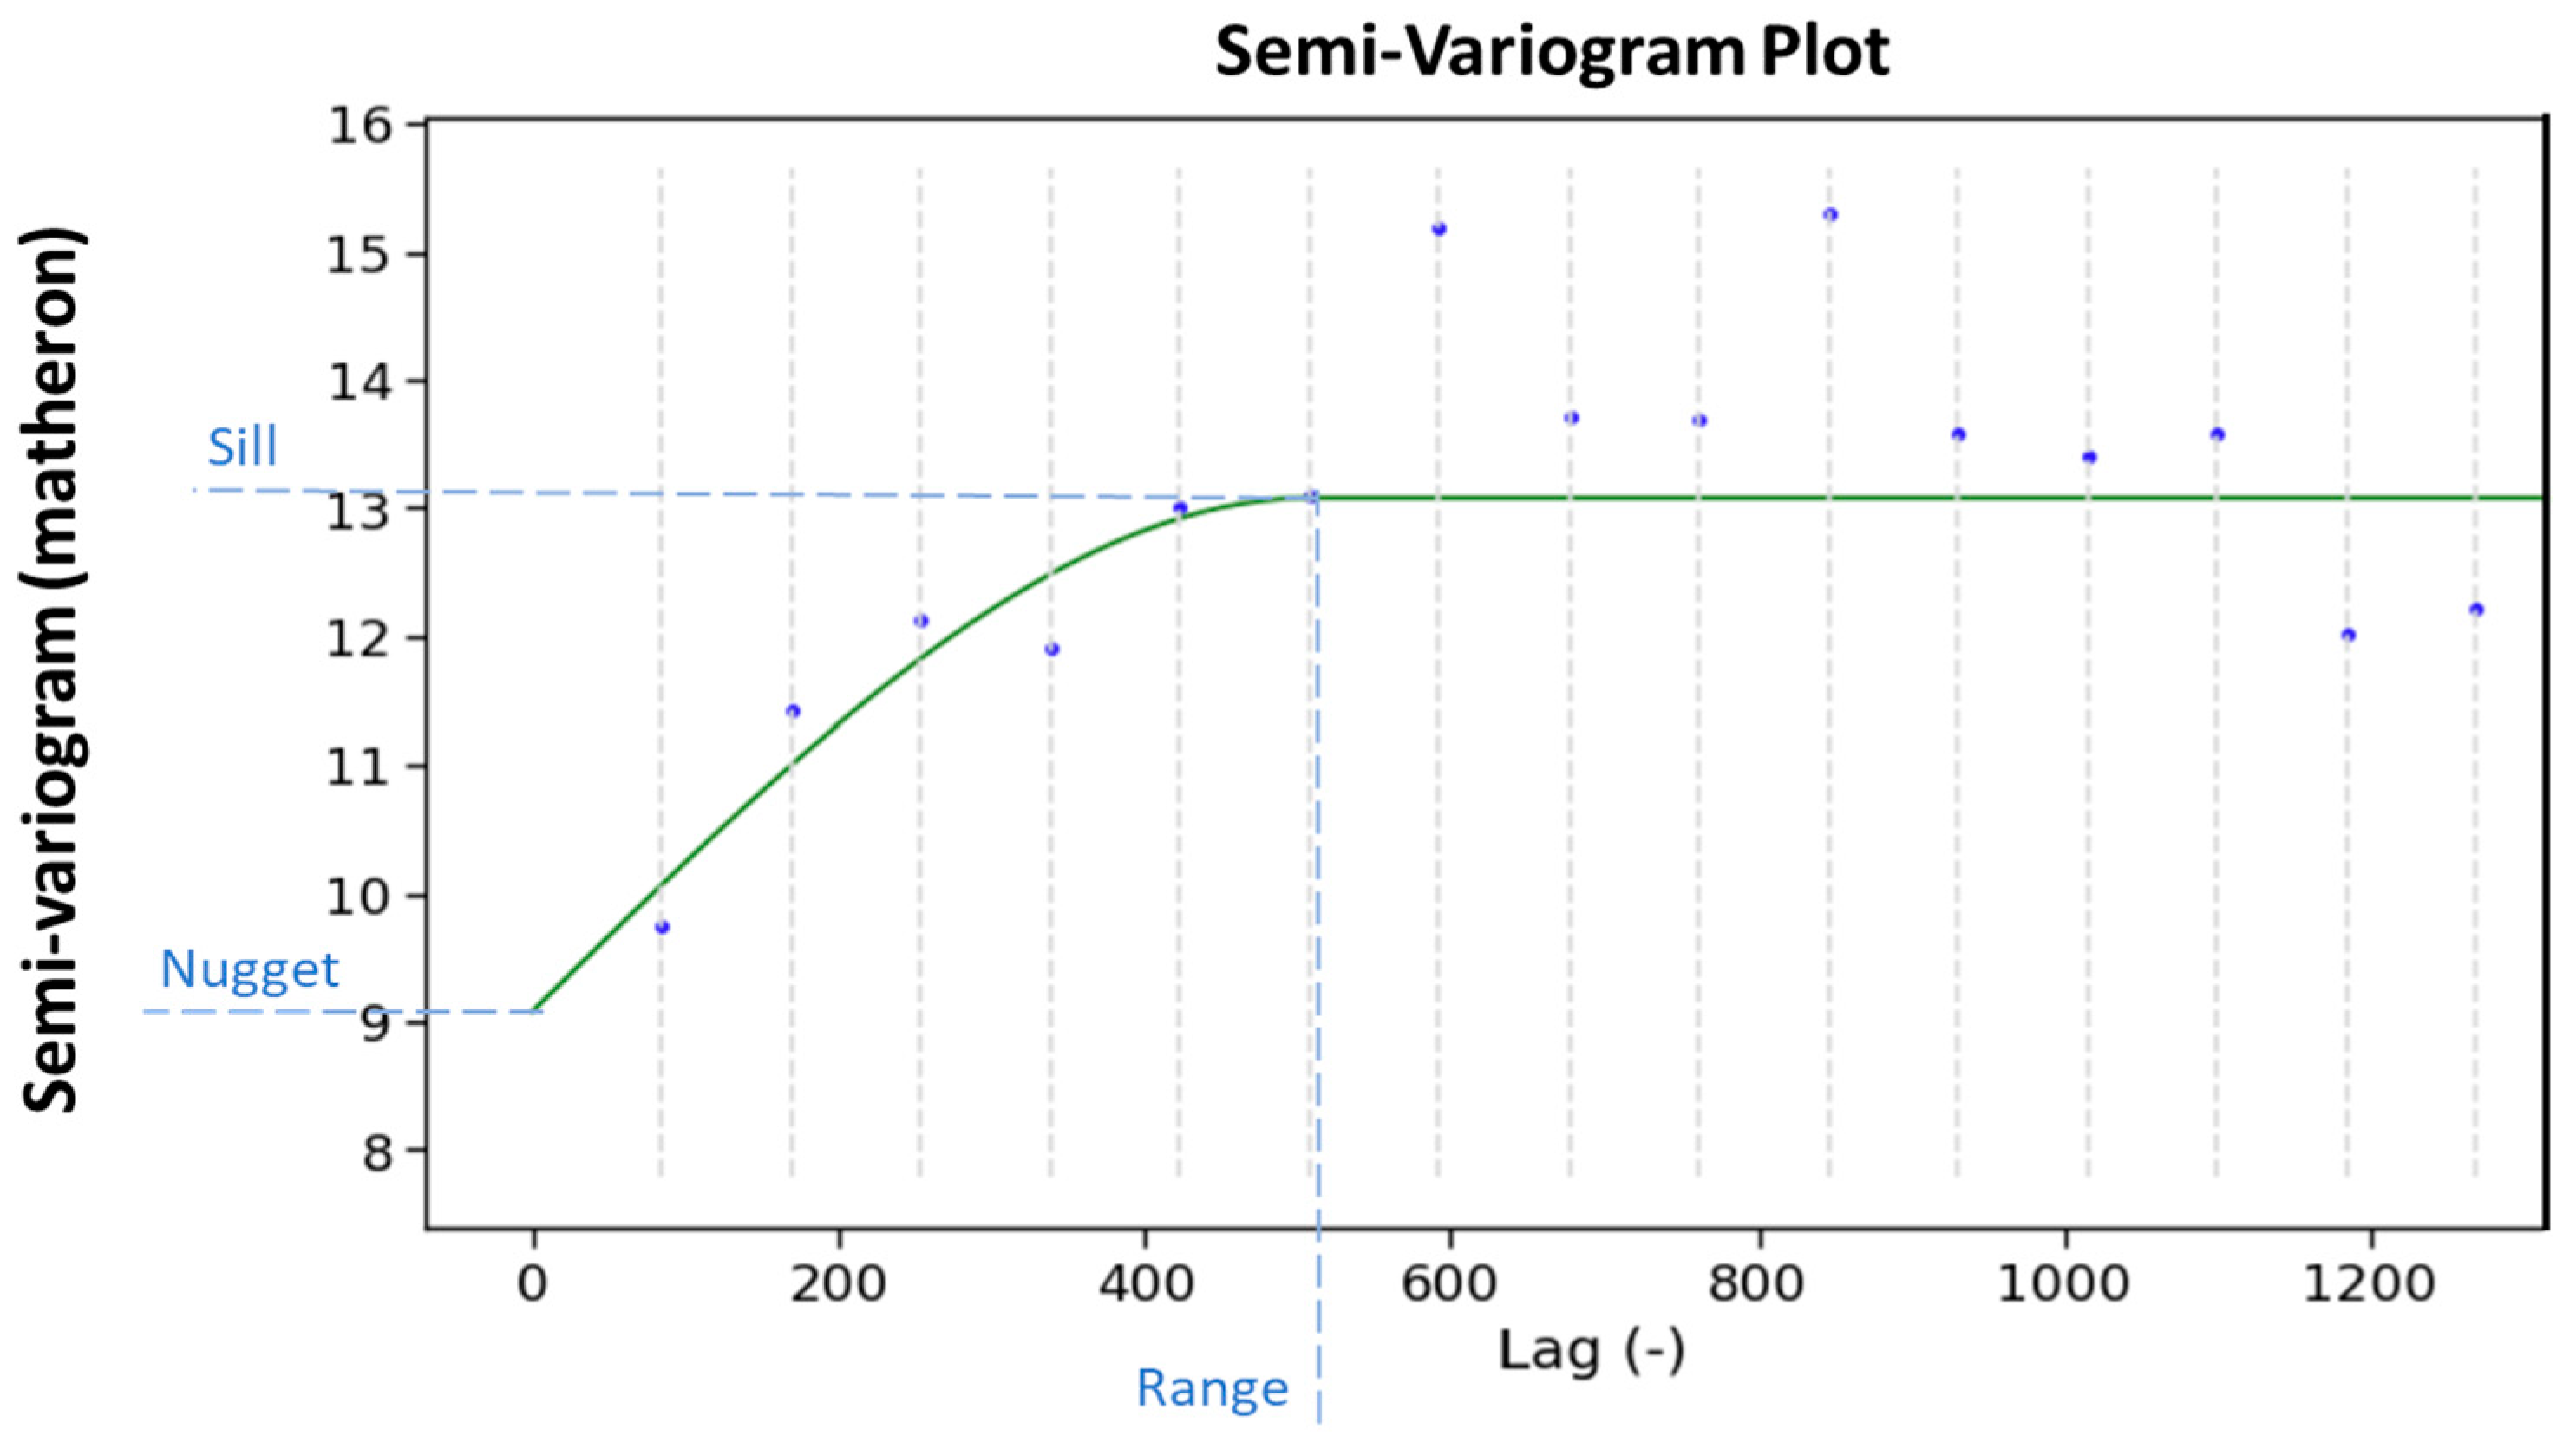
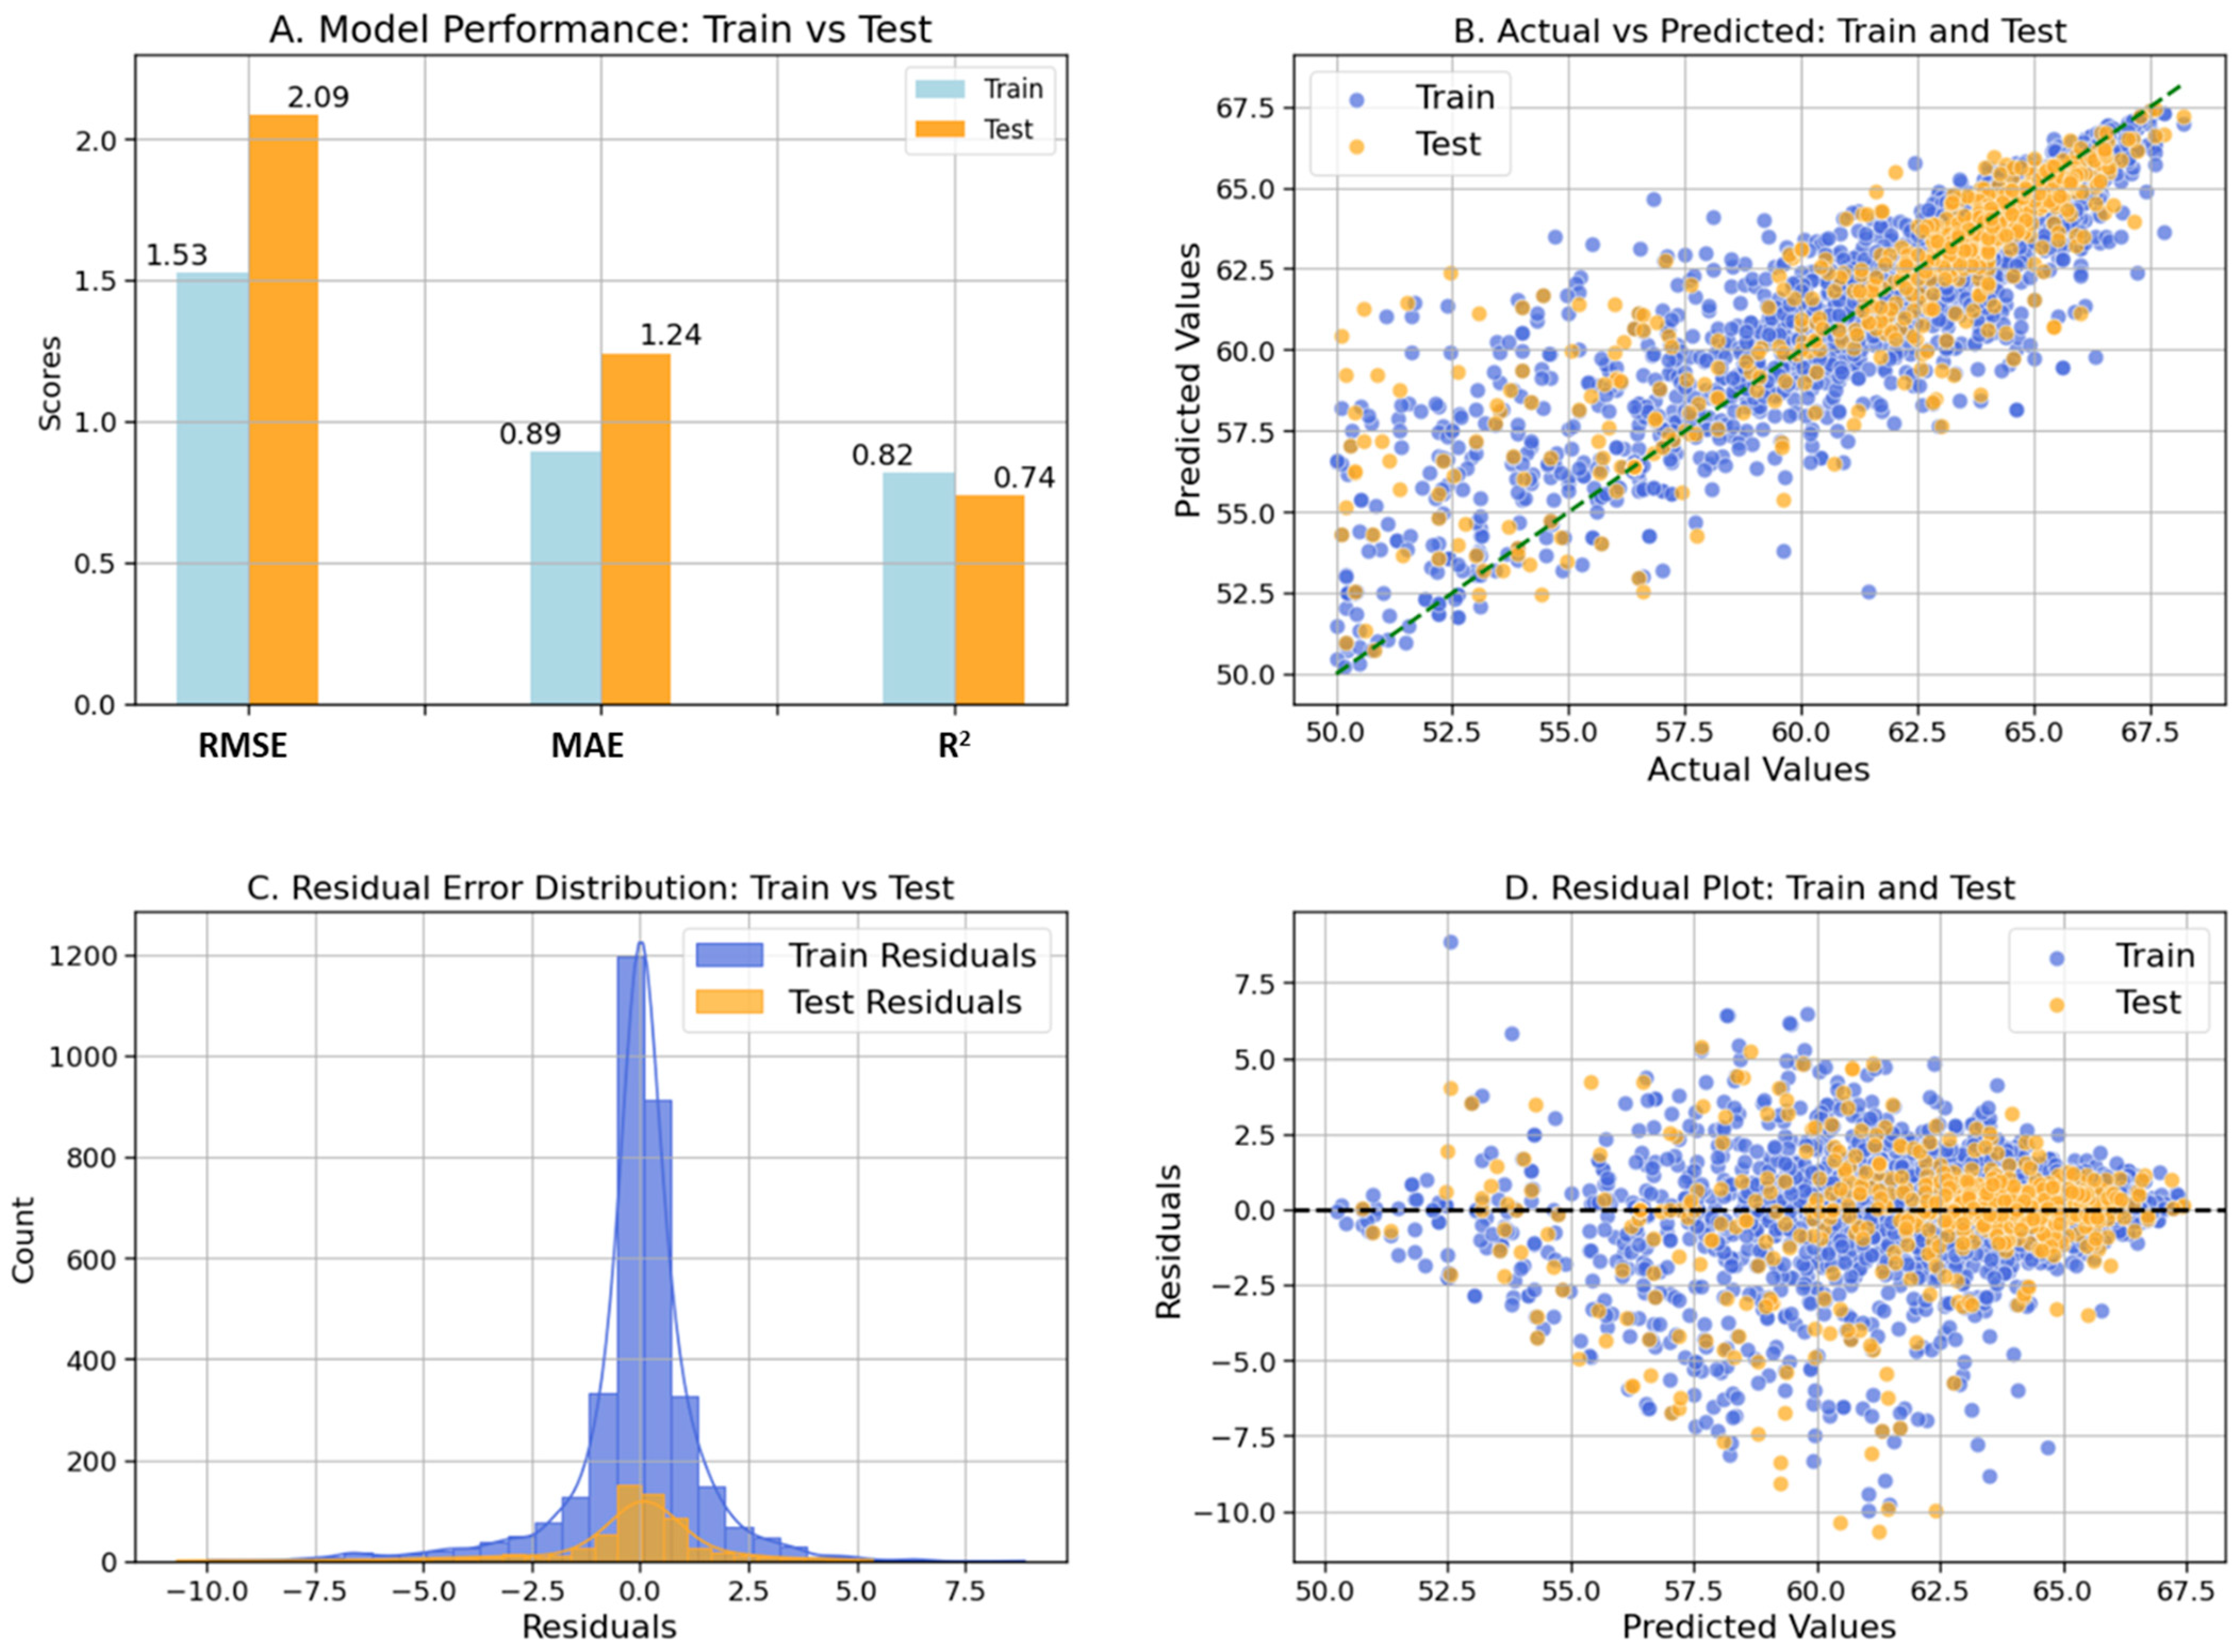
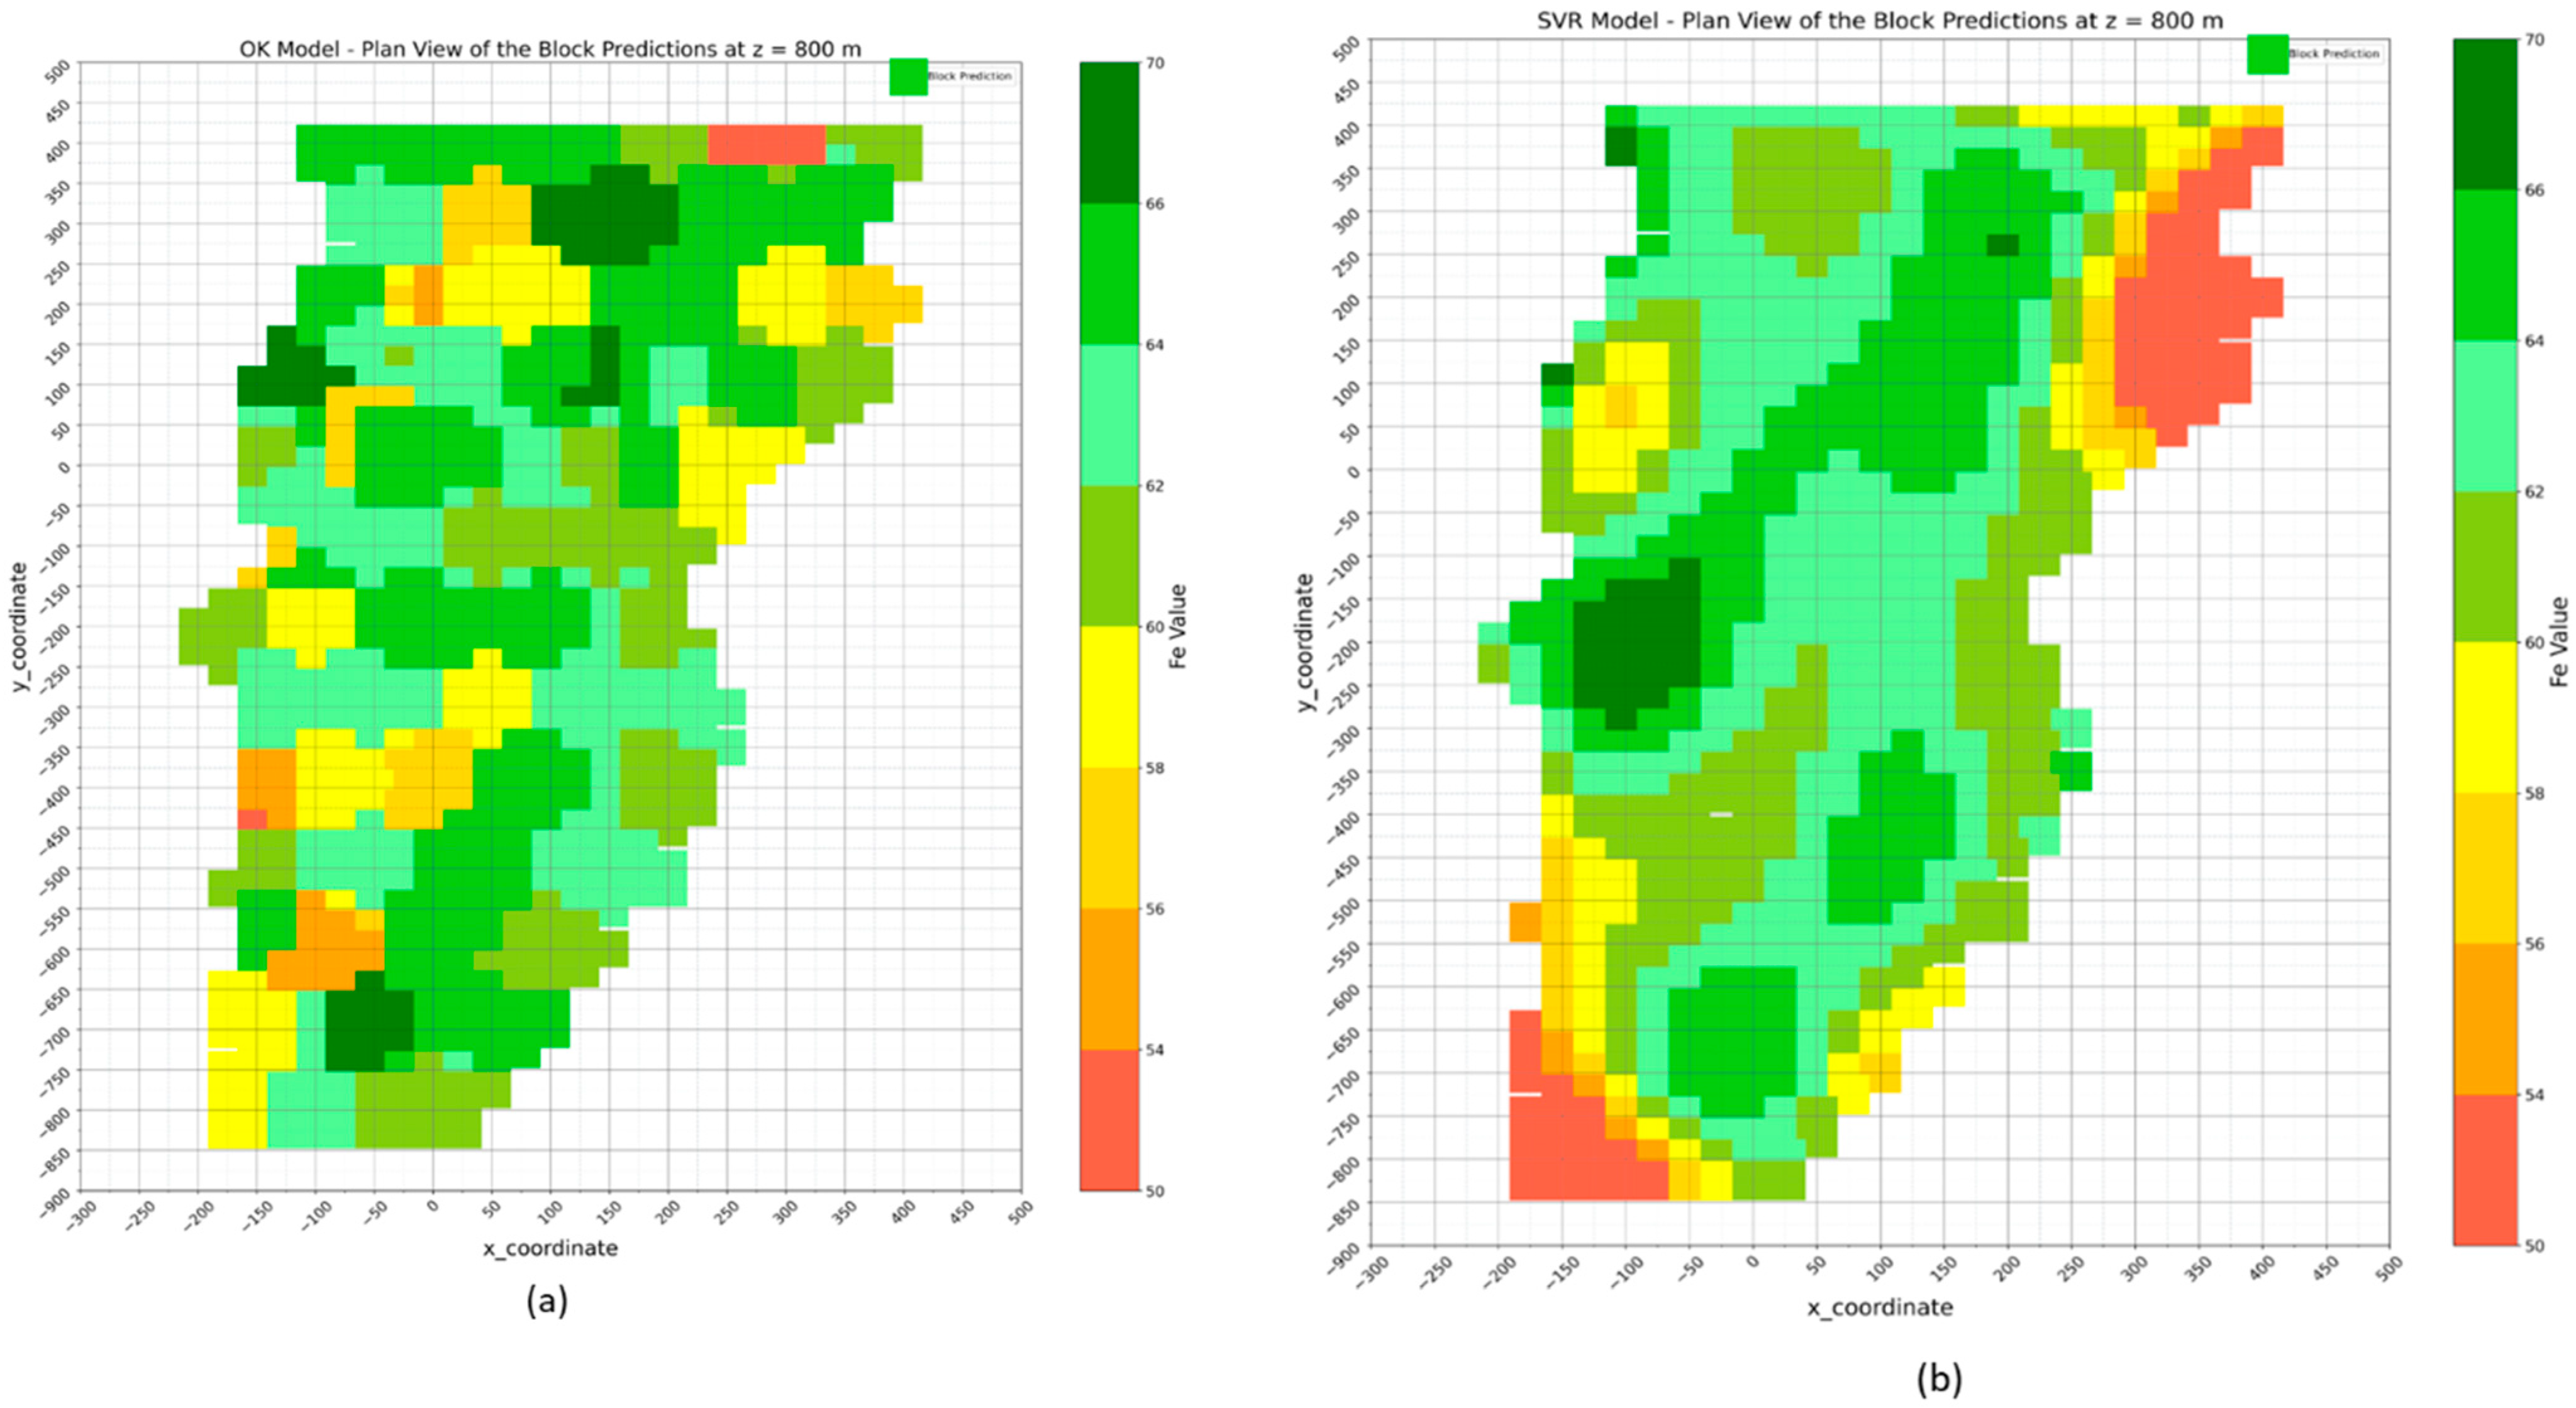
4.1. Geostatistical Ordinary Kriging Model
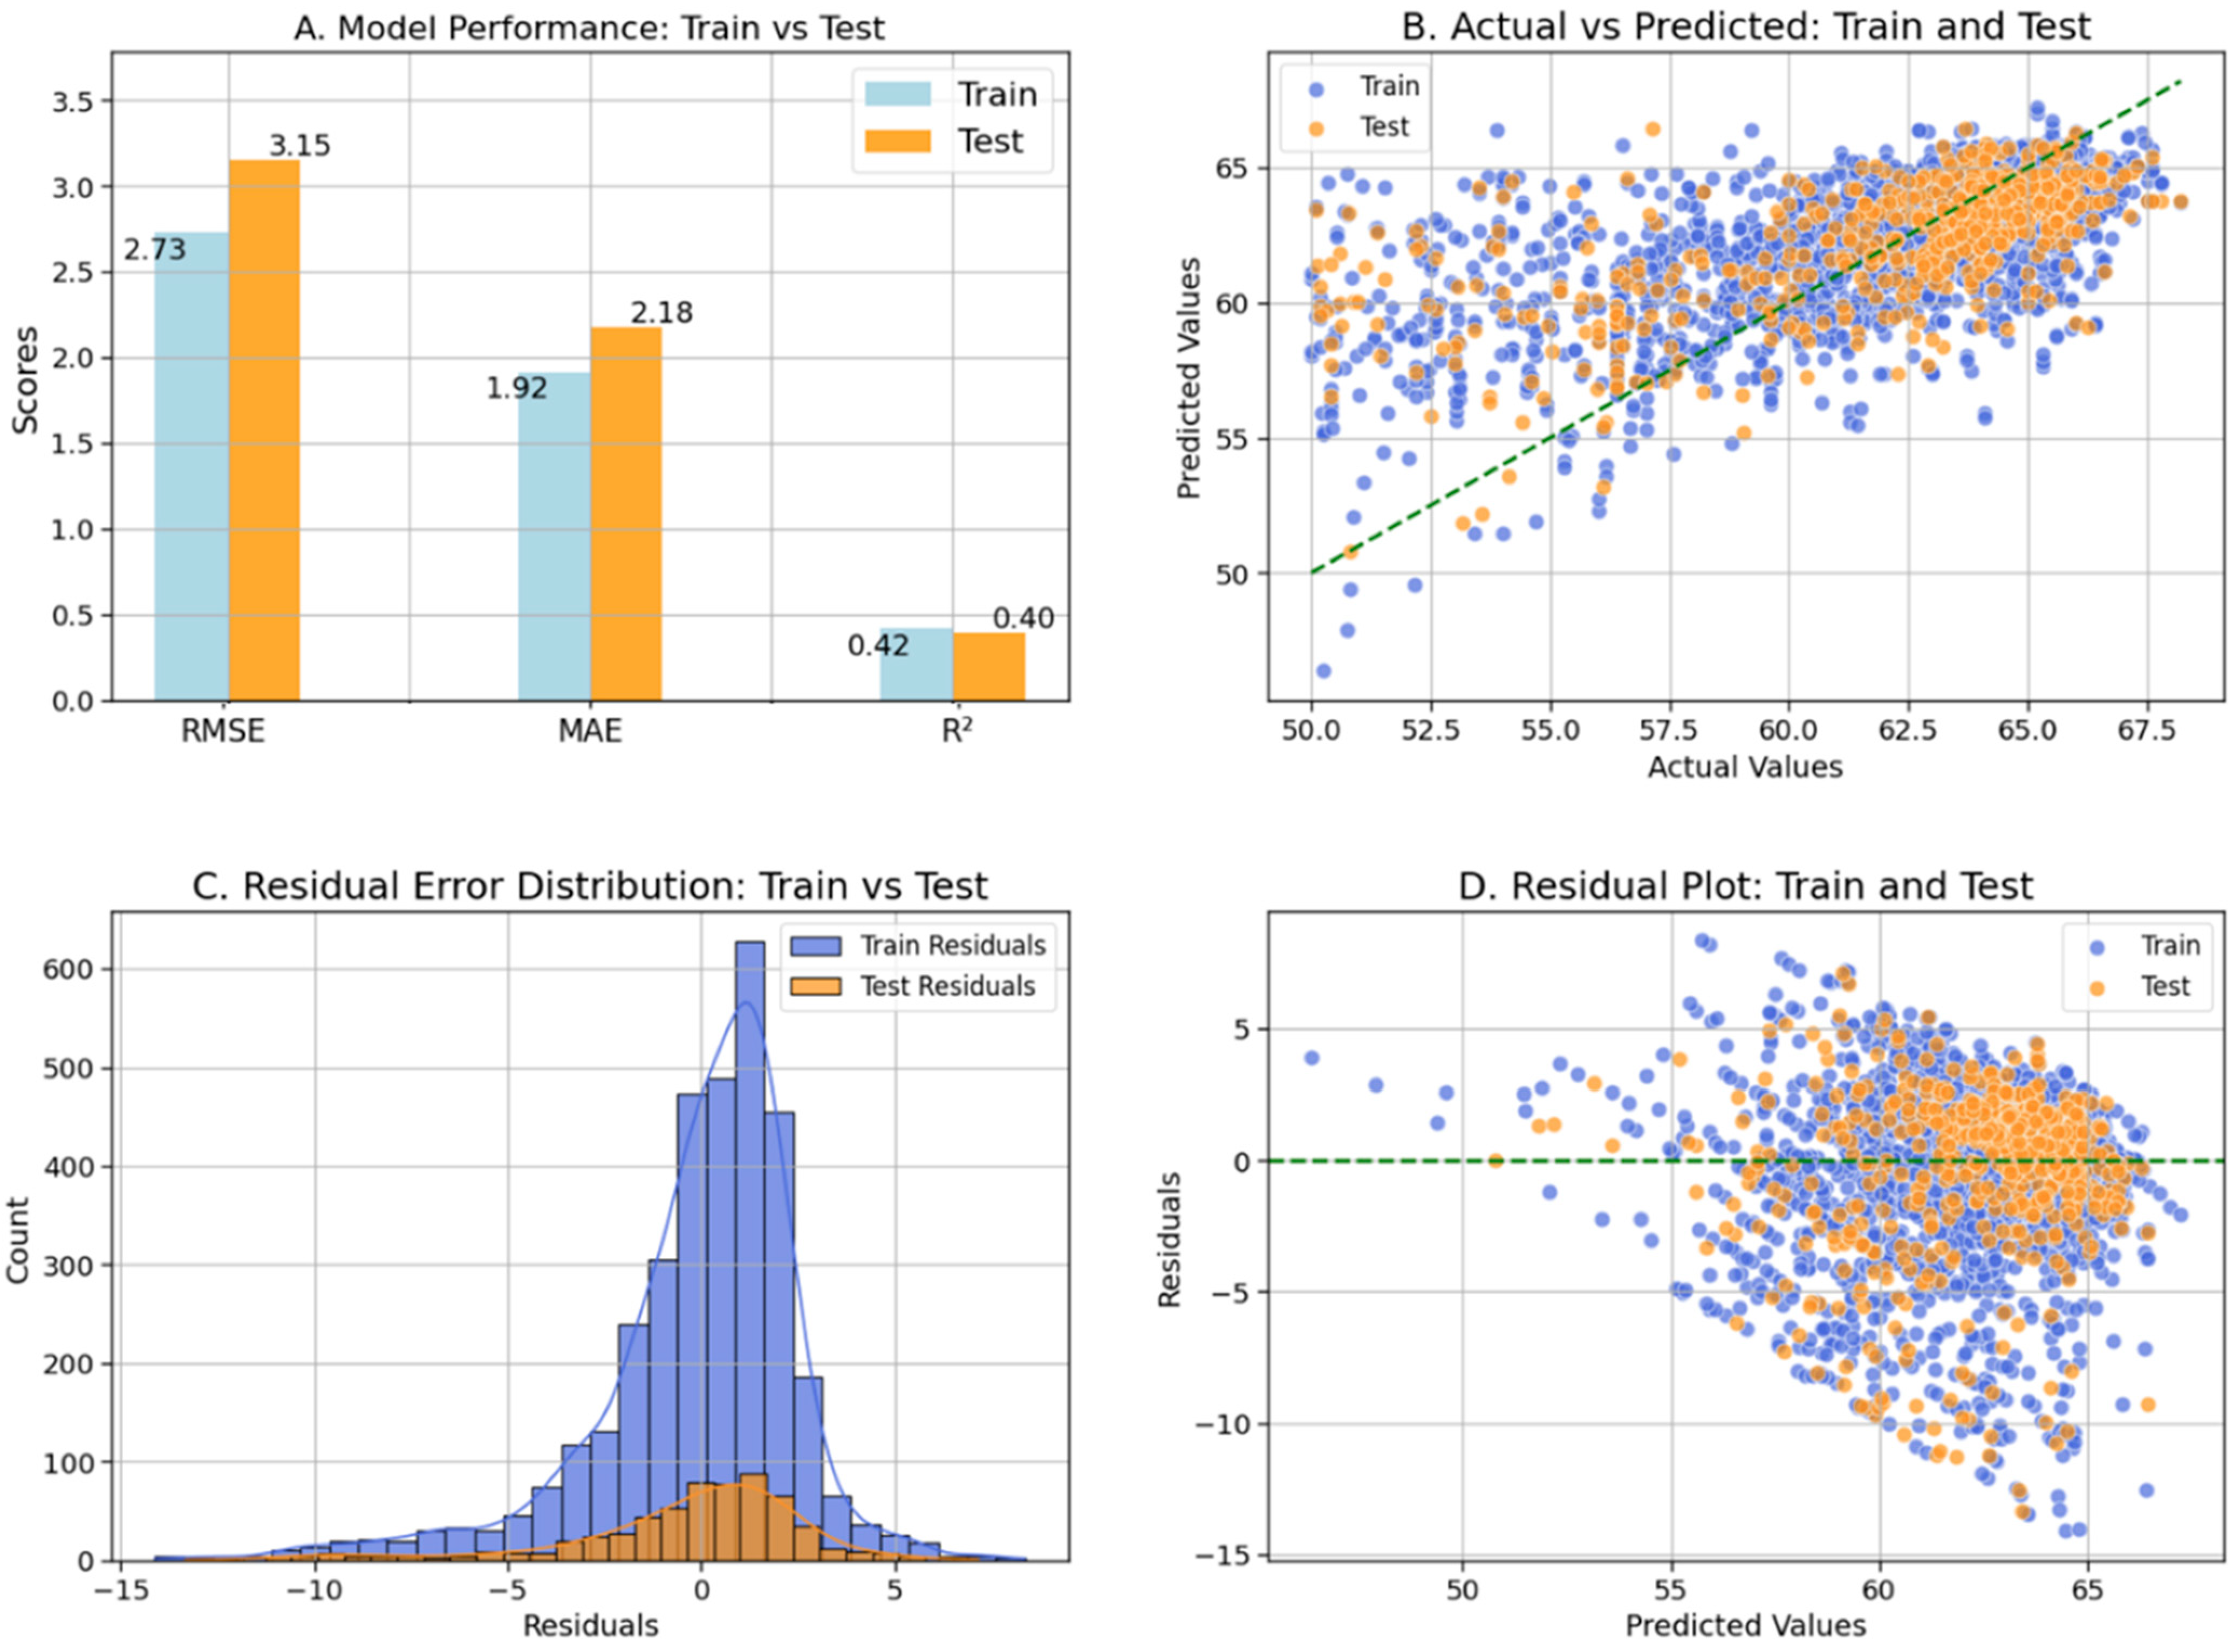
4.2. Support Vector Regression (SVR) Model
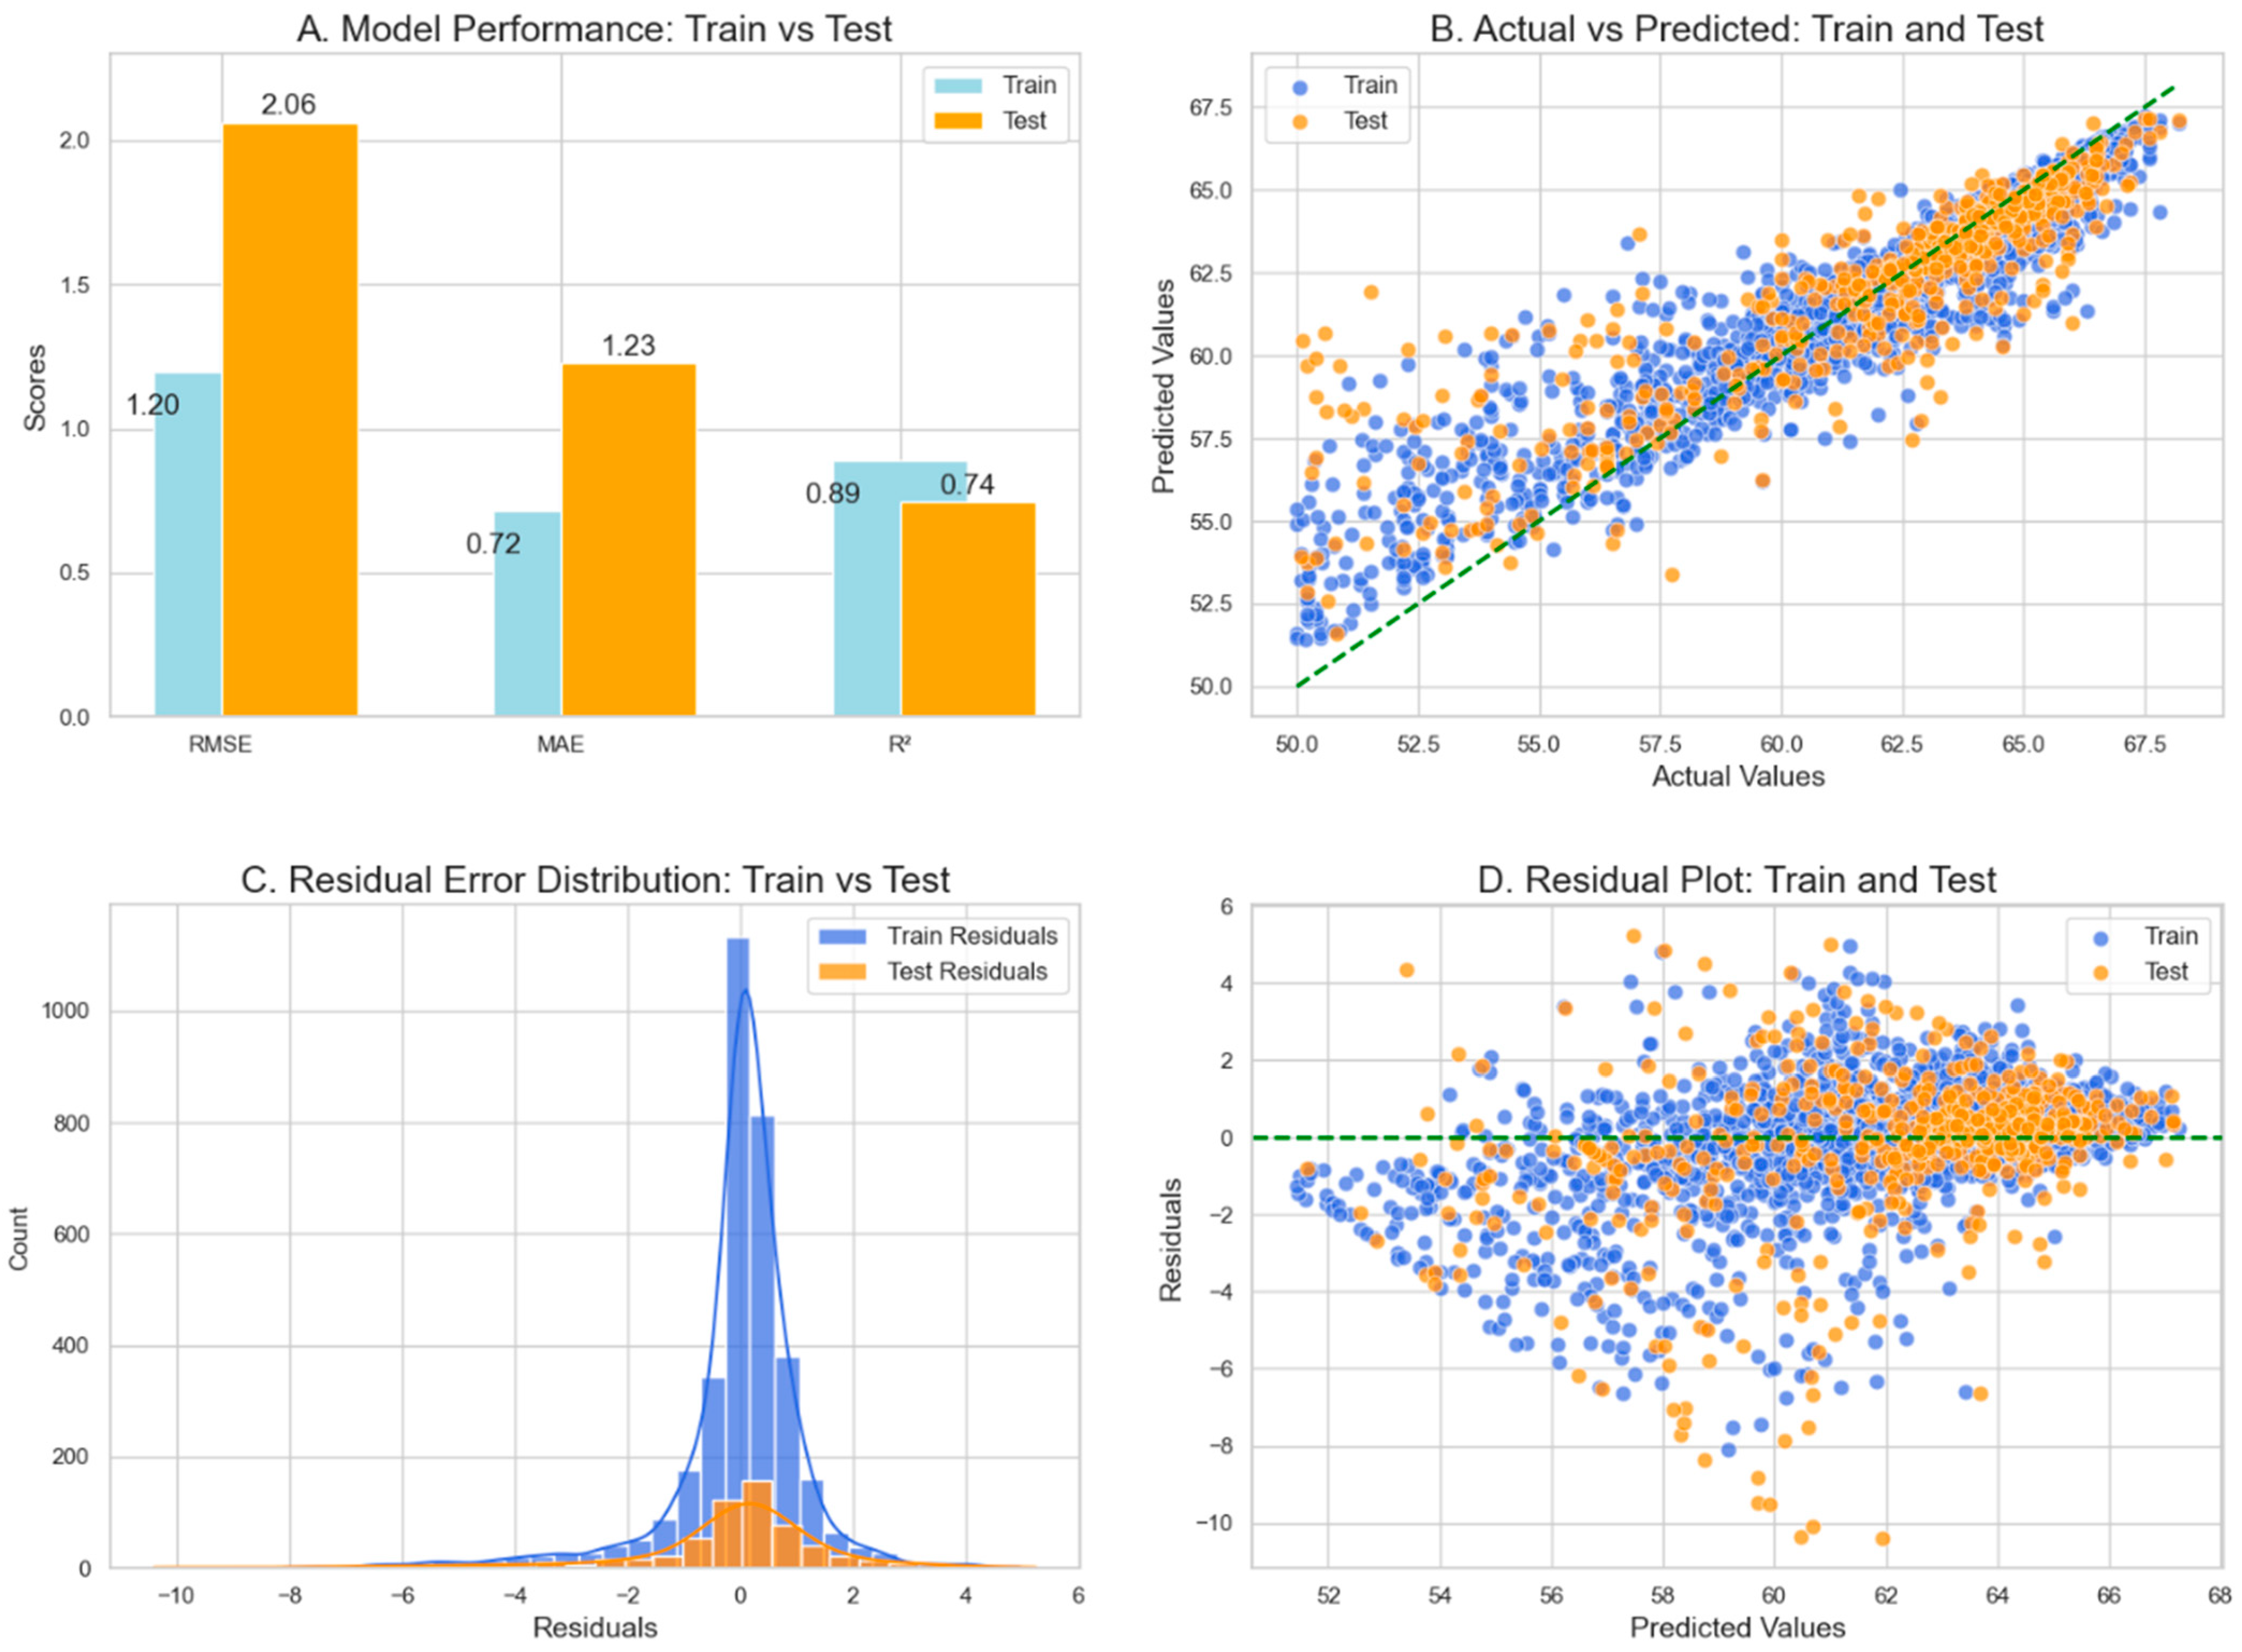
4.3. Random Forest Regressor (RFR) Model
4.4. K-Nearest Neighbour (KNN) Regression Model
4.5. XGBoost Regression Model
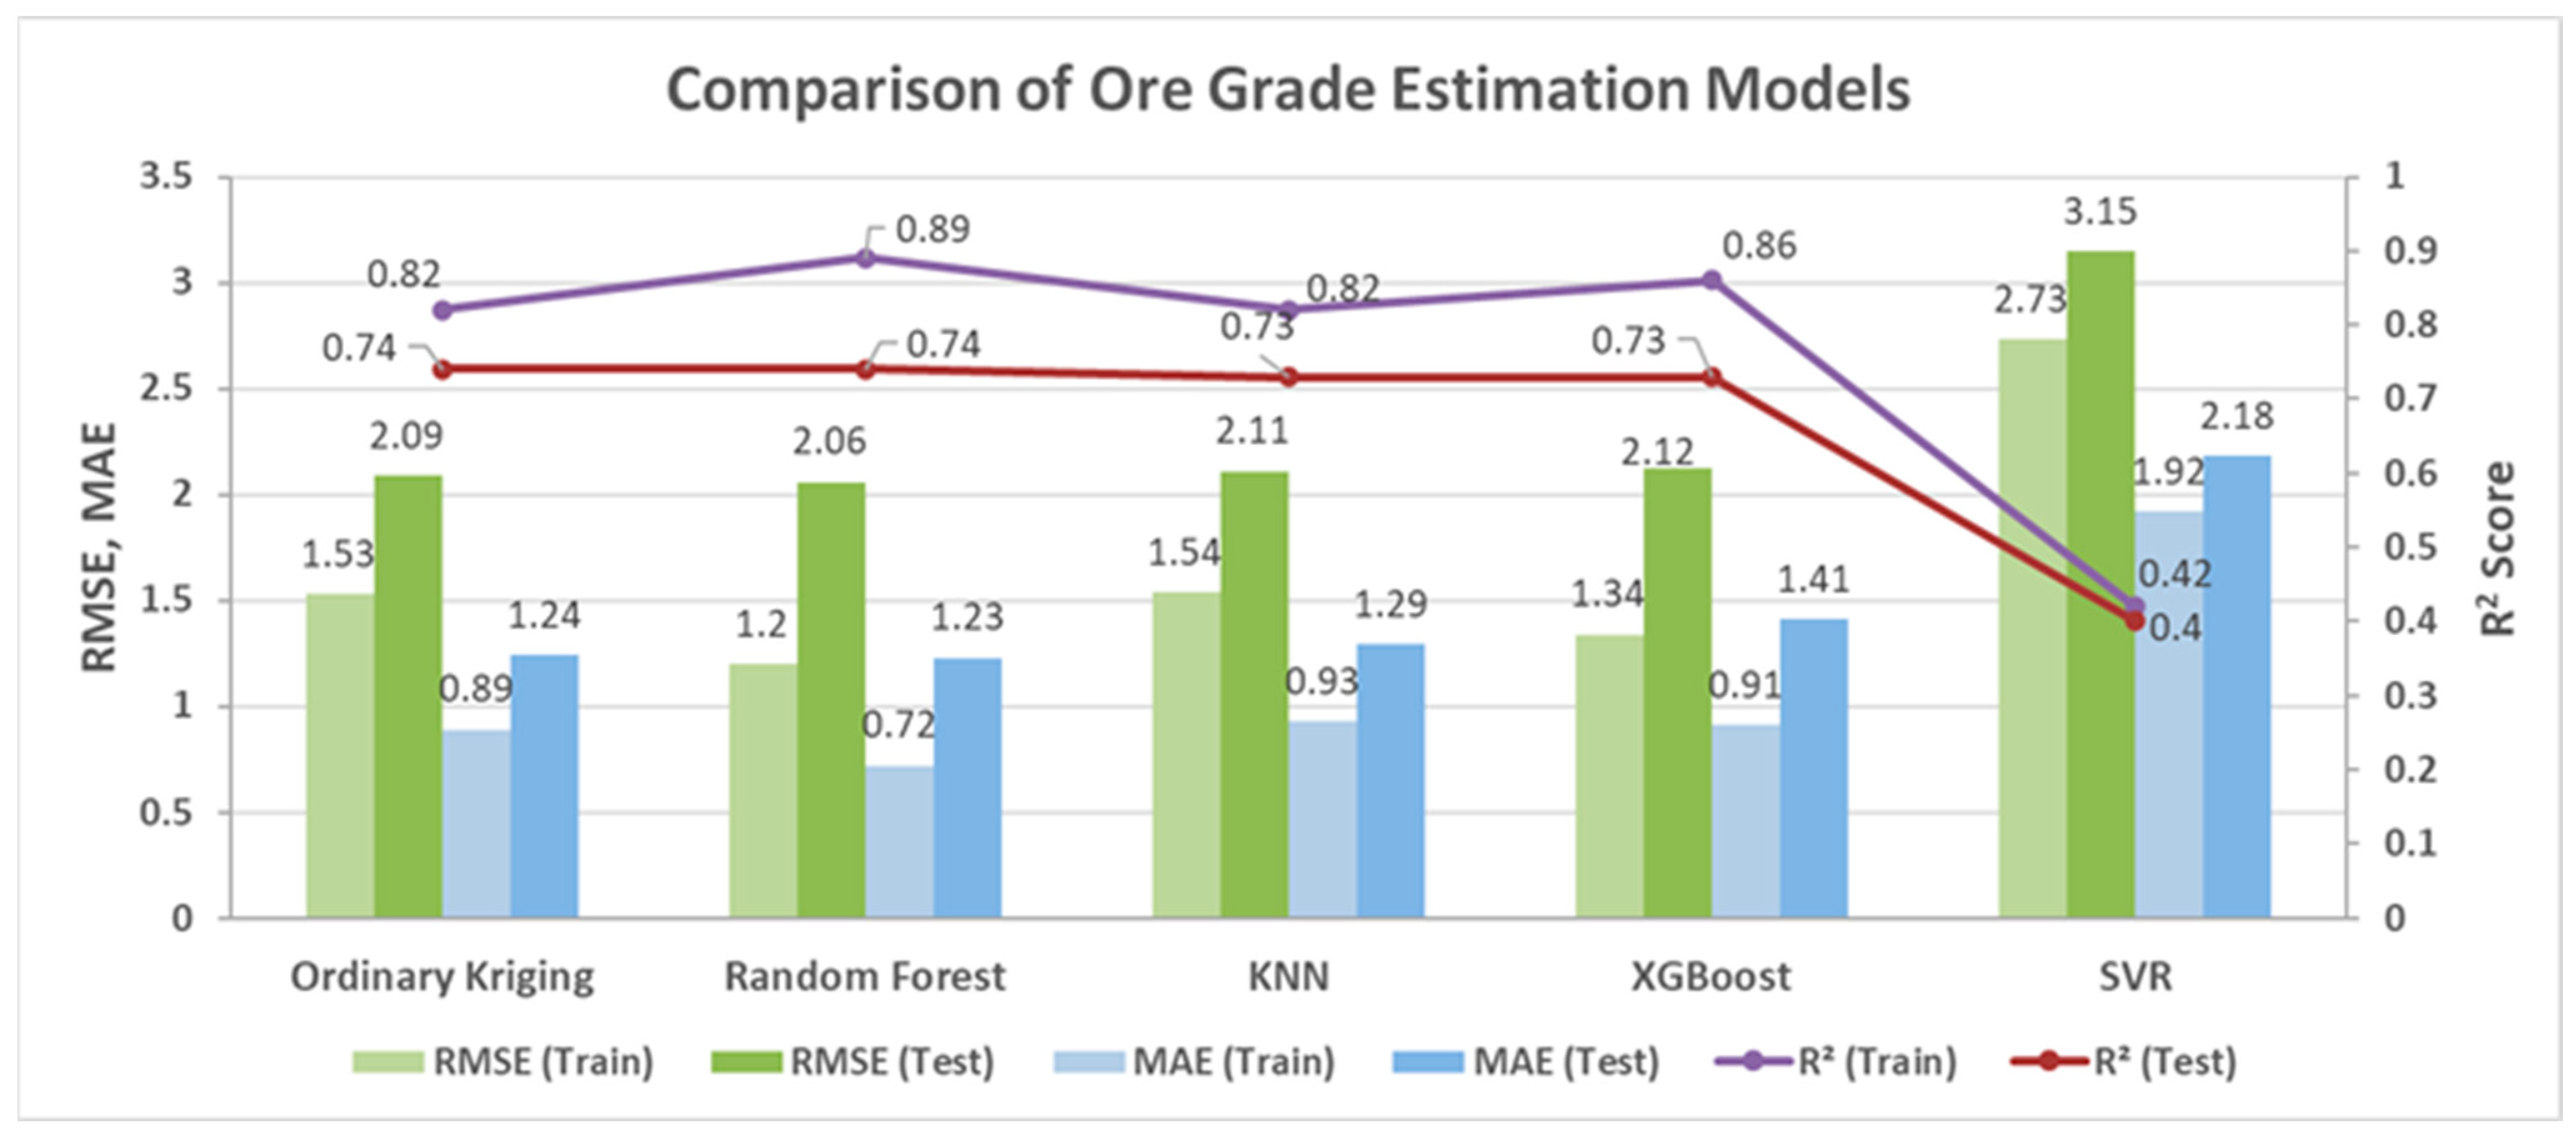
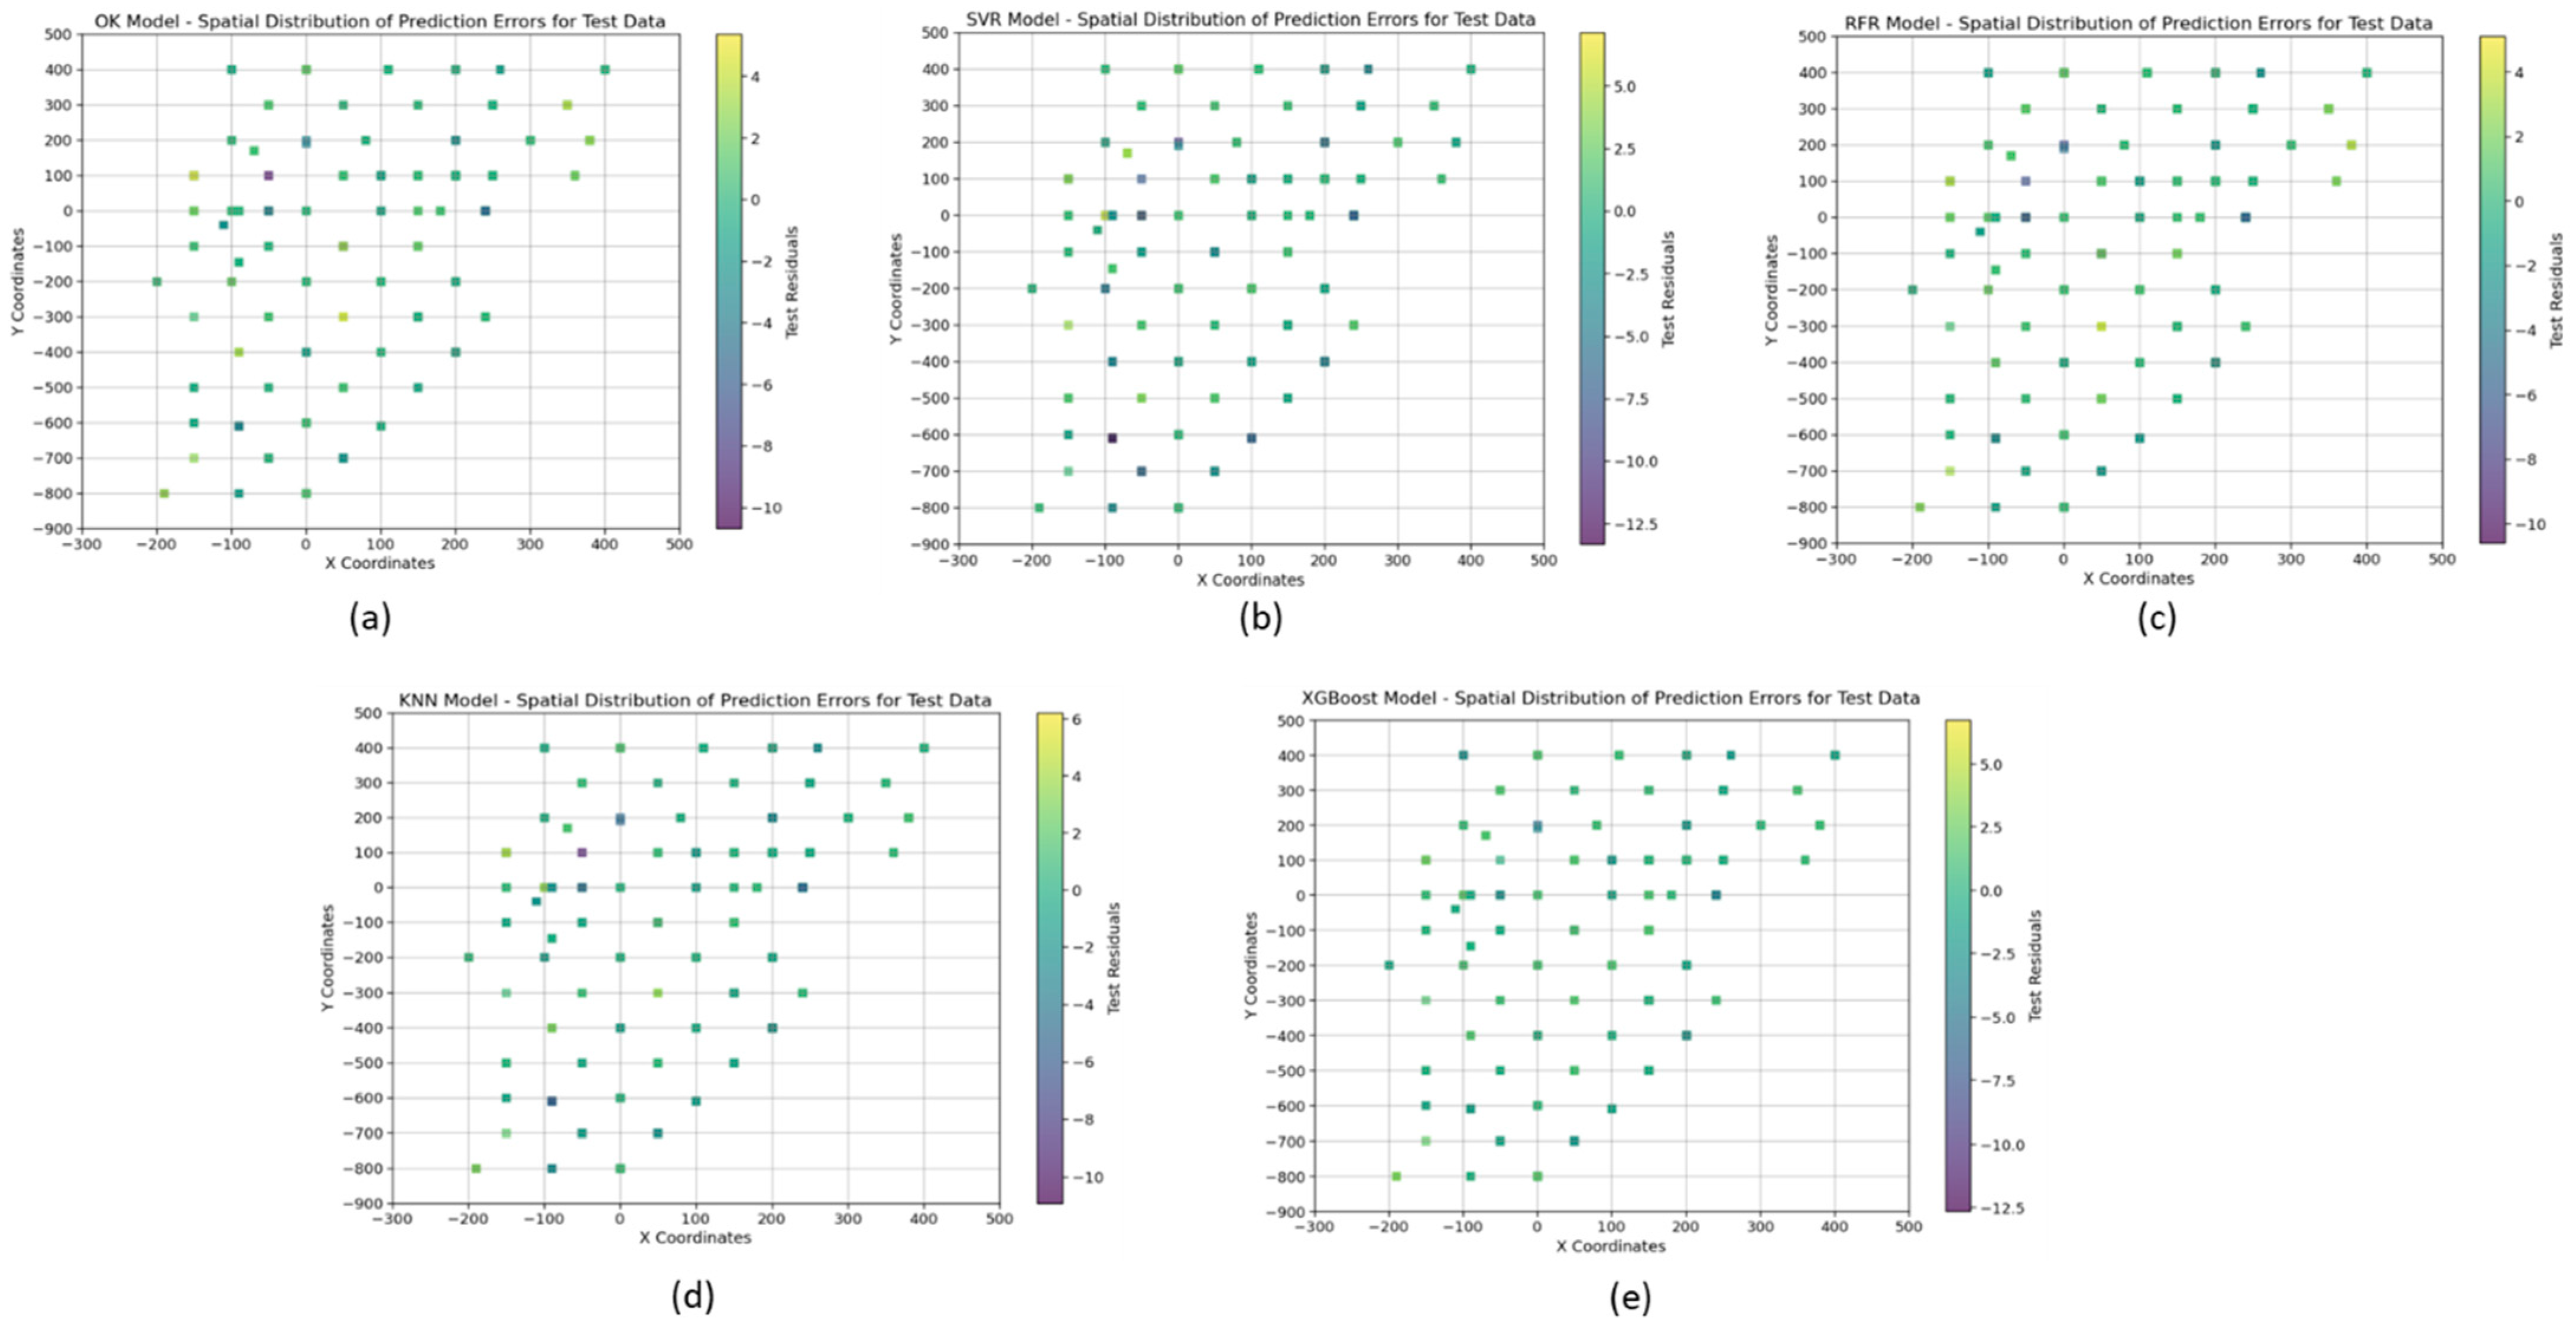
4.6. Comparison of the Ore Grade Estimation Models
5. Limitation and Future Studies
6. Conclusions
Author Contributions
Funding
Data Availability Statement
Conflicts of Interest
References
- Reichl, C.; Schatz, M.; Zsak, G. World mining data. In Minerals Production; International Organizing Committee for the World Mining Congresses: Vienna, Austria, 2014; Volume 32, pp. 1–261. [Google Scholar]
- Gupta, D.; Rao, J.V.R.; Ramamurty, V. National geophysical mapping in Geological Survey of India—An impetus to mineral exploration. Innov. Explor. Methods Miner. Oil Gas Groundw. Sustain. Dev. 2022, 455–462. [Google Scholar] [CrossRef]
- Ministry of Mines, ‘National Mineral Scenario’, Government of India. Available online: https://mines.gov.in/webportal/nationalmineralscenario (accessed on 1 October 2024).
- Abbaszadeh, M.; Ehteram, M.; Ahmed, A.N.; Singh, V.P.; Elshafie, A. The copper grade estimation of porphyry deposits using machine learning algorithms and Henry gas solubility optimization. Earth Sci. Inform. 2021, 14, 2049–2075. [Google Scholar] [CrossRef]
- Böhmer, M.; Kucera, M. Prospecting and Exploration of Mineral Deposits; Elsevier: New York, NY, USA, 2013. [Google Scholar]
- Isaaks, E.H.; Srivastava, R.M. An Introduction to Applied Geostatistics; Oxford University Press: New York, NY, USA, 1989. [Google Scholar]
- Abzalov, M. Introduction to geostatistics. In Modern Approaches in Solid Earth Sciences; Springer: Cham, Switzerland, 2016; Volume 12. [Google Scholar] [CrossRef]
- Afeni, T.; Akeju, V.; AE, A. A comparative study of geometric and geostatistical methods for qualitative reserve estimation of limestone deposit. Geosci. Front. 2020, 12, 243–253. [Google Scholar] [CrossRef]
- Zimmerman, D.; Pavlik, C.; Ruggles, A.; Armstrong, M.P. An experimental comparison of ordinary and universal kriging and inverse distance weighting. Math. Geol. 1999, 31, 375–390. [Google Scholar] [CrossRef]
- Mineralnymi, Z.K. Application of linear geostatistics to evaluation of Polish mineral deposits. Gospod. Surowcami Miner. 2006, 22, 53–65. [Google Scholar]
- Matheron, G. Principles of geostatistics. Econ. Geol. 1963, 58, 1246–1266. [Google Scholar] [CrossRef]
- Krige, D.G. A Review of the Development of Geostatistics in South Africa. In Advanced Geostatistics in the Mining Industry; Springer: Dordrecht, The Netherlands, 1976; pp. 279–293. [Google Scholar] [CrossRef]
- Matheron, G. The Theory of Regionalized Variables and Its Applications; EÌ cole National supeÌ rieure des Mines: Paris, France, 1971. [Google Scholar]
- Journel, A.G.; Huijbregts, C.J. Mining Geostatistics; Academic Press: San Diego, CA, USA, 1978. [Google Scholar]
- Goovaerts, P. Assessment of Spatial Uncertainty In Geostatistics for Natural Resources Evaluation; Oxford Academic: New York, NY, USA, 1997. [Google Scholar] [CrossRef]
- Vann, J.; Guibal, D. Beyond Ordinary Kriging—An overview of non-linear estimation. In Proceedings of the a One Day Symposium: Beyond Ordinary Kriging, Perth, Australia, 30 October 1998; p. 32. [Google Scholar]
- Sinclair, A.J.; Blackwell, G.H. Applied Mineral Inventory Estimation; Cambridge University Press: Cambridge, UK, 2002. [Google Scholar] [CrossRef]
- Matheron, G. A Simple Substitute for Conditional Expectation: The Disjunctive Kriging. In Advanced Geostatistics in the Mining Industry; Springer: Dordrecht, The Netherlands, 1976; pp. 221–236. [Google Scholar] [CrossRef]
- Suro-Pérez, V.; Journel, A.G. Indicator principal component kriging. Math. Geol. 1991, 23, 759–788. [Google Scholar] [CrossRef]
- Verly, G.; Sullivan, J. Multigaussian and probability krigings—Application to the Jerritt Canyon deposit. Min. Eng. 1985, 37, 568–874. [Google Scholar]
- Bertolini, M.; Mezzogori, D.; Neroni, M.; Zammori, F. Machine Learning for industrial applications: A comprehensive literature review. Expert Syst. Appl. 2021, 175, 114820. [Google Scholar] [CrossRef]
- Jung, D.; Choi, Y. Systematic Review of Machine Learning Applications in Mining: Exploration, Exploitation, and Reclamation. Minerals 2021, 11, 148. [Google Scholar] [CrossRef]
- Flores, V.; Henriquez, N.; Ortiz, E.; Martinez, R.; Leiva, C. Random forest for generating recommendations for predicting copper recovery by flotation. IEEE Lat. Am. Trans. 2024, 22, 443–450. [Google Scholar] [CrossRef]
- Josso, P.; Hall, A.; Williams, C.; Le Bas, T.; Lusty, P.; Murton, B. Application of random-forest machine learning algorithm for mineral predictive mapping of Fe-Mn crusts in the World Ocean. Ore Geology Rev. 2023, 162, 105671. [Google Scholar] [CrossRef]
- Bishop, B.A.; Robbins, L.J. Using machine learning to identify indicators of rare earth element enrichment in sedimentary strata with applications for metal prospectivity. J. Geochem. Explor. 2024, 258, 107388. [Google Scholar] [CrossRef]
- Gebretsadik, A.; Kumar, R.; Fissha, Y.; Kide, Y.; Okada, N.; Ikeda, H.; Mishra, A.K.; Armaghani, D.J.; Ohtomo, Y.; Kawamura, Y. Enhancing rock fragmentation assessment in mine blasting through machine learning algorithms: A practical approach. Discov. Appl. Sci. 2024, 6, 223. [Google Scholar] [CrossRef]
- Samanta, B.; Bandopadhyay, S.; Ganguli, R. Data Segmentation and Genetic Algorithms for Sparse Data Division in Nome Placer Gold Grade Estimation Using Neural Network and Geostatistics. Explor. Min. Geol. 2002, 11, 69–76. [Google Scholar] [CrossRef]
- Chatterjee, S.; Bandopadhyay, S.; Machuca, D. Ore grade prediction using a genetic algorithm and clustering Based ensemble neural network model. Math. Geosci. 2010, 42, 309–326. [Google Scholar] [CrossRef]
- Goswami, A.D.; Mishra, M.K.; Patra, D. Evaluation of machine learning algorithms for grade estimation using GRNN & SVR. Eng. Res. Express 2022, 4, 035037. [Google Scholar] [CrossRef]
- Jafrasteh, B.; Fathianpour, N.; Suárez, A. Comparison of machine learning methods for copper ore grade estimation. Comput. Geosci. 2018, 22, 1371–1388. [Google Scholar] [CrossRef]
- Erten, G.E.; Yavuz, M.; Deutsch, C.V. Grade estimation by a machine learning model using coordinate rotations. Appl. Earth Sci. 2021, 130, 57–66. [Google Scholar] [CrossRef]
- Erten, G.E.; Erten, O.; Karacan, C.Ö.; Boisvert, J.; Deutsch, C.V. Merging machine learning and geostatistical approaches for spatial modeling of geoenergy resources. Int. J. Coal Geol. 2023, 276, 104328. [Google Scholar] [CrossRef]
- Kaplan, U.E.; Topal, E. A New Ore Grade Estimation Using Combine Machine Learning Algorithms. Minerals 2020, 10, 847. [Google Scholar] [CrossRef]
- Tsae, N.B.; Adachi, T.; Kawamura, Y. Application of Artificial Neural Network for the Prediction of Copper Ore Grade. Minerals 2023, 13, 658. [Google Scholar] [CrossRef]
- Atalay, F. Estimation of Fe Grade at an Ore Deposit Using Extreme Gradient Boosting Trees (XGBoost). Min Met. Explor 2024, 41, 2119–2128. [Google Scholar] [CrossRef]
- Bi, Z.; Fu, C.; Zhu, J.; Du, Y. Control Ore Processing Quality Based on Xgboost Machine Learning Algorithm. In Proceedings of the 2023 Asia-Europe Conference on Electronics, Data Processing and Informatics, ACEDPI, Prague, Czech Republic, 17–19 April 2023; pp. 177–180. [Google Scholar] [CrossRef]
- Singh, R.K.; Sarkar, B.C.; Ray, D. Geostatistical Modelling of a High-grade Iron Ore Deposit. J. Geol. Soc. India 2021, 97, 1005–1012. [Google Scholar] [CrossRef]
- Krishnamurthy, K.V. Reserves and Resources of Iron Ores of India—A Perspective. J. Geol. Soc. India 2022, 98, 647–653. [Google Scholar] [CrossRef]
- Devananda, B.; Behera, R. Iron ore localisation and its controlling factors in the eastern limb of Bonai Keonjhar belt, Odisha, India. Int. Res. J. Earth Sci. 2018, 6, 9–15. [Google Scholar]
- Indian Bureau of Mines, Nagpur. Gazette Notification for Threshold Value of Minerals, REGD. NO. D. L.-33004/99; Controller of Publications: New Delhi, India, 2018. [Google Scholar]
- Cabello-Solorzano, K.; de Araujo, I.O.; Peña, M.; Correia, L.; Tallón-Ballesteros, A.J. The Impact of Data Normalization on the Accuracy of Machine Learning Algorithms: A Comparative Analysis. In Lecture Notes in Networks and Systems; Springer: Cham, Switzerland, 2023; Volume 750, pp. 344–353. [Google Scholar] [CrossRef]
- Singh, D.; Singh, B. Investigating the impact of data normalization on classification performance. Appl. Soft Comput. 2020, 97, 105524. [Google Scholar] [CrossRef]
- Joseph, V.R. Optimal Ratio for Data Splitting. Stat. Anal. Data Min. 2022, 15, 531–538. [Google Scholar] [CrossRef]
- Cortes, C.; Vapnik, V.; Saitta, L. Support-vector networks. Mach. Learn. 1995, 20, 273–297. [Google Scholar] [CrossRef]
- Awad, M.; Khanna, R. Support Vector Regression. Effic. Learn. Mach. 2015, 67–80. [Google Scholar] [CrossRef]
- Tsirikoglou, P.; Abraham, S.; Contino, F.; Lacor, C.; Ghorbaniasl, G. A hyperparameters selection technique for support vector regression models. Appl. Soft Comput. 2017, 61, 139–148. [Google Scholar] [CrossRef]
- Nourali, H.; Osanloo, M. Mining capital cost estimation using Support Vector Regression (SVR). Resour. Policy 2019, 62, 527–540. [Google Scholar] [CrossRef]
- Loh, W.Y. Classification and regression trees. WIREs Data Min. Knowl Discov. 2011, 1, 14–23. [Google Scholar] [CrossRef]
- Breiman, L.; Friedman, J.H.; Olshen, R.A.; Stone, C.J. Classification and Regression Trees; CRC Press: New York, NY, USA, 2017. [Google Scholar] [CrossRef]
- Breiman, L. Random forests. Mach. Learn. 2001, 45, 5–32. [Google Scholar] [CrossRef]
- Zhang, H.; Zhou, J.; Armaghani, D.J.; Tahir, M.M.; Pham, B.T.; Van Huynh, V. A combination of feature selection and random forest techniques to solve a problem related to blast-induced ground vibration. Appl. Sci. 2020, 10, 869. [Google Scholar] [CrossRef]
- Breiman, L.; Friedman, J.H.; Olshen, R.A.; Stone, C.J. Classification and Regression Trees. Biometrics 1984, 40, 874. [Google Scholar] [CrossRef]
- Rai, S.S.; Murthy, V.M.S.R.; Kumar, R.; Maniteja, M.; Singh, A.K. Using machine learning algorithms to predict cast blasting performance in surface mining. Min. Technol. 2022, 131, 191–209. [Google Scholar] [CrossRef]
- Dietterich, T.G. Experimental comparison of three methods for constructing ensembles of decision trees: Bagging, boosting, and randomization. Mach. Learn. 2000, 40, 139–157. [Google Scholar] [CrossRef]
- Hengl, T.; Nussbaum, M.; Wright, M.N.; Heuvelink, G.B.M.; Gräler, B. Random forest as a generic framework for predictive modeling of spatial and spatio-temporal variables. PeerJ 2018, 6, e5518. [Google Scholar] [CrossRef]
- Altman, N.S. An introduction to kernel and nearest-neighbor nonparametric regression. Am. Stat. 1992, 46, 175–185. [Google Scholar] [CrossRef]
- Murni; Kosasih, R.; Fahrurozi, A.; Handhika, T.; Sari, I.; Lestari, D.P. Travel Time Estimation for Destination In Bali Using kNN-Regression Method with Tensorflow. IOP Conf. Ser. Mater. Sci. Eng. 2020, 854, 012061. [Google Scholar] [CrossRef]
- Öngelen, G.; İnkaya, T. LOF weighted KNN regression ensemble and its application to a die manufacturing company. Sadhana Acad. Proc. Eng. Sci. 2023, 48, 246. [Google Scholar] [CrossRef]
- Johannesen, N.J.; Kolhe, M.; Goodwin, M. Relative evaluation of regression tools for urban area electrical energy demand forecasting. J. Clean. Prod. 2019, 218, 555–564. [Google Scholar] [CrossRef]
- Chen, T.; Guestrin, C. Xgboost: A scalable tree boosting system. In Proceedings of the 22nd ACM SIGKDD International Conference on Knowledge Discovery and Data Mining, San Francisco, CA, USA, 13–17 August 2016; pp. 785–794. [Google Scholar] [CrossRef]
- Friedman, J.H. Greedy function approximation: A gradient boosting machine. Ann. Stat. 2001, 29, 1189–1232. [Google Scholar] [CrossRef]
- Bentéjac, C.; Csörgő, A.; Martínez-Muñoz, G. A comparative analysis of gradient boosting algorithms. Artif. Intell. Rev. 2020, 54, 1937–1967. [Google Scholar] [CrossRef]
- Daya, S.B.S.; Cheng, Q.; Agterberg, F. Handbook of Mathematical Geosciences: Fifty Years of IAMG; Springer: Cham, Switzerland, 2018; pp. 1–914. [Google Scholar] [CrossRef]
- Griffith, D. Spatial Statistics and Geostatistics: Basic Concepts. In Encyclopedia of GIS; Springer: Cham, Switzerland, 2017; pp. 2086–2100. [Google Scholar] [CrossRef]
- Dong, W.; Huang, Y.; Lehane, B.; Ma, G. XGBoost algorithm-based prediction of concrete electrical resistivity for structural health monitoring. Autom. Constr. 2020, 114, 103155. [Google Scholar] [CrossRef]
- Rossi, M.E.; Deutsch, C.V. Mineral Resource Estimation; Springer: Dordrecht, The Netherlands, 2014; pp. 1–332. [Google Scholar] [CrossRef]


| Hole_id | Easting, X (m) | Northing, Y (m) | Elevation, Z (m) | SiO2 (%) | Al2O3 (%) | Fe (%) |
|---|---|---|---|---|---|---|
| B01 | 50 | 100 | 776.5 | 20.70 | 0.92 | 53.00 |
| B01 | 50 | 100 | 775.5 | 20.08 | 0.93 | 53.57 |
| .. | .. | .. | .. | .. | .. | .. |
| .. | .. | .. | .. | .. | .. | .. |
| B71 | –90 | –145 | 864.5 | 1.20 | 1.64 | 66.30 |
| B71 | –90 | –145 | 850.5 | 1.59 | 0.92 | 66.33 |
| Metric | Fe (%) | SiO2 (%) | Al2O3 (%) | Easting (X) | Northing (Y) | Elevation (Z) |
|---|---|---|---|---|---|---|
| Count | 4112 | 4112 | 4112 | 4112 | 4112 | 4112 |
| Mean | 62.36 | 2.71 | 2.30 | 87.99 | –60.65 | 792.08 |
| Std | 3.67 | 3.44 | 2.18 | 151.92 | 331. 19 | 43.16 |
| Min | 50.00 | 0.16 | 0.02 | –200 | –800 | 655.50 |
| 25% | 61.13 | 1.00 | 1.00 | –50 | –300 | 764.50 |
| 50% | 63.59 | 1.56 | 1.57 | 100 | 0.00 | 798.50 |
| 75% | 64.76 | 2.87 | 2.62 | 200 | 200 | 824 |
| Max | 68.20 | 25.40 | 25.76 | 400 | 400 | 879 |
| Range | 18.2 | 25.24 | 25.74 | 600 | 1200 | 223.5 |
| Skewness | –1.42 | 3.51 | 2.53 | 0.13 | –0.58 | –0.54 |
| Kurtosis | 1.51 | 4.29 | 8.97 | –0.92 | –0.57 | –0.28 |
| Anderson–Darling Normality test p-value, normality | p = 0, non-normal | p = 0, non-normal | p = 0, non-normal | p = 0, non-normal | p = 0, non-normal | p = 0, non-normal |
| Metric | Fe (%) | Fe_Train (%) | Fe_Test (%) |
|---|---|---|---|
| Count | 4112 | 3495 | 617 |
| Mean | 62.358 | 62.37 | 62.28 |
| Std | 3.665 | 3.65 | 3.74 |
| Min | 50 | 50 | 50 |
| 25% | 61.13 | 61.20 | 60.80 |
| 50% | 63.59 | 63.60 | 63.50 |
| 75% | 64.76 | 64.74 | 64.86 |
| Max | 68.2 | 68.2 | 67.8 |
| Skewness | –1.42 | –1.44 | –1.34 |
| Kurtosis | 1.51 | –1 | –1.34 |
| Two-sample Z-test p-value | 1 | 0.86 | 0.61 |
| Metric | Fe_Train (%) | Fe_Test (%) | X_Train | X_Test | Y_Train | Y_Test | Z_Train | Z_Test |
|---|---|---|---|---|---|---|---|---|
| Count | 3495 | 617 | 3495 | 617 | 3495 | 617 | 3495 | 617 |
| Mean | 0.00 | –0.13 | 0.00 | 0.00 | 0.00 | –0.03 | 0.00 | 0.07 |
| Std | 1.00 | 1.13 | 1.00 | 0.99 | 1.00 | 1.01 | 1.00 | 1.01 |
| Min | –3.47 | –3.44 | –1.89 | –1.89 | –2.24 | –2.24 | –3.14 | –3.16 |
| 25% | –0.34 | –0.58 | –0.91 | –0.91 | –0.73 | –0.73 | –0.63 | –0.56 |
| 50% | 0.33 | 0.27 | 0.08 | 0.08 | 0.18 | 0.18 | 0.14 | 0.21 |
| 75% | 0.66 | 0.63 | 0.74 | 0.74 | 0.78 | 0.75 | 0.76 | 0.86 |
| Max | 1.61 | 1.61 | 2.05 | 2.05 | 1.39 | 1.39 | 2.04 | 1.95 |
| Skewness | –1.44 | –1.28 | 0.13 | 0.12 | –0.58 | –0.56 | –0.54 | –0.56 |
| Model | Design Features/Hyperparameters | Optimal Values of Hyperparameters |
|---|---|---|
| Ordinary Kriging (OK) | - | model: ‘spherical’, estimator: matheron, Range: 508.5, Sill: 13.07, Nugget: 9.08, n_lags: 16, anisotropy_angle_x = 0, anisotropy_angle_y = 0, anisotropy_angle_z = 0 |
| Support Vector Regression (SVR) | C: [0.01, 0.1, 1, 10, 100, 500], epsilon: [0.001, 0.01, 0.1, 0.2, 0.5] kernel: [‘rbf’, ‘poly’] degree: [2, 3, 4] (only for polynomial), gamma: [‘scale’, ‘auto’] | C: 500, epsilon: 0.5, kernel: ‘rbf’, gamma: ‘scale’, |
| Random Forest Regression (RFR) | n_estimators: [50, 100, 200] max_depth: [ 5, 7, 10, 15] min_samples_split: [2, 3, 4, 5, 6, 7, 8, 9, 10] min_samples_leaf: [2, 3, 4, 5, 6, 7, 8, 9, 10] max_features: [‘sqrt’] | n_estimators: 100, min_samples_split: 3, min_samples_leaf’: 2, max_features: ‘sqrt’, max_depth: 15 |
| K-Nearest Neighbour (KNN) Regression | n_neighbour: [5, 10, 15, 20], leaf_size: [30, 40, 50, 60], n_estimators: [20, 30, 40, 50], max_samples: [0.7, 0.8, 0.9, 1.0], metric: [‘euclidean’, ‘manhattan’] | n_neighbour: 5, leaf_size: 30, n_estimators: 50, max_samples: 1.0, metric: ‘ euclidean’ |
| XGBoost Regression | n_estimators: [50, 100, 200], learning_rate: [0.01, 0.025, 0.05, 0.075, 0.1], max_depth: [3, 4, 5, 6], min_child_weight: [2, 5, 10], gamma: [0.01, 0.025, 0.05, 0.075, 0.1], booster: [‘gbtree’, ‘dart’] | n_estimators: 100, learning_rate: 0.1, max_depth: 6, min_child_weight: 2, gamma: 0.075, booster: ‘dart’ |
| Strengths of ML Models | Limitations of ML Models |
|---|---|
| 1. Handles Non-Linear Relationships: ML models, like random forest and XGBoost, effectively capture complex, non-linear spatial patterns. | 1. Lack of Uncertainty Quantification: ML models do not inherently provide measures of prediction uncertainty (e.g., estimation variance for every prediction), which are critical for mining. |
| 2. Flexibility in High-Dimensional Data: ML models can process datasets with numerous variables without strict assumptions. | 2. Risk of Overfitting: Without careful tuning and cross-validation, ML models may overfit the training data, reducing their generalizability to new data. |
| 3. Robust to Noise: ML models handle noisy and irregular data distributions better than traditional geostatistical methods. | 3. Potential for Prediction Artifacts: Tree-based models without hyperparameter tunning can produce grid-like artifacts in spatial predictions due to discretized learning processes. |
| 4. No Stationarity Assumptions Required: ML models do not require the stationarity assumption that geostatistical models like OK rely on. | 4. Limited Geological Context: ML models often rely on the quality and relevance of input features, potentially missing geological interpretations crucial for mining. |
| 5. High Predictive Accuracy: With proper hyperparameter tuning, ML models can outperform traditional methods in terms of predictive metrics. | 5. Computationally Intensive: Tuning and training sophisticated ML models require significant computational resources and expertise. |
| 6. In practical mining applications, ML models can directly predict grades using spatial data. Therefore, it can minimize the extensive drilling during the exploration stage. | 6. Site-Specific Models: ML models are often developed for specific mine sites, making it challenging to generalize them to other locations without significant retraining. |
| Model | R2 (Train) | R2 (Test) | RMSE (Train) | RMSE (Test) | MAE (Train) | MAE (Test) |
|---|---|---|---|---|---|---|
| OK | 0.82 | 0.74 | 1.53 | 2.09 | 0.89 | 1.24 |
| RFR | 0.89 | 0.74 | 1.2 | 2.06 | 0.72 | 1.23 |
| KNN | 0.82 | 0.73 | 1.54 | 2.11 | 0.93 | 1.29 |
| XGBoost | 0.86 | 0.73 | 1.34 | 2.12 | 0.91 | 1.41 |
| SVR | 0.42 | 0.40 | 2.73 | 3.15 | 1.92 | 2.18 |
| Measure | x | y | z | OK Test Residuals | SVR Test Residuals | RFR Test Residuals | XGB Test Residuals | KNN Test Residuals |
|---|---|---|---|---|---|---|---|---|
| count | 617 | 617 | 617 | 617 | 617 | 617 | 617 | 617 |
| mean | 87.81 | –69.67 | 794.5551 | –0.25 | –0.39 | –0.23 | –0.14 | –0.27 |
| std | 149.98 | 333.17 | 43.50168 | 2.07 | 3.13 | 2.12 | 2.12 | 2.09 |
| min | –200 | –800 | 655.5 | –10.68 | –13.32 | –10.74 | –12.65 | –10.67 |
| 25% | –50 | –300 | 767.5 | –0.56 | –1.51 | –0.63 | –0.79 | –0.63 |
| 50% | 100 | 0 | 800.5 | 0.00 | 0.29 | 0.16 | 0.16 | 0.06 |
| 75% | 200 | 190 | 828.5 | 0.61 | 1.53 | 0.76 | 1.05 | 0.71 |
| max | 400 | 400 | 875.5 | 5.36 | 7.14 | 5.02 | 6.73 | 5.47 |
| Measure | x | y | z | OK Block Pred | SVR Block Pred | RFR Block Pred | KNN Block Pred | XGB Block Pred |
|---|---|---|---|---|---|---|---|---|
| count | 805 | 805 | 805 | 805 | 805 | 804 | 804 | 805 |
| mean | 60.0 | –143.7 | 800 | 62.38 | 61.54 | 62.36 | 62.42 | 62.37 |
| std | 139.2 | 346.9 | 0 | 2.92 | 4.22 | 2.42 | 2.59 | 2.54 |
| min | –200 | –825 | 800 | 52.36 | 44.17 | 54.04 | 54.06 | 54.58 |
| 25% | –50 | –425 | 800 | 60.26 | 60.84 | 61.06 | 60.56 | 60.75 |
| 50% | 50 | –125 | 800 | 63.27 | 62.52 | 62.82 | 63.34 | 62.87 |
| 75% | 150 | 150 | 800 | 64.37 | 64.02 | 64.07 | 64.34 | 64.30 |
| max | 400 | 400 | 800 | 67.17 | 67.64 | 67.91 | 67.01 | 67.11 |
Disclaimer/Publisher’s Note: The statements, opinions and data contained in all publications are solely those of the individual author(s) and contributor(s) and not of MDPI and/or the editor(s). MDPI and/or the editor(s) disclaim responsibility for any injury to people or property resulting from any ideas, methods, instructions or products referred to in the content. |
© 2025 by the authors. Licensee MDPI, Basel, Switzerland. This article is an open access article distributed under the terms and conditions of the Creative Commons Attribution (CC BY) license (https://creativecommons.org/licenses/by/4.0/).
Share and Cite
Maniteja, M.; Samanta, G.; Gebretsadik, A.; Tsae, N.B.; Rai, S.S.; Fissha, Y.; Okada, N.; Kawamura, Y. Advancing Iron Ore Grade Estimation: A Comparative Study of Machine Learning and Ordinary Kriging. Minerals 2025, 15, 131. https://doi.org/10.3390/min15020131
Maniteja M, Samanta G, Gebretsadik A, Tsae NB, Rai SS, Fissha Y, Okada N, Kawamura Y. Advancing Iron Ore Grade Estimation: A Comparative Study of Machine Learning and Ordinary Kriging. Minerals. 2025; 15(2):131. https://doi.org/10.3390/min15020131
Chicago/Turabian StyleManiteja, Mujigela, Gopinath Samanta, Angesom Gebretsadik, Ntshiri Batlile Tsae, Sheo Shankar Rai, Yewuhalashet Fissha, Natsuo Okada, and Youhei Kawamura. 2025. "Advancing Iron Ore Grade Estimation: A Comparative Study of Machine Learning and Ordinary Kriging" Minerals 15, no. 2: 131. https://doi.org/10.3390/min15020131
APA StyleManiteja, M., Samanta, G., Gebretsadik, A., Tsae, N. B., Rai, S. S., Fissha, Y., Okada, N., & Kawamura, Y. (2025). Advancing Iron Ore Grade Estimation: A Comparative Study of Machine Learning and Ordinary Kriging. Minerals, 15(2), 131. https://doi.org/10.3390/min15020131