1. Introduction
Niobium oxides are widely used in advanced technological applications, including the manufacture of capacitors, superconducting materials, solar cells, and aerospace components [
1,
2]. Despite its relevance, niobium is relatively scarce in the Earth’s crust, occurring at approximately 20 ppm, and is dispersed in more than 150 minerals [
3,
4]. Economically viable sources are limited to pyrochlore, columbite–tantalite, and microlite, with Brazil accounting for more than 90% of global niobium production. As such, niobium is considered a strategic material, and research aimed at improving its extraction and purification is essential for industrial and technological development, particularly in resource-rich countries such as Brazil [
5].
Minerals containing niobium and tantalum are classified as refractory, exhibiting significant resistance to conventional acid leaching techniques. Industrial extraction methods are largely based on hydrofluoric acid (HF), hydrochloric acid (HCl), or sulfuric acid (H
2SO
4), or on alkaline fusion using NaOH, KOH, or molten salts such as KHF
2 [
6,
7,
8,
9]. These approaches have serious environmental and operational disadvantages, including the emission of volatile metal fluorides, high acid consumption, the formation of toxic effluents, and the need for ores with a high Nb
2O
5 content to remain economically viable [
10,
11]. In addition, acid-based methods often generate unstable solutions and require complex purification processes [
4,
8].
Melting-based processes have emerged as an alternative to acid leaching, particularly for refractory ores such as columbite. These methods involve decomposing the mineral matrix using oxidizing or fluorinated salts to form water-soluble niobium compounds. Fusion-based processes typically employ agents such as Na
2O
2, KHF
2, or K
2S
2O
7 to decompose refractory minerals, but these often require high temperatures and pose environmental risks due to volatile byproducts [
8,
11,
12]. In this study, boric acid is introduced as a flux to reduce viscosity and melting temperature, facilitating the formation of water-soluble niobium phases under milder conditions [
13]. Although agents such as Li
2B
4O
7 and NaF/KHF
2 have been explored [
10], the use of boric acid (a precursor of B
2O
3) in combination with sodium carbonate for the selective extraction of niobium has not been widely investigated.
The combination of boric acid and sodium carbonate offers a potentially safer and more energy-efficient route for columbite ore processing. Boron-based compounds reduce the melting point of oxide systems and decrease the viscosity of the molten material, which can increase the mobility and reaction kinetics of metal oxides during melting [
14,
15,
16,
17]. In addition, the formation of sodium niobate phases, such as Na
3NbO
4 and NaNbO
3, can improve water solubility, potentially eliminating the need for acid leaching. However, the literature lacks a systematic investigation of the phase transformations involved in this melting process, especially about the influence of boron content, solid–liquid ratios, and calcination conditions on the recovery and purity of niobium oxide.
Therefore, this study aims to develop and evaluate an alternative route for the extraction of niobium pentoxide (Nb2O5) from columbite ore using sodium carbonate and boric acid as melting agents. This results in a fluoride-free alkaline fusion process, which is followed by leaching with water, precipitation with guanidine carbonate, and calcination. This route offers advantages over traditional methods, as it operates under milder conditions and generates less hazardous waste. The study fills a gap in the literature by providing experimental evidence and results for a new, little-explored route.
2. Materials and Methods
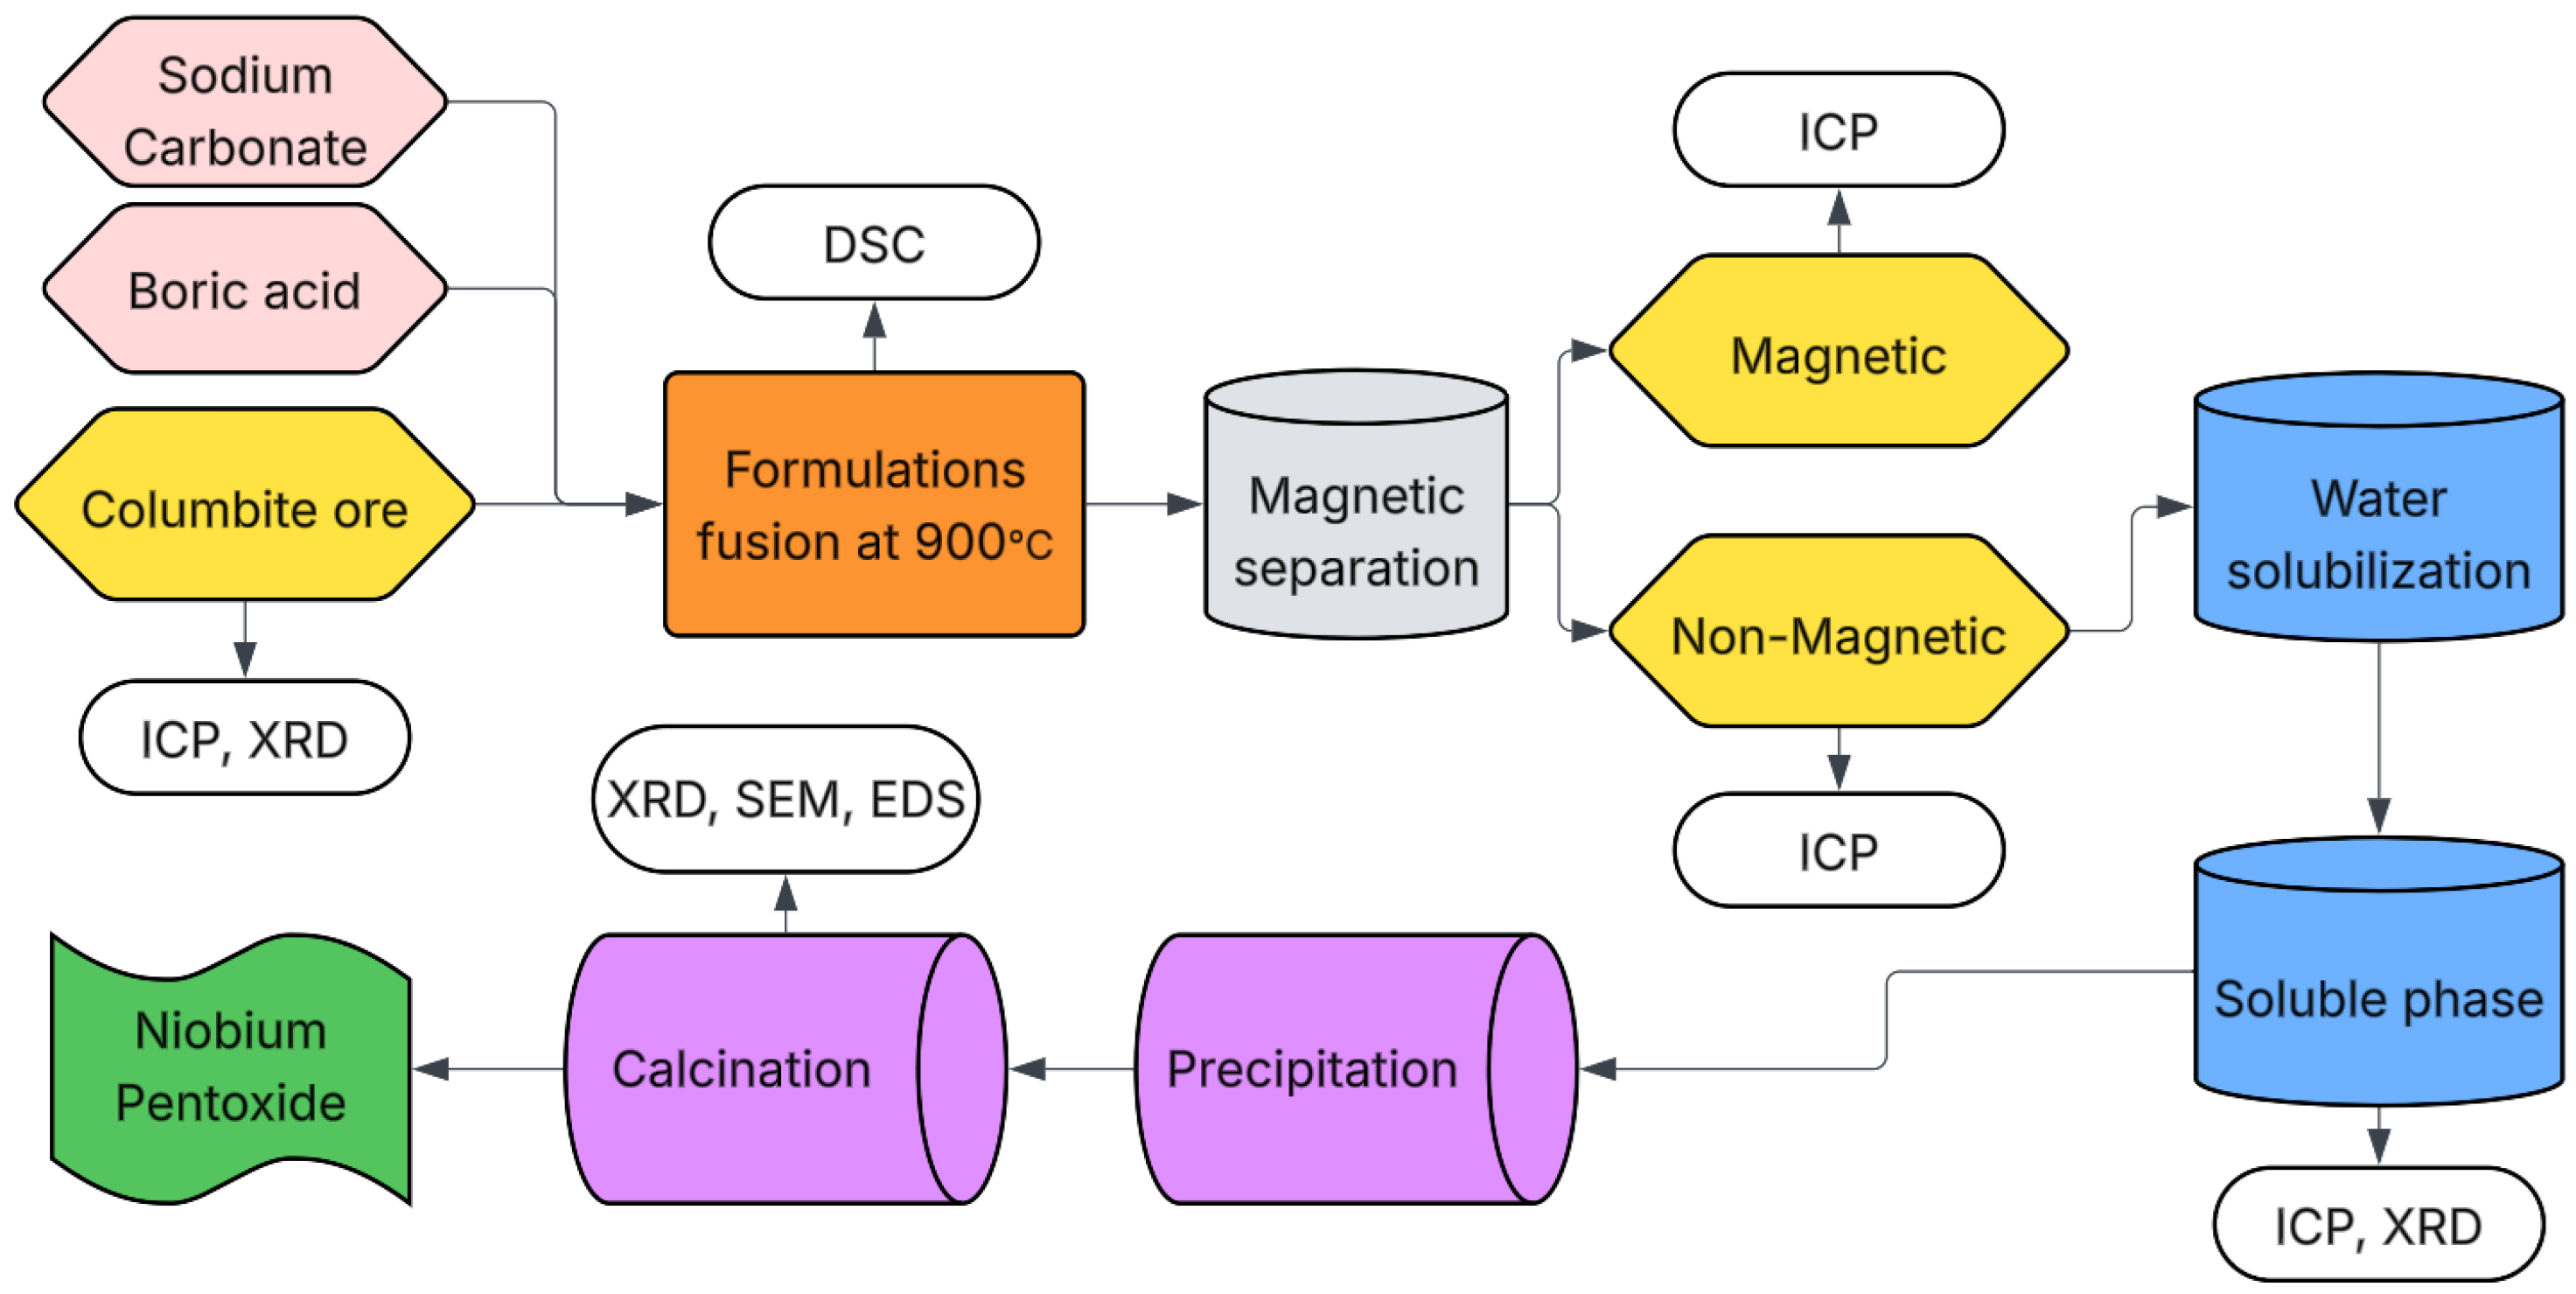
The overall experimental workflow is summarized in the process flow diagram shown in
Figure 1.
2.1. Raw Materials and Fusions
For this study, columbite ore, sodium carbonate, and boric acid were used as raw materials. The chemical compositions of sodium carbonate and boric acid are presented in
Table 1.
The columbite ore was supplied by a private company located in Roraima-RN, Brazil, and was confirmed to be free of radioactive elements. The ore was characterized by chemical analysis using Inductively Coupled Plasma—Optical Emission Spectrometry (ICP-OES) for Nb, Sn, Ta, and Zr, and X-ray Fluorescence (XRF) for Si, Ti, Al, Fe, Mn, and P.
X-ray Diffraction (XRD) analysis was also performed to identify the crystalline phases present in the ore. A Rigaku Miniflex 300 diffractometer (Rigaku, Tokyo, Japan) was used, operating with Cu Kα radiation (λ = 1.5418 Å), at 30 kV and 8 mA. The scans were carried out over a 2θ range of 10–80°, with a step size of 0.02° and a dwell time of 5 s per step.
To investigate the interactions between different component ratios while minimizing the number of experimental runs, a Design of Experiments (DOE) approach was employed. This methodology enables a systematic evaluation of how specific responses are influenced by variations in the proportions of the components under study. The main objective was to identify the optimal boron oxide (B2O3) to sodium oxide (Na2O) ratio that maximizes the extraction efficiency of niobium oxide (Nb2O5) from columbite using the proposed processing route.
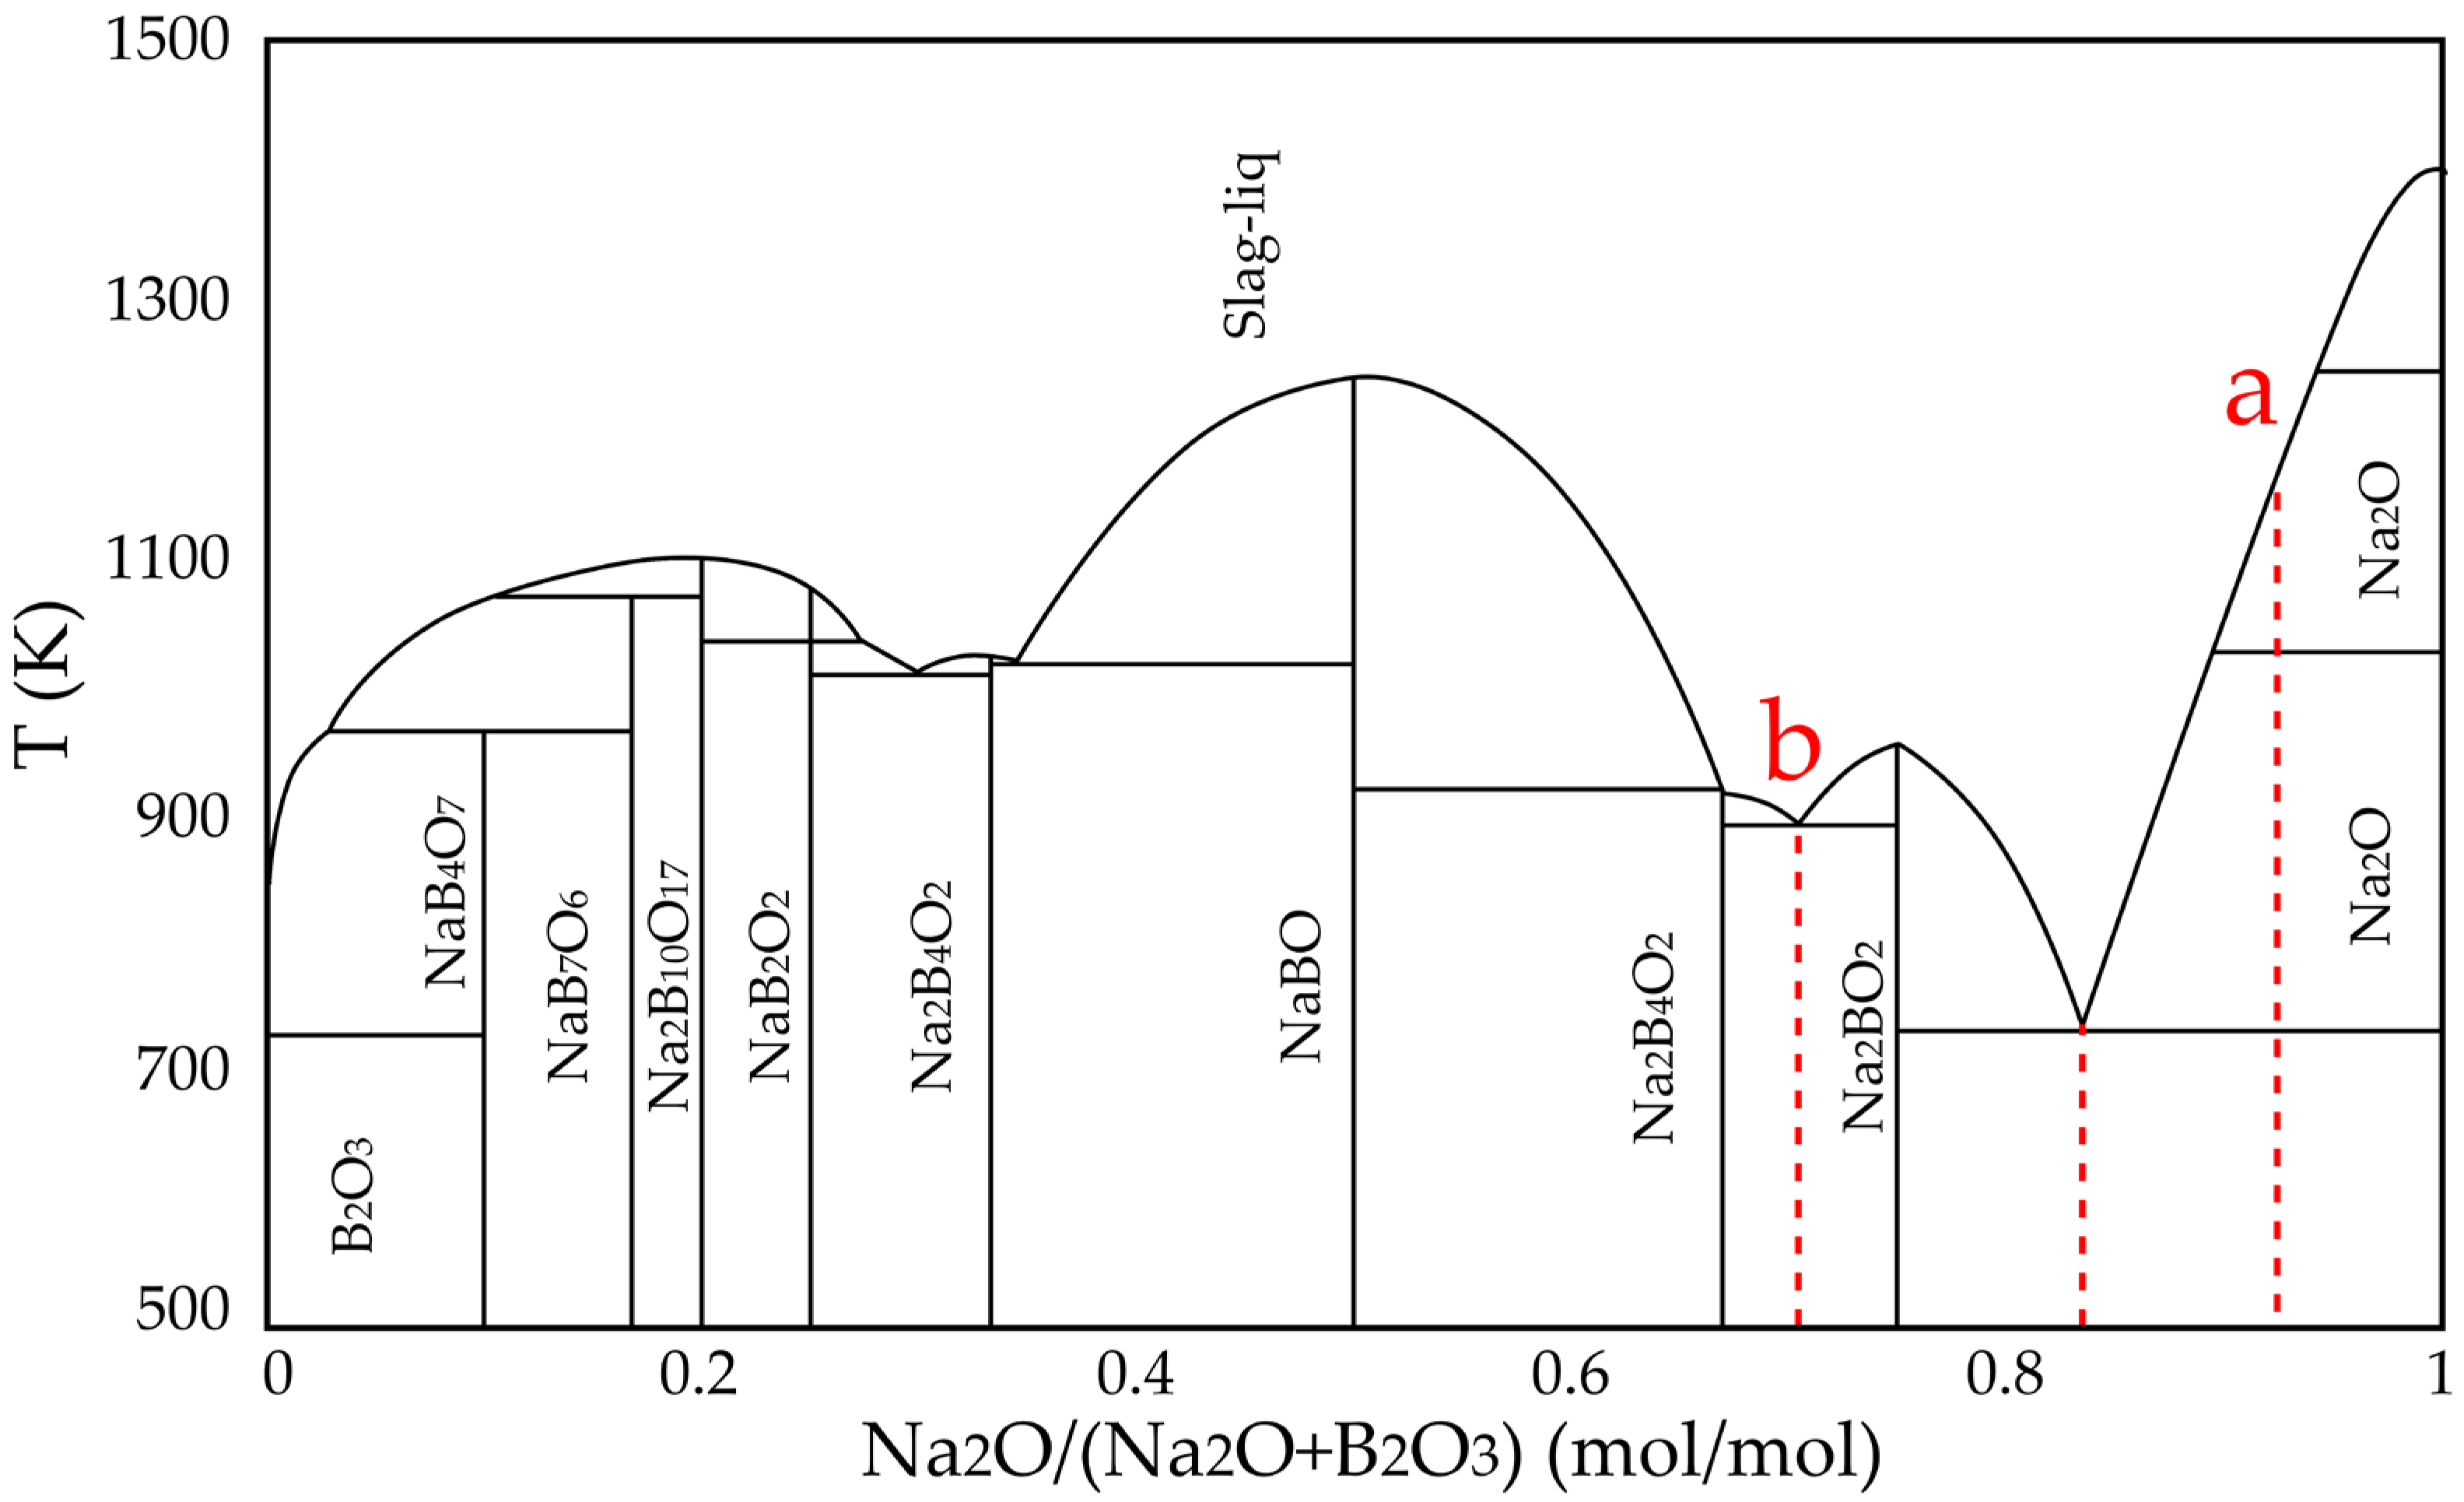
Based on the binary phase diagram of the Na
2O–B
2O
3 system (
Figure 2), obtained through computational simulation using FactSage, two points (a and b) were defined as the compositional limits for the evaluated formulations. Point “a” was determined from preliminary experiments and corresponds to the Na
2O:B
2O
3 ratio in the C10Na70B20 formulation. Point “b” represents a eutectic composition, advantageous for industrial applications due to its lower melting point, potentially reducing the energy demand of the process. Between points “a” and “b” lies another eutectic point with the lowest fusion temperature, which was selected as the center point for the formulations tested.
The columbite content in the formulations was set between 10 wt% and 20 wt%. The experimental compositions (
Table 2) were defined using Statistica 14 (trial version), with the aim of evaluating the influence of boron oxide (B
2O
3) and sodium oxide (Na
2O) on the extraction of niobium oxide (Nb
2O
5) from columbite ore. A statistical model with three factors and four centroid points was adopted to structure the experimental design.
A naming convention was established for the mixtures, where C represents the mass percentage of columbite, Na the percentage of sodium carbonate, and B the percentage of boric acid. For instance, the composition C10Na81B9 refers to a mixture containing 10% columbite, 81% sodium carbonate, and 9% boric acid (by mass).
The formulations were analyzed by Differential Scanning Calorimetry (DSC) to determine their melting behavior, as variations in chemical composition can influence the melting temperature. The analyses were performed using a Netzsch thermobalance (Model 449F3 Jupiter) (Netzsch Group, Selb, Germany) over a temperature range of 35 °C to 1200 °C, with a heating rate of 10 °C/min under a synthetic air atmosphere (flow rate: 50 mL/min).
Each mixture was placed in a 1 L crucible and subjected to fusion in a pit furnace at 900 °C for 60 min. The molten material was then poured into a container containing 0.6 L of water to promote rapid cooling (quenching). The resulting solid was diluted to a total volume of 3 L with deionized water, and agitation was applied at 1500 rpm for 2 min to suspend the material. The stirring speed was then reduced to 1290–1300 rpm and maintained for 10 min. A 7000 Gauss magnet was introduced into the solution under constant stirring to separate magnetic particles. The magnet was removed every 5 min, and the material adhered to it was collected. This process was repeated until no additional magnetic material adhered to the magnet, indicating complete separation.
After filtration, the magnetic and non-magnetic products were dried on a heating plate at 150 °C to yield a solid material. These samples were characterized by Inductively Coupled Plasma—Optical Emission Spectrometry (ICP-OES) to quantify niobium and tantalum contents. For digestion, 0.5 g of dried sample was weighed and transferred to a beaker, followed by the addition of 20 mL of nitric acid (65%). The mixture was heated on a hot plate at 100–130 °C for 30 min. Then, 10 mL of hydrochloric acid (37%) was added, and the solution was maintained under heating for an additional 2 h. After cooling to room temperature, the volume was adjusted to 100 mL with deionized water and vacuum filtered using white band filter paper (2 μm pore size) prior to analysis. X-ray diffraction (XRD) analysis was also performed on the dried solid samples to identify crystalline phases.
2.2. Water Solubilization
This step was conducted on formulations exhibiting the highest potential for niobium extraction, i.e., those that showed the highest niobium content in the non-magnetic material after chemical analysis. The dry non-magnetic material was manually ground to achieve a particle size passing through a 75 μm mesh.
The effects of temperature, time, and solid-to-liquid ratio on niobium solubilization in water were investigated in this stage. A 2
3 + 2 experimental design was employed, involving three variables and two central points. The temperature range was set between 30 °C and 80 °C, while the duration ranged from 1 to 3 h. The solid-to-liquid ratio varied from 1:10 to 1:50 (g/mL).
Table 3 shows the variable settings for each test derived from the experimental design. A 95% confidence level was adopted in the statistical analysis.
The nomenclature used is as follows: T denotes temperature, Te represents time, and R indicates the solid-to-liquid ratio. The numbers indicate the respective values of each parameter. For example, test T30Te1R1:10 corresponds to 30 °C, 1 h, and a solid-to-liquid ratio of 1:10 (g/mL).
After the water solubilization step, vacuum filtration was performed using a blue band paper filter, slow filtration, 11 cm diameter, with 2 μm porosity. After filtration, the filtrates and residue products were dried on a heating plate at 150 °C to yield a solid material. Subsequently characterized by Inductively Coupled Plasma Optical Emission Spectrometry (ICP-OES) to determine niobium and tantalum contents. X-ray diffraction (XRD) analysis was also conducted. To determine the fraction of water-soluble and water-insoluble materials, the dry materials were weighed.
2.3. Niobium Oxide Precipitation
Following the water solubilization process, the leachate was treated to recover niobium (Nb) and tantalum (Ta). In this step, precipitation was performed on samples C20Na69.5B10.5 and C20Na68B12, which exhibited the highest niobium contents in the chemical analyses. Based on the study by Tanvar et al. [
18], precipitation was carried out using 15.0 g of solubilized sample in 1 L of water, stirred at 900 rpm for 30 min. Guanidine carbonate (20.0 g) was used as the precipitating agent for each formulation, maintaining the same stirring speed and duration.
The precipitate was separated from the liquid phase by vacuum filtration using 2 μm pore size filter paper with an 11.0 cm diameter, and dried in an oven at 100 °C. The dried Nb–Ta–guanidine precipitate was then characterized by ICP-OES and X-ray diffraction (XRD) techniques.
Afterward, the calcination procedure followed the methodology proposed by Ogi et al. [
19]. The material retained on the filter was calcined in an electric fast-firing furnace at 900 °C for 60 min, with a heating rate of 15 °C/min. After calcination, the material was characterized by chemical analysis (ICP-OES), XRD, and scanning electron microscopy (SEM).
3. Results and Discussion
Table 4 shows the chemical analysis of the raw columbite ore, expressed as mass percentages of the respective oxides. The ore contains 56.80% niobium pentoxide (Nb
2O
5), 13.07% tantalum pentoxide (Ta
2O
5), and 16.67% iron oxide (Fe
2O
3). Other oxides such as SiO
2, TiO
2, Al
2O
3, MnO, P
2O
5, SnO
2, and ZrO
2 were also identified. The authors report that niobium oxide content (Nb
2O
5) in columbite ranges from 46.8% to 81.2%, while tantalum oxide (Ta
2O
5) varies between 5.3% and 31.2%.
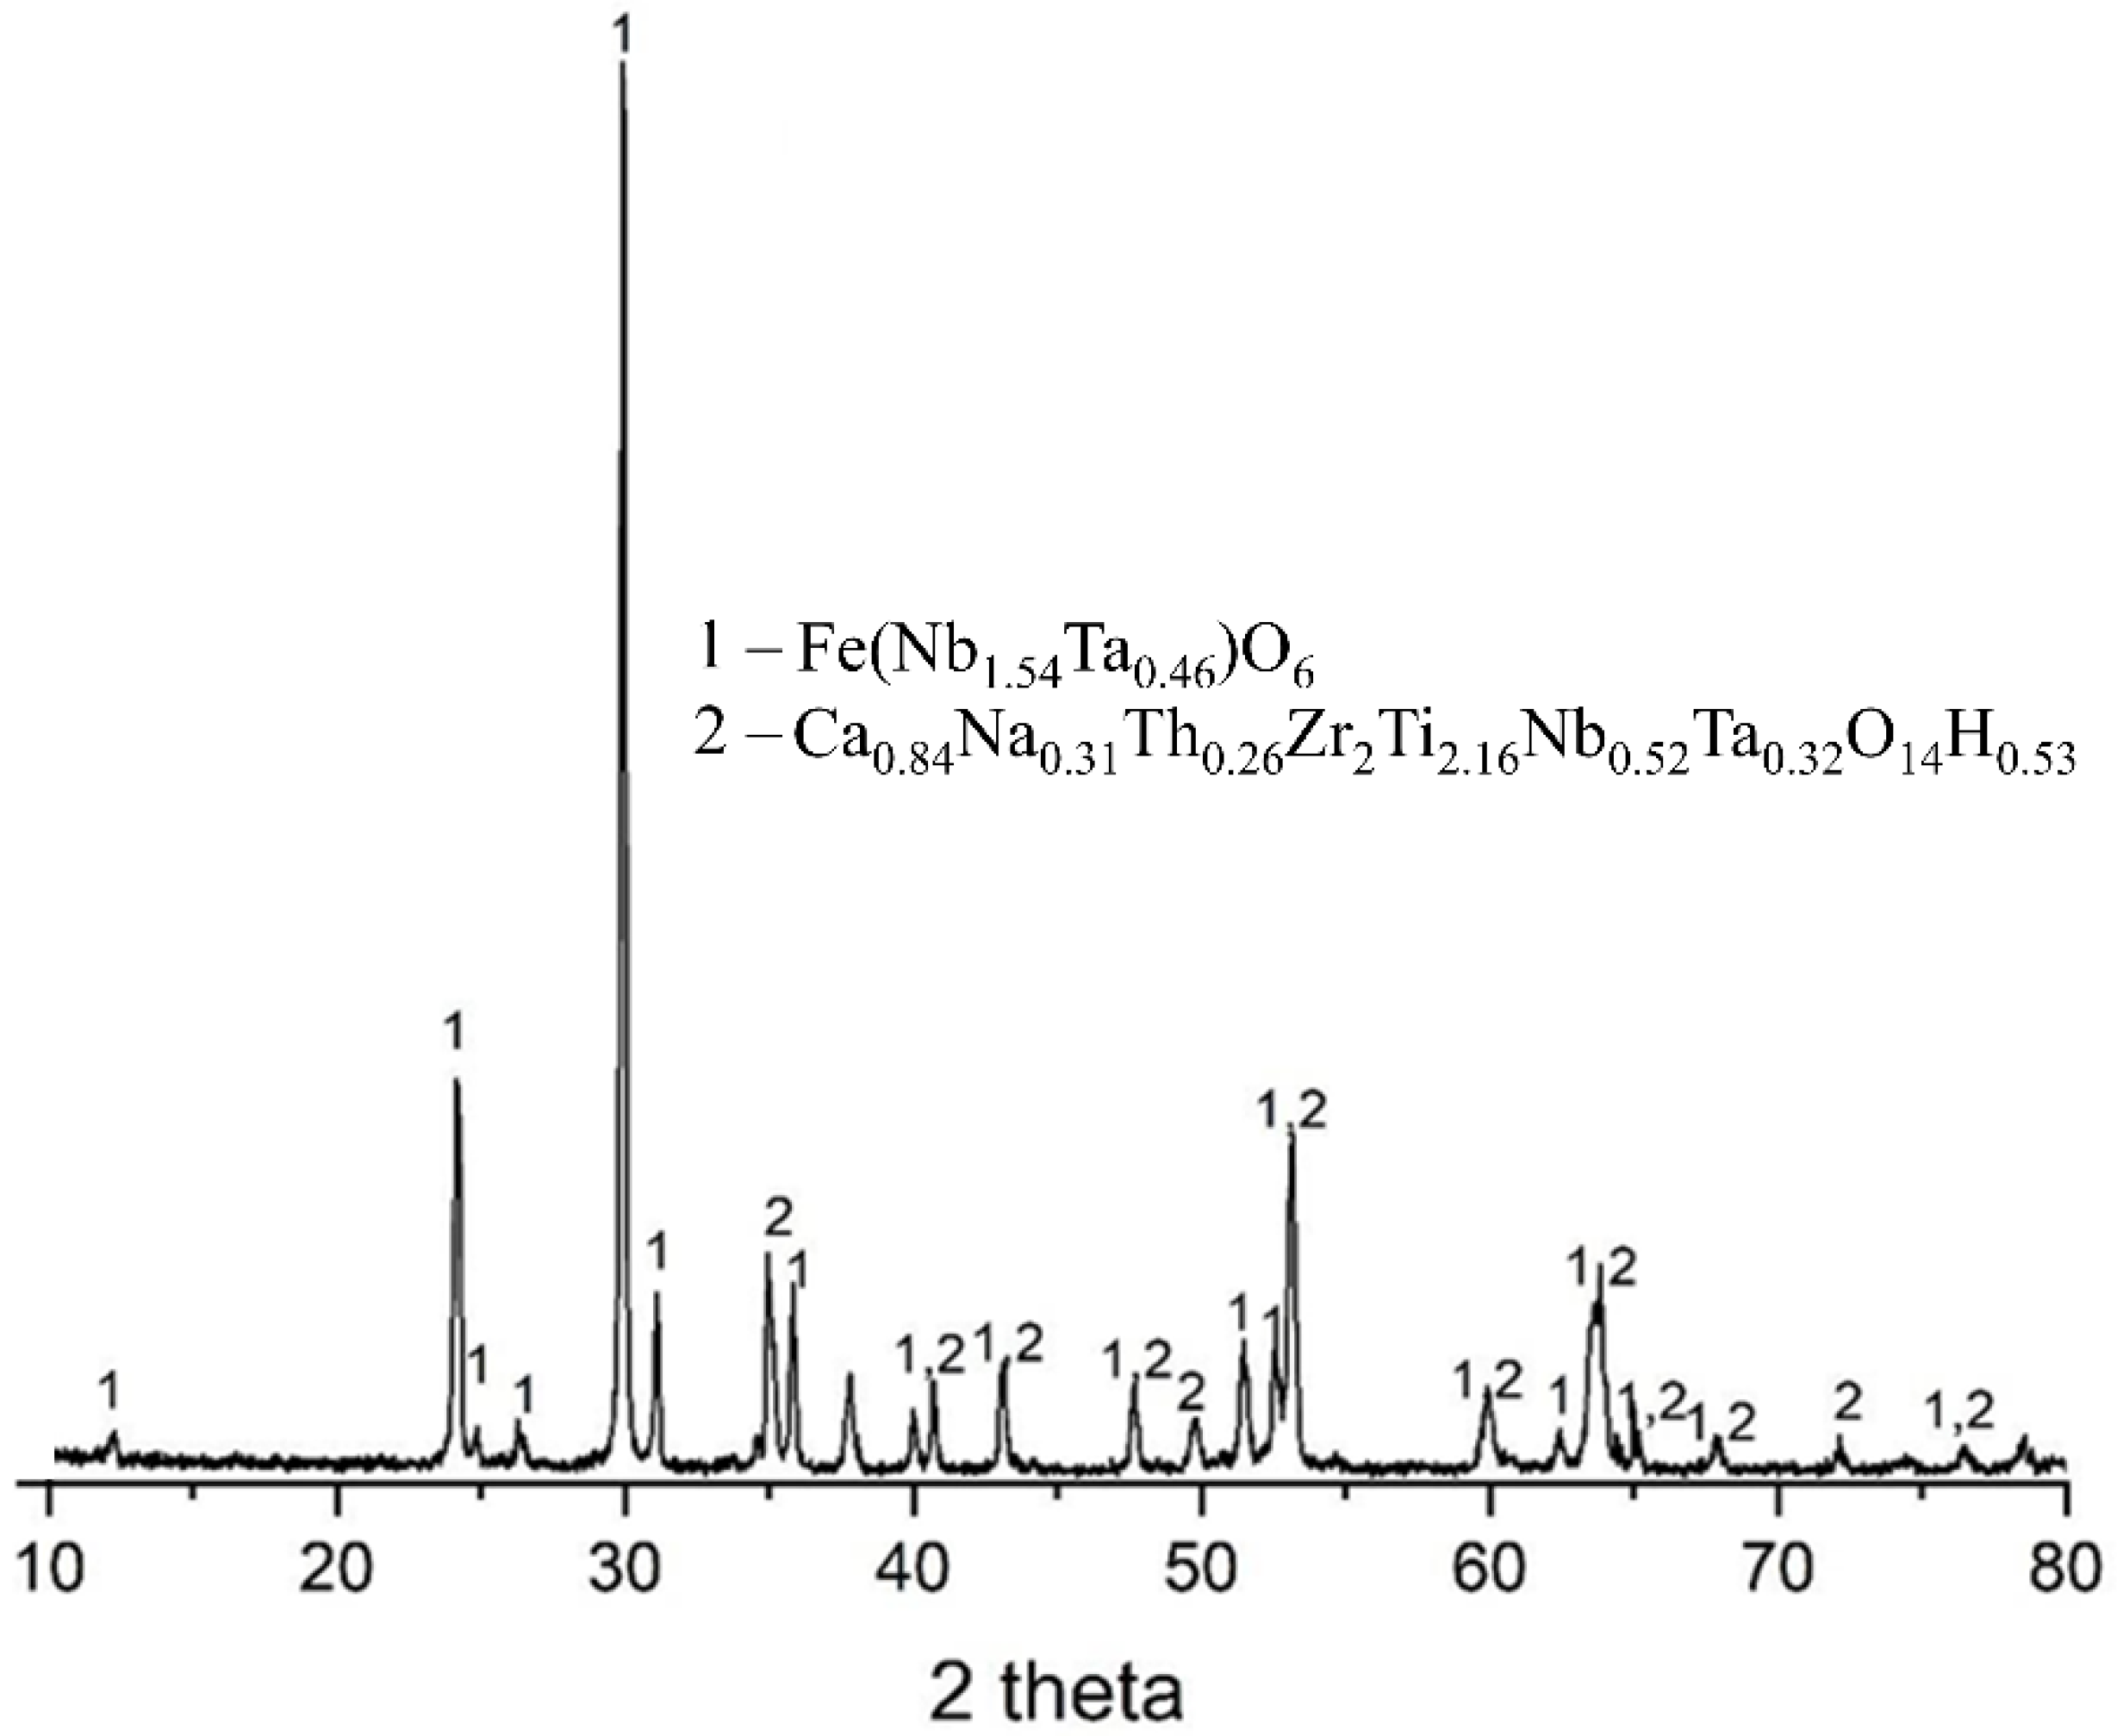
Figure 3 shows the X-ray diffraction pattern of the columbite ore. The analysis confirms ferrocolumbite as the major crystalline phase, representing the primary source of niobium and tantalum in the ore. A secondary phase, zirkelite, is also present and relevant due to the presence of elements such as Zr, Ti, and Ca, which may affect the selectivity of the extraction process.
Additionally, the particle size distribution of the ore was analyzed. The results showed that columbite particles range from 0.04 to 71 μm, with D10 = 1.13 μm, D50 = 12.28 μm, and D90 = 37.67 μm.
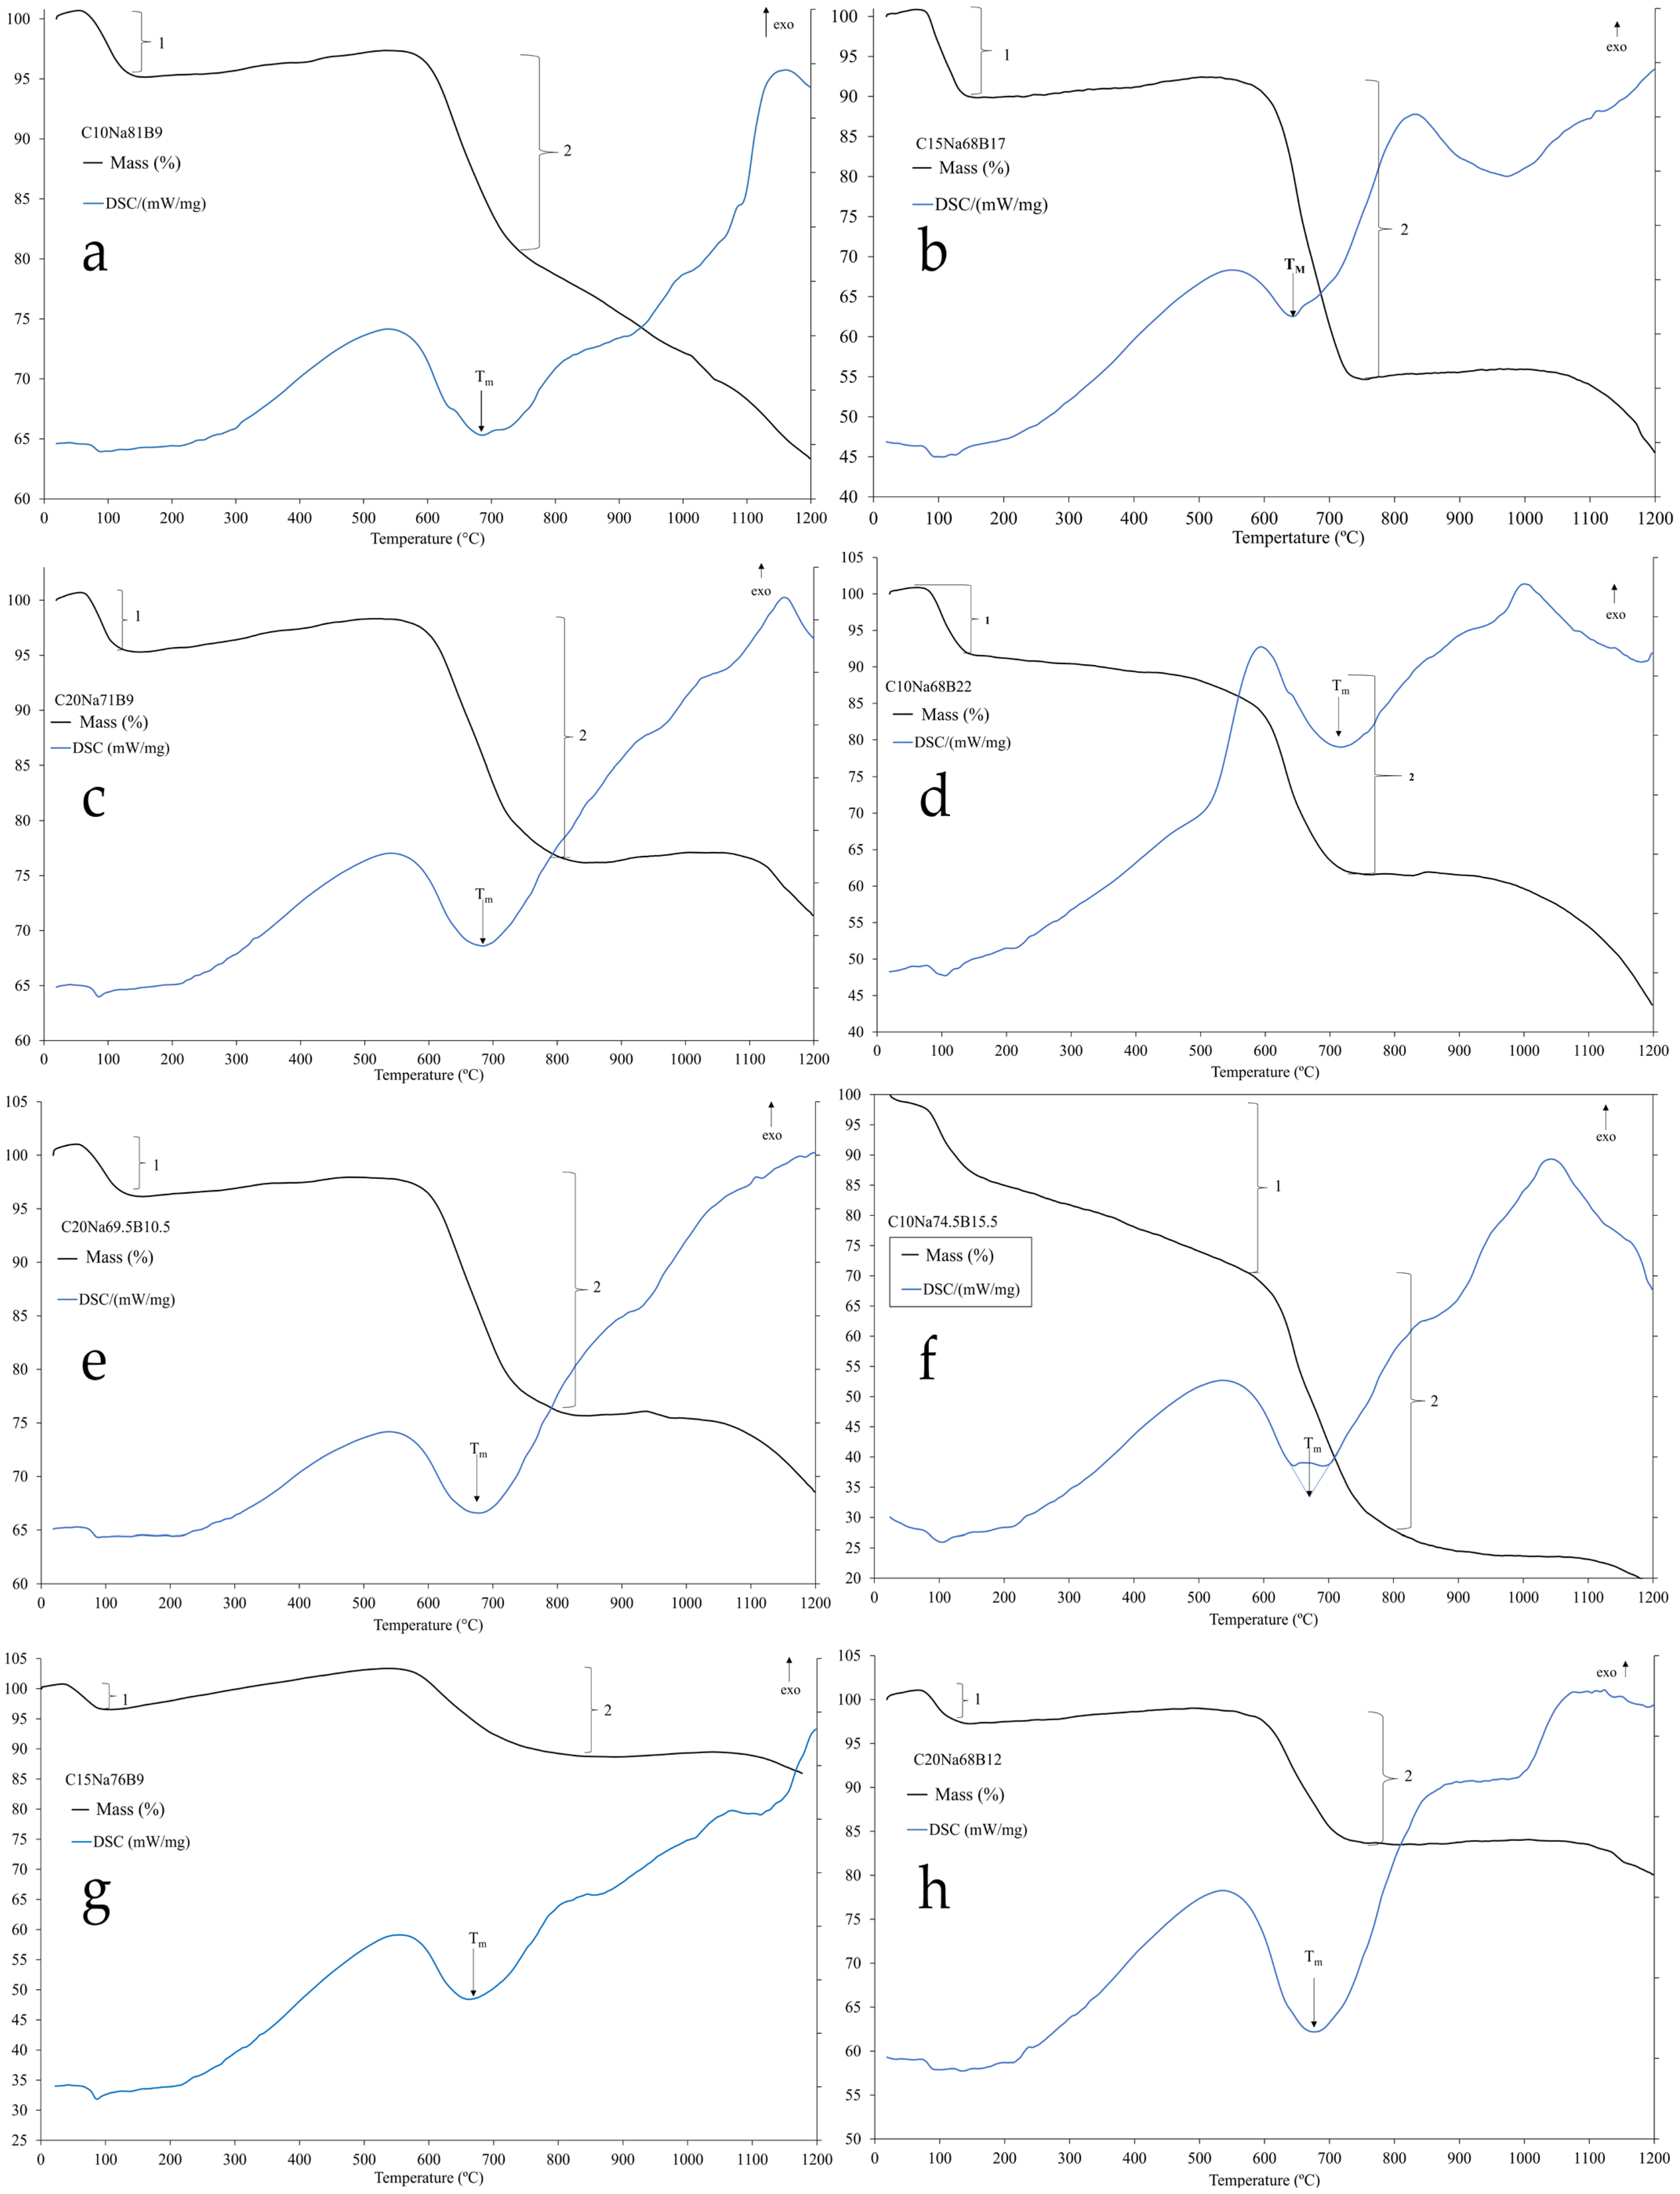
The thermal behavior of the formulations was investigated using Thermogravimetric and Differential Scanning Calorimetry (TGA/DSC) analysis, as depicted in
Figure 4. The TGA curves show an initial mass loss below 150 °C (Point 1), corresponding to the removal of adsorbed and absorbed water [
20]. A second mass loss (Point 2) is attributed to the thermal decomposition of the flux agents, primarily the dehydration of boric acid (Equation (1)) [
21], and the decomposition of sodium carbonate upon reaction with the ore (Equation (2)) [
22].
Concurrently, the DSC curve displays multiple thermal events, with the endothermic peak labeled Tₘ, signifying the onset of melting, which is critical for the fusion stage. For niobium oxide systems, which are complex and comprise multiple phases and polymorphs, the interpretation of these peaks remains unclear, although they likely correspond to phase transitions [
23,
24].
Following the fusion stage, the resulting product was separated into magnetic and non-magnetic fractions. This physical separation allowed for the chemical analysis of each fraction to determine how the variables in the initial formulations influenced the partitioning of the elements.
The chemical composition results of the magnetic fraction are shown in
Table 5. The lowest niobium concentration in the magnetic fraction was observed for formulation C15Na76B9, with 4.5 mg/L. Formulations C10Na68B22 and C20Na68B12 also showed low niobium levels, 5.74 mg/L and 9.36 mg/L, respectively. On the other hand, formulation C15Na68B17 presented 16.98 mg/L of niobium, and formulation C20Na69.5B10.5 exhibited a niobium concentration of 58.21 mg/L.
Table 6 shows the chemical analysis of the non-magnetic fraction for each formulation after fusion. The fusion results show that mixtures C20Na69.5B10.5 and C20Na68B12 achieved the highest niobium concentrations (89.62 and 46.90 mg/L, respectively). It was observed that increasing the sodium carbonate content in the mixtures did not necessarily enhance niobium extraction; however, there is clear evidence that boric acid contributed significantly to the extraction. For example, formulations C20Na69.5B10.5 and C20Na68B12 contained 69.5% and 68% sodium carbonate, respectively. A similar trend was observed for formulations C10Na81B9 and C10Na68B22, containing 81% and 68% sodium carbonate, respectively. Formulation C10Na81B9 presented a niobium content of 12.09 mg/L, whereas formulation C10Na68B22 showed 35.95 mg/L.
It was also noted that the addition of boric acid influenced the extraction process. Comparing formulations C20Na69.5B10.5 and C20Na68B12, a decrease of 1.5% boric acid in the mixture composition led to a reduction in niobium concentration in the non-magnetic fraction from 89.62 mg/L to 46.90 mg/L. Additionally, comparing samples C20Na71B9 and C20Na68B12, both containing 20% columbite, the increase in boric acid content from 9.0% to 12.0% caused an increase in niobium content in the non-magnetic fraction from 19.97 mg/L to 46.90 mg/L. Formulations C10Na81B9 and C10Na68B22 exhibited the same behavior, i.e., increasing boric acid content in the formulations also increased niobium content in the non-magnetic fraction.
Therefore, the results indicate that the presence of boric acid contributes to niobium extraction in the formulations proposed in this work. Boric acid is known to reduce both the melting temperature and the viscosity of the molten mixtures, which facilitates greater release of niobium into the liquid phase, making it available to react with sodium to form water-soluble phases [
14]. Furthermore, lower viscosity allows greater mobility of chemical elements in the molten mixture, further enhancing extraction efficiency [
15,
16,
17].
For the subsequent steps, formulations C20Na69.5B10.5 and C20Na68B12 were selected due to their highest niobium and tantalum contents in the non-magnetic material (89.62 mg/L–10.44 mg/L and 46.90 mg/L–9.62 mg/L, respectively).
Next, water solubilization tests were conducted using formulations C20Na69.5B10.5 and C20Na68B12. This stage investigated the variables of solid-to-liquid ratio, temperature, and time.
Table 7 presents the weight percentages of samples solubilized in water and the percentage of samples insoluble in water. The sample with the lowest solid-to-liquid ratio (T80Te3R1:50) achieved a solubility of 86.2%. Conversely, the sample with the lowest solubility was T80Te3R1:10 (60.8%), confirming that higher solid-to-liquid ratios may limit the leaching process.
Statistical analysis of the mixture C20Na69.5B10.5 shows that the solid-to-liquid ratio was statistically significant at a confidence level above 95% (p = 0.028). In contrast, the parameters temperature and time did not show statistical significance, presenting p-values greater than 0.050 (0.185 and 0.963, respectively).
The effect index of the Pareto chart for the solid-to-liquid ratio was −2.881, indicating that the lowest solid-to-liquid ratio increases the solubility value of the compositions. Thus, it can be observed that a higher proportion of liquid relative to solid favors greater solubilization of the components. This behavior can be explained by the increased availability of water to interact with solid particles, facilitating the transport and diffusion of soluble components into the liquid phase.
Accordingly, combining the analyzed parameters for formulation C20Na69.5B10.5, the sample exhibiting the highest solubility was T80Te1R1:50 (90.4%). In contrast, the sample with the lowest solubility was T30Te3R1:10 (69%), confirming that higher solid-to-liquid ratios can limit the leaching process.
The statistical analysis of the mixture C20Na68B12 again shows that the solid-to-liquid ratio was statistically significant at a confidence level above 95% (p = 0.001). In contrast, the parameters temperature and time did not show statistical significance, with p-values greater than 0.05 (0.845 and 0.614, respectively). The effect index for the Pareto chart was −7.9442, indicating the same behavior already described.
Table 8 presents the results of the chemical analysis of the soluble phase from the water leaching of sample C20Na69.5B10.5. The compositions of the samples show variations in the concentrations of Na
2O and B
2O
3, which can be attributed to the nature of the reagents used in the fusion process and the extraction of elements from the columbite ore. Na
2O is the main component, with values ranging from 64.85% to 84.68%. B
2O
3 is also present in varying amounts between 10.29% and 14.38%, originating from the added reagents. Niobium pentoxide (Nb
2O
5) contents were found between 1.40% and 18.03%. For tantalum pentoxide (Ta
2O
5), the results showed values ranging from 0.28% to 3.58%.
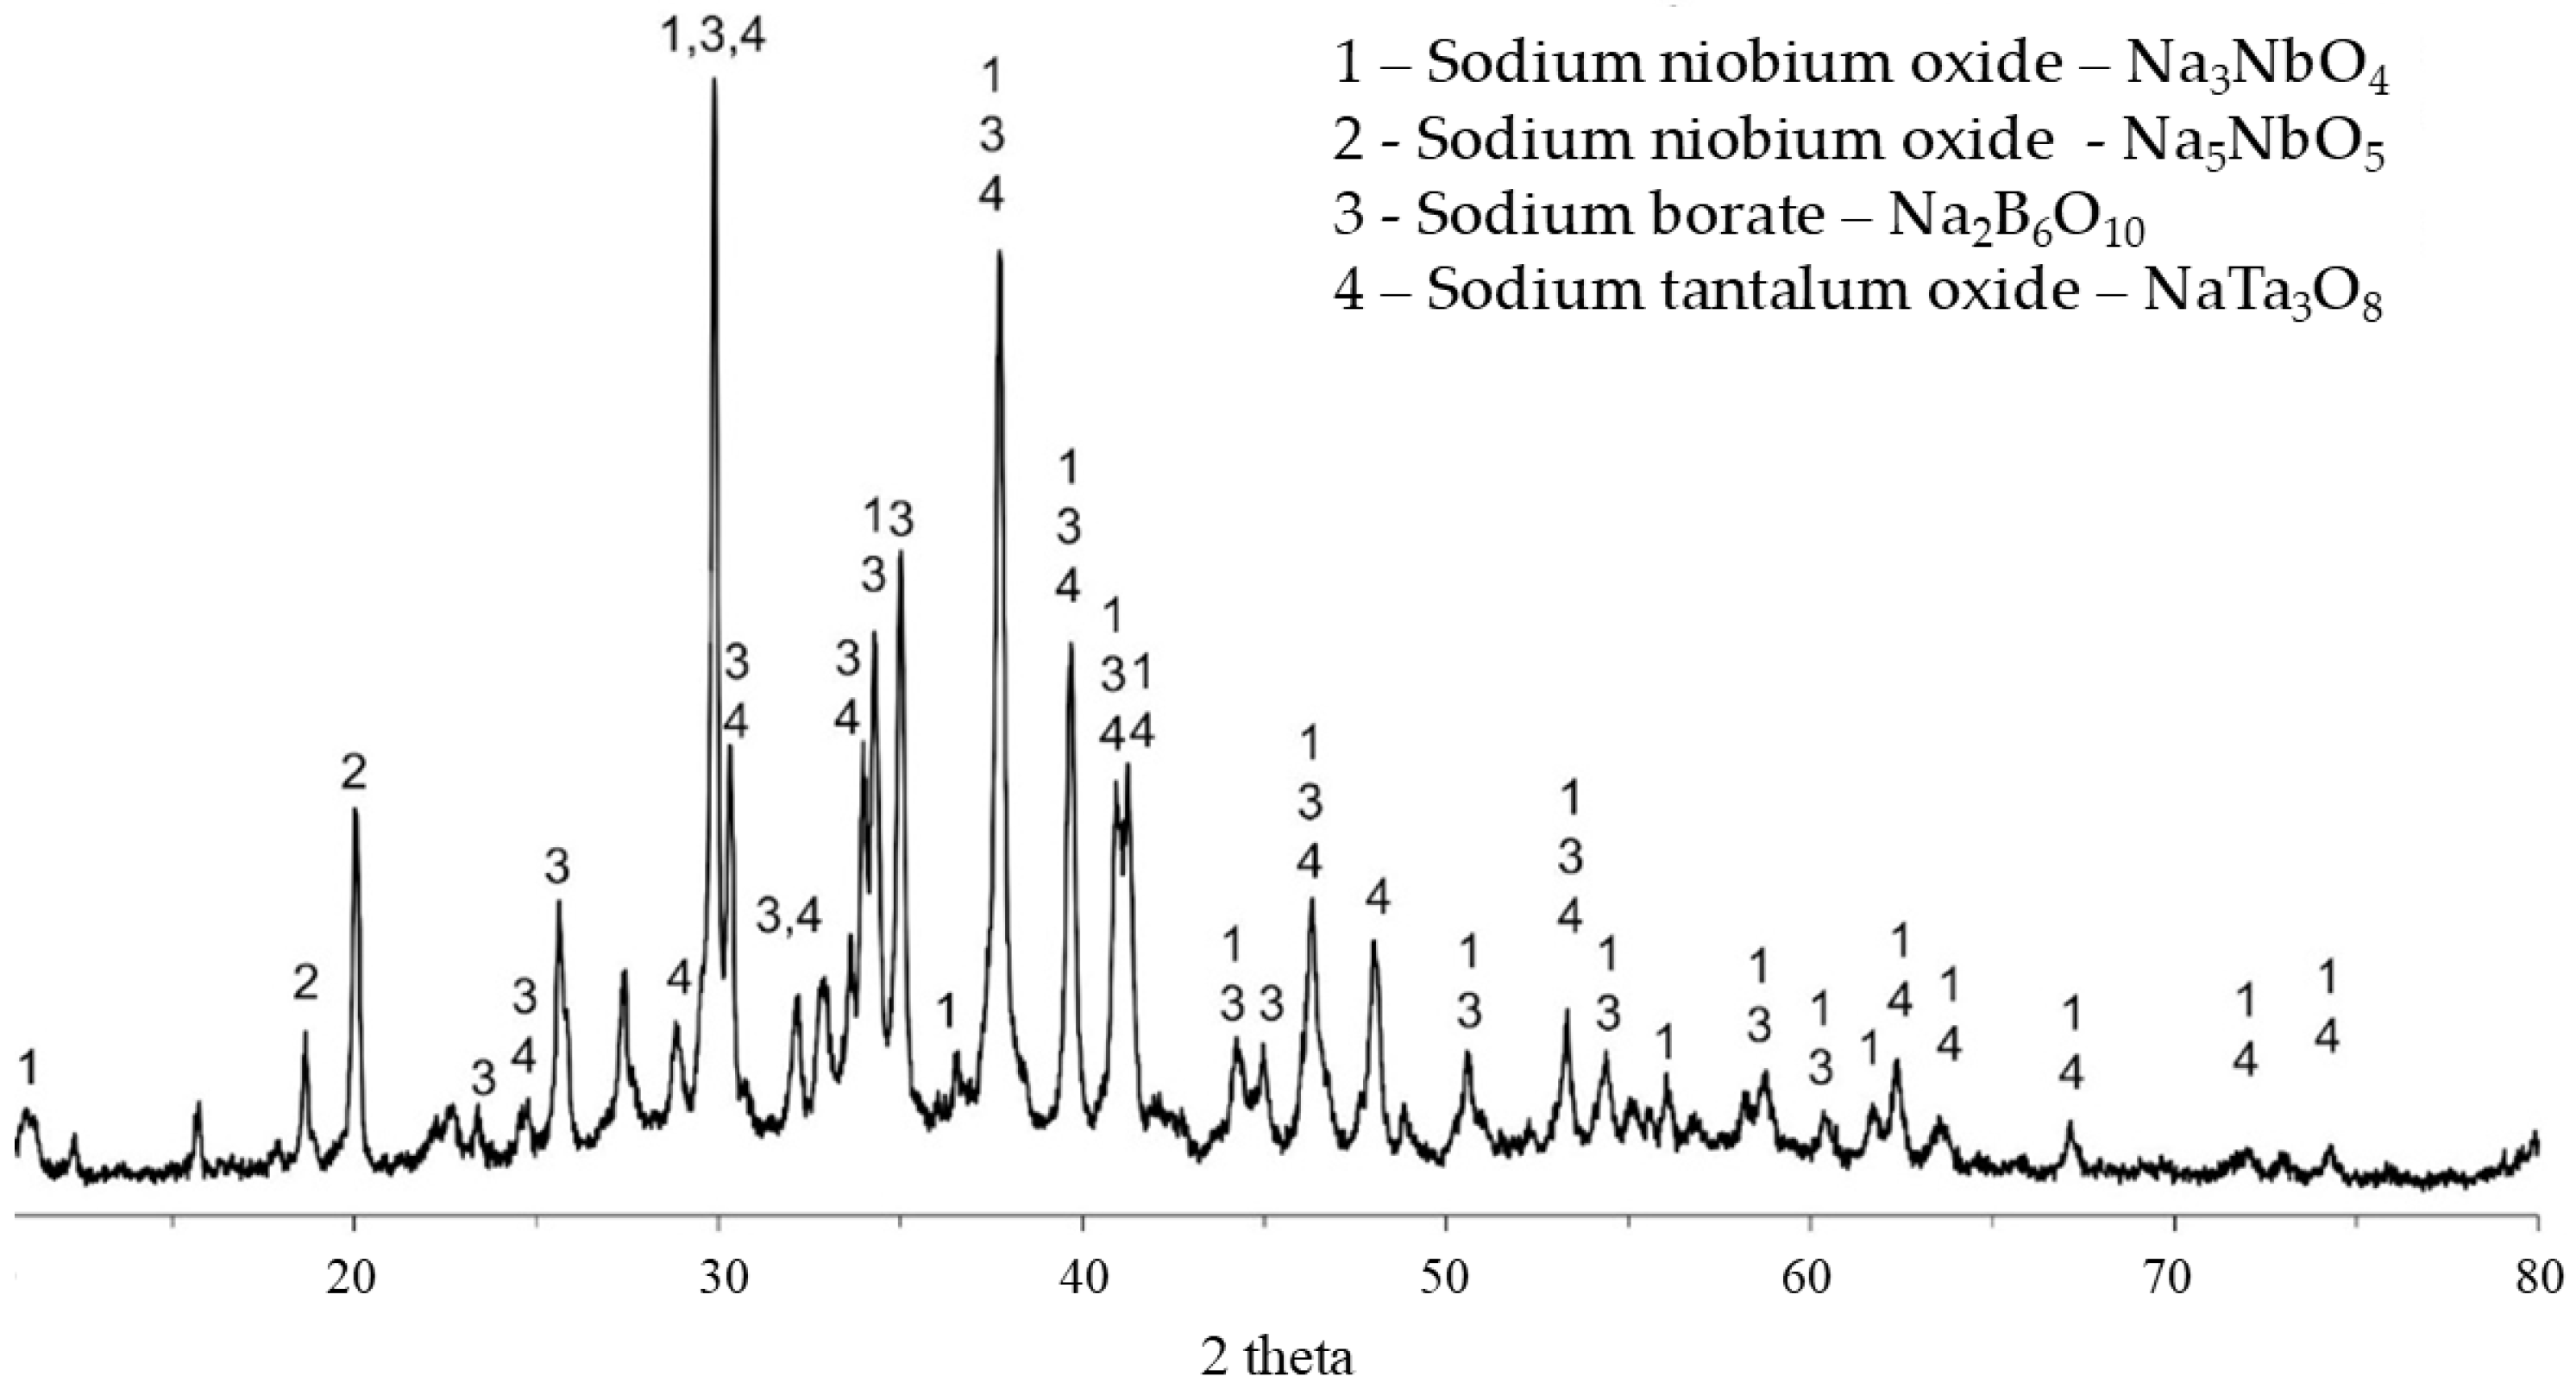
Figure 5 shows the X-ray diffraction pattern of the filtered and dried material of the soluble phase resulting from the aqueous leaching of formulation C20Na69.5B10.5. The formation of the Na
3NbO
4 phase, which is water-soluble, was predominantly observed, indicating that the alkaline fusion conditions were favorable for the extraction of niobium and tantalum from the columbite ore. Additionally, the fraction retained during the filtration step was also analyzed by XRD; however, the result showed an amorphous structure due to rapid cooling in water.
Table 9 presents the results of the chemical analyses from the aqueous leaching step of sample C20Na68B12. Variations in the concentrations of Na
2O and B
2O
3 were observed, which can be attributed to the nature of the reagents used in the fusion and extraction processes of the columbite ore. The Na
2O content reached up to 77.71%, while B
2O
3 levels were as high as 18.50%. These elevated values are expected since these oxides originate from the reagents added during the leaching process. For the components of interest, Nb
2O
5 content ranged from 2.90% to 18.09%, and Ta
2O
5 content varied from 0.59% to 4.55%.
Statistical analysis shows that the solid-to-liquid ratio was statistically significant at a confidence level above 95% (
p = 0.034). In contrast, the parameters temperature and time did not show statistical significance, with
p-values greater than 0.05 (0.915 and 0.744, respectively). Anes [
25] also found that the solid-to-liquid ratio influenced the leaching of niobium contained in tin production residue. The Pareto chart had an index of −2.716, indicating that a decrease in the solid-to-liquid ratio increases niobium extraction.
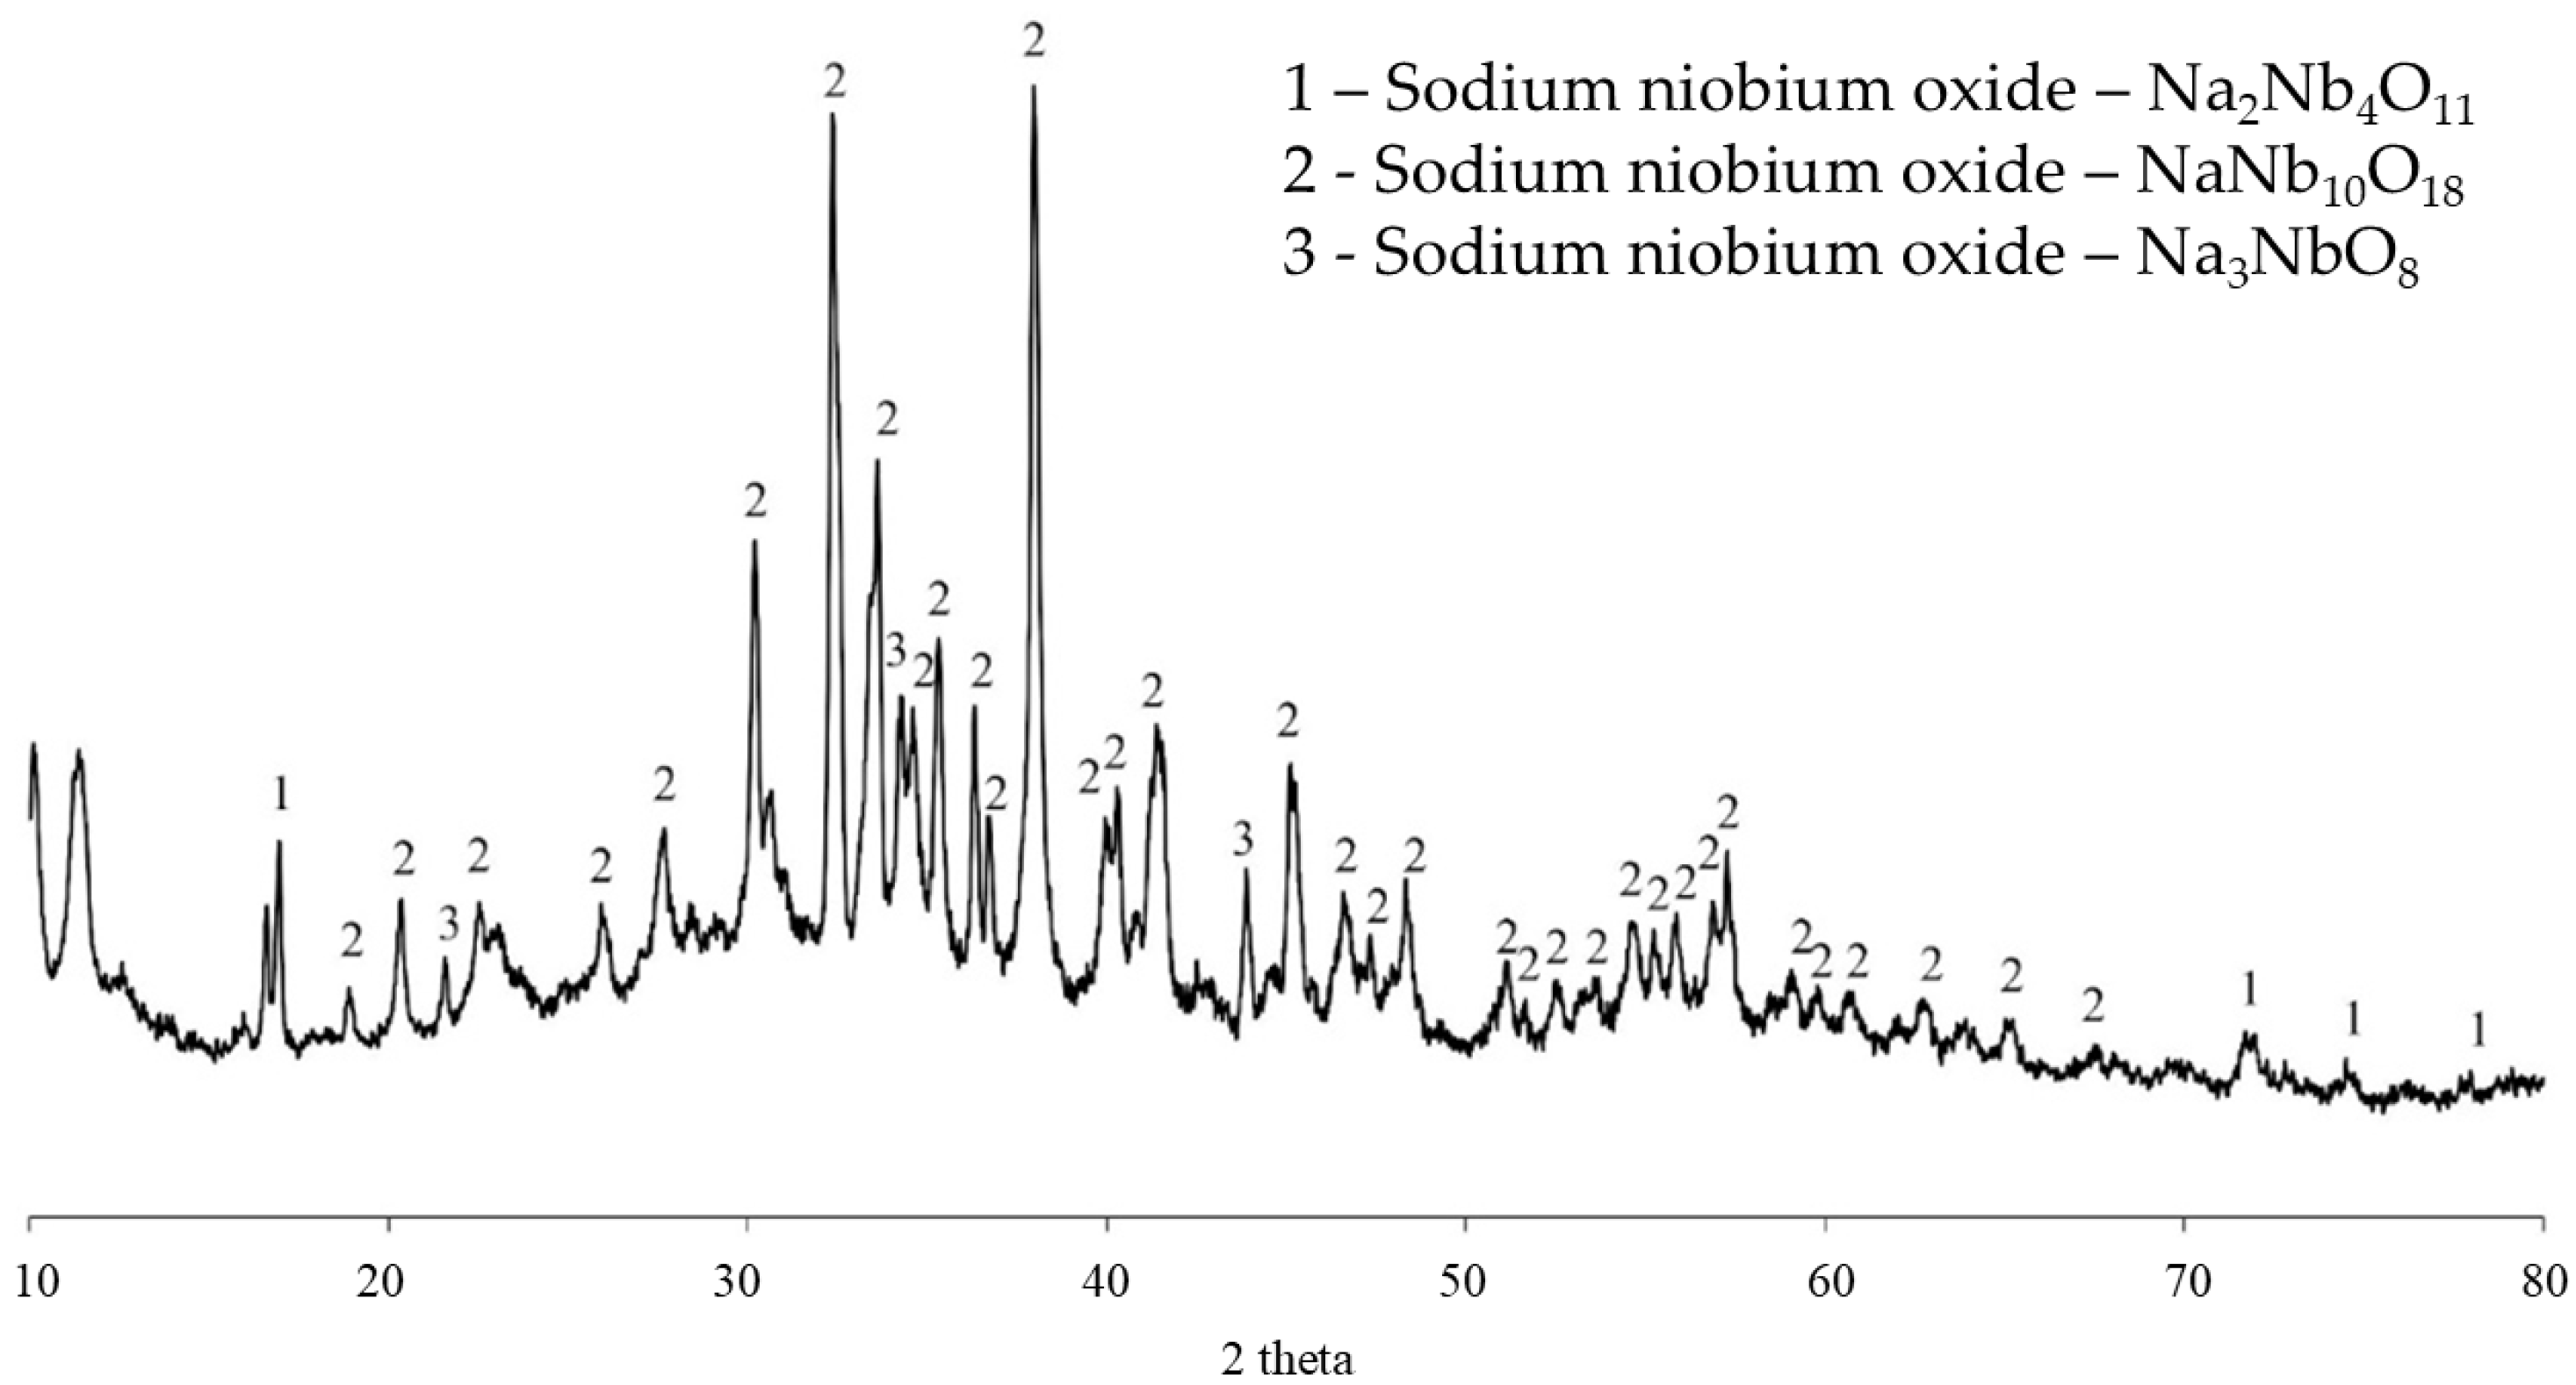
Figure 6 shows the X-ray diffraction pattern of the soluble phase resulting from the aqueous leaching of formulation C20Na68B12. The predominance of the NaNb
10O
18 phase, which is water-soluble, is observed. The phases Na
2Nb
4O
11 and Na
3NbO
8, also water-soluble, were identified as well. XRD analysis of the insoluble residue from filtration confirmed its amorphous structure.
After calcination of the soluble compositions, the precipitation and calcination products were subjected to X-ray diffraction analysis.
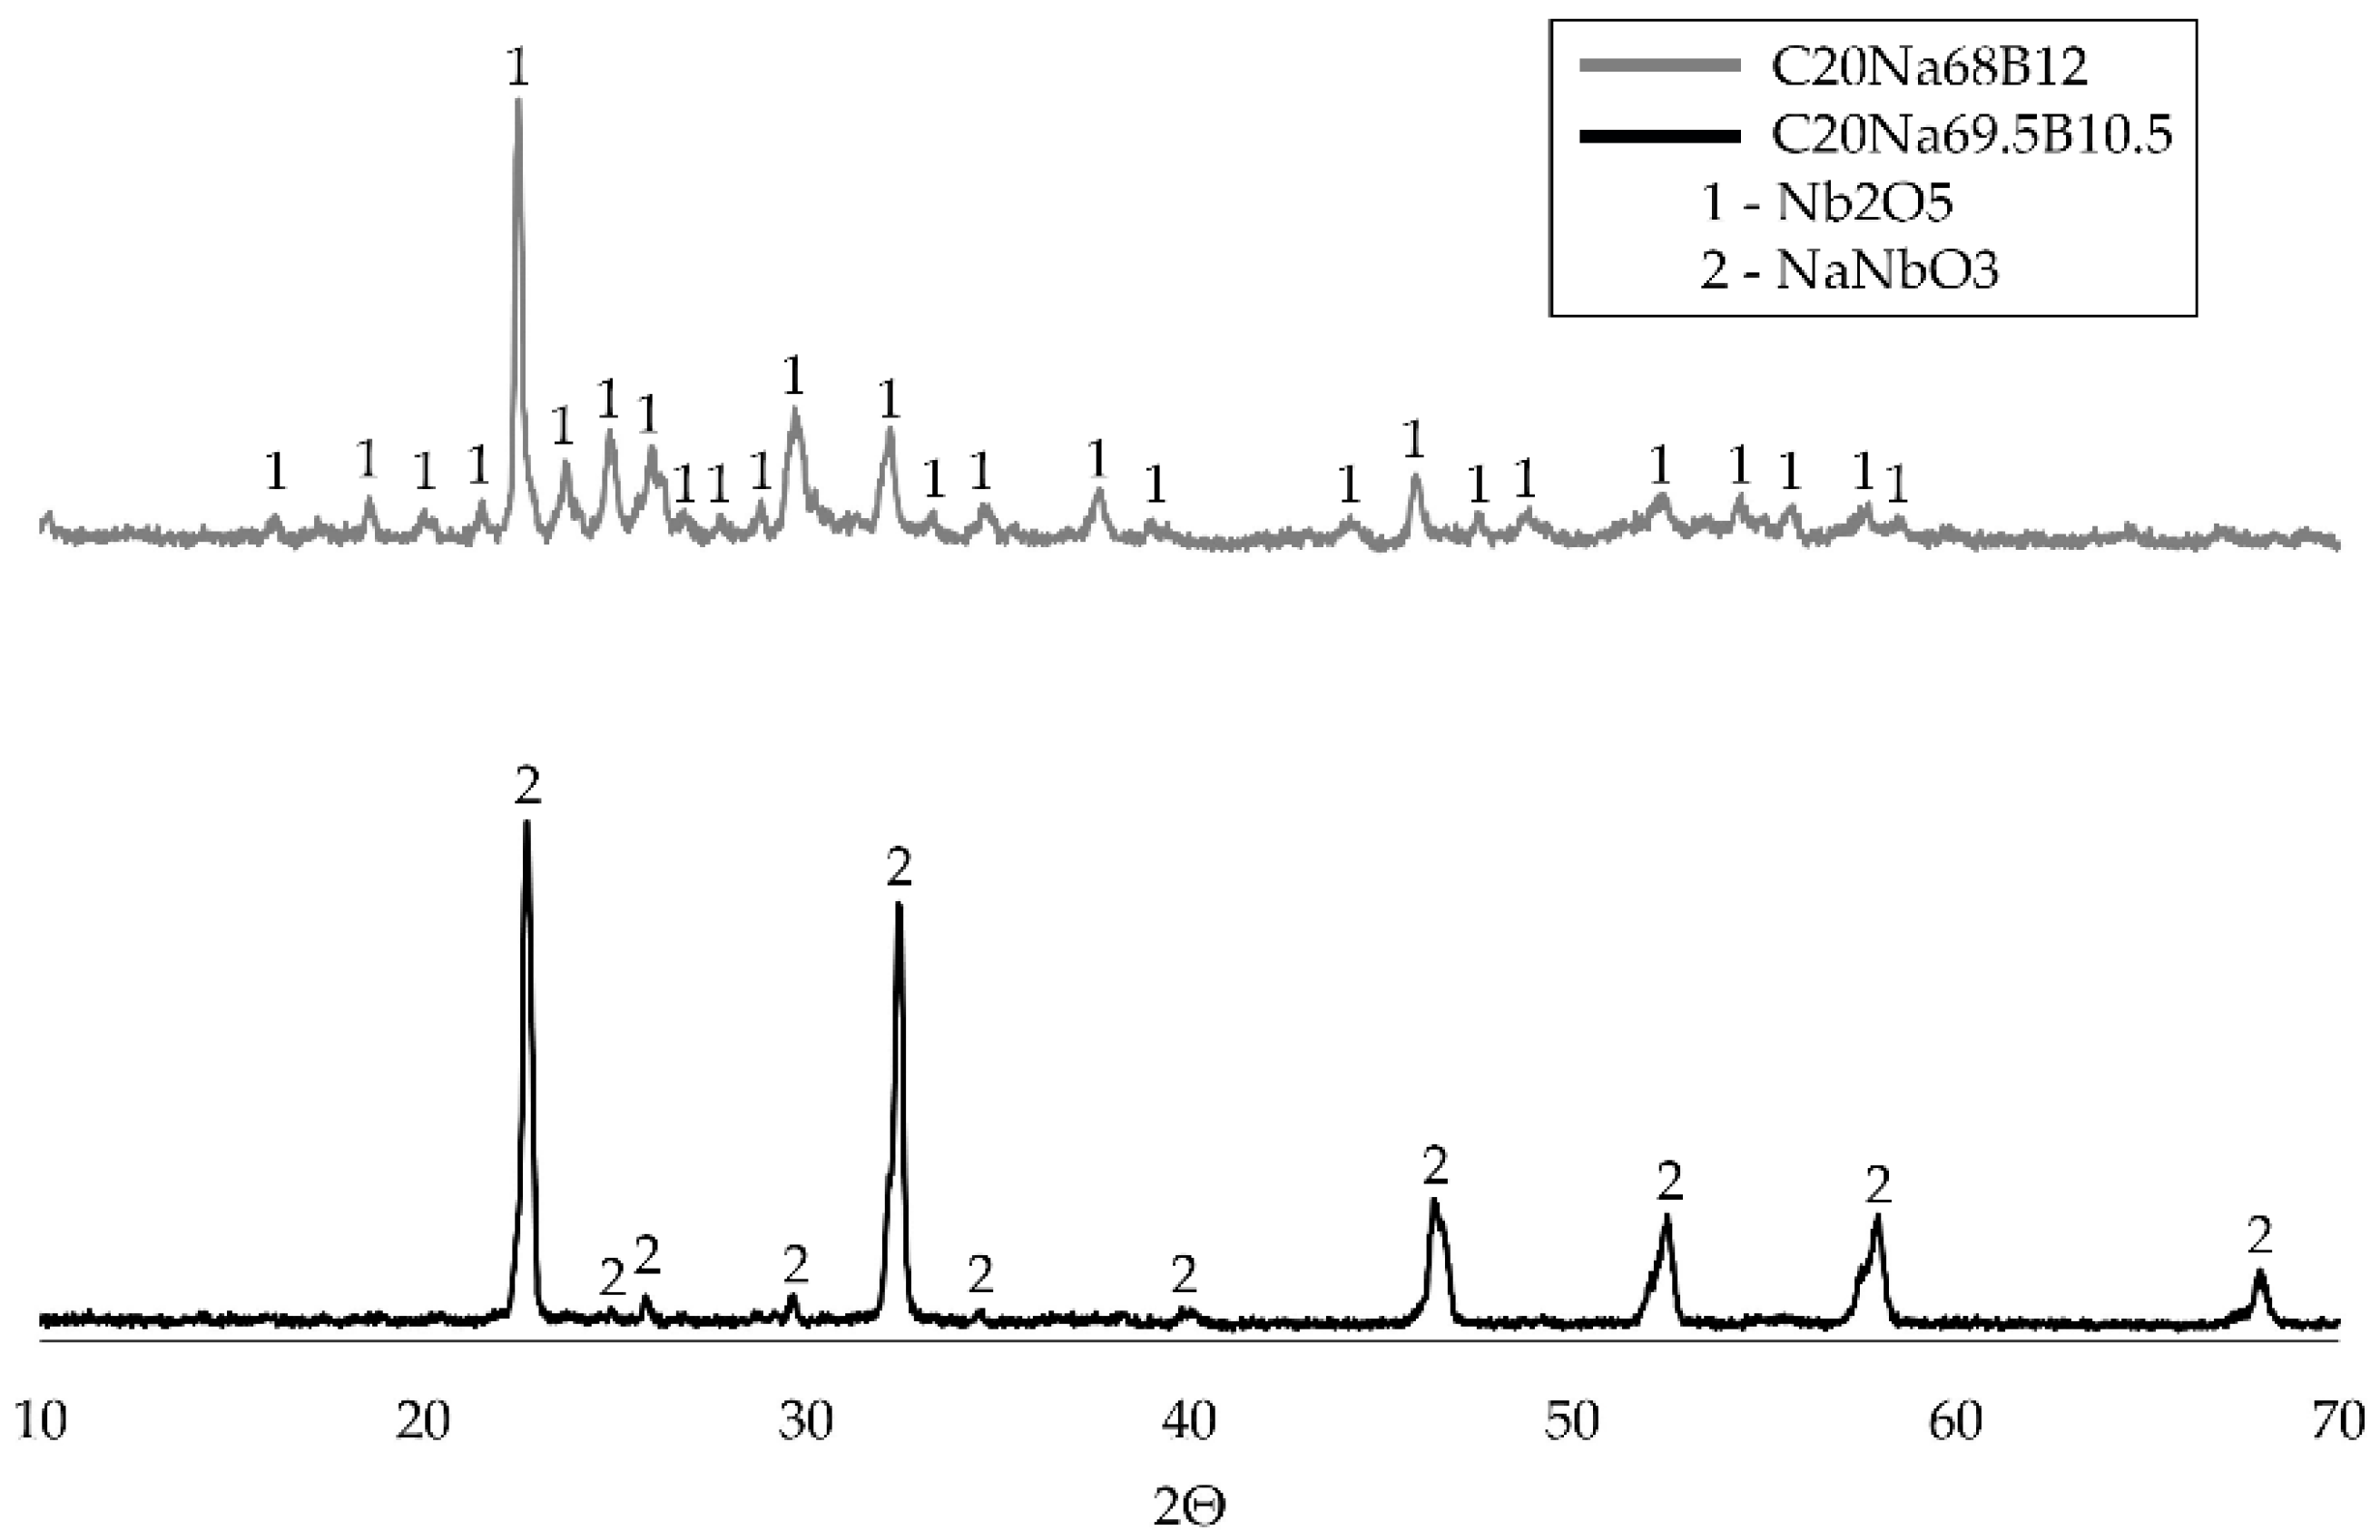
Figure 7 shows that the main peak of the sample retained on the filter corresponds to the formation of Lueshite (NaNbO
3) for formulation C20Na69.5B10.5, and niobium pentoxide (Nb
2O
5) for formulation C20Na68B12.
The XRD analysis results of samples C20Na69.5B10.5 and C20Na68B12, combined with previous observations on chemical composition, allow for important interpretations regarding the behavior of niobium during the precipitation and calcination processes:
The detection of Nb2O5 in sample C20Na68B12 confirms that the calcination process was successful in achieving the desired phase. Niobium pentoxide is the expected product of niobium oxidation under appropriate temperature, time, and furnace atmosphere conditions. This suggests that the combination of precipitation with guanidine carbonate and subsequent calcination at 900 °C for 1 h was effective for this sample. The lower sodium (1.31%) and boron (0.18%) concentrations enabled niobium to remain in a form more suitable for complete oxidation to Nb2O5.
Conversely, the predominant presence of Lueshite (NaNbO
3) in sample C20Na69.5B10.5 suggests that the calcination process did not primarily yield Nb
2O
5 but instead led to the formation of a sodium–niobium compound. This may be related to the high sodium content observed in the chemical analysis of C20Na69.5B10.5, which showed a significantly higher sodium concentration (9.48 wt%) than C20Na68B12 (1.31 wt%). This excess sodium likely favored the formation of NaNbO
3, hindering complete niobium oxidation to Nb
2O
5. Sodium may interfere with full oxidation by stabilizing the NaNbO
3 (Lueshite) phase during calcination. Since potassium and sodium are both alkali metals and behave similarly, these findings may align with previous studies [
4,
12].
Therefore, the presence of NaNbO3 (Lueshite) in sample C20Na69.5B10.5 indicates that the precipitation process was less effective at removing sodium, resulting in the formation of an undesired phase during calcination. In contrast, sample C20Na68B12, with a lower sodium content, achieved the formation of Nb2O5, indicating a more efficient overall process and once again demonstrating the important roles of both boron and sodium in the extraction route.
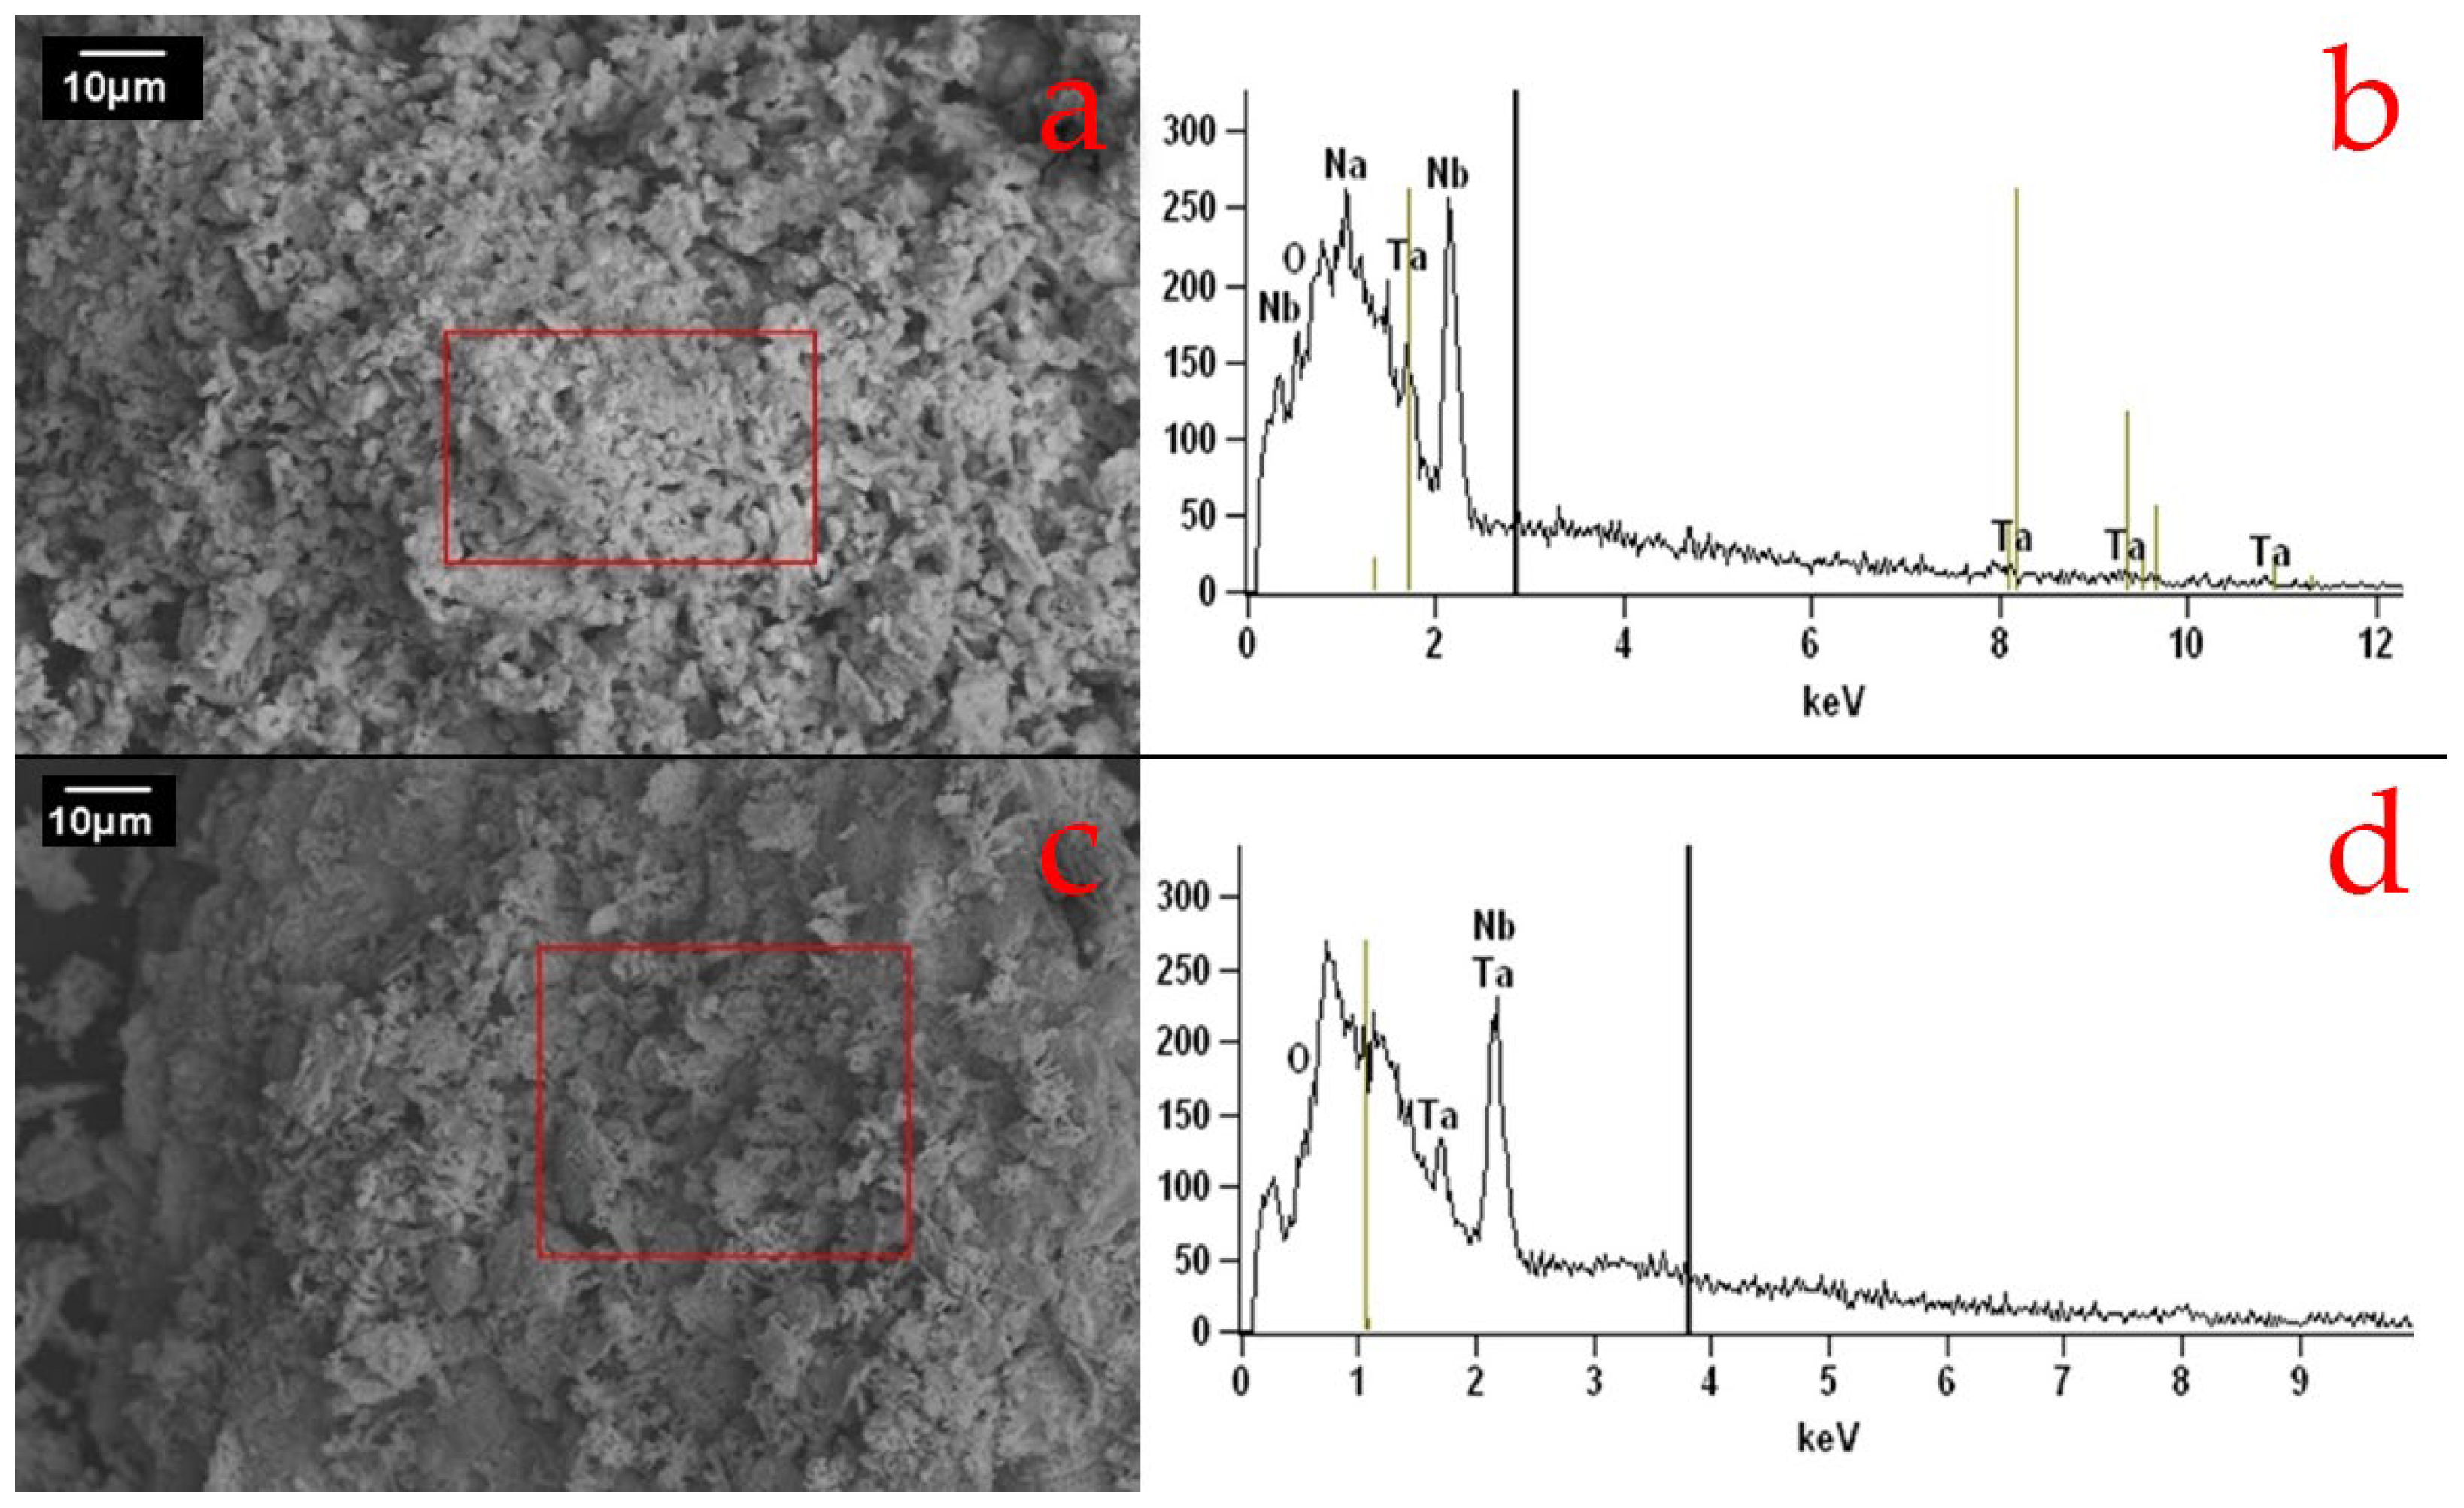
Figure 8 shows the SEM images and EDS spectra of the compositions. The analysis reveals an irregular morphology with submicrometric pores of varied shapes and sizes for compositions C20Na69.5B10.5(2) and C20Na68B12(2). Tanvar et al. [
18,
26] reported similar SEM images, showing niobium oxide particles with submicrometric porosity; such pores are typically attributed to the presence of organic matter.
The EDS spectrum of C20Na69.5B10.5(2) displays peaks of niobium, tantalum, sodium, and oxygen, likely due to the formation of niobate phases. Meanwhile, the EDS spectrum of C20Na68B12(2) shows peaks of niobium, tantalum, and oxygen, probably corresponding to the formation of oxide phases.
