Article

Evolutionary Model of the Sepid-Sarve Manto-Type Copper Mineralization, Doruneh Fault Volcanic-Plutonic Belt (Central Iran Domain, NE Iran): An Integrated Geological, Geochemical, Fluid-Inclusion and Stable O–S Isotope Study

1
Department of Geology, Faculty of Science, Lorestan University, Khorramabad 68151-44316, Iran
2
School of Geology, College of Science, University of Tehran, Tehran 14155-6619, Iran
3
Department of Lithospheric Research, Faculty of Earth Sciences, Geography and Astronomy, University of Vienna, 1010 Vienna, Austria
4
Department of Geology, Faculty of Science, Shahid Chamran University, Ahvaz 61357-83151, Iran
*
Author to whom correspondence should be addressed.
Minerals 2025, 15(12), 1246; https://doi.org/10.3390/min15121246
Submission received: 17 September 2025 / Revised: 27 October 2025 / Accepted: 6 November 2025 / Published: 25 November 2025

Abstract

The Sepid-Sarve copper deposit is part of an Eocene volcano-sedimentary sequence located in the southern Sabzevar Zone. The copper mineralization occurs at the contact between pyroclastic and lava units with various limestone layers (including marly, Nummulitic, sandy, and clastic limestones). The ore minerals consist of malachite, azurite, chalcocite, digenite, cuprite, tenorite, covellite, and occasionally native copper. The associated hydrothermal fluids show moderate to high salinities, ranging from 3.08 to 13.38 wt.% NaCl equivalent, with homogenization temperatures between 90 and 356 °C, indicating fluid mixing during ore formation. Chalcocite is rarely accompanied by quartz, suggesting low silica content in the ore-forming fluids. The δ34S values of sulfide samples from the Sepid-Sarve deposit range from −23.9 ± 0.3‰ to −2.9 ± 0.2‰, while δ34S values of hydrothermal H2S range from −24.1 ± 0.3‰ to −21.0 ± 0.3‰. The δ18O values of hydrothermal fluids associated with mineralization fall within the range of basaltic rocks, meteoric waters, and sedimentary rocks. Geochemical variations in major and trace elements suggest the involvement of continental crustal contamination in the magmatic evolution. The studied volcanic rocks fall within the calc-alkaline to shoshonitic fields, formed in a continental arc setting, and are derived from an enriched mantle source influenced by subduction-related fluids. These rocks are characterized by HREE depletion, moderate LREE enrichment, and a weak negative Eu anomaly. Based on the results, the Sepid-Sarve deposit is classified as a stratabound (Manto-type) copper sulfide deposit, formed in a volcano-sedimentary setting associated with a subduction-related magmatic arc environment.

1. Introduction

Mesozoic Manto-type Cu deposits are classified into two categories: sedimentary-hosted deposits (e.g., Cerro Negro) and volcanic-hosted deposits (e.g., Mantos Blancos and Buena Esperanza) [1]. Three main theories have been proposed for the genesis of these ore deposits: (a) syngenetically formed volcanogenic deposits [2,3,4]; (b) epigenetic deposits formed by magmatic emanations from associated plutonic intrusions [5,6]; and (c) epigenetic deposits formed by fluid–rock interaction involving Cu-bearing host rocks [7,8,9,10,11].
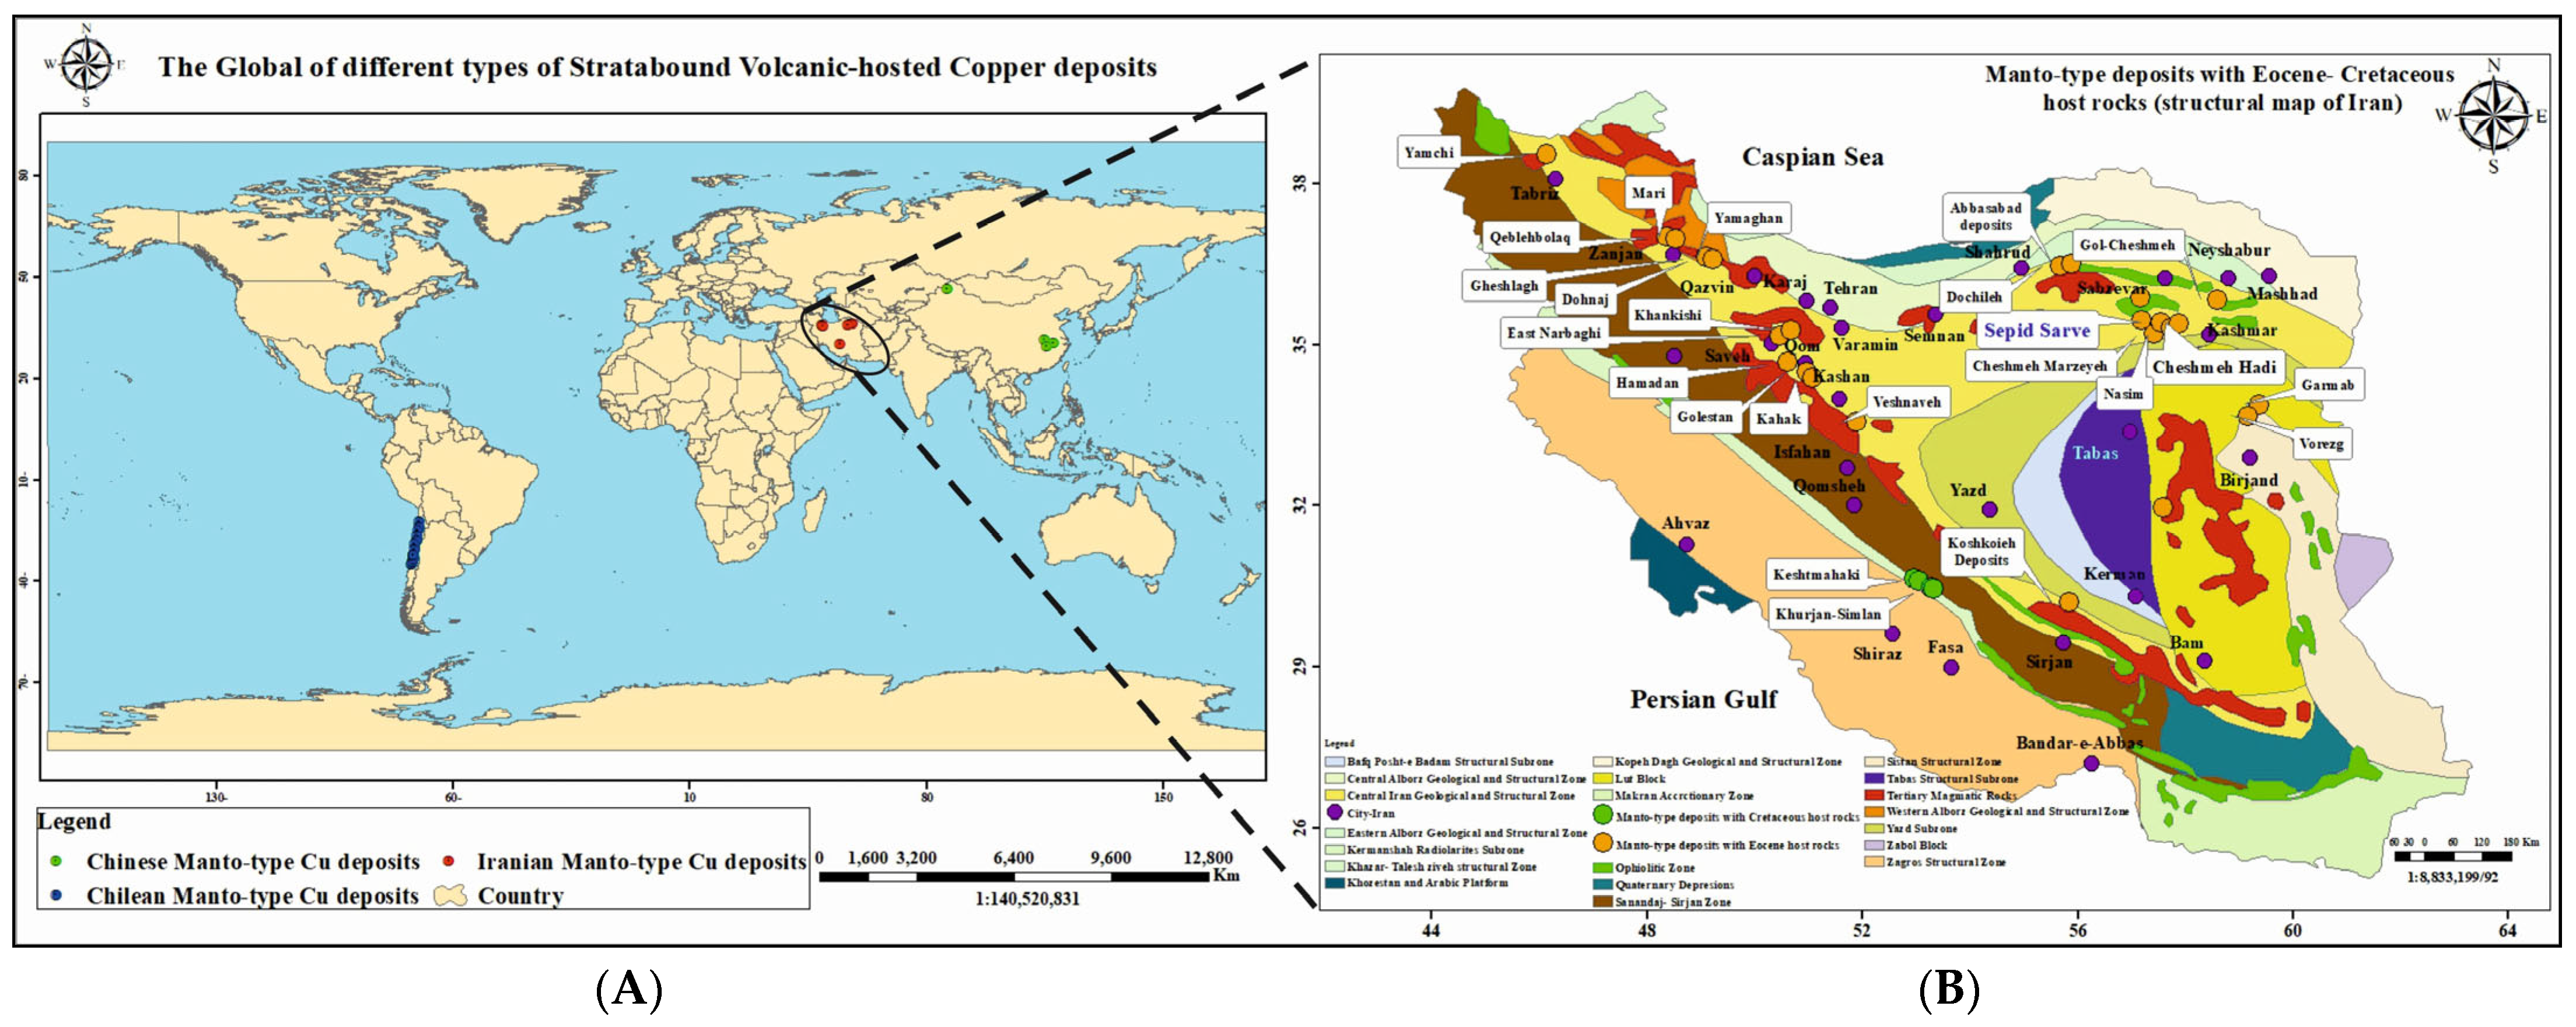
Most Manto-type copper deposits are hosted within stratigraphic sequences predominantly composed of andesitic to basaltic rocks. These sequences correspond to the Mesozoic era (in Chile and Iran), the Proterozoic to Triassic (in North America), the Late Silurian to Early Devonian (in China), and the Cenozoic (in Iran) (Figure 1A). The presence of Manto-type copper mineralization in Iran was first identified and reported by Samani at the Veshnaveh deposit (Qom Mountains) in 2000. Since then, a large number of stratabound copper deposits in Iran have been studied from both scientific and exploration perspectives (Figure 1 and Figure 2). These deposits mainly occur in volcanic regions and volcanic-plutonic belts and are often referred to as “Manto-type.” They have been investigated by Samani, 2001 [12]; Nezafati and Stöllner, 2017–2023 [13]; Fazeli, 2002 [14]; Boveiri Konari et al., 2011–2013 [15]; Abolipour et al., 2015 [16]; Alizadeh et al., 2013 [17]; Maghfouri and Movahednia, 2015 [18]; Maghfouri et al., 2017 [19]; Kaboodi et al., 2019 [20]; Fazli et al., 2021 [21]; Jiba et al., 2021 [22] and Salehi and Rasa, 2016 [23], and they represent economically significant copper deposits in Iran (Figure 1B). Accordingly, the proper identification and understanding of these types of mineralization can offer a new perspective in the study of copper geology and resource potential in Iran.
To date, more than 30 major Manto-type copper deposits and numerous copper occurrences ranging in age from Cretaceous to Eocene have been identified in Iran (e.g., Veshnaveh deposit [14], Keshtmahaki [15], Koshkoiye [16], Vorezg-Qayen copper deposit [17], Abbas Abad copper deposit [18], Mari Cu(Ag) Manto copper deposit [19], Kahak Manto-Type copper deposir [20], Narbaghi deposit [21], Yamaghan Manto-Type Cu(Ag) deposit [22] and Madan Bozorg Cu deposits, Abbas Abad [23]). Some of these deposits were historically exploited in ancient times—for example, Veshnaveh deposit [13,14] and Narbaghi deposit [21] (Figure 1B).
Approximately 85% of Iran’s Manto-type copper deposits occur within the UDMA, the Sabzevar Zone (north of the Doruneh Fault), and the AMA. This zone is composed of extensive magmatic rocks and includes the largest Iranian ophiolite mélange that is considered as remnants of a Cretaceous back-arc oceanic basin that formed by hyperextension in the Iranian plateau due to the initiation of Neo-Tethys subduction [24,25,26]. The ore deposits of the Sabzevar Zone can be separated into two groups, based on their different metal association, spatial distribution, and geodynamic setting. Notable examples include the Abbasabad deposit in the Alborz range, Keshkuiyeh in the UDMA, and Sepid-Sarve and (e.g., Abri, Rahbari, and Cheshmeh Marzeyeh cu deposit [27], Bonaward plutonic complex [28], Baharieh copper deposit [29], Kal Abri copper deposit [30], Nasim copper deposit [31], Sharifabad copper deposit [32], Madan Bozorg [33], Grik and Gukhab [34], Golcheshmeh [35], Cheshmeh-Hadi [36]) in the southern Sabzevar Zone (north of the Doruneh Fault). The majority of the deposits are being actively explored. The Cheshmeh Marzeyeh cu deposit [27], Kal Abri copper deposit [30], Nasim copper deposit [31], Madan Bozorg [33] and Cheshmeh-Hadi [36] deposits are presently mined (Figure 1).
This study characterizes the geological setting and mineralization style of the Sepid-Sarve deposit, and proposes a large-scale mineralization model integrated with the tectono-magmatic evolution of the region, based on newly acquired field and analytical data. The results provide a refined exploration framework for identifying new Manto-type copper targets in similar volcano-sedimentary settings, improve the understanding of ore-forming processes in the Sabzevar Zone, and offer practical guidelines for more effective exploration and resource development strategies in Iran’s metallogenic provinces.
Figure 1. (A) Global distribution of different types of stratabound volcanic-hosted copper deposits [2,6]. (B) including Manto-type copper deposits in Iran, along with a map showing the spatial distribution of Manto-type deposits based on the age of their host rocks within the major tectonic domains of Iran [37,38].
Minerals 15 01246 g001
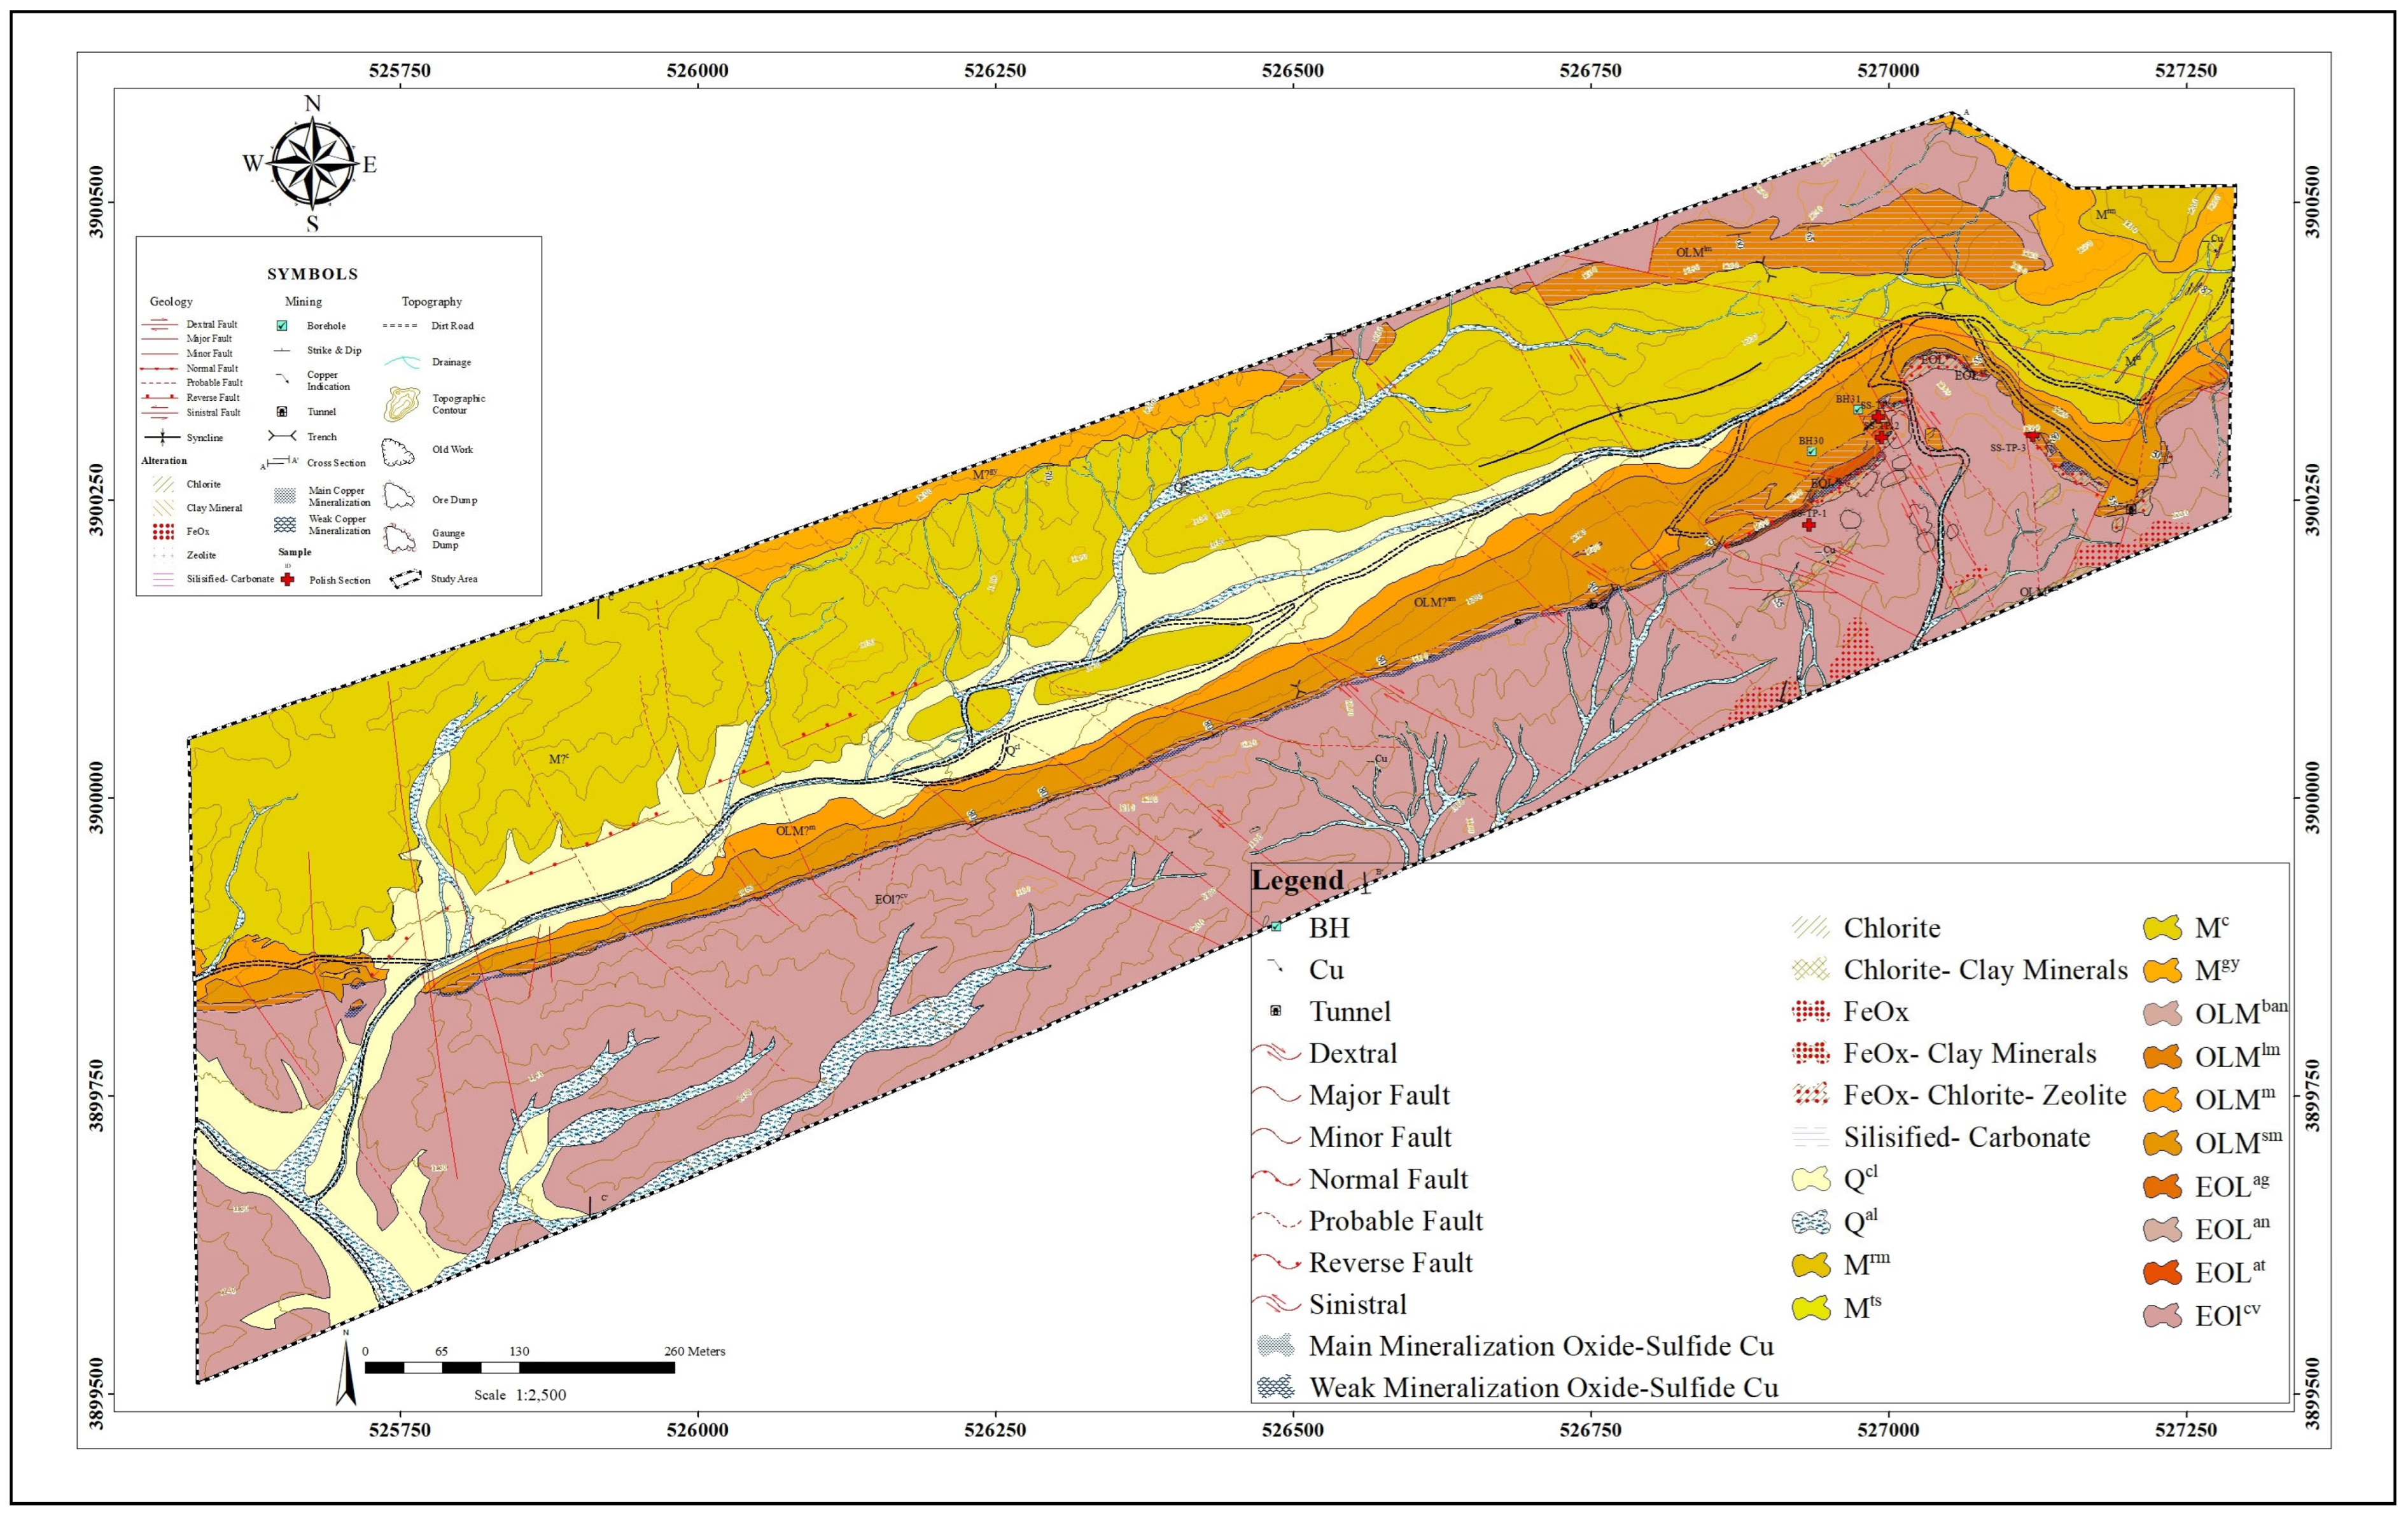
Figure 2. Detailed 1:2500 Geological Map of the Eastern Part of the Sepid-Sarve Copper Deposit.
Minerals 15 01246 g002

2. Geologic Setting

2.1. Regional Geology and Tectonic Setting

The Cretaceous mineralized orebodies consist of Cr deposits associated with serpentinized peridotites, VMS deposits, and Mn ore deposits in volcano-sedimentary sequences [26]. The Cenozoic mineralization in the Sabzevar Zone includes Cu- Au porphyry, red-bed, and Manto-type Cu deposits. The stratigraphic sequence and host rock lithotypes of the Manto-type deposits of the Sabzevar Zone are very similar to the Cu-(Ag) deposits of the AMA, which are also hosted by the Eocene volcanic rocks. Manto-type deposits in Iran are typically associated with andesitic lava flows. The Eocene host rocks (Eocene volcano-sedimentary sequences) are the most common host lithologies for Manto-type copper–silver deposits in Iran. These deposits are mainly concentrated within the Urumieh–Dokhtar Magmatic Arc (UDMA) [21], the Alborz Magmatic Arc (AMA), the Sabzevar Zone, and the Lut Block. Vein-type mineralization within andesitic lava flows highlights the critical role of stratigraphic control in the formation of Iran’s Manto-type copper deposits. In the Sepid-Sarve copper deposit, located ~67 km west of Bardeskan and 17 km from Doruneh village in southwestern Khorasan Razavi Province, mineralization is hosted by Eocene volcanic rocks and restricted to specific stratigraphic horizons. The deposit lies within the Doruneh sheet, along the northern margin of Central Iran and the southern Sabzevar Zone, an area shaped by intense Cenozoic magmatism and activity along the Doruneh Fault. This tectonic setting has exposed lithological units ranging from Precambrian to Quaternary. Despite the high potential of volcano-sedimentary sequences for Manto-type copper mineralization, limited understanding of their genetic models and mineralization controls has led to the abandonment of many deposits before achieving economic results.
According to the tectonostratigraphic framework of Iran [39,40], the study area lies within the Sabzevar Zone of the Central Iranian terrane. The Bardeskan region can be subdivided into two distinct domains: north of the Doruneh Fault, where the terrain is mountainous and morphologically diverse; south of the fault, except for the southeastern hills associated with the Ozbak-Kuh outcrops, lies a subsiding basin with an average elevation of ~851 m above sea level. This basin is extensively covered by Quaternary deposits and exhibits geomorphic features such as alluvial terraces, alluvial fans, mudflats, and salt flats.
The most prominent geotectonic feature is the east–west-trending Doruneh Fault, which separates the northern mountainous domain from the southern plains. The Sepid-Sarve area lies within the 1:250,000 Bardeskan quadrangle [41] and the central portion of the 1:100,000 Doruneh geological map [42]. Two major geological characteristics define this region: (1) intense Mesozoic folding, metamorphism, and plutonism; and (2) extensive Cenozoic volcanic activity. Central Iran, however, is not a homogeneous terrane but a mosaic of distinct structural blocks, each with unique geological features resulting from extensive faulting.
Eocene volcano-sedimentary rocks are widely exposed throughout the region, forming a belt with substantial potential for Manto-type copper mineralization. In the Sepid-Sarve deposit, mineralization is hosted by Eocene volcanic rocks and restricted to specific stratigraphic horizons. The Doruneh quadrangle, along the northern margin of Central Iran and the southern Sabzevar Zone [37,38], is particularly significant due to intense Cenozoic magmatism and the activity of the Doruneh Fault. These tectono-magmatic processes have exposed a wide range of lithologies, from Precambrian to Quaternary.
The occurrence of vein-type mineralization within andesitic lava flows underscores the critical role of stratigraphic control in the localization and formation of metals in Iran’s Manto-type copper deposits. Stratigraphic positioning is therefore considered a key factor in ore formation. Furthermore, the lateral and vertical continuity of mineralization is strongly influenced by host-rock lithology, extensional fault systems, and the degree of fracturing.

2.2. Ore Deposit Geological Characteristics

The Sepid-Sarve copper deposit is hosted within an Eocene volcano–sedimentary sequence in the southern Sabzevar Zone. This sequence comprises intermediate to mafic volcanic units (porphyritic to mega-porphyritic andesite, pyroxene andesite, and basalt), pyroclastic rocks (tuff and agglomerate), and sedimentary strata including fossiliferous limestone (bearing Nummulites, Plesiopoda, and Brachiopoda), calcareous sandstone, detrital limestone, conglomerate, siltstone, shale, gypsiferous marl, and alluvial terrace deposits.
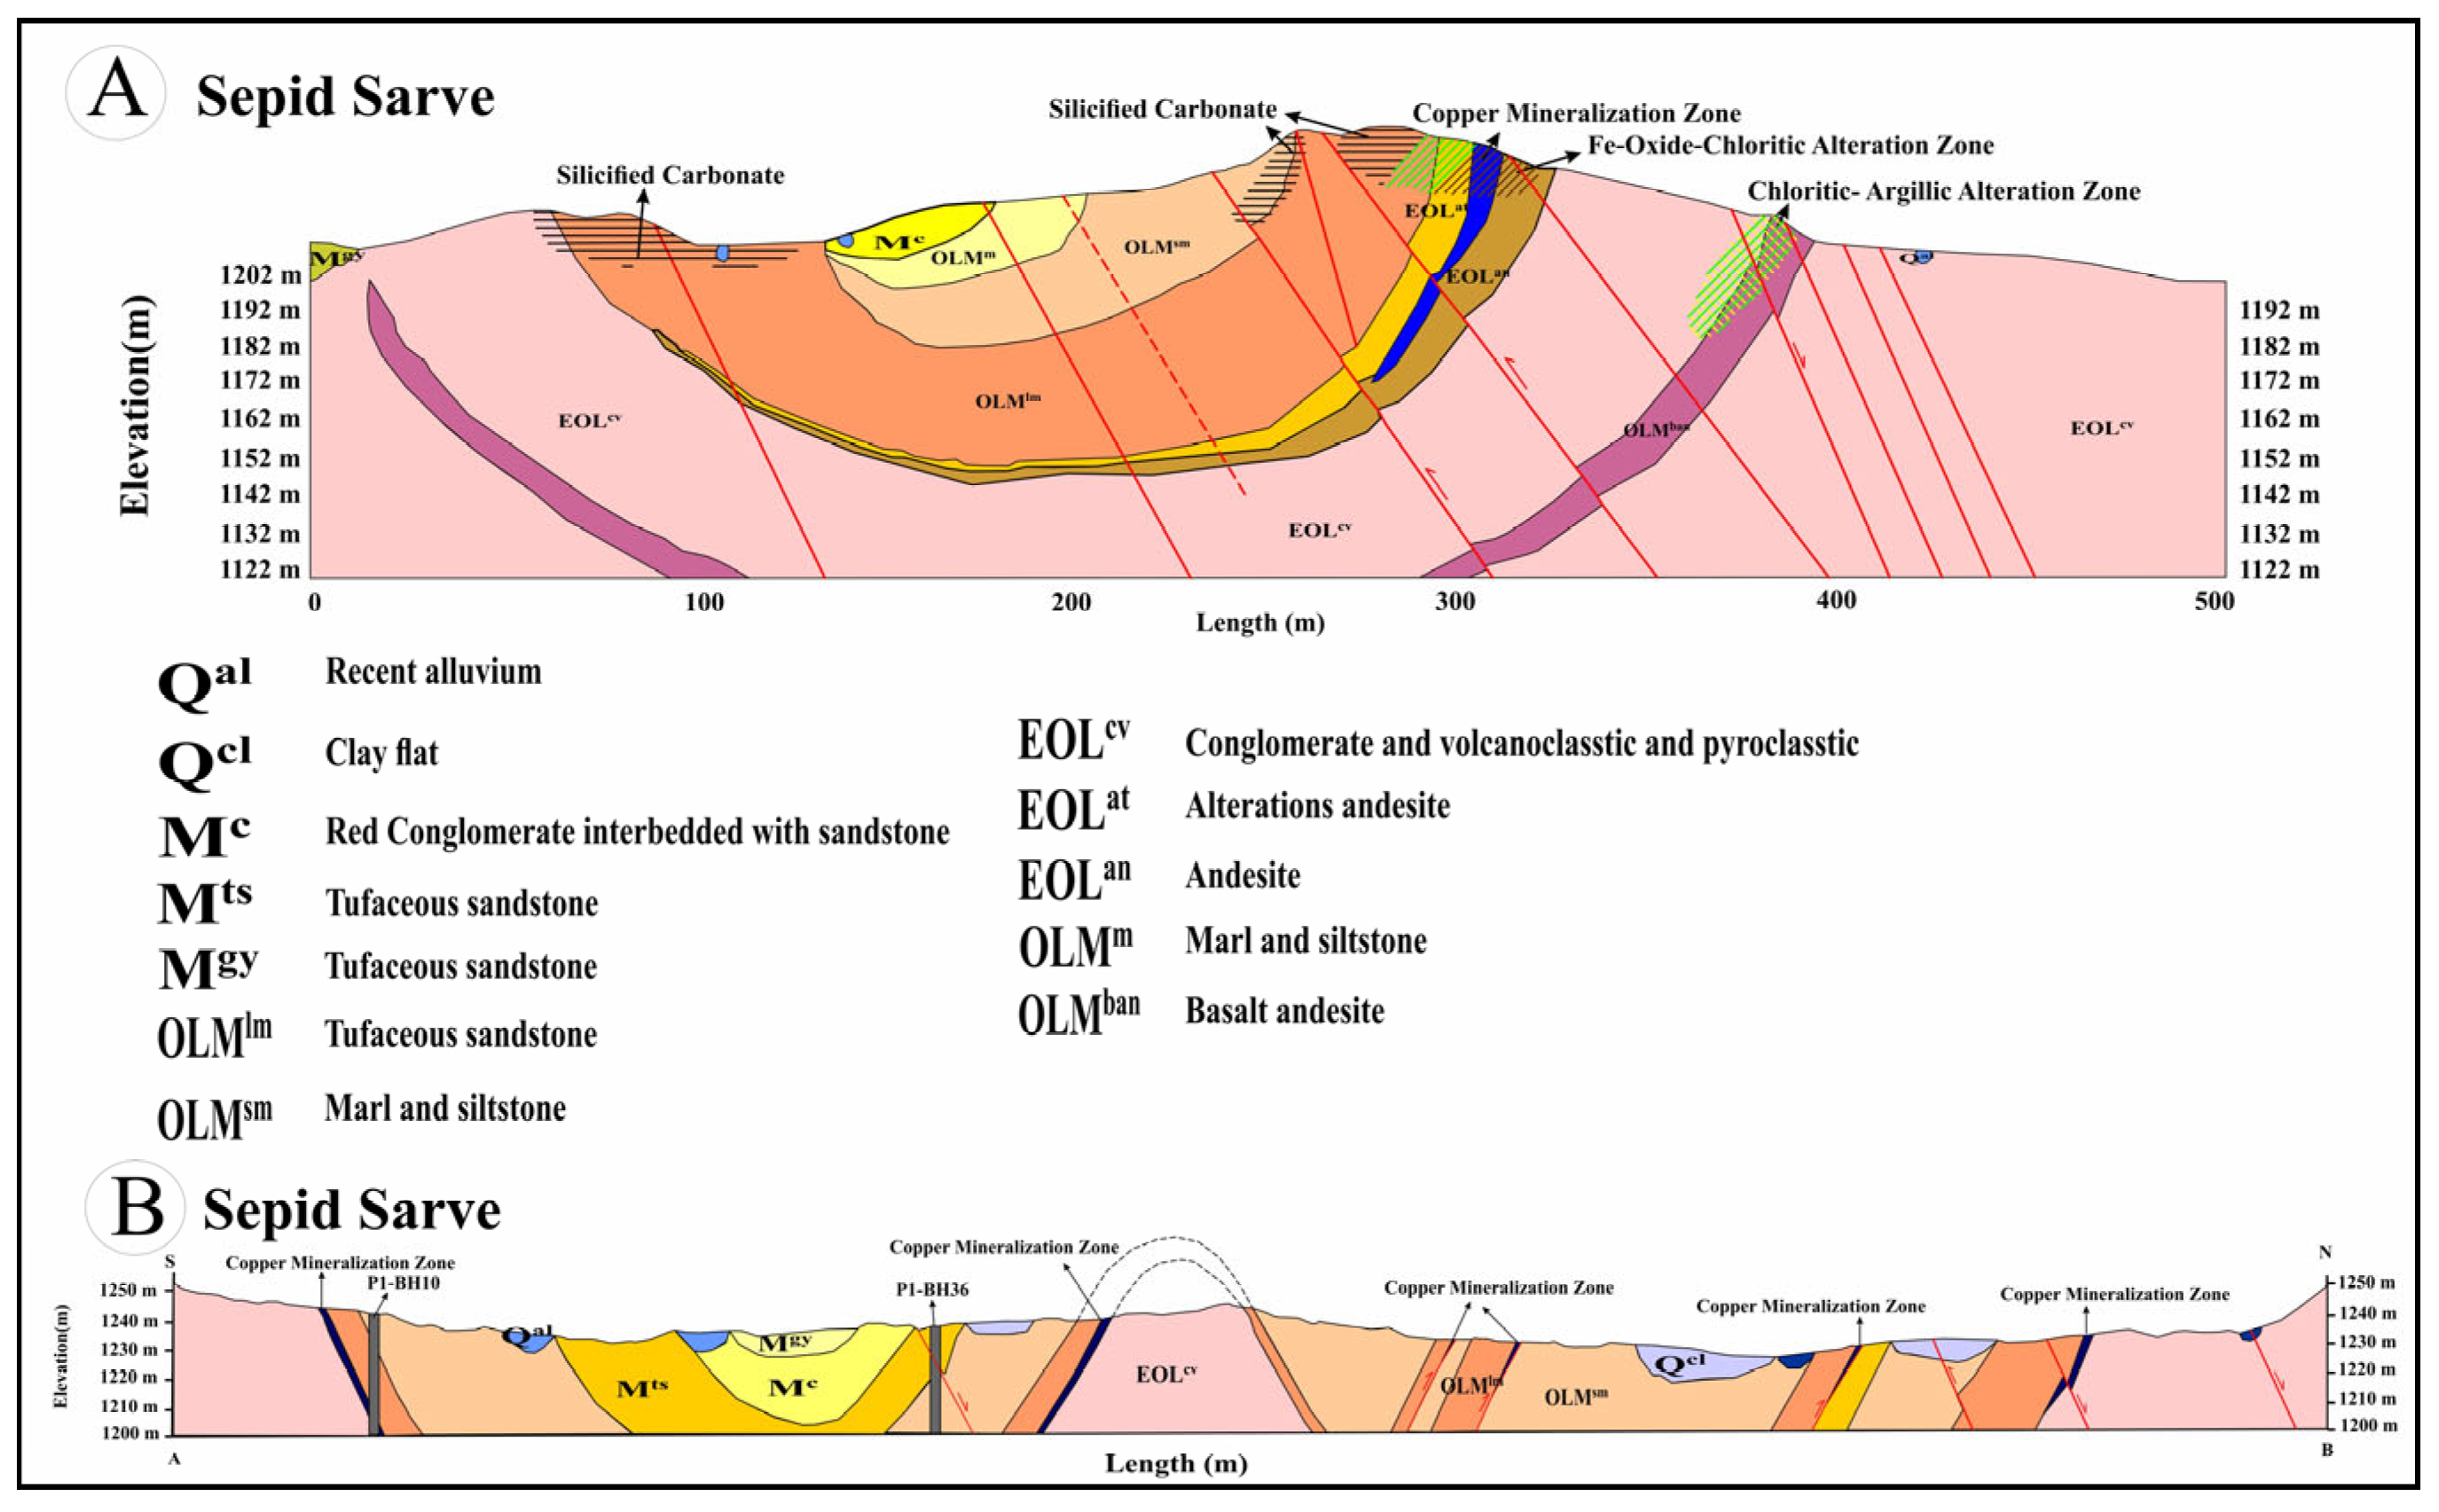
A distinctive feature of the region is the widespread development of Cretaceous volcanic–tuffaceous rocks and Eocene volcanic and pyroclastic units, reflecting intense volcanic activity. In the central part of the study area, Middle Eocene sediments host a thick volcanic–pyroclastic complex dominated by andesite, pyroxene andesite, basaltic andesite, and basalt, typically dark green to black in color and often displaying bedding and banding. In some sections, green to red agglomerates are interbedded within this volcanic package. Copper mineralization, mainly malachite, occurs along fractures within the andesites (Figure 2). Overlying this complex is a pyroclastic sequence of agglomerate, tuff, lapilli tuff, and andesitic tuff with colors ranging from red to green.
Upper Eocene sediments consist of alternating sandstone, siltstone, silty marl, and thin-bedded limestone, generally light green to cream in color. The Upper Eocene volcanic–pyroclastic succession in the Sepid-Sarve deposit area can be divided into four units. The first unit is composed of andesite, porphyritic andesite, and pyroxene andesite (green to dark gray), with amygdaloidal textures formed by alteration of phenocrysts (Figure 2). Vesicles are typically filled with secondary calcite. Above this lies a volcanic complex of basalt and basaltic andesite (black), overlain by Oligo–Miocene sedimentary deposits, representing the final phase of Eocene volcanism. These volcanic rocks exhibit gentle morphology and are locally vesicular, with vesicles filled by calcite, silica, and occasionally zeolite.
Several fault systems are present in the study area, including E–W and N–S trending faults, as well as dextral strike-slip faults trending NW–SE and NE–SW, the latter being dominant. In places, these faults displace mineralized zones. In the easternmost part of the deposit, overturned limestone units indicate intense tectonic activity. Here, multiple NW–SE strike-slip faults have disrupted the limestone layers and displaced copper mineralization hosted at the contact between limestone and volcanic units (Figure 2).

2.2.1. Conglomerate

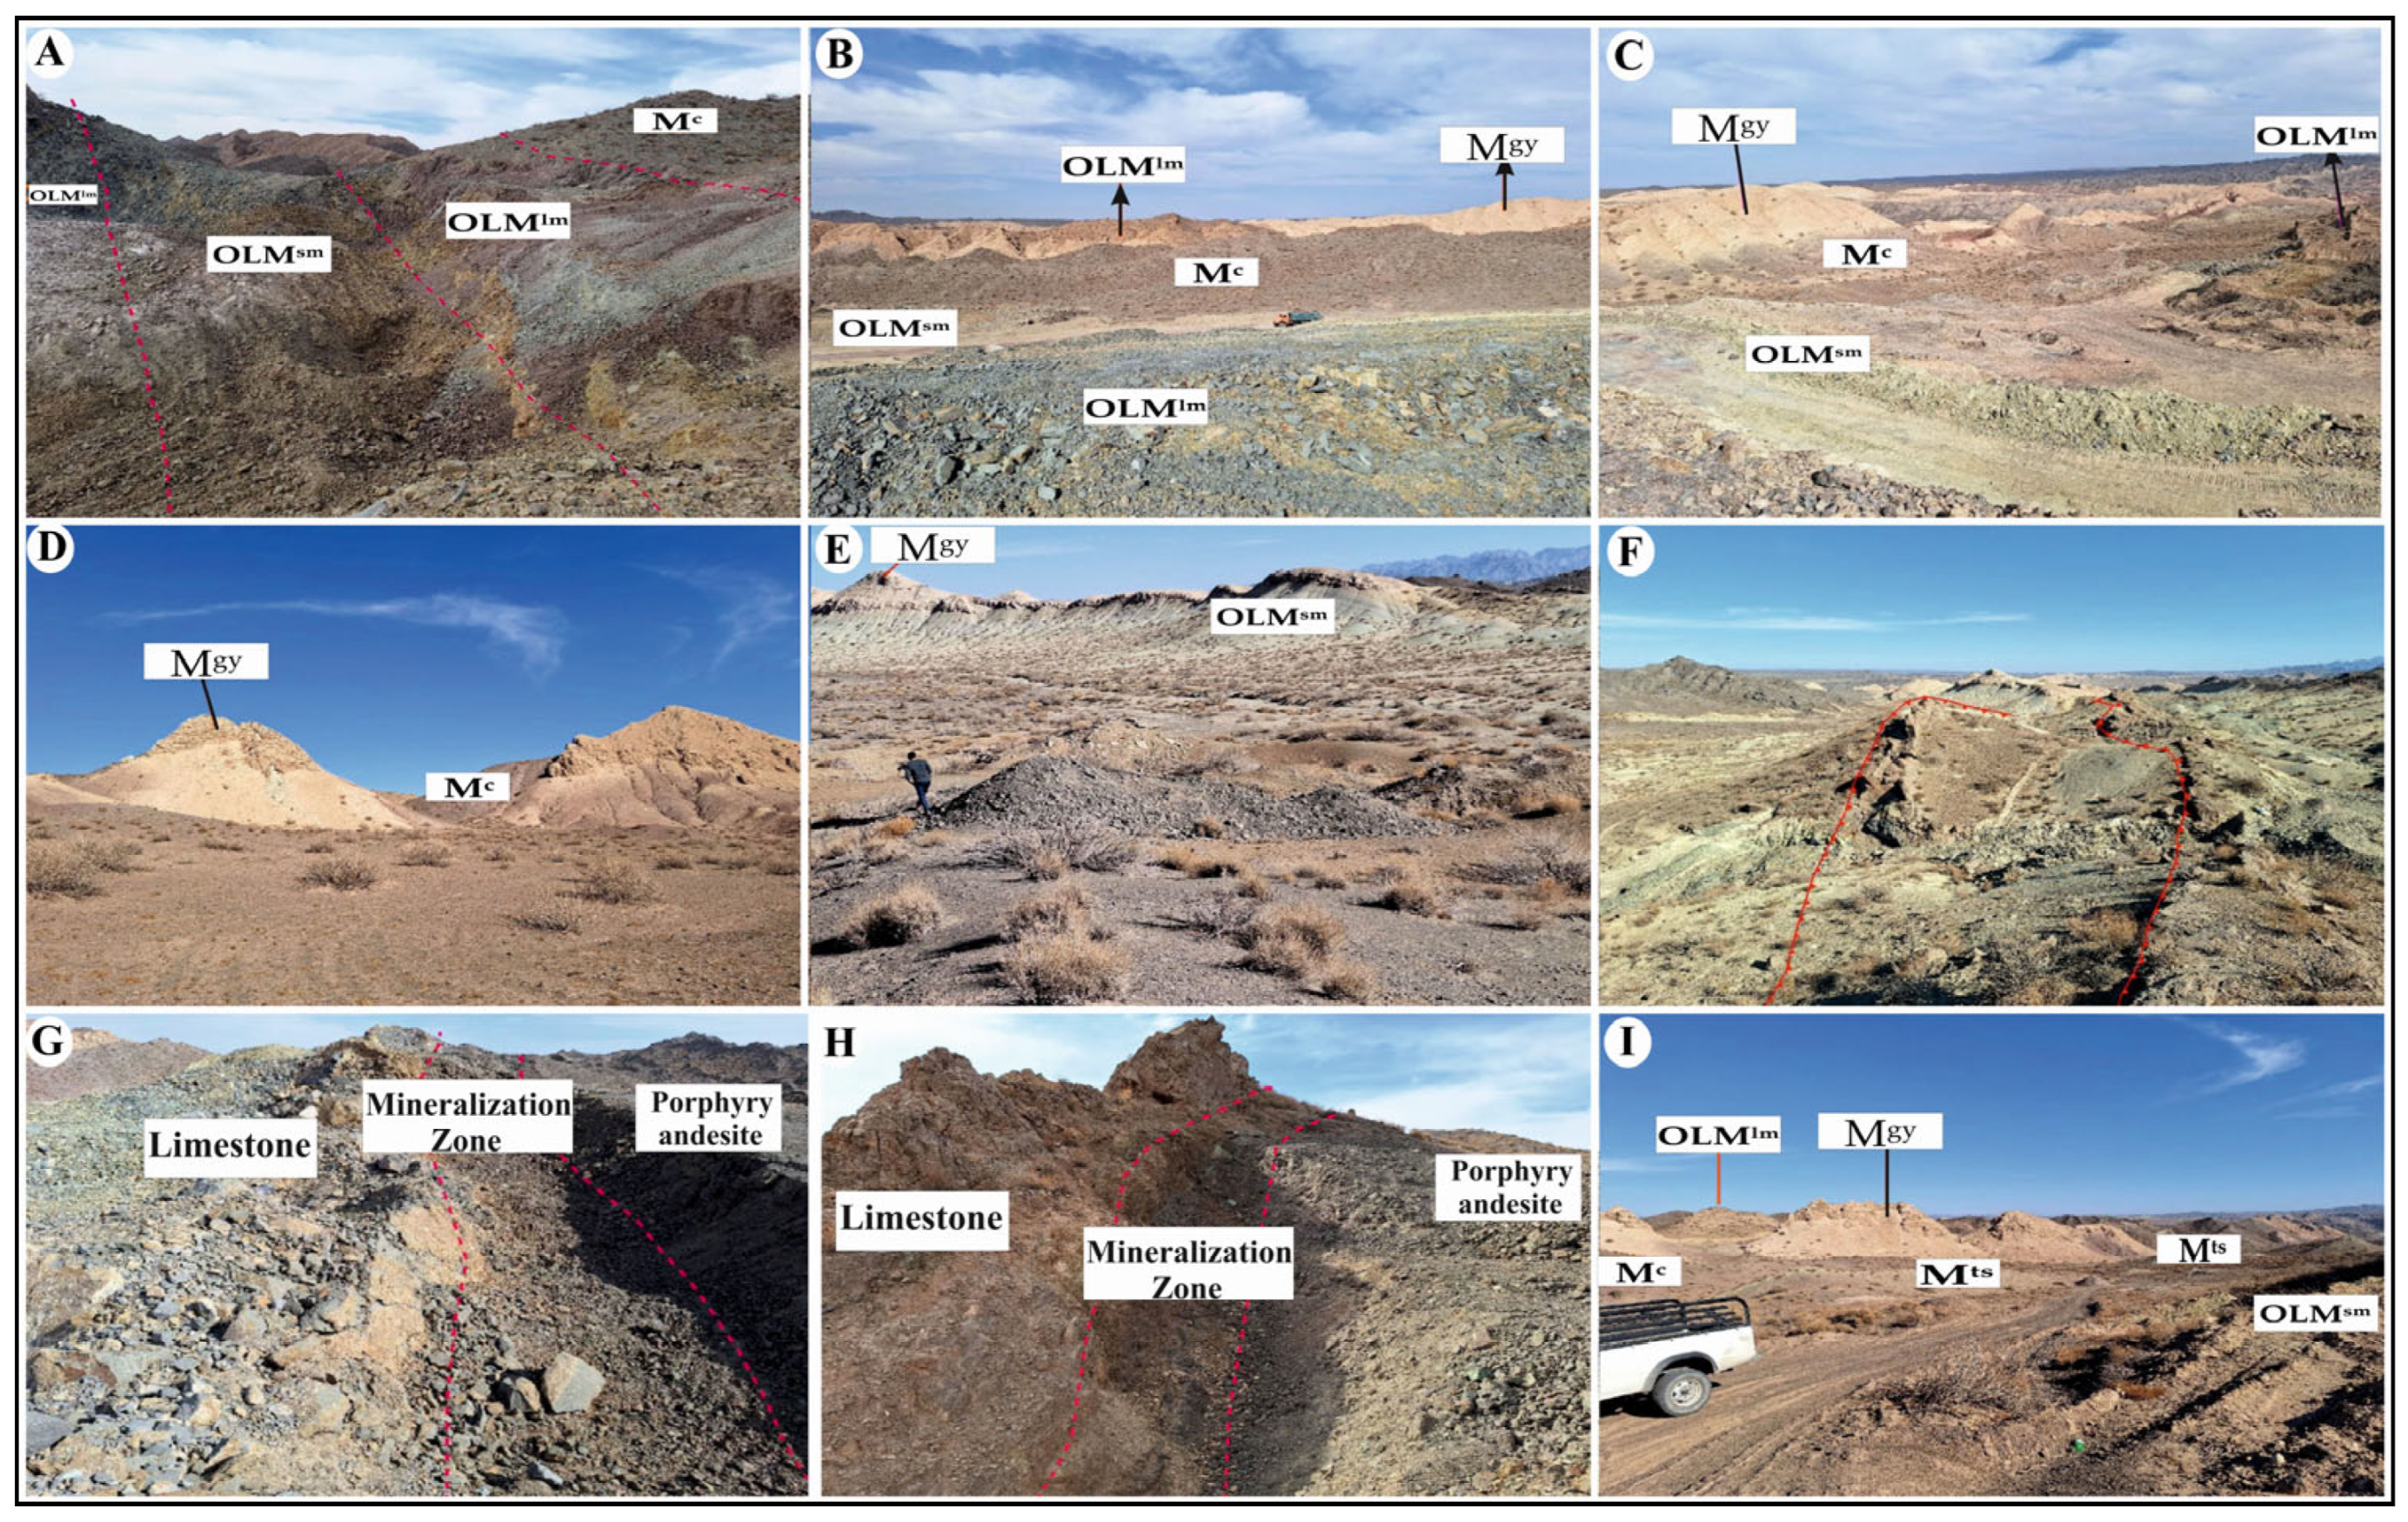
The EOLcv unit, representing the oldest lithological formation exposed in the Sepid-Sarve copper deposit area, is widely exposed in the southern, central, and northern parts of the region and constitutes one of the most prominent geological units with significant thickness (Figure 3E,F). One of the most important features of this unit is the occurrence of ore zones at the contact between this unit and a Nummulitic Eocene limestone (Figure 3A). Outcrops of this unit exhibit a hilly to rugged topography, particularly in the southern part, where it forms the highest elevations of the area and structurally defines the outer limb of an anticline.
Field exposures display varied coloration, ranging from brown and red to dark gray, and are composed of a volcano-sedimentary conglomerate sequence interbedded with volcaniclastic rocks and volcanic lava flows. The conglomerates, forming the main component of this unit, consist of coarse- to medium-grained, poorly sorted clasts with moderate to good roundness. The clasts are predominantly composed of older volcanic rocks, including andesitic and basaltic-andesitic fragments (Figure 3E).
Intermediate to mafic lava flows, including andesite, basaltic andesite, and pyroxene andesite, are present within this unit, particularly thickened in the eastern parts (Figure 3F).

2.2.2. Andesitic and Basaltic Andesite

The Eocene andesitic and basaltic andesite volcanic units show mineralogical, textural, and lithological diversity. These lava flows are conformable and parallel to adjacent units. Fresh andesites are dark gray, weathering to grayish-brown, with some areas stained reddish by iron oxides (Figure 3C,D). Hand samples reveal porphyritic, megaporphyritic, vesicular, amygdaloidal, and flow textures, featuring phenocrysts of plagioclase, pyroxene, and opaque minerals. Vesicles are often filled with secondary silica, calcite, and chlorite minerals, giving amygdaloidal and vesicular textures.

2.2.3. Pyroxene Andesite

The pyroxene andesite unit appears as low-relief hills with a light gray color and displays porphyritic and amygdaloidal textures. Hand specimens contain rounded pyroxene crystals and coarse plagioclase crystals (27–36 wt.%). Secondary minerals like chlorite and calcite are present as veinlets and vesicle-fillings, with carbonate veins measuring 1.5–2.5 mm clearly visible.

2.2.4. Hornblende-Pyroxene Andesite

The hornblende-pyroxene andesite is also light gray, with vesicles filled by celadonite, chlorite, calcite, and minor zeolites, and shows porphyritic and amygdaloidal textures. Plagioclase phenocrysts (43–45 wt.%) along with hornblende and pyroxene are easily observed. The hornblende basaltic andesite is dark gray, porphyritic, and amygdaloidal, with visible plagioclase (22–26 wt.%) and hornblende (4–6 wt.%) phenocrysts. The hornblende-pyroxene basaltic andesite, found in mountainous terrain in the eastern area, also displays porphyritic texture with plagioclase (27%–29%), pyroxene (5%–6%), and hornblende (4%–6%). The pyroxene basaltic andesite, appearing as low-relief hills, contains plagioclase (24%–26%) and pyroxene (5%–6%). The olivine-pyroxene basalt is dark green to black, fine-grained, and includes plagioclase (16%–18%), pyroxene (5%–7%), and olivine (12%–14%) phenocrysts.

2.2.5. Basalt, Olivine Basalt, and Microgabbro

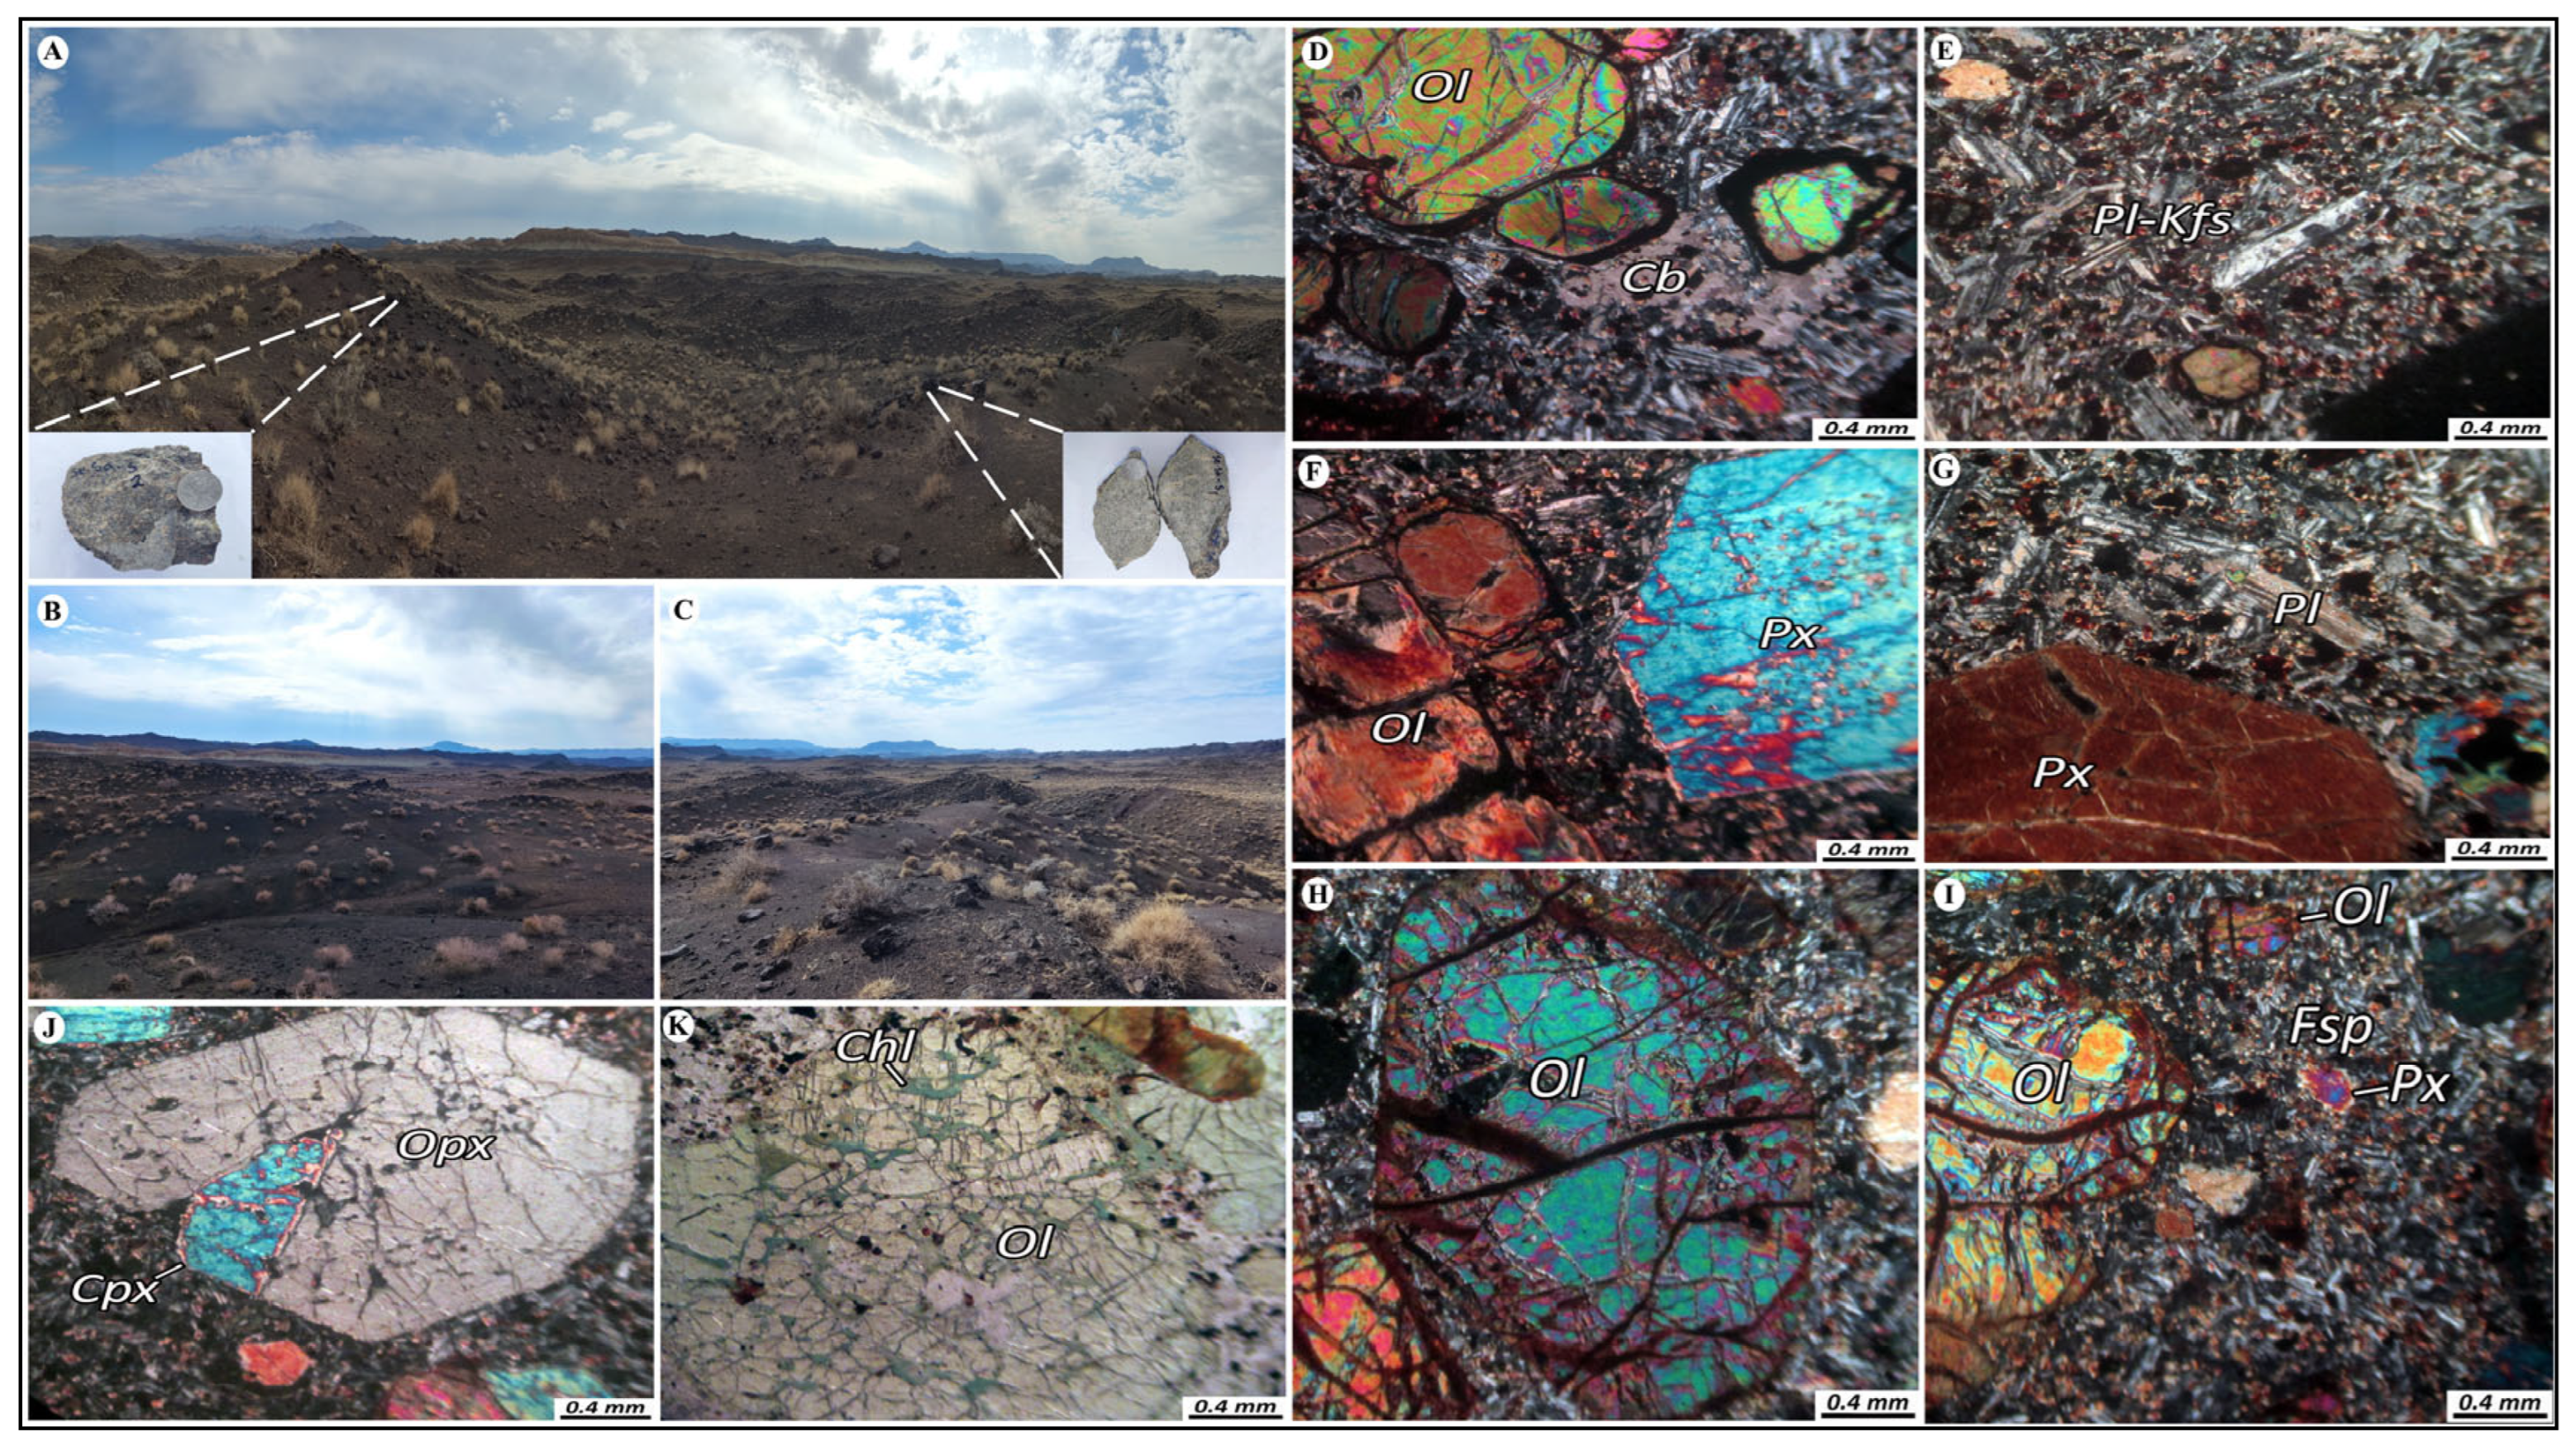
Basalt, olivine basalt, and microgabbro units occur as low-relief hills with smooth and eroded surfaces across the region (Figure 4A,C). In hand specimens, these rocks appear dark green, dark gray, to black in color. They are primarily composed of phenocrysts of olivine and pyroxene, and commonly display porphyritic, micro-porphyritic, amygdaloidal, and vesicular textures (Figure 4D,K). Most olivine crystals in these basalts exhibit iron oxide staining and iddingsitization along grain boundaries and fracture zones.
In certain areas of the Sepid-Sarve deposit, this unit contains weak mineralization. The gabbro-basalt rocks have medium-grained textures and consist of plagioclase, olivine, pyroxene, and minor alkali feldspar. Olivine crystals in the groundmass are frequently altered to iron oxides. The plagioclase composition is sodic, and in association with alkali feldspar, suggests disequilibrium with olivine (Figure 4E,I), indicating evidence of magma mixing. Chlorite appears as minor veinlets in parts of the rock. Partial alteration of olivine to iddingsite and secondary iron oxides is evident.
Microscopically, the gabbro-basalt rock contains 45%–50% phenocrysts. Of the total phenocryst volume, 60%–65% are pyroxene and 35%–40% are olivine. Pyroxene crystals range from 1 to 4 mm, and olivine crystals from 0.5 to 3 mm in size. Plagioclase crystals, occasionally observed, measure about 0.5–1 mm and are finer than the mafic phenocrysts (Figure 4). Both orthopyroxene and clinopyroxene are present (Figure 4). Some vesicles are filled with secondary quartz and carbonate minerals. Occasionally, pyroxene appears as large megacrysts.

2.2.6. Agglomerate

The volcaniclastic units are represented by andesitic agglomerates that occupy a significant portion of the area and are stratigraphically interbedded with lava flows. These rocks show weak to moderate hydrothermal alteration, including chloritic, hematitic, and, in some locations, carbonate and argillic alterations. Agglomerates are brown to reddish in color and cover extensive areas. In hand specimens, some show pyroclastic textures and are composed of andesite to pyroxene andesite.
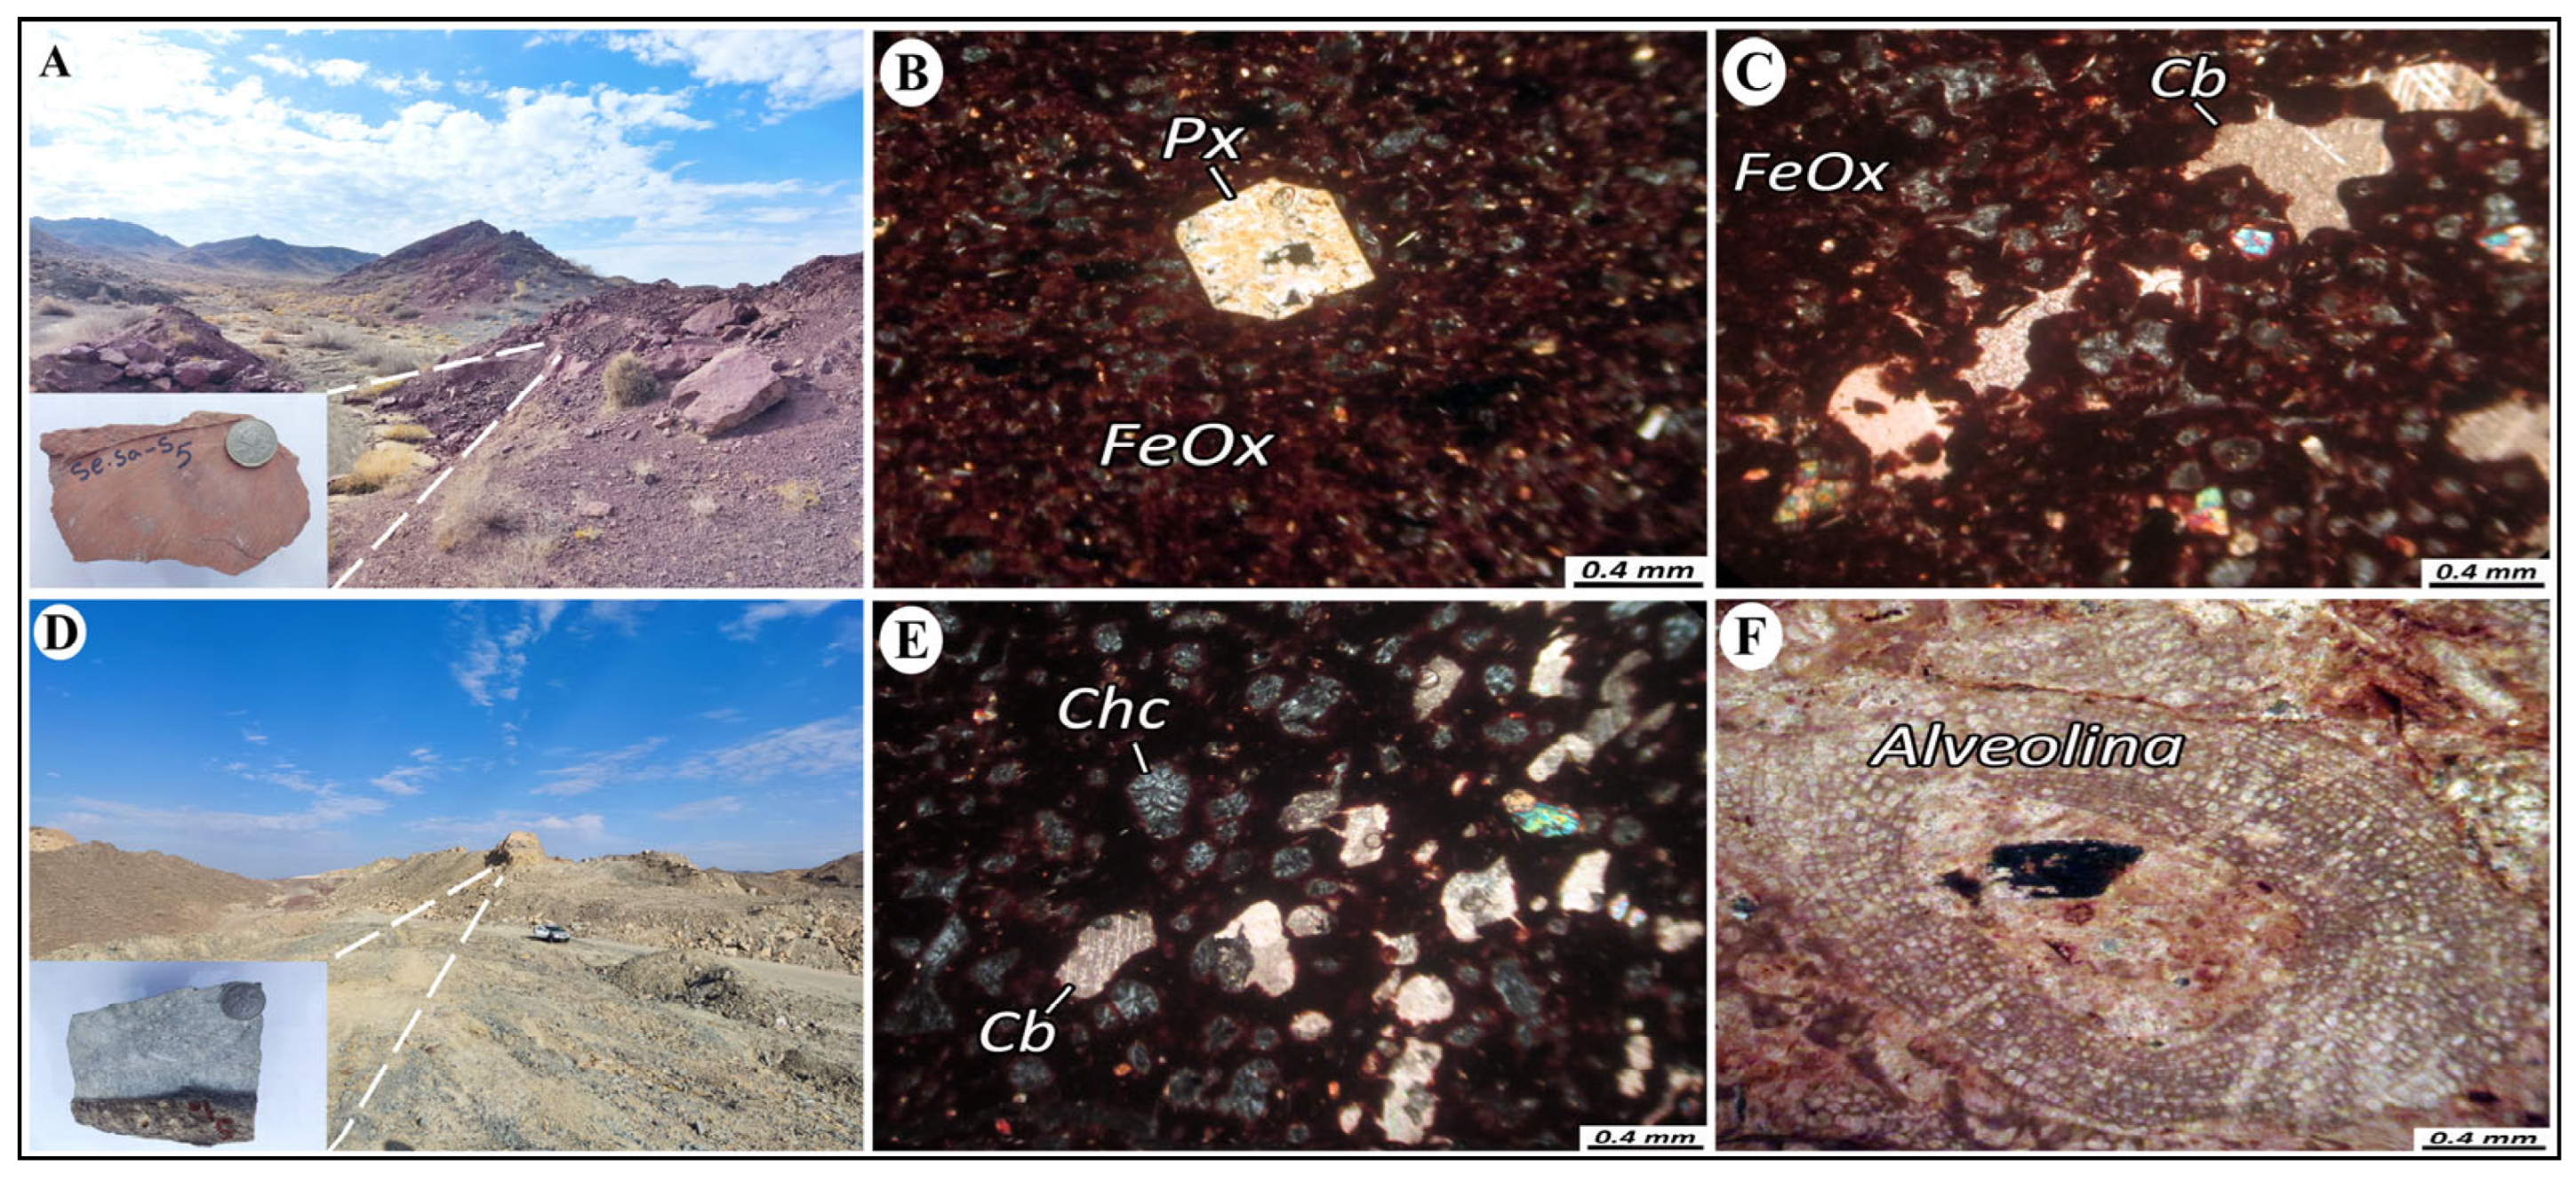
The majority of the copper mineralization in the Sepid-Sarve deposit occurs at the contact of these units with the overlying limestone (Figure 5F,H). Copper mineralization appears as both oxide (malachite) and sulfide (chalcocite) phases. The crystal tuff has an amygdaloidal texture and is composed of plagioclase and pyroxene, with secondary minerals including iron oxides, carbonates, and chalcedonic quartz. The groundmass is iron-rich. Intense alteration is evident, with iron oxides forming a substantial portion of the rock and the vesicles being filled with secondary silica and carbonate minerals. This rock likely represents an oxidized crystal tuff. Pyroxene and scattered plagioclase are observed. A large portion of the rock consists of porous iron oxides, with vesicles filled by secondary minerals.

2.2.7. Limestone

Thin-bedded, cream-colored limestones (OLMlm), interbedded with marl and siltstone and rich in Nummulite and bivalve fossils, occur in multiple synclines across the Sepid-Sarve area (Figure 5B,C,I). These carbonate units include silty, sandy, and detrital limestones. The main limestone body, trending east–west in the central region, is conformably interbedded with volcanic and volcaniclastic rocks.
This limestone is a fossiliferous micritic packstone with abundant fossils and a fine-crystalline matrix. Copper mineralization often occurs at its contact with volcanic units. Carbonate breccias here consist of angular fossil-rich clasts in a calcitic matrix (Figure 6A), with some fragments containing quartz and plagioclase grains. Large benthic foraminifera like Alveolina are common. Iron oxides sometimes replace the margins of carbonate clasts (Figure 6A).
This limestone is a key exploration target, as major copper mineralization in Sepid-Sarve is associated with its contact with overlying agglomerates.
Petrographically, the limestone includes lumachelle, fossiliferous micritic (bio-micrite), sparitic (bio-sparite), and micro-sparitic (bio-micro-sparite) types, showing coarse textures and abundant fossil debris. Minor feldspar and silica detritus are present, with a matrix of micrite, sparite, and iron oxides. Secondary silica fills fractures, and abundant carbonate fossils (mostly Nummulites) are present alongside minor feldspar and quartz grains (Figure 6D).

2.2.8. Marl and Siltstone

The OLMsm unit consists of thinly bedded marl and siltstone layers, ranging from light gray to cream, overlying the fossiliferous limestone. It forms hilly terrain, with greater thickness and lateral extent in the western sector compared to the east (Figure 4A–C,E,I). This unit is conformably overlain by a red marl layer. Notably, limestone beds analogous to OLMlm occur within the northern part of the western sector, hosting malachite mineralization, and have been structurally emplaced into the marl via thrust faulting.
The OLMm unit comprises thinly bedded red to gray marl and siltstone overlying the gray-cream marl. It forms hilly topography, is relatively thin but more extensive in the eastern region, and is unconformably overlain by a brown conglomerate (Figure 5A).
The Mc unit is characterized by gray to brown polymictic conglomerates with clasts from pebbles to boulders. It is poorly sorted with moderate clast roundness. Interbedded sandstone layers (Mts unit), more prevalent in the west, accompany this unit. The Mc forms hilly relief and exhibits significant thickness, particularly in the east. In some areas, it is unconformably overlain by a gypsum-bearing marl (Figure 5A,D).
The Mts unit comprises gray to green sandstones interlayered with tuffs, occurring interbedded within the Mc conglomerate. It is more extensive and thicker in the western sector, exhibiting low-relief hills and relatively minor thickness (Figure 3A).
The Mgy unit includes marls with transparent gypsum layers, gray to white in color, present in both eastern and western sectors (Figure 3A,B). It locally overlies older units discontinuously, with wider distribution in the east and beyond the study area. The unit hosts multiple high-quality gypsum layers currently under extraction, displaying rugged topography and limited thickness (Figure 5B,E).
The Mgy unit includes marls containing transparent gypsum layers, gray to white in color, and is observed in both the eastern and western sectors (Figure 3A,B). It locally and discontinuously overlies older units. The unit is more widespread in the eastern part and is also extensively developed outside the study area. It contains multiple high-quality, bright gypsum layers that are currently being mined. This unit displays relatively rugged topography and has limited thickness.

3. Materials and Methods

3.1. Petrographic and Geochemical Analyses

As part of this study, and following an extensive literature review, a total of 134 samples were collected during fieldwork from intrusive and volcanic igneous units, as well as from mineralized veins and altered zones of the Sepid-Sarve copper deposit. Sampling was conducted from the surface down to a depth of 56.2 m (Sampling was carried out using core drilling) to facilitate petrographic and lithological investigations. Corresponding thin sections were prepared for detailed analysis. Among these, 20 volcanic rock samples with minimal alteration were selected for whole-rock geochemical (litho-chemical) analysis. Major elements in these samples were measured using X-ray fluorescence (XRF), following the processes of crushing, pulverizing, drying, homogenizing, powder preparation, pressing with boric acid, and finally fusion with lithium metaborate or tetraborate. For the analysis of rare earth elements (REEs) and trace elements, 0.2 g of each sample was digested with diluted nitric acid and subsequently analyzed using inductively coupled plasma mass spectrometry (ICP-MS), based on ionization and separation of ions according to their mass-to-charge ratios. The analytical procedures were carried out at the Zar Azma Laboratory in Tehran.

3.2. Fluid Inclusions Measurements

Five double-polished thin sections with a thickness of 80–100 µm were prepared from quartz and calcite (carbonate) veins and veinlets. Petrographic observations of fluid inclusion evidence were conducted, followed by micro-thermometric analyses on 40 fluid inclusions. These studies were carried out using a Linkam THMSG600 heating–freezing stage (Linkam, Redhill, UK) with a temperature range of −196 °C to +600 °C and a precision of ±1 °C, at the Department of Geology, Tarbiat Modares University, Tehran. Temperature calibration was performed using Synflinc synthetic standards. During the freezing and heating procedures, the rates were controlled within the range of 1–10 °C/min, before being decreased to 0.5–1 °C/min in the vicinity of phase transition points. Salinities (wt.% NaCl equiv.) and densities (g/cm3) of the aqueous (NaCl-H2O) inclusions were determined using the computer program HOKIEFLINCS_H2O-NaCl Excel developed by [6] based on the final ice melting temperatures.

3.3. Stable Isotope Measurements

3.3.1. Oxygen Isotope Analysis

Two quartz and calcite samples were selected from the same vein locations where fluid inclusion samples were collected, for stable oxygen isotope (δ18O) analysis. The samples were first crushed to mesh 60 at the University of Tehran and then manually purified under a binocular microscope to achieve a purity of over 99%. After separation, the samples were powdered, sieved to remove contaminants, and rinsed with ethanol to ensure cleanliness. Isotopic analyses were performed at the Stable Isotope Research Center, Arak University, Iran. For δ18O analysis in solid samples, high-temperature pyrolysis was conducted at 1450 °C using an elemental analyzer, where all oxygen atoms in the molecular structure were converted to carbon monoxide (CO) gas in the presence of carbon black and glassy carbon. The resulting CO gas passed through a series of purification systems, including a water trap to remove moisture and a purge-and-trap column to eliminate CO impurities. After complete removal of interfering gases, the desorption column was heated to 150 °C, and the purified CO gas was transferred through a secondary water trap into the isotope ratio mass spectrometer (IRMS). For calibration and calculation, the isotopic composition of the reference CO gas was determined by comparison with international or laboratory secondary standards. The mass ratio of 30/28 was measured to determine the δ18O values. In this process, δ18O is measured by converting the sample to CO gas via pyrolysis at 1450 °C, followed by purification and subsequent analysis by IRMS, using the 30/28 mass ratio and calibrated against international standards. δ18O values exhibit a precision of 0.1‰ and are reported in reference to V-SMOW (Vienna Standard Mean Ocean Water, δ18O = 0, with uncertainties of 0.02‰; International Atomic Energy Agency, (2017) [43].

3.3.2. Sulfur Isotope Analysis

Three representative chalcocite samples from mineralized veinlets were selected for sulfur isotope (δ34S) analysis. The samples were first powdered and sieved to obtain grain sizes between 0.1 and 0.5 mm. Isotopic analyses were performed at the Stable Isotope Research Center, Arak University, Iran. Clean mineral grains were handpicked under a binocular microscope to ensure purity. For isotopic analysis, the samples were combusted at 1150 °C in an elemental analyzer, producing sulfur dioxide (SO2) gas. The generated SO2 gas was directed through a purification system consisting of a water trap to remove moisture and a purge-and-trap column to eliminate residual impurities. The adsorption column was subsequently heated to 220 °C to release the accumulated SO2 gas, which was then transferred into the isotope ratio mass spectrometer (IRMS). Within the IRMS, the sulfur isotopic composition was determined by measuring the mass ratio 66/64, corresponding to the 34S/32S ratio of the sample. To ensure the accuracy and reproducibility of the measurements, repeated calibrations were performed using the IAEA-S-4 international standard [44] (δ34S = +16.9 ± 0.2‰ VCDT) and a laboratory secondary standard (δ34S = −6.3 ± 0.2‰ VCDT).

4. Results and Discussion

4.1. Ore Mineralogy and Paragenetic Sequence

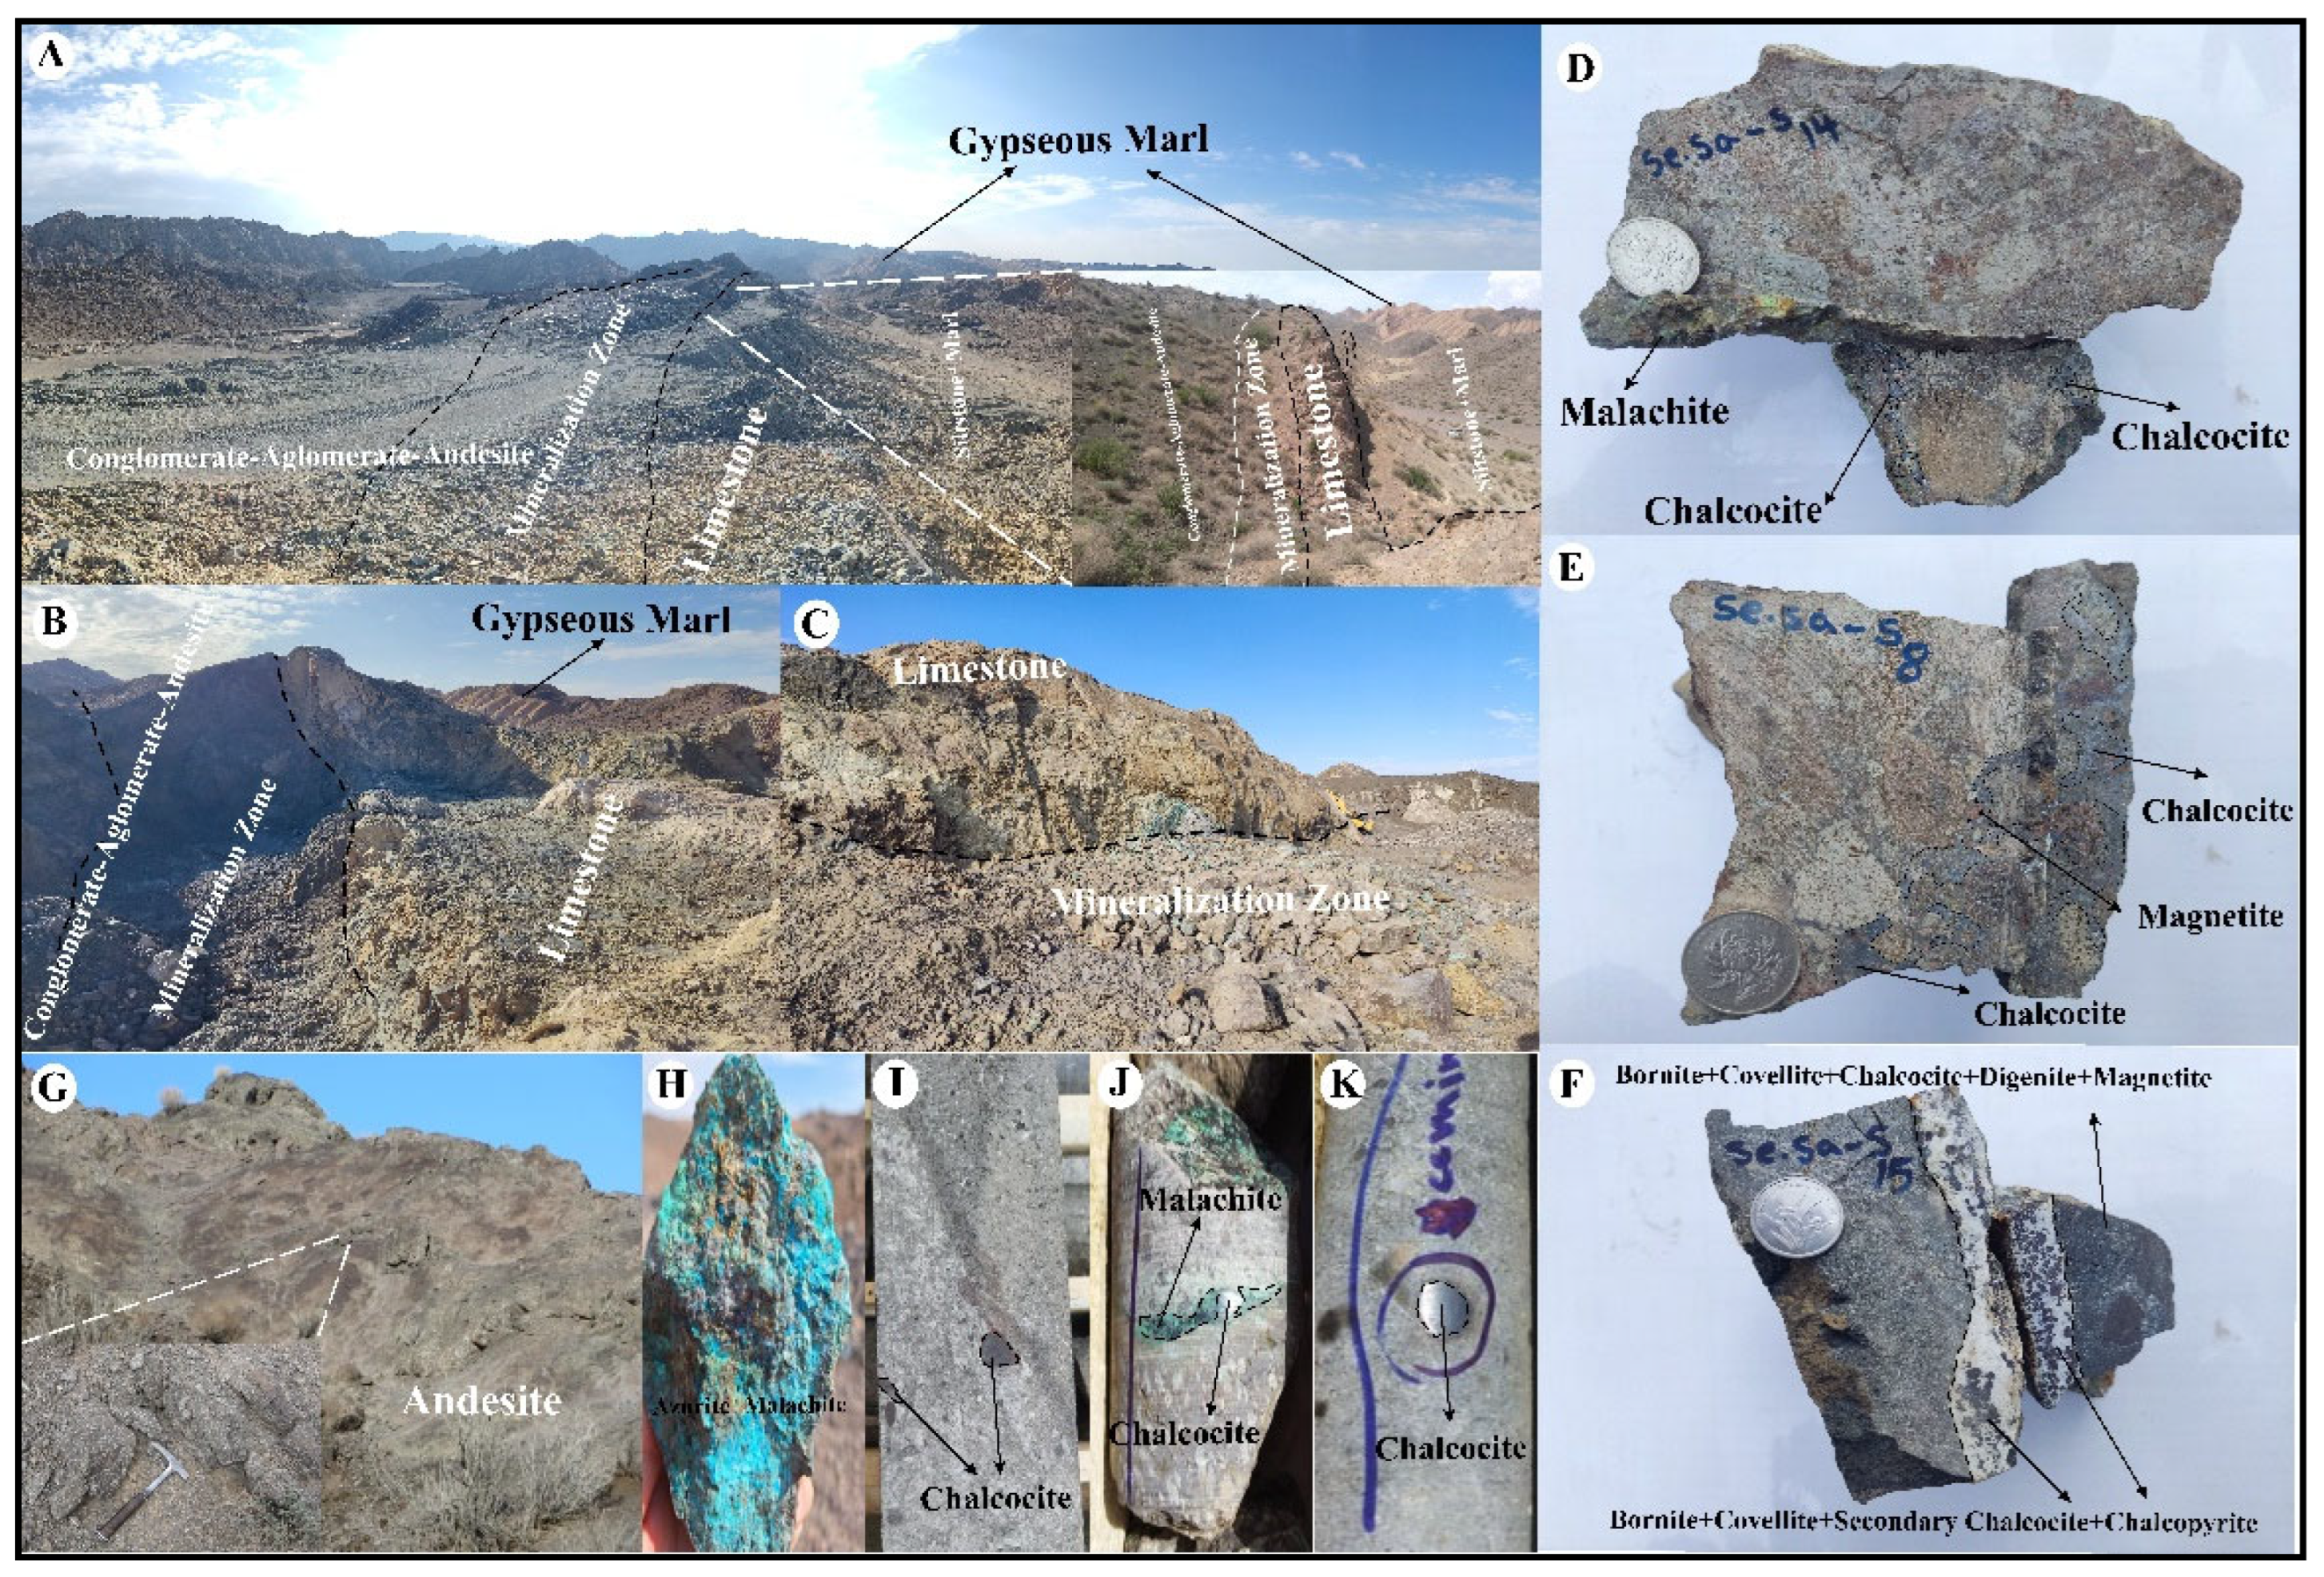
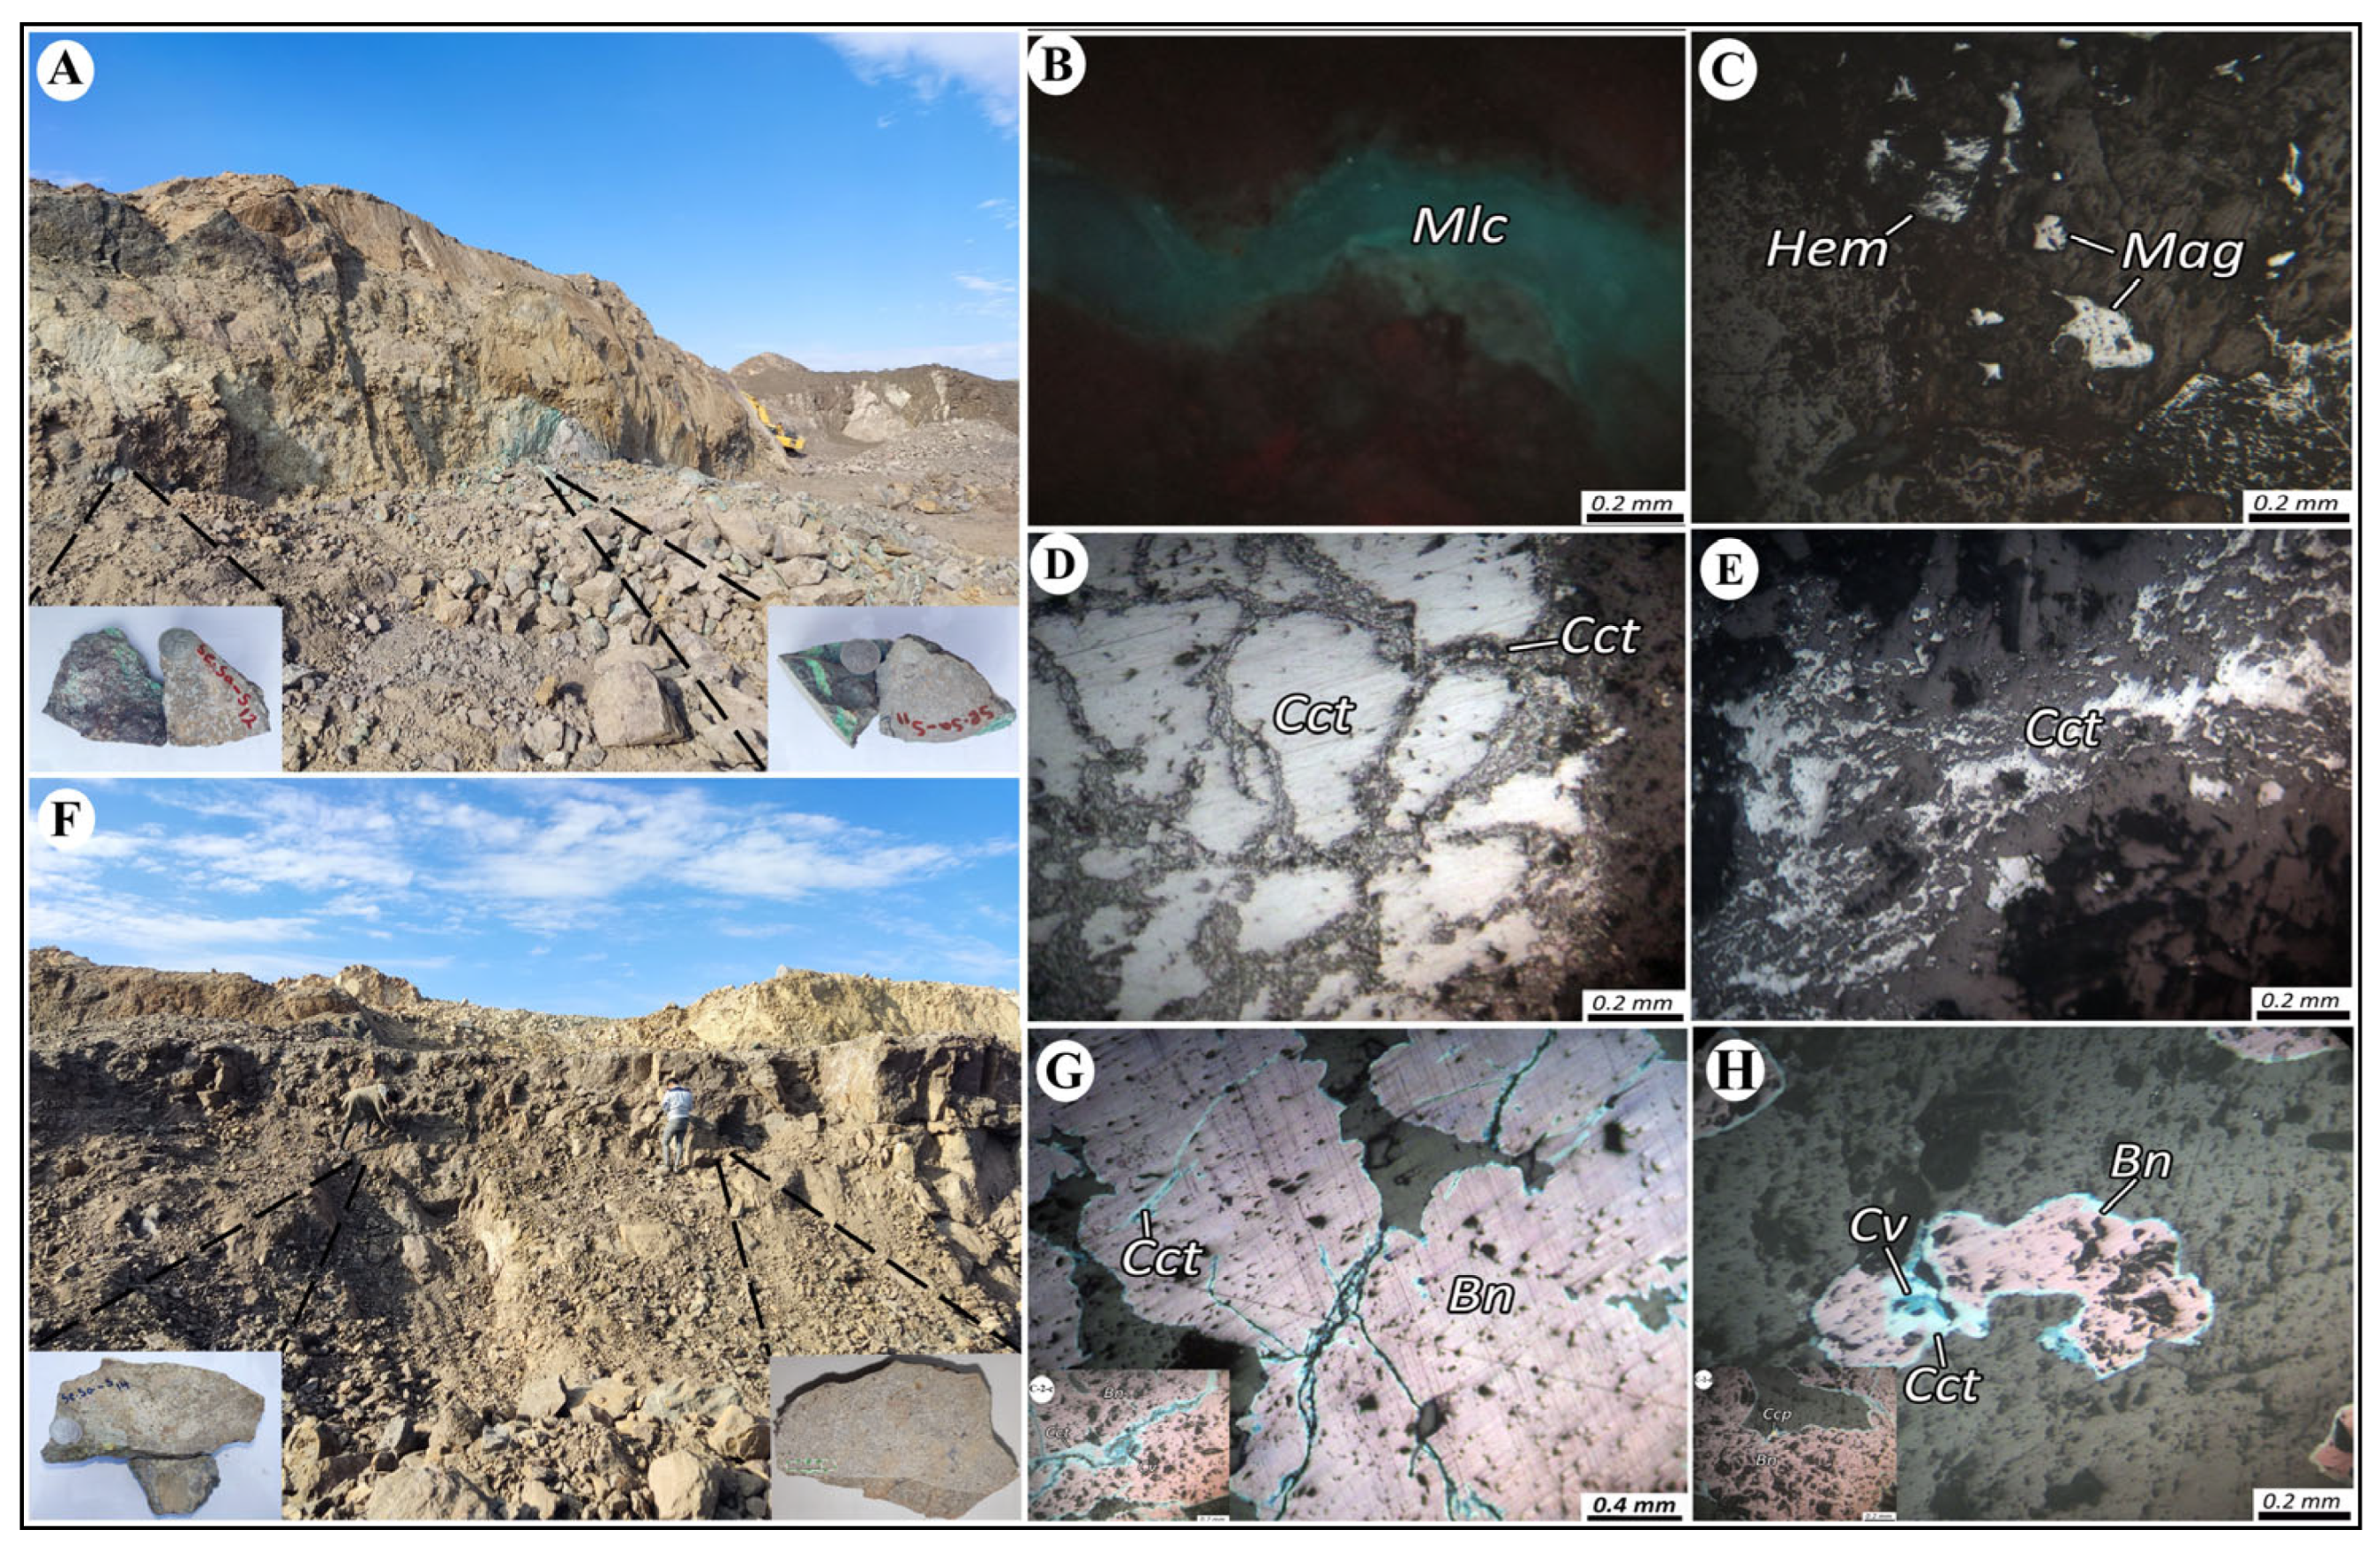
Intense compressional tectonics formed anticlines and synclines, with mineralization localized along their limbs. Field observations, including fold orientations and vein alignments, support the interpretation of compressional tectonics localizing mineralization along fold limbs. High-permeability conglomerates facilitated fluid flow and metal deposition. Mineralized zone thickness varies from <1 m to >10 m, occurring as veinlets, disseminations, cavity fillings, and impregnation textures (Figure 7D–F). Veinlet-style mineralization mainly occurs in andesitic and pyroclastic rocks, with limestone less involved (Figure 7G). Conglomerates, rich in volcanic and agglomerate fragments, provided porous pathways for hydrothermal fluids or metamorphic brines, enabling open-space and disseminated mineral precipitation. Copper mineralization is concentrated at contacts between pyroclastic/volcanic units and overlying carbonate sequences (marly, fossiliferous, and clastic limestones). Main minerals include sulfides (chalcocite, covellite, bornite, pyrite, rare chalcopyrite), copper carbonates (azurite, malachite), oxides (hematite, limonite, goethite, cuprite), and gangue (calcite, zeolite, quartz, clays). Secondary copper minerals and iron oxides formed from sulfide oxidation under surface conditions. Brecciated fragments (>1 cm) result primarily from penetration of chalcocite-bearing veinlets, which control mineralization patterns. These veinlets reach 1–2 mm thickness and are partly replaced by chalcocite throughout the host rock.
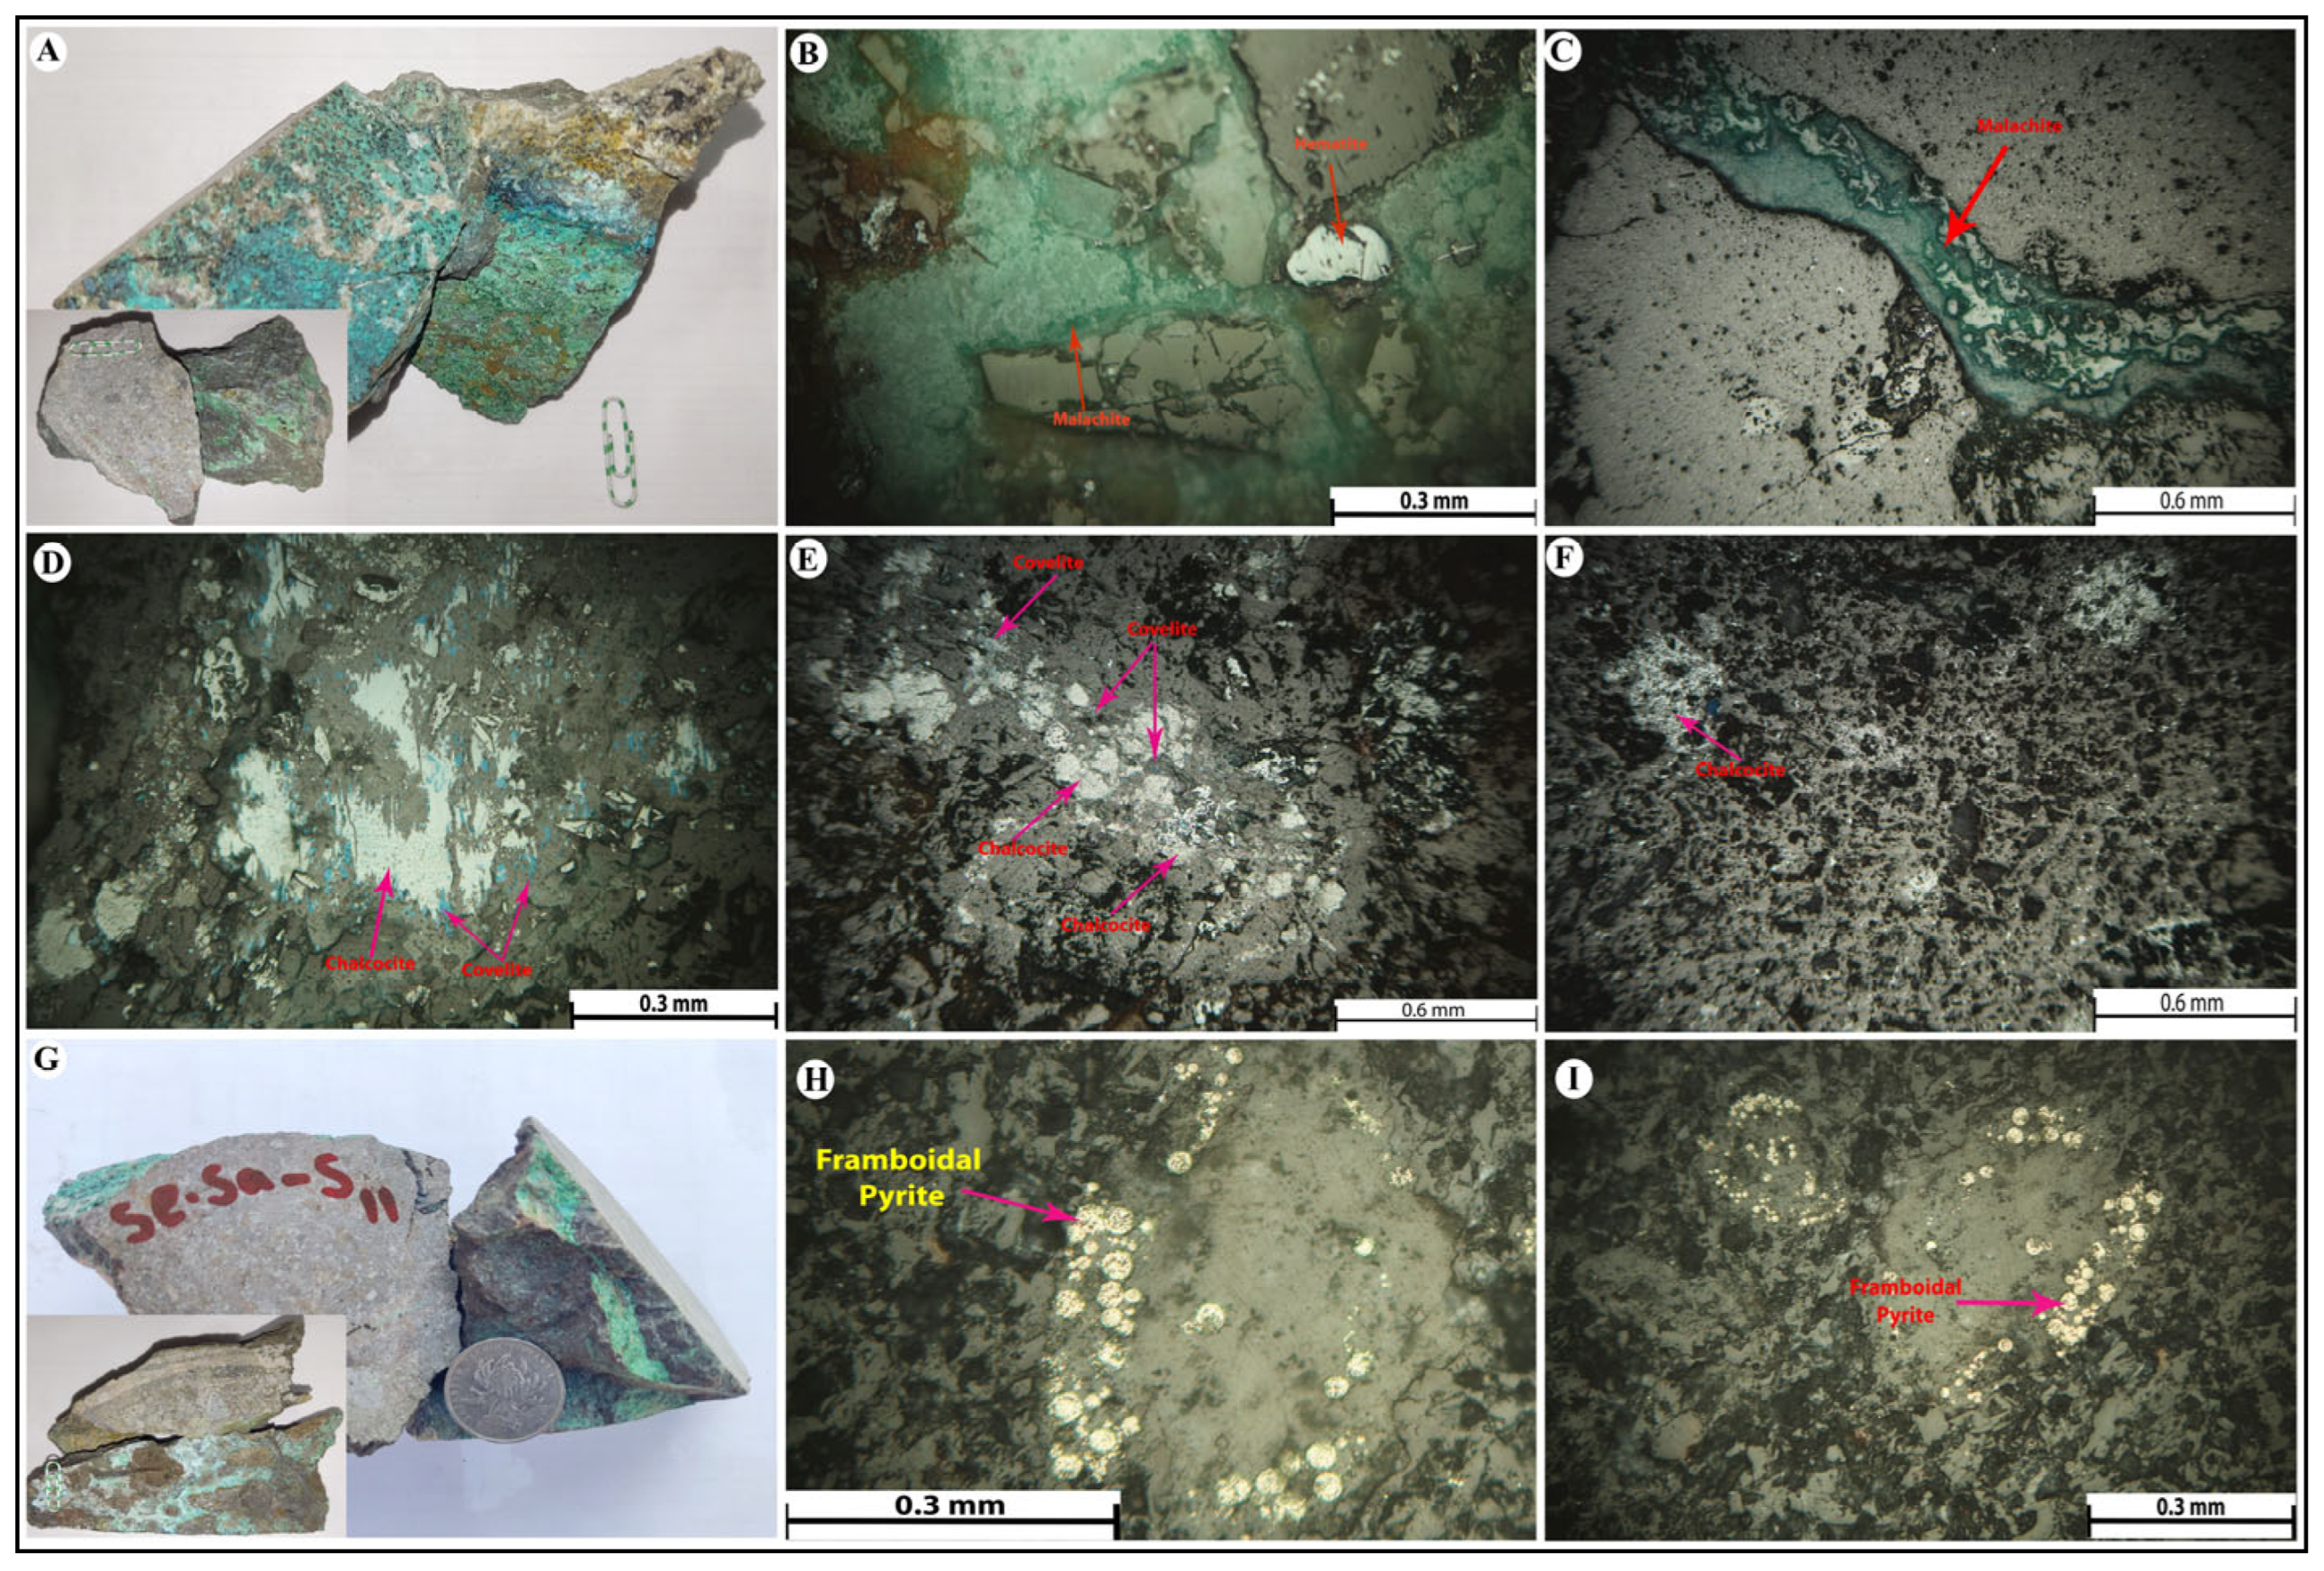
The veinlets are often discontinuous, with chalcocite mineralization frequently terminating within non-metallic veinlets (Figure 8D–F). Chalcocite occurs as both primary and secondary forms, the latter showing a bluish tint. Thin, short chalcocite veinlets are observed locally, and fine disseminated chalcocite particles may be present but are difficult to distinguish from hematite due to similar coloration (Figure 8D,E).
Mineralization mainly occurs below the carbonate horizon and within upper volcanic and volcaniclastic units—conglomerate, andesite, and agglomerate (Figure 9A). In some areas, oxide copper minerals appear at the limestone’s upper boundary in contact with shale and marl (Figure 9F).
Hematite is found as disseminated granules and short veinlets. Malachite fragments and veinlets also occur, identifiable by their green color. Magnetite crystals, partially or fully altered to hematite, vary in abundance; hematitization intensity is generally low but locally more pronounced. Magnetite appears as fine dispersed particles and as coarser subhedral to anhedral grains undergoing partial to complete hematite replacement. Brecciated samples show rock fragments with variably oxidized magnetite, where crystals range from anhedral to euhedral, often with marginal or extensive hematite replacement (Figure 9A,B). Some magnetite crystals are fully transformed to hematite, losing their original phase entirely.
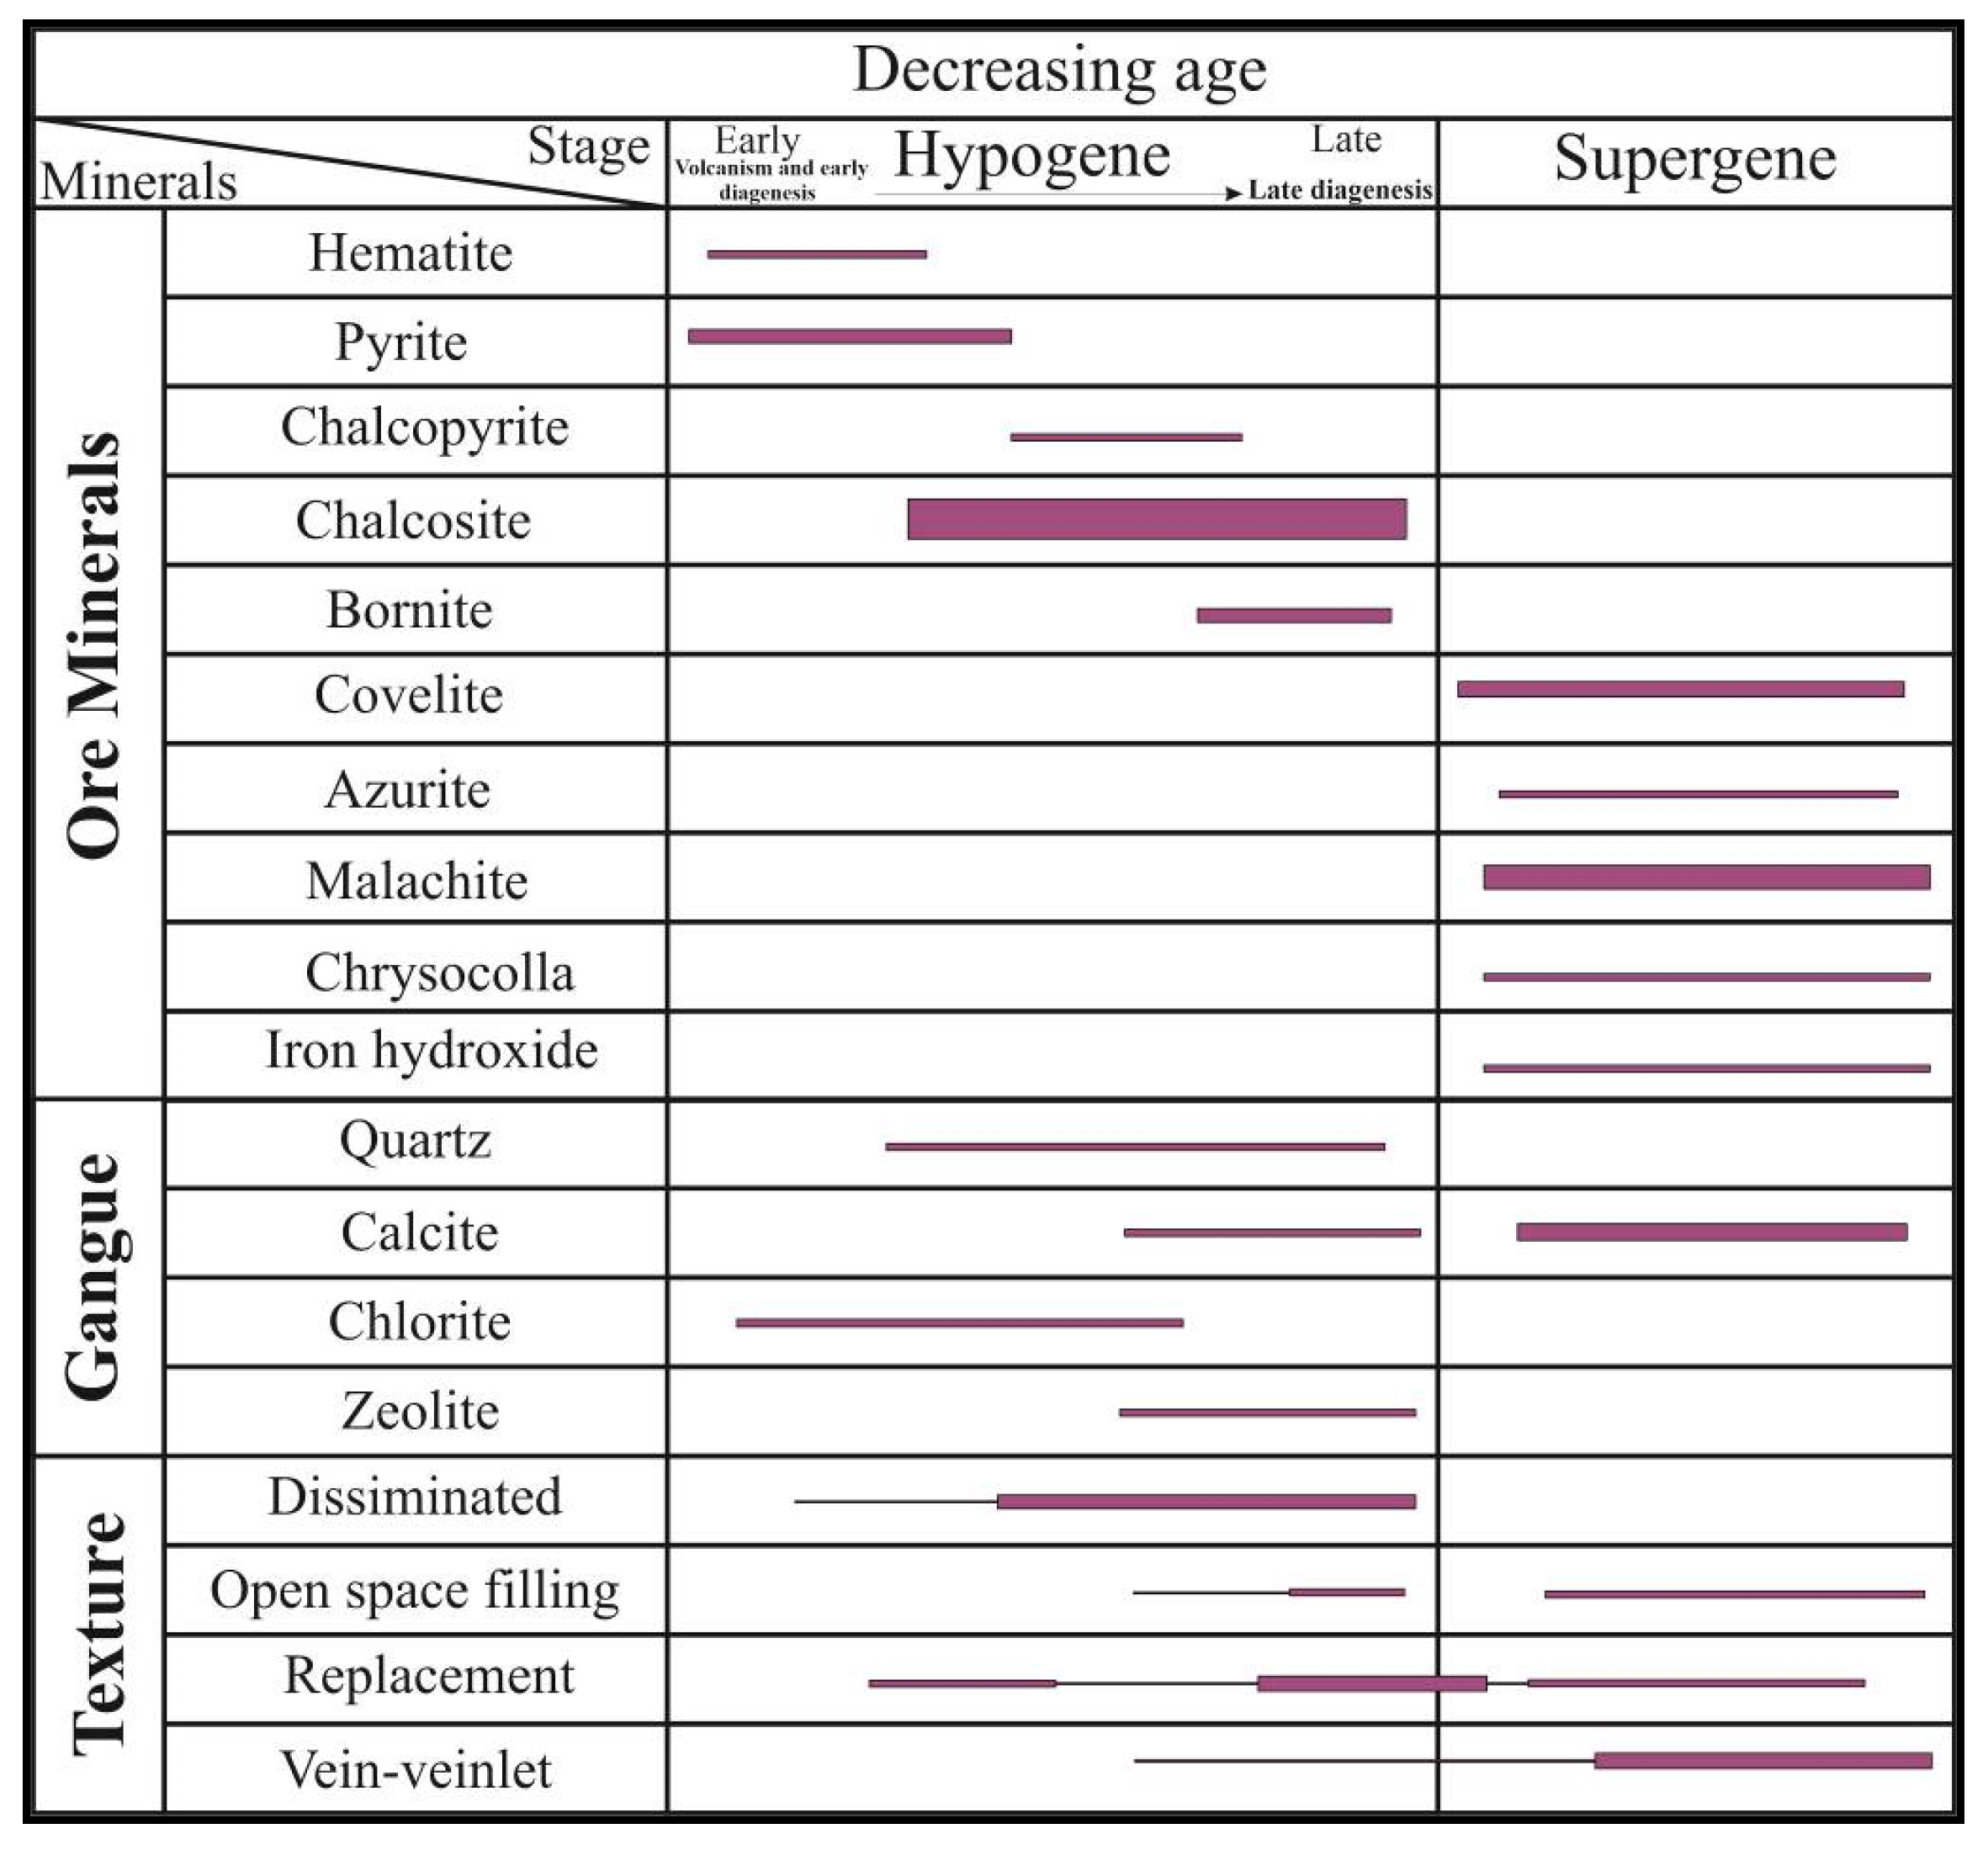
Paragenetic analysis indicates that chalcocite formed after magnetite. Magnetite crystals in the matrix are mostly anhedral and commonly partially replaced by hematite, with disseminated magnetite also found within malachite veinlets. Well-formed euhedral magnetite crystals occur in brecciated fragments, while anhedral grains replace portions of the host rock. Magnetite crystals occasionally appear disseminated within non-metallic, chalcocite-bearing veinlets and show variable hematitization. These relationships suggest magnetite crystallized early, followed by the intrusion of chalcocite-bearing veinlets (Figure 9A).
Bornite is primarily observed as thick veinlets and massive zones. Secondary chalcocite and covellite replace bornite margins, indicating alteration of bornite to these copper sulfides (Figure 9G,H). Covellite–secondary chalcocite veinlets are sometimes present within large bornite grains along fractures. Fine-grained chalcopyrite occurs at bornite margins, often intergrown (Figure 9H).
The ore assemblage comprises chalcocite, minor chalcopyrite and bornite, covellite, pyrite, malachite, and chrysocolla. Primary sulfides (chalcocite, bornite, pyrite) were subsequently altered to secondary minerals (malachite, covellite, iron hydroxides) during supergene enrichment (Figure 7, Figure 8 and Figure 9). Alteration is dominated by chloritic, carbonatic, and zeolitic assemblages, with limited argillic zones. Chalcocite, characterized by high copper and lack of iron, is the key primary copper mineral in Manto-type deposits. In contrast, chalcopyrite—common in porphyry and VMS deposits—contains less copper and more iron. The mineralization zone in the Sepid-Saru copper deposit can be observed in two sections, eastern and western. Based on the results of this study, the mineralization zone in the eastern section has a thickness ranging from less than 1 m to 4.35 m, occurring at the contact between porphyritic andesite and Nummulitic limestone. It extends to a length of 450 m, with an oxidized zone reaching a minimum depth of 25 m and a sulfide zone extending to a depth of 120 m. In the western section, the thickness of this zone is less than 2 m, with a length of 275 m, an oxidized zone to a depth of 25 m, and a sulfide zone reaching a depth of 100 m. The main copper-bearing mineral in the Sepid-Sarve deposit is chalcocite, which is notably not accompanied by quartz. This absence indicates a negligible silica content in the ore-forming fluid. Chalcocite, the most important primary copper sulfide mineral in Manto-type deposits, is characterized by high copper and an absence of iron. Accordingly, it can be inferred that ore-forming fluids in Manto-type systems were copper-rich and iron-poor. The lack of quartz associated with chalcocite further suggests that the hydrothermal fluid was silica-deficient, while the presence of organic material indicates that the fluids were reducing in nature. In addition, the absence of epidote—an Fe-rich mineral typically indicative of oxidizing conditions—supports the interpretation of an iron-deficient, reducing ore fluid (Figure 8 and Figure 9).
Although volcanic host rocks contain up to 5% primary magnetite, no significant iron-rich mineralization (e.g., chalcopyrite, pyrite) or alteration is present, suggesting these rocks are unlikely metal sources. Similarly, intrusive sources would typically yield silica-, iron-, and aluminum-rich fluids; however, the absence of quartz associated with chalcocite argues against this.
Recent studies highlight the crucial role of framboidal pyrite and bitumen in the genesis of mantle-type copper deposits [45,46,47]. In Iranian stratabound deposits, framboidal pyrite commonly acts as a pre-ore reducing agent. For instance, in the Keshkuiyeh deposit, peak copper grades correlate with veins and zones enriched in pyrobitumen and framboidal pyrite. These pyrite textures, occurring as fine-grained aggregates near copper mineralization (Figure 8I), suggest a pivotal role in ore formation. The pre-ore assemblage in Iranian mantle-type deposits typically comprises framboidal pyrite alongside pervasive propylitic alteration of andesitic host rocks, interpreted as early diagenetic or pre-hydrothermal features [19]. In this setting, pyrite formation plays a key role in establishing reducing conditions in the mineralized host rock. During this stage, along with the formation of the host rocks and early diagenesis, framboidal pyrites formed sporadically within the andesitic-tuffaceous matrix. In many mantle-type copper deposits, the sulfur necessary for pyrite formation is supplied by bacterial reduction in seawater sulfate, which reacts with iron available in the basin, and eventually producing pyrite in the host rock matrix [2,6]. In rift-related extensional environments, extensive volcanic activity leads to the formation of a thick volcanic-sedimentary sequence, which retains high amounts of heat [6]. During this stage, pressure from diagenesis and dehydration of the underlying pyroclastic units generate hydrothermal fluids. The presence of zeolites in the host rock units indicates the progression of burial diagenesis. Mechanical breakdown of pyroclastic units in oxidizing coastal environments leads to silicate dissolution, forming clay minerals. During this reaction, copper and iron hydroxides are released, and Cu is adsorbed on clay minerals and iron hydroxides.
Framboidal pyrite formed during early diagenesis may be partially replaced by Cu-(Fe) sulfides, such as chalcocite and bornite, during burial diagenesis. The presence of zeolite minerals during subsequent burial indicates ongoing diagenetic evolution [19]. These data imply that metal-bearing hydrothermal fluids interacted with pre-existing pyrite, which served as a reducing agent to induce copper sulfide precipitation [47,48]. Similar pyrite replacement processes have been reported for stratabound copper deposits in central Chile [2,10].
At Sepid-Sarve, chalcocite—the hallmark mineral of Manto-type deposits—dominates, with lesser bornite, pyrite, digenite, magnetite, and hematite observed as primary sulfides. Secondary minerals, including malachite, azurite, secondary chalcocite, covellite, and hematite, occur throughout the deposit (Figure 10). These exhibits disseminated, cavity-filling (amygdaloidal), martitized, replacement, and skeletal textures, predominantly as veinlets of varying lengths and thicknesses, as well as disseminated grains.

4.2. Alteration

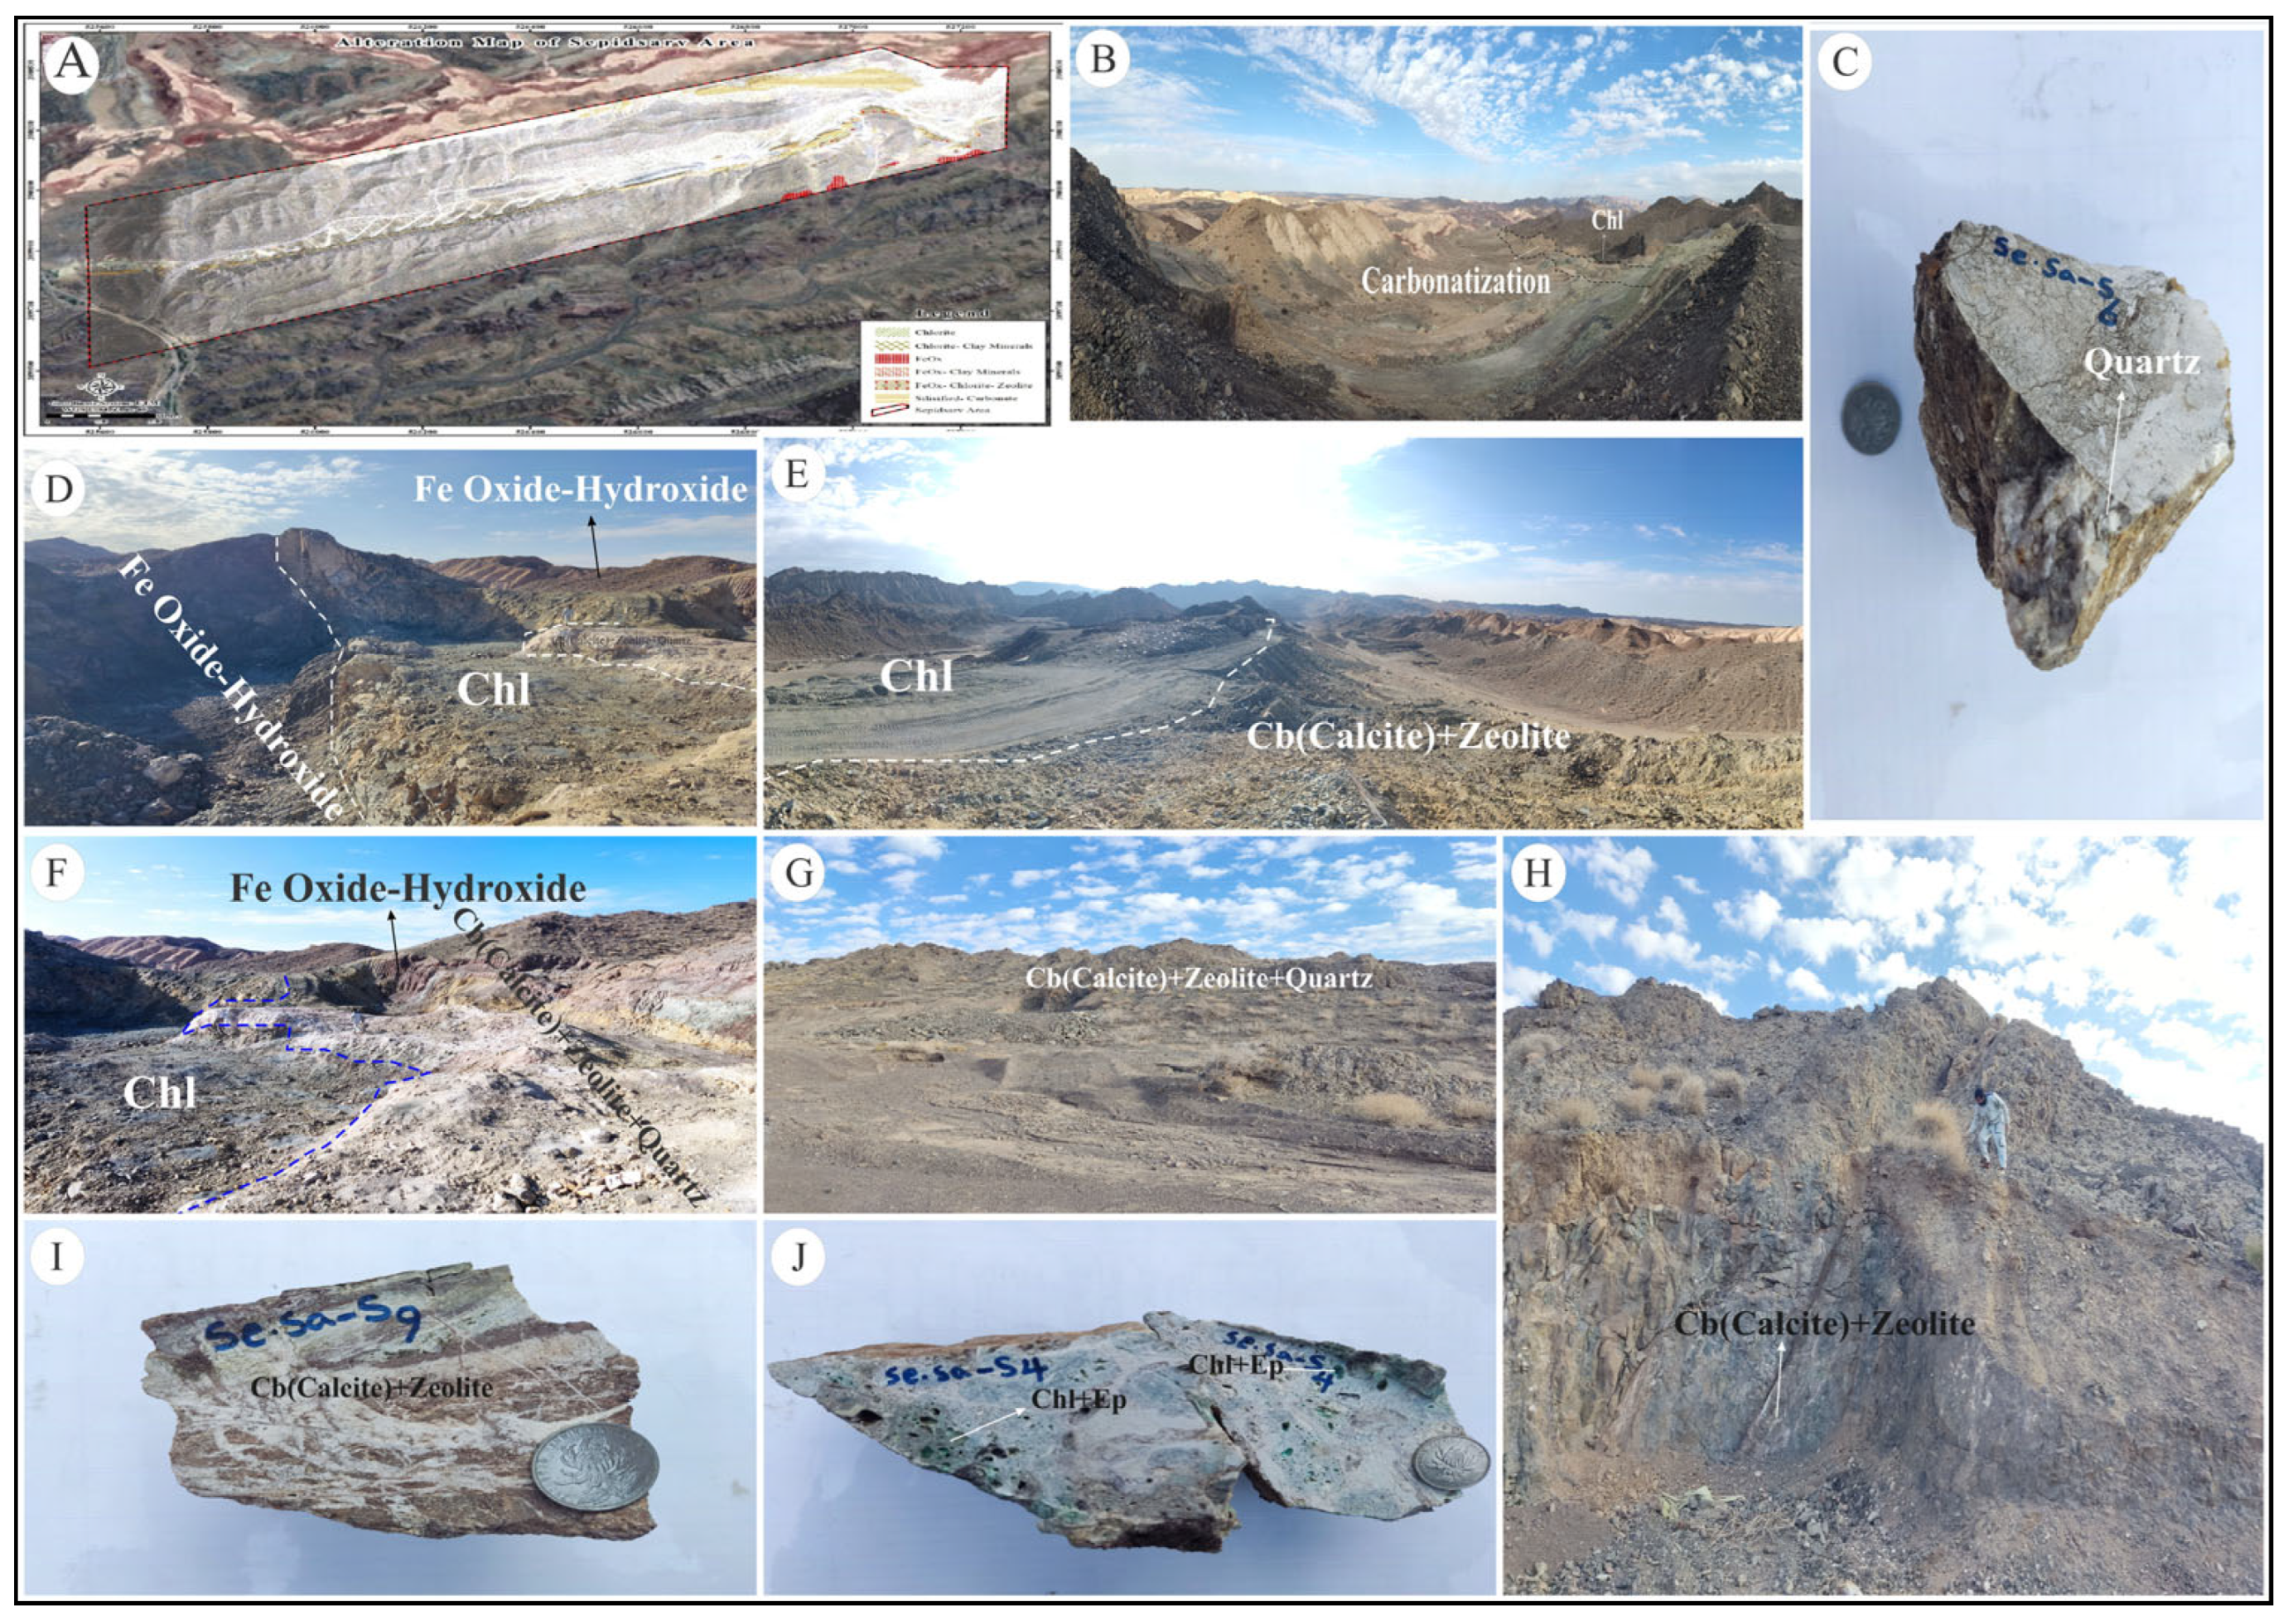
Magmatic and hydrothermal fluids related to volcanic activity caused generally weak alteration in the host rocks, mainly resulting in chloritic and iron oxide alterations (Figure 11A). Alteration in the Sepid-Sarve deposit, consistent with the broader northwest Bardeskan region, occurs in two stages: pre-mineralization and syn-mineralization.
Pre-mineralization alteration comprises carbonate (Figure 11B), silicification (Figure 11C), and propylitic assemblages characterized by epidote and chlorite (Figure 11D,E). Syn-mineralization alteration mainly includes carbonate (Figure 11E,F), zeolite (Figure 11F,G), calcite (Figure 11G,H), minor chlorite, and subordinate argillic alteration. The pre-mineralization stage corresponds to regional propylitic alteration, while syn-mineralization alteration is localized and marked by carbonate, calcite, zeolite, and minor argillic alteration (Figure 11A).
Chlorite forms via alteration of mafic minerals or hydrothermal introduction of Fe and Mg. Zeolitic alteration occurs locally and is linked to hydrothermal alteration, low-grade metamorphism, and meteoric water influence in intermediate to basic rocks. Iron oxide staining, chloritization, and iddingsitization are weak to moderate in andesitic units, with weak carbonate and clay alteration. Iron oxide alteration likely results from pyrite oxidation to goethite–hematite, facilitating sulfur release and sulfide mineral formation such as chalcocite and digenite. Secondary copper oxides like malachite derive from primary sulfides (Figure 11B).
Pervasive propylitic alteration of variable intensity affects the Eocene volcanic–sedimentary complex, including andesitic, basaltic, and microgabbro units, with more intense alteration in olivine basalt and microgabbro (Figure 11D,F). Alteration minerals mainly include chlorite, calcite, and epidote, with minor jarosite, iddingsite, iron oxides, and magnetite appearing as veinlets, cavity fillings, replacements, and disseminations. Plagioclase and mafic minerals are locally replaced by up to 20 wt.% chlorite and calcite and up to 5 wt.% epidote (Figure 11J).
Carbonate alteration, with 30%–35% intensity, occurs in andesitic units and Nummulitic limestone near mineralized zones, both at surface and drill cores. Calcite dominates, replacing plagioclase and mafic minerals and filling veinlets and cavities in andesite and limestone (Figure 11B,E,F). Plagioclase alteration reaches 20 wt.%, mafic minerals up to 90 wt.%. Vesicles in andesite are partially or fully filled with calcite, which commonly grows with colloform texture up to 3 cm in size and density of ~25 per m2. Limestone mineralization involves calcium leaching and calcite veinlet precipitation.
Silicic alteration is mainly observed in andesitic tuff, olivine basalt, and andesite units, often coexisting with carbonate and propylitic alterations. Cryptocrystalline quartz is the principal mineral, occurring as cavity fillings and veinlets, sometimes bordered by calcite. Veinlet thickness ranges from 0.1 to 1 mm, with densities up to 10 per m2 (Figure 11G).
Weak argillic alteration involves 10–15 wt.% feldspar replacement by clay minerals in some volcanic samples. Zeolitic alteration is prominent in mega-porphyritic andesite near mineralization, mainly filling vesicles (Figure 11G–I).

4.3. Geochemistry of Major and Trace Elements
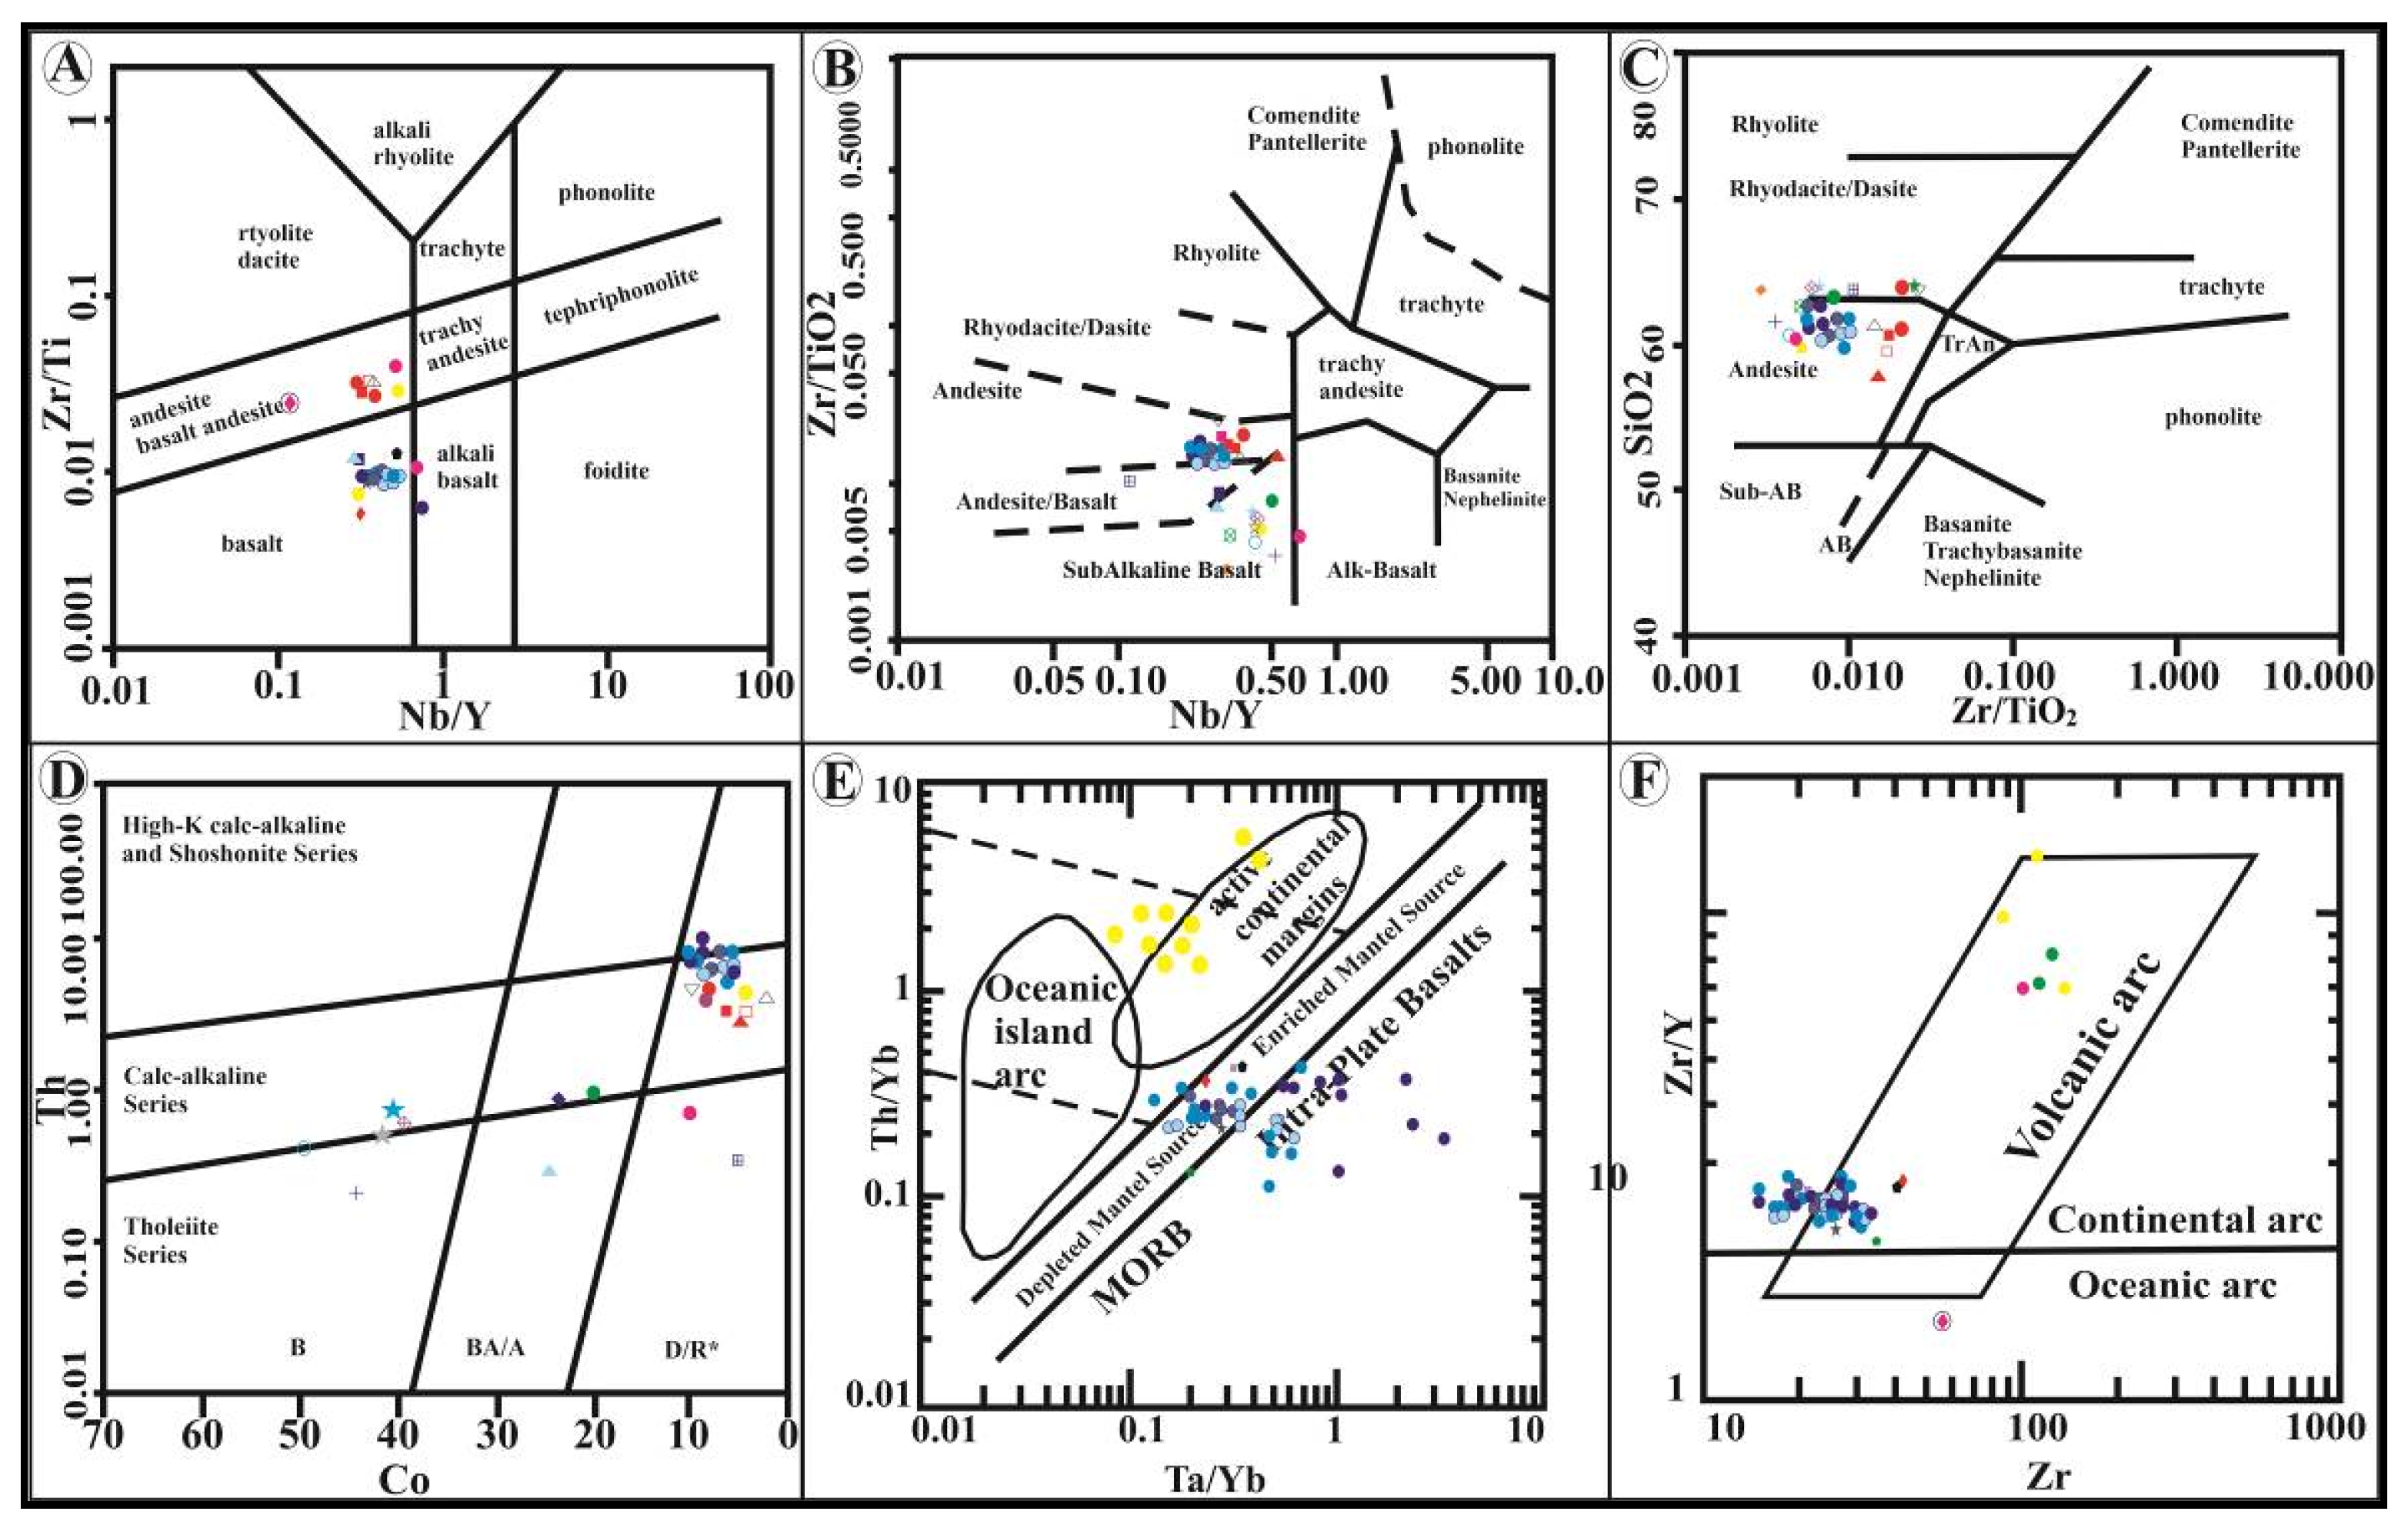
Twenty samples from volcanic outcrops and drill cores were selected for petrographic and geochemical analyses of major and trace elements, and 75 samples were analyzed specifically for trace and minor elements (Table 1). For rock classification and to minimize alteration effects, immobile elements were used. Based on the Nb/Y vs. Zr/Ti diagram [49], the volcanic rocks are mainly classified as andesite, basaltic andesite, basalt, and alkali basalt (Figure 12A). Using the Nb/Y vs. Zr/TiO2 plot [49], the samples are categorized as sub-alkaline basalt, basaltic andesite, and andesite (Figure 12B). The Zr/TiO2 vs. SiO2 plot indicates compositions ranging from andesite to dacite and rhyodacite (Figure 12C). Based on Co vs. Th [50], the samples fall within the calc-alkaline basalt–andesite–andesite series (Figure 12D). To distinguish between continental arc and island arc settings, Ta/Yb vs. Th/Yb (Figure 12E) and Zr vs. Zr/Y (Figure 12F) diagrams [51] were used. The samples plot within the continental arc field, indicating a source in an enriched mantle influenced by subduction-zone fluids. High Th contents likely result from crustal contamination and fluids derived from the subducted slab. Magmas from active continental margins typically show stronger enrichment in incompatible LREEs compared to island arc magmas, likely due to a combination of enriched mantle sources and crustal assimilation. The Zr vs. Zr/Y plot further confirms their placement within the continental volcanic arc field.
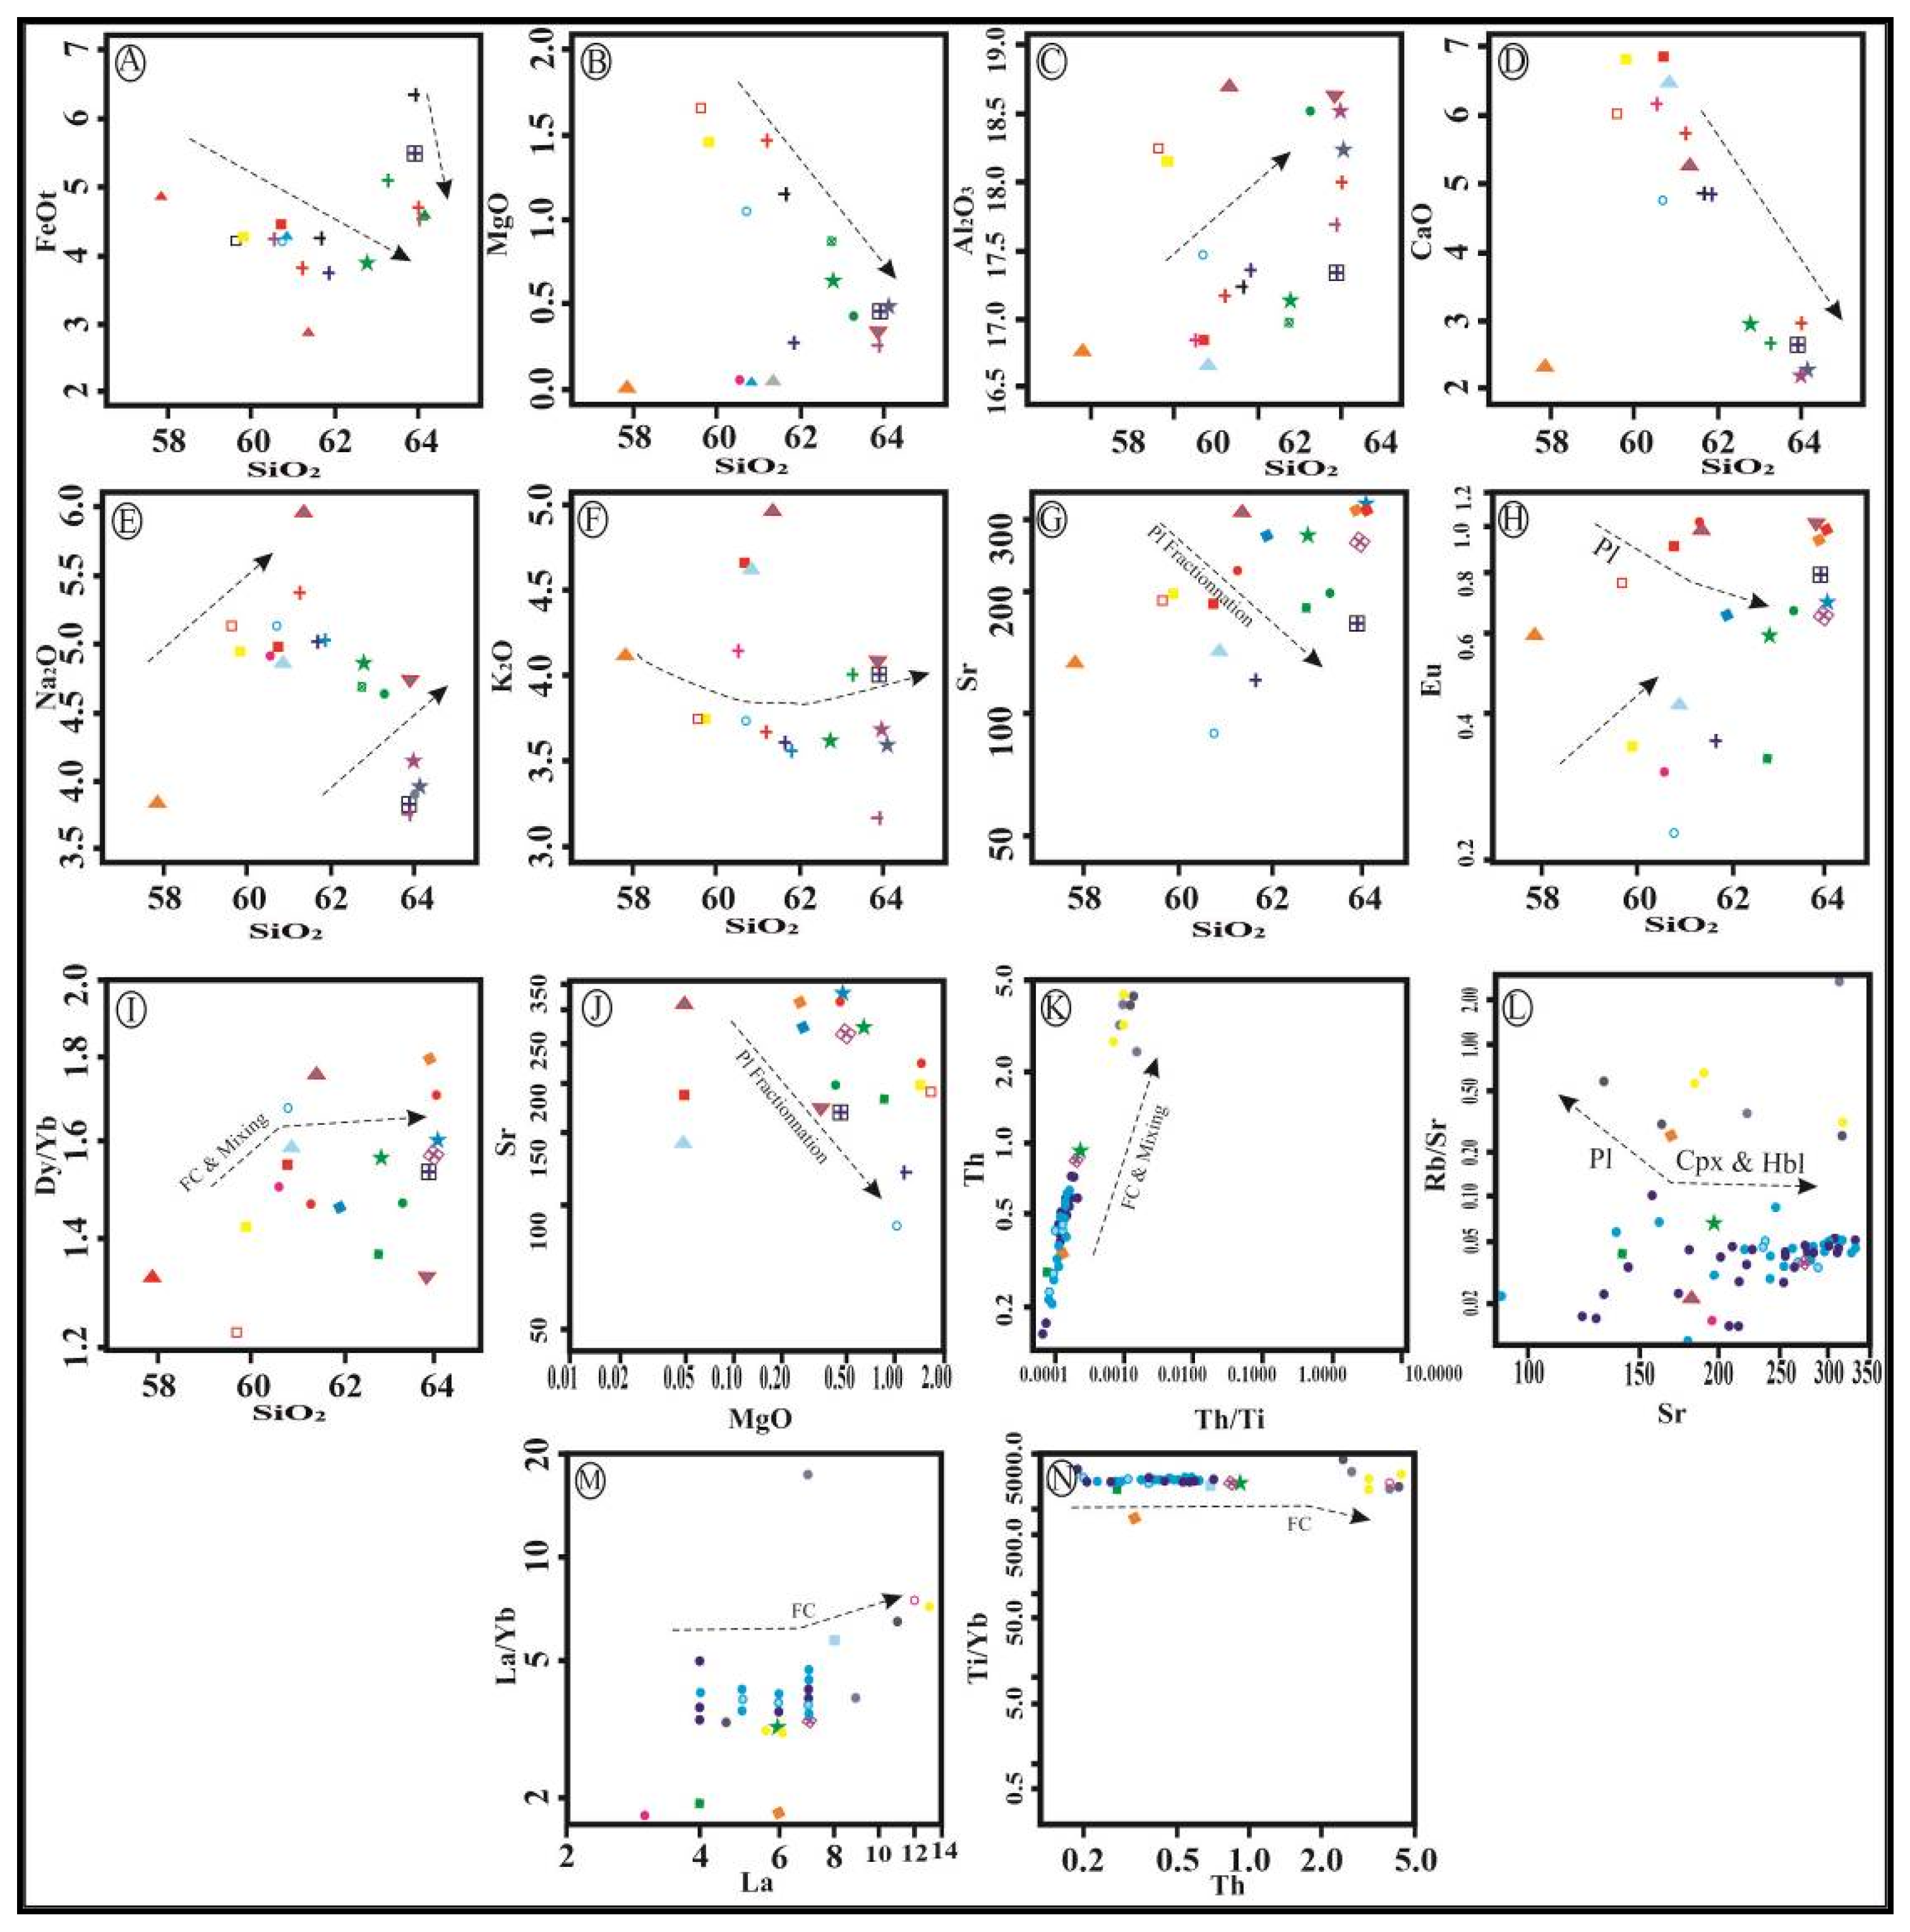
The SiO2 content in the volcanic rocks ranges from 57.85 to 64.1 wt%, with an average of 61.95 wt%. Al2O3 varies between 16.65 and 18.70 wt%, CaO from 2.18 to 6.82 wt%, Na2O from 3.76 to 5.97 wt%, K2O from 3.17 to 4.97 wt%, MgO from 0.01 to 1.66 wt%, TiO2 from 0.55 to 0.74 wt%, and total Fe2O3 (Fe2O3T) from 3.18 to 7.07 wt%. To understand the processes influencing magma evolution, such as fractional crystallization, binary plots of oxide–oxide, oxide–element, and element–element (Harker diagrams; [52]) were utilized. Generally, linear or negatively correlated trends suggest the influence of processes such as fractional crystallization, magma mixing, or crustal assimilation. However, significant scatter may reflect crystal accumulation, alteration, or crustal contamination [53]. Among the major oxides, Na2O and Al2O3 show increasing trends (Figure 13C,E). K2O versus SiO2 lacks a clear trend and shows scattered values (Figure 13F). In calc-alkaline suites, the concentrations of MgO, CaO, Fe2O3, and TiO2 decrease with increasing SiO2, which aligns with the volcanic rocks of the Sepid-Sarve deposit, reflecting the crystallization of ferromagnesian minerals as well as plagioclase, amphibole, and clinopyroxene fractionation [54] (Figure 13A,B). The decreasing CaO trend corresponds to plagioclase crystallization from anorthite to albite (Figure 13D). The increasing trends in Na2O and possibly K2O may be attributed to the presence of alkali feldspar in the final stages of crystallization or potassium addition during hydrothermal alteration. These trends overall highlight the role of continental crust in the magmatic evolution.
In the SiO2 vs. Sr diagram (Figure 13G), Sr shows a decreasing trend consistent with plagioclase fractionation at low pressure. Since Sr is compatible in plagioclase but not in clinopyroxene, this trend also corresponds to the decreasing CaO pattern due to plagioclase evolution. Europium (Eu) first increases with increasing SiO2 and then decreases, reflecting plagioclase involvement in magma evolution, further supported by a positive correlation between Sr and Eu (Figure 13H). The Dy/Yb ratio shows a slight decrease with increasing SiO2, indicating hornblende or clinopyroxene fractionation (Figure 13I). Sr content also decreases with MgO, suggesting plagioclase removal (Figure 13J). The Rb/Sr ratio first decreases and then increases with increasing Sr, displaying an almost linear trend consistent with plagioclase, hornblende, and clinopyroxene fractionation [55] (Figure 13L).
The Th/Ti vs. Th (Figure 13K), La vs. La/Yb (Figure 13M), and Th vs. Ti/Yb (Figure 13N) diagrams [56] indicate crustal contamination during magmatic differentiation in the Sepid-Sarve region.
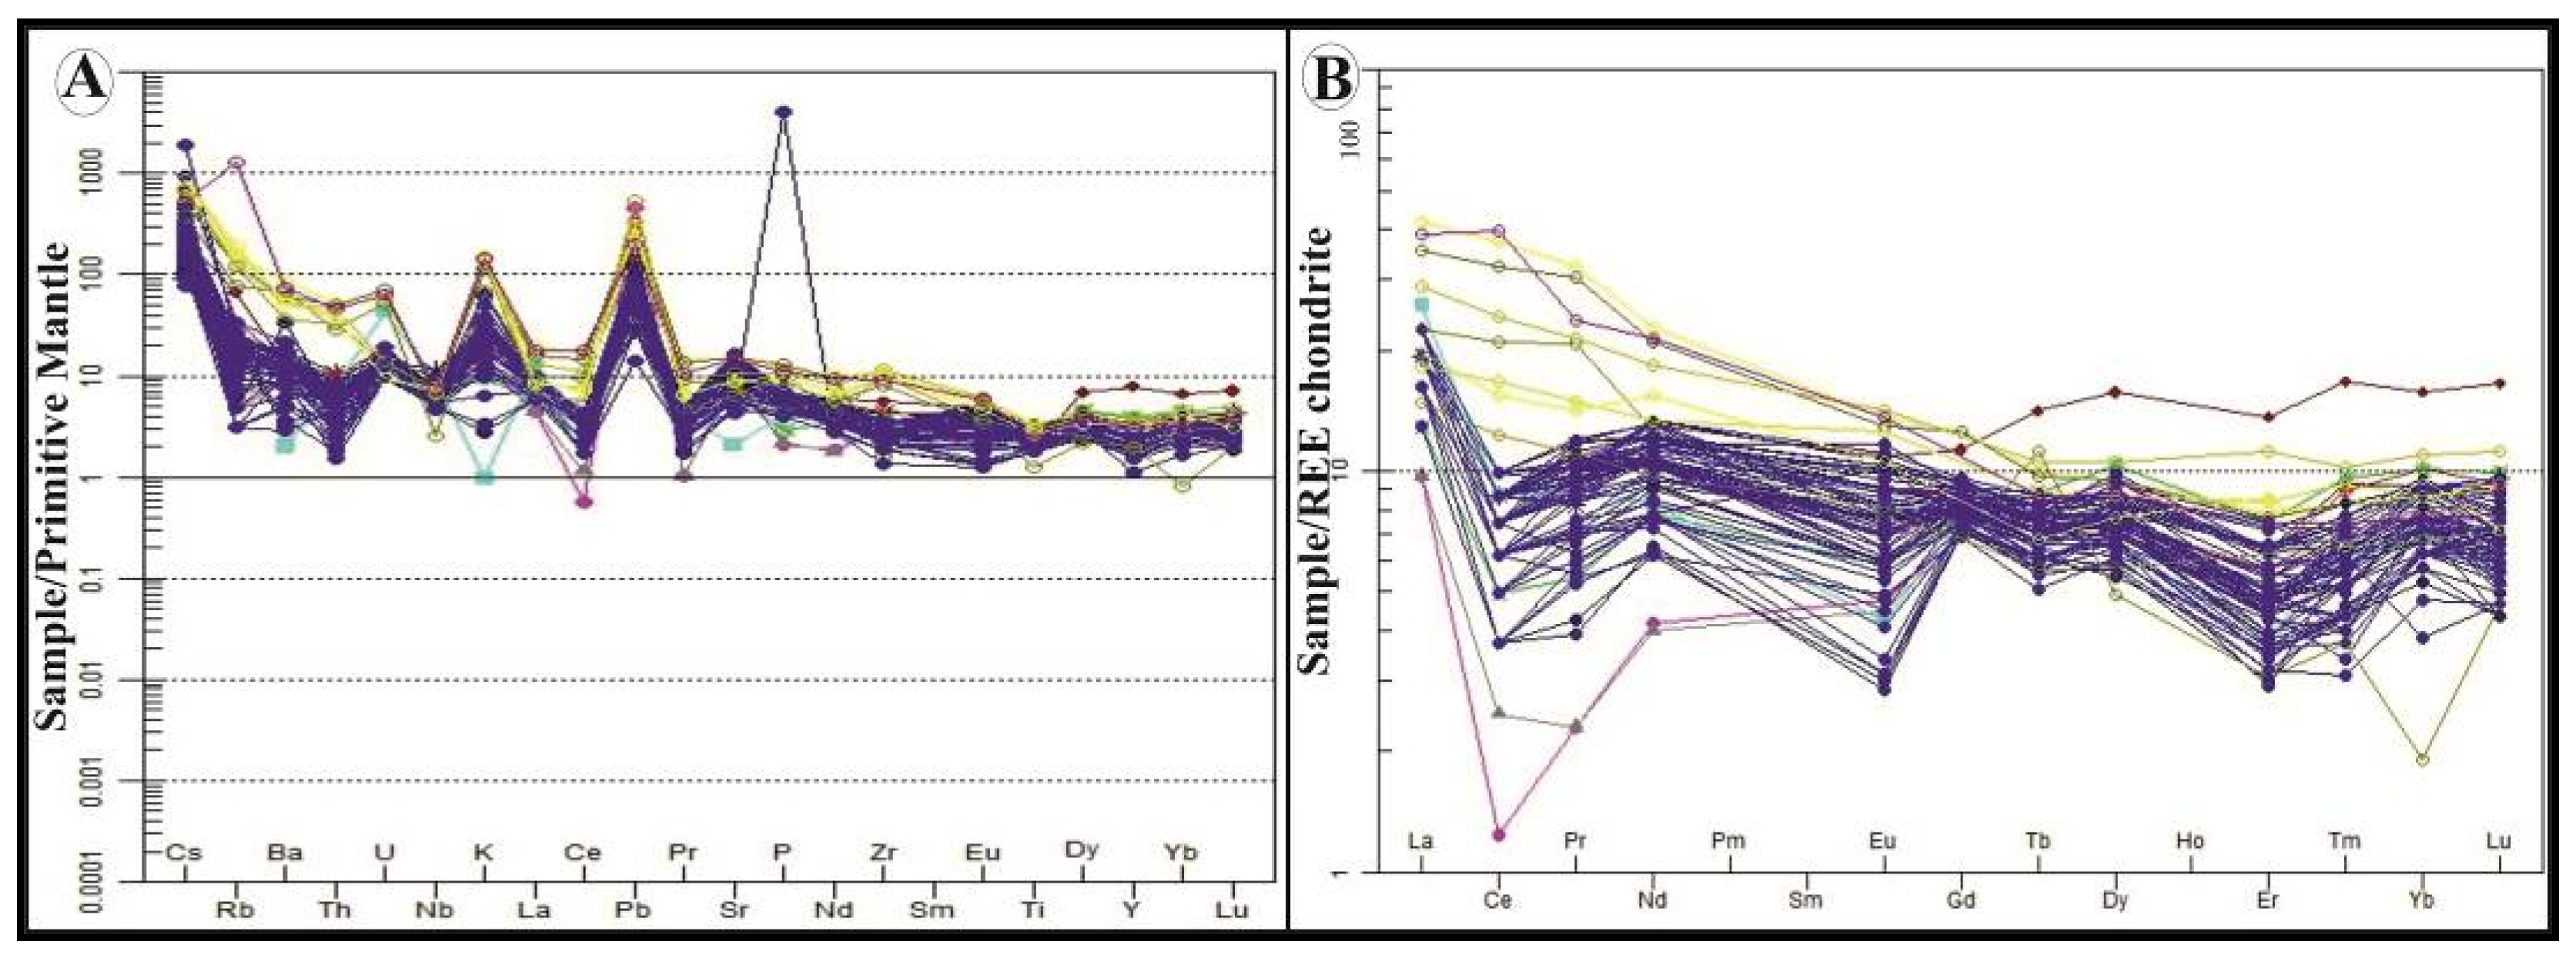
Spider diagrams normalized to primitive mantle [57] show negative slopes with enrichment of LILEs over HFSEs, and depletion in HREEs—features characteristic of calc-alkaline magmas. The observed positive Pb anomaly is indicative of crustal contamination during magma evolution (Figure 14A). In the chondrite-normalized REE diagram, volcanic rocks from Sepid-Sarve exhibit moderate LREE enrichment, HREE depletion, and weak negative Eu anomalies, further reflecting plagioclase fractionation and a continental arc signature (Figure 14B).
Figure 12. Geochemical discrimination diagrams used to identify the magma series and tectonomagmatic nature of the volcanic rocks in the Sepid-Sarve copper deposit: (A) Nb/Y vs. Zr/Ti [58], (B) Nb/Y vs. Zr/TiO2 [49], (C) Zr/TiO2 vs. SiO2 [49], (D) Co vs. Th [50], (E) Ta/Yb vs. Th/Yb [51], (F) Zr vs. Zr/Y [51].
Minerals 15 01246 g012
Figure 13. Harker variation diagrams used for petrogenetic interpretation of the volcanic rocks from the Sepid-Sarve copper deposit: (A) SiO2 vs. FeOt, (B) SiO2 vs. MgO, (C) SiO2 vs. Al2O3, (D) SiO2 vs. CaO, (E) SiO2 vs. Na2O, (F) SiO2 vs. K2O, (G) SiO2 vs. Sr, (H) SiO2 vs. Eu, (I) SiO2 vs. Dy/Yb, (J) MgO vs. Sr, (K) Th/Ti vs. Th, (L) Sr vs. Rb/Sr, (M) La vs. La/Yb, (N) Th vs. Ti/Yb [53,55,59,60].
Minerals 15 01246 g013
Figure 14. (A) Primitive mantle–normalized trace element patterns for rock samples from the Sepid-Sarve deposit. Normalization values are from [57]. (B) Chondrite-normalized REE patterns for samples from the Sepid-Sarve deposit, with chondrite values from [61].
Minerals 15 01246 g014

4.4. Fluid Inclusions

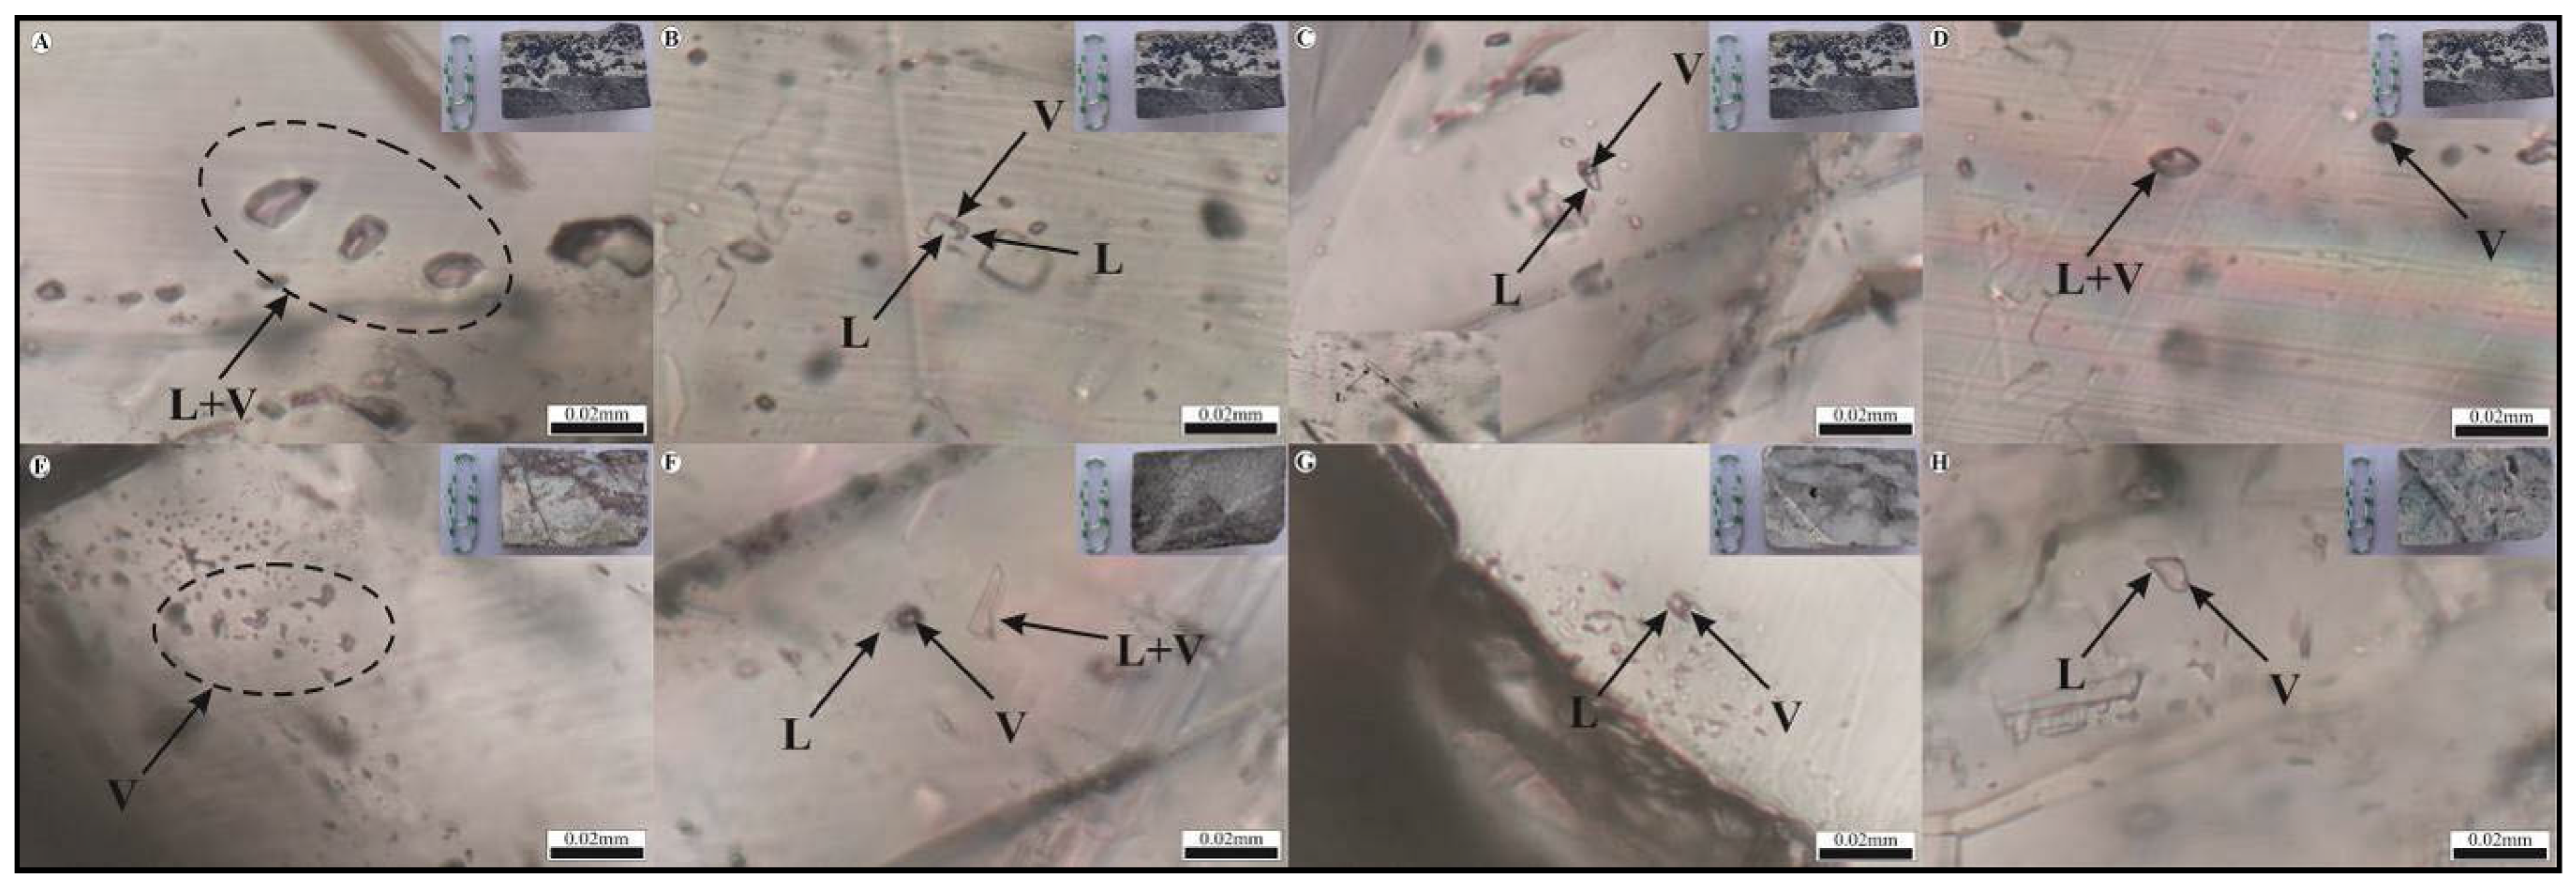
In the Sepid-Sarve copper deposit, fine-crystalline calcite is the most abundant and significant mineral associated with the main mineralizing fluid. The studied fluid inclusions occur as Mono-phase (liquid, L; vapor, V) and two-phase liquid-rich plus vapor-rich (L + V) types (Figure 15B,F), mostly irregular, rectangular, spherical, or elliptical in shape, and dark in color. Mono-phase vapor inclusions range from 5 to 15 microns, predominantly irregular in shape. Two-phase liquid-rich inclusions constitute 5%–40% of the inclusion volume, mostly irregular to elliptical, with sizes between 2 and 10 microns. Two-phase vapor-rich inclusions measure about 14 microns, with spherical to flattened shapes. Overall, fluid inclusion sizes in the deposit range from a few microns upward. Mono-phase vapor inclusions occur sporadically and individually within the host (Figure 15D,E), while liquid-rich two-phase inclusions are mostly isolated (Figure 15A,C,G,H).
The results of the studies are summarized in Table 2, based on the type of phase and mineralization.
Homogenization temperatures (Th) of vapor + liquid (V + L) inclusions range from 90 to 386 °C, averaging 193.75 °C, while for liquid + vapor (L + V) inclusions, Th ranges from 265 to 341 °C, averaging 302.6 °C (Figure 13A). The first melting temperature is directly related to the salt composition of the hydrothermal fluid [61] (Figure 16B). Salinity varies from 3.08 to 13.38 wt.% NaCl, with an average of 7.56 wt.% (Figure 16C).
Based on fluid inclusion studies, the formation temperature of the Sepid-Sarve copper deposit ranged between 90 and 386 °C, originating from a solution containing 3.08 to 13.38 wt.% NaCl. The final ice melting temperatures of fluid inclusions vary from –6.9 to –8.1 °C. Salinity, a key factor influencing fluid density, was evaluated using homogenization temperature versus salinity plots for mineralizing inclusions from Sepid-Sarve [62]. Fluid densities vary between 0.7 and 1 g/cm3 (Figure 17A,B). A decrease in homogenization temperature from 386 to 90 °C corresponds to a density increase from below 0.7 to 1 g/cm3, resulting in reduced fluid velocity and enhanced mineral precipitation.
The increase in salinity in fluid inclusions over the 90 to 386 °C range is accompanied by rising density. This process is linked to boiling phenomena whereby, due to cooling or pressure drop, fluids evolve toward a denser, more saline phase compared to the initial fluid. However, salinity increase with decreasing temperature cannot be solely explained by simple boiling. Reference [63] argued that boiling-induced salinity increases are relatively small compared to the larger salinity variations observed here (Figure 17B). Meteoric waters with low temperature and salinity infiltrate faults and fractures, mixing with magmatic fluids and producing convective fluid mixing between deep intrusive bodies and shallower levels.
The homogenization temperature–salinity diagram reflects a progressive cooling and dilution of the mineralizing fluid, with both temperature and salinity declining during late-stage deposition (Figure 17C). Hydrothermal systems dominated by hydrostatic pressure commonly experience boiling, and vapor pressure can be used to estimate trapping depths. Such systems generally relate to near-surface environments within the upper ~3 km of the crust [64,65].
The coexistence of liquid-rich, vapor-rich, two-phase inclusions with varying fill volumes, as well as some homogenized vapor inclusions, confirms boiling processes in the study area. Using the [66] diagram, the depth of mineralization in Sepid-Sarve was estimated based on homogenization temperatures ranging from 90 to 386 °C.
To identify the dominant metal-bearing complex, fluid inclusion data were plotted on the [67] diagram, showing that Sepid-Sarve fluids fall within the sulfide complex field (Figure 18A). This suggests sulfate (SO42−) or bisulfide (HS) as the dominant anions, consistent with the presence of minerals such as chalcocite and bornite.
According to [65] classification of ore-forming systems based on salinity and homogenization temperature, the Sepid-Sarve samples fall within the epithermal deposit range (Figure 18B,C). Origin determination using the [68] diagram indicates that the fluids derive from magmatic waters, metamorphic waters, and meteoric waters, which likely reacted with host rocks during ascent, migrating along faults and fractures to deposit metals at the contact between conglomerate, andesite, agglomerate, and nummulitic limestone.
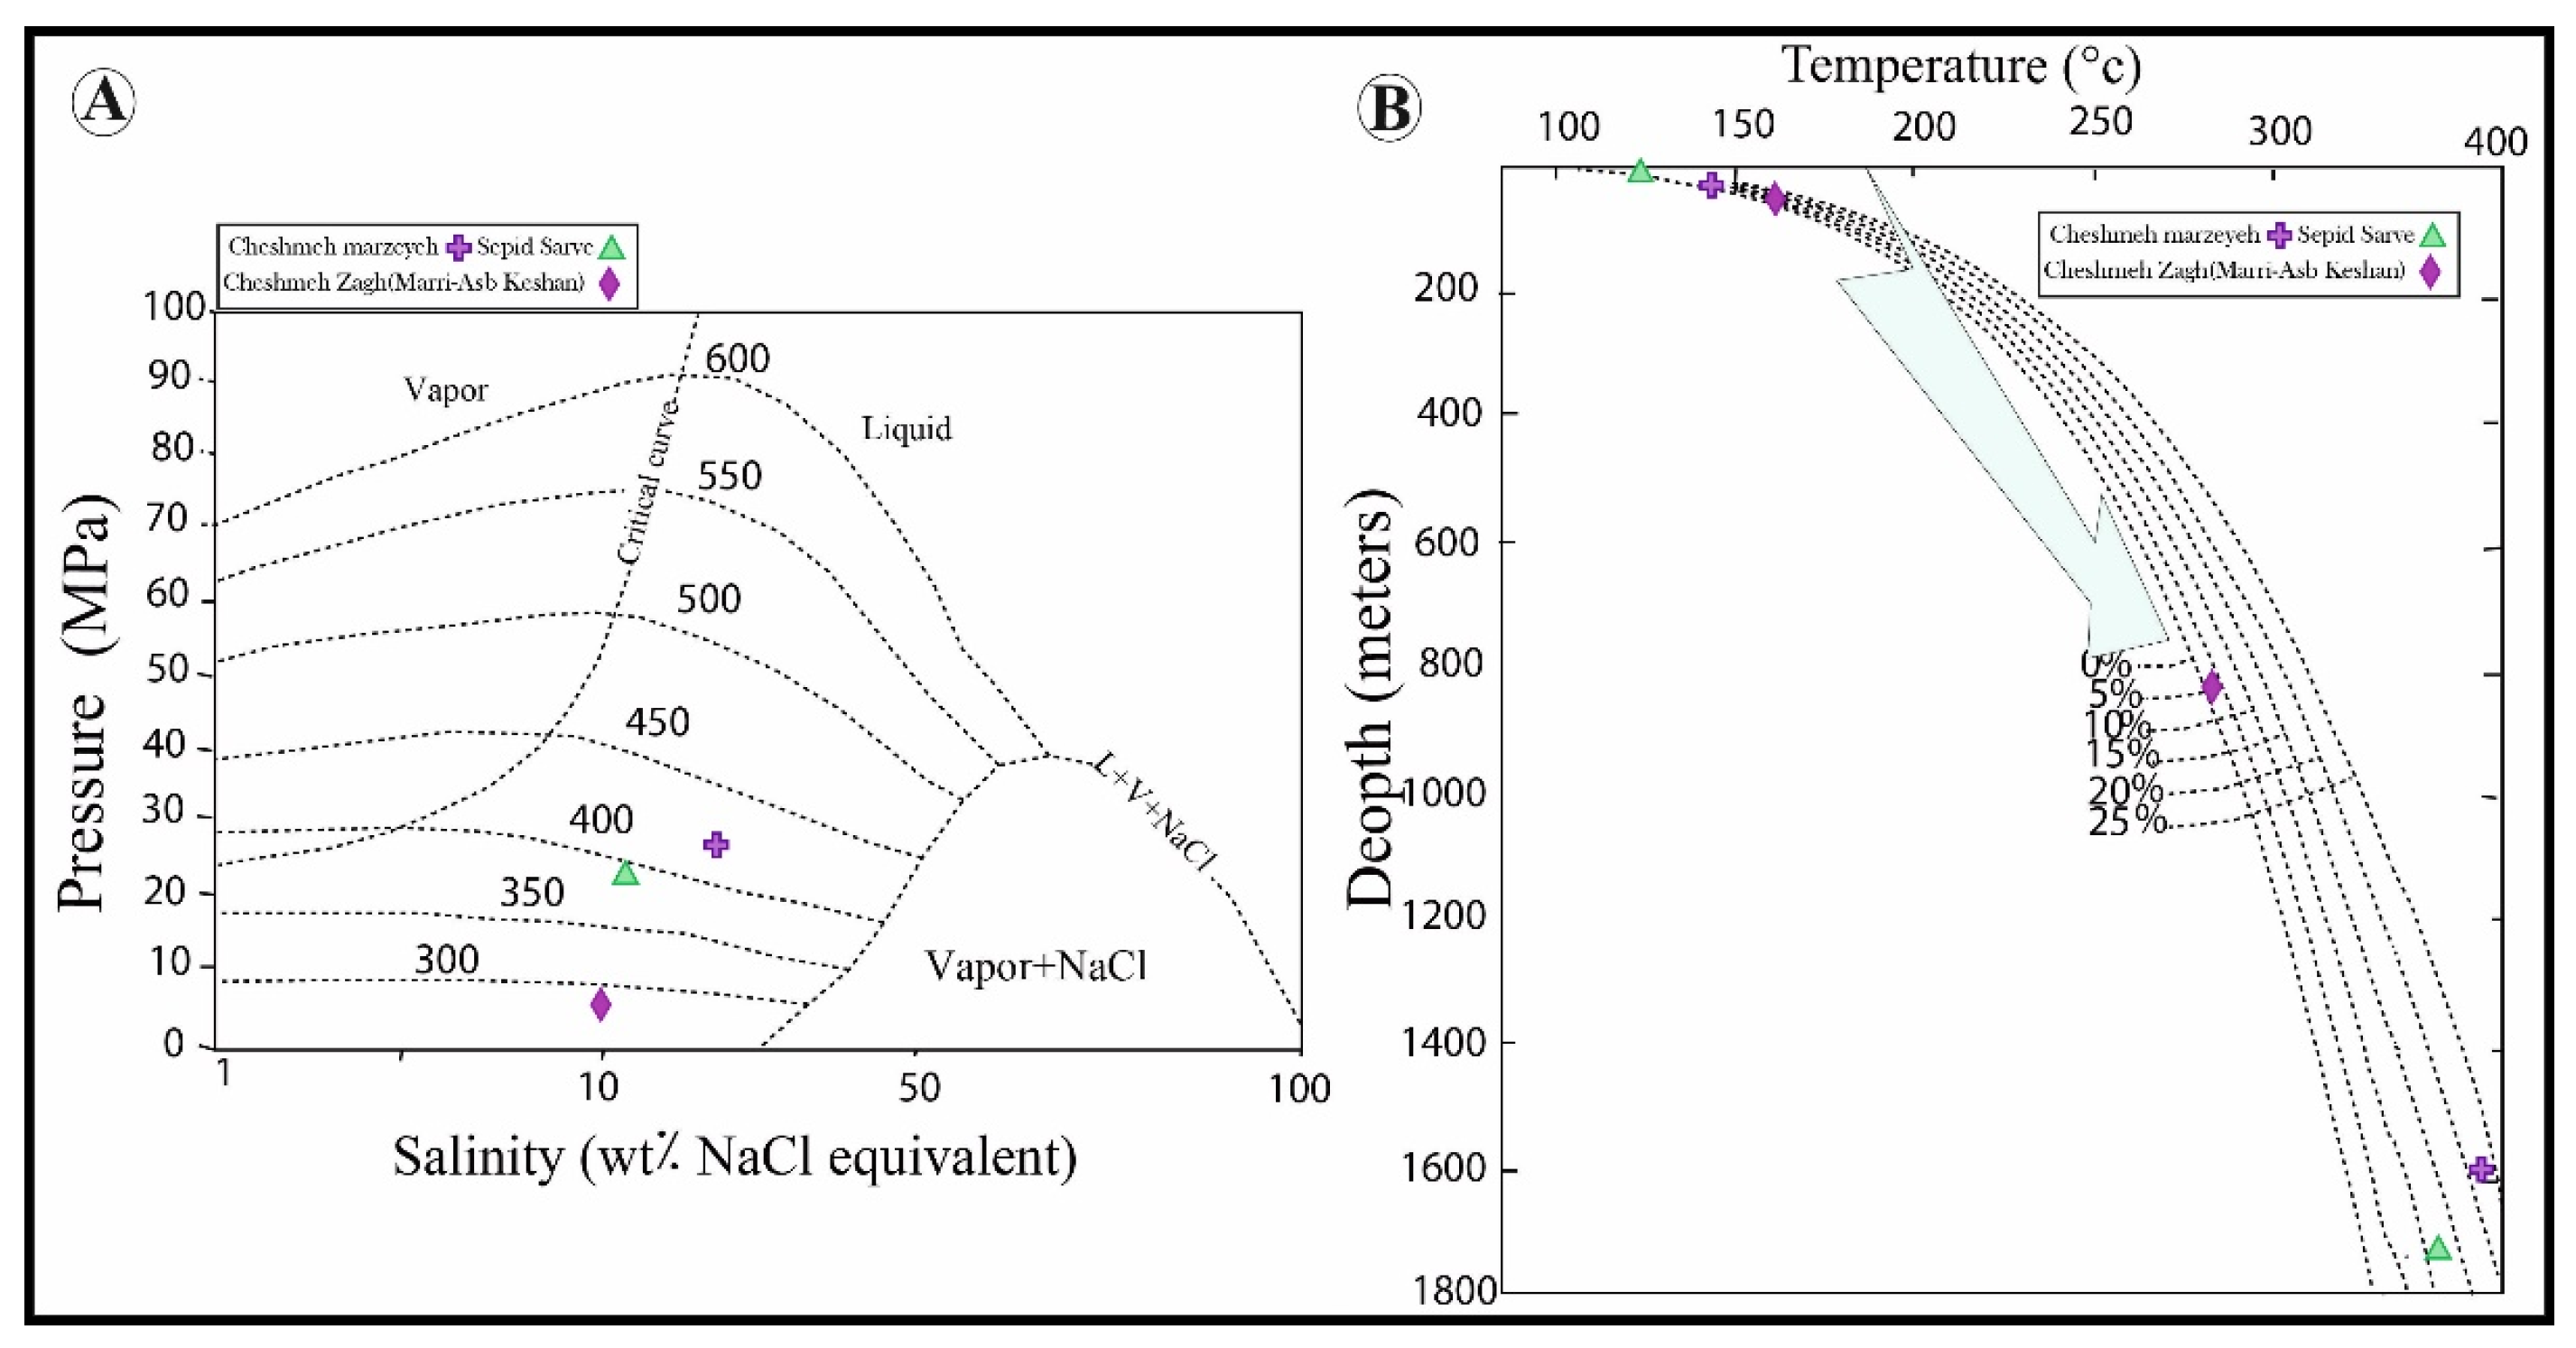
Using homogenization temperatures and boiling point data, and applying [66], the trapping pressure of fluid inclusions was calculated via P = Hρg, yielding pressures between 240 and 260 bar (Figure 19A). The relationship between homogenization temperature and pressure is illustrated in Figure 19. The most frequent homogenization temperature range (100–300 °C) corresponds to trapping depths between ~100 and 1550 m (Figure 19B).
Figure 17. (A) Homogenization temperature-salinity plot showing fluid densities ranging from 0.7 to 1.0 g/cm3 in the Sepid-Sarve copper deposit [69]. (B) Homogenization temperature-salinity diagram [70] indicating boiling and cooling processes in the studied deposit. (C) Homogenization temperature-salinity plot delineating the magmatic to epithermal fluid range in the deposit [71].
Minerals 15 01246 g017
Figure 18. (A) Homogenization temperature versus salinity diagram for determining dominant metal complexes [67]. (B) Homogenization temperature versus salinity plot of various deposit types [65], with the Sepid-Sarve copper deposit samples falling within the epithermal deposit field. (C) Salinity versus homogenization temperature diagram of fluid inclusions showing different water-type fields [72].
Minerals 15 01246 g018
Figure 19. (A) Pressure vs. salinity diagram showing fluid inclusion pressures of 26/5–28/5 MPa in the Sepid-Sarve copper deposit [69]. (B) Homogenization temperature versus depth diagram for estimating trapping depth of fluids in the Sepid-Sarve copper deposit [66].
Minerals 15 01246 g019

4.5. Stable Isotopes

4.5.1. Sulfur Isotopes

To investigate the origin and nature of ore-forming and alteration-related fluids in the Sepid-Sarve copper deposit, sulfur and oxygen isotope analyses were conducted. Three sulfide mineral samples and two silica mineral samples were selected. Sample preparation was performed at a laboratory in Tehran, after which the specimens were sent to the Stable Isotope Research Laboratory at Arak University for isotopic analysis (Table 3). Sulfur isotope fractionation occurs via two principal mechanisms that result in natural variations of δ34S values in different environments and materials [73]: (a) Abiotic isotopic fractionation, which takes place through various chemical exchange reactions between sulfate and sulfide species, or among different types of sulfides; (b) Biological (kinetic) isotopic fractionation, which occurs through microbial metabolic processes, leading to the preferential incorporation of lighter sulfur isotopes (32S) into biologically derived products. In hydrothermal systems, sulfur is primarily present in reduced forms such as H2S, HS, and S2−, which play key roles in ore deposition processes [74]. The most stable sulfur species in reducing and alkaline environments are H2S and HS. Under these conditions, the oxygen fugacity (fO2) and pH of the hydrothermal fluids tend to be low, and the δ34S values of deposited sulfide minerals generally reflect those of the total sulfur in the fluid [75].
The sulfide minerals in the Sepid-Sarve copper deposit exhibit a relative depletion in the heavy sulfur isotope (34S). One plausible explanation for this isotopic depletion is that hydrothermal sulfur was derived from the leaching of sulfide minerals in reduced sedimentary environments [72]. The δ34S values of H2S in the ore-forming hydrothermal fluid are estimated to range from −22.7‰ to −2.7‰. For comparison, δ34S values in peridotitic kimberlites of mantle origin are approximately 0 ± 1‰, and in basaltic rocks typically range between 0‰ and 5‰ [72]. However, recycling of crustal materials (e.g., sulfides and marine sulfates) in subduction zones, as well as mantle contamination, can cause significant heterogeneity in mantle sulfur isotopic values, ranging from −10‰ to +10‰ [76]. Therefore, the isotopic composition of the hydrothermal fluid may suggest a magmatic origin.
Sulfur in the Sepid-Sarve deposit may have been sourced either from the leaching of primary volcanic-hosted sulfide minerals or directly from magmatic-hydrothermal fluids. One contributing factor to the 34S depletion could be the preferential leaching of 32S (due to its higher reactivity compared to 34S; [73]) from volcanic and pyroclastic host rocks by meteoric-dominated hydrothermal fluids. Another factor may be isotopic fractionation between sulfate and sulfide species in the hydrothermal fluid. Following isotopic equilibrium fractionation and subsequent 34S depletion in sulfides, two potential scenarios could have occurred:
  • During sulfide mineralization, the hydrothermal fluid expelled and dispersed the sulfate phase away from the vein system. The scarcity of sulfate minerals alongside sulfides may support this removal of sulfate-bearing fluids during or after mineralization. This scenario is consistent with acidic and oxidizing conditions that facilitate sulfide precipitation from sulfur complexes and promote sulfate phase separation.
  • Prior to the current stage of sulfide deposition, the sulfate phase may have precipitated at greater depths, allowing the upward migration of a sulfide-dominant hydrothermal fluid into the vein system, where it precipitated 34S-depleted sulfide minerals.
Another possible mechanism responsible for the observed 34S depletion is the derivation of sulfur from sedimentary sequences containing biogenic sulfides, which were leached by meteoric-dominated hydrothermal fluids. However, considering the fluid inclusion temperatures and the absence of sulfur-bearing sedimentary host rocks, a biogenic sulfur source and bacterial reduction processes are unlikely. Instead, the mixing of meteoric and magmatic waters likely produced a system in which both sulfate and reduced sulfur were generated.
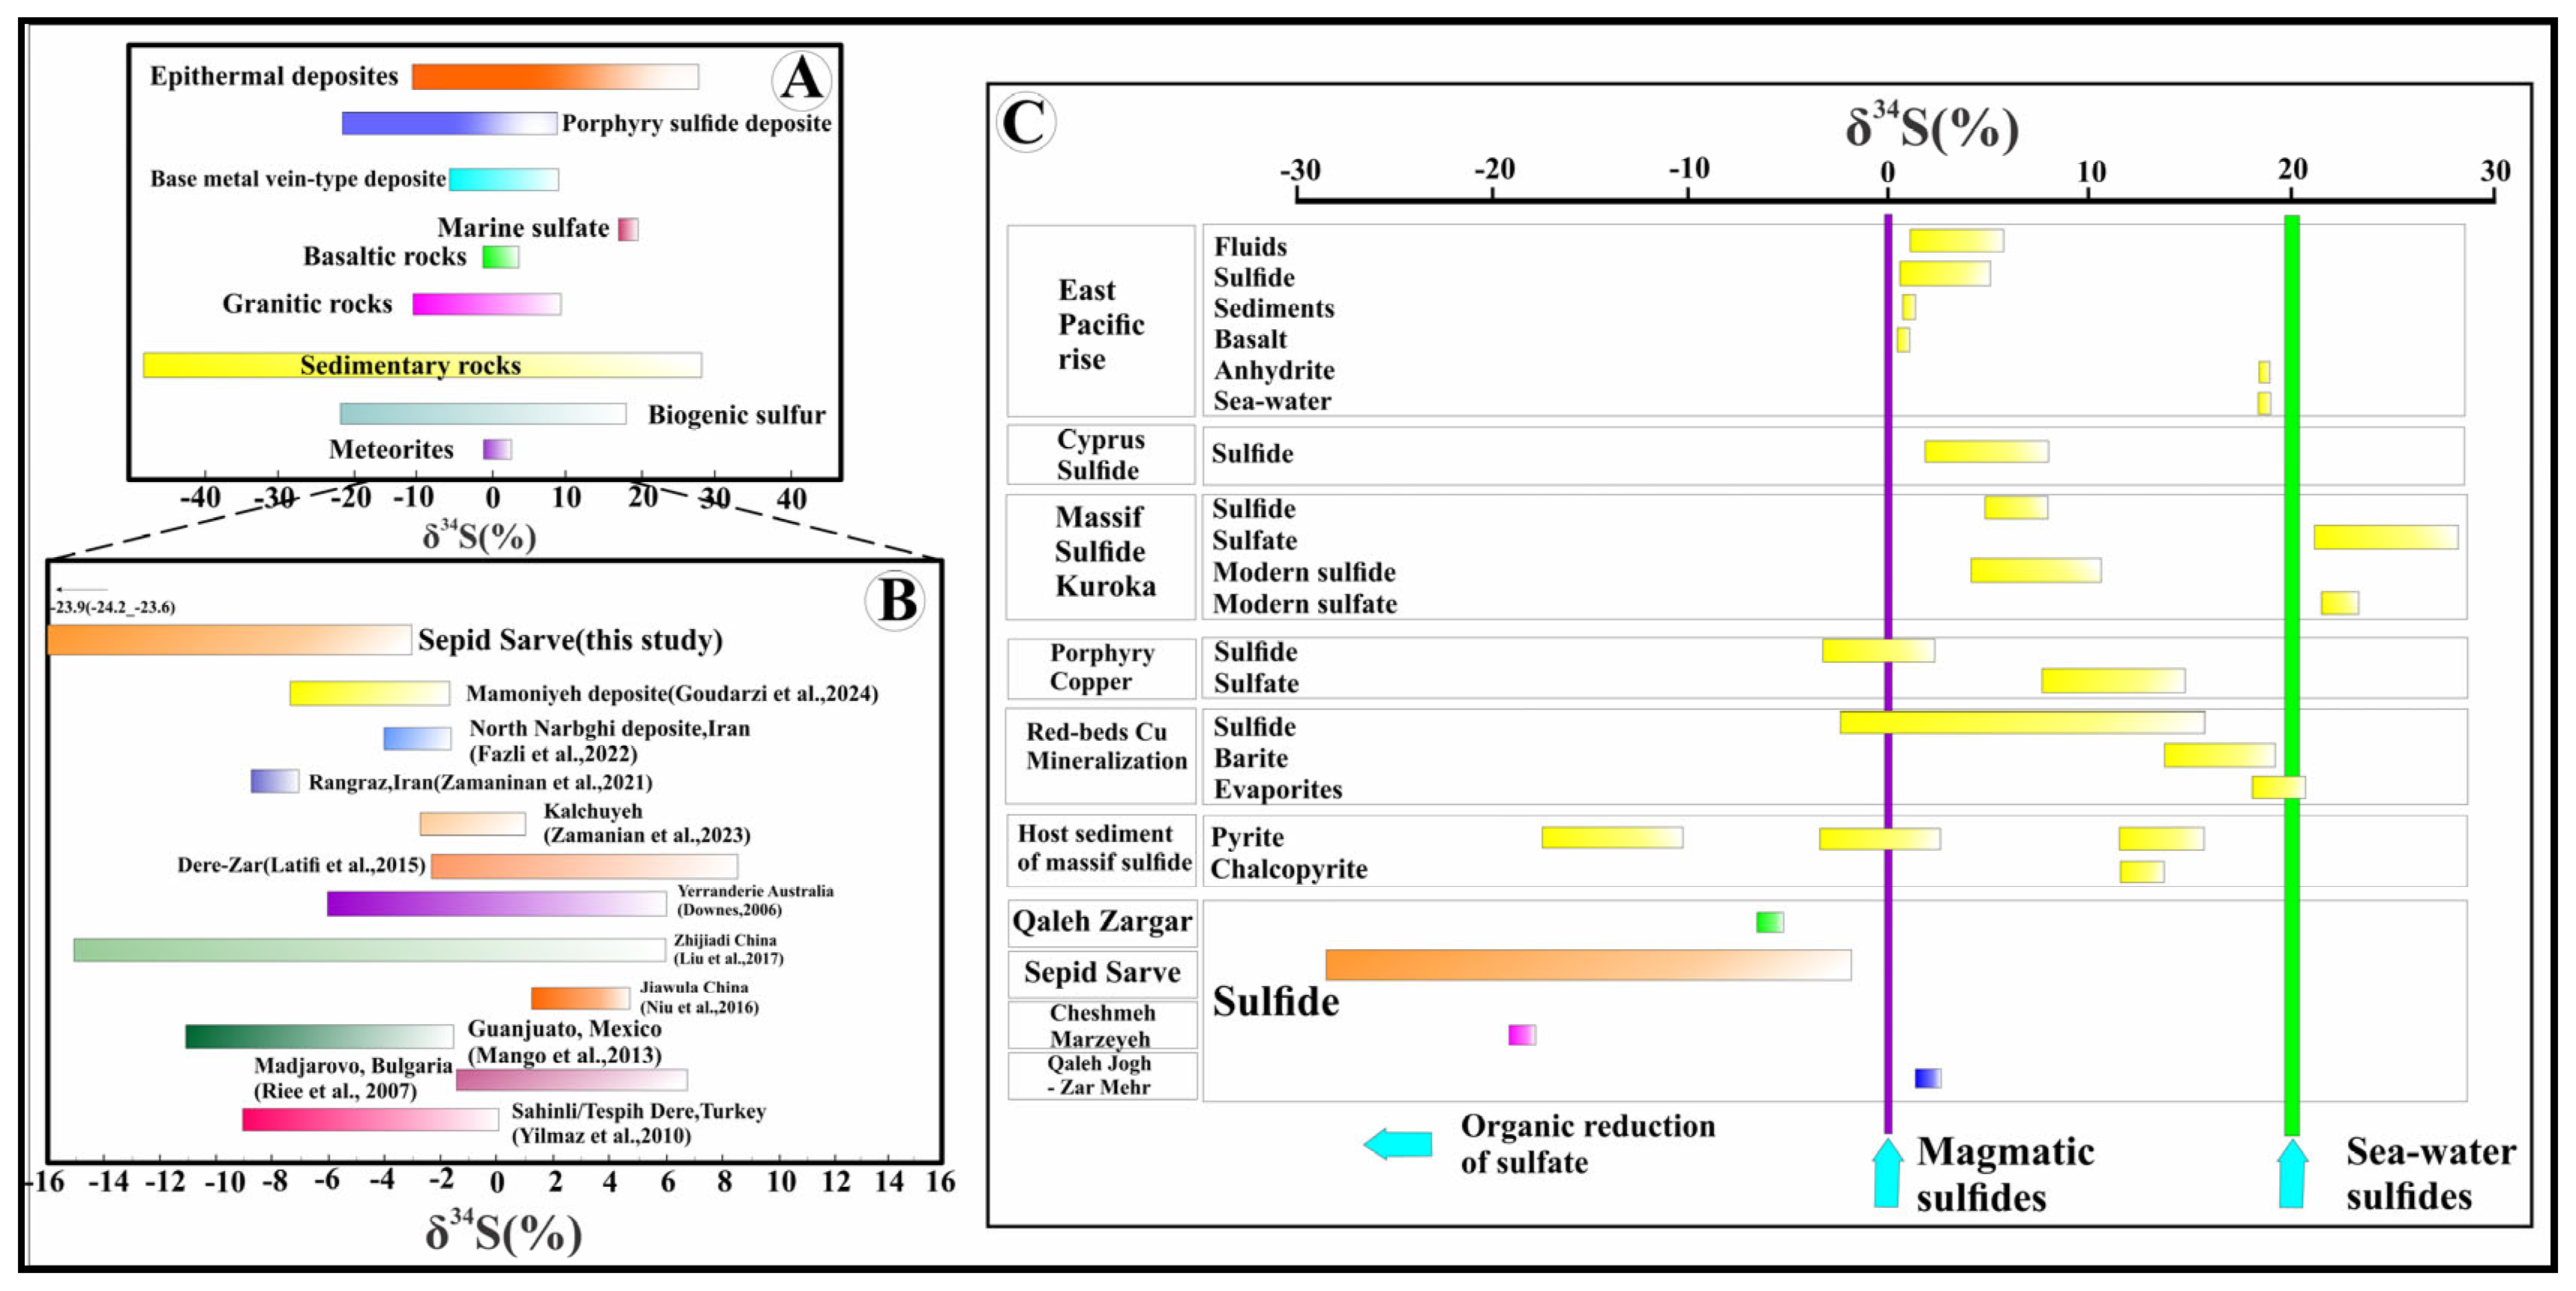
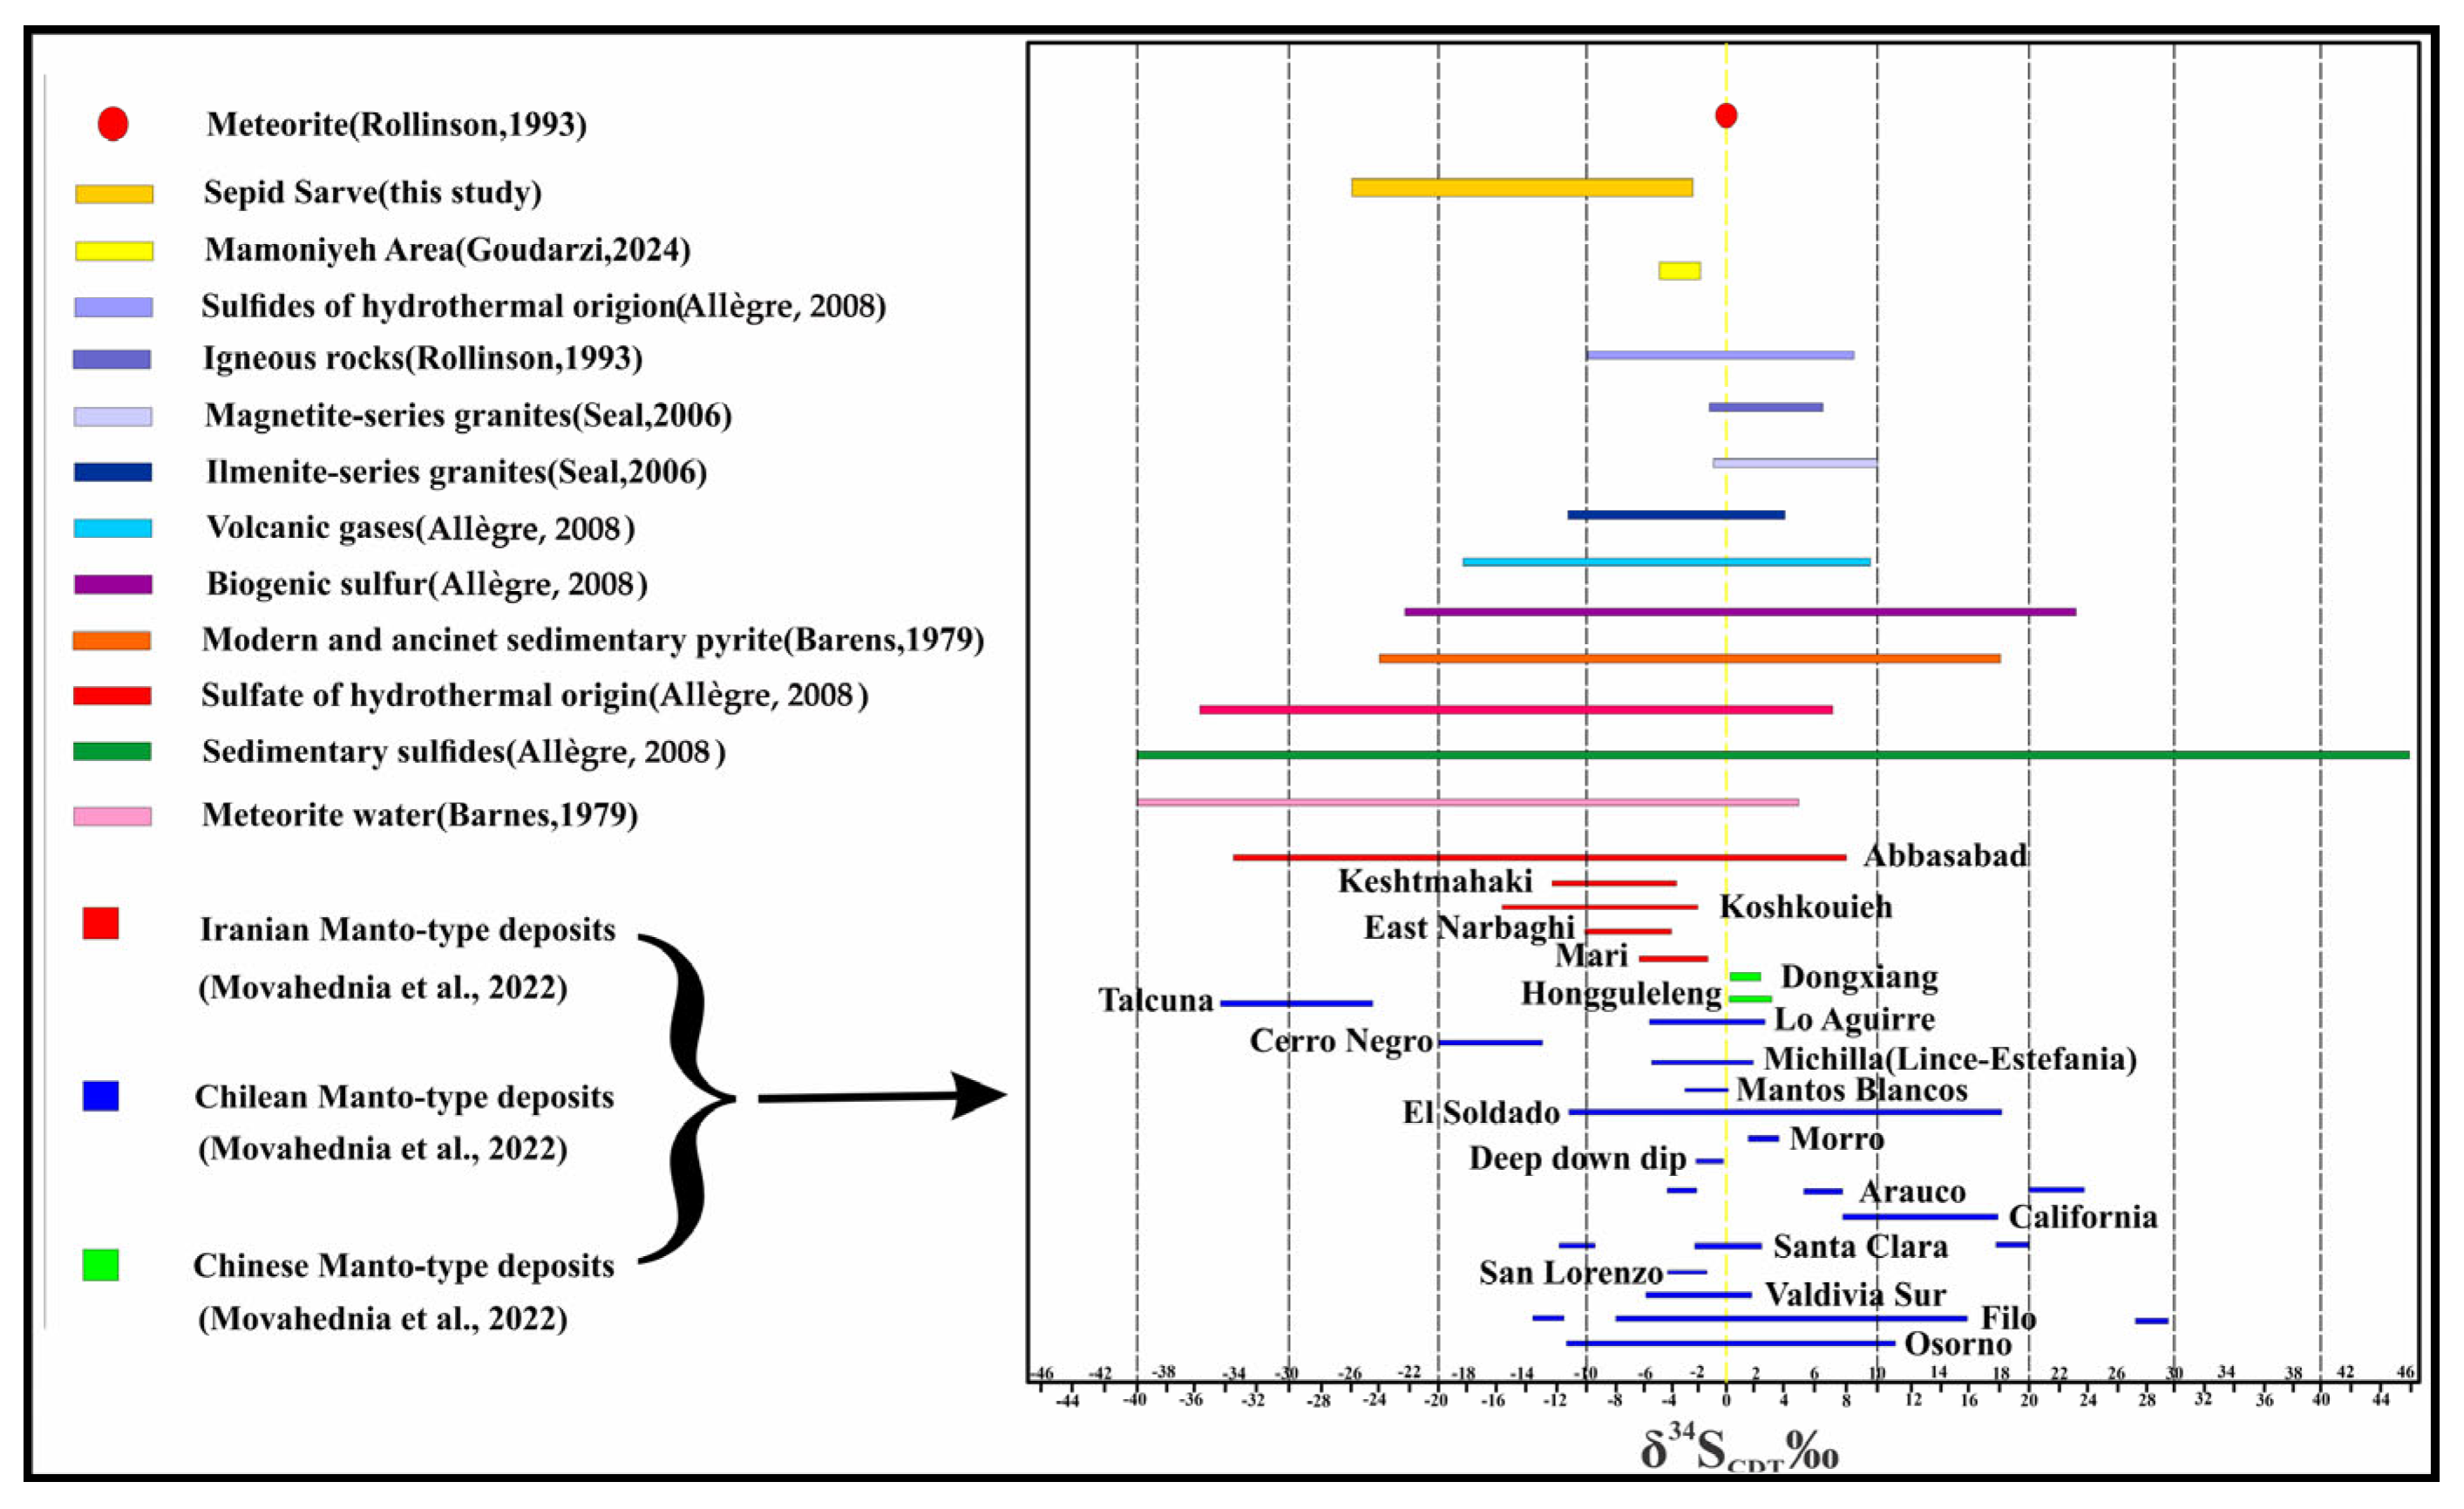
The δ34S values of sulfide minerals in the Sepid-Sarve deposit, when compared to various geological environments and sulfur sources, closely resemble those from ilmenite-series granites and hydrothermal sulfides (Figure 20A–C). Additionally, Figure 21 compares the δ34S values of Sepid-Sarve with those from other deposits in Central Iran, the Urumieh–Dokhtar belt, and other global analogues. These comparisons suggest that sulfide mineralization in the Sepid-Sarve deposit was formed from fluids that derived sulfur predominantly via the reduction in seawater sulfate.

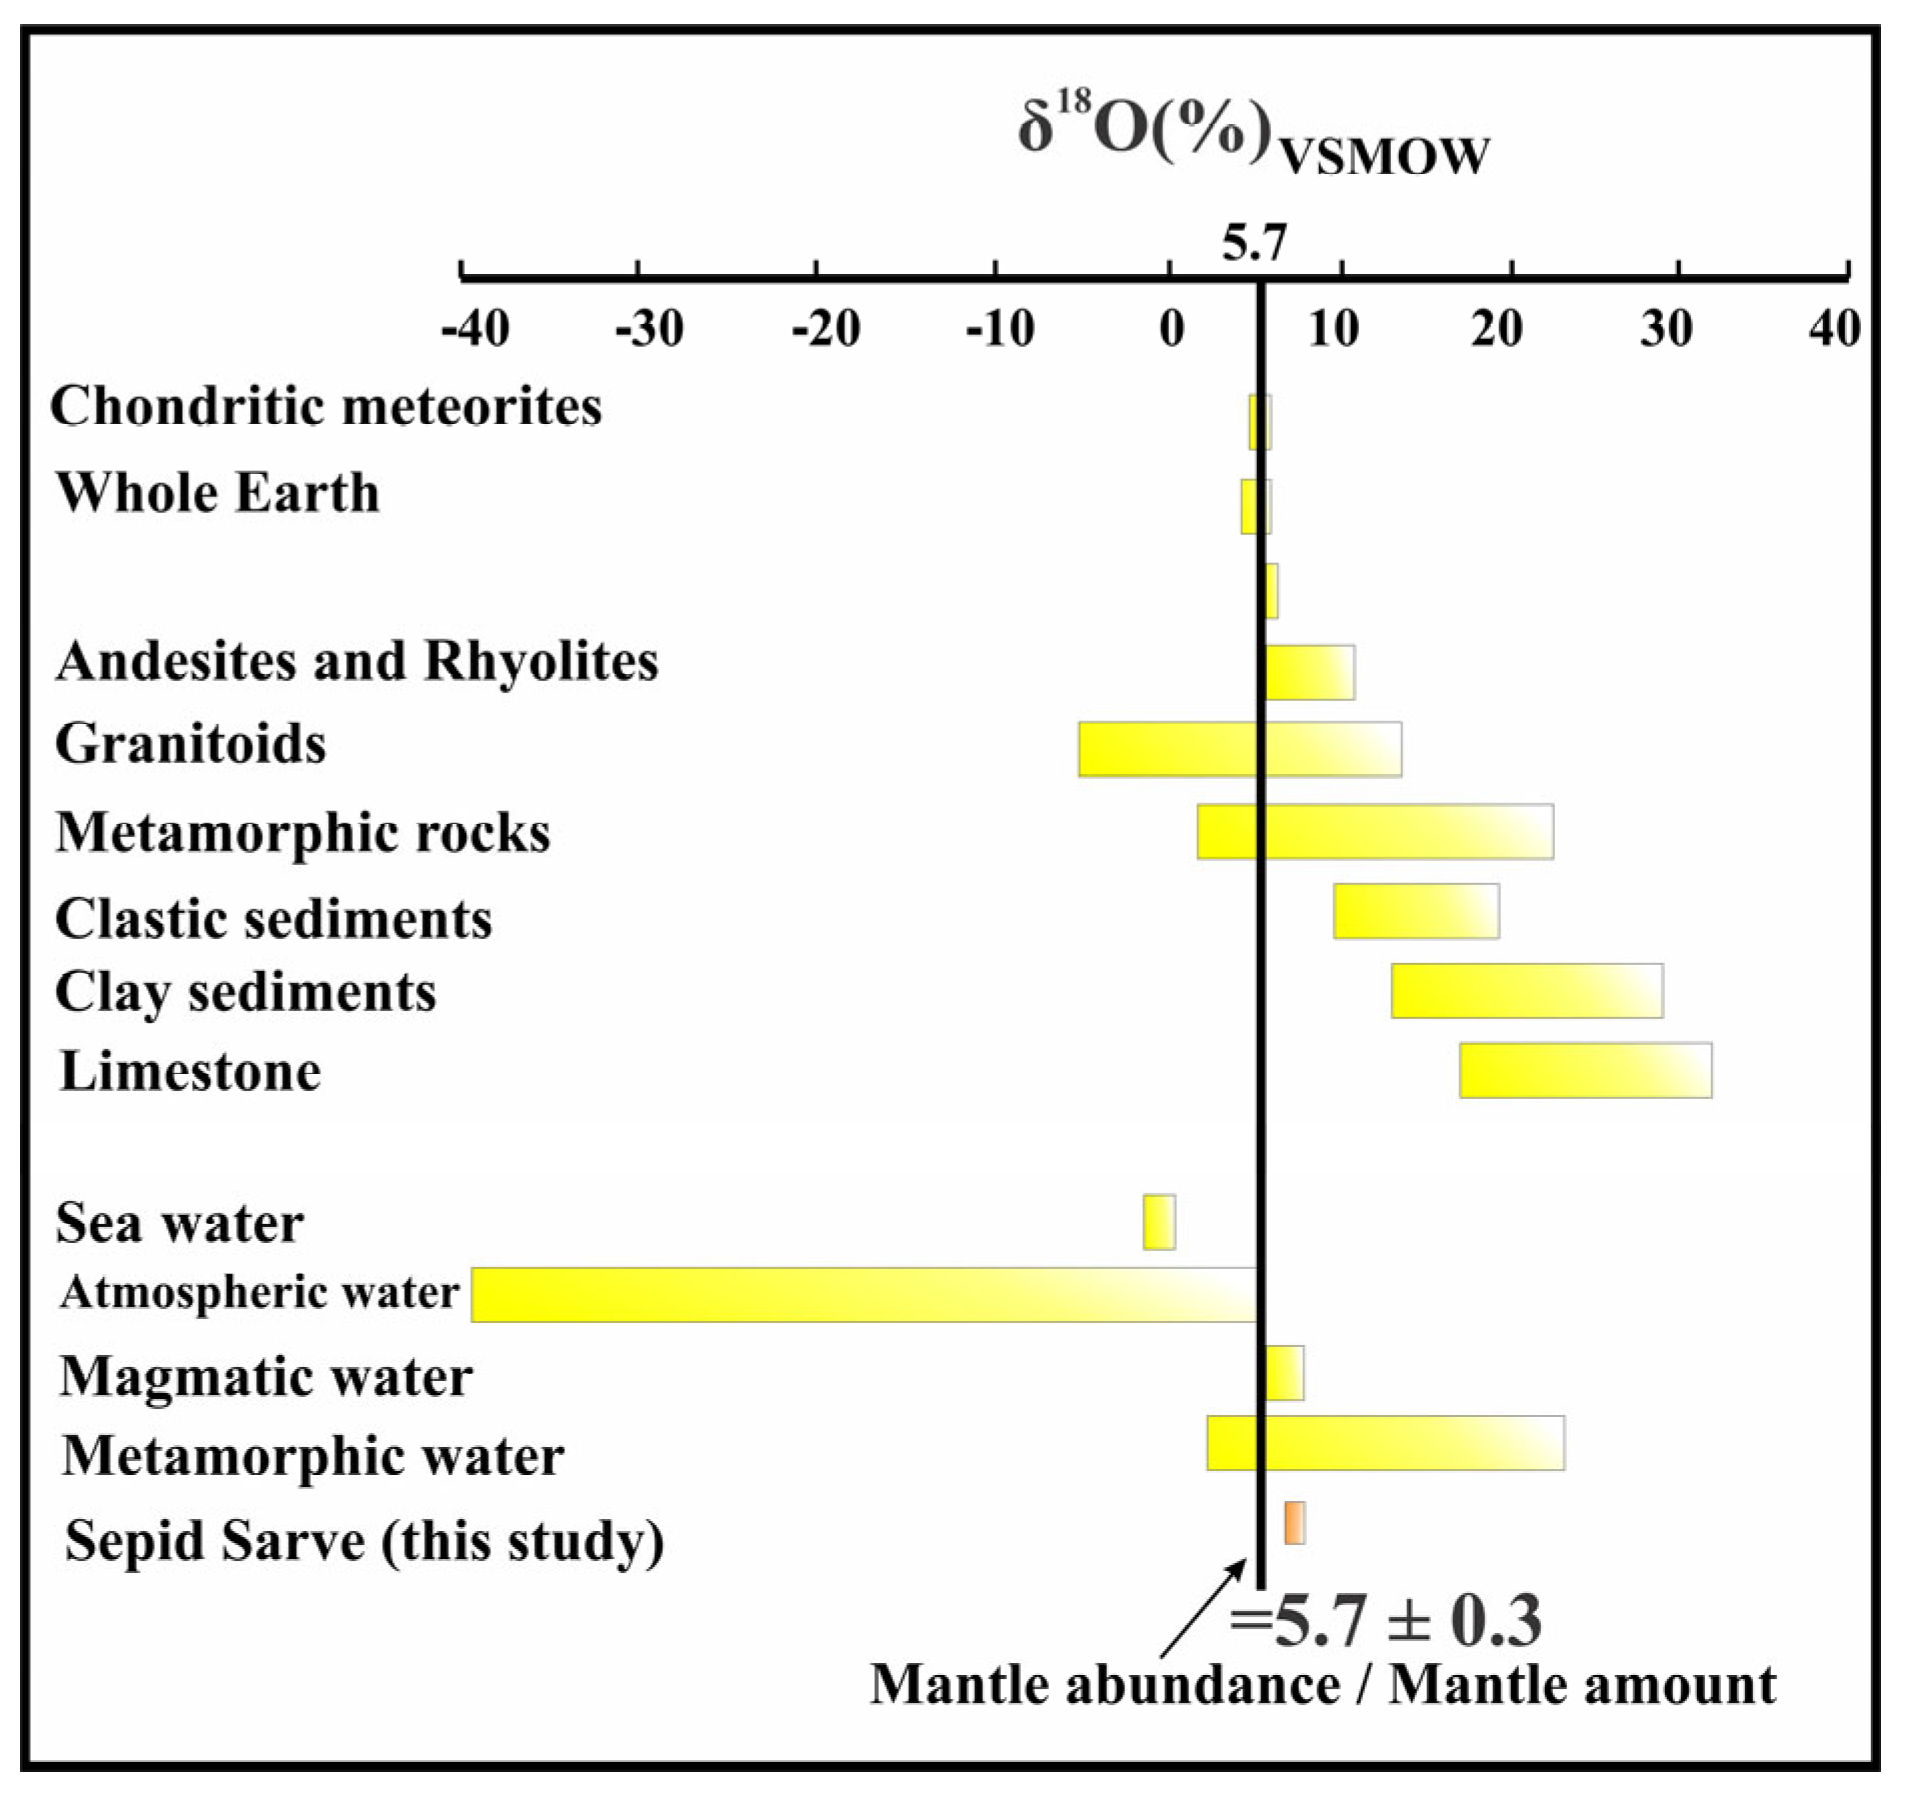
4.5.2. Oxygen Isotopes

The oxygen isotope compositions (δ18O) of hydrothermal fluids associated with altered and mineralized carbonate samples from the Sepid-Sarve copper deposit are presented in Table 4. The δ18O values of mineralized samples fall within or close to the compositional fields of meteoric water, basalts, and sedimentary rocks, suggesting that the hydrothermal fluids involved in ore deposition were primarily of magmatic origin but underwent mixing with meteoric waters. The δ18O values of altered but barren carbonate samples plot entirely within the meteoric water range, slightly shifting toward magmatic compositions, indicating that carbonate alteration may have resulted from interaction between magmatic and meteoric fluids.
This isotopic transition is consistent with the fluid inclusion micro-thermometry data, which indicate decreasing fluid temperatures due to fluid mixing and dilution. The evolution from a magmatic-dominated fluid to cooler, oxidizing, and more diluted meteoric waters is characteristic of hydrothermal systems where ore precipitation is triggered by fluid mixing, cooling, and changes in redox conditions (Figure 22).

4.6. Tectono-Magmatic Model

Most of the known Manto-type copper deposits in Iran formed during the Eocene, a period characterized by intense tectonic and magmatic activity, especially within the Urumieh-Dokhtar Magmatic Arc (UDMA), Alborz Magmatic Arc (AMA), and the Sabzevar region. The Eocene is considered a key metallogenic epoch due to the closure of the Neo-Tethys Ocean. Many of Iran’s mineral deposits, including Manto-type copper deposits, are closely related to the evolution of the Neo-Tethys Ocean. These deposits typically form in arc-related or subduction zone settings and are generally associated with volcano-sedimentary environments along plate boundaries. They are often hosted by basaltic to andesitic rocks.
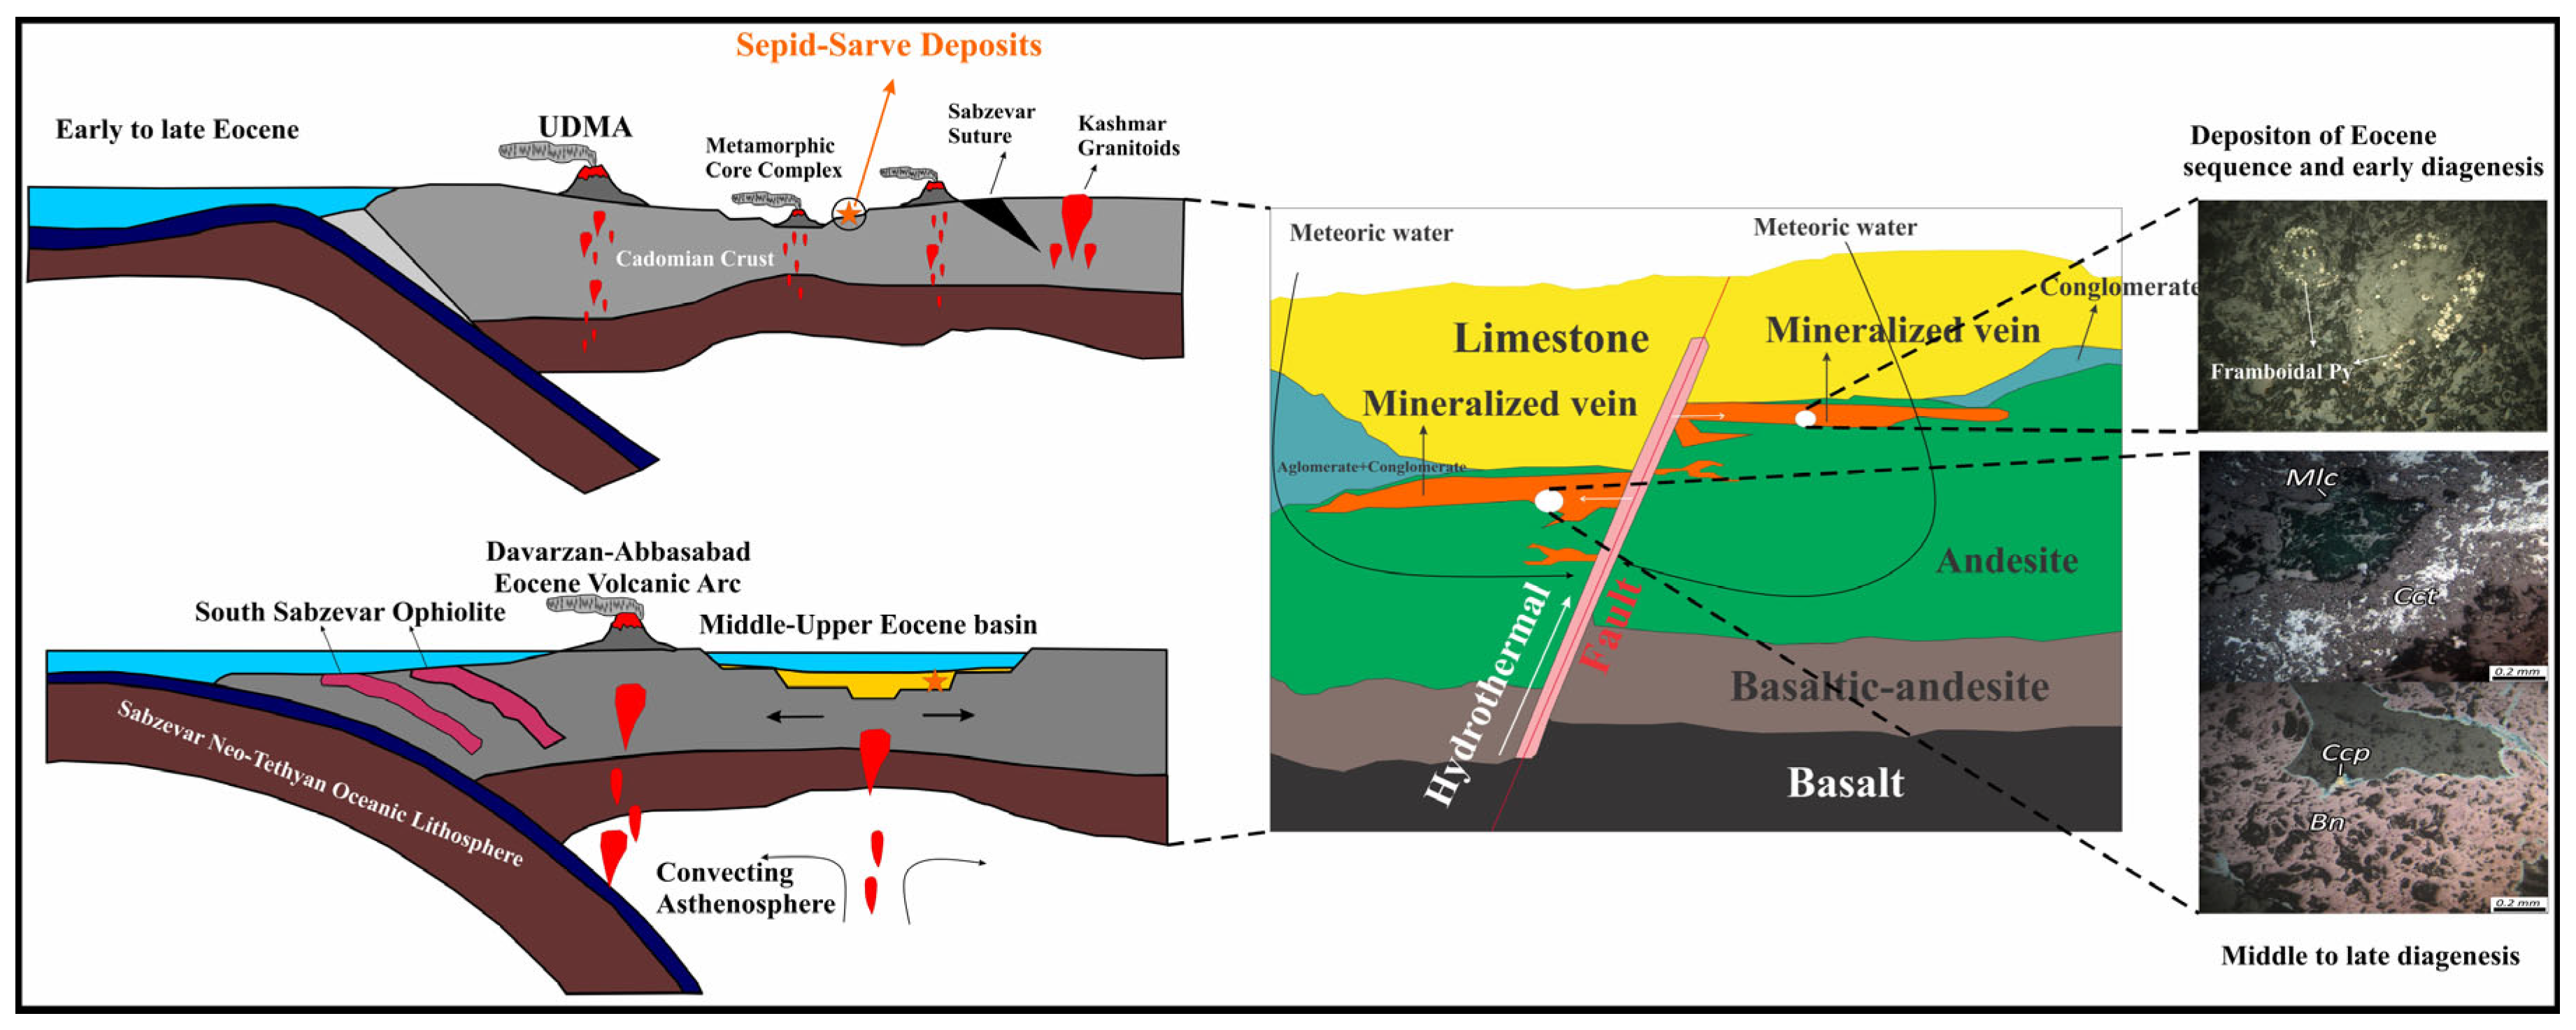
The general formation process of Manto-type copper deposits involves the generation of calc-alkaline magma in the subduction zone, heat-induced alteration caused by intrusive bodies, and the precipitation of copper along fractures and rock porosity through hydrothermal fluids derived from the mantle and lower crust. The Khaf–Doruneh Belt (in the southern Sabzevar Zone, northwest of Bardeskan) hosts Manto-type copper mineralization due to its tectonically active setting related to the subduction of Neo-Tethyan oceanic crust beneath the Central Iranian continental crust and the concurrent Eocene magmatic activity (Figure 23). These deposits are typically stratabound and hosted in volcanic and sedimentary sequences.
The Sabzevar Ocean, situated between the Lut Block to the south and the Turan Block to the north, remained open since at least the mid-Cretaceous period. Intra-oceanic subduction in the Sabzevar Basin likely began before the Albian, as evidenced by the presence of high-pressure metamorphic rocks [25]. Similarly to UDMA magmatism, the Eocene–Oligocene magmatic rocks in the Kashmar region of the Sabzevar area formed during Eocene extensional tectonics [106]. The Eocene volcanic activity in Davarzan–Abbasabad (Sabzevar) began with continental to shallow marine Paleogene–Eocene sediments, followed by widespread subaqueous to subaerial basaltic and andesitic volcanism, volcaniclastic rocks, and sedimentary sequences during the middle to late Eocene [107]. These E–W-trending magmatic rocks were generated in response to the subduction of Neo-Tethyan oceanic lithosphere beneath the eastern Alborz (Figure 23).
The mid-Eocene volcanic rocks of the Davarzan–Abbasabad area formed in a back-arc extensional setting and are associated with post-Eocene subduction-related magmatism (Figure 23). This region experienced collisional and post-collisional tectonic events during the Oligocene to Miocene [107,108,109,110,111]. In western Sabzevar (Davarzan–Abbasabad area), these Eocene volcanic rocks host Manto-type Cu–Ag mineralization, including the Bozorg Mine, Damanjala, Asiadeyu, Labkalu, North Choghandarsar, South Choghandarsar, Elhak, and Dochileh deposits.
This model is based on the subduction of the Neo-Tethyan oceanic crust during the Eocene, which led to the development of calc-alkaline magmatism (andesite, basalt, trachyandesite) and hydrothermal activity within the Khaf–Doruneh Belt. Copper mineralization occurs at the contact between volcanic rocks (e.g., andesite) and fossiliferous limestones (mostly conglomerates), where copper-rich hydrothermal fluids precipitated in fractures and cavities. The subduction of the oceanic plate beneath the continental crust during the Neo-Tethys era triggered partial melting in the mantle wedge, producing calc-alkaline magma. The intrusion of this magma and the release of metal-bearing hydrothermal fluids caused mineralization in fractures and stress zones. This magmatic activity was accompanied by regional propylitic and argillic alteration (Figure 23 and Figure 24).
The primary ore minerals include chalcocite, bornite, and pyrite, while the supergene secondary minerals include malachite, azurite, and hematite. Regional zeolitic–carbonatic and local chloritic and hematitic alteration are present. Observed mineral textures include veinlets, cavity fillings, replacement, and stratabound forms. Calc-alkaline volcanic rocks, shear zones, deep faults, dykes, and intense alteration are characteristic features of this model (Figure 23). The formation model of the Sepid-Sarve copper deposit closely aligns with this model, and the Kal Abri deposit, located east of the Sepid-Sarve copper deposit, represents another similar example.

5. Conclusions

The Sepid-Sarve copper deposit is a strata-bound (Manto-type) sulfide system hosted in volcanic-sedimentary sequences formed in a subduction-related magmatic arc setting. The volcanic succession, predominantly comprising basalt, basaltic andesite, and andesite, developed in a non-marine environment, followed by deposition of sedimentary conglomerates and limestone. Mineralization is mainly associated with chlorite, zeolite, and calcite alteration zones. Copper mineralization in the Sepid-Sarve deposit is observed at the contact of porphyritic andesite with nummulite-bearing limestone, and in the eastern part, due to facies changes and depositional basin conditions, mineralization occurs at the contact of porphyritic andesite with agglomerate and conglomerate. The ore-forming fluids, characterized by low silica content and reducing conditions, ascended along faults, depositing copper in fractures and pore spaces.
Geochemical and isotopic data suggest that the mineralizing fluids originated primarily from a magmatic source but underwent mixing with meteoric waters, promoting sulfide precipitation. Fluid inclusions indicate moderate salinities (3.08–13.38 wt.% NaCl eq.) and highlight boiling and fluid mixing as key mineralization mechanisms. Sulfur isotope values (δ34S between −2.7‰ and −24.4‰) and oxygen isotope signatures support a model of magmatic–meteoric fluid interaction.
Geochemical analyses confirm a calc-alkaline to shoshonitic affinity of volcanic rocks derived from an enriched mantle source influenced by subduction-related fluids and crustal contamination. Mineralogy is dominated by primary chalcocite, bornite, and pyrite, with supergene malachite, azurite, and hematite. Alteration includes regional zeolite–carbonate and localized chlorite and hematite zones.
The Sepid-Sarve deposit exemplifies copper mineralization in an active continental margin, where subduction-related magmatism, structural controls (notably the Doruneh Fault), and hydrothermal processes converge to form significant Manto-type deposits in volcano-sedimentary environments.

Author Contributions

Conceptualization, M.E. and H.Z.; Methodology, M.E. and H.Z.; Software, M.E.; Validation, M.E., U.K. and M.G.; Formal analysis, M.E., U.K. and M.G.; Investigation, M.E.; Resources, M.E., A.Z. and A.A.; Data curation, M.E.; Writing—original draft, M.E.; Writing—review & editing, M.E., U.K. and M.G.; Visualization, M.E.; Project administration, H.Z.; Funding acquisition, M.E. All authors have read and agreed to the published version of the manuscript.

Funding

Open Access Funding by the University of Vienna.

Data Availability Statement

The original contributions presented in this study are included in the article. Further inquiries can be directed to the corresponding author.

Conflicts of Interest

The authors declare no conflict of interest.

References

  1. Campus, F. Distroto Minero Punta del cobre, modelo interpretative. Rev. Geol. Chile 1980, 11, 51–76. [Google Scholar]
  2. Wilson, N.S.F.; Zentilli, M. The role of organic matter in the genesis of the El Soldado volcanic-hosted Manto-type Cu deposit, Chile. Econ. Geol. 1999, 94, 1115–1136. [Google Scholar] [CrossRef]
  3. Ruiz, C.; Aguirre, L.; Corvalan, J.; Klohn, C.; Klohn, E.; Levi, B. Geología y Yacimientos Metalíferos de Chile; Instituto de Investigaciones Geol´ ogicas: Santiago, Chile, 1965; p. 302. [Google Scholar]
  4. Ruiz, C.; Peebles, F. Geología, Distribuci´on y g´ Enesis de los Yacimientos Metalíferos Chilenos; Editorial Universitaria: Santiago, Chile, 1988; p. 305. [Google Scholar]
  5. Palacios, C. Subvolcanic copper deposits in the Coastal Range of northern Chile. Zeitbl. Geol. Palaontol 1986, 1, 1605–1615. [Google Scholar] [CrossRef]
  6. Vivallo, W.; Henríquez, F. Genesis común de los dep´ositos estratoligados y vetiformes de cobre del Jur´ asico Medio a Superior en la Cordillera de la Costa, Regi´ on de Antofagasta, Chile. Rev. Geol. Chile 1998, 25, 199–228. [Google Scholar] [CrossRef]
  7. Losert, J. Genesis of Copper Mineralizations and Associated Alterations in the Jurassic Volcanic Rocks of the Buena Esperanza Mining Area; Departamento de Geología, Universidad. de Chile: Santiago, Chile, 1973; Volume 40, p. 64. [Google Scholar]
  8. Sato, T. Manto type copper deposits in Chile: A review. Bull. Geol. Surv. Jpn. 1984, 35, 565–582. [Google Scholar]
  9. Tosdal, R.M.; Munizaga, F. Lead sources in Mesozoic and Cenozoic Andean ore deposits, north-central Chile (30–34 S). Mineral. Depos. 2003, 38, 234–250. [Google Scholar] [CrossRef]
  10. Merinero, R.; Ortega, L.; Lunar, R.; Pina, R.; Cardenes, V. Framboidal chalcopyrite and bornite constrain redox conditions during formation of their host rocks in the copper stratabound mineralization of Picachos, north-central Chile. Ore Geol. Rev. 2019, 112, 103037. [Google Scholar] [CrossRef]
  11. Kojima, S.; Trist´a-Aguilera, D.; Hayashi, K. Genetic aspects of the Manto-type copper deposits based on geochemical studies of north Chilean deposits. Resour. Geol. 2009, 59, 87–98. [Google Scholar] [CrossRef]
  12. Samani, B. Metallogeny of Manto-Type Deposits in Iran; 6th Symposium on Geosciences; Geological Survey of Iran: Tehran, Iran, 2001; (In Persian with English abstract). [Google Scholar]
  13. Nezafati, N.; Stöllner, T. Economic Geology, Mining Archaeological and Archaeometric Investigations at the Veshnaveh Ancient Copper Mine, Central Iran. Metalla 2017, 23, 67–90. [Google Scholar] [CrossRef]
  14. Fazeli, A. Type of the Copper Mineralization at Veshnaveh Deposit, South of Qom. Unpublished Master’s Thesis, Kharazmi university, Tehran, Iran, 2002; p. 157. [Google Scholar]
  15. Boveiri Konari, M.; Rastad, E.; Rashidnejad Omran, N. Volcanic redbed-type copper mineralization in the Keshtmahaki, Southern Sanandaj-Sirjan Zone, southeastern Iran. In Proceedings of the 11th SGA Biennial Meeting Let’s Talk Ore Deposits, Antofagasta, Chile, 26–29 September 2011. [Google Scholar]
  16. Abolipour, M.; Rastad, E.; Rashidnejad Omran, N. Manto-type copper mineralization in pyrobitumen-bearing porphyritic andesite, Koshkoiye district of Rafsanjan, Dehaj-Sardoiye subzone. Sci. Q. J. Geosci. 2015, 24, 123–144. [Google Scholar]
  17. Alizadeh, V.; Momenzadeh, M.; Emami, M.H. Petrography, geochemistry, mineralogy, fluid inclusions and mineralization study of Vorezg-Qayen copper deposit. Sci. Q. J. Geosci. 2013, 22, 47–58. [Google Scholar]
  18. Maghfouri, S.; Movahednia, M. Investigation of geology and mineralization of Abbas Abad copper deposit and comparison with Manto-type deposit. In Proceedings of the 18th Symposium of the Geological Society of Iran, Tehran, Iran, 24 December 2014; Tarbiat Modares University: Tehran, Iran (In Persian with English abstract). [Google Scholar]
  19. Maghfouri, S.; Hosseinzadeh, M.R.; Moayyed, M.; Movahednia, M.; Choulet, F. Geology, mineralization and sulfur isotopes geochemistry of the Mari Cu (Ag) Manto-type deposit, northern Zanjan, Iran. Ore Geol. Rev. 2017, 81, 10–22. [Google Scholar] [CrossRef]
  20. Kaboodi, Z.; Ghaderi, M.; Rastad, E. Mineralogy, texture and structure and genetic model of Kahak Manto-type copper deposit in the Eocene volcano-sedimentary sequence, south Qom. Sci. Q. J. Geosci. 2019, 29, 145–154. [Google Scholar]
  21. Fazli, N.; Ghaderi, M.; Movahednia, M.; Maghfouri, S. Manto-type copper mineralization in the central part of the Urumieh-Dokhtar magmatic arc (Qom-Saveh region) with emphasis on the East Narbaghi deposit, northeast Saveh. Iranian J. Geol. 2021, 15, 69–90. [Google Scholar]
  22. Jiba, Z.; Ghaderi, M.; Maghfouri, S. Geology, mineralogy, and fluid inclusion studies of the Yamaghan Manto-type Cu (Ag) deposit, southeast Zanjan, NW Iran. Adv. Appl. Geol. 2021, 11, 594–615. [Google Scholar]
  23. Salehi, L.; Rasa, I. Sulfur isotopic characteristics of the chalcocite in Madan Bozorg Cu deposits, Abbas Abad, NE Iran. In Proceedings of the 34th Geosciences Congress, Tehran, Iran, 22–24 February 2016. [Google Scholar]
  24. Glennie, K.W. Cretaceous Tectonic Evolution of Arabia’s Eastern Plate Margin: A Tale of Two Oceans, in Middle East Models of Jurassic/Cretaceous Carbonate Systems; SEPM (Society for Sedimentary Geology) Special Publication: Claremore, OK, USA, 2000; Volume 69, pp. 9–20. [Google Scholar] [CrossRef]
  25. Rossetti, F.; Nasrabady, M.; Vignaroli, G.; Theye, T.; Gerdes, A.; Razavi, M.; Moin Vaziri, H. Early Cretaceous migmatitic mafic granulites from the Sabzevar range (NE Iran): Implications for the closure of the Mesozoic peri-Tethyan oceans in central Iran. Terra Nova 2010, 22, 26–34. [Google Scholar] [CrossRef]
  26. Maghfouri, S. Geology, Mineralogy, Geochemistry, and Genesis of Cu Mineralization within Late Cretaceous Volcano-Sedimentary Sequence in Southwest of Sabzevar, with Emphasis on the Nudeh Deposit. Unpublished. Master’s Thesis, Tarbiat Modares University, Tehran, Iran, 2012; 312p. (In Persian with English abstract). [Google Scholar]
  27. Soltani, A. Mineralogy, geochemistry and genesis of the Abri, Rahbari, and Cheshmeh Marziyeh cu deposit, NW Darooneh. Master’s Thesis, Shahrood University of Technology, Shahrud, Iran, 2016; 191p. [Google Scholar]
  28. Monazzami Bagherzadeh, R.; Karimpour, M.H.; Farmer, J.L.; Stern, C.; Santos, J.F.; Ribeiro, S.; Rahimi, B.; Haidarian Shahri, M.R. Geochronology, petrology and geochemistry of intermediate and mafic Rocks of the Bornaward plutonic complex (northwest of Bardeskan, Iran). J. Econ. Geol. 2019, 10, 425–448. [Google Scholar]
  29. Rezaeihamid, R.; Tale Fazel, A. Mineralogy, minerals-chemistry and sulfur isotope geochemistry of Baharieh copper deposit (NE Kashmar): Implications for ore genesis. J. Petrol. 2019, 10, 53–78. [Google Scholar]
  30. Jabari, A.; Malekzadeh Shafaroudi, A.; Karimpoor, M.H. The stratabound (mantle-type) copper deposit of Kal Abri in the Eocene volcano-sedimentary complex, NW Bardaskan, NE Iran. J. Adv. Appl. Geol. 2016, 23, 142. [Google Scholar]
  31. Ramezaniabbakhsh, T.; Karimpour, M.H.; Azizi, H.; Rahimi, B.; Saadat, S. Metallogeny of mantle-copper deposits, special view in Nasim copper deposit, northwest of Bardaskan, Khorasan Razavi, Iran. J. Econ. Geol. 2023, 15, 143–174. [Google Scholar] [CrossRef]
  32. Ebrahimi, S.; Arab-Amiri, A.; Ghanbari, H. Mineralogy, alteration, fluid inclusion and stable isotopes studies of the Sharifabad-Bardeskan copper deposit, NE Iran. Sci. Q. J. Geosci. 2020, 30, 135–146. [Google Scholar]
  33. Heidari, M. Study of Geochemistry, Sulfur Stable isotopes, and Genesis of Madan Bozorg Copper Deposit (Abbasabad, East of Shahroud). Unpublished Master’s Thesis, Bu-Ali Sina University, Hamadan, Iran, 2012; 169p. (In Persian with English abstract). [Google Scholar]
  34. Taefi, N.; Mousivand, F.; Sadeghian, M. Mineralogy, geochemistry, and genesis of copper mineralization in the Grik and Gurkhan Southeast of Shahrood. In Proceedings of the 6th Symposium of Iranian Society of Economic Geology, Zahedan, Iran, 13 September 2014; University of Birjand: Birjand, Iran (In Persian with English abstract). [Google Scholar]
  35. Entezari Harsini, A. Geology, Geochemistry, Mineralization, Genesis and Isotope studies of Golcheshmeh deposit, South Neyshabour, Northeastern Iran. Unpublished Ph.D. Thesis, Ferdowsi University of Mashhad, Mashhad, Iran, 2017; 310p. (In Persian with English abstract). [Google Scholar]
  36. Rezapanah Khour, H. Investigation of Geology, Alteration and the Cu Mineralization in Cheshmeh-Hadi Area, Bardaskan (Khorasan Razavi Province, Northeast Iran). Unpublished Master’s Thesis, Shahid Bahonar University of Kerman, Kerman, Iran, 2016; 148p. (In Persian with English abstract). [Google Scholar]
  37. Aghanabati, A. Geology of Iran; Geological Survey of Iran: Tehran, Iran, 2004; 586p. [Google Scholar]
  38. Alavi, M. Sedimentary and structural characteristics of the Paleo Tethys remnants in northeastern Iran. Geol. Soc. Am. Bull. 1991, 103, 983–992. [Google Scholar] [CrossRef]
  39. Steele-MacInnis, M.; Lecumberri-Sanchez, P.; Bodnar, R.J. HokieFlincs_H2O-NaCl: A Microsoft Excel spreadsheet for interpreting microthermometric data from fluid inclusions based on the PVTX properties of H2O-NaCl. Comput. Geosci. 2012, 49, 334–337. [Google Scholar] [CrossRef]
  40. Eftekharnejad, J. Tectonic division of Iran with respect to sedimentary basins. J. Iran. Petrol. Soc. 1981, 82, 19–28. (In Persian) [Google Scholar]
  41. Shahrabi, M.; Hosseini, M.; Shabani, K. Geological Survey and Mineral Exploration of Iran; 1:250,000 Bardeskan quadrangle; Geological Survey & Mineral Exploration of Iran (GSI): Tehran, Iran, 2007. [Google Scholar]
  42. Ghaeni, F.; Moussavi Harami, R. Geological Survey and Mineral Exploration of Iran; 1:100,000 Doruneh geological map; Ferdowsi university of Mashhad: Mashhad, Iran, 2007. [Google Scholar]
  43. VSMOW2/SLAP2; Reference Sheet for VSMOW2 and SLAP2—International Measurement Standards. Vienna International Centre: Vienna, Austria, 2017.
  44. IAEA-S-4; Soufre de Lacq, Elemental Sulfur—Sulfur Stable Isotope Reference Material. Vienna International Centre: Vienna, Austria, 2022.
  45. Zentilli, M.; Munizaga, F.; Graves, M.C.; Boric, R.; Wilson, N.S.F.; Mukhopadhyay, P.K.; Snowdon, L.R. Hydrocarbon involvement in the genesis of ore deposits: An example in Cretaceous strata-bound (Manto-type) copper deposits of central Chile. Int. Geol. Rev. 1997, 39, 1–21. [Google Scholar] [CrossRef]
  46. Wilson, N.S.F. Organic petrology, chemical composition, and reflectance of pyrobitumen from the El Soldado Cu deposit, Chile. Int. J. Coal Geol. 2000, 43, 53–82. [Google Scholar] [CrossRef]
  47. Herazo, A.; Reich, M.; Barra, F.; Morata, D.; Real, I.D.; Pagès, A. Assessing the role of bitumen in the formation of stratabound Cu-(Ag) deposits: Insights from the Lorena deposit, Las Luces district, northern Chile. Ore Geol. Rev. 2020, 124, 103639. [Google Scholar] [CrossRef]
  48. Dissanayake, C.B. Gold and other metals in graphite. In Bitumen in Ore Deposits. Society for Geology Applied to Mineral Deposits; Parnell, J., Kucha, H., Landais, P., Eds.; Springer: Berlin/Heidelberg, Germany, 1993; Volume 9, pp. 138–152. [Google Scholar] [CrossRef]
  49. Winchester, J.A.; Floyd, P.A. Geochemical discrimination of different magma series and their differentiation products using immobile elements. Chem. Geol. 1977, 20, 325–343. [Google Scholar] [CrossRef]
  50. Hasite, A.R.; Kerr, A.C.; Pearce, J.A.; Mitchell, S.F. Classification of altered volcanic island arc rocks using immobile trace elements: Development of the Th-Co discrimination diagram. J. Petrol. 2007, 48, 2341–2357. [Google Scholar] [CrossRef]
  51. Pearce, J.A. Role of the Sub-Continental Lithosphere in Magma Genesis at Active Continental Margins. In Continental Basalts and Mantle Xenoliths; Hawkesworth, C.J., Norry, M.J., Eds.; Shiva: Cheshire, UK, 1983; pp. 230–249. [Google Scholar]
  52. Harker, A. The Natural History of Igneous Rocks; Cambridge University Press: Cambridge, UK, 1909. [Google Scholar] [CrossRef]
  53. Wilson, M. Igneous Petrogenesis; Unwin Hyman: London, UK, 2007; 461p. [Google Scholar]
  54. Feely, T.C.; Cosca, M.A.; Lindsay, C.R. Petrogenesis and implications of calc-alkaline cryptic hybrid magmas from Washburn volcano, Absaroka volcanic province, U.S.A. J. Petrol. 2002, 43, 663–703. [Google Scholar] [CrossRef]
  55. Davidson, J.; Turner, S.; Handley, H.; Macpherson, C.; Dosseto, A. Amphibole “sponge” in arc crust? Geology 2007, 35, 787–790. [Google Scholar] [CrossRef]
  56. Schiano, P.; Monzier, M.; Eissen, J.P.; Martin, H.; Koga, K.T. Simple mixing as the major control of the evolution of volcanic suites in the Ecuadorian Andes. Contrib. Mineral. Petrol. 2010, 160, 297–312. [Google Scholar] [CrossRef]
  57. Sun, S.S.; McDonough, W.F. Chemical and isotopic systematics of oceanic basalts: Implications for mantle composition and processes. Geol. Soc. Lond. Spec. Publ. 1989, 42, 313–345. [Google Scholar] [CrossRef]
  58. Pearce, J.A. A user’s guide to basalt discrimination diagrams. In Trace Element Geochemistry of Volcanic Rocks: Applications for Massive Sulfide Exploration; Wyman, D.A., Ed.; Geological Association of Canada: St. John’s, NL, Canada, 1996; Volume 12, pp. 79–113. [Google Scholar]
  59. Stepanov, A.; Mavrogenes, J.A.; Meffre, S.; Davidson, P. The key role of mica during igneous concentration of tantalum. Contrib. Miner. Petrol. 2014, 167, 1009. [Google Scholar] [CrossRef]
  60. Klimm, K.; Holtz, F.; King, P.L. Fractionation vs. magma mixing in the Wangrah suite A-type granites, Lachlan Fold Belt, Australia, experimental constraints. Lithos 2008, 102, 415–434. [Google Scholar] [CrossRef]
  61. Boynton, W.V. Cosmochemistry of the rare earth elements, Meteorite studies. In Rare Earth Element Geochemistry; Developments in Geochemistry; Elsevier: Amsterdam, The Netherlands, 1984; pp. 115–1522. [Google Scholar] [CrossRef]
  62. Sheppherd, T.J.; Rankin, A.H.; Alderton, D.H.M. A Practical Guide to Fluid Inclusion Studies; Blackie and Son: Glasgow, Scotland, 1985; 239p. [Google Scholar]
  63. Hedenquist, J.W.; Henley, R.W. The important of CO2 on freezing point measurements of fluid inclusion: Evidence from active geothermal system and implication for epithermal ore deposition. Econ. Geol. 1985, 80, 1379–1406. [Google Scholar] [CrossRef]
  64. Kant, W.; Warmada, W.; Idrus, A.; Setijadji, L.D.; Watanabe, K. Fluid inclusion study of the polymetalic epithermal quartz veins at Soripesa Prospect Area, Sumbawa island, Indonesia. J. Appl. Geol. 2012, 4, 77–89. [Google Scholar] [CrossRef]
  65. Wilkinson, J.J. Fluid Inclusions in Hydrothermal Ore Deposits. Lithos 2001, 55, 229–272. [Google Scholar] [CrossRef]
  66. Haas, J.L. The effect of salinity on the maximum thermal gradient of a hydrothermal system at hydrostatic pressure. Econ. Geol. 1971, 66, 940–946. [Google Scholar] [CrossRef]
  67. Pirajno, F. Hydrothermal Mineral Deposits, Principle and Fundamental Concept for the Exploration Geologist; Springer: Berlin/Heidelberg, Germany, 2009; 706p. [Google Scholar]
  68. Kesler, S.E. Ore-forming fluids. Elements 2005, 1, 13–18. [Google Scholar] [CrossRef]
  69. Zhang, Y.G.; Frantz, J.D. Determination of the homogenisation temperatures and densities of superficial fluids in the system NaCl-KCl-CaCl2-H2O using synthetic f luids inclusions. Chem. Geol. 1987, 64, 335–345. [Google Scholar] [CrossRef]
  70. Bodnar, R.J. A method of calculating fluid inclusion volumes based on vapor bubble diameters and P-V-T-X properties on inclusion fluids. Econ. Geol. 1983, 78, 534–542. [Google Scholar] [CrossRef]
  71. Lattanzi, P. Applications of fluid inclusions in the study and exploration of mineral deposits. Eur. J. Miner. 1991, 3, 689–697. [Google Scholar] [CrossRef]
  72. Beane, R.E. The magmatic-meteoric transition. Geotherm. Resour. Counc. Spec. Rep. 1983, 13, 245–253. [Google Scholar]
  73. Hoefs, J. Stable Isotope Geochemistry; Springer: Heidelberg, Germany, 2004; 287p. [Google Scholar] [CrossRef]
  74. Méheut, M.; Lazzeri, M.; Balan, E.; Mauri, F. Equilibrium isotopic fractionation in the kaolinite, quartz, water system: Prediction from first-principles density-functional theory. Geochim. Cosmochim. Acta 2007, 71, 3170–3181. [Google Scholar] [CrossRef]
  75. Li, Y.B.; Liu, J.M. Calculation of sulfur isotope fractionation in sulfides. Geochim. Cosmochim. Acta 2006, 70, 1789–1795. [Google Scholar] [CrossRef]
  76. Ohmoto, H.; Goldhaber, M.B. Sulfur and Carbon Isotope. In Geochemistry of Hydrothermal Ore Deposits, 3rd ed.; Barnes, H.L., Ed.; John Wiley & Sons: New York, NY, USA, 1997; pp. 517–611. [Google Scholar]
  77. Marini, L.; Moretti, R.; Accornero, M. Sulfur Isotopes in Magmatic-Hydrothermal Systems, Melts, and Magmas. In Sulfur in Magmas and Melts: Its Importance for Natural and Technical Processes; Behrens, H., Webster, J., Eds.; De Gruyter: Berlin, Germany, 2011; pp. 423–492. [Google Scholar] [CrossRef]
  78. Hoefs, J. Stable Isotope Geochemistry, 8th ed.; Springer: Cham, Switzerland, 2021. [Google Scholar] [CrossRef]
  79. Fazli, N.; Ghaderi, M.; Movahednia, M.; Li, J.W.; Lentz, D.R.; Yan, S. Geology and genesis of the North Narbaghi Cu-Ag deposit in the Urumieh-Dokhtar magmatic arc, Iran: Fluid inclusion and stable isotope constraints. Ore Geol. Rev. 2022, 144, 104801. [Google Scholar] [CrossRef]
  80. Zamanian, H.; Dolatshahi, S.; Yang, X.; Somarin, A.K.; Meshkani, S.A. Geochemical, fluid inclusion and O-H-S isotope constraints on the origin of the Rangraz copper deposit, Central Iran. Ore Geol. Rev. 2021, 128, 103877. [Google Scholar] [CrossRef]
  81. Zamanian, H.; Tale Fazel, E.; Sameti, M.; Asadi Haroni, H.; Yang, X. The petrogenesis and metallogenesis of the Kalchuyeh epithermal gold deposit, central Iran: Constraints from geochemistry, fluid inclusion, and H–O–S isotopes. J. Asian Earth Sci. 2023, 242, 105505. [Google Scholar] [CrossRef]
  82. Latifi Saii, F.; Mirnejad, H.; Alipour Asl, M.; Niroomand, S. Evaluating the Au mineralization in the Darrehzar vein system (Pariz area—Kerman Province), with emphasis on fluid inclusion and sulfur isotope studies. Adv. Appl. Geol. 2014, 4, 65–75. [Google Scholar]
  83. Downes, P.M. Yerranderie, a Late Devonian silver–gold–lead intermediate sulfidation epithermal district, eastern Lachlan Orogen, New South Wales, Australia. Resour. Geol. 2007, 57, 1–23. [Google Scholar] [CrossRef]
  84. Liu, Y.; Zhang, J.; Li, Y. Genesis of the Zhijiadi Ag–Pb–Zn Deposit, Central North China Craton: Constraints from Fluid Inclusions and Stable Isotope Data. Geofluids 2017, 2017, 4153618. [Google Scholar] [CrossRef]
  85. Niu, S.-D.; Li, S.-R.; Santosh, M.; Zhang, D.-H.; Li, Z.-D.; Shan, M.-J.; Lan, Y.-X.; Gao, D.-R. Mineralogical and isotopic studies of base metal sulfides from the Jiawula Ag–Pb–Zn deposit, Inner Mongolia, NE China. J. Asian Earth Sci. 2016, 115, 480–494. [Google Scholar] [CrossRef]
  86. Mango, H.; Oreskes, N.; Zantop, H. Origin of epithermal Ag–Au–Cu–Pb–Zn mineralization in Guanajuato, Mexico. Miner. Depos. 2013, 49, 119–143. [Google Scholar] [CrossRef]
  87. Rice, C.M.; McCoyd, R.J.; Boyce, A.J.; Marchev, P. Stable isotope study of the mineralization and alteration in the Madjarovo Pb–Zn district, south-east Bulgaria. Miner. Depos. 2007, 42, 691–713. [Google Scholar] [CrossRef]
  88. Yilmaz, H.; Oyman, T.; Nuran Sonmez, F.; Arehart, G.; Zeki, B. Intermediate sulfidation epithermal gold-base metal deposits in Tertiary subaerial volcanic rocks, Sahinli/Tespih Dere (Lapseki/Western Turkey). Ore Geol. Rev. 2010, 37, 236–258. [Google Scholar] [CrossRef]
  89. Goudarzi, M.; Zamanian, H.; Klötzli, U.; Lentz, D.; Ullah, M. Genesis of the Mamuniyeh Copper Deposit in the Central Urumieh-Dokhtar Magmatic Arc, Iran: Constraints from Geology, Geochemistry, Fluid Inclusions, and H–O–S Isotopes. Ore Geol. Rev. 2024, 175, 106279. [Google Scholar] [CrossRef]
  90. Rollinson, H. Rising Geochemical Data: Evaluation, Presentation, Interpretation; Longman John Wiley and Sons: New York, NY, USA, 1993; 352p. [Google Scholar]
  91. Allègre, C.J. Isotope Geology; Sutcliffe, C., Translator; Cambridge University Press: Cambridge, UK, 2008; ISBN 978-0-521-86228-8. [Google Scholar] [CrossRef]
  92. Seal, R.R. Sulfur Isotope Geochemistry of Sulfide Minerals. Rev. Mineral. Geochem. 2006, 61, 633–677. [Google Scholar] [CrossRef]
  93. Barnes, H.L. Geochemistry of Hydrothermal Ore Deposite; Sulfur and Carbon Isotope, Ohmoto and Goldbar; John Wiley & Sons: New York, NY, USA, 1979; Chapter 11. [Google Scholar]
  94. Movahednia, M.; Maghfouri, S.; Fazli, N.; Rastad, E.; Ghaderi, M.; González, F.J. Metallogeny of Manto-type stratabound Cu-(Ag) mineralization in Iran: Relationship with NeoTethyan evolution and implications for future exploration. Ore Geol. Rev. 2022, 149, 105064. [Google Scholar] [CrossRef]
  95. Sasaki, A.; Ulriksen, C.E.; Sato, K.; Ishihara, S. Sulfur isotope reconnaissance of porphyry copper and Manto-type deposits in Chile and the Philippines. Bull. Geol. Surv. Jpn. 1984, 35, 615–622. [Google Scholar]
  96. Puig, A.; Spiro, B. The source of sulphur in polymetallic deposits in the Cretaceous magmatic arc, Chilean Andes. J. South Am. Earth Sci. 1988, 1, 261–266. [Google Scholar] [CrossRef]
  97. Munizaga, F.; Reyes, J.C.; Nystrom, J.O. Razones isotópicas de los sulfuros del distrito minero de Cerro Negro: Un posible indicador de los dep´ositos estratoligados de Cu hospedados en rocas sedimentarias lacustres. Andean Geol. 1994, 21, 189–195. [Google Scholar]
  98. Munizaga, F.; Zentilli, M. Sulphur Isotope Characterization of Stratabound Copper Deposits in Chile; Comucicaciones, Universidad de Chile: Santiago, Chile, 1994; Volume 45, pp. 127–134. [Google Scholar]
  99. Saric, N.; Kreft, C.; Huete, C. Geología del yacimiento Lo Aguirre, Chile. Rev. Geol. Chile 2003, 30, 317–331. [Google Scholar] [CrossRef]
  100. Wilson, N.S.F.; Zentilli, M.; Reynolds, P.H. Age of mineralization by basinal f luids at the El Soldado Manto-type Cu deposit, Chile: 40 feldspar. Chem. Geol. 2003, 197, 161–176. [Google Scholar] [CrossRef]
  101. Wilson, N.S.F.; Zentilli, M. Association of pyrobitumen with copper mineralization from the Uchumi and Talcuna districts, central Chile. Int. J. Coal Geol. 2006, 65, 158–169. [Google Scholar] [CrossRef]
  102. Cai, Y.T.; Ni, P.; Wang, G.G.; Pan, J.Y.; Zhu, X.T.; Chen, H.; Ding, J.Y. Fluid inclusion and H-O–S–Pb isotopic evidence for the Dongxiang Manto-type copper deposit, South China. J. Geochem. Explor. 2016, 171, 71–82. [Google Scholar] [CrossRef]
  103. Shen, P.; Pan, H.; Li, Z.; Sun, J.; Shen, Y.; Li, C.; Feng, H.; Cao, C. A Manto-type Cu deposit in the Central Asian Orogenic Belt: The Hongguleleng example (Xinjiang, China). Ore Geol. Rev. 2020, 124, 103656. [Google Scholar] [CrossRef]
  104. Zheng, Y.F. Calculation of oxygen isotope fractionation in hydroxyl-bearing silicates. Earth Planet. Sci. Lett. 1993, 120, 247–263. [Google Scholar] [CrossRef]
  105. Rollinson, H.R. Using Geochemical Data: Evaluation, Presentation, Interpretation; Mor, F.; Madadri, S., Translators; Routledge: Oxfordshire, UK, 2005. [Google Scholar]
  106. Shafaii Moghadam, H.; Hua Li, X.; Ling, X.X.; Santos, J.F.; Stern, R.J.; Li, Q.L.; Ghorbani, G. Eocene Kashmar granitoids (NE Iran): Petrogenetic constraints from U-Pb zircon geochronology and isotope geochemistry. Lithos 2015, 216, 118–135. [Google Scholar] [CrossRef]
  107. Ghasemi, H.; Rezaei-Kahkhaei, M. Petrochemistry and tectonic setting of the Davarzan-Abbasabad Eocene Volcanic (DAEV) rocks, NE Iran. Mineral. Petrol. 2015, 109, 235–252. [Google Scholar] [CrossRef]
  108. Berberian, M.; King, G.C.P. Towards a paleogeography and tectonic evolution of Iran. Can. J. Earth Sci 1981, 18, 210–265. [Google Scholar] [CrossRef]
  109. Ghasemi, A.; Talbot, C.J. A new tectonic scenario for the Sanandaj-Sirjan Zone (Iran). J. Asian Earth Sci. 2006, 26, 683–693. [Google Scholar] [CrossRef]
  110. Asiabanha, A.; Bardintzeff, J.M.; Kananian, A.; Rahimi, G. Post-Eocene volcanics of the Abazar district, Qazvin, Iran: Mineralogical and geochemical evidence for a complex magmatic evolution. J. Asian Earth Sci. 2012, 45, 79–94. [Google Scholar] [CrossRef]
  111. Asiabanha, A.; Foden, J. Post Collisional transition from an extensional volcano sedimentary basin to a continental arc in the Alborz Ranges, N Iran. Lithos 2012, 148, 98–111. [Google Scholar] [CrossRef]
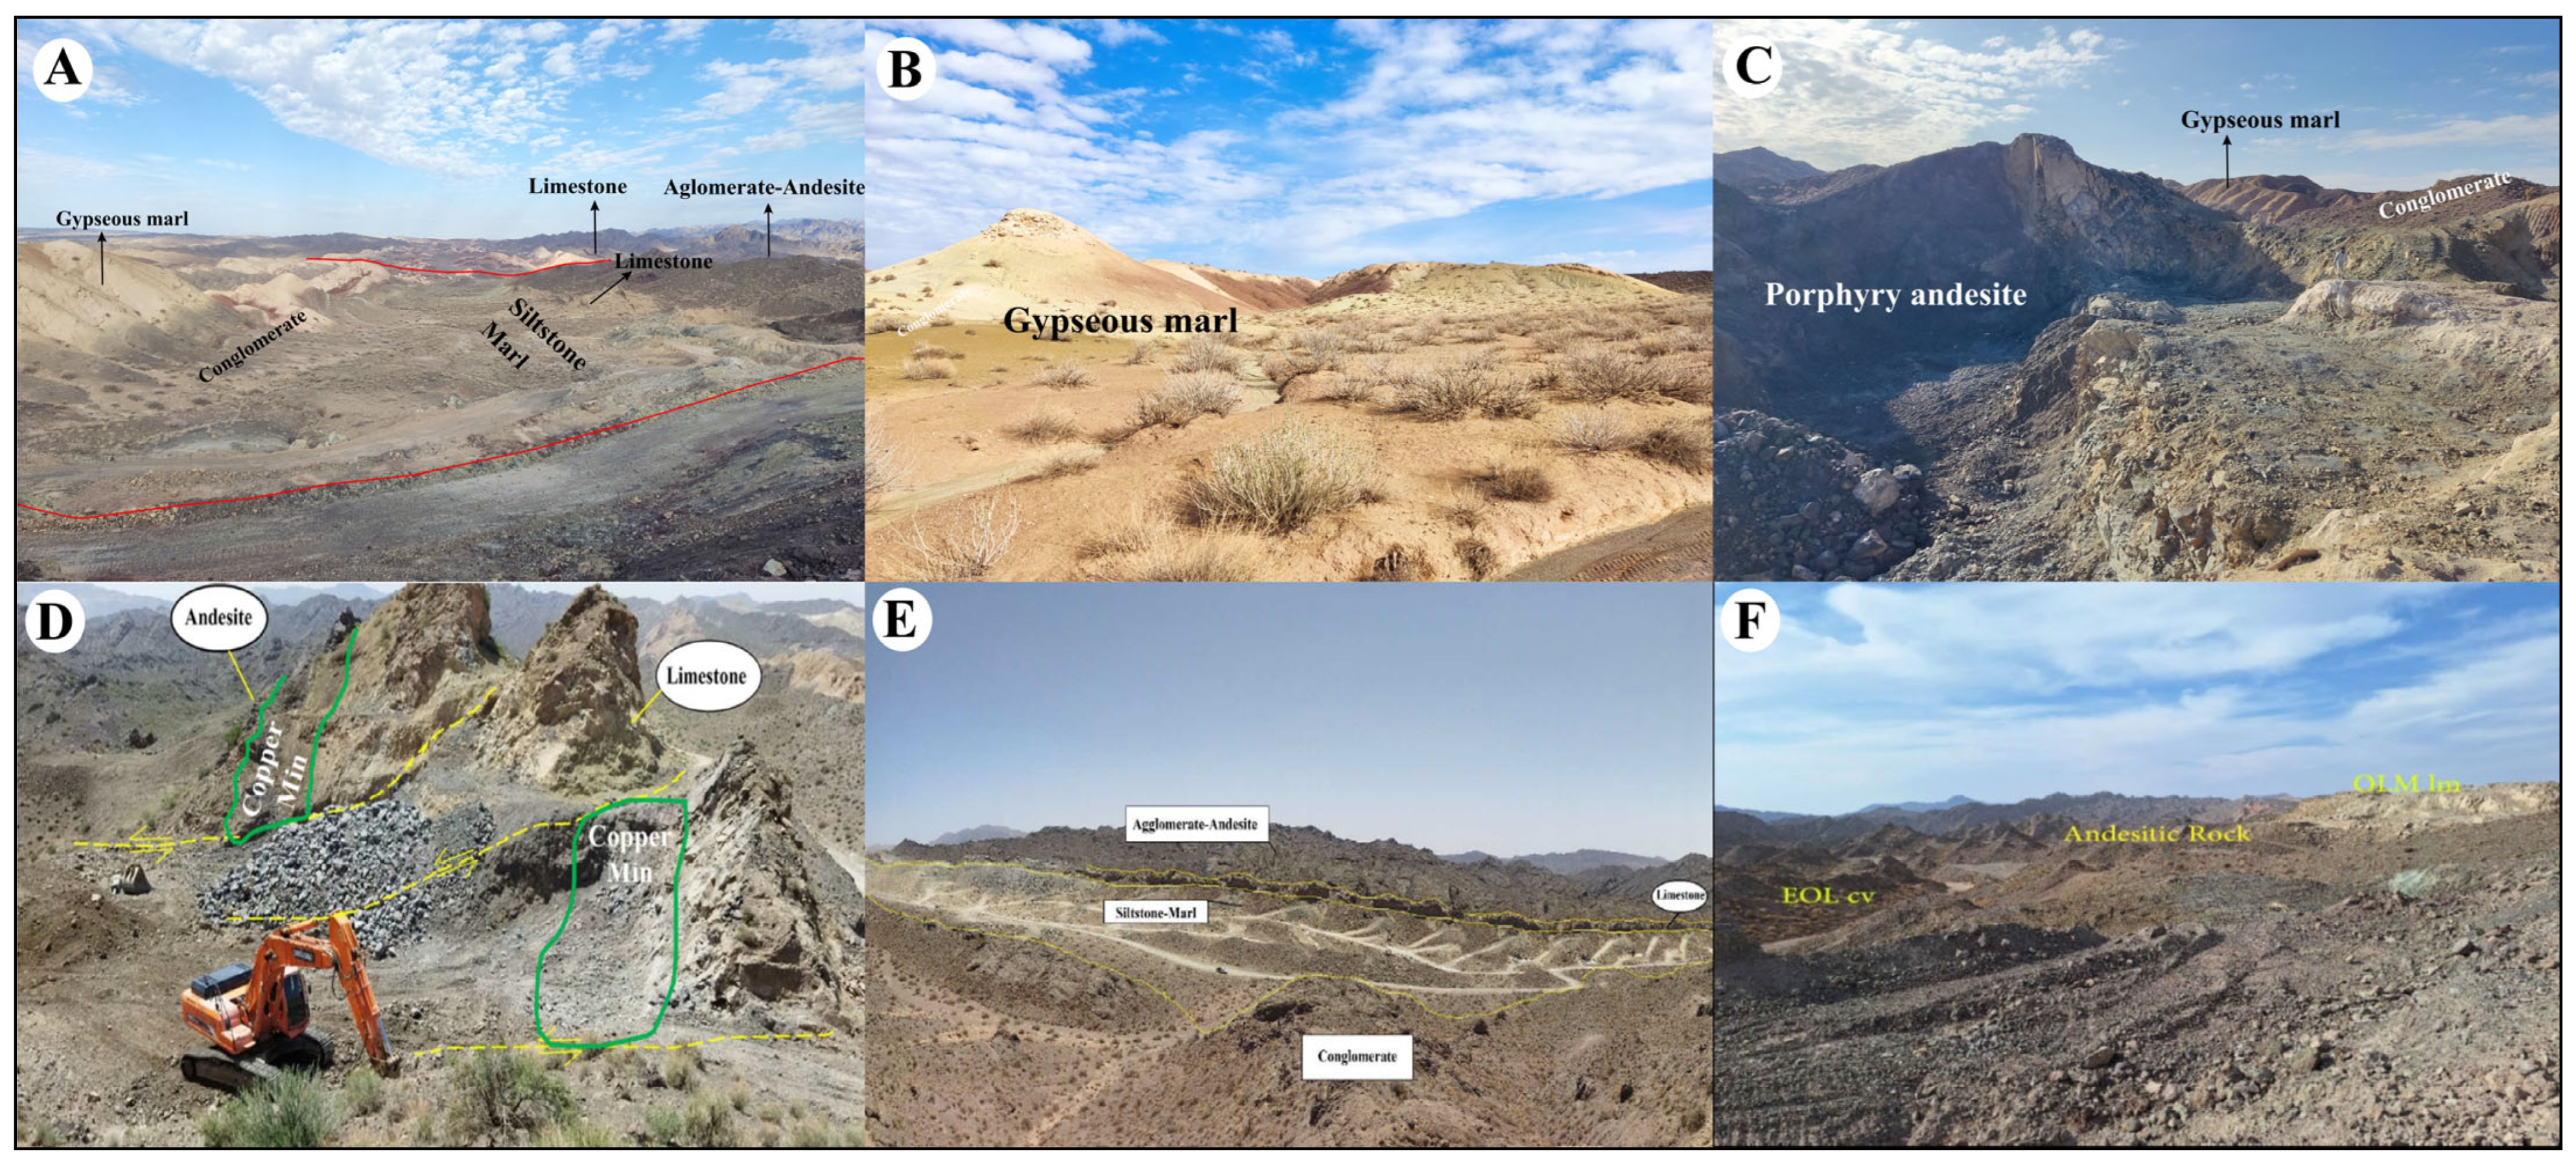
Figure 3. (A) View of the eastern part of the deposit showing Nummulitic limestone, conglomerate, andesite, agglomerate, siltstone, marl, and gypsum units. (B) View of the marl and gypsum units in the central part of the deposit. (C) View of the marl and gypsum units alongside conglomerate, andesite, and agglomerate. (D) Mineralized zone located at the contact between Nummulitic limestone and andesite. (E) View of the eastern part of the deposit showing Nummulitic limestone, conglomerate, andesite, agglomerate, siltstone, marl, and gypsum units. (F) Outcrop of EOLcv (Eocene Limestone with Volcanic Intercalations) and OLMlm (Oligo–Miocene Marl and Limestone) units with andesite in the eastern part of the Sepid-Sarve copper deposit.
Minerals 15 01246 g003
Figure 4. (AC) Outcrop views of the gabbro–basalt unit in the Sepid-Sarve copper deposit area. (D) Olivine phenocryst associated with carbonate minerals. (E) Groundmass composed of alkali feldspar and plagioclase. (F) Pyroxene and olivine phenocrysts. (G) Pyroxene phenocryst within a groundmass that commonly contains quartz. (J) Clinopyroxene and orthopyroxene phenocrysts in the rock. (K) Olivine with fractures partially replaced by chlorite. (H) Fractured olivine phenocryst within the rock matrix. (I) Olivine phenocryst embedded in a groundmass consisting of feldspar, pyroxene, and olivine.
Minerals 15 01246 g004
Figure 5. (A) General view of the limestone units (OLMlm), marl and siltstone (OLMm), and conglomerate (Mc). (B) Outcrop view showing limestone (OLMlm), marl and siltstone (OLMm–OLMsm), conglomerate (Mc), and gypsiferous marl (Mgy). (C) Outcrop view of limestone (OLMlm), marl and siltstone (OLMm), conglomerate (Mc), and gypsiferous marl (Mgy). (D) View of conglomerate (Mc) and gypsiferous marl (Mgy) units. (E) Outcrop of gypsiferous marl (Mgy) and marl–siltstone (OLMsm) units. (F) Nummulitic limestones emplaced into marl units along thrust faults at the contact with the mineralized zone. (G,H) View of copper mineralization zones at the contact between Nummulitic limestone and conglomerate, andesite, and agglomerate units. (I) View of limestone (OLMlm), marl and siltstone (OLMm–OLMsm), conglomerate (Mc), and gypsiferous marl (Mgy) units.
Minerals 15 01246 g005
Figure 6. Overview of the Sepid-Sarve copper deposit area: (A) Packstone unit. (B) Coarse pyroxene crystal set in an iron oxide-rich matrix. (C) Dispersed carbonate grains in an iron oxide matrix. (D) Limestone unit. (E) Vesicles filled with carbonate and chalcedonic minerals. (F) Coarse fragment of an alveolinid fossil.
Minerals 15 01246 g006
Figure 7. (A) General view of the eastern part of the Sepid-Sarve copper deposit. (B) A view of the mineralized zone at the contact between limestone, conglomerate, agglomerate, and andesite. (C) View of the mineralized zone contact with limestone. (D,E) Views of rock samples showing chalcocite mineralization and shear textures. (F) Hand specimen displaying bornite, covellite, chalcocite, chalcopyrite, and magnetite mineralization. (G) View of andesite rock. (H) Azurite and malachite mineralization in the oxidation zone. (IK) Copper sulfide (chalcocite) mineralization in drill core samples.
Minerals 15 01246 g007
Figure 8. (A) Hand specimen showing oxide and sulfide copper mineralization. (B) Presence of hematite as the main mineral along with malachite. (C) Malachite filling cavities and void spaces. (D,E) Disseminated chalcocite partially replaced by covellite. (F) Fine, disseminated chalcocite replacing primary minerals such as plagioclase. (G) Hand specimen with oxide and sulfide copper mineralization. (H,I) Pyrite occurring as fine grains with spherical and framboidal (clustered) textures, disseminated in the host rock.
Minerals 15 01246 g008
Figure 9. (A) General views of the mineralized zone in the Sepid-Sarve copper deposit. (B) Malachite veinlet under polarized light, exhibiting green color. (C) Disseminated magnetite mineralization partially altered to hematite. (D) Chalcocite veinlet occupying spaces between sheared rock fragments. (E) Formation of chalcocite accompanied by non-metallic veinlets. (F) General views of the mineralized zone in the Sepid-Sarve copper deposit. (G) Portion of bornite veinlet observed as a massive aggregate; bornite has been altered from the margins and within fractures to covellite and chalcocite. (H) Disseminated bornite fragments partially replaced by covellite and chalcocite at the margins, with minor chalcopyrite occurring along bornite margins.
Minerals 15 01246 g009
Figure 10. Paragenesis diagram of selected minerals in the Sepid-Sarve copper deposit.
Minerals 15 01246 g010
Figure 11. Photographs of different alteration types in the Sepid-Sarve area (A) View of alteration types observed in the eastern section, including chlorite, iron oxides (FeOx), chlorite–clay minerals, FeOx–chlorite–zeolite assemblages, and silicified-carbonate alteration. (B) Chloritic alteration accompanied by carbonatization in the eastern part of the deposit. (C) Hand specimen showing silicification alteration. (D) Chloritic alteration associated with iron oxide–hydroxide alteration in volcanic rocks. (E) Chloritic alteration together with carbonatization accompanied by calcite and zeolite occurring as veins and veinlets in volcanic rocks. (F) Kaolinitization and iron oxide–hydroxide alteration with associated carbonatization in volcanic rocks of the western part of the deposit. (G) Carbonatization and silicification associated with veins and veinlets of calcite, zeolite, and quartz in the southern part of the deposit. (H) Carbonatization accompanied by the formation of calcite and zeolite veins and veinlets. (I) Hand specimen containing calcite and zeolite veins and veinlets. (J) Hand specimen showing chloritic alteration.
Minerals 15 01246 g011
Figure 15. (A) Two-phase fluid inclusion enriched in liquid (L + V). (B) Two-phase fluid inclusion enriched in vapor (V + L). (C) Two-phase fluid inclusions enriched in liquid phase. (D) Mono-phase gaseous fluid inclusion. (E) Mono-phase gaseous fluid inclusions. (F) Two-phase fluid inclusion enriched in vapor phase. (G) Two-phase fluid inclusions enriched in liquid phase. (H) Two-phase fluid inclusions enriched in liquid phase.
Minerals 15 01246 g015
Figure 16. Histograms of fluid inclusion data: (A) Homogenization temperature, (B) Final ice-melting temperature, (C) Salinity.
Minerals 15 01246 g016
Figure 20. (A) Comparison of δ34S values of sulfur in sulfides from various rock types [77,78]. The data illustrate the typical sulfur isotope compositions for mantle-derived, magmatic, and crustal sources, showing distinct isotopic fields. (B) Sulfur isotopic compositions (δ34S) of sulfide minerals from the Sepid-Sarve copper deposit compared to global epithermal deposits and deposits within the Urumieh-Dokhtar magmatic arc. The δ34S values of Sepid-Sarve sulfides fall within or near the compositional fields typical of hydrothermal systems, suggesting a similar fluid evolution pathway [79,80,81,82,83,84,85,86,87,88,89]. (C) Comparison of δ34S values of sulfides from the Sepid-Sarve deposit with various geological environments [90]. The data suggest that the sulfur isotopic signature of the Sepid-Sarve sulfides is consistent with sources related to ilmenite-series granites and volcanic-hosted hydrothermal systems.
Minerals 15 01246 g020
Figure 21. Comparison of δ34S values from the Sepid-Sarve copper deposit with various geological environments [89,90,91,92,93,94] and typical Manto-type deposits in Iran [15,16,23], Chile [6,95,96,97,98,99,100,101] and China [102,103].
Minerals 15 01246 g021
Figure 22. Comparison of δ18O values from the Sepid-Sarve copper deposit with various geological environments [105].
Minerals 15 01246 g022
Figure 23. Schematic model illustrating the formation and evolution of the Sabzevar region: Oblique subduction of the Neo-Tethyan lithosphere beneath the Iranian plate from Middle–Late Jurassic to Late Cretaceous, followed by the development of back-arc sedimentary and magmatic basins in the Sabzevar area. From early to late Eocene, the Kashmar granites and associated volcanic rocks formed above a north-dipping subduction zone during a phase of magmatic flare-up triggered by regional extension [105]. These Eocene volcanic rocks host Manto-type Cu deposits in the Sepid-Sarve (Figure 24), Cheshmeh-Marzeyeh, and Cheshmeh-Hadi areas [106].
Minerals 15 01246 g023
Figure 24. Cross-sectional profile of geological units, structural features, and folding in the Sepid-Sarve copper deposit. (A) Eastern section; (B) Western section.
Minerals 15 01246 g024
Table 1. Chemical Analysis Results of the Studied Samples from the Sepid-Sarve Copper Deposit.
SampleSiO2Al2O3Na2OMgOK2OTiO2CaOFe2O3AgPbCuMoBiFeCoNiTiSbTlLiBeNaKCaMgAlGaCsRbBaSrThUYZrHfNbTaPLaCePrNdSmEuErGdTbDyHoTmYbLu
Se.Sa-12A64/05183/90/463/660/582/955/170/61510682/20/0535,7948/22944561/10/55114/931,34834,62624,9662871746515/24/8946133164/351/214/41193/085/50/4109013303/9313/72/9811/663/260/473/070/390/271/80/29
Se.Sa-13A63/917/693/760/263/170/632/687/0731/923>5%3/80/0535,6584/21831392/20/41103/927,38928,24818,0241856649715/23/9794203154/291/514/5183/124/60/31123711263/712/62/890/951/613/260/463/050/390/271/70/26
Se.Sa-15A57/8516/753/840/014/120/742/315/38>1038>10006/820/4641,0004/913/838001/330/615/81/132,60035,20013,50024002/6615/25/3974/32541322/70/38/71093/784/70/4610004/69/911/355/81/50/61/300/271/850/390/211/40/23
Se.Sa-16A61/2517/165/381/463/670/635/714/20/42225413/010/1637,9008/419/640000/580/5122/61/436,60036,20047,70039004/1718/65/6778/23682233/90/3181283/655/40/4310008/919/52/6113/021/042/3400/53/370/680/332/30/36
Se.Sa-17A60/7516/854/990/054/660/636/814/920/43205753/750/1234,7006/216/239000/840/5818/51/235,70038,10034,50014002/5617/36/691014001843/20/2151103/154/90/378005/613/51/828/022/350/921/7700/422/780/570/31/80/3
Se.Sa-17B59/6418/255/151/663/750/666/014/690/44224583/250/1432,0004/217/334000/840/5617/31/535,72337,51235,00012902/3616/26/781223591903/20/2151103/145/30/259006/112/51/739/262/360/771/800/322/450/580/2120/23
Se.Sa-18A61/3518/75/970/054/970/715/233/180/51410682/10/0534212/32932151/50/39103/930,22136,62023,230278173651548025123123/91/3141003/045/20/26103212322/912/82/711/5600/412/80/340/241/60/29
Se.Sa-18B63/8518/634/750/354/080/552/686/070/14173972/790/1132,2009/918/70/441/840/5620/61/329,00042,10032,2204100345017/85/5186/13981734/50/220/61424/1560/4810007/4182/3110/83/241/022/53/390/523/30/740/322/50/41
Se.Sa-0163/318/514/650/434/010/612/645/640/125420/138,51920313776<0.5<0.1140/222,946710647,451>2%75,88415/10/7131261970/910/315/5481/758/10/834076716/90/220/671/342/160/392/790/390/31/90/31
Se.Sa-0261/917/365/050/273/560/584/854/150/14400/10/147,49223/5374245<0.5<0.1120/223,126638253,087>2%81,67315/41101052720/840/415/5491/814/60/57523771/337/40/210/661/292/230/393/070/390/292/10/3
Se.Sa-0360/8516/654/860/054/610/66/454/730/14630/10/148,66324/638360510/1630/219,532237355,661>2%82,42215/81/76611410/280/217/2421/644/90/6278440/664/70/020/431/572/10/423/330/650/312/10/32
Se.Sa-0460/5516/854/910/064/150/626/154/680/1961860/10/137,32210462650<0.5<0.1<10/21761244>10%724189,85215/7<0/5<11443/70/680/99/3281/296/40/58397871/150/020/310/811/970/312/10/580/21/40/18
Se.Sa-0559/8518/154/941/453/740/656/824/720/7322840/10/145,85525/4523746<0.50/1560/225,505314648,663>2%86,485160/9360196<0.10/211/8331/325/40/53195310/282/50/020/351/191/790/322/410/570/221/70/21
Se.Sa-0662/7516/954/70/853/640/662/954/330/1161530/10/145,71026543712<0.5<0.170/224,429351554,628>2%88,52916/10/9461182<0.10/212/9331/364/50/5205320/282/40/020/331/131/780/322/460/580/211/80/17
Se.Sa-0763/917/353/840/464/010/62/636/10/13400/10/127,8595/152572<0.50/1180/226,56416,42517,194900970,54115/91/842921690/330/435/7622/164/10/39590681/467/80/480/82/862/930/675/060/640/543/30/53
Se.Sa-0864/118/243/950/483/590/582/245/080/141380/10/154,89340/62993802<0.5<0.1170/215,347866066,205>2%68,08415/62/5171103300/710/313/1371/545/60/62656781/437/20/260/712/360/392/880/430/21/80/23
Se.Sa-096418/524/150/493/680/572/185/040/172910/154,82139/52823446<0.5<0.1320/212,006742848,237>2%62,40416/31/191052640/580/3411/6341/345/20/66619781/447/40/120/661/132/130/362/510/420/231/60/17
Se.Sa-1062/817/154/860/643/620/632/94/30/16190/10/153,39841/83293458<0.5<0.1330/212,023700464,240>2%59,38016/71/413892740/470/211/3331/334/90/49594771/437/90/020/612/290/362/50/710/171/60/21
Se.Sa-1161/6517/255/031/153/610/614/864/720/15250/10/148,51144/44672298<0.5<0.1390/22871350842,747>2%34,05316/60/7<1551210/20/36/9211/023/70/34373430/663/70/020/360/671/760/241/970/670/110/15
Se.Sa-1260/7517/455/141/043/740/594/744/660/13160/10/152,37749/65062671<0.50/1400/24524161440,212>2%42,51416/34/722089/40/390/38/7251/093/80/36432550/864/30/020/230/761/920/322/180/650/121/30/24
Table 2. Micro-thermometric data of fluid inclusions in the Sepid-Sarve copper deposit.
Sample N.Mineralization TypeMineralPhaseTiceTICE+SalinityTh V-LTh L-VTutecTHT
S4Mlc + Az + CalCalciteL + V(−2)–(−5/5)2/0–5/53/38–9/09135–210 −36/3135–210
S7Mlc + Az + CalCalciteL + V(−2/7)–(9/2)2/7–9/24/48–12/63176–330 −43176–330
S7Mlc + Az + CalCalciteV + L(−7/8)–(−8/20)7/8–8/211/19–11/6 265–341 265–341
S6Cct + CalCalciteL + V(−1/8)–(−9/4)1/8–9/43/08–13/1790–386 −49/690–386
S9Cct + CalCalciteL + V(−2)–(−5)2/0–5/03/39–7/86149–275 −37/2149–275
S9Cct + CalCalciteV + L(−5/7)–(−5/8)5/7–5/88/76–8/98 280–300 280–300
S15Cct + Bn + Ccp + Mag + QtzQuartzL + V(−2)–(−9/6)2/0–9/63/39–13/38100–234 −39100–234
S15Cct + Bn + Ccp + Mag + QtzQuartzL + V + S−8811/55280 280
Table 3. Sulfur isotopic composition (δ34S ‰) of sulfide minerals in the Sepid-Sarve copper deposit.
Chalcopyrite <=> H2S [75]
Sample PointMineralδ34Smin (%)T (°C)-MinT (°C)-AveT (°C)-Max1000 Ln α-T(min)1000 Ln α-T(Ave)1000 Ln α-T(max)δ34SH2Sfluid (‰)
Se-Sa-S8Chalcocite−2/9 ± 0/2
Se-Sa-S14Chalcocite-Malachite-Azurite−7/1 ± 0/0
Se-Sa-S15-2Chalcocite-Bornite-Chalcopyrite-Covellite-Silica(Quartz)−23/9 ± 0/3100193/692800/40/20/2−24/1 ± 0/3
Galena <=> H2S [75]
Sample PointMineralδ34Smin(%)T (°C)-MinT (°C)-AveT (°C)-Max1000 Ln α-T(min)1000 Ln α-T(Ave)1000 Ln α-T(max)δ34SH2Sfluid (‰)
Se-Sa-S8Chalcocite−2/9 ± 0/2
Se-Sa-S14Chalcocite-Malachite-Azurite−7/1 ± 0/0
Se-Sa-S15-2Chalcocite-Bornite-Chalcopyrite-Covellite-Silica(Quartz)−23/9 ± 0/3100193/69280−4/6−2/9−2/1−21/0 ± 0/3
Galena <=> Chalcopyrite [75]
Sample PointMineralδ34Smin(%)T (°C)-MinT (°C)-AveT (°C)-Max1000 Ln α-T(min)1000 Ln α-T(Ave)1000 Ln α-T(max)δ34SH2Sfluid (‰)
Se-Sa-S8Chalcocite−2/9 ± 0/2
Se-Sa-S14Chalcocite-Malachite-Azurite−7/1 ± 0/0
Se-Sa-S15-2Chalcocite-Bornite-Chalcopyrite-Covellite-Silica(Quartz)−23/9 ± 0/3100193/69280−3/3−1/5−0/6−22/4 ± 0/3
Table 4. Oxygen isotope compositions of hydrothermal fluids in equilibrium with host rocks in the Sepid-Sarve copper deposit.
Muscovite <=> H2O [104]
Sample PointMineralδ18Omin(%)T (°C)-MinT (°C)-AveT (°C)-Max1000 Ln α-T(min)1000 Ln α-T(Ave)1000 Ln α-T(max)δ18OH2Ofluid (%)
Se.Sa-S6Silica(Quartz)+7/5 ± 0/090177/538612/45/60/1+1/9 ± 0/0
Se.Sa-S15-1Chalcocite-Bornite-Chalcopyrite- Covellite-Silica(Quartz)+7/6 ± 0/3100193/6928011/34/81/9+2/8 ± 0/3
Quartz <=> H2O [74]
Sample PointMineralδ18Omin(%)T (°C)-MinT (°C)-AveT (°C)-Max1000 Ln α-T(min)1000 Ln α-T(Ave)1000 Ln α-T(max)δ18OH2Ofluid (%)
Se.Sa-S6Silica(Quartz)+7/5 ± 0/090177/538624/413/52/8−6/0 ± 0/0
Se.Sa-S15-1Chalcocite-Bornite-Chalcopyrite- Covellite-Silica(Quartz)+7/6 ± 0/3100193/6928022/912/16/5−4/5 ± 0/3
Disclaimer/Publisher’s Note: The statements, opinions and data contained in all publications are solely those of the individual author(s) and contributor(s) and not of MDPI and/or the editor(s). MDPI and/or the editor(s) disclaim responsibility for any injury to people or property resulting from any ideas, methods, instructions or products referred to in the content.